Article

Seasonal Spatial Distribution Patterns of the Sand Crab Ovalipes punctatus (De Haan 1833) in the Southern Yellow and East China Seas and Predictions from Various Climate Scenarios

1
Key Laboratory of Fisheries Remote Sensing Ministry of Agriculture and Rural Affairs, East China Sea Fisheries Research Institute, Chinese Academy of Fishery Sciences, Shanghai 200090, China
2
Shanghai Aquatic Wildlife Conservation and Research Center, Shanghai 200080, China
*
Author to whom correspondence should be addressed.
These authors contributed equally to this work.
Biology 2025, 14(8), 947; https://doi.org/10.3390/biology14080947 (registering DOI)
Submission received: 4 July 2025 / Revised: 16 July 2025 / Accepted: 24 July 2025 / Published: 28 July 2025
(This article belongs to the Special Issue Global Fisheries Resources, Fisheries, and Carbon-Sink Fisheries)

Simple Summary

Spatial distribution models that consider biotic and abiotic factors are necessary to understand the distribution pattern variations and life history traits of crabs. The sand crab Ovalipes punctatus (De Haan 1833) is an economically important species in China, Korea, and Japan, where its market price and demand are very high. In this study, we first collected O. punctatus distribution data during cruises conducted in 2018 and 2019 in the southern Yellow and East China Seas. We then used ensemble models to predict seasonal distribution variations and climate scenarios. The results showed that the crabs were concentrated in the northern East China Sea in spring but migrated to offshore areas in the southern Yellow and East China Seas in summer, where they remained in autumn and winter. These results provide important data for developing future climate adaptive fishery management strategies and devising best practices for the application of species distribution models for fishery management and conservation planning.

Abstract

In the past two decades, little information has been updated to understand the resource status of the crab species Ovalipes punctatus in the East China Sea Region. In this study, we conducted surveys in 2018 and 2019 to identify the seasonal spatial distribution patterns of the economically important sand crab Ovalipes punctatus (De Haan 1833) in the southern Yellow and East China Seas. In the study area, the largest biomass of crabs was observed in the fishing grounds of Dasha and the Yangtze River mouth, and the second largest biomass was detected in the Jiangwai-Zhouwai area. Seasonally, the total biomass order in these areas was summer > autumn & winter > spring, and the mean average individual weight order was spring & summer > winter > autumn. These findings provided maps of the seasonal spatial distribution pattern of the species across seasons, which were then used in climate-change scenario models. Model predictions suggested that O. punctatus might migrate northward and offshore under climate warming conditions, and that the climate scenario SSP585-2100 might be the most negative case, respectively, for the habitat area of gain% minus loss%. These data can be used to develop robust and systematic regional fisheries resource management policies that consider adaptation measures to address the impact of environmental and climate change along China’s coasts and other areas in the world.

1. Introduction

The sand crab species Ovalipes punctatus (De Haan 1833) occurs mainly in the Yellow and East China Seas of China, in coastal areas of Japan, Korea, and Australia, and in the Indian Ocean [1]. This species is a bycatch target of beam shrimp trawling and crab pot fisheries [1]. It has a life span of almost 15 months and prefers to inhabit sandy bottoms in shallow areas (~5–60 m), although it has been found at depths of 95 to 140 m in offshore areas of the Mindong fishing ground in China (Figure 1) [2]. O. punctatus can adapt to a range of temperatures and salinities and has strong swimming abilities [3]. On average, the carapace length and width of this crab are 32.15 mm and 55.5 mm at first sexual maturity, with a wet weight of 45.46 g [4]. However, the minimum size at sexual maturity was a carapace of 63 mm and a wet weight of 76 g in the Mindong offshore fishing ground [5].
In the Yellow and East China Seas, O. punctatus accounts for about half of the total catch in spring and winter each year [1]. The catch of this species has gradually increased since the 1980s [6]. Increasing market demand has led to overfishing in China, raising concerns about recruitment failure [7]. In addition, Wang et al. (2011) detected a tendency for individual size miniaturization with an accelerated growth rate in this species [8]. However, despite the high consumption and price of O. punctatus in China, Korea, and Japan, studies on seasonal spatial distribution variations in China over the past 20 years have not been conducted.
In the East China Sea, the potential fishery resource of O. punctatus was estimated to be 84,092.3 tonnes [9]. Recently, marine crustaceans constituted ~19.2% of the total marine fishery catches of all fishing species in China, equating to about 10 million tons [10]. Among them, crab species are economically and ecologically important in coastal ecosystems, and their seasonal spatial distributions are pivotal for fishery management and conservation. Shifts in the range of habitat area and habitat loss caused by climate change may also reduce crab catches and ultimately negatively impact regional fishing activities.
The massive use of fossil fuels increases the atmospheric CO2 concentration and leads to global climate warming, which results in increased ocean temperatures and oceanic CO2 concentrations [11]. Such changes can affect the distribution of marine fauna and the ecosystems in which they live [12]. Temperature and CO2 changes may decrease the appropriate habitat area for all marine biological communities, cause local species extinctions, increase habitats for non-native species, and promote the expansion and establishment of invasive species [13,14,15]. Climate change is also likely to contribute to direct or indirect variations in the biomass, reproduction, and distribution patterns of marine fauna [16].
The surface water temperature along the eastern coast of China is expected to exhibit a warming trend over the next 80 years [17]. By the end of the twenty-first century, the average ocean surface temperature is predicted to increase by 1.8 to 4 °C in China’s seas [18]. In recent decades, the bottom water temperature in the southern Bohai Sea has increased by 0.013 °C annually on average [19]. Thus, understanding the impact of possible climate change scenarios on marine fauna is crucial.
The first goal of this study was to identify the seasonal spatial distribution patterns of O. punctatus in the southern Yellow Sea and East China Sea in 2018 and 2019 and their responses to environmental variables (e.g., depth, water temperature, and salinity). The second goal was to develop ensemble spatial distribution models (SDMs) to predict species distribution variations across seasons and climate scenarios (current, SSP1-2.6, SSP2-4.5, SSP3-7.0, and SSP5-8.5) for 2040–2050 (the 2050s) and 2090–2100 (the 2090s). The findings of this study provide baseline data for the development of fisheries policies to conserve and manage this species and prevent resource depletion (e.g., taking actions to limit total allowable catches (TACs) and closed fishing seasons).

2. Materials and Methods

2.1. Sampling and Survey Procedures

We performed fishery-independent bottom-trawling surveys from 2018 to 2019 in the southern Yellow and East China Seas (Figure 1). The coastal currents in China carry low-salinity water southward along the coastlines. When the northeast monsoon prevails in winter, the China coastal currents are driven through the Taiwan Strait and into the South China Sea. During the southwest monsoon, which prevails in summer, the China coastal current direction in the southern East China Sea is reversed, flowing north into the East China Sea.
The surveys were conducted using a trawl net (Zhejiang, China) with a cod end mesh size of 20 mm and a height of 10–15 m that was towed by the fisheries research vessels Zhongkeyu 211 and 212) in autumn (2–11 November, 2018), winter (4–27 January, 2019), spring (22 April–10 May 2019), and summer (13 August–27 September 2019). The bottom trawls were conducted in a grid characterized by a latitude and longitude spacing of 30 min × 30 min. Each bottom tow was assigned to a specific grid cell according to the survey location. The average trawl speed was 3 knots, and all tows were conducted for approximately 1 h at each station using a trawl net with a headline of 72.24 m and a groundline of 82.44 m. In total, 519 valid tows were included in this study (127 stations in autumn, 111 stations in winter, 141 stations in spring, and 140 stations in summer).
Samples from each survey station were transported to an indoor laboratory for species identification. The catch per unit effort (CPUE) of each survey was determined in terms of seasonal abundance (CPUEn; ind∙h−1), and the seasonal catch per unit effort by weight (CPUEw; g∙h−1) was determined by measuring individuals to the nearest 0.10 g of wet weight. The average individual weight (AIW) was defined as CPUEw divided by CPUEn at each station.
In autumn, the total CPUEw was 11,877.19 g·h−1, and the total CPUEn was 503.3 ind·h−1. In winter, the values were 19,398.8 g·h−1 and 571.77 ind·h−1. In spring, they were 8508.74 g·h−1 and 200.33 ind·h−1, and in summer, they were 57,428.81 g·h−1 and 2195.91 ind·h−1.
The equations used to calculate the growth of O. punctatus were as follows: Weight (W) = 0.0004 × Length (L)2.8121 and W = 0.0006 × (L)2.7358 in the Zhoushan fishing ground [8]; W = 1.6576 × 10⁻⁴ × (L)3.0756 in the Mindong fishing ground [2]; W = 1.009 × 10⁻⁴ × (L)3.1728 and W = 1.7041 × 10⁻⁴ × (L)3.0632 in the East China Sea [20]; and W = 8.77 × 10⁻⁴ × (L)2.673 and W = 3.37 × 10⁻⁴ × (L)2.9073 in the offshore areas of the Mindong fishing ground [5].
Environmental factors were measured at each station using an SBE-19 profiler (Sea-Bird Scientific, Bellevue, WA, USA), which was calibrated before each survey. Sea surface salinity (SSS) and sea surface temperature (SST) were measured at 3 m below the surface, whereas sea bottom salinity (SBS) and sea bottom temperature (SBT) were measured 2 m above the sea bottom at depths < 50 m and 2–4 m above the bottom at depths > 50 m.

2.2. Ensemble Model

SDMs are commonly used in biodiversity and ecological studies to predict the potential distribution of species [21]. SDMs have been applied to estimate the distribution variations of crabs inhabiting different habitats (e.g., estuaries, intertidal zones, and mangrove areas), monitor crab invasions, forecast the locations and center areas of fishing grounds, reflect modifications of typical habitats, identify habitat suitability, and standardize CPUE [22]. SDMs can also be used to assess the possible effects of climate change on the distribution of marine species and provide good predictions of key habitat variables [22].
In this study, we used 10 algorithms to forecast the habitat distribution of O. punctatus using our survey data: extreme gradient boosting training (XGBOOST), surface range envelope (SRE), random forest (RF), multiple adaptive regression splines (MARS), generalized linear models (GLMs), generalized boosting models (GBMs), generalized additive models (GAMs), flexible discriminant analysis (FDA), classification tree analysis (CTA), and artificial neural networks (ANNs).
We used the “biomod2” package on the ensemble SDM platform (4.3-4) (https://biomodhub.github.io/biomod2/, accessed on 22 June 2025). We used the mean survey data collected over four months (November 2019 and January, May, and August 2019) to produce the annual model, and we used different seasonal data to produce the seasonal models. Future climate data were obtained from the Coupled Model Intercomparison Project Phase 6 (CMIP6), and environmental data (SSS, SBS, SST, and SBT) were obtained from the website Bio-ORACLE (https://bio-oracle.org/index.php, accessed on 22 June 2025). The four Shared Socioeconomic Pathways (SSPs) scenarios (SSP126, SSP245, SSP370, and SSP585) for 2040–2050 (the 2050s) and 2090–2100 (the 2090s) were used in this study [23].

3. Results and Discussion

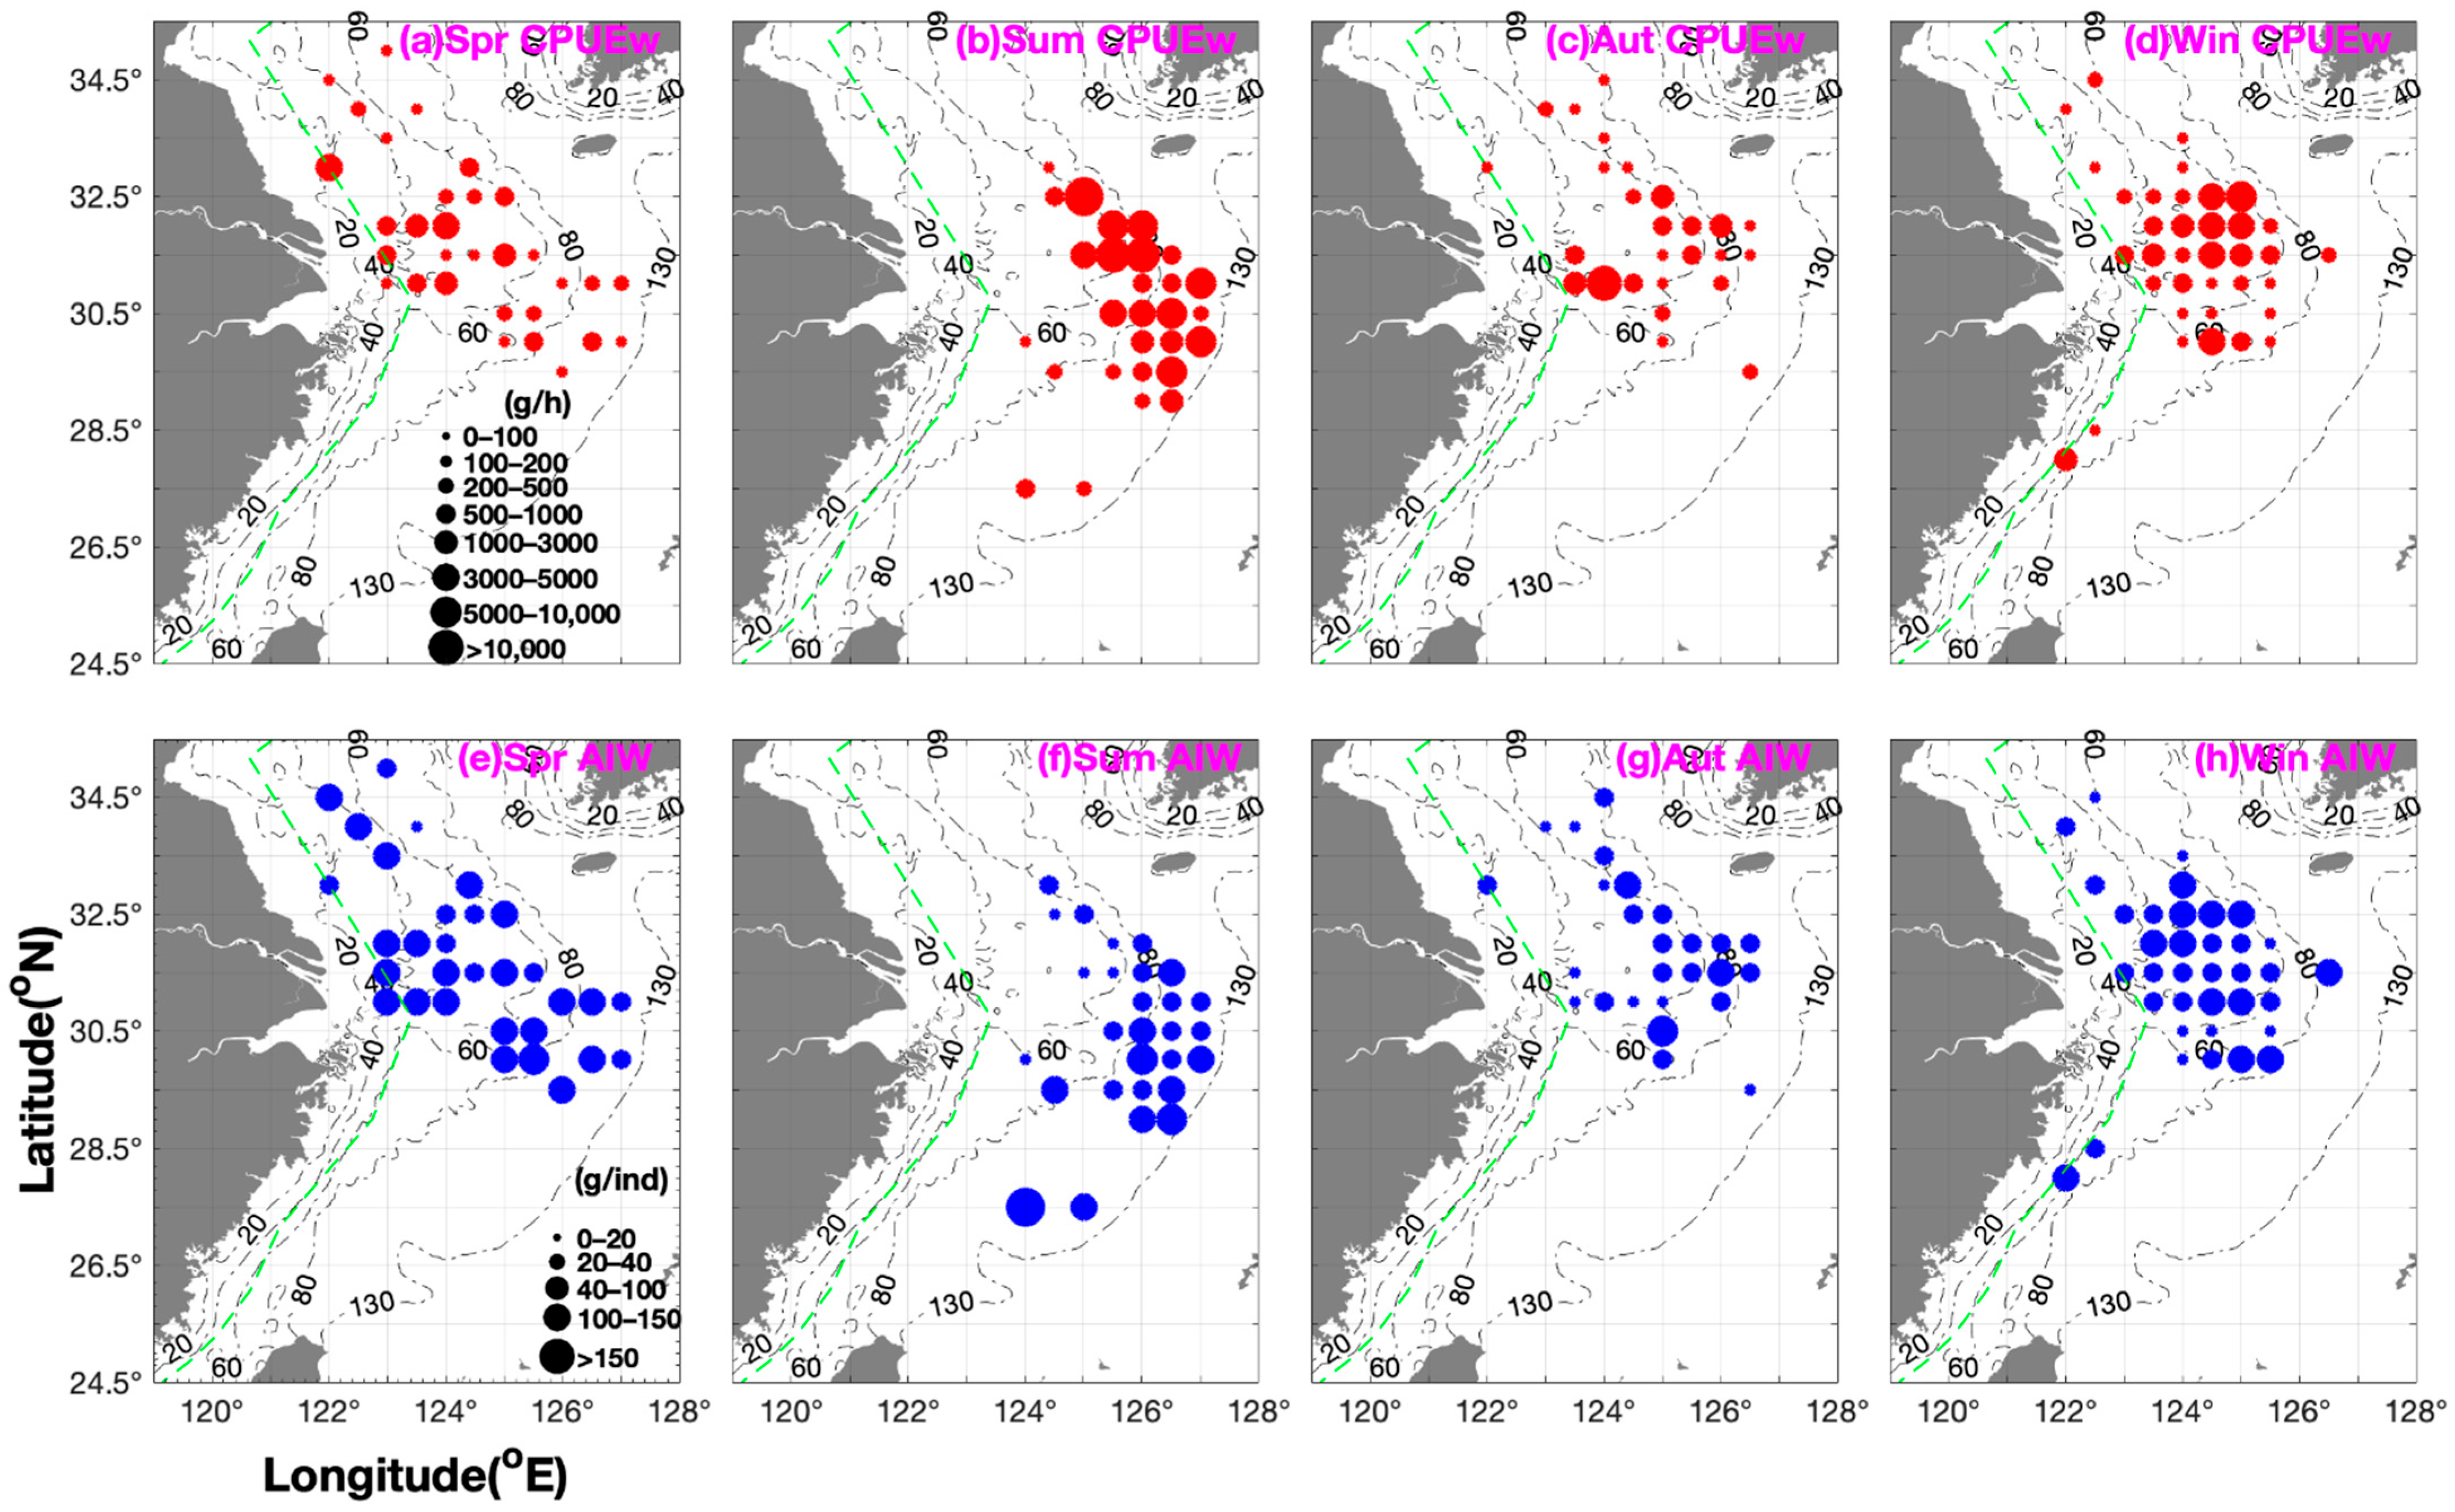
3.1. Seasonal Spatial Distribution Characteristics and Patterns

Figure 2 shows the seasonal spatial distribution patterns of O. punctatus in the study area. The biomass and number of O. punctatus in different seasons in different fishing grounds were in the following order: Dasha > Yangtze River mouth & Jiangwai > Zhouwai > Lianqingshi in spring; Shawai > Jiangwai > Zhouwai > Wenwai-Minwai in summer; Yangtze River mouth > Shawai > Zhouwai > Lianqingshi in autumn; and Dasha > Yangtze River mouth > Yushan > Zhoushan > Lianqingshi in winter (Figure 1 and Figure 2 & Table 1). The seasonal longitudinal order of the biomass was as follows: 124° E–124.5° E > 122° E–123.5° E > 125° E–125.5° E > 126° E–127° E in spring; 125° E–125.5° E > 127° E > 126° E–126.5° E > 124° E–124.5° E in summer; 124° E–124.5° E > 125° E–126.5° E > 122° E–123.5° E in autumn; and 124° E–124.5° E > 125° E–126.5° E > 123° E–123.5° E > 122° E–122.5° E in winter (Figure 1 and Figure 2), indicating the major biomass in the offshore area of 124° E–124.5° E. Table 2 shows the mean seasonal data for CPUEw, CPUEn, and AIW from autumn 2018 to summer 2019. Seasonally, the order of biomass value was summer > autumn and winter > spring (Table 2). The upper limit value was highest in summer, followed by autumn, then winter, and then spring, indicating a gradual decrease in biomass from summer to spring of the following year (Table 2). The number of O. punctatus also showed the order summer > autumn & winter > spring (Table 2).
In spring, the greatest biomass occurred at 20–40 m when CPUEw was >1000 g·h−1. In summer, the values were 40–100 m when CPUEw was >1000 g·h−1, in autumn they were 40–70 m when CPUEw was >200 g·h−1, and in winter they were 40–55 m when CPUEw was >1000 g·h−1. The groups of crabs with AIW > 50 g·ind−1 were found at 40–100 m and those with AIW < 10 g·ind−1 were found at 70 m in spring; 80–120 m and 60 m in summer; 60–70 m and 66 m in autumn; and 45–70 m and ~60 m in winter (Figure 2).
Yu et al. (2005) reported that the seasonal order of O. punctatus biomass from 1998 to 2000 was spring > summer > autumn > winter and that for number, the order was spring > autumn > summer > winter in the study area [1]. They concluded that the spawning period occurs from February to June, as they found more and more juveniles from July to August, with a very slow growth speed from October to the following January [20]. The female sexual gonad is visible in spring [20].
In China, coastal fishermen mainly target spawning cohorts from March to August [24]. In the Mindong fishing ground, Ye et al. (2004) detected the greatest and least biomasses in summer and autumn, respectively, with peak fishery catches occurring in spring and summer [5]. Yu et al. (2005) recorded the largest biomass in spring from 1998 to 2000 [1]. However, after approximately 30 years of intense overfishing and summer moratoria on marine fishing since 1995, the largest biomass in our study occurred from August to September 2018 after the end of the summer fishing moratorium. The annual mean individual weight was 41 g·ind−1 in our study compared to 39 g·ind−1 from 1998 to 2000 [24].
Yu et al. (2006) reported that the areas with the largest biomass of O. punctatus included 31.5° N–32.5° N, 122.5° E–124° E (fishing ground of the Yangtze River mouth); 30° N–30.5° N, 125° E–126.5° E (~80 m depth in the Zhouwai fishing ground); and 26° N–27° N, 122° E–123° E (~80–120 m depth in the Mindong fishing ground) [24]. They concluded that the northern East China Sea is this crab’s spawning and nursery ground, with the center of the grounds located at < 40 m depth in the southwestern Dasha and northwestern Yangtze River mouth fishing grounds in the range of 31.5° N–33° N, 122.5° E–124° E [24]. They also concluded that the central distribution area is located in the southwestern Dasha fishing ground in spring, with the order as follows: Dasha & Yangtze River mouth > Zhouwai > Mindong [24].
Our study results suggest that the central distribution area is located at 31° N–33° N, 122.5° E–126° E (Figure 2). We also found an intense distribution at a depth of ~ 80 m in the Zhouwai fishing ground in spring, but we did not find major biomass in the Mindong fishing ground (Figure 1 and Figure 2). In summer and autumn, the majority of the biomass occurred in offshore water areas (Figure 2).
The mean individual size of the species in the fishing grounds was as follows: Zhouwai > Yangtze River mouth & Jiangwai > Dasha > Lianqingshi in spring; Wenwai-Minwai > Zhouwai > Jiangwai > Dasha & Shawai in summer (with the smallest individual found in the southern Yellow Sea and the largest in the East China Sea); Dasha & Shawai > Yangtze River mouth & Jiangwai > Lianqingshi > Zhouwai in autumn; and Yushan > Dasha & Yangtze River mouth > Lianqingshi > Zhoushan in winter (Figure 1 and Figure 2; Table 1). The longitudinal order of the individual size was as follows: 125° E–125.5° E > 126° E–127° E > 122° E–123.5° E > 124° E–124.5° E in spring; 126° E–126.5° E > 124° E–124.5° E > 127° E > 125° E–125.5° E in summer; 124° E–124.5° E > 126° E–126.5° E > 125° E–125.5° E > 122° E–123.5° E in autumn; and 122° E–122.5° E > 125° E–125.5° E > 123° E–123.5° E > 124° E–124.5° E in winter (Figure 1 and Figure 2). The mean AIW showed the order of spring and summer > winter > autumn, and the upper limit value of AIW was in the order of summer > autumn > spring > winter (Table 2). Yu et al. (2006) suggested that most of the larger crabs occur in the shallower water adjacent to the inshore area in spring, and they also found juvenile and parent cohorts in spring, with the size order of summer > winter > spring [24].

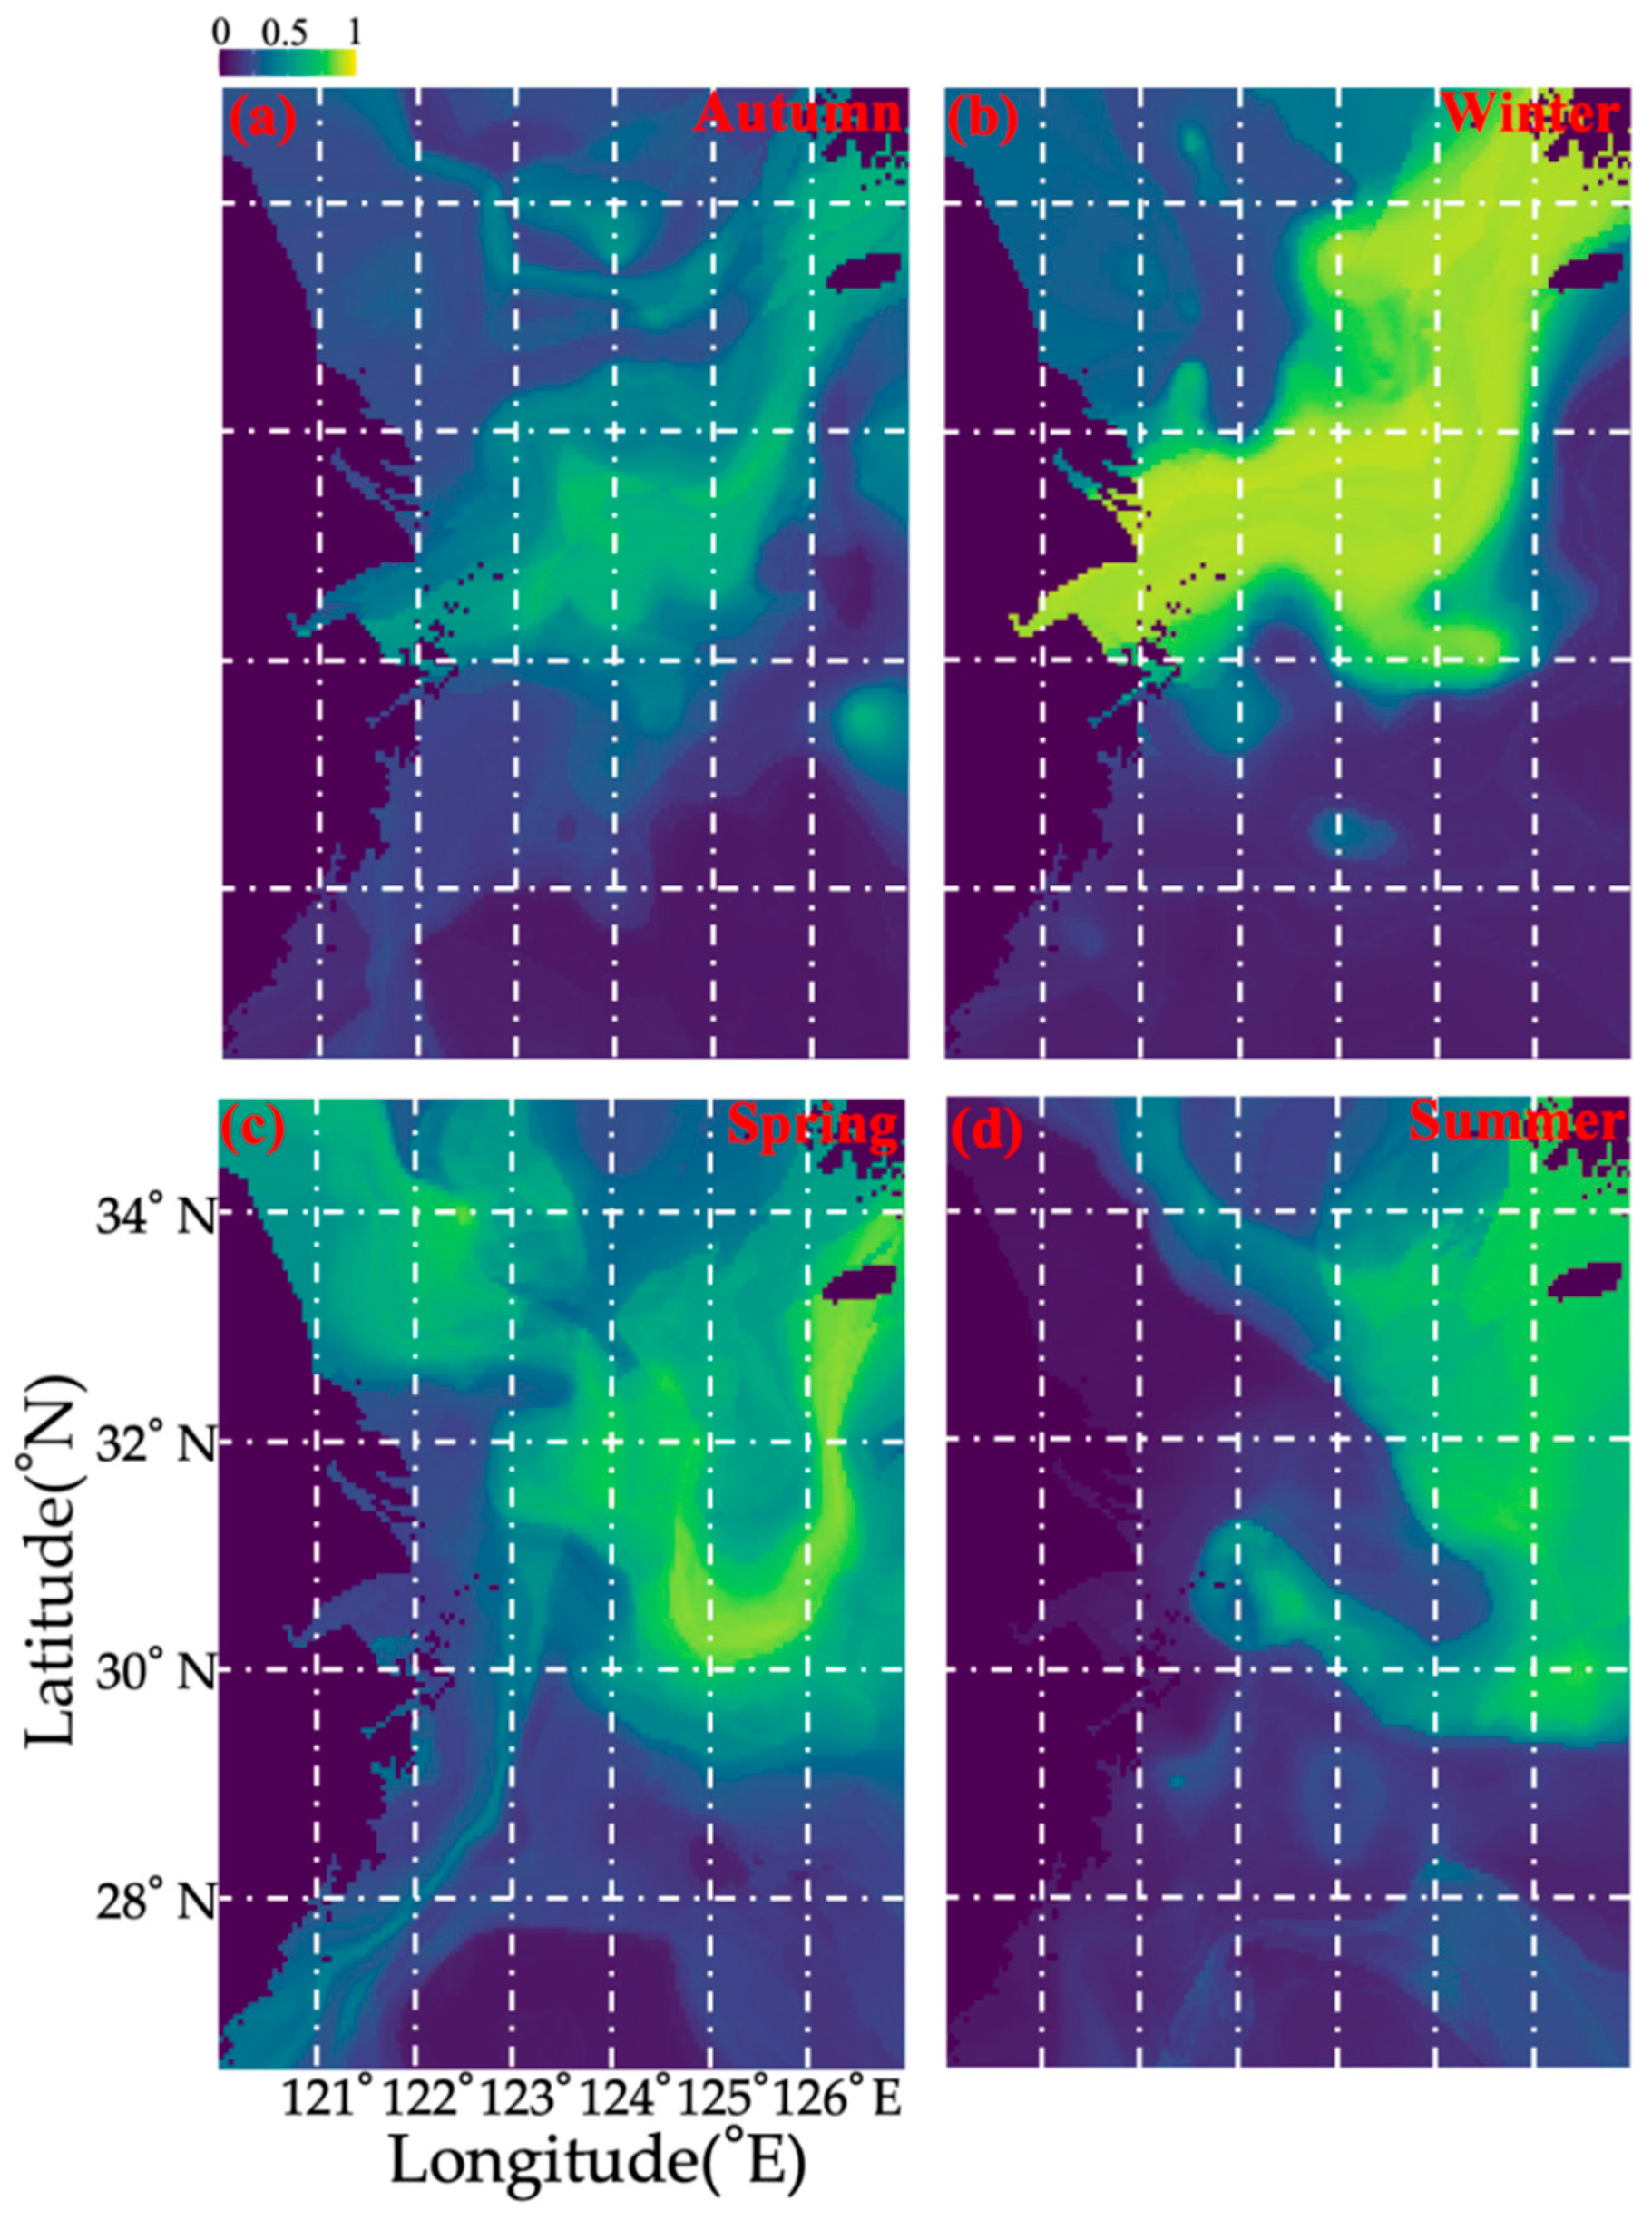
3.2. Seasonal Variations of Environmental Variables

Table 3 presents the seasonal data for the environmental factors. SST values were similar in spring and winter, but the lower limit of SST in winter was lower than that in spring (Table 3). In summer, O. punctatus were found in warmer water areas with SST from 26 °C to 30 °C, and then in autumn, SST decreased (Table 3). SSS was similar in autumn, winter, and spring, but it increased during the transition from autumn to winter, and the cohort migrated to offshore areas at this time (Table 3). From winter to spring, SSS decreased, and the cohort gradually migrated to the inshore areas (Table 3).
The lower limit value of SBT was in the order of summer > spring > winter > autumn, and the upper limit value of SBT was in the order of summer > autumn > spring > winter (Table 3). The SBS values were similar, and the distribution range of the cohort was similar across the four seasons (Table 3). The depth values at which O. punctatus occurred in spring, autumn, and winter were similar, but in summer, they migrated to shallower water areas (Table 3).
Figure 3 shows the relationship between the sea bottom salinity and temperature for CPUEn and AIW. In spring, the greatest number of O. punctatus occurred at SBT 13.44 °C–14.38 °C and SBS 32.04‰–32.32‰ when CPUEn was >20 ind h−1 (Figure 3). In summer, the values were 19.07 °C–20.61 °C and 31.69‰–34.6‰ when CPUEn was >100 ind h−1, and in autumn, they were 21.56 °C and 33.44‰ when CPUEn was >100 ind h−1, and in winter, they were 13.23 °C–15.47 °C and 33.01‰–33.84‰ when CPUEn was >50 ind h−1 (Figure 3).
The groups of crabs with AIW > 50 g·ind−1 were found at SBT 11.81 °C–18.03 °C and SBS 30.58‰–34.25‰ in spring; 17.49 °C–28 °C and 33.68‰–34.64‰ in summer; and 12.43 °C–18.52 °C and 32.44‰–34.48‰ in winter (Figure 3). The groups of smaller-sized individuals (<10 g·ind−1) occurred at 18.59 °C and 33.48‰ and at 9.92 °C and 33.19‰ in autumn and at 15.64 °C–15.70 °C and 33.71‰–34‰ in winter (Figure 3).
Yu et al. (2005) reported that O. punctatus were mainly concentrated at depths of <40 m in spring, >80 m in summer, <40 m in autumn, and 40 to 60 m in winter [1]. Zoeae were detected at a depth of 38 m [25]. Yu et al. (2005) also found that the equation “number = 15,828.1 − 537.77 × water temperature” explained the distribution in summer, with a negative relationship between the individual number of crabs and water temperature in this season [1]. Our results indicated a preference for lower water temperatures, with the majority of the biomass of O. punctatus recorded in winter and spring. Yu et al. (2005) found high biomass at temperatures between 12 °C and 15 °C in spring [1]. It was found that the zoeae of O. punctatus cannot tolerate water temperature > 27.5 °C and salinity < 15‰ and that the optimal values for zoeae survival were 15–22 °C and 34‰–35‰ [25].

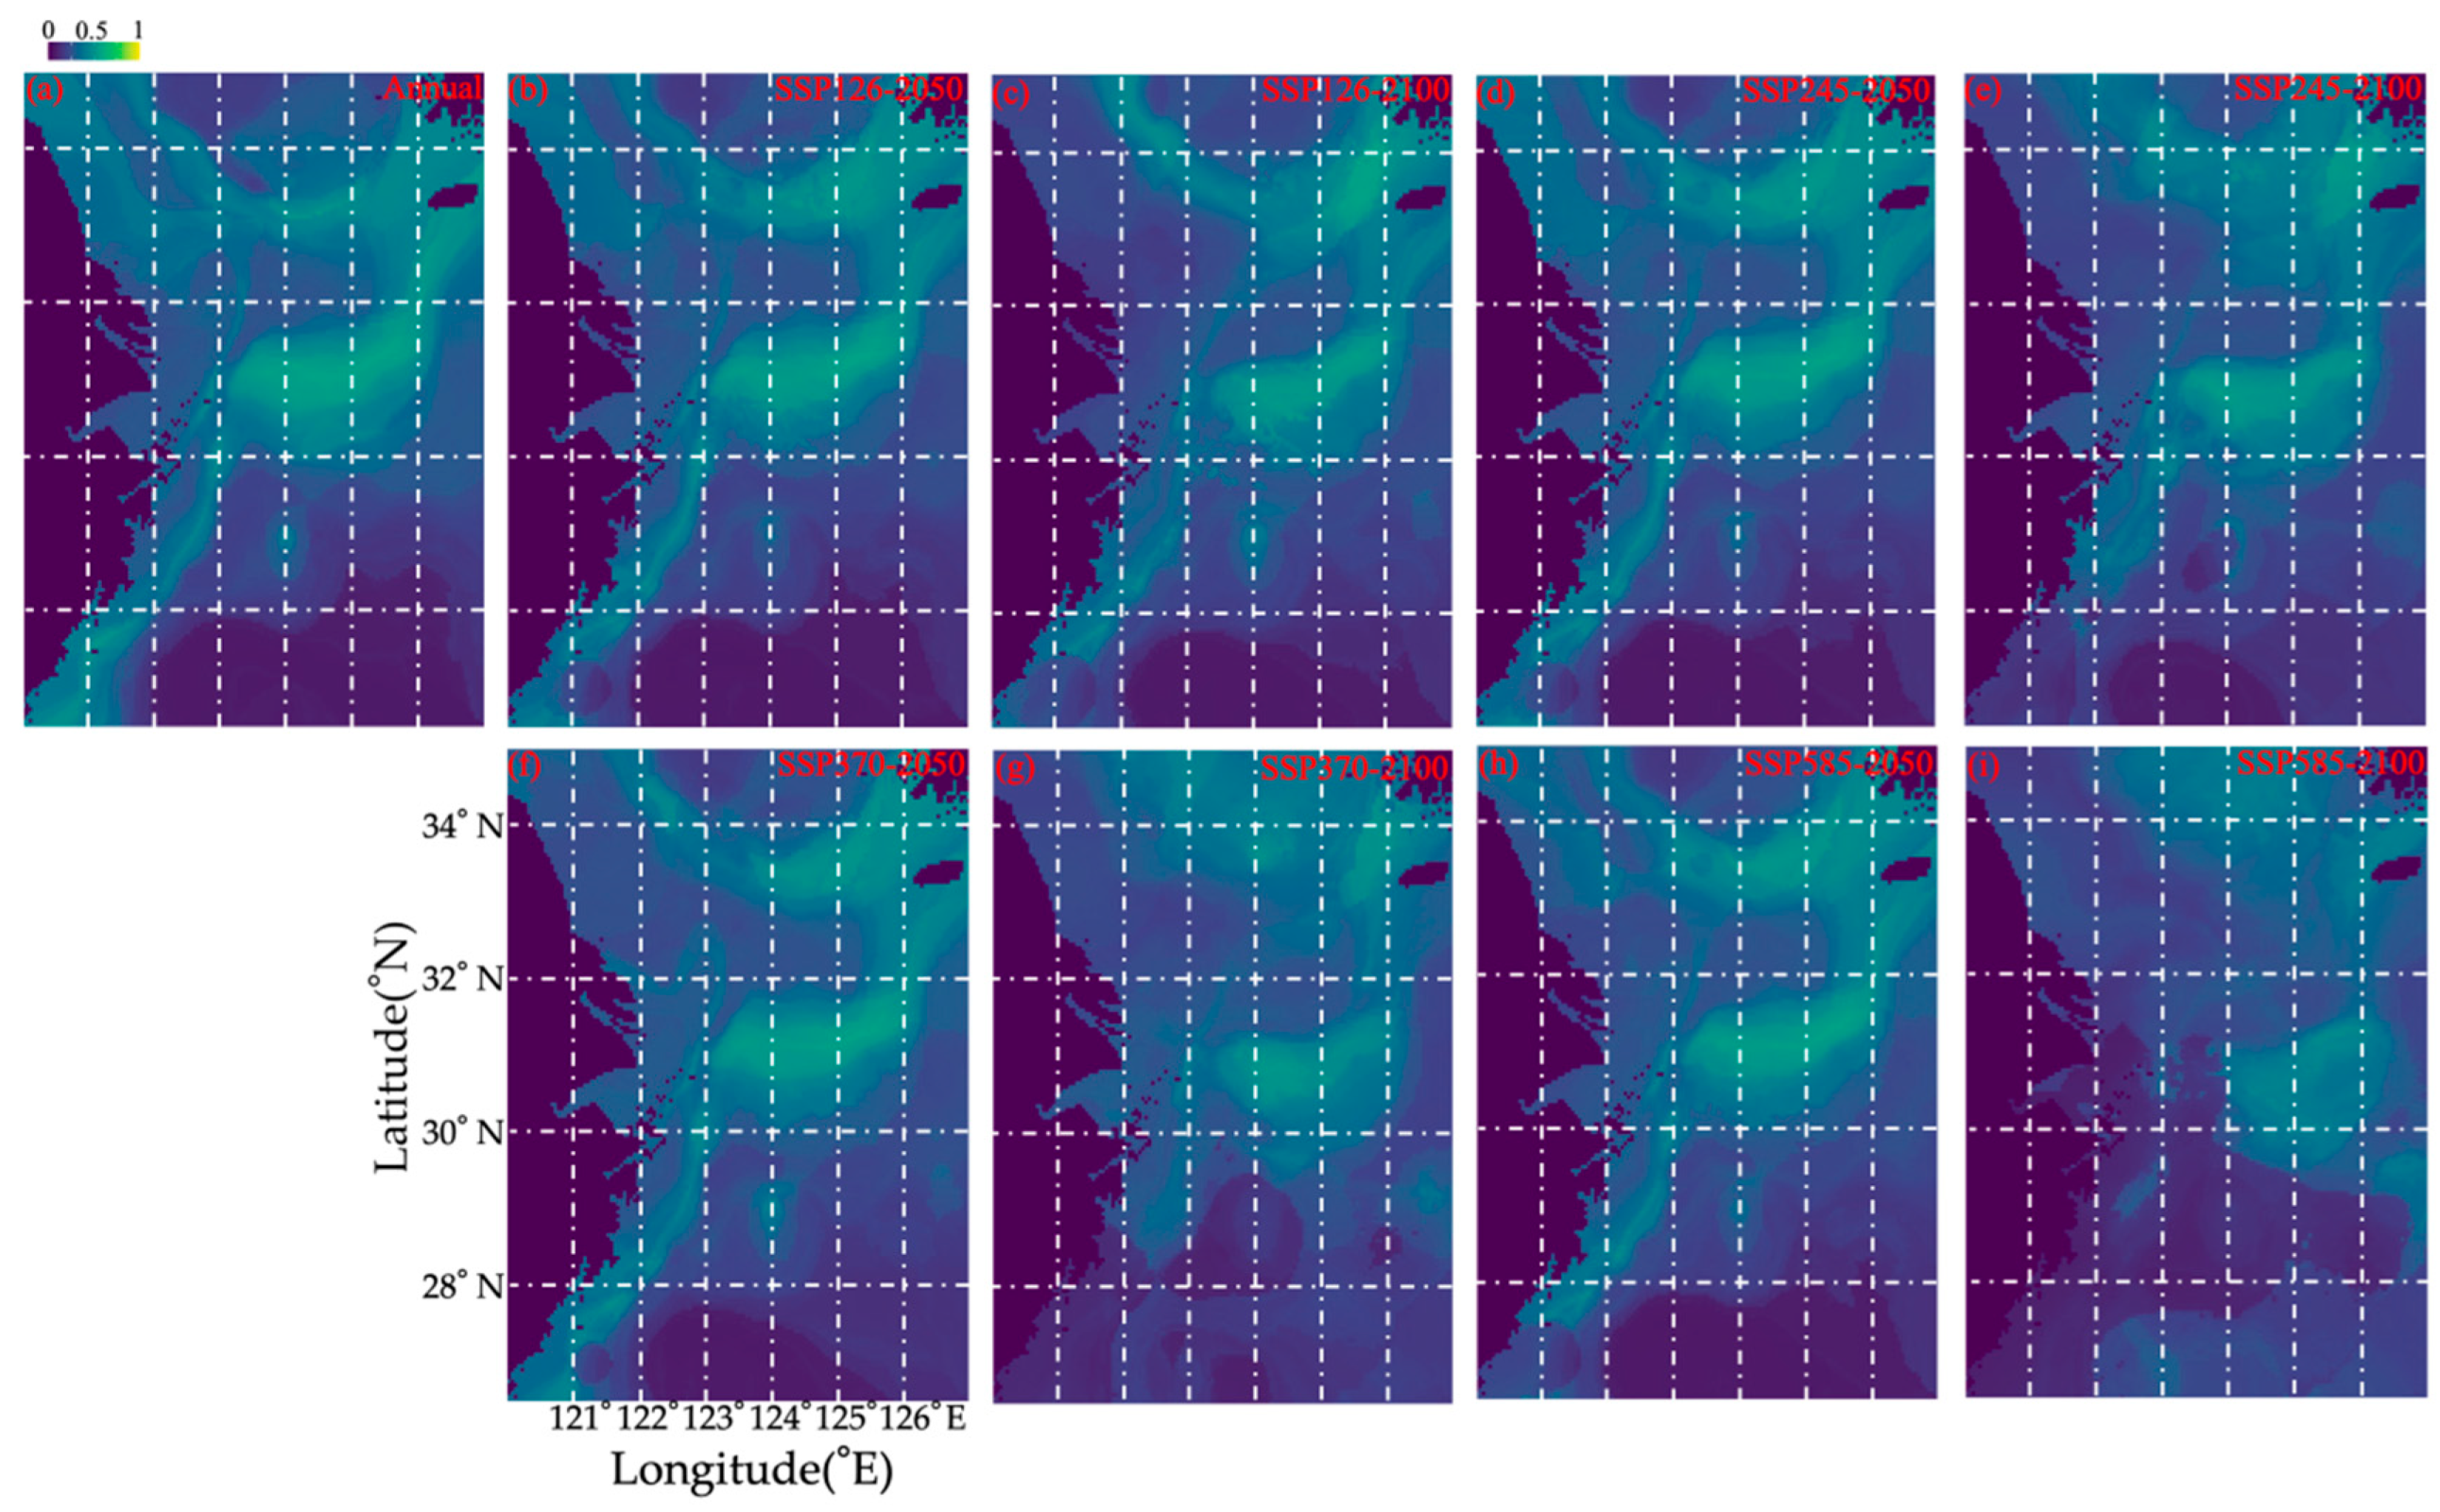
3.3. Habitat Predictions Under Different Climate Projections

Figure 4 shows the current seasonal spatial distribution pattern of O. punctatus. Our survey data show that in spring, O. punctatus were concentrated in the northern East China Sea, including the depth range of 20 to 40 m in Jiangsu coastal water and >40 to 80 m outside the Yangtze River estuary extending to Jeju Island (Figure 4 and Supplementary Figure S1). In summer, the crabs moved to offshore areas with depths < 60 m in the southern Yellow and northern East China Seas (29.5° N to 33° N) (Figure 4 and Supplementary Figure S1). In autumn, they were concentrated in the northern East China Sea, including the Shawai, Jiangwai, and Yangtze River mouth fishing areas (Figure 4). In winter, the crabs remained in the Dasha, Shawai, Jiangwai, and Yangtze River mouth fishing grounds with an enlarged distribution range (Figure 4 and Supplementary Figure S1).
Currently, O. punctatus is concentrated in the southern Yellow and East China Seas, including the fishing grounds of Jiangwai and Shawai and the areas near Jeju Island (Figure 5 and Supplementary Figure S2). A comparison of this case with that of the SSP126-2050 scenario showed that the distribution range in Jiangsu offshore waters would decrease. The distribution ranges in the SSP126, SSP245, SSP370, and SSP585 scenarios for 2050 were similar. An obvious northward distribution tendency was detected in the SSP370-2100 and SSP585-2100 scenarios compared with the SSP126-2100 and SSP245-2100 ones. In the SSP370 and SSP585 scenarios, O. punctatus were distributed in water > 60 m depth in the southern Yellow Sea; however, in the case of SSP370, they remained in the fishing grounds of the Yangtze River mouth and Jiangwai, but under SSP585, they gradually migrated to the Jiangwai fishing ground, showing a tendency for offshore movement (Figure 5 and Supplementary Figure S2).
The models provided various scenarios for future habitat loss and gain (Table 4). The loss area was in the order of SSP585-2100 > SSP370-2100 > SSP126-2100 & SSP245-2100 > SSP370-2050 & SSP585-2050 > SSP126-2050 & SSP245-2050, indicating a greater loss of area in 2100 than in 2050 (Table 4). Greater loss was predicted for SSP585 and SSP370 than for SSP126 and SSP245 (Table 4). The gain area was in the order of SSP245-2100, SSP370-2100, and SSP585-2100 > other scenarios, indicating a greater predicted gain of area in 2100 (Table 4). The “gain minus loss” analysis showed that the population would gradually move northward and to offshore areas in the order of SSP245-2050 > SSP126-2050 & SSP245-2100 & SSP370-2050 & SSP585-2050 > SSP370-2100 & SSP126-2050 > SSP585-2100 (Table 4).

3.4. Implications for Fisheries Management, Underlying Benefits, and Future Studies

Numerous impacts of global warming are expected, including shifts in the distribution of various marine species [26]. The distribution area of Pacific cod (Gadus microcephalus) in the Yellow Sea has moved northward by 0.5° N since 1959 [27]. Climate change is likely to affect the life histories and cycles of marine species [28]. Coastal nearshore warming could be more evident than that in deep water, and the warming rate will likely occur more rapidly at higher latitudes than at lower latitudes [29]. Climate change could reduce the suitable habitat areas for O. punctatus in the study area and force them to migrate to higher latitudes. Our data showed a trend of habitat reduction from low to high latitudes and from nearshore to deep-sea areas for O. punctatus. Changes in distribution patterns may cause community restructuring and ecosystem biodiversity loss, which in turn could have serious impacts on marine fisheries [30]. A series of refuges for the studied species under continuous climate warming needs to be planned in the current management actions, which is a very important factor in regulating crab recruitment in natural populations [31].
Gao’s findings support the conclusion of a single-stock management regime for the species within the Yellow and East China Seas [7], but Yu et al. (2010) argued that the species in this area should be separated into at least two management units [32]. In 2000, China’s central government revised the Chinese Fisheries Law and clearly introduced the idea of a quota fishing system. This system is an active management system that sets a maximum allowable catch for specific fishery resources within a specific time and area. Subsequently, regulations were formulated to gradually implement a quota fishing system to strictly manage and reduce the number of fishing vessels in coastal waters. Future works are needed to identify the accurate management units for the species in the study area. Currently, the system is hindered by the absence of real-time and long-term monitoring to obtain scientific data and the inability to ensure the actual catch or landed quantity within the set TAC range. In response, the government has strictly implemented actions such as summer fishing moratoria and minimum mesh size to protect the juvenile and parent cohorts of marine economic animals.
The results of this study provide a scientific basis for the formulation of an improved fishery management system that includes managing the time, effort, and location of fishing, protecting important habitats, monitoring environmental variations of habitats that may be lost under climate change, and utilizing cohorts in stable habitats in moderation. Our findings also provide important insights into the threat of climate change to suitable habitats for O. punctatus.
The geographic distributions of other species in the study area are also likely to change in response to climate change, thereby affecting the distribution and catch of the target species of existing fisheries. Moreover, climate fluctuations during the spawning season can negatively impact recruitment. In the future, an adaptive science-based fishery management strategy that incorporates multiple species should be developed to gather information, predict outcomes, and monitor and evaluate results. A continuous review of what works and what fails should lead to more economically, ecologically, and socially optimal outcomes under changing environmental and climate conditions.
Finally, our study has some limitations. Specifically, the methods used in this study are subject to the risk of overfitting when predicting future distributions of species under different climate scenarios [33].

4. Conclusions

Compared to the resource status of O. punctatus in 2000, the highest recorded biomass shifted from winter and spring to the end of the summer fishing moratorium (August to September) in our 2018-2019 study. This finding indicates the success and shortcomings of such legal regulations. In addition, we argued that the major biomass of the species concentrated on the Dasha fishing ground for spawning in spring, and migrated south to the Shawai and Jiangwai fishing grounds for feeding and nursery in summer, and concentrated on the Yangtze River mouth fishing ground for food and growth in autumn, and gradually migrated from Zhoushan to Dasha fishing grounds for the preparations of next generation release. The findings of our study have implications for fisheries management and the establishment of new regulations in China and lay the groundwork for sustainable O. punctatus fisheries.

Supplementary Materials

The following supporting information can be downloaded at: https://www.mdpi.com/article/10.3390/biology14080947/s1, Figure S1: The predicted habitat suitability of Ovalipes punctatus in different seasons; Figure S2: The predicted habitat suitability of Ovalipes punctatus in different climate scenarios.

Author Contributions

Conceptualization, M.X. and H.L.; methodology, J.L.; software, H.Z.; validation, M.X., H.L. and H.Z.; formal analysis, X.S.; investigation, X.S. and Z.L.; resources, X.S.; data curation, M.X.; writing—original draft preparation, M.X.; writing—review and editing, M.X.; visualization, H.L.; supervision, H.L.; project administration, H.L.; funding acquisition, H.L. All authors have read and agreed to the published version of the manuscript.

Funding

This research was supported by the National Key R&D Program of China (Grant/Award Numbers: 2024YFD2400404).

Institutional Review Board Statement

Ethical review and approval were waived for this study due to the lack of involvement with an endangered species.

Informed Consent Statement

Not applicable.

Data Availability Statement

The original contributions presented in this study are included in the article/Supplementary Material. Further inquiries can be directed to the corresponding author.

Acknowledgments

The authors wish to thank the crews of the fishing boats for their help with field sampling; members of the Key Laboratory of East China Sea and the Oceanic Fishery Resources Exploitation, Ministry of Agriculture and Rural Affairs; and Wenquan Sheng for constructive discussions and encouragement.

Conflicts of Interest

The authors declare no conflicts of interest.

References

  1. Yu, C.G.; Song, H.T.; Yao, G.Z. Study on distribution of Ovalipes punctatus (crab) in the East China Sea. J. Fish. China 2005, 29, 198–204. (In Chinese) [Google Scholar]
  2. Wu, G.F.; Xie, Q.J. Biological traits and seasonal spatial distribution pattern of main economic crab species in Mindongbei fishing ground. J. Fujian Fish. 2002, 1, 10–14. (In Chinese) [Google Scholar]
  3. Brown, A.C.; McLachlan, A. Ecology of Sandy Shores; Elsevier Press: Amsterdam, The Netherlands, 1990. [Google Scholar]
  4. Jiang, X.Q.; Yu, C.G. Reproductive biology of Ovalipes punctatus in the East China Sea. J. Zhejiang Ocean. Univ. Nat. Sci. Ed. 2012, 31, 285–289. (In Chinese) [Google Scholar]
  5. Ye, Q.T.; Zhang, Z.L.; Ye, S.Z. The biomass distribution and biological characteristic of Ovalipes Punctatus in the Eastern Fujian Outer Sea. J. Fujian Fish. 2004, 4, 47–51. (In Chinese) [Google Scholar]
  6. Lee, H.; Jeong, J.; Choi, Y. Sex-specific differences in the growth and population characteristics of sand crab Ovalipes punctatus (De Haan, 1833) in coastal waters of Korea. Sci. Rep. 2024, 14, 20137. [Google Scholar] [CrossRef]
  7. Zheng, W.; Han, Z.; Chen, G.; Yu, C.; Gao, T. Mitochondrial DNA variation in the East China Sea and Yellow Sea populations of swimming crab Ovalipes punctatus. Mitochondrial DNA 2015, 26, 559–565. [Google Scholar] [CrossRef]
  8. Wang, Y.; Yu, C.G.; Zheng, J.; Chen, X.Q.; Ning, P. Biological characteristics and seasonal variations of Ovalipes punctatus in the Zhoushan fishing ground. Oceanol. Et Limnol. Sin. 2011, 42, 274–278. (In Chinese) [Google Scholar]
  9. Li, J.; Chen, X.; Fang, X.; Yu, H. Analysis on flesh rate and muscle nutritional value in Ovalipes punctatus. Food Ind. 2012, 33, 93–96. (In Chinese) [Google Scholar]
  10. Fisheries Administration Bureau; MARA; PRC. China Fishery Statistics Yearbooks; China Agriculture Press: Beijing, China, 2020. (In Chinese) [Google Scholar]
  11. Hoegh-Guldberg, O. Coral reef sustainability through adaptation: Glimmer of hope or persistent mirage? Curr. Opin. Environ. Sustain. 2014, 7, 127–133. [Google Scholar] [CrossRef]
  12. Fabry, V.J.; Seibel, B.A.; Feely, R.A.; Orr, J.C. Impacts of ocean acidification on marine fauna and ecosystem processes. ICES J. Mar. Sci. 2008, 65, 414–432. [Google Scholar] [CrossRef]
  13. Bellard, C.; Thuiller, W.; Leroy, B.; Genovesi, P.; Bakkenes, M.; Courchamp, F. Will climate change promote future invasions? Glob. Change Biol. 2013, 19, 3740–3748. [Google Scholar] [CrossRef]
  14. Hulme, P.E. Climate change and biological invasions: Evidence, expectations, and response options. Biol. Rev. 2017, 92, 1297–1313. [Google Scholar] [CrossRef]
  15. Xu, S.C.; Zhang, Y.; Zhou, Y.; Xu, S.; Yue, S.D.; Liu, M.J.; Zhang, X. Warming northward shifting southern limits of the iconic temperate seagrass (Zostera marina). iScience 2022, 25, 104755. [Google Scholar] [CrossRef]
  16. Koepper, S.; Revie, C.W.; Stryhn, H.; Clark, K.F.; Scott-Tibbetts, S.; Thakur, K.K. Spatial and temporal patterns in the sex ratio of American lobsters (Homarus americanus) in southwestern Nova Scotia, Canada. Sci. Rep. 2021, 11, 24100. [Google Scholar] [CrossRef]
  17. Zhang, C.C.; Wei, H.; Song, G.S.; Xie, C. IPCC-CMIP5 Based projection and analysis of future sea surface temperature changes in coastal Seas East of China. Oceanol. Et Limnol. Sin. 2020, 51, 1288–1300, (In Chinese with English abstract). [Google Scholar]
  18. IPCC (Intergov. Panel Clim. Change). Summary for policymakers. In Climate Change 2013: The Physical Science Basis. Contribution of Working Group I to the Fifth Assessment Report of the Intergovernmental Panel on Climate Change; Stocker, T.F., Qin, D., Plattner, G.K., Tignor, M., Allen, S.K., Boschung, J., Nauels, A., Xia, Y., Bex, V., Midgley, P.M., Eds.; Cambridge University Press: Cambridge, UK, 2013; pp. 1–30. [Google Scholar]
  19. Ning, X.R.; Lin, C.L.; Su, J.L.; Liu, C.G.; Hao, Q.; Le, F.F.; Tang, Q. Long-term environmental changes and the responses of the ecosystems in the Bohai Sea during 1960–1996. Deep Sea Res. Part II 2010, 57, 1079–1091. [Google Scholar] [CrossRef]
  20. Yu, C.; Song, H.; Yao, G. Biological characteristics of Ovalipes punctatus in the East China Sea. J. Fish. China 2004, 28, 657–662. (In Chinese) [Google Scholar]
  21. Liu, S.; Tian, Y.; Liu, Y.; Alabia, I.D.; Cheng, J.; Ito, S. Development of a prey-predator species distribution model for a large piscivorous fish: A case study for Japanese Spanish mackerel Scomberomorus niphonius and Japanese anchovy Engraulis japonicus. Deep Sea Res. Part II 2023, 207, 105227. [Google Scholar] [CrossRef]
  22. Liu, S.; Liu, Y.; Xing, Q.; Li, Y.; Tian, H.; Luo, Y.; Ito, S.; Tian, Y. Climate change drives fish communities: Changing multiple facets of fish biodiversity in the Northwest Pacific Ocean. Sci. Total Environ. 2024, 955, 176854. [Google Scholar] [CrossRef]
  23. Riahi, K.; Van Vuuren, D.P.; Kriegler, E.; Edmonds, J.; O’Neill, B.C.; Fujimori, S.; Bauer, N.; Calvin, K.; Dellink, R.; Fricko, O.; et al. The shared socioeconomic pathways and their energy, land use, and greenhouse gas emissions implications: An overview. Glob. Environ. Chang. 2017, 42, 153–168. [Google Scholar] [CrossRef]
  24. Yu, C.; Song, H.; Yao, G.; Lu, H. Composition and distribution of economic crab species in the East China Sea. Oceanol. Et Limnol. Sin. 2006, 37, 53–60. (In Chinese) [Google Scholar]
  25. Preez, H.H.D.; Mclachlan, A. Distribution of the portunid crab Ovalipes punctatus (De hann) in Algoa Bay and salinity and temperature tolerances of its zoeae. Afr. Zool. 1984, 19, 302–304. [Google Scholar]
  26. Poloczanska, E.S.; Burrows, M.T.; Brown, C.J.; García Molinos, J.; Halpern, B.S.; Hoegh-Guldberg, O.; Kappel, C.V.; Moore, P.J.; Richardson, A.J.; Schoeman, D.S.; et al. Responses of marine organisms to climate change across oceans. Front. Mar. Sci. 2016, 3, 62. [Google Scholar] [CrossRef]
  27. Li, Z.L.; Jin, X.S.; Zhang, B.; Zhou, Z.P.; Shan, X.J.; Dai, F.Q. Interannual variations in the population characteristics of the Pacific cod Gadus macrocephalus in the Yellow Sea. Oceanol. Et Limnol. Sin. 2012, 43, 924–931. (In Chinese) [Google Scholar]
  28. Merino, G.; Barange, M.; Blanchard, J.L.; Harle, J.; Holmes, R.; Allen, I.; Allison, E.H.; Badjeck, M.C.; Dulvy, N.K.; Holt, J.; et al. Can marine fisheries and aquaculture meet fish demand from a growing human population in a changing climate? Glob. Environ. Change 2012, 22, 795–806. [Google Scholar] [CrossRef]
  29. Liu, X.; Han, X.; Han, Z. Effects of climate change on the potential habitat distribution of swimming crab Portunus trituberculatus under the species distribution model. J. Oceanol. Linmlogy 2022, 40, 1556–1565. [Google Scholar] [CrossRef]
  30. Rilov, G. Multi-species collapses at the warm edge of a warming sea. Sci. Rep. 2016, 6, 36897. [Google Scholar] [CrossRef]
  31. Takahashi, K.; Kawaguchi, K. Nocturnal occurrence of the swimming crab Ovalipes punctatus in the swash zone of a sandy beach in northeastern Japan. Fish. Bull. Natl. Ocean. Atmos. Adm. 2001, 99, 510–515. [Google Scholar]
  32. Yu, C.G.; Han, Z.Q.; Zheng, J.; Xue, L.J.; Gao, T.X. Genetic population structure of Ovalipes punctatus revealed by AFLP markers. Sci. Res. Essays 2010, 5, 1649–1654. [Google Scholar]
  33. Torrejón-Magallanes, J.; Ángeles-González, L.E.; Csirke, J.; Bouchon, M.; Morales-Bojórquez, E.; Arreguín-Sánchez, F. Modeling the Pacific chub mackerel (Scomber japonicus) ecological niche and future scenarios in the northern Peruvian Current System. Prog. Oceanogr. 2021, 197, 102672. [Google Scholar] [CrossRef]
Figure 1. (a) Map of the study area (26.50–35.00° N, 120.00–127.00° E), which is denoted by a dark solid line in the East China Sea region and includes the southern Yellow and East China Seas. The color bar denotes a depth range of 0–100 m. The red dashed line indicates the boundary between the Yellow Sea and the East China Sea. (b) The black boxes and numbers represent the following fishing grounds: (1) Haizhou Bay, (2) Lianqingshi, (3) Liandong, (4) Lvsi, (5) Dasha, (6) Shawai, (7) Yangtze River mouth, (8) Jiangwai, (9) Zhoushan, (10) Zhouwai, (11) Yushan, (12) Yuwai, (13) Wentai, (14) Wenwai, (15) Mindong, (16) Minwai, and (17) Minzhong.
Biology 14 00947 g001
Figure 2. Seasonal distribution patterns of Ovalipes punctatus catch per unit effort by weight (CPUEw; g·h−1) are shown in red (grouped into 0–100, 100–200, 200–500, 500–1000, 1000–3000, 3000–5000, 5000–10,000, and >10,000 g·h−1), and AIW (g·ind−1) data are shown in blue (grouped into 0–20, 20–40, 40–100, 100–150, and >150 g·ind−1). (ad) CPUEw in (a) spring, (b) summer, (c) autumn, (d) winter; (eh) AIW in (e) spring, (f) summer, (g) autumn, and (h) winter.
Biology 14 00947 g002
Figure 3. Relationship between salinity (‰) and temperature (°C) for catch per unit effort by number (CPUEn) size classified by group (0–50, 50–100, 100–200, 200–500, and >500 ind·h−1) and average individual weight (AIW) size classified by group (0–20, 20–40, 40–100, 100–150, >150 g·ind−1) of Ovalipes punctatus. The data for spring, summer, autumn, and winter are denoted by solid blue, light blue, green, and brown circles, respectively. (a) Sea bottom temperature vs. sea bottom salinity for CPUEn; (b) sea bottom temperature vs. sea bottom salinity for AIW.
Biology 14 00947 g003
Figure 4. Current seasonal spatial predicted distribution patterns of Ovalipes punctatus (ad) from spring to winter in the study area based on data collected from 2018–2019.
Biology 14 00947 g004
Figure 5. Predicted spatial habitat distribution patterns of Ovalipes punctatus in the cases of (a) annual mean habitat, (b) SSP126 in 2050, (c) SSP126 in 2100, (d) SSP245 in 2050, (e) SSP245 in 2100, (f) SSP376 in 2050, (g) SSP370 in 2100, (h) SSP585 in 2050, and (i) SSP585 in 2100.
Biology 14 00947 g005
Table 1. Mean and total values of catch per unit effort by weight (CPUEw; g·h−1), percentage of CPUEw, catch per unit effort by number (CPUEn; ind·h−1), percentage of CPUEn, average individual weight (AIW; g·ind−1), and percentage of AIW in different fishing grounds according to season.
Mean ValueTotal Value
BB%NN%AIWBB%NN%AIWAIW%
Spring
(2)70.35.9%1.55.5%38.2281.43.3%63%152.79.6%
(5)50942.5%1451.2%41.44581.353.8%126.263%372.823.3%
(7)233.519.5%4.215.3%53.21401.316.5%25.212.6%319.420%
(8)225.118.8%5.419.6%42.51125.513.2%26.913.4%212.313.3%
(10)159.913.3%2.38.4%77.21119.313.2%168%540.133.8%
Summer
(5)262.12.3%15.23.1%18.9524.20.9%30.51.4%37.72.7%
(6)7155.861.8%320.865.9%21.821,467.437.4%962.443.8%65.54.7%
(8)2434.821%117.824.2%31.417,043.629.7%824.837.6%219.515.7%
(10)144012.4%30.86.3%4517,279.830.1%369.716.8%539.838.7%
(14)&(16)2782.4%2.10.4%133.31113.81.9%8.50.4%533.438.2%
Autumn
(2)62.32.2%3.83.1%16.31871.6%11.52.3%48.87.8%
(5)60.12.1%2.11.7%32.8300.32.5%10.52.1%164.226.3%
(6)443.615.6%16.613.6%26221818.7%82.816.4%130.220.9%
(7)2009.270.7%87.571.7%18.58036.867.7%349.869.5%74.211.9%
(8)113.54%4.13.4%29.2680.85.7%24.94.9%175.328.1%
(10)151.55.3%7.96.5%15.4454.43.8%23.84.7%30.84.9%
Winter
(2)92.84.6%58.5%25.4185.61%101.7%50.84.1%
(5)82040.5%21.236.1%36.810,659.855%27648.3%478.538.2%
(7)478.423.6%15.626.5%36.25740.329.6%18732.7%434.534.7%
(9)309.115.3%1322.1%232163.711.2%90.815.9%161.212.9%
(11)324.716%46.8%63.5649.43.3%81.4%127.110.1%
N.B.: fishing grounds of (2) Lianqingshi, (5) Dasha, (6) Shawai, (7) Yangtze River mouth, (8) Jiangwai, (9) Zhoushan, (10) Zhouwai, (11) Yushan, (14) Wenwai, and (16) Minwai (see Figure 1).
Table 2. Seasonal data for catch per unit effort by weight (CPUEw; g·h−1), number (CPUEn; ind·h−1), and average individual weight (AIW; g·ind−1) from autumn 2018 to summer 2019.
FactorSpringSummerAutumnWinter
Mean CPUEw at collection stations (g·h−1)274.482051.03456.82538.86
Value range of CPUEw (g·h−1)11.84–1286.2418.9–1312010.95–6896.9416.06–3450.67
Mean CPUEn at collection stations (ind·h−1)6.4678.4319.3615.88
Value range of CPUEn (ind·h−1)1–44.751.09–5681–282.350.97–84
Mean AIW (g·ind−1)51.5349.8528.6634.78
Value range of AIW (g·ind−1)8.97–104.333.5–203.177.3–121.626.7–87.06
Abbreviations: CPUEw, catch per unit effort by weight; CPUEn, catch per unit effort by number; AIW, average individual weight.
Table 3. Seasonal data ranges of environmental factors (SST, SSS, SBT, SBS, depth) in the study area from autumn 2018 to summer 2019.
FactorSpringSummerAutumnWinter
SST (°C)12.61–18.0226.15–29.6116.97–22.699.14–18.41
SSS (‰)30.58–33.9527.73–33.9730.49–34.0231.6–34.34
SBT (°C)10.1–18.0312.55–289.04–22.79.26–18.52
SBS (‰)30.58–34.3131.69–34.6531.37–34.7731.69–34.48
Depth (m)20–10543–12021–10219–90
Abbreviations: SST, sea surface temperature; SBT, sea bottom temperature; SSS, sea surface salinity; SBS, sea bottom salinity.
Table 4. Percentages of habitat loss, gain, and overall habitat (gain minus loss) for Ovalipes punctatus under various climate scenarios (SSP126-2050, SSP126-2100, SSP245-2050, SSP245-2100, SSP370-2050, SSP370-2100, SSP585-2050, and SSP585-2100).
Case.Loss%Gain%Gain% − Loss%
SSP126–2050−25.76%7.77%−18.00%
SSP126–2100−38.55%10.95%−27.61%
SSP245–2050−22.22%9.96%−12.26%
SSP245–2100−43.92%24.11%−19.81%
SSP370–2050−31.50%9.41%−22.10%
SSP370–2100−60.09%28.30%−31.79%
SSP585–2050−34.24%9.62%−24.62%
SSP585–2100−78.49%24.72%−53.77%
Disclaimer/Publisher’s Note: The statements, opinions and data contained in all publications are solely those of the individual author(s) and contributor(s) and not of MDPI and/or the editor(s). MDPI and/or the editor(s) disclaim responsibility for any injury to people or property resulting from any ideas, methods, instructions or products referred to in the content.

