Article

Limitations of the Farquhar–von Caemmerer–Berry Model in Estimating the Maximum Electron Transport Rate: Evidence from Four C3 Species

1
Institute of Biophysics, Math & Physics College, Jinggangshan University, Ji’an 343009, China
2
School of Life Science, Jinggangshan University, Ji’an 343009, China
3
Department of Biological Sciences, Macquarie University, Sydney, NSW 2000, Australia
4
Faculty of Forestry and Wood Technology, Poznan University of Life Sciences, Wojska Polskiego 71E, 60-625 Poznan, Poland
5
Key Laboratory of Crop Breeding in South Zhejiang, Wenzhou Academy of Agricultural Sciences, Wenzhou 325006, China
6
College of Bioscience and Engineering, Jiangxi Agriculture University, Nanchang 330045, China
7
School of Life Sciences, Nantong University, Nantong 226019, China
8
State Key Laboratory of Environmental Chemistry and Ecotoxicology, Research Center for Eco-Environmental Sciences, Chinese Academy of Sciences, Beijing 100085, China
*
Authors to whom correspondence should be addressed.
Current address: New Quality Productivity Research Center, Guangdong ATV College of Performing Arts, Deqing 526631, China.
These authors contributed equally to this work.
Biology 2025, 14(6), 630; https://doi.org/10.3390/biology14060630
Submission received: 24 April 2025 / Revised: 20 May 2025 / Accepted: 23 May 2025 / Published: 29 May 2025
(This article belongs to the Special Issue Plant Stress Physiology: A Trait Perspective)

Simple Summary

Accurately measuring how plants convert sunlight into energy through photosynthesis is crucial for predicting crop yields and understanding plant responses to climate change. Scientists often use mathematical models, like the FvCB model, to estimate the maximum rate of electron transport in plants—a key factor in photosynthesis. However, this study found that two widely used versions of the FvCB model often overestimate this rate when tested on four common plant species, including wheat and ryegrass. By comparing model predictions with direct measurements, this research revealed that the models fail to account for energy losses caused by processes like photorespiration and nutrient absorption. The empirical model proposed by Ye et al. provided more accurate and reliable estimates. These findings highlight the need to improve existing models to better predict plant growth under changing environmental conditions. This work will help farmers, ecologists, and policymakers make more informed decisions about crop management and climate adaptation strategies, ensuring food security and ecosystem resilience in a warming world.

Abstract

The study evaluates the accuracy of two FvCB model sub-models (I and II) in estimating the maximum electron transport rate for CO2 assimilation (JA-max) by comparing estimated values with observed maximum electron transport rates (Jf-max) in four C3 species: Triticum aestivum L., Silphium perfoliatum L., Lolium perenne L., and Trifolium pratense L. Significant discrepancies were found between JA-max estimates from sub-model I and observed Jf-max values for T. aestivum, S. perfoliatum, and T. pratense (p < 0.05), with sub-model I overestimating JA-max for T. aestivum. Sub-model II consistently produced higher JA-max estimates than sub-model I. This study highlights limitations in the FvCB sub-models, particularly their tendency to overestimate JA-max when accounting for electron consumption by photorespiration (JO), nitrate reduction (JNit), and the Mehler reaction (JMAP). An alternative empirical model provided more accurate Jf-max estimates, suggesting the need for improved approaches to model photosynthetic electron transport. These findings have important implications for crop yield prediction, ecological modeling, and climate change adaptation strategies, emphasizing the need for more accurate estimation methods in plant physiology research.

1. Introduction

As global environmental changes intensify, the ability to accurately estimate plant photosynthetic rates has become increasingly critical for predicting and adapting to future climate conditions. The light-driven electron transport chain in the photosynthetic apparatus is the fundamental force powering plant growth and development. A key parameter is the maximum electron transport rate for CO2 assimilation (JA-max), which represents the peak rate under light-saturated conditions and reflects the upper limit of energy conversion during photosynthesis. Therefore, accurate determination of JA-max is essential for understanding plant responses to environmental factors such as light, CO2 concentration, temperature, nutrition, and water availability [1,2,3,4,5,6].
To estimate JA-max, both indirect and direct methods have been developed. The indirect method, based on the Farquhar–von Caemmerer–Berry (FvCB) model, estimates JA-max by fitting the CO2 response curve of photosynthesis (AnCi curve) under light-saturated conditions. The FvCB model, which considers the enzymatic kinetics of Rubisco and the chemometrics of RuBP regeneration in C3 species, is widely used for this purpose [2,3,5,6,7,8,9,10,11]. Direct methods include the non-rectangular hyperbolic model (NRH model) and a mechanistic model of the light response of electron transport rate (J–I curve) developed by Ye et al. [12,13]. These models estimate or calculate Jmax by fitting the J–I curve, and the latter model considers light energy absorption and pigment molecule excitation in photosynthesis. However, these models are typically used to estimate Jmax under constant CO2 conditions and do not investigate the CO2 response of photosynthesis in plants.
With rising atmospheric CO2 levels, understanding C3 plant responses to elevated CO2 is crucial. The FvCB model is a key tool for investigating this response and has been extensively applied to study plant physiology under various conditions [4,5,6,14,15,16,17,18,19,20,21,22]. The FvCB model estimates key parameters like JA-max, the maximum carboxylation rate (Vcmax), triose phosphates utilization (VTPU), day respiration rate (Rd), and mesophyll conductance (gm), which are vital for crop yield prediction, ecological modeling, and global carbon cycling [4,5,6,17,20,23,24,25,26]. However, JA-max in the FvCB model is indirectly estimated, necessitating a modeling–observation intercomparison approach to assess its accuracy under different conditions.
The FvCB model’s development involves two equations for estimating JA-max by fitting the AnCi curve of C3 plants. One assumes RuBP regeneration is limited by NADPH alone (sub-model I) [2,5,6,7,27,28,29], while the other assumes co-limitation by NADPH and ATP (sub-model II) [5,8,23,27,30,31]. Sub-model I is often favored for its accuracy in estimating JA-max across diverse environmental conditions. In contrast, sub-model II is employed by others to explore the photosynthetic physiology and ecology of C3 plants under varied environmental conditions [5,8,23,27,30,32].
However, in practice, it is uncertain whether RuBP regeneration in C3 plants is limited by NADPH alone or co-limited by NADPH and ATP, leading to uncertainty in model selection and JA-max estimation accuracy. Therefore, it is essential to verify the consistency of JA-max values estimated by the two sub-models with observed values, especially under varying environmental conditions.
Our objective in this study is to simultaneously measure the AnCi and JCi curves for Triticum aestivum L., Silphium perfoliatum L., Lolium perenne L., and Trifolium pratense L. at saturating irradiance (Isat), fit the AnCi curves using both FvCB sub-models to estimate JA-max values, and compare these with observed values (Jf-max) to determine the more accurate sub-model. It also seeks to investigate reasons and solutions if estimated JA-max values differ from observed values, providing new criteria for evaluating RuBP regeneration limitation assumptions in the FvCB model.

2. Material and Methods

2.1. Plant Material

Four species were used as test materials. T. aestivum (Jimai 22) is a widely cultivated wheat variety in Shandong Province, China. S. perfoliatum, native to the tallgrass prairie regions of North America, was introduced to China from Korea in 1979 by the Institute of Botany, Chinese Academy of Sciences, and is now used as a high-quality forage species. L. perenne (cv. Zhongxin 830) was developed through multigenerational hybridization between hexaploid and octoploid parental lines (H4372 × woH90) by the Crop Breeding and Cultivation Research Institute of the Chinese Academy of Agricultural Sciences. T. pratense is native to China and is widely used for forage and ornamental purposes. The seeds used in this study were obtained from Jinan Tianshundifeng. Agricultural Technology Co., Ltd., Jinan, China. The experimental site was located at Yucheng Station in the southwest of Yucheng County, Chinese Academy of Sciences, Shandong Province. The plants were sown on 15 October 2022 and maintained under standard field conditions. Data collection was performed on sunny days from 28 April 2023 to 10 May 2023. T. aestivum was in the booting to flowering stage, with an approximate plant height of 60–70 cm, and the flag leaf was selected for testing. S. perfoliatum was also in vigorous vegetative growth, with an approximate plant height of 30 cm, and the second leaf fully unfolded from top was selected for testing. L. perenne was in the booting stage, with an approximate plant height of 1.3 m. The first leaf beneath the flag leaf was selected for testing. T. pratense was in a period of vigorous vegetative growth with an approximate plant height of 15 cm, and mature leaves at the top were selected for testing.

2.2. Gas Exchange and Chl Fluorescence Measurement

From 28 April 2023 to 10 May 2023, AnI curves were measured for each study plant with an open-path gas exchange system (LI-6400; Li-Cor, Lincoln, NE, USA), equipped with a leaf chamber fluorometer (6400-40; Li-Cor). Measurements were taken between 9:30 and 11:30 and between 14:30 and 17:00 on sunny days. The ambient [CO2] concentration was maintained at 420 μmol mol−1 for 15 or 13 light levels in the following order (first to last): 2000, 1800, 1600, 1400, 1200, 1000, 800, 600, 400, 200, 150, 100, 80, 50, and 0 μmol m−2 s−1 for L. perenne and T. aestivum; 1600, 1400, 1200, 1000, 800, 600, 400, 200, 150, 100, 80, 50, and 0 μmol m−2 s−1 for T. pratense; and 1400, 1200, 1000, 800, 600, 400, 200, 150, 100, 80, 50, and 0 μmol m−2 s−1 for S. perfoliatum. The plants were allowed to acclimate to changes in light intensity for approximately 2–3 min before measurements were logged; it took about 50 min to complete an entire AnI curve. After data collection, we employed a mechanistic model of AnI in PMSS (http://photosynthetic.sinaapp.com, accessed on 15 May 2024) to simulate the AnI curves, determining the saturating irradiance (Isat) to be 1200, 900, 2000, and 2000 μmol m−2 s−1 for T. aestivum, S. perfoliatum, L. perenne, and T. pratense, respectively. Then AnCi and JCi curves were simultaneously recorded at saturating irradiance for 12 CO2 concentrations in the following order (first to last measurement): 1600, 1400, 1200, 1000, 800, 600, 420, 300, 200, 100, 60, and 0 μmol mol−1. To ensure steady-state conditions, the plants were given approximately 5 min to acclimate to ambient CO2 (420 μmol mol−1) in the gas exchange chamber before beginning each AnCi and JCi curve, and then logged. It took approximately 45 min to complete a single AnCi and JCi curve. The two FvCB sub-models in PMSS (http://photosynthetic.sinaapp.com, accessed on 16 May 2024) were then used to simulate the AnCi curves and obtain the JA-max values for the four C3 plants.

2.3. JA-max Estimated by the FvCB Model

Electron transport and concomitant proton transfer in the chloroplast’s thylakoids produces NADPH and ATP [10]. For steady-state C3 leaf photosynthesis, the carbon assimilation rate is assumed to be limited either by Rubisco-catalyzed carboxylation or by regeneration of RuBP, which is controlled by the electron transport rate [2,5,6,7,10,28,29,31,33,34]. When calculating the electron transport-limited rate of CO2 assimilation (Aj), there are many equations for estimating JA-max [5,10]. Among these, two FvCB sub-models are commonly used to estimate the JA-max value [5,10,31].
Sub-model I can be expressed as follows [2,5,6,7,10,28,29,31]:
A j = J C i Γ   4 C i + 8 Γ R d
where Ci is the intercellular CO2 concentration, Γ is the CO2 compensation point in the absence of day respiratory rate, and Rd is the daily respiration rate.
In sub-model II, the limitation is co-determined by both NADPH and ATP availability, and the equation takes a slightly different form [5,10,23,27,30,31,35]:
A j = J C i Γ   4.5 C i + 10.5 Γ R d
At the saturation irradiance, the value of J estimated by sub-model I and sub-model II represents the maximum electron transport rate for carbon assimilation (JA-max). In addition, through simple mathematical analysis, both sub-models I and II exhibit asymptotic functions without extreme values. They, while similar, provide different estimates for JA-max based on assumptions regarding the biochemical limitations of photosynthesis. Mathematical analysis shows that the JA-max estimated by sub-model I is greater than that estimated by sub-model II, because the denominator in Equation (2) is larger than that in Equation (1) for any same value of Γ and Ci. The difference in the denominator reflects the additional ATP requirement per unit of CO2 fixation when accounting for photorespiration and other processes.

2.4. An Empirical Model for the CO2 Response of Electron Transport Rate (Model 1)

The empirical model of CO2 response of the electron transport rate for photosynthetic organisms (including C3, C4, CAM species, algae, and photosynthetic bacteria) [36] is:
J f = α 1 β C i 1 + γ C i + J 0
where J is electron transport rate, α, β, and γ are three coefficients independent of Ci, and J0 is the electron transport rate, while Ci = 0 μmol·mol−1.
Saturation CO2 concentration (Cisat) corresponds to the maximum electron transport rate (Jf-max), and Jf-max can be obtained as follows:
C isat = β + γ β 1 γ
and
J f - max = α β + γ β γ 2 + J 0
By fitting the JCi curves using Equation (3), the values of Cisat and Jf-max can be obtained from Equations (4) and (5), respectively.
These values can then be directly compared with the observed values to verify the accuracy of Equation (3). No significant differences were found between the estimated Jf-max values and observed Jf-max values (see Table 1). Consequently, our results indicate that Equation (3) is an effective model for simulating JCi curves and for calculating Cisat and Jf-max.

2.5. Statistical Analyses

The two FvCB sub-models and the empirical JCi model proposed by Ye et al. (available via the PMSS web platform, http://photosynthetic.sinaapp.com) were used to simulate the AnCi and JCi curves to determine the JA-max values for the four plants. PMSS integrates these models and uses Simulated Annealing and the Metropolis Algorithm to fit photosynthetic parameters to user-provided data. Data are expressed as the means ± standard error. Student’s t-tests were used to compare the JA-max values estimated by the two FvCB sub-models with the corresponding observed Jf-max values. Data were analyzed by one-way analysis of variance (ANOVA) at p < 0.05 (p-significance level) using SPSS 18.5 statistical software (SPSS, Chicago, IL, USA). Figures were generated using Origin 7.0 (Origin Lab, Northampton, MA, USA) and Adobe Illustrator CS6 (Adobe, San Jose, CA, USA). The goodness of fit between the experimental observations and the line of best fit obtained from mathematical modeling were assessed using the coefficient of determination (R2), calculated as R2 = 1 − SSE/SST, where SST is the total sum of squares, and SSE is the error sum of squares.

3. Results

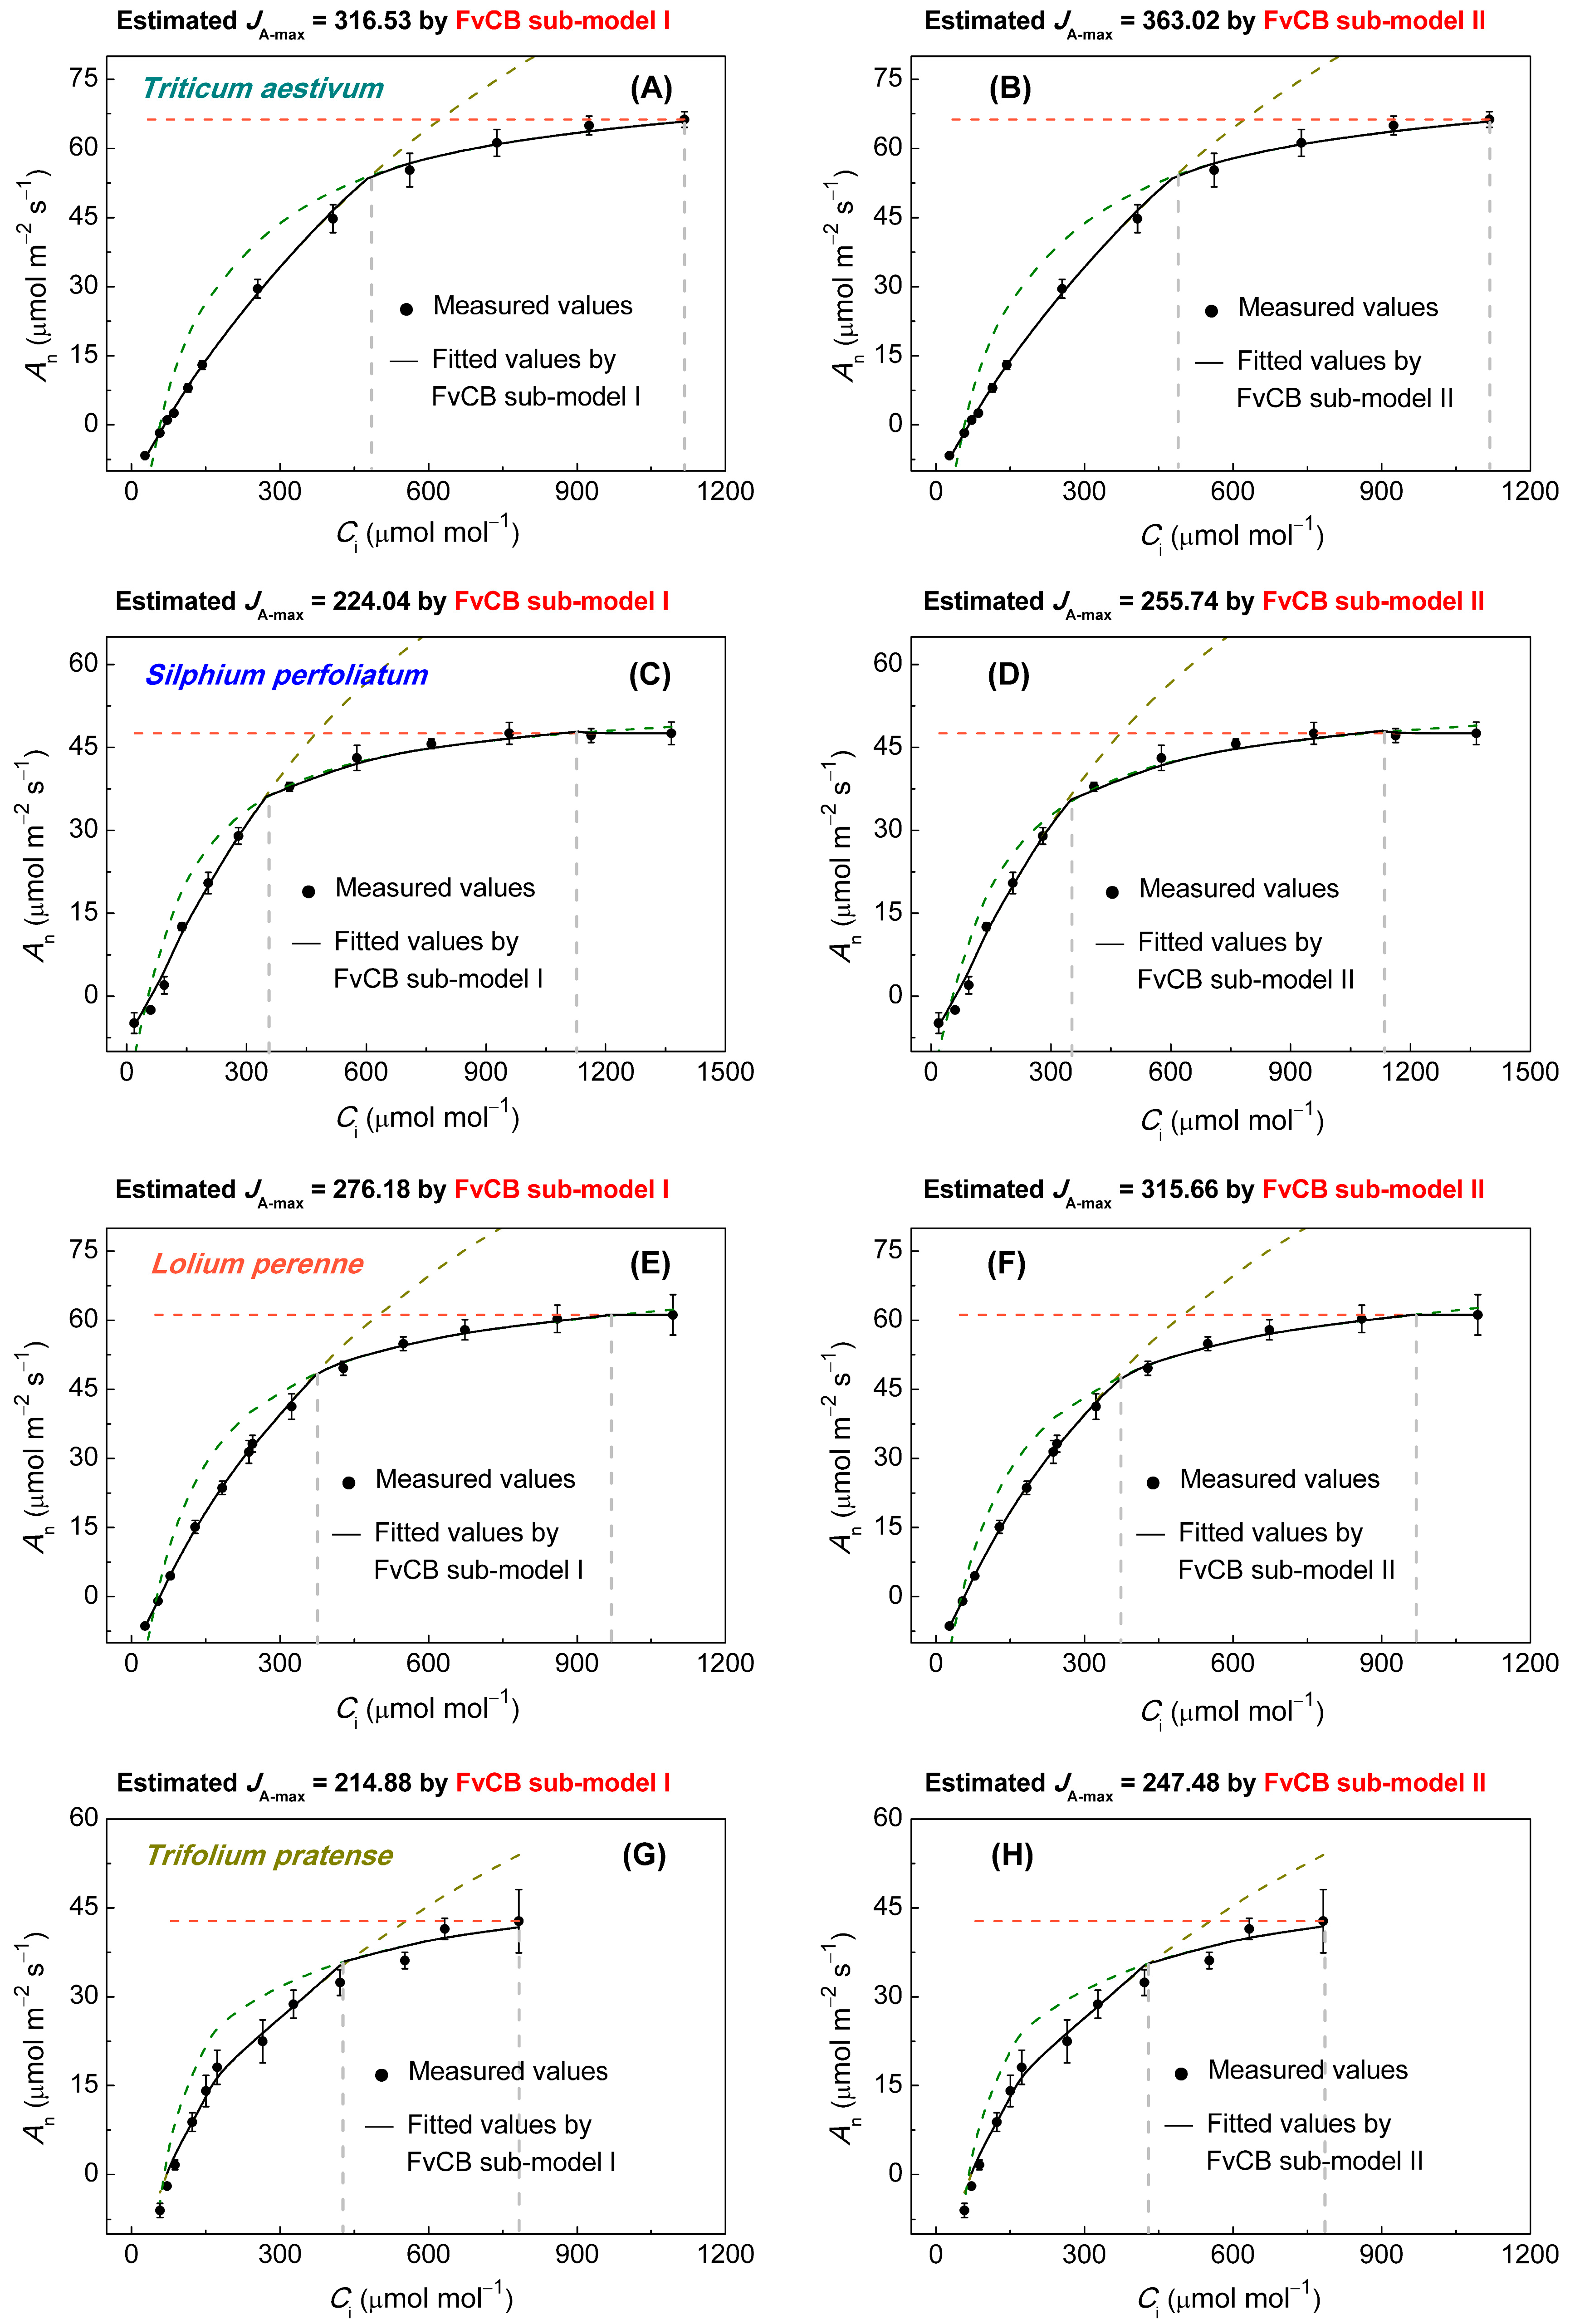
3.1. An–Ci Curve Analysis

The CO2 assimilation rates of all four C3 species showed a typical AnCi response under saturating irradiance (Figure 1). At CO2 concentrations below approximately 500 μmol·mol−1, An increased rapidly, reflecting the Rubisco-limited phase. As CO2 concentration continued to increase, An also increased, but at a slower pace, particularly for T. aestivum (Figure 1A,B), S. perfoliatum (Figure 1C,D), and L. perenne (Figure 1E,F), which reached a plateau, indicating Ci transit points from RuBP-limited to triose-phosphate-utilization-limited (TPU-limited) photosynthesis (Ci,TPU). Notably, the carbon assimilation rate of S. perfoliatum showed a slight decrease after reaching Ci,TPU (Figure 1C,D).

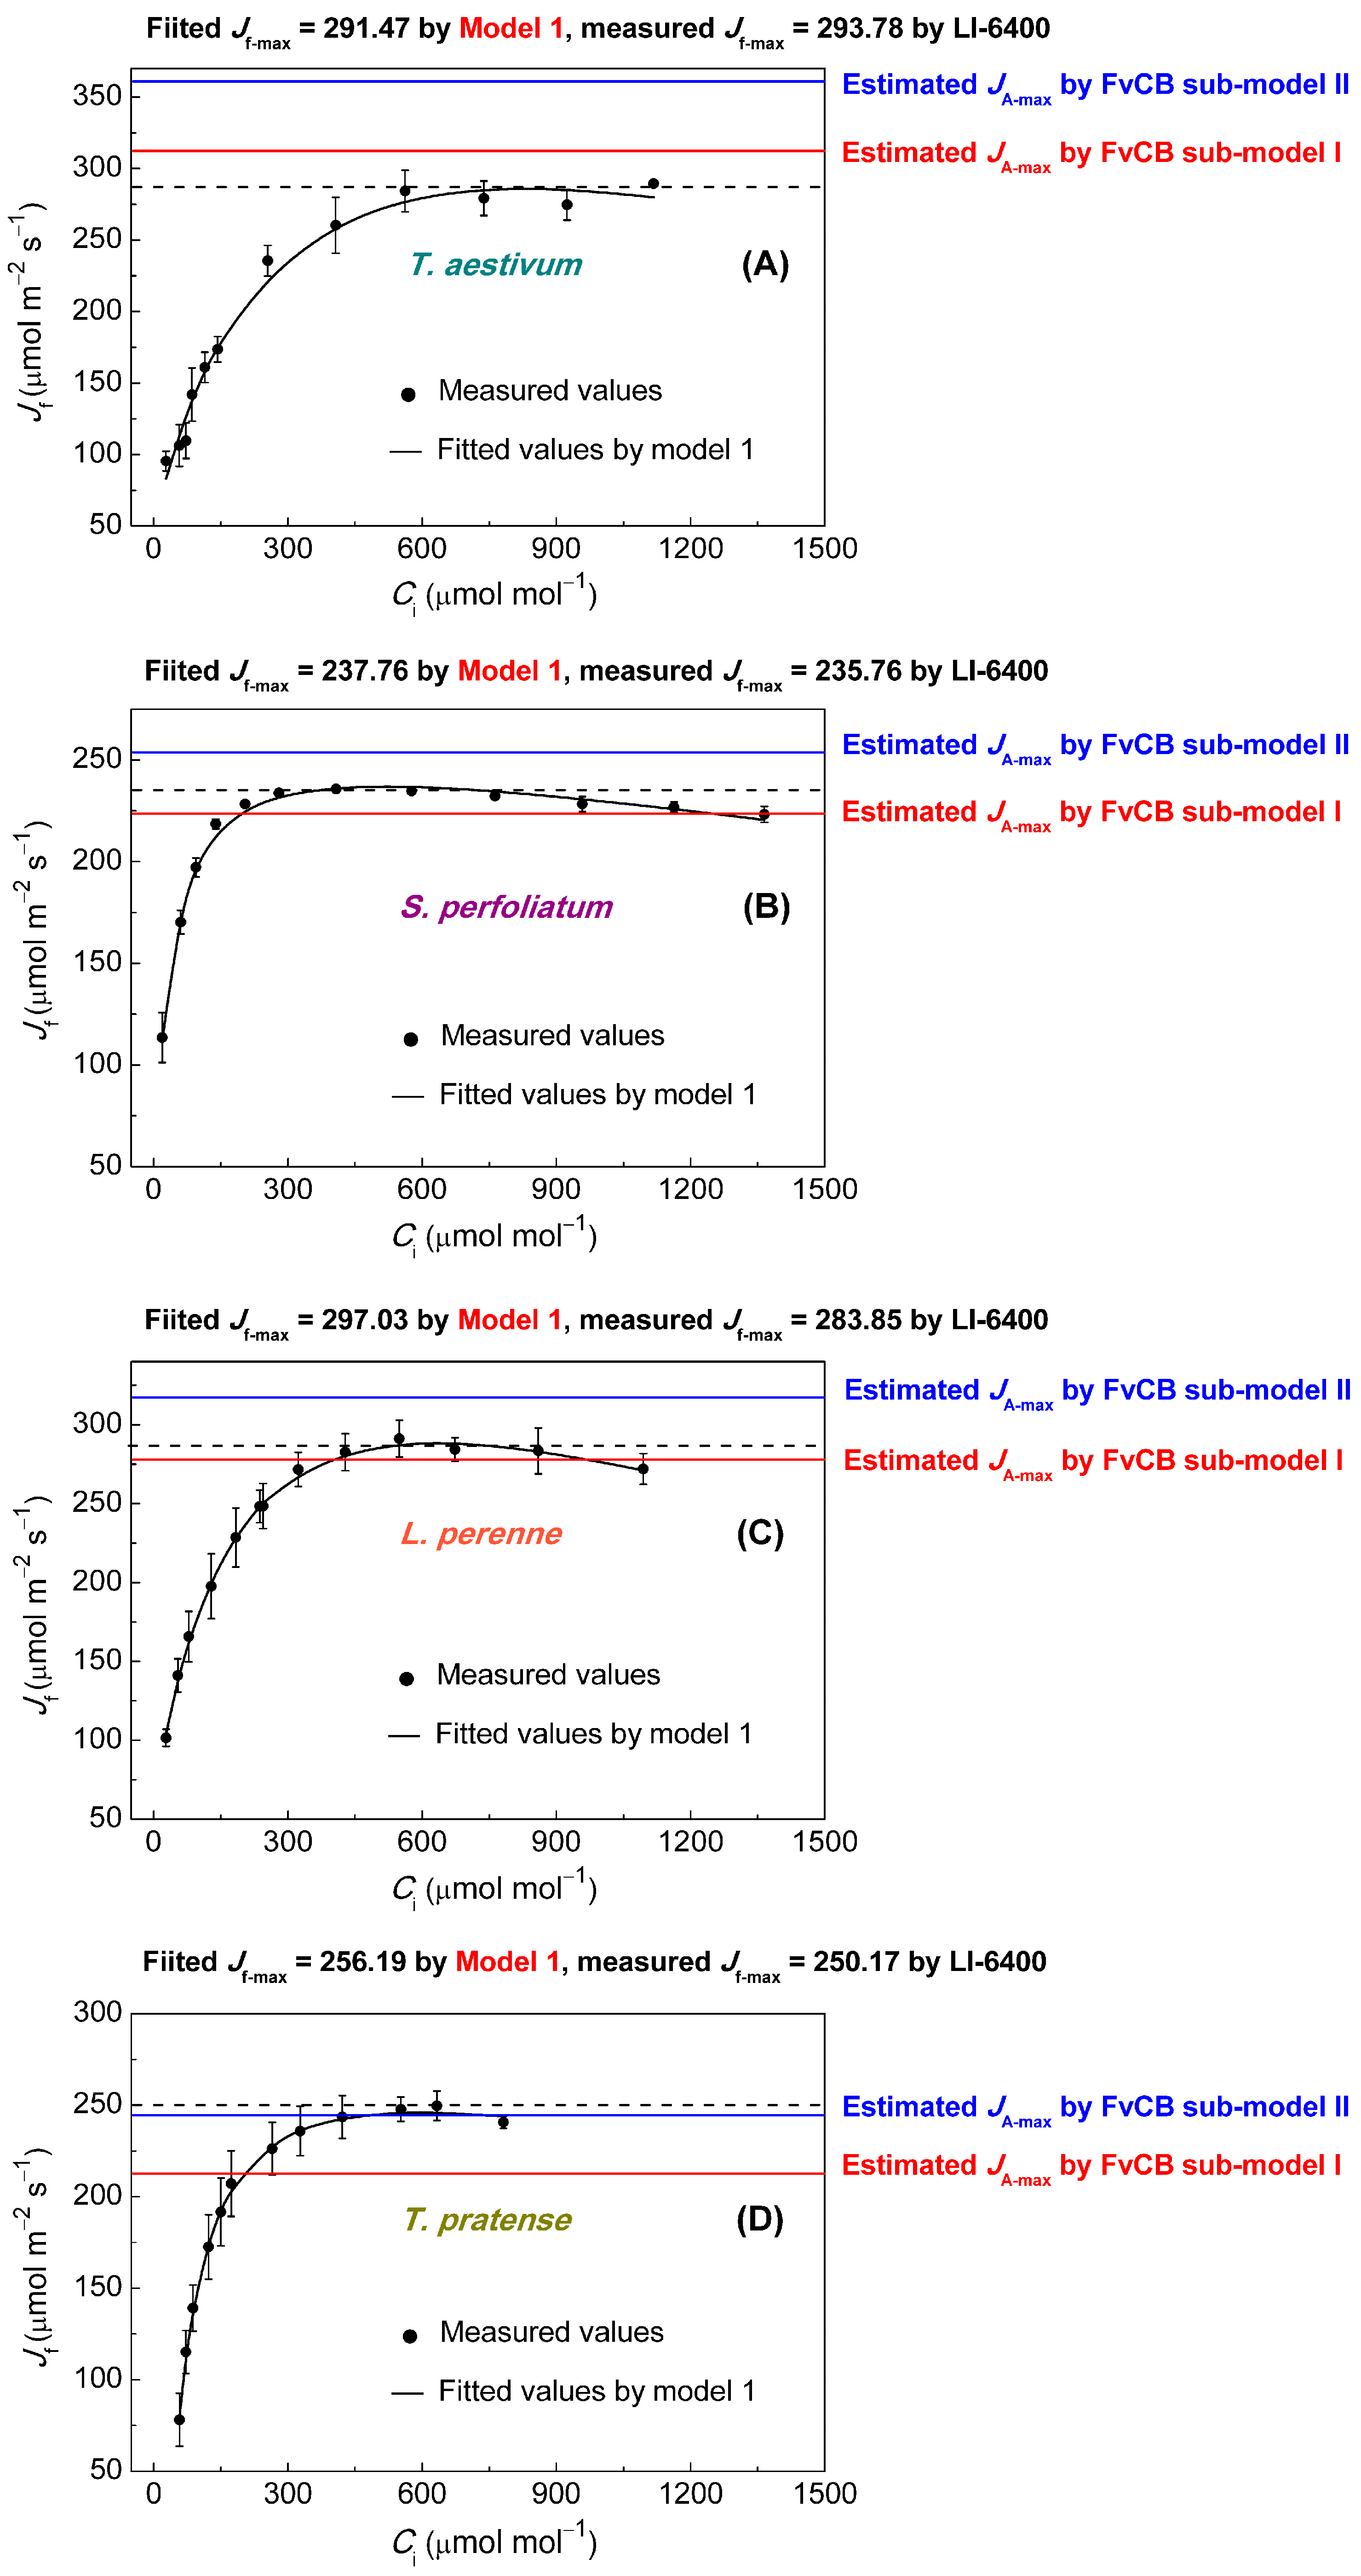
3.2. Comparison of Jmax Estimates

Comparison of JCi curves under saturating irradiance (derived from fitted AnCi curves in Figure 2) revealed significant differences between observed Jmax (Jf-max) values and estimated Jmax values using the two FvCB sub-models in all species (Figure 3). For T. pratense, sub-model I significantly underestimated Jmax compared to observed values (p < 0.05) (Figure 3A, Table 1), while sub-model II did not (p > 0.05). For S. perfoliatum, both sub-models significantly differed from observed values (p < 0.05), with sub-model I underestimating and sub-model II overestimating Jmax (Figure 3B, Table 1). For L. perenne, the Jmax values estimated by sub-model I were not significantly different from observed values (p > 0.05), but sub-model II significantly underestimated Jmax (p < 0.05) (Figure 3C, Table 1). For T. aestivum, both sub-models significantly overestimated Jmax (p < 0.05) (Figure 3D, Table 1). Sub-model II consistently produced higher Jmax estimates than sub-model I across all species. The Rd and Γ parameters were identical between the two sub-FvCB models (Supplementary Table S1). In contrast, the Ye empirical JCi model accurately reproduced both the CO2 response trends of J and the Jmax values for all four plants, showing no significant difference from measured values (p > 0.05) (Figure 3A–D, Table 1).

4. Discussion

4.1. Why Can Current Technology Validate the Estimation of JA-max by the FvCB Model?

At present, advanced experimental methodologies, such as chlorophyll fluorescence-based techniques, provide a more comprehensive understanding of electron partitioning. As elucidated by von Caemmerer [10] and Long and Bernacchi [23], Jf supports not only JA, but also photorespiration (JO), nitrate-to-ammonium conversion (JNit), and Mehler ascorbate peroxidase (MAP)-reaction-driven oxygen uptake (JMAP). This relationship can be expressed as Jf = JA + JO + JNit + JMAP.
This relationship underscores that Jf must exceed JA under any environmental conditions. When JA-max is inferred from the AnCi curve—a method that indirectly estimates JA-max—the sub-models consider only the electron transport rate dedicated to carbon assimilation (JA-max). This approach neglects other electron-consuming processes, including JO, JNit, and JMAP. Conversely, the maximum Jf (Jf-max) values, which are directly obtained from the JCi curve, represent the total electron transport rate (Jf) originating from photosystem II (PSII). This differentiation is critical, because JA represents just a portion of the overall electron flow, suggesting that the JA-max derived from the FvCB sub-models should invariably be lower than the observed Jf-max across various environmental conditions. Hence, the JA-max estimated by the two FvCB sub-models should consistently be lower than the observed Jf-max. This criterion is fundamental for evaluating the credibility of the FvCB model’s estimation of JA-max.

4.2. What Explains the Discrepancies Between Estimated JA-max and Observed Jf-max?

The discrepancies between estimated JA-max and observed Jf-max values, particularly for T. aestivum, highlight a need for a deeper examination of the underlying assumptions in the FvCB sub-models. For T. aestivum, the observed Jf-max values consistently fall below the JA-max estimates from both sub-models (Figure 1A,B and Figure 3A; Table 1), posing difficulties in interpretation within the context of the FvCB model. When considering consumption of JO, JNit, and JMAP, the JA-max value derived from the FvCB model should be considerably lower than the observed Jf-max value, not alarmingly higher. From this, we can deduce that the JA-max for T. aestivum, as estimated by the FvCB model, is unreasonable. Upon scrutinizing these results through the perspective of mathematical interpolation, it becomes evident that the coefficients for Ci and Γ in Equation (1) might be overstated. It is only when these coefficients for Ci and Γ are reduced that the estimated JA-max has the potential to fall below the Jf-max. For S. perfoliatum and L. perenne, analogous findings were observed; the JA-max values were found to be overestimated when accounting for consumption of JO, JNit, and JMAP (Figure 1C–F and Figure 3B,C; Table 1).
For example, in the case of T. aestivum, when consumption of JO, JNit, and JMAP is neglected, the coefficient of Γ in the denominator of Equation (1) must be adjusted to approximately 7.02 (a value less than 8) to ensure that the JA-max value remains lower than the Jf-max values. This adjustment implies that 0.57 mol of CO2 is released in the photorespiratory pathway for every mol of RuBP oxygenated, which exceeds the theoretical value of 0.5 mol [7]. However, this conclusion conflicts with the widely accepted consensus that 1 mol of O2-bound RuBP releases 0.5 mol of CO2 [2,5,7,10,27,28,29,31,37]. Therefore, the claim that the amount of CO2 released in the photorespiratory pathway exceeds the theoretical value of 0.5 mol per mol of RuBP oxygenation appears to be unsupported.
To further evaluate this discrepancy, von Caemmerer’s theory provides an alternative perspective [10]. Specifically, if the Q cycle operates (H+/e = 3), the JA-max for carbon assimilation can be estimated by A j = J C i Γ   3 C i + 7 Γ R d . Under this assumption, the calculated JA-max value is (240.02 ± 4.09) μmol m−2 s−1, which is significantly lower than the measured value of (293.78 ± 3.13) μmol m−2 s−1 (Table 1).

4.3. Can a More Comprehensive Framework Improve JA-max or Jf-max Estimation?

Given the challenges associated with the FvCB sub-models, alternative approaches, such as the empirical model proposed by Ye et al. [36], offer a promising solution. This model directly calculates Jf-max from JCi curves, bypassing the need for indirect estimation via AnCi fitting. In this study, the empirical model produced Jf-max values that closely matched observed Jf-max values across all four species (Figure 3, Table 1). Most importantly, this approach accounts for the whole-chain electron transport rate, providing a more accurate representation of photosynthetic electron transport. This is especially relevant when considering other key parameters in the FvCB model, such as Vcmax, VTPU, Rd, and gm.
However, while the empirical model demonstrates superior accuracy, its lack of mechanistic detail limits its applicability in broader physiological studies. For instance, the biological significance of its coefficients in the empirical model remains unclear, and it does not explicitly link electron transport with ATP synthesis or the co-limitation of NADPH and ATP. As such, it should be regarded as a transitional tool, complementing the FvCB model while paving the way for more integrative approaches.

4.4. Should We Rethink the Estimation of JA-max?

The discrepancies in JA-max estimations by the FvCB sub-models reveal the necessity for prudent application and interpretation of these models. When considering consumption of JO, JNit, and JMAP, the consistent overestimation by sub-model II across four species and by sub-model I for S. perfoliatum, L. perenne, and T. aestivum, specifically for T. aestivum (Figure 3, Table 1) underscore the imperative to incorporate a deeper understanding of electron partitioning into model development. From a mathematical perspective, it is expected that the JA-max values derived from fitting the AnCi curves of the four plant species using A j = J C i Γ   3 C i + 7 Γ R d would be lower than the corresponding Jf-max values. Similarly, the JA-max values obtained by fitting the AnCi curves of S. perfoliatum and L. perenne using this equation are also anticipated to be lower than their respective Jf-max values.

4.5. How Does Overestimating JA-max Affect Agricultural and Environmental Research?

The implications of overestimating JA-max extend across multiple scientific and practical domains, with significant consequences for both agricultural and environmental research. In agricultural contexts, inflated JA-max values can lead to unrealistic yield projections, potentially resulting in suboptimal resource allocation and misguided management practices. Farmers and policymakers relying on these overestimations may make decisions that do not align with actual crop performance, leading to inefficiencies in resource use and potential economic losses.
In ecological modeling, inaccuracies in JA-max estimates can significantly compromise our understanding of carbon flux dynamics and energy conversion efficiencies. This distortion can affect predictions of carbon sequestration capacity and plant responses to environmental changes, ultimately undermining the accuracy of climate models and ecological forecasts. Such inaccuracies may also hinder efforts to predict and mitigate the impacts of climate change on natural ecosystems.
Furthermore, the potential consequences for climate change adaptation strategies are particularly concerning. Inaccurate JA-max assessments could lead to flawed predictions of plant resilience and adaptability under elevated CO2 concentrations and changing environmental conditions. This, in turn, could hinder the development of effective strategies for maintaining ecosystem stability and ensuring food security in the face of global climate change. Misguided adaptation strategies based on overestimated JA-max values may fail to address the actual challenges posed by climate change, potentially exacerbating vulnerabilities in agricultural and natural systems.
While our study highlights these limitations in the examined species, the broader applicability of these findings requires further verification through additional research encompassing a wider range of plant species and environmental conditions. Future studies should focus on developing more accurate estimation methods and refining existing models to better capture the complex physiological processes underlying photosynthetic efficiency. By improving the precision of JA-max estimates, researchers can enhance the reliability of predictions in agricultural and environmental research, ultimately supporting more informed decision-making and sustainable resource management.

5. Conclusions

This study evaluated the accuracy of two widely used sub-models of the FvCB model in estimating the maximum electron transport rate for CO2 assimilation across four C3 plant species. Our results revealed that both sub-models frequently overestimated the electron transport rate, particularly in T. aestivum, highlighting key limitations in their current formulations. By comparing these estimates with observed values obtained from direct measurements, we demonstrated that the empirical model proposed by Ye et al. provided more accurate and reliable estimates. These findings underscore the importance of refining photosynthetic models to more accurately reflect the physiological realities of plant electron transport. Improved models are essential for advancing research in plant physiology, enhancing crop yield predictions, and developing effective responses to climate change.

Supplementary Materials

The following supporting information can be downloaded at https://www.mdpi.com/article/10.3390/biology14060630/s1, Table S1: FvCB model-derived parameters Rd and Γ.

Author Contributions

Conceptualization, Z.Y. and X.Y.; methodology, Z.Y., X.Y., S.Z. and P.R.; software, Z.Y. and F.W.; validation, W.H., H.K. and T.A.; formal analysis, H.K. and T.A.; investigation, W.H., H.K. and T.A.; resources, H.K.; data curation, H.K. and T.A.; writing—original draft preparation, Z.Y. and X.Y.; writing—review and editing, Z.Y., X.Y., P.R. and S.Z.; visualization, Z.Y. and X.Y.; supervision, Y.X.; project administration, Z.Y.; funding acquisition, Z.Y. All authors have read and agreed to the published version of the manuscript.

Funding

This research was supported by the Natural Science Foundation of China (Grant No. 32260063, 32460752).

Institutional Review Board Statement

Not applicable.

Informed Consent Statement

Not applicable.

Data Availability Statement

Rd and Γ, parameters derived from the FvCB two sub-models, are available in Supplementary Table S1.

Acknowledgments

The authors acknowledge support from the Natural Science Foundation of China.

Conflicts of Interest

The authors declare no conflicts of interest.

References

  1. Onoda, Y.; Hikosaka, K.; Hirose, T. Seasonal change in the balance between capacities of RuBP carboxylation and RuBP regeneration affects CO2 response of photosynthesis in Polygonum cuspidatum. J. Exp. Bot. 2005, 56, 755–763. [Google Scholar] [CrossRef] [PubMed]
  2. Sharkey, T.D.; Bernacchi, C.J.; Fa Rquhar, G.D.; Singsaas, E.L. Fitting photosynthetic carbon dioxide response curves for C3 leaves. Plant Cell Environ. 2007, 30, 1035–1040. [Google Scholar] [CrossRef] [PubMed]
  3. von Caemmerer, S. Steady-state models of photosynthesis. Plant Cell Environ. 2013, 36, 1617–1630. [Google Scholar] [CrossRef]
  4. Sharkey, T.D. What gas exchange data can tell us about photosynthesis. Plant Cell Environ. 2016, 39, 1161–1163. [Google Scholar] [CrossRef] [PubMed]
  5. Yin, X.; Busch, F.A.; Struik, P.C.; Sharkey, T.D. Evolution of a biochemical model of steady-state photosynthesis. Plant Cell Environ. 2021, 44, 2811–2837. [Google Scholar] [CrossRef]
  6. Yin, X.; Amthor, J.S. Estimating leaf day respiration from conventional gas exchange measurements. New Phytol. 2024, 241, 52–58. [Google Scholar] [CrossRef]
  7. Farquhar, G.D.; von Caemmerer, S.; Berry, J.A. A biochemical model of photosynthetic CO2 assimilation in leaves of C3 species. Planta 1980, 149, 78–90. [Google Scholar] [CrossRef]
  8. von Caemmerer, S.; Farquhar, G.D. Some relationships between the biochemistry of photosynthesis and the gas exchange of leaves. Planta 1981, 153, 376–387. [Google Scholar] [CrossRef]
  9. Harley, P.C.; Sharkey, T.D. An improved model of C3 photosynthesis at high CO2: Reversed O2 sensitivity explained by lack of glycerate reentry into the chloroplast. Photosynth. Res. 1991, 27, 169–178. [Google Scholar] [CrossRef]
  10. von Caemmerer, S. Biochemical Models of Leaf Photosynthesis; CSIRO Publishing: Victoria, Australia, 2000. [Google Scholar]
  11. Silva-Pérez, V.; Furbank, R.T.; Condon, A.G.; Evans, J.R. Biochemical model of C3 photosynthesis applied to wheat at different temperatures. Plant Cell Environ. 2017, 40, 1552–1564. [Google Scholar] [CrossRef]
  12. Ye, Z.P.; Robakowski, P.; Suggett, D.J. A mechanistic model for the light response of photosynthetic electron transport rate based on light harvesting properties of photosynthetic pigment molecules. Planta 2013, 237, 837–847. [Google Scholar] [CrossRef]
  13. Ye, Z.P.; Suggett, J.D.; Robakowski, P.; Kang, H.J. A mechanistic model for the photosynthesis-light response based on the photosynthetic electron transport of photosystem II in C3 and C4 species. New Phytol. 2013, 199, 110–120. [Google Scholar] [CrossRef] [PubMed]
  14. Miao, Z.; Xu, M.; Lathrop, R.G., Jr.; Wang, Y. Comparison of the ACc curve fitting methods in determining maximum ribulose 1,5-bisphosphate carboxylase/oxygenase carboxylation rate, potential light saturated electron transport rate and leaf dark respiration. Plant Cell Environ. 2009, 32, 109–122. [Google Scholar] [CrossRef]
  15. Patrick, L.D.; Ogle, K.; Tissue, D.T. A hierarchical Bayesian approach for estimation of photosynthetic parameters of C3 plants. Plant Cell Environ. 2009, 32, 1695–1709. [Google Scholar] [CrossRef]
  16. Bellasio, C.; Beerling, D.J.; Griffiths, H. An Excel tool for deriving key photosynthetic parameters from combined gas exchange and chlorophyll fluorescence: Theory and practice. Plant Cell Environ. 2016, 39, 1180–1197. [Google Scholar] [CrossRef] [PubMed]
  17. Busch, F.A.; Sage, R.F. The sensitivity of photosynthesis to O2 and CO2 concentration identifies strong Rubisco control above the thermal optimum. New Phytol. 2017, 213, 1036–1051. [Google Scholar] [CrossRef] [PubMed]
  18. Walker, A.P.; Quaife, T.; Bodegom, P.V.; Kauwe, M.D.; Keenan, T.F.; Joiner, J.; Lomas, M.R.; Macbean, N.; Xu, C.; Yang, X. The impact of alternative trait-scaling hypotheses for the maximum photosynthetic carboxylation rate (Vcmax) on global gross primary production. New Phytol. 2017, 215, 1370–1386. [Google Scholar] [CrossRef]
  19. Anderegg, W.R.; Wolf, A.; Arango-Velez, A.; Choat, B.; Chmura, D.J.; Jansen, S.; Kolb, T.; Li, S.; Meinzer, F.C.; Pita, P. Woody plants optimise stomatal behaviour relative to hydraulic risk. Ecol. Lett. 2018, 21, 968–977. [Google Scholar] [CrossRef]
  20. Dusenge, M.E.; Duarte, A.G.; Way, D.A. Plant carbon metabolism and climate change: Elevated CO2 and temperature impacts on photosynthesis, photorespiration and respiration. New Phytol. 2019, 221, 32–49. [Google Scholar] [CrossRef] [PubMed]
  21. Fabre, D.; Yin, X.; Michael, D.; Anne, C.V.; Sandrine, R.; Lauriane, R.; Armelle, S.; Delphine, L. Is triose phosphate utilization involved in the feedback inhibition of photosynthesis in rice under conditions of sink limitation? J. Exp. Bot. 2019, 70, 5773–5785. [Google Scholar] [CrossRef]
  22. Han, T.; Zhu, G.; Ma, J.; Wang, S.; Zhang, K. Sensitivity analysis and estimation using a hierarchical Bayesian method for the parameters of the FvCB biochemical photosynthetic model. Photosynth. Res. 2020, 143, 45–66. [Google Scholar] [CrossRef] [PubMed]
  23. Long, S.P.; Bernacchi, C.J. Gas exchange measurements, what can they tell us about the underlying limitations to photosynthesis? Procedures and sources of error. J. Exp. Bot. 2003, 54, 2393–2401. [Google Scholar] [CrossRef] [PubMed]
  24. Verheijen, L.M.; Aerts, R.; Brovkin, V.; Cavender-Bares, J.; Cornelissen, J.H.; Kattge, J.; Van Bodegom, P.M. Inclusion of ecologically based trait variation in plant functional types reduces the projected land carbon sink in an earth system model. Glob. Change Biol. 2015, 21, 3074–3086. [Google Scholar] [CrossRef]
  25. Norby, R.J.; Gu, L.; Haworth, I.C.; Jensen, A.M.; Turner, B.L.; Walker, A.P.; Warren, J.M.; Weston, D.J.; Xu, C.; Winter, K. Informing models through empirical relationships between foliar phosphorus, nitrogen and photosynthesis across diverse woody species in tropical forests of Panama. New Phytol. 2017, 215, 1425–1437. [Google Scholar] [CrossRef]
  26. Rogers, A.; Serbin, S.P.; Ely, K.S.; Sloan, V.L.; Wullschleger, S.D. Terrestrial biosphere models underestimate photosynthetic capacity and CO2 assimilation in the Arctic. New Phytol. 2017, 216, 1090–1103. [Google Scholar] [CrossRef] [PubMed]
  27. Yin, X.Y.; Oijen, M.V.; Schapendonk, A. Extension of a biochemical model for the generalized stoichiometry of electron transport limited C3 photosynthesis. Plant Cell Environ. 2004, 27, 1211–1222. [Google Scholar] [CrossRef]
  28. Dubois, J.J.B.; Fiscus, E.L.; Booker, F.L.; Flowers, M.; Reid, C.D. Optimizing the statistical estimation of the parameters of the Farquhar–von Caemmerer–Berry model of photosynthesis. New Phytol. 2007, 176, 402–414. [Google Scholar] [CrossRef] [PubMed]
  29. Ellsworth, D.S.; Crous, K.Y.; Lambers, H.; Cooke, J. Phosphorus recycling in photorespiration maintains high photosynthetic capacity in woody species. Plant Cell Environ. 2015, 38, 1142–1156. [Google Scholar] [CrossRef] [PubMed]
  30. Bernacchi, C.J.; Bagley, J.E.; Serbin, S.P.; Ruiz-Vera, U.M.; Rosenthal, D.M.; Vanloocke, A. Modelling C3 photosynthesis from the chloroplast to the ecosystem. Plant Cell Environ. 2013, 36, 1641–1657. [Google Scholar] [CrossRef]
  31. Yin, X.; Struik, P.C.; Romero, P.; Harbinson, J.; Vos, J. Using combined measurements of gas exchange and chlorophyll fluorescence to estimate parameters of a biochemical C3 photosynthesis model: A critical appraisal and a new integrated approach applied to leaves in a wheat (Triticum aestivum) canopy. Plant Cell Environ. 2009, 32, 448–464. [Google Scholar] [CrossRef]
  32. Gu, L.H.; Pallardy, S.G.; Law, B.E.; Wullschleger, S.D. Reliable estimation of biochemical parameters from C3 leaf photosynthesis-intercellular carbon dioxide response curves. Plant Cell Environ. 2010, 33, 1852–1874. [Google Scholar] [CrossRef] [PubMed]
  33. Farquhar, G.D.; Busch, F.A. Changes in the chloroplastic CO2 concentration explain much of the observed Kok effect: A model. New Phytol. 2017, 214, 570. [Google Scholar] [CrossRef] [PubMed]
  34. Moualeu-Ngangue, D.P.; Chen, T.W.; Stützel, H. A new method to estimate photosynthetic parameters through net assimilation rateintercellular space CO2 concentration (A-Ci) curve and chlorophyll fluorescence measurements. New Phytol. 2017, 213, 1543–1554. [Google Scholar] [CrossRef]
  35. Lenz, K.E.; Host, G.E.; Roskoski, K.; Noormets, A.; Sôber, A.; Karnosky, D.F. Analysis of a Farquhar-von Caemmerer-Berry leaf-level photosynthetic rate model for Populus tremuloides in the context of modeling and measurement limitations. Environ. Pollut. 2010, 158, 1015–1022. [Google Scholar] [CrossRef] [PubMed]
  36. Ye, Z.P.; Duan, S.H.; An, T.; Kang, H.J. Construction of CO2-response model of electron transport rate in C4 crop and its application. Chin. J. Plant Ecol. 2018, 42, 1000. [Google Scholar] [CrossRef]
  37. Zelitch, I. Selection and characterization of tobacco plants with novel O2-resistant photosynthesis. Plant Physiol. 1989, 90, 1457–1464. [Google Scholar] [CrossRef]
Figure 1. AnCi curves illustrating the CO2 response of photosynthesis for the four C3 species at 12 CO2 concentrations under saturating irradiance, namely (A,B) Triticum aestivum, (C,D) Silphium perfoliatum, (E,F) Lolium perenne, and (G,H) Trifolium pratense. Solid black dots represent observed experimental data. Data represent mean ± SE, n = 3. Solid lines represent lines of best fit modeled by the FvCB sub-model I (A,C,E,G) and sub-model II (B,D,F,H). AnCi curves are typically divided into three stages, including Rubisco-limited, RuBP-limited, and triose-phosphate-utilization-limited (TPU-limited).
Biology 14 00630 g001
Figure 2. Light response (AnI) curves of photosynthesis for the four C3 species at 13–15 light levels maintained at an ambient CO2 concentration of 420 μmol mol−1, namely (A) Triticum aestivum, (B) Silphium perfoliatum, (C) Lolium perenne, and (D) Trifolium pratense. Solid black dots represent observed experimental data. Data represent mean ± SE, n = 3–6. AnI curves (AD) are modeled by the Ye AnI model.
Biology 14 00630 g002
Figure 3. JCi curves showing the CO2 response of electron transfer rate for the four C3 species at 12 CO2 concentrations under saturating irradiance, namely (A) Triticum aestivum, (B) Silphium perfoliatum, (C) Lolium perenne, and (D) Trifolium pratense. Solid black dots represent observed experimental data. Data represent mean ± SE, n = 3. Solid black lines represent lines of best fit modeled by the empirical model proposed by Ye et al. [36]. The black dashed lines, blue solid lines, and red solid lines represent the measured values of Jf-max using LI-6400 and the estimated values of JA-max using FvCB sub-model I and FvCB sub-model II, respectively.
Biology 14 00630 g003
Table 1. Comparison of estimated JA-max values from fitting AnCi curves with the FvCB sub-models, JCi curves using the empirical model proposed by Ye et al. [36], and observed Jf-max values from LI-6400 for four C3 species (mean ± SE, n = 3). Estimated JA-max and observed Jf-max values within one plant that are significantly different (p < 0.05) are marked with different superscript letters (e.g., 214.88 ± 3.31 b and 247.48 ± 3.60 a), while those that are not significantly different (p > 0.05) share the same superscript letter (e.g., 247.48 ± 3.60 a and 250.17 ± 4.33 a). Units of JA-max and Jf-max: μmol m−2 s−1.
SpeciesFitted JA-max Values by FvCB Sub-Model IFitted JA-max Values by FvCB Sub-Model IIFitted Jf-max Values by Empirical ModelObserved Jf-max Values by Li-6400
Triticum aestivum316.53 ± 5.42 b363.02 ± 6.07 a291.47 ± 0.65 c293.78 ± 3.13 c
Silphium perfoliatum224.04 ± 2.47 c255.74 ± 2.73 a237.76 ± 1.36 b235.76 ± 0.98 b
Lolium perenne276.18 ± 7.20 b315.66 ± 8.57 a297.03 ± 10.23 b283.85 ± 3.36 b
Trifolium pratense214.88 ± 3.31 b247.48 ± 3.60 a256.19 ± 6.17 a250.17 ± 4.33 a
Disclaimer/Publisher’s Note: The statements, opinions and data contained in all publications are solely those of the individual author(s) and contributor(s) and not of MDPI and/or the editor(s). MDPI and/or the editor(s) disclaim responsibility for any injury to people or property resulting from any ideas, methods, instructions or products referred to in the content.

