
Growth Process and Mortality of Sasa borealis Seedlings over Six Years Following Mass Flowering and Factors Influencing Them


Simple Summary
Abstract

1. Introduction
2. Materials and Methods
2.1. Study Site
2.2. Setting Up Study Plots
2.3. Survey of Seedlings
2.3.1. Emergence of Seedlings
2.3.2. Mortality and Morphology of Seedlings
2.4. Measurements of Biotic Factors
2.4.1. Medium- and Large-Sized Mammals
2.4.2. Field Mice
2.5. Measurements of Abiotic Factors
2.5.1. Temperature and Humidity near the Ground Surface
2.5.2. Solar Radiation Intensity
2.5.3. Soil Moisture and Nutrient Content
2.5.4. Snow Level
2.6. Data Analysis
2.6.1. Number of Emerged Seedlings
2.6.2. Mortality and Morphology of Seedlings
2.6.3. Mortality and Morphology of Foraged Seedlings
3. Results
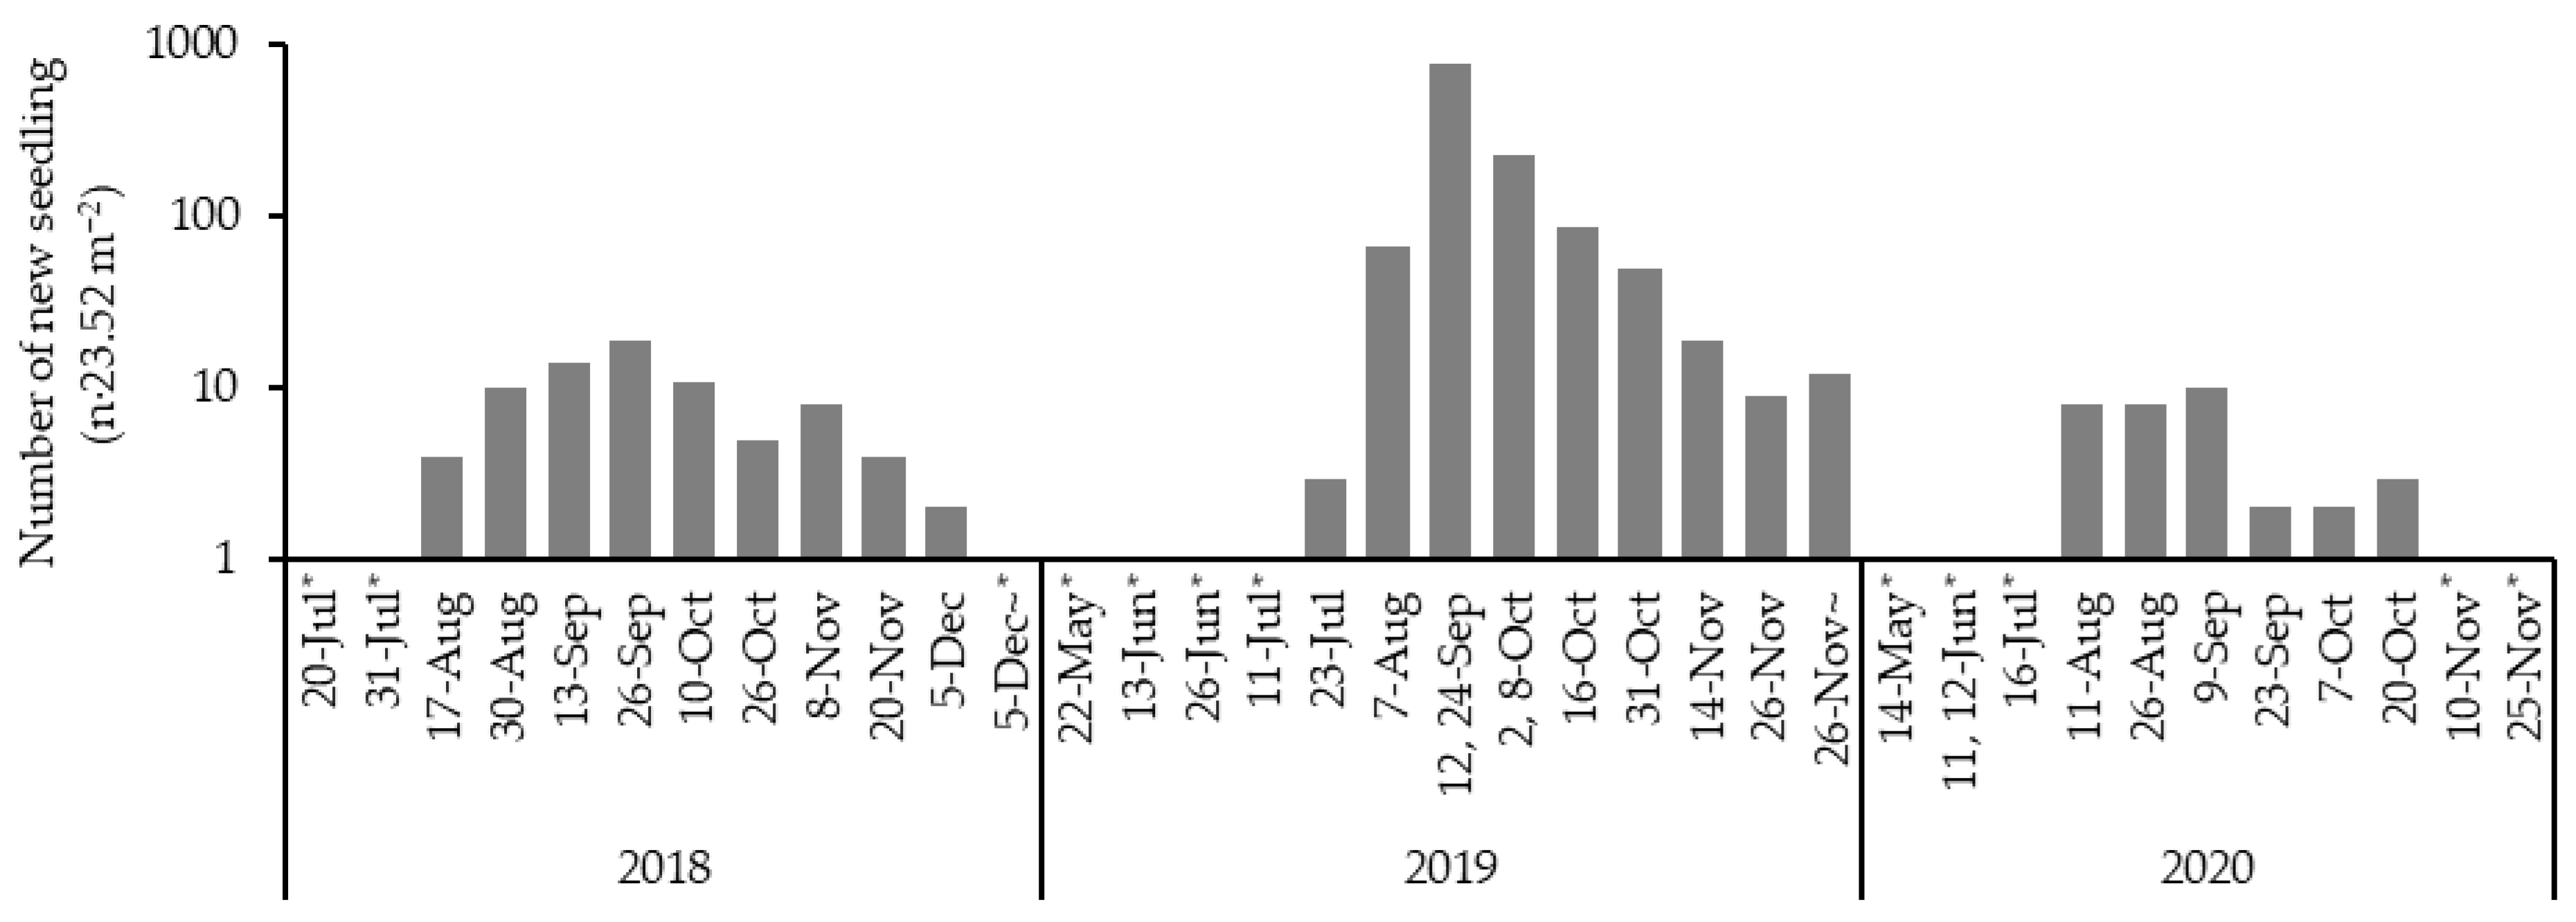
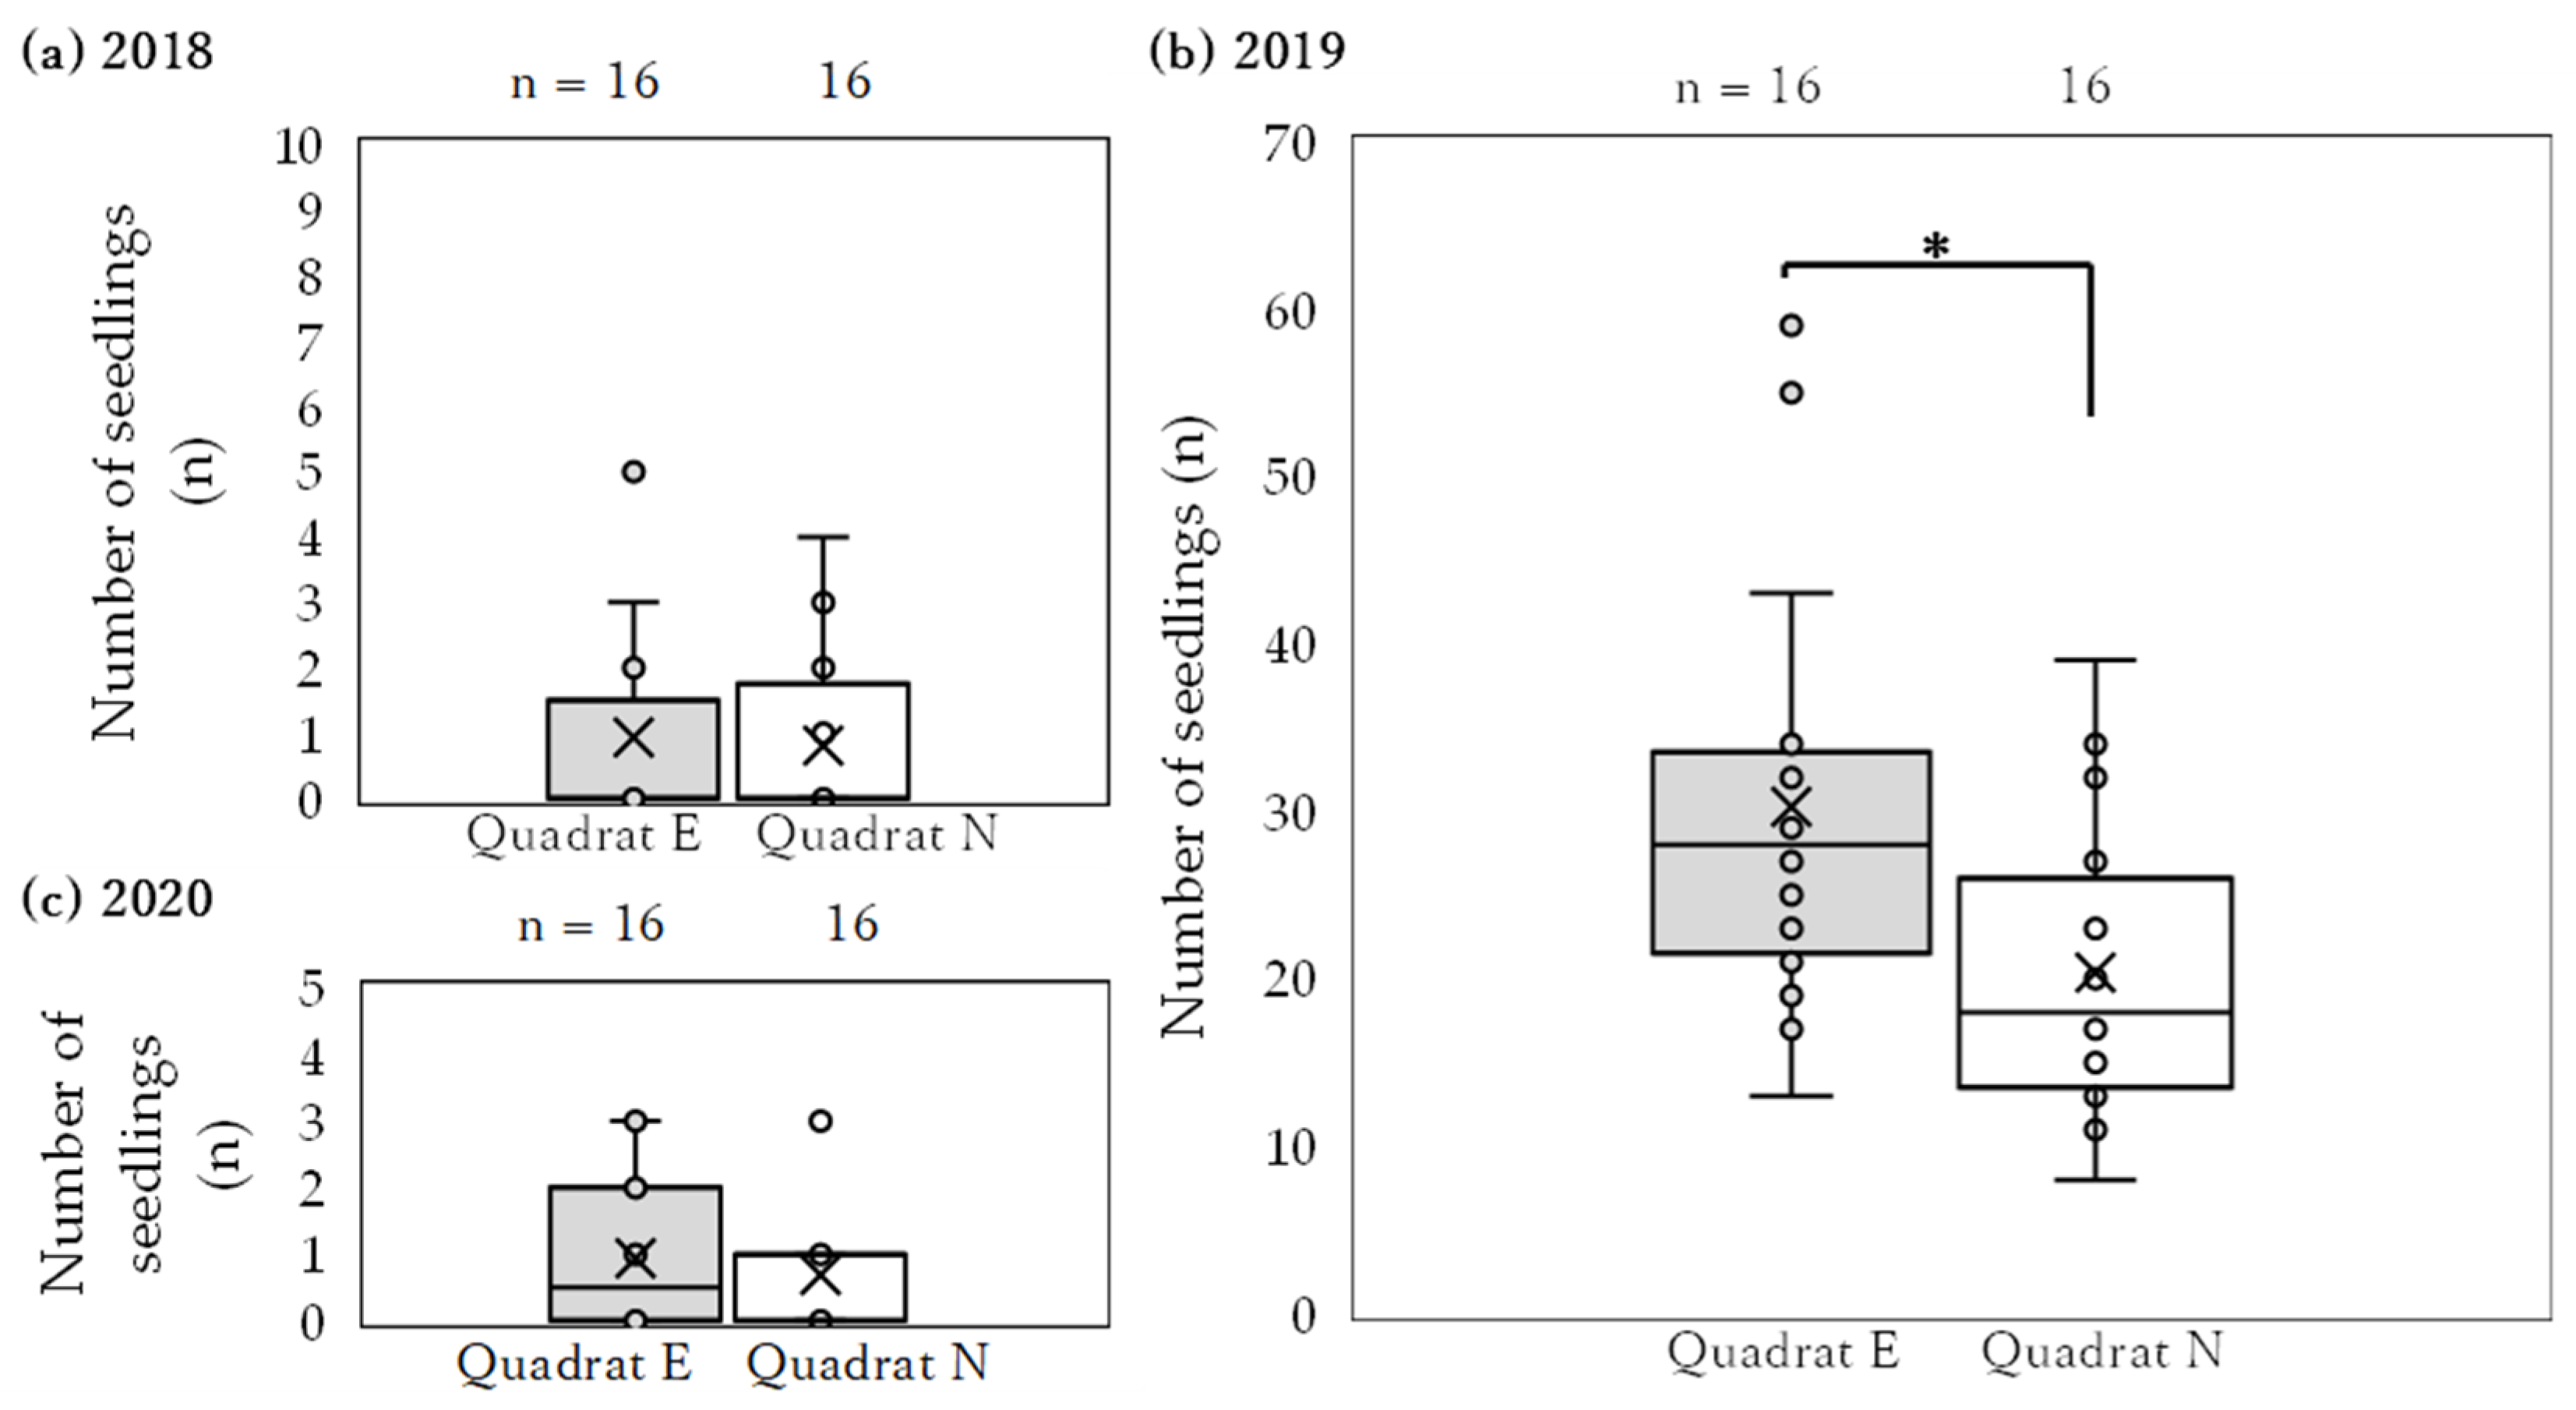
3.1. Emergence of Seedlings
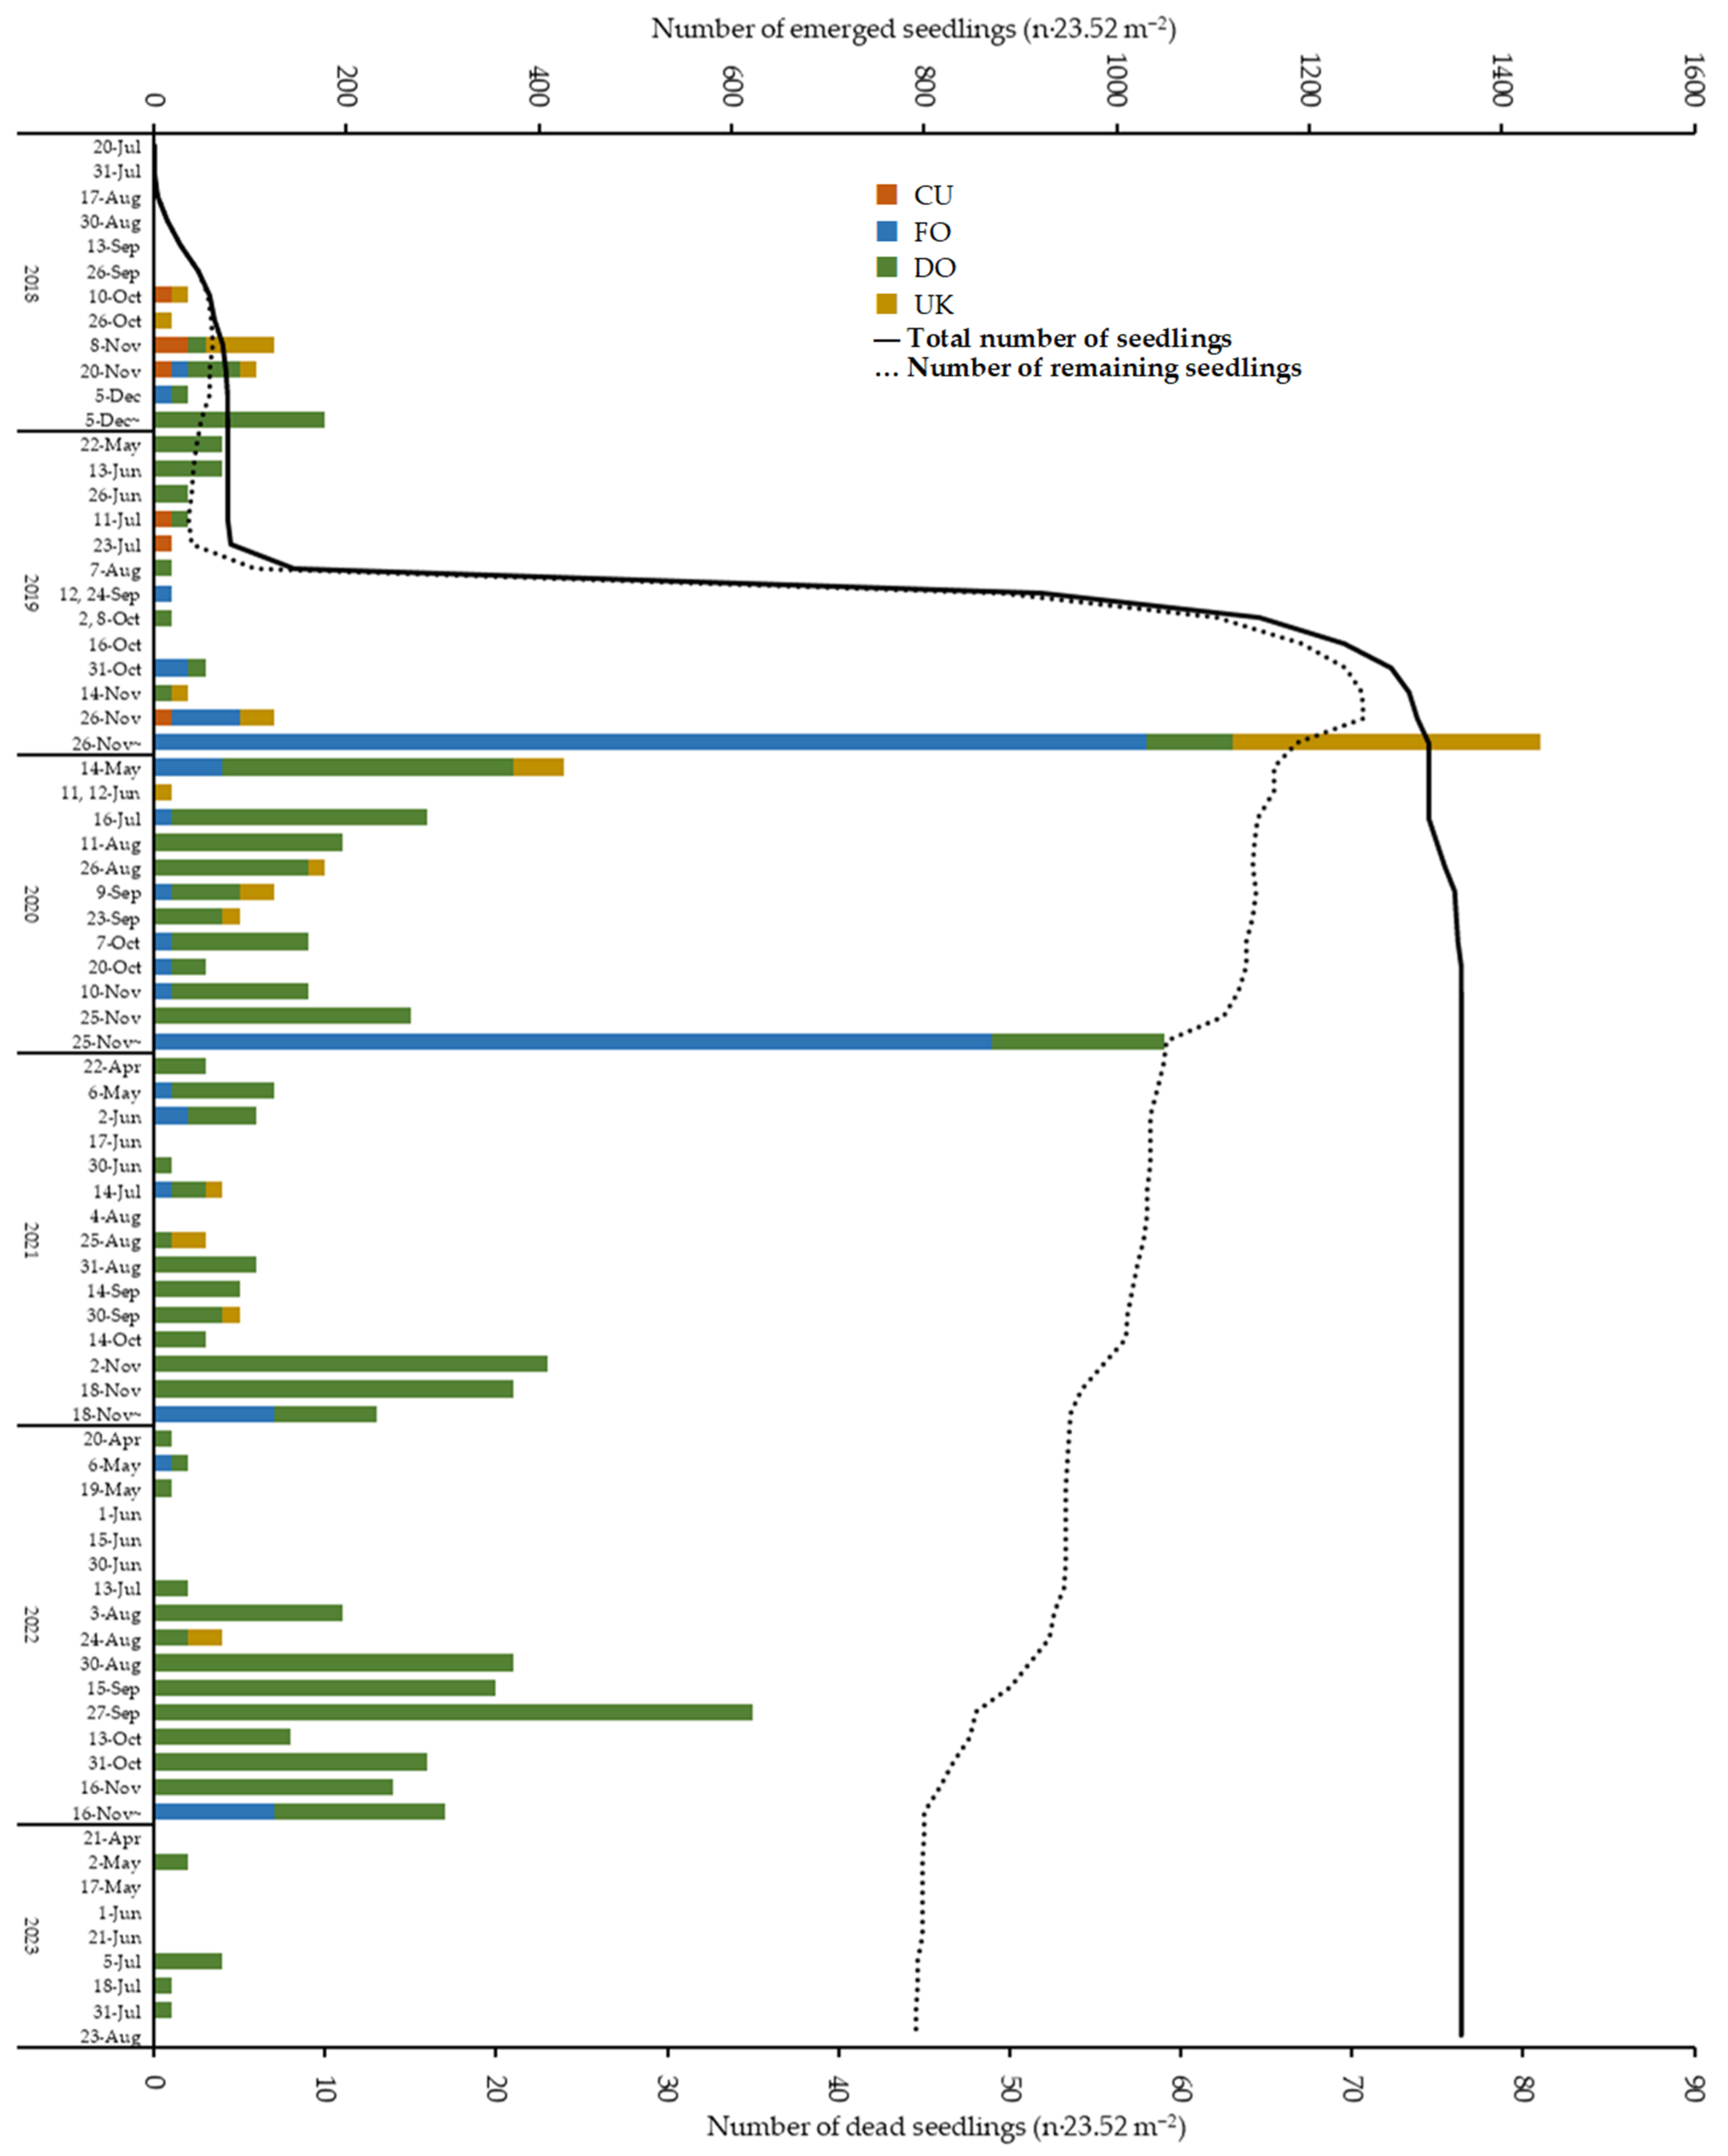
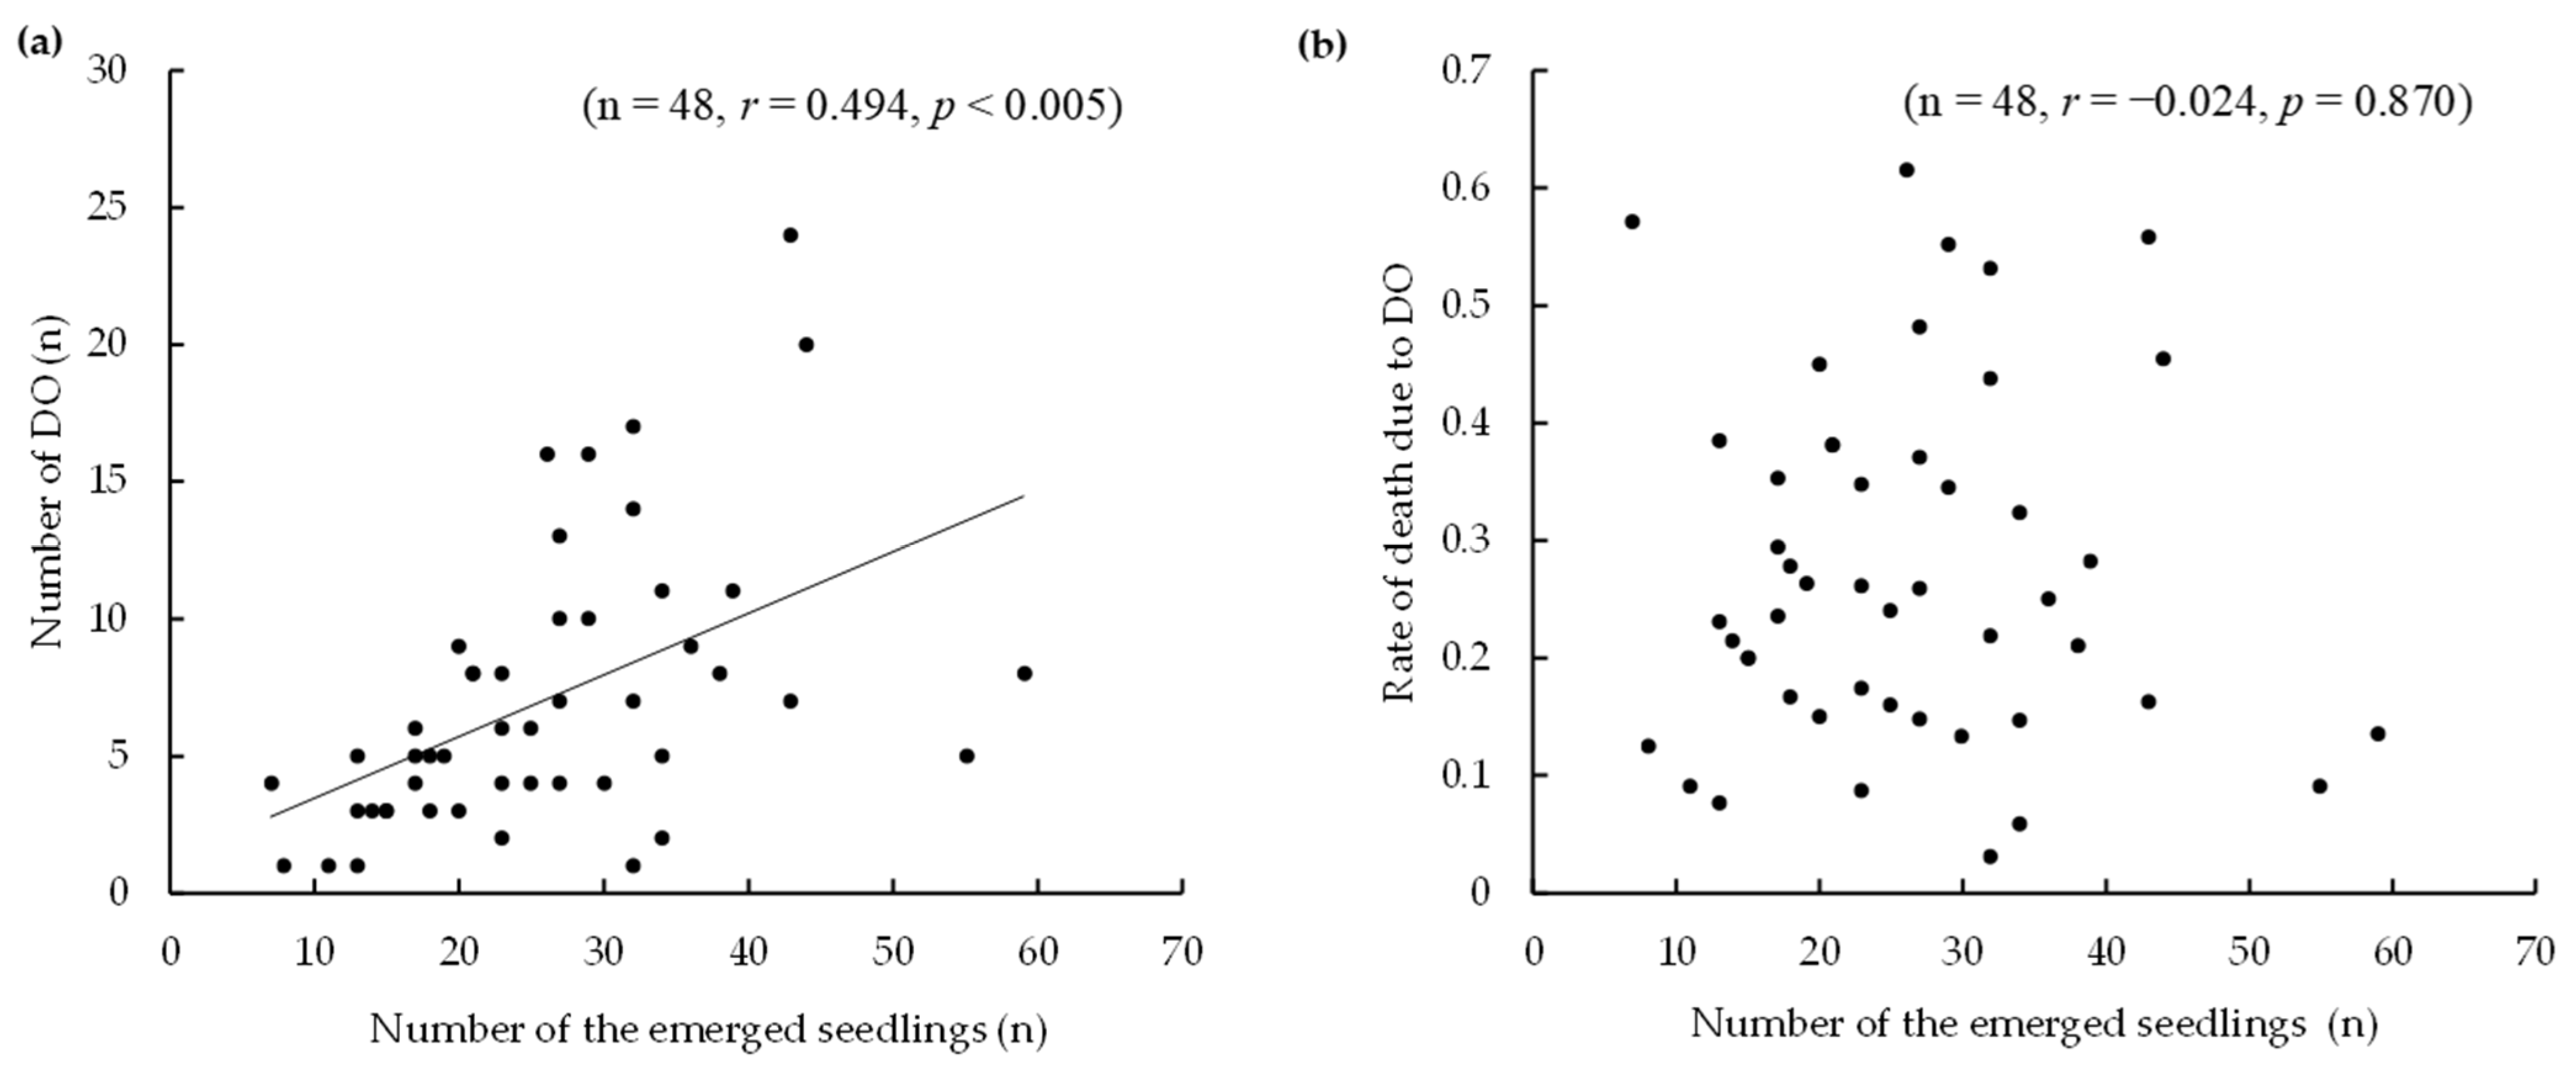
3.2. Mortality and Morphology of Seedlings
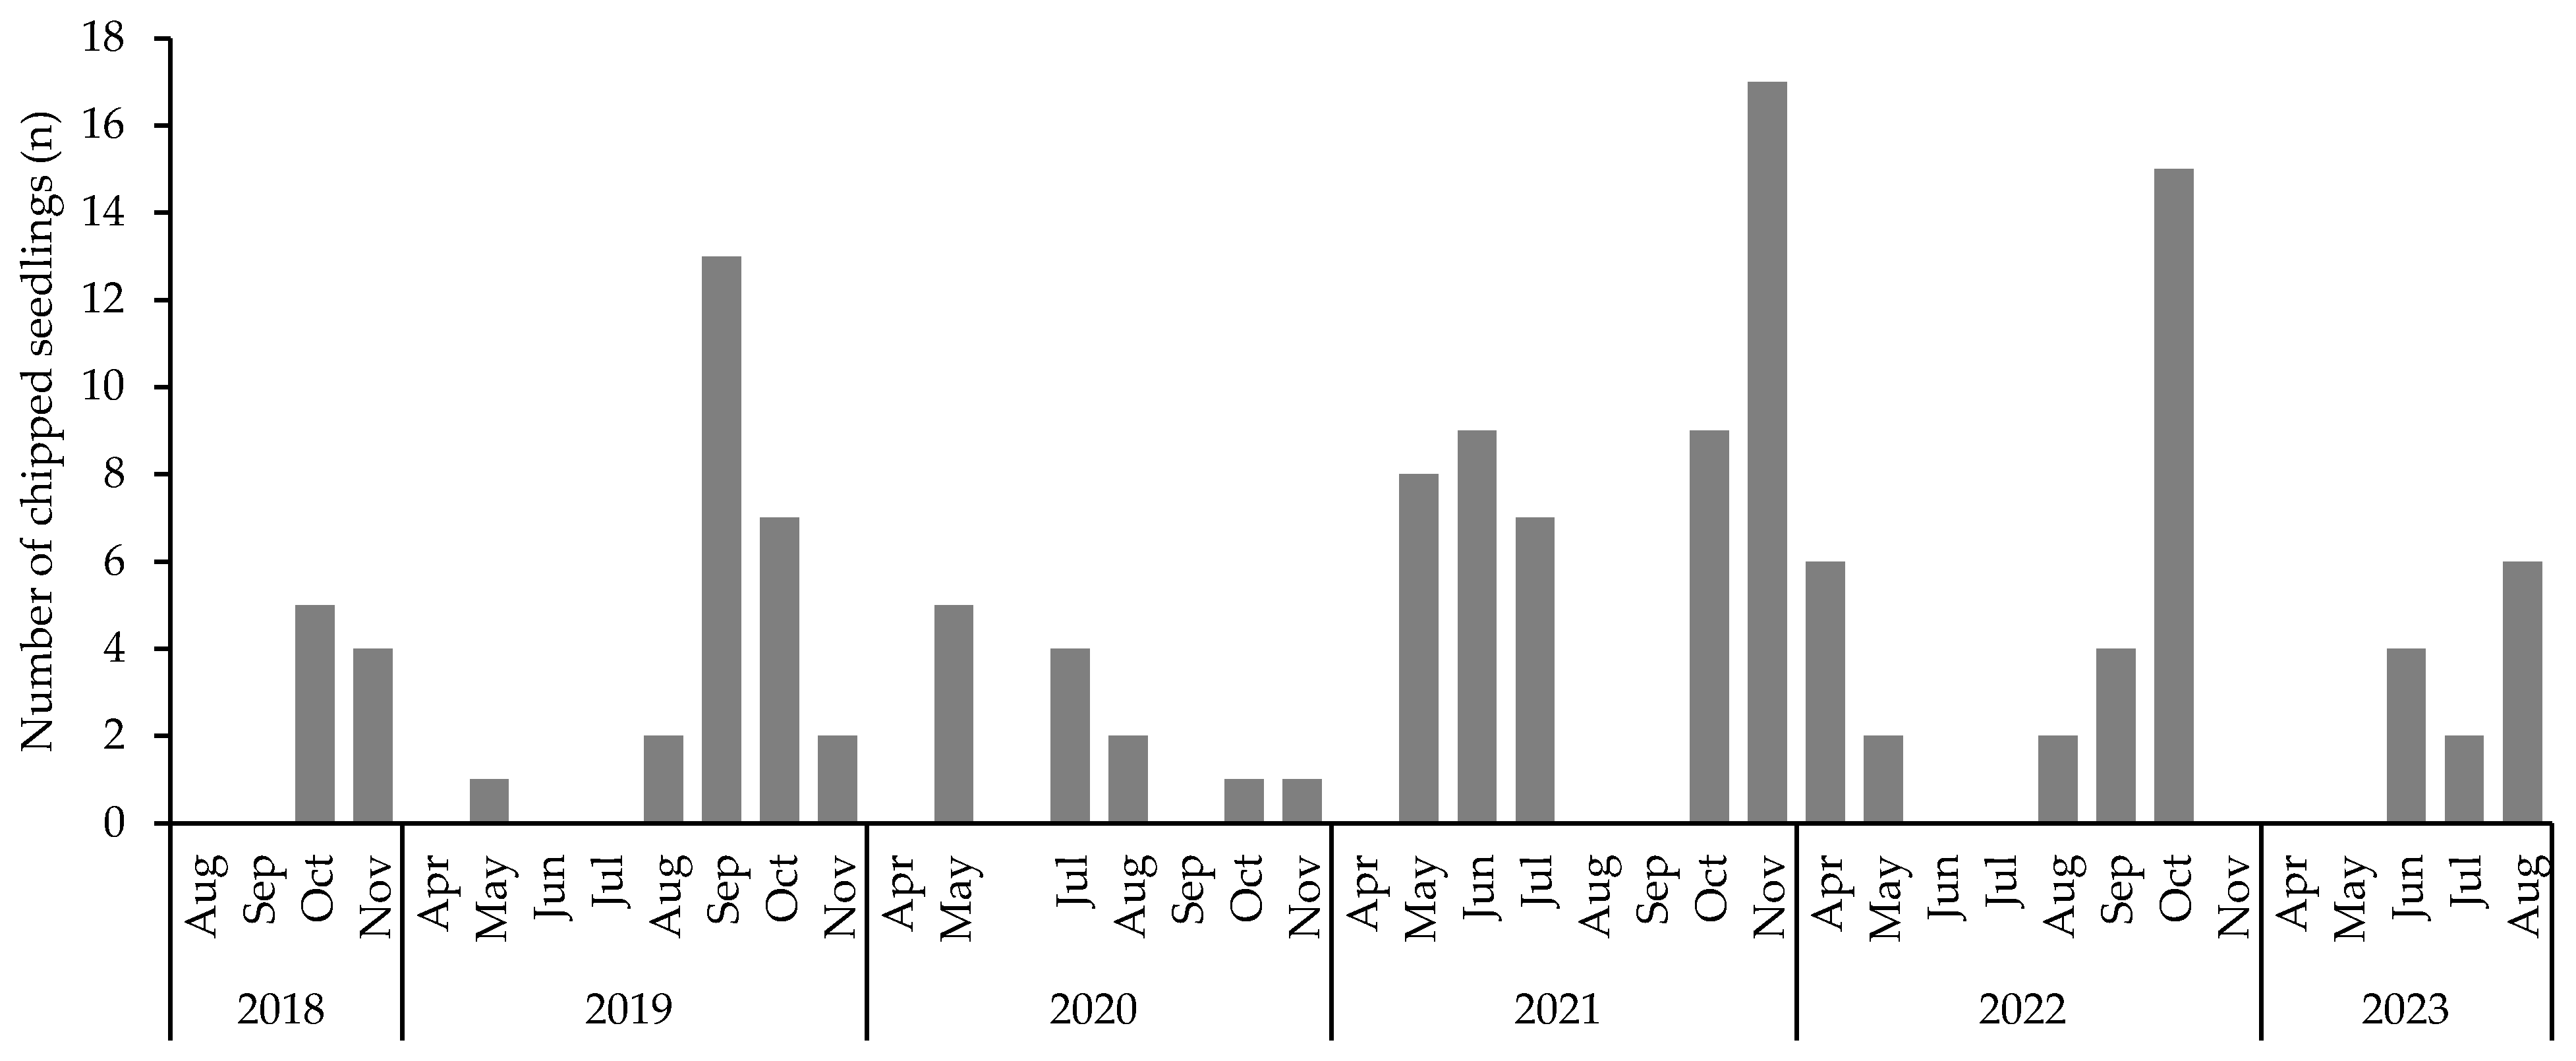
3.3. Seedling Foraging and Damage by Mammals and Arthropods
3.4. Mortality and Morphology of Foraged Seedlings
4. Discussion
4.1. Timing of Emergence
4.2. Factors Limiting the Number of Emerged Seedlings
4.3. Mortality of Seedlings
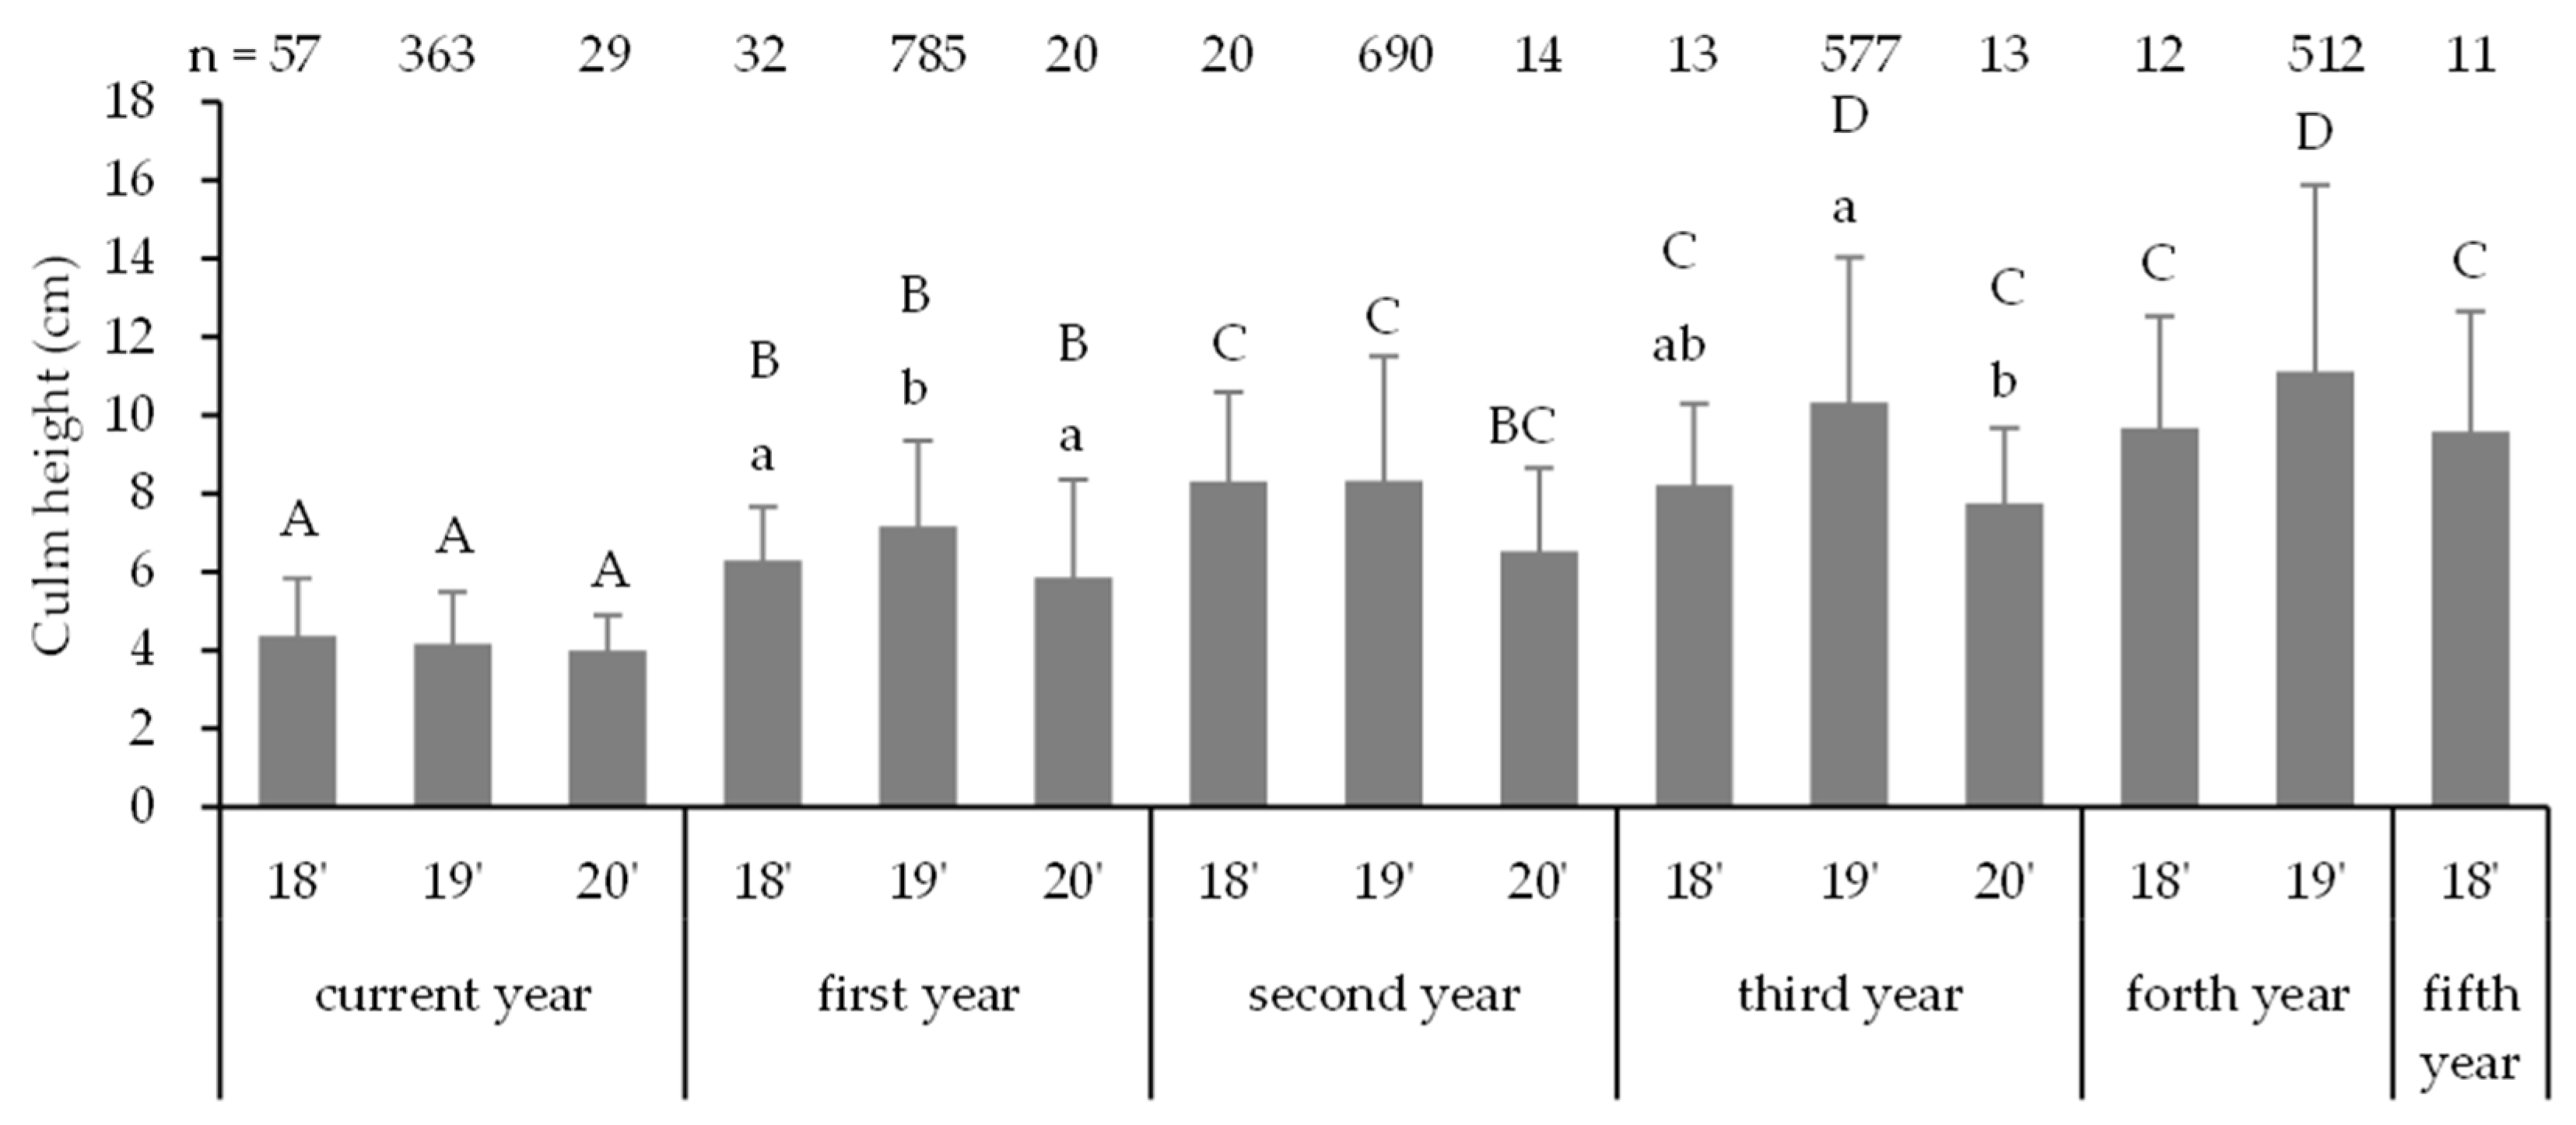
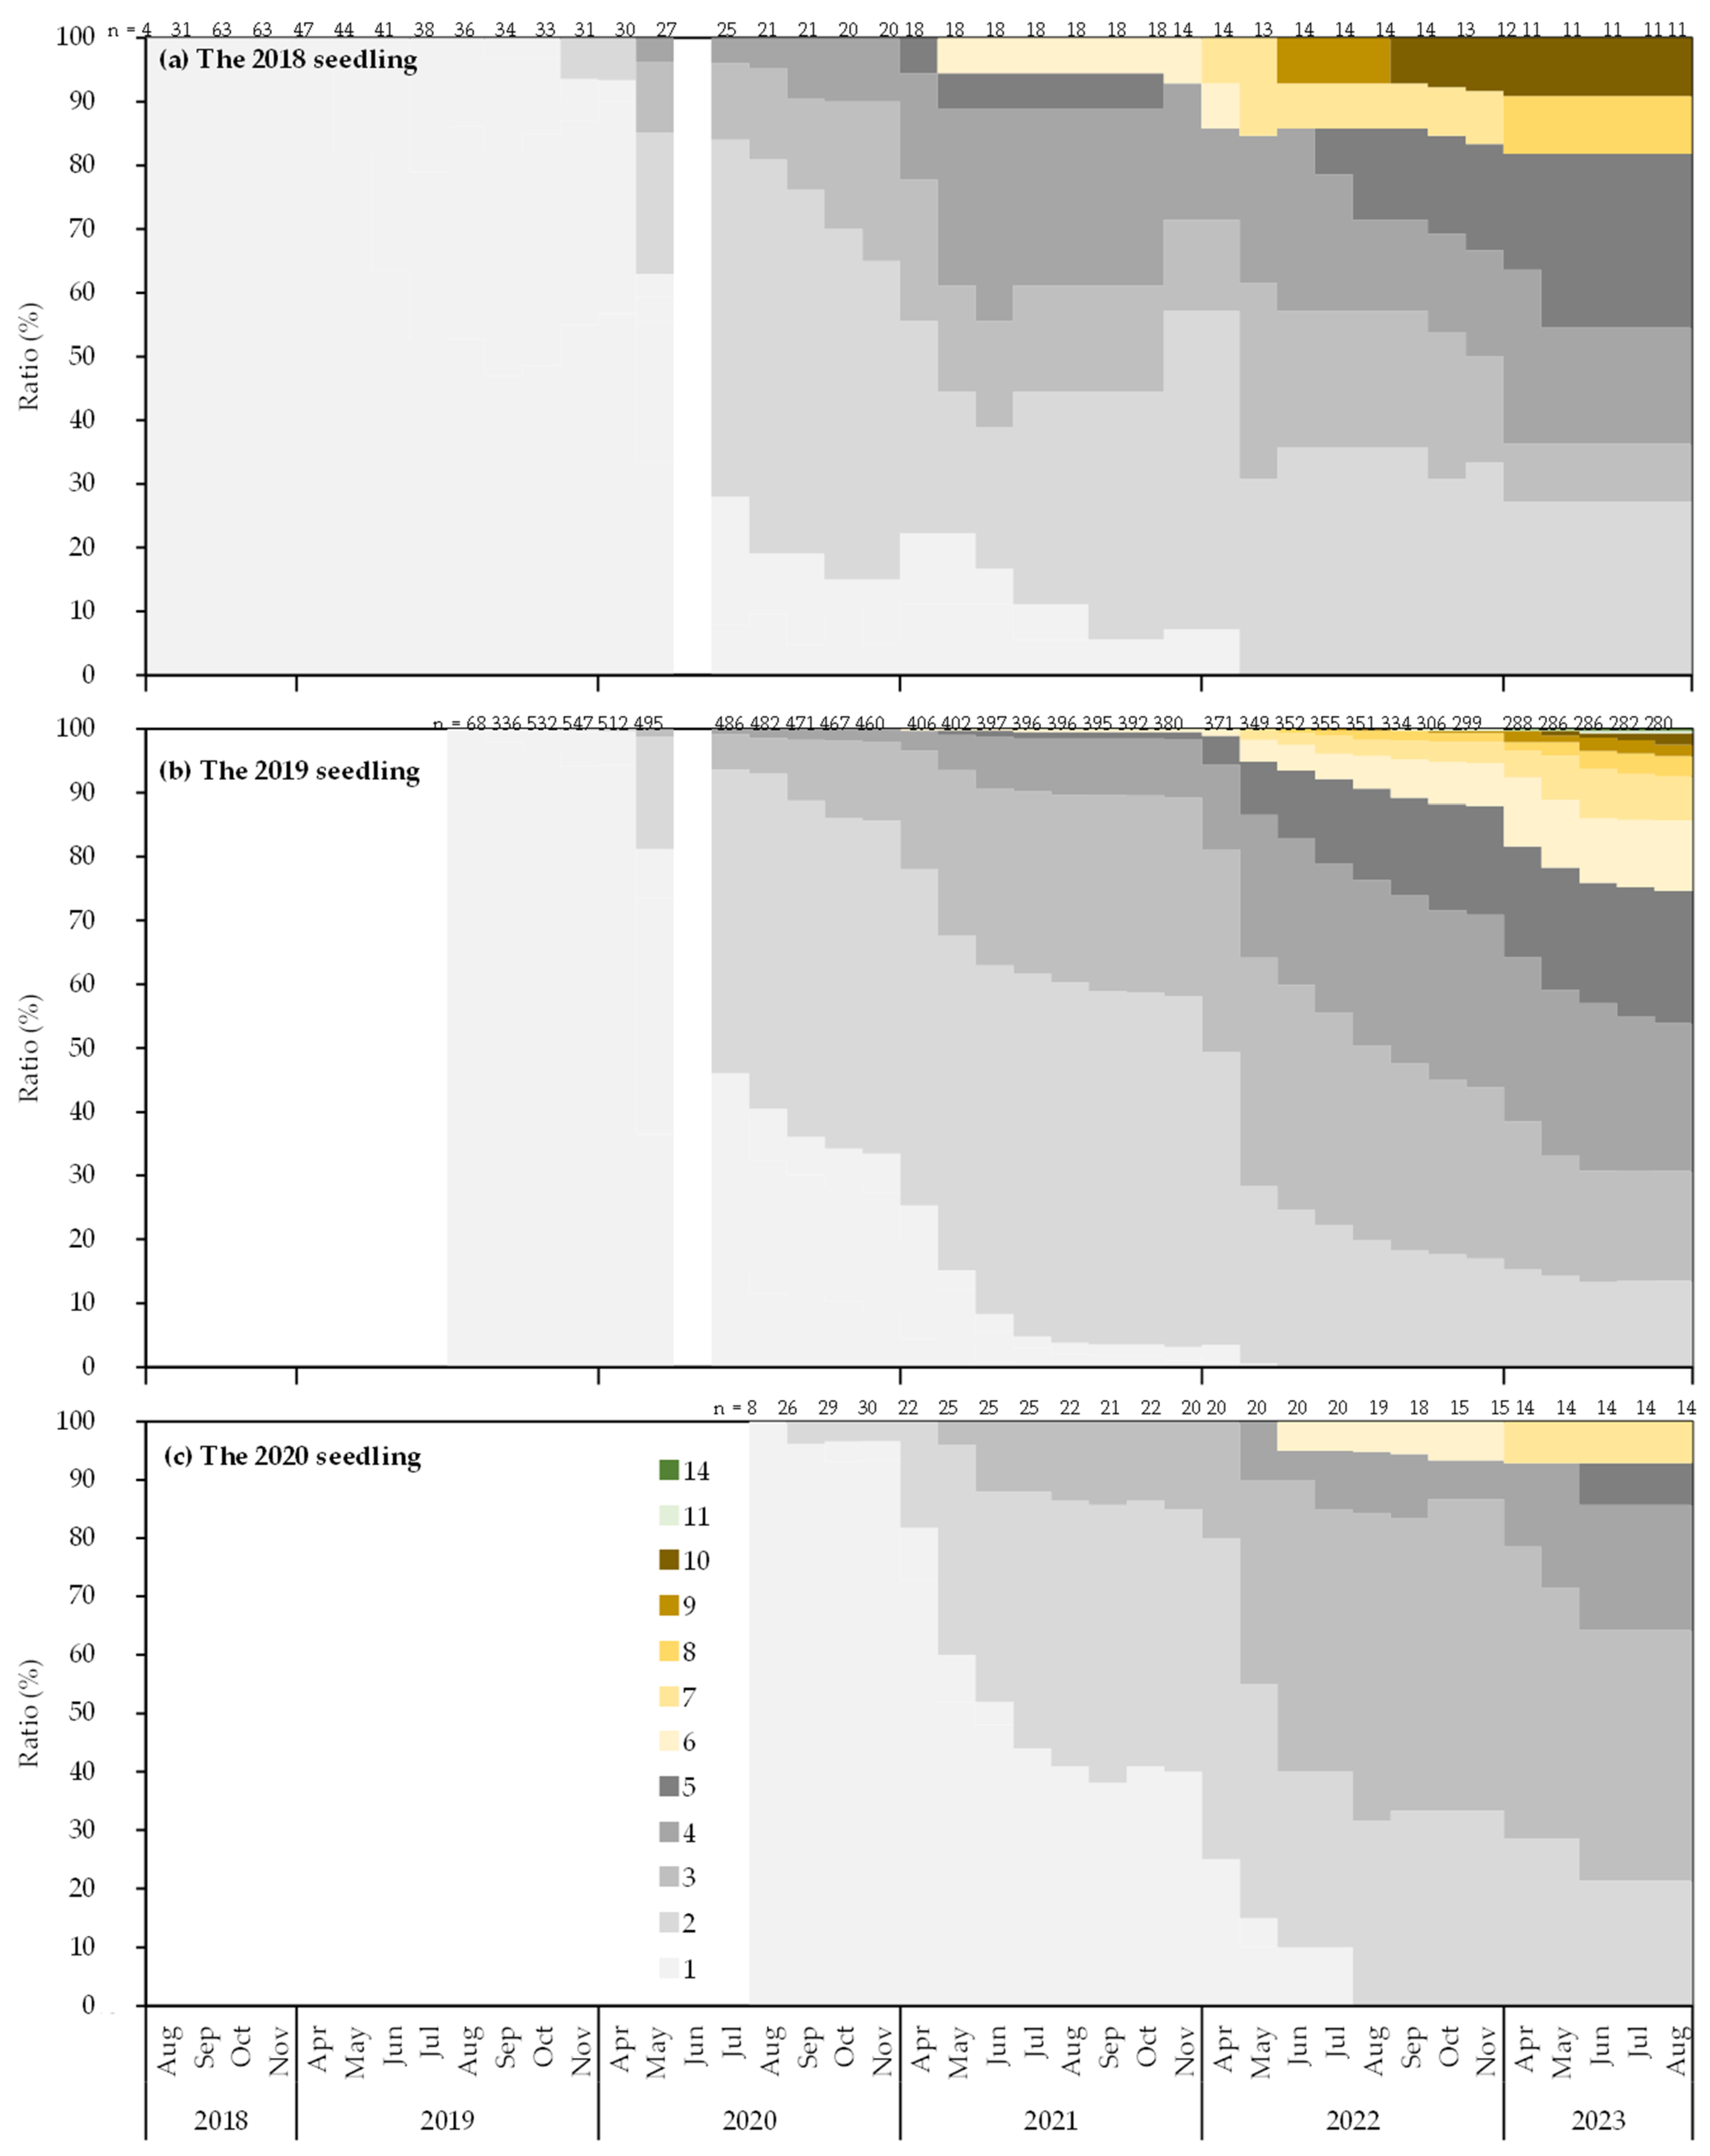
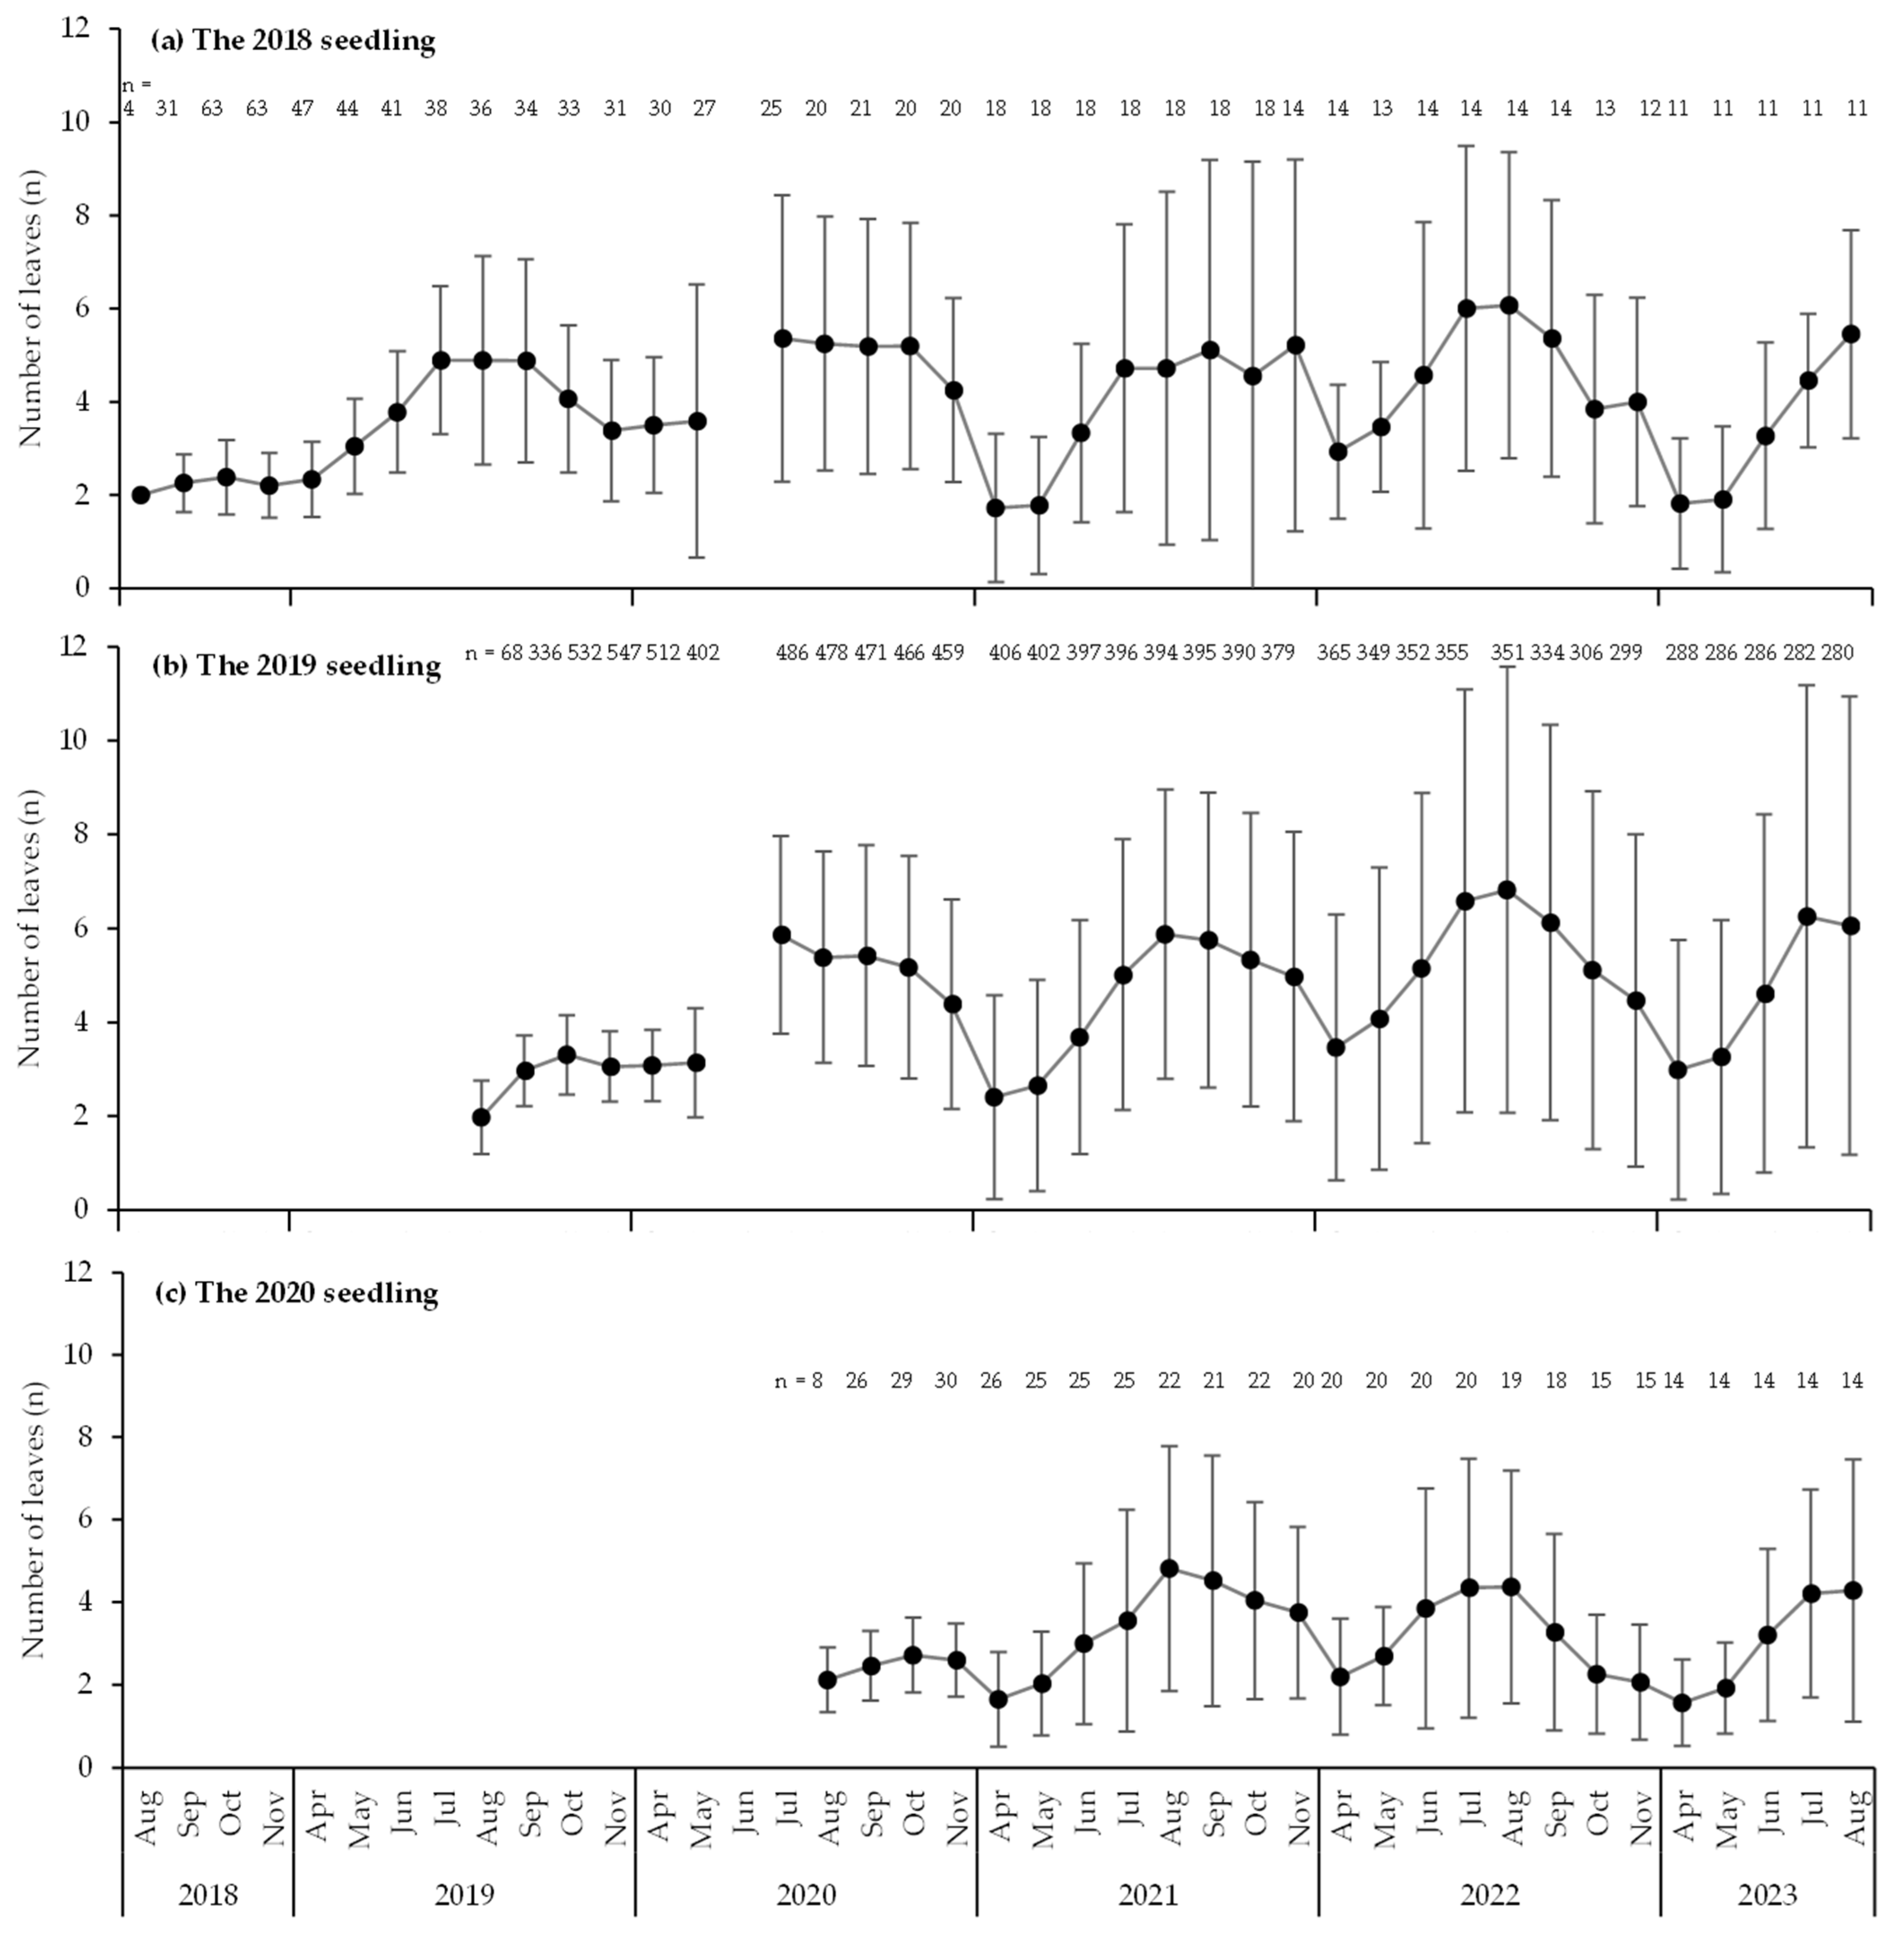
4.4. Morphology of Seedlings
4.5. Foragers of Seedlings
5. Conclusions
Supplementary Materials
Author Contributions
Funding
Institutional Review Board Statement
Informed Consent Statement
Data Availability Statement
Acknowledgments
Conflicts of Interest
Abbreviations
| AIC | Akaike’s Information Criterion |
| CU | Cut (one of the categories of the condition of dead seedling) |
| DO | Damping off (one of the categories of the condition of dead seedling) |
| FO | Foraging (one of the categories of the condition of dead seedling) |
| GLM | Generalized linear model |
| GLMM | Generalized linear mixed model |
| UK | Unknown (one of the categories of the condition of dead seedling) |
References
- Janzen, D.H. Why bamboos wait so long to flower. Annu. Rev. Ecol. Syst. 1976, 7, 347–391. [Google Scholar] [CrossRef]
- Makita, A.; Suzuki, J.; Suyama, Y. The bamboos-their mysterious life histories. Jpn. J. Ecol. 2010, 60, 45–50. [Google Scholar]
- Matsumura, M.; Iwata, E.; Saijoh, Y. Fundamental studies on artificial propagation by seeding useful wild grasses in Japan. IV. Notes on reproduction by seeds in Nezasa plant, Arundinaria pygamea var. glabra, in central Japan. Res. Bull. Fac. Coll. Agric. Gifu Univ. 1974, 36, 389–404. [Google Scholar]
- Makita, A. Survivorship of a monocarpic bamboo grass, Sasa kurilensis, during the early regeneration process after mass flowering. Ecol. Res. 1992, 7, 245–254. [Google Scholar] [CrossRef]
- Makita, A.; Konno, Y.; Fujita, N.; Takada, K.; Hamabata, E. Recovery of a Sasa tsuboiana population after mass flowering and death. Ecol. Res. 1993, 8, 215–224. [Google Scholar] [CrossRef]
- Nishiwaki, A.; Makita, A. Seed production in the mass flowering sites of Sasa kurilensis var. jotanii in Mikura-jima, Izu Islands, Japan, in 1997. Bamboo J. 1998, 15, 1–9. [Google Scholar]
- Kudo, H.; Kadomatsu, M.; Noda, M.; Akibayashi, Y.; Natsume, S.; Kaneko, K. Long-term observation on the growth of Sasa kurilensis regenerated after mass flowering and associated plants in northern Japan: A 31 year-observation. Res. Bull. Coll. Exp. For. Hokkaido Univ. 1999, 56, 30–40. [Google Scholar]
- Kitamura, K.; Kawahara, T. Difference in germination response to cold stratification intervals between two dwarf bamboo species, Sasa cernua and S. senanensis. Bull. For. For. Prod. Res. Inst. 2011, 10, 1–5. [Google Scholar]
- Matsumura, M.; Nakajima, N. Fundamental studies on artificial propagation by seeding useful wild grasses in Japan. VII. Some observations concerning the seed propagation of the dwarf bamboo, Sasa senanensis Rehd. Res. Bull. Fac. Coll. Agric. Gifu Univ. 1981, 45, 289–297. [Google Scholar]
- Kudo, H. Natural withering of Sasa kurilensis and regeneration of trees. Res. Bull. Coll. Exp. For. Hokkaido Univ. 1984, 42, 889–908. [Google Scholar]
- Abe, Y.; Shibata, S. Sasa veitchii (Carriere) Rehder var. hirsuta seedling growth under various light conditions. J. Jpn. Soc. Reveg. Technol. 2013, 39, 295–300. [Google Scholar]
- Blubaugh, C.K.; Kaplan, I. Invertebrate seed predators reduce weed emergence following seed rain. Weed Sci. 2016, 64, 80–86. [Google Scholar] [CrossRef]
- García-Hernández, M.; de los, Á.; López-Barrera, F. Direct seeding success of four threatened oak species in a peri-urban forest: Effects of microhabitat and rodent exclusion. Ecol. Manag. 2024, 553, 121629. [Google Scholar] [CrossRef]
- Willson, M.F.; Sabag, C.; Figueroa, J.; Armesto, J.J. Frugivory and seed dispersal of Podocarpus nubigena in Chiloe, Chile. Rev. Chil. De. Hist. Nat. 1996, 69, 343–349. [Google Scholar]
- Franklin, D.C. Vegetative phenology and growth of a facultatively deciduous bamboo in a monsoonal climate. Biotropica 2005, 37, 343–350. [Google Scholar] [CrossRef]
- Areta, J.I.; Bodrati, A.; Cockle, K. Specialization on Guadua bamboo seeds by three bird species in the atlantic forest of Argentina. Biotropica 2009, 41, 66–73. [Google Scholar] [CrossRef]
- Koshy, K.C.; Gopakumar, B.; Sebastian, A.; Nair, S.A.; Johnson, A.J.; Govindan, B.; Baby, S. Flower-fruit dynamics, visitor-predator patterns and chemical preferences in the tropical bamboo, Melocanna baccifera. PLoS ONE 2022, 17, e0277341. [Google Scholar] [CrossRef]
- Suzuki, H.; Kajimura, H. Utilization of Sasa borealis seeds by Japanese field mouse: Discovery of small-seed caching. Front. Ecol. Evol. 2023, 11, 1124393. [Google Scholar] [CrossRef]
- Taiz, L.; Zeiger, E. Plant Physiology, 3rd ed.; Sinauer Associates: Sunderland, MA, USA, 2002. [Google Scholar]
- Abe, Y.; Shibata, S. Seed germination and seedling establishment of the monocarpic dwarf bamboo Sasa veitchii var. hirsuta. J. Res. 2014, 19, 166–173. [Google Scholar] [CrossRef]
- Hulme, P.E. Seedling herbivory in grassland: Relative impact of vertebrate and invertebrate herbivores. J. Ecol. 1994, 82, 873–880. [Google Scholar] [CrossRef]
- Bowman, T.R.S.; McMillan, B.R.; St Clair, S.B. Rodent herbivory differentially affects mortality rates of 14 native plant species with contrasting life history and growth form traits. Oecologia 2017, 185, 465–473. [Google Scholar] [CrossRef] [PubMed]
- Uno, H.; Inatomi, Y.; Ueno, M.; Iijima, H. Effects of sika deer (Cervus nippon) and dwarf bamboo (Sasa senanensis) on tree seedlings in a cool-temperate mixed forest on Hokkaido Island, Japan. Eur. J. Res. 2019, 138, 929–938. [Google Scholar] [CrossRef]
- Takatsuki, S. The importance of Sasa nipponica as a forage for sika deer (Cervus nippon) in Omote-Nikko. Jpn. J. Ecol. 1983, 33, 17–25. [Google Scholar]
- Ota, K.; Takatsu, S.; Abe, H. Fluctuations of numbers of small mammals at Mt. Moiwa, Sapporo I. Seasonal fluctuations of small mammal populations. J. Fac. Agric. Hokkaido Univ. 1959, 3, 49–69. [Google Scholar]
- Sato, J.J.; Shimada, T.; Kyogoku, D.; Komura, T.; Uemura, S.; Saitoh, T.; Isagi, Y. Dietary niche partitioning between sympatric wood mouse species (Muridae: Apodemus) revealed by DNA meta-barcoding analysis. J. Mammal. 2018, 99, 952–964. [Google Scholar] [CrossRef]
- Takenaka, M.; Hayashi, K.; Yamada, G.; Ogura, T.; Ito, M.; Milner, A.M.; Tojo, K. Behavior of snow monkeys hunting fish to survive winter. Sci. Rep. 2022, 12, 20324. [Google Scholar] [CrossRef]
- Yokoyama, S.; Shibata, E. The effects of sika-deer browsing on the biomass and morphology of a dwarf bamboo, Sasa nipponica, in Mt. Ohdaigahara, central Japan. Ecol. Manag. 1998, 103, 49–56. [Google Scholar] [CrossRef]
- Saruki, S.; Inoue, S.; Shibata, Y.; Nagasawa, H.; Ohosaki, S.; Kubota, K. Distribution and growth situation of Suzutake (Sasamorpha borealis) damaged by grazing of Shika deer (Cervus nippon nippon) in Miyazaki Forest of Kyushu University: Case study in 2003. Bull. Kyushu Univ. For. 2004, 85, 47–54. [Google Scholar]
- Koizumi, T.; Yabe, T.; Inoue, S. The effects of sika deer, Cervus nippon, grazing on the density and height of a dwarf bamboo, Sasamorpha borealis in southwestern Japan. Kyushu J. For. Res. 2006, 59, 90–93. [Google Scholar]
- Tanaka, Y.; Takatsuki, S.; Takayanagi, A. Decline of Sasa palmata community by grazing Sika deer (Cervus nippon) at Ashiu Research Forest Station. For. Res. Kyoto 2008, 77, 13–23. [Google Scholar]
- Cho, K.; Enoki, T.; Kaji, K.; Yamauchi, K.; Ogata, T.; Shiiba, Y. Dynamics of Sasa borealis (Hack.) Makino et Shibata community induced by the grazing of sika deer (Cervus nippon): The change from 2003 to 2014 in Shiiba Research Forest, Kyushu University. Bull. Kyushu Univ. For. 2016, 97, 7–10. [Google Scholar]
- Nagaike, T. Effects of deer browsing in Sasa spp. In Larix kaempferi plantations and secondary deciduous broad-leaved forests. Bull. Yamanashi For. For. Prod. Res. Inst. 2018, 37, 5–9. [Google Scholar]
- Higashiguchi, R.; Shibata, S. Effect of removing the impact of continuous herbivory by sika deer on regeneration of dwarf bamboo (Sasa veitchii var. hirsuta) after mass flowering. J. Jpn. Soc. Reveg. Technol. 2017, 43, 74–79. [Google Scholar] [CrossRef]
- Bianchi, E.; Bugmann, H.; Bigler, C. Early emergence increases survival of tree seedlings in Central European temperate forests despite severe late frost. Ecol. Evol. 2019, 9, 8238–8252. [Google Scholar] [CrossRef] [PubMed]
- Qin, J.H.; Zhang, Z.H.; Geng, Y.; Zhang, C.Y.; Song, Z.L.; Zhao, X.H. Variations of density-dependent seedling survival in a temperate forest. Ecol. Manag. 2020, 468, 118158. [Google Scholar] [CrossRef]
- Huang, W.W.; Olson, E.; Wang, S.C.; Shi, P.J. The growth and mortality of Pleioblastus pygmaeus under different light availability. Glob. Ecol. Conserv. 2020, 24, e01262. [Google Scholar] [CrossRef]
- Kobayashi, M. The Illustrated Book of Plant Systematics in Color Bambusoideae in Japan; The Hokuryukan Co.: Tokyo, Japan, 2017. [Google Scholar]
- Nagata, K.; Tamura, A. Flowering records if three bamboo species in the Tanzawa Mountains in (the year) 2013. Bull. Kanagawa Prefect. Nat. Environ. Conserv. Cent. 2014, 12, 43–45. [Google Scholar]
- Okamoto, T. Simultaneous flowering of Sasa borealis in 2017—In the case of Mt. Rokko. Res. Inf. 2018, 129, 1–2. [Google Scholar]
- Saitoh, T. Simultaneous flowering of Sasa borealis in Tohoku Region. For. Wind. 2020, 82, 1–2. [Google Scholar]
- Niiyama, K.; Shibata, M.; Saitoh, T.; Naoe, S. The 30 years dynamics of three dwarf bamboo species in Ogawa research site in northern Ibaraki prefecture, Japan. Bull. For. For. Prod. Res. Inst. 2021, 20, 339–351. [Google Scholar]
- Cho, S.; Kim, Y.; Jung, S.; Choung, Y. Synergistic effect of dwarf bamboo flowering and wild boar rooting on forest regeneration. Forests 2021, 12, 1207. [Google Scholar] [CrossRef]
- Nakagawa, M.; Yoda, K.; Asahi, K.; Yumigeta, Y.; Watanabe, A. Reproductive characteristics in an understory bamboo and gradual environmental changes after its dieback provide an extended opportunity for overstory tree regeneration in a mixed cool-temperate forest in central Japan. Plant Biol. 2023, 25, 687–695. [Google Scholar] [CrossRef] [PubMed]
- Bates, D.; Maechler, M.; Bolker, B.; Walker, S. Fitting linear mixed-effects models using lme4. J. Stat. Softw. 2015, 67, 1–48. [Google Scholar] [CrossRef]
- R Core Team. R: A Language and Environment for Statistical Computing; R Foundation for Statistical Computing: Vienna, Austria, 2021. [Google Scholar]
- Taylor, A.H.; Qin, Z. Regeneration from seed of Sinarundinaria fangiana, a bamboo, in the Wolong Giant Panda Reserve, Sichuan, China. Am. J. Bot. 1988, 75, 1065–1073. [Google Scholar] [CrossRef]
- Wang, W.; Franklin, S.B.; Cirtain, M.C. Seed germination and seedling growth in the arrow bamboo Fargesia qinlingensis. Ecol. Res. 2007, 22, 467–474. [Google Scholar] [CrossRef]
- Augspurger, C.K.; Cheeseman, J.M.; Salk, C.F. Light gains and physiological capacity of understory woody plants during phenological avoidance of canopy shade. Funct. Ecol. 2005, 19, 537–546. [Google Scholar] [CrossRef]
- Gómez, J.; Hódar, J. Wild boars (Sus. scrofa) affect the recruitment rate and spatial distribution of holm oak (Quercus ilex). Ecol. Manag. 2008, 256, 1384–1389. [Google Scholar] [CrossRef]
- Nagamatsu, D. Forest structure resulting from the relationship between topography and seedling. In Ecology of Forest Buds; Masaki, T., Ed.; Bun-ichi Sogo Shuppan Co.: Tokyo, Japan, 2008; pp. 47–64. [Google Scholar]
- Kamata, N. Forest of Insects; University of Tokyo Press: Tokyo, Japan, 2005. [Google Scholar]
- Yuruki, T.; Aragami, K.; Inoue, S. Ecological studies of Suzutake (Sasa borealis). Bull. Kyushu Univ. For. 1977, 50, 83–122. [Google Scholar]
- Gagnon, P.R.; Platt, W.J. Reproductive and seedling ecology of a semelparous native bamboo (Arundinaria gigantea, Poaceae). J. Torrey Bot. Soc. 2008, 135, 309–316. [Google Scholar] [CrossRef]
- Kamota, F. Characteristic features of water consumption of vegetables and fruit trees. J. Jpn. Soc. Soil. Phys. 1982, 45, 19–26. [Google Scholar]
- Nakashizuka, T. Regeneration of beech (Fagus crenata) after the simultaneous death of undergrowing dwarf bamboo (Sasa kurilensis). Ecol. Res. 1988, 3, 21–35. [Google Scholar] [CrossRef]
- Haeussler, S.; Tappeiner, J.C.; Greber, B.J. Germination, survival, and early growth of red alder seedlings in the central Coast Range of Oregon. Can. J. Res. 1995, 25, 1639–1651. [Google Scholar] [CrossRef]
- Murata, I.; Saruki, S.; Kubota, K.; Inoue, S.; Tashiro, N.; Enoki, T.; Utsumi, Y. Effects of sika deer (Cervus nippon) and dwarf bamboo (Sasamorpha borealis) on seedling emergence and survival in cool-temperate mixed forests in the Kyushu Mountains. J. Res. 2009, 14, 296–301. [Google Scholar] [CrossRef]
- Terai, Y.; Shibata, S.; Hono, T. Effects of herbivorous mammals on aboveground and underground parts of Sasa nipponica—The results of the 4th year after the enclosure. J. Jpn. Soc. Reveg. Technol. 2008, 34, 516–523. [Google Scholar]
- Abe, Y.; Shibata, S. Effects of sika deer grazing on seedling regeneration of the dwarf bamboo Sasa veitchii var. hirsuta after mass flowering and death. J. Jpn. Soc. Reveg. Technol. 2013, 38, 449–453. [Google Scholar]
- Kitamura, K.; Kawahara, T. Small-scale flowering and genetic clonal structure of Sasa cernua. FFPRI Hokkaido Res. Cent. Rep. 2009, 3, 2–4. [Google Scholar]
- Matsuo, A.; Suyama, Y.; Makita, A. The relationship between rhizome habits and spatial distribution pattern of genets in two dwarf bamboos, Sasa veitchii var. hirsuta and Sasa kurilensis. Jpn. J. Ecol. 2010, 60, 81–88. [Google Scholar]
- Matsumura, M.; Itoh, K.; Saijoh, Y. Fundamental studies on artificial propagation by seeding useful wild grasses in Japan. X. Some observations on the 10th year plants of Sasa senanensis originated from seedlings. Res. Bull. Fac. Coll. Agric. Gifu Univ. 1988, 53, 413–423. [Google Scholar]
- Hisamoto, Y. Simultaneous flowering and death of Phyllostachys nigra in the Arakawa riverbed and its impact on the ecosystem. Bamboo 2020, 144, 12–24. [Google Scholar]
- Kumar, S.; Takeda, A.; Shibata, E. Effects of 13-year fencing on browsing by sika deer on seedlings on Mt. Ohdaigahara, central Japan. J. Res. 2006, 11, 337–342. [Google Scholar] [CrossRef]
- Stolter, C.; Niemelä, P.; Ball, J.P.; Julkunen-Tiitto, R.; Vanhatalo, A.; Danell, K.; Varvikko, T.; Ganzhorn, J.U. Comparison of plant secondary metabolites and digestibility of three different boreal coniferous trees. Basic Appl. Ecol. 2009, 10, 19–26. [Google Scholar] [CrossRef]
- Taiz, L.; Zeiger, E.; Møller, I.M.; Murphy, A.S. Plant Physiology and Development, 6th ed.; Oxford University Press: Oxford, UK, 2015. [Google Scholar]
- Budny, M.; Zalewski, K.; Stolarski, M.J.; Wiczkowski, W.; Okorski, A.; Stryinski, R. The phenolic compounds in the young shoots of selected willow cultivars as a determinant of the plants’ attractiveness to cervids (Cervidae, Mammalia). Biology 2021, 10, 612. [Google Scholar] [CrossRef] [PubMed]
- Vourc’h, G.; De Garine-Wichatitsky, M.; Labbe, A.; Rosolowski, D.; Martin, J.L.; Fritz, H. Monoterpene effect on feeding choice by deer. J. Chem. Ecol. 2002, 28, 2411–2427. [Google Scholar] [CrossRef]
- Luck, K.; Chen, X.L.; Norris, A.M.; Chen, F.; Gershenzon, J.; Köllner, T.G. The reconstruction and biochemical characterization of ancestral genes furnish insights into the evolution of terpene synthase function in the Poaceae. Plant Mol. Biol. 2020, 104, 203–215. [Google Scholar] [CrossRef]
- Huang, W.J.; Wu, Y.F.; Zhao, Z.J.; Yi, S.L.; He, Z.B. Influence of thermal treatment conditions on the release of volatile organic compounds from Bamboo. Bioresources 2016, 11, 7296–7304. [Google Scholar] [CrossRef]
- Suzuki, H.; Kashiwagi, H.; Kajimura, H. How does the 120-year cycle mast seeding of dwarf bamboo affect the rodent population? Ecol. Process 2022, 11, 43. [Google Scholar] [CrossRef]
- Ida, H.; Nakagoshi, N. Gnawing damage by rodents to the seedlings of Fagus crenata and Quercus mongolica var grosseserrata in a temperate Sasa grassland deciduous forest series in southwestern Japan. Ecol. Res. 1996, 11, 97–103. [Google Scholar] [CrossRef]
- Sasaki, H.; Kawabata, M. Food habits of the raccoon dog Nyctereutes procyonoides viverrinus in a mountainous area of Japan. J. Mammal. Soc. Jpn. 1994, 19, 1–8. [Google Scholar]
- Hirasawa, M.; Kanda, E.; Takatsuki, S. Seasonal food habits of the raccoon dog at a western suburb of Tokyo. Mammal. Study 2006, 31, 9–14. [Google Scholar] [CrossRef]
- Franck, A.R.; Farid, A. Many species of the Carnivora consume grass and other fibrous plant tissues. Belg. J. Zool. 2020, 150, 1–70. [Google Scholar] [CrossRef]
- Maeto, K.; Fukuyama, K. Mature tree effect of Acer mono on seedling mortality due to insect herbivory. Ecol. Res. 1997, 12, 337–343. [Google Scholar] [CrossRef]

Disclaimer/Publisher’s Note: The statements, opinions and data contained in all publications are solely those of the individual author(s) and contributor(s) and not of MDPI and/or the editor(s). MDPI and/or the editor(s) disclaim responsibility for any injury to people or property resulting from any ideas, methods, instructions or products referred to in the content. |
© 2025 by the authors. Licensee MDPI, Basel, Switzerland. This article is an open access article distributed under the terms and conditions of the Creative Commons Attribution (CC BY) license (https://creativecommons.org/licenses/by/4.0/).
Share and Cite
Suzuki, H.; Kajimura, H. Growth Process and Mortality of Sasa borealis Seedlings over Six Years Following Mass Flowering and Factors Influencing Them. Biology 2025, 14, 516. https://doi.org/10.3390/biology14050516
Suzuki H, Kajimura H. Growth Process and Mortality of Sasa borealis Seedlings over Six Years Following Mass Flowering and Factors Influencing Them. Biology. 2025; 14(5):516. https://doi.org/10.3390/biology14050516
Chicago/Turabian StyleSuzuki, Hanami, and Hisashi Kajimura. 2025. "Growth Process and Mortality of Sasa borealis Seedlings over Six Years Following Mass Flowering and Factors Influencing Them" Biology 14, no. 5: 516. https://doi.org/10.3390/biology14050516
APA StyleSuzuki, H., & Kajimura, H. (2025). Growth Process and Mortality of Sasa borealis Seedlings over Six Years Following Mass Flowering and Factors Influencing Them. Biology, 14(5), 516. https://doi.org/10.3390/biology14050516