Article

Climate Change vs. Human Activities: Conflicting Future Impacts on a High-Altitude Endangered Snake (Thermophis baileyi)

by
Yuxue Pan
1,†,
Ruiying Han
1,†,
Fengbin Dai
1,
Yu Liu
1,
Tianjian Song
1,
Yueheng Ren
1,
Song Huang
2 and
Jiang Chang
1,*
1
State Key Laboratory of Environmental Criteria and Risk Assessment, Chinese Research Academy of Environmental Sciences, Beijing 100012, China
2
College of Life Sciences, Anhui Normal University, Wuhu 241000, China
*
Author to whom correspondence should be addressed.
These authors contributed equally to this work.
Biology 2025, 14(11), 1531; https://doi.org/10.3390/biology14111531 (registering DOI)
Submission received: 3 September 2025 / Revised: 18 October 2025 / Accepted: 29 October 2025 / Published: 31 October 2025

Simple Summary

As a high-altitude distributed reptile endemic to the Tibetan Plateau, the Tibetan hot-spring snake (Thermophis baileyi) is sensitive to accelerating climate change and expanding human land use, making it an ideal species for studying the effects of global changes on high-altitude ectotherms. In this study, based on field survey data and species occurrence records, we used species distribution model (SDM) under multiple future scenarios to assess the individual and combined impacts of climate and land cover change on its habitat. We identified four key environmental factors shaping its distribution and tracked changes in high-suitability habitat (HSH). The results demonstrated that anthropogenic landscape change would cause a reduction in the HSH area. Conversely, appropriate climate warming (SSP1-2.6, SSP2-4.5, SSP3-7.0) would expand the HSH area; however, this expansion effect would be diminished when superimposed with anthropogenic landscape changes. In addition, extreme warming (exceeding SSP5-8.5) would surpass the ecological niche limits of T. baileyi, subsequently reducing its HSH and triggering a northward shift in its distribution centroid. The quantification of climate–landscape change impacts on T. baileyi offers critical insights for high-altitude ectotherm distributions under global changes and evidence-based conservation planning.

Abstract

Endemic ectotherms in high-altitude regions face dual threats from climate change and human activities, yet quantifiable indicators to disentangle these stressors remain limited. We developed a novel multi-scenario framework to disentangle the independent and synergistic impacts of climate change and anthropogenic landscape change on the habitat suitability of the Tibetan hot-spring snake (Thermophis baileyi) across the Tibetan Plateau. Our analysis was based on field survey data and species occurrence records, utilizing the species distribution model and the CA–Markov model. We identified temperature seasonality (41.8% contribution) as the primary environmental factor influencing its distribution, followed by precipitation of the coldest quarter (15.1%) and land cover (13.8%). The results showed that moderate climate warming would benefit the survival of the species, with a 24.03–38.55% gain in high-suitability habitat (HSH) area under climate change-only scenarios. However, extreme warming (exceeding SSP5-8.5) would surpass the thermal tolerance threshold of T. baileyi, reducing its HSH and triggering a northward shift in its distribution centroid. Landscape change reduced the HSH (5.98% reduction under land cover change-only scenario), and attenuated climate-driven gains by 4.99–11.31% under combined climate–landscape change scenarios. In addition, only one-fifth of the current HSH was covered by national natural reserves. Synergistic anthropogenic pressures critically offset climate benefits, demonstrating the need for integrated conservation strategies to address the challenges posed by both extreme climate warming and land cover change threats to mitigate future habitat degradation. The quantification of climate–land cover change impacts on T. baileyi offers critical insights for high-altitude ectotherm distributions under global changes and evidence-based conservation planning.

1. Introduction

During recent decades, the pace of global environmental change, including climate change and land cover transformation, has been unprecedented in recorded human history [1]. Global change has already damaged natural habitats so much that many terrestrial wildlife species are doomed to extinction, with many predicted to be lost within decades [2]. With global warming and the expansion of human activities, the natural habitats of many species are being damaged, leading to changes in species distribution ranges and adjustments in ecological niches [3,4,5]. Land cover change has been consistently identified as a dominant threat to biodiversity, causing substantial declines in species richness and abundance among most terrestrial species [6]. For instance, from 1995 to 2022, land use change committed 1.5% of global species to extinction [7]. These threats are particularly synergistic for ectothermic animals, as both climate and land use change erode the microhabitat heterogeneity necessary for behavioral thermoregulation [8,9]. Consequently, the interplay of shifting thermal climates and fragmented landscapes poses a fundamental challenge to their persistence, pushing many species toward their physiological limits [10,11].
The genus Thermophis is a relict group occurring at elevations over 3500 m [12]. It comprises three closely related species: Thermophis baileyi [13], the Tibetan hot-spring snake; Thermophis zhaoermii [14], the Sichuan hot-spring snake; and Thermophis shangrila [15], the Shangri-La hot-spring snake. These three species are tightly linked to high-elevation geothermal sites [16]. This dependency, however, makes them highly vulnerable to habitat destruction from the development of geothermal power stations and other commercial infrastructure [17,18].
T. baileyi, the Tibetan hot-spring snake (Serpentes, Colubridae), is an ectothermic species uniquely adapted to high-altitude environments, and exhibits high sensitivity to habitat alterations [19]. This nonvenomous snake is endemic to the Tibetan Plateau [20], a region with relatively extreme environments including extreme temperature fluctuations, low temperatures, high elevations, oxidative stress, intense ultraviolet radiation, and abundant geothermal resources [21]. These snakes are confined to habitats with hot springs, with the highest documented altitudinal distributions (ranging from 3600 m to 4900 m above sea level) among snakes [22]. Currently, T. baileyi is listed as “Endangered (EN)” by the IUCN Red List [23] and has experienced a significant change from its previous “Vulnerable (VU)” status [24] over a decade ago. Due to its strict ecological requirements and restriction to the climatically vulnerable Tibetan Plateau, T. baileyi is sensitive to the impacts of climate and landscape change [18], making it an ideal species for studying the effects of global changes on species distributions, especially those of ectothermic animals.
Expanding commercialization of geothermal energy has caused substantial habitat destruction, posing escalating threats to T. baileyi populations [18,20]. Previous research on T. baileyi has largely focused on taxonomic and genetic conditions, revealing mechanisms such as cold acclimation and high-elevation acclimatization [16,19]. Genomic studies have further elucidated intraspecific divergence and selection pressures in this lineage [25], while population genetic work has inferred historical refugia and current diversification drivers [20]. However, ecological aspects, particularly those related to distribution dynamics, habitat change, conservation status, and responses to anthropogenic pressure, remain poorly understood.
Given that climate and landscape change can critically impact ectothermic species by altering their thermal environments and restricting microhabitat availability [26,27,28], with the degradation of geothermal habitats and shifting climate regimes hampering both behavioural thermoregulation and dispersal [29], we hypothesized that the synergistic pressures of climate warming and landscape change were primary limiting factors for T. baileyi, a high-elevation ectotherm with strict microhabitat preferences tied to hot-spring resources on the Tibetan Plateau.
In this study, we aimed to address key questions regarding the conservation status, population abundance, and environmentally dependent distribution patterns of the endangered T. baileyi under multiple climate and landscape change scenarios across the Tibetan Plateau. By integrating species distribution modeling (SDM) with future scenario analysis, we sought to quantify the relative contributions of bioclimatic factors, landscape change, and their interactive effects on the spatial shifts of this high-altitude snake. Our findings provide the first empirical estimate of its current and future spatial distribution and demonstrate how future climate change and landscape change will shape its distribution patterns, thereby offering a scientific basis for formulating targeted conservation strategies to safeguard this and other high-elevation ectotherms in an era of global environmental change.

2. Materials and Methods

2.1. Research Framework

We developed a framework to quantify the contributions of climate change and human activities to the high-altitude distribution ectothermic species T. baileyi (Supplemental Figure S1). The framework primarily comprises three steps. First, we collected and selected data of occurrence records, environmental variables, and human activity data for analysis. All datasets were subsequently processed through data cleaning, variable standardization, and spatial alignment procedures. Three future scenarios were designed for simulating the future distribution. Meanwhile, the cellular automata (CA)–Markov (CA–Markov) model was employed to predict future land cover in 2050, which was driven predominantly by human activities. The MaxEnt model for T. baileyi was subsequently constructed, and the accuracy of the models was evaluated. Finally, the current and future suitable habitats of the species under different scenarios were simulated. Policy recommendations were proposed on the basis of the results.

2.2. Species Occurrence Data

In this study, we collected 68 occurrence records (Supplemental Table S1) of T. baileyi, mainly via field surveys (52 records, 149 individuals), searching the open source website Global Biodiversity Information Facility [30] (3 records) and consulting the relevant literature [17,19] (13 records) for supplementation. Duplicate records and records with obvious geocoding inaccuracies were identified and removed manually, retaining only one record per 500 m grid cell. Finally, a total of 54 records (Figure 1, Supplemental Table S2) remained for building species distribution models (SDMs) using MaxEnt version 3.6. All occurrence records were organized as “.CSV” format for analysis, as MaxEnt software requires.
Our field survey sites comprehensively covered all known distribution areas and potential microhabitats of T. baileyi, primarily along geothermal spring streams. Field investigations were conducted during two periods in 2019–2020 (June and August) by a total of 16 researchers organized into four teams. Field surveys of large geothermal areas employed the transect method for direct individual counts [31]. The sampling area covered no less than 5% of the distribution area. Each transect underwent four replicate surveys to ensure accuracy. For distribution points with single or few springs, a quiet stakeout approach was employed, utilizing direct counting for population assessment. Each site was surveyed for 4 consecutive days, recording the numbers of adults, subadults, and juveniles. The final count adopted the data from the day with the highest recorded numbers. Surveys were conducted around 3 p.m., when snakes are most active, even during the rainy season. Additionally, questionnaires (Supplemental Material S1) were administered to local residents to gather historical information on population trends and identify potential distribution gaps.

2.3. Environmental Variables

The standard 19 bioclimatic variables, key for defining species ecological niches, were used to simulate suitable habitat distributions via MaxEnt software. In addition, considering the strict microhabitat preferences tied to hot-spring resources of T. baileyi, land surface temperature (LST) was selected as an environmental factor, along with the other three environmental variables, land use, slope, and digital elevation model (DEM) data.
The standard 19 bioclimatic variables at a spatial resolution of 30 arc-seconds (~1 km2) were obtained from the WorldClim 2 database for the current and future periods [32,33]. In the WorldClim database, the current period was defined from 1970–2000. The future bioclimatic variables (averages for 2041–2060) were based on the shared socioeconomic pathway (SSP)–representative concentration pathway (RCP) combination scenario in Phase 6 of the Coupled Model Intercomparison Project (CMIP6, [34]). The climate scenarios under CMIP6 represent different socioeconomic development pathways and various trajectories of atmospheric greenhouse gas concentrations. The four scenarios SSP1-2.6, SSP2-4.5, SSP3-7.0, and SSP5-8.5 were adopted to represent the low, medium, high, and higher emission scenarios, respectively.
The LST data for 2020 was computed from Landsat 4, 5, 7, and 8 imagery using the Google Earth Engine (GEE). LST values were estimated with the Statistical Mono-Window (SMW) algorithm developed by the Climate Monitoring Satellite Application Facility (CM-SAF). The specific code and method can be found in the research of [35].
The global land cover products (GLC_FCS30) for 1990, 2005 and 2020 at 30 m using time series Landsat imagery [36] were used in this study. The GLC_FCS30 products utilize a refined classification system containing 35 land cover categories. We reclassified these 35 land cover categories into 10 categories (Supplemental Table S3).
The digital elevation model (DEM) data for 2020 was obtained from the Shuttle Radar Topography Mission (SRTM) at 90 m resolution of via the Geospatial Data Cloud site, Computer Network Information Center, Chinese Academy of Sciences (http://www.gscloud.cn). The slope data was extracted from the DEM via spatial analysis in ArcGIS 10.5.
All datasets (Table 1) were resampled to a uniform 500 m resolution using spatial analysis tools of ArcGIS 10.5 to meet MaxEnt requirements, considering a balance between computational practicality and ecological relevance. Continuous variables (e.g., bioclimatic layers) were resampled using the bilinear interpolation method, while categorical data (e.g., land cover) were processed using the majority resampling technique to preserve their discrete nature.

2.4. Models

2.4.1. Scenario Settings

To quantify the different impacts of climate change and human activities on the distribution of T. baileyi, three sets of scenarios were designed in this study (Table 2).
Landscape change-only (LCO) scenario. This scenario isolated the influence of anthropogenic landscape changes on the species’ habitat distribution range while holding climate variables constant at current (2020) levels. To simulate these dynamics, the predicted 2050 land-use layer (see Section 2.4.2 for the prediction method) was input as an environmental variable to replace the 2020 land-cover layer, while the other variables remained unchanged.
Climate change-only (CCO) scenario. This scenario focused solely on the effects of climate change, incorporating four distinct Shared Socioeconomic Pathways—Representative Concentration Pathways (SSP-RCP) scenarios: SSP1-2.6, SSP2-4.5, SSP3-7.0, and SSP5-8.5. Each represented different trajectories of greenhouse gas emissions and associated climatic shifts, enabling an examination of how climate change independently affects species distributions.
Combined climate–landscape change (CCLC) scenario. This integrative scenario concurrently accounted for both landscape changes and climate change, providing a more realistic and holistic projection of the species’ potential distributional shifts under the interplay of these two major factors.

2.4.2. Prediction of Future Land Cover

We used the cellular automata (CA)–Markov (CA–Markov) model [37,38] in IDRISI Terrset 17.0 to predict land cover in 2050, which served as input data for the LCO and CCLC scenarios. The CA–Markov model combines the Markov chain and CA, where the probabilities of possible land cover changes supplied by a Markov chain are spatialized by CA [39]. The model requires an initial land cover distribution and a transition matrix, based on the assumption of stationarity in the underlying drivers of land cover change [40]. This assumption is fundamental for counterfactual analysis, enabling the extrapolation of landscape dynamics under a “no intervention” hypothesis [41]. In the model, the Markov chain is used to calculate the conversion probability among land cover types, and these probabilities are subsequently used as the conversion rules of the CA to simulate the process of land cover change [41].
Land cover data for 1990, 2000, 2010 and 2020 were used to simulate future land types in 2050 with a CA–Markov model. First, land cover data for 2000 and 2010 were used to predict the land cover map in 2020. Then a validation tool within the software was used to test model accuracy by comparing our predicted 2020 land cover data with the GLC_FCS30 product for 2020, which yielded a Kappa index of 0.76, indicating a “substantial” level of accuracy and justifying the model’s use for future projection [42]. A Kappa value >0.40 is considered acceptable, and >0.75 indicates good agreement. Following successful validation, land cover data for 1990 and 2020 were used to predict the 2050 data through the previously verified model.
Driving factors representing predominant anthropogenic influences were selected. These included (1) topographic factors (DEM, slope) and (2) anthropogenic factors, including the human footprint index (HFI), human activity intensity (HAI), road network density, nighttime lights, and livestock activity intensity index. The 1 km resolution HFI for 2018 was obtained from the annual terrestrial human footprint dataset from 2000 to 2018 [43]. The HAI data for 2020 [44] was downloaded from the National Tibetan Plateau Data Center (http://data.tpdc.ac.cn). The nighttime light data for 2020 was from a prolonged artificial nighttime light dataset from China [45] downloaded from the National Tibetan Plateau Data Center. Road network data was downloaded from the Open Street Map website (http://www.openstreetmap.org/). The livestock activity intensity index for 2020 was sourced from a previous study [46]. Due to low inter-annual volatility and data availability constraints, the HFI (Human Footprint Index) for 2018 was used as a substitute for the 2020 data. All datasets (Table 1) were resampled to a uniform 500 m resolution using spatial analysis tools of ArcGIS 10.5.

2.4.3. Prediction of Potential Distributions

We used the MaxEnt model, combined with environmental variables (Table 1) and occurrence records of T. baileyi, to simulate the current (2020) and future (2050) potential distributions of the species. MaxEnt is an effective tool developed for modelling target species’ potential geographic distributions [47] and is founded on the principle of maximum entropy from statistical mechanics and information theory [48,49]. MaxEnt has been widely applied to model the potential distribution areas of species under different climate scenarios through the analysis of current species occurrence data and environmental variables [50,51,52].
MaxEnt is capable of regulating contributions from redundant variables, rendering its robustness to the degree of predictor collinearity in model training [53]. To mitigate issues such as multicollinearity, autocorrelation, and redundancy of environmental variables that may lead to model overfitting [54], the jackknife test was used to measure the contribution rates of the remaining variables, and variables that contributed less than 1% in MaxEnt were removed [55].
In the modelling process, maximum iterations were 1000, and the number of replicates was 10. A total of 75% of the occurrence records were randomly selected for training, with the remaining 25% used for testing. The area under the curve (AUC) was used to assess the accuracy of the models. In general, the AUC value ranges from 0 to 1, and the closer the AUC is to 1, the better the model performance is. AUC values less than 0.5 indicated a failed prediction, and AUC values more than 0.9 were considered excellent [50].
Four distinct grades were categorized on the basis of the suitability index (ranging from 0 to 1) obtained from MaxEnt. The classification criteria were as follows: high-suitability habitats (HSH, p ≥ 0.7), medium-suitability habitats (0.35 ≤ p < 0.7), low-suitability habitats (0.1 ≤ p < 0.35), and unsuitable habitats (p < 0.1). Moreover, the centroid shifts of T. baileyi from the present to future scenarios were analysed via the zonal geometry tool in ArcGIS 10.7. The direction and distance of centroid movement of HSH were quantified.

3. Results

3.1. Dominant Environmental Variables and Response Curves

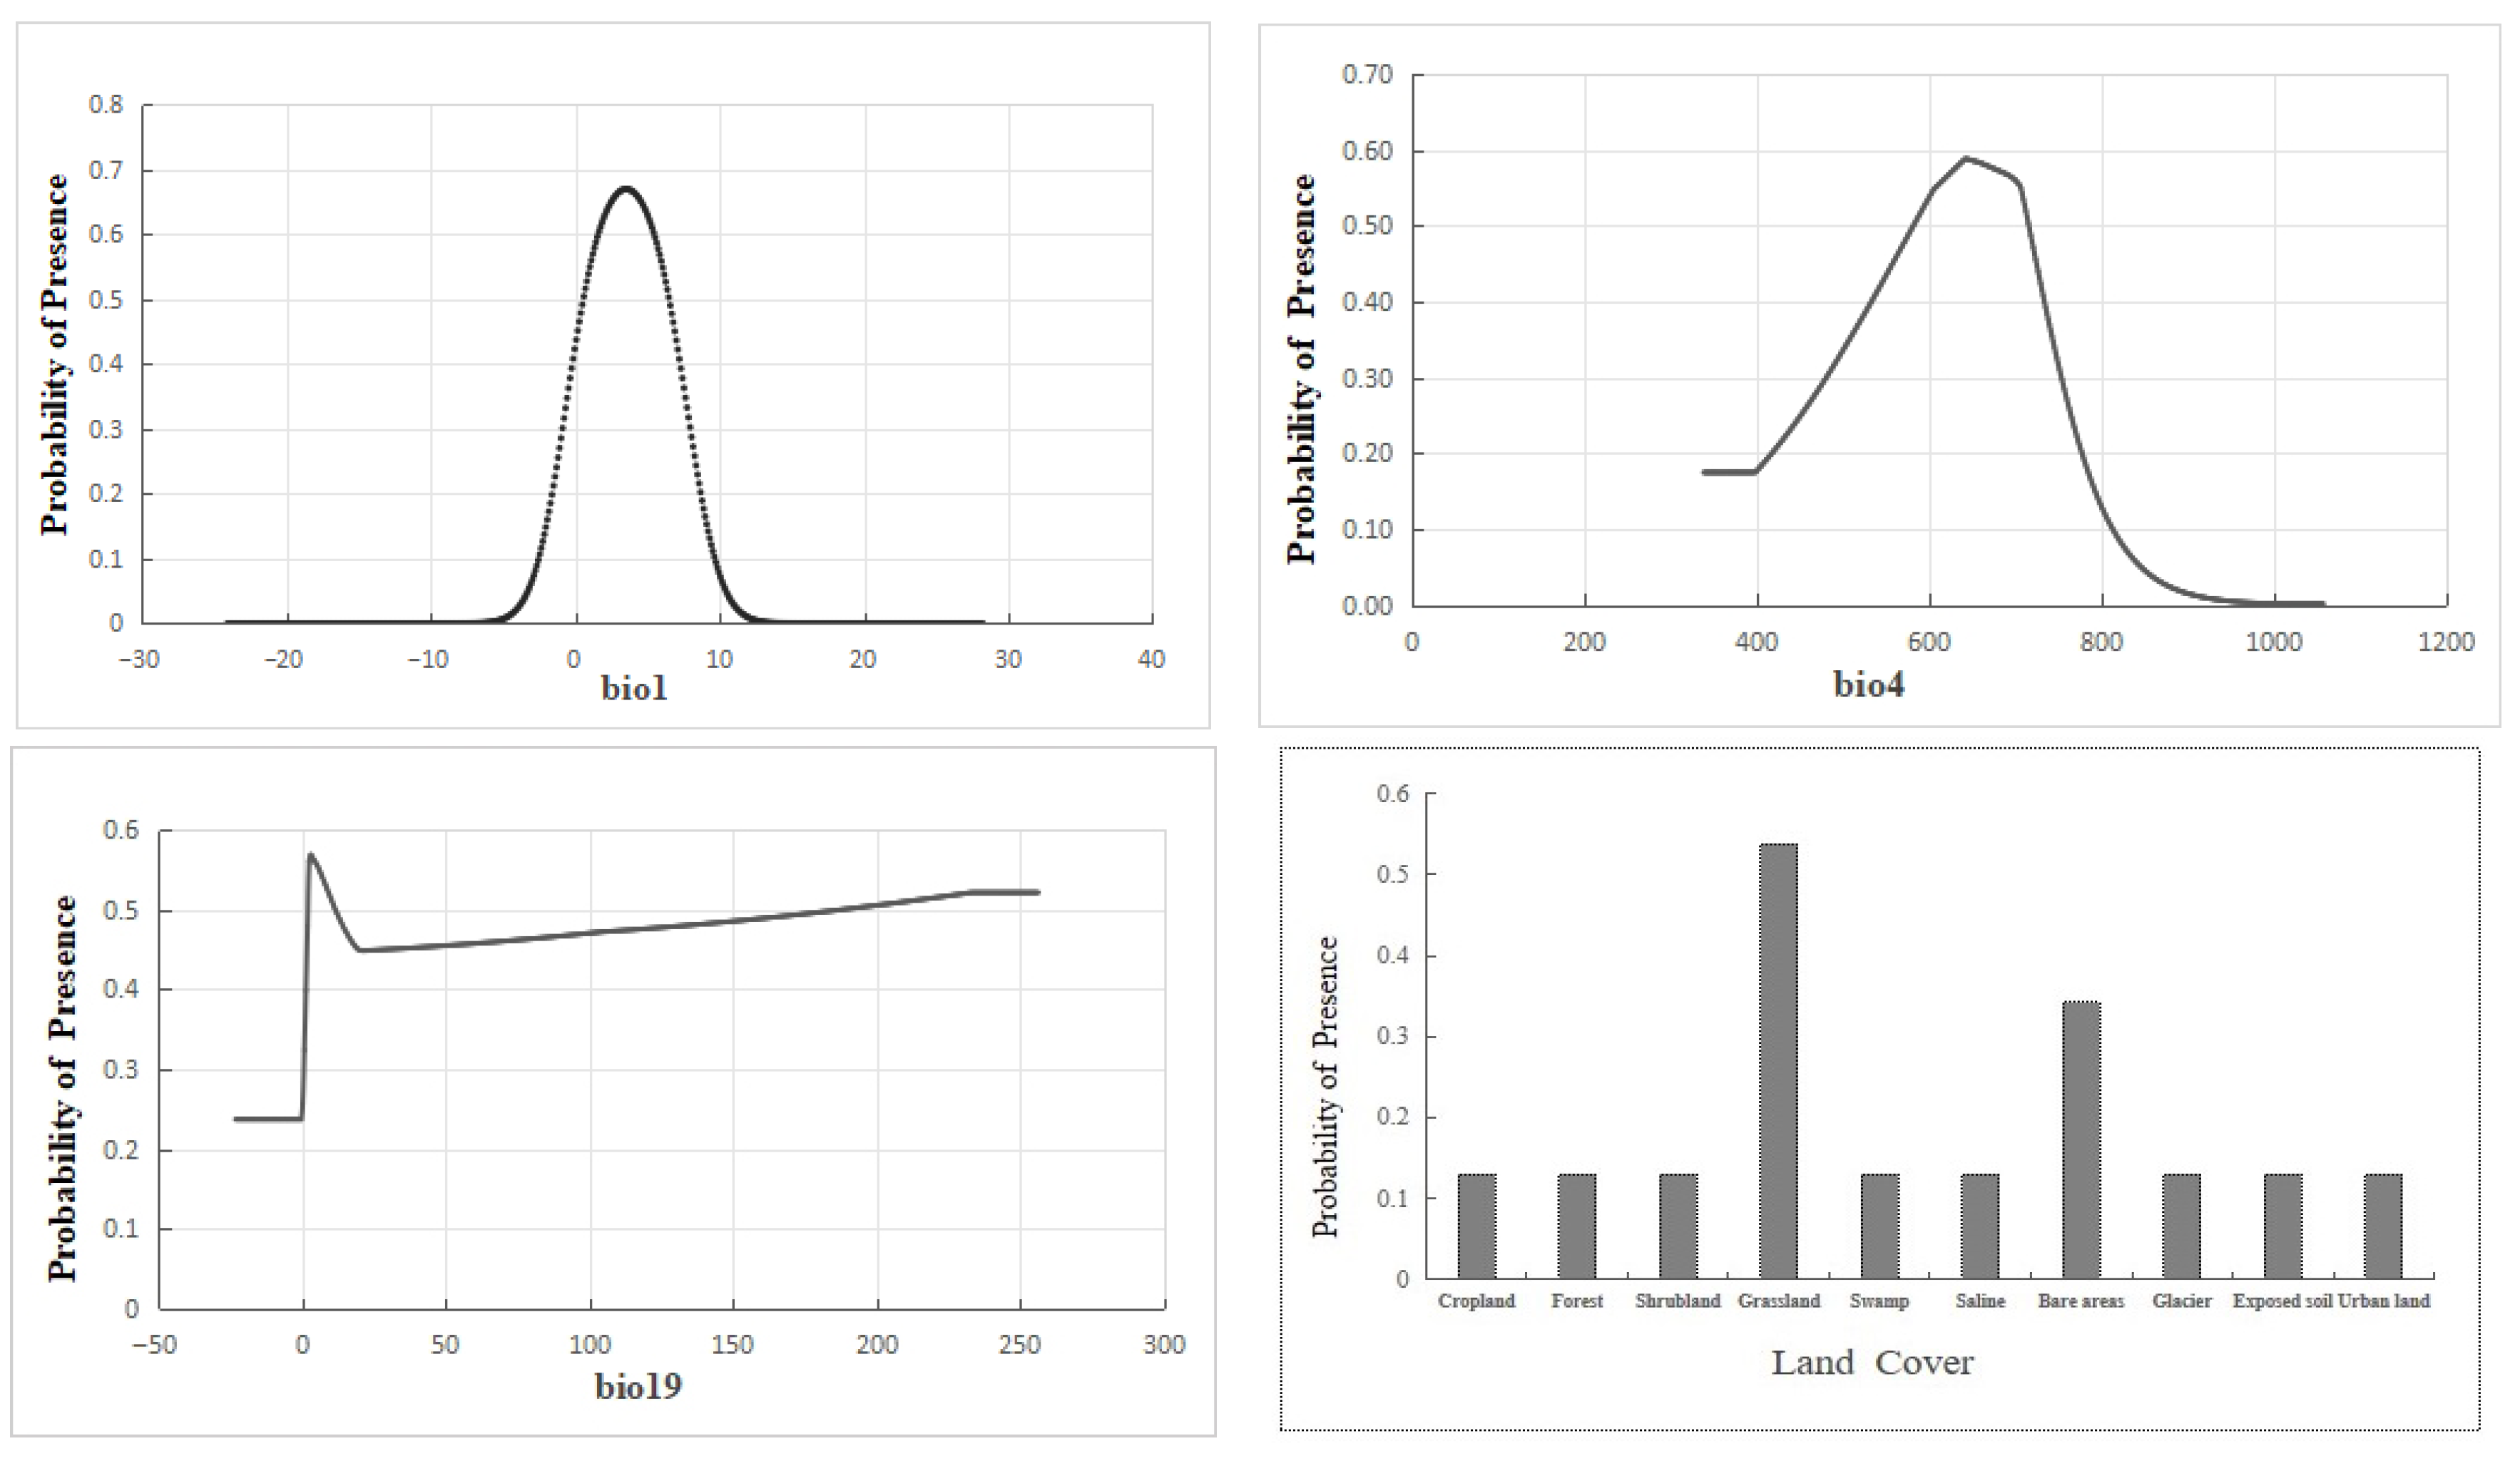
Based on the jackknife test, a total of 9 dominant factors (Table 3) were identified and retained as the environmental variables for predicting the distribution of T. baileyi. Among these variables, temperature seasonality (bio4) emerged as the most significant factor, contributing 41.8% to the distribution. This was followed by precipitation of the coldest quarter (bio19), with a 15.1% contribution, land cover type at 13.8%, and annual mean temperature (bio1), accounting for 10.2%. In total, these top four factors had a cumulative contribution of 80.9%, highlighting their predominant role in shaping the distribution pattern of T. baileyi. The identified factors collectively define the unique ecological niche of T. baileyi. The dominance of temperature seasonality and cold-season precipitation highlights its specific adaptation to geothermal buffering and reveals its inherent vulnerability to environmental changes that disrupt these conditions.
The response curves reflect the relationships between the distribution probability and dominant environmental variables [56]. As shown in Figure 2, the presence probability of T. baileyi varied parabolically with bio1 and bio4. The annual mean temperature (bio1) demonstrated an optimal range of 0.62–6.50 °C, and the temperature seasonality (bio4, standard deviation ×100) showed maximal suitability within 583.26–715.59. Bare areas and sparse herbaceous areas were the land cover types most suitable for T. baileyi survival. The probability of T. baileyi increased with precipitation of the coldest quarter (bio19).

3.2. Comparison of Current and Future Distributions Under Different Scenarios

3.2.1. Comparison of Current and Future Distributions Driven by Landscape Change

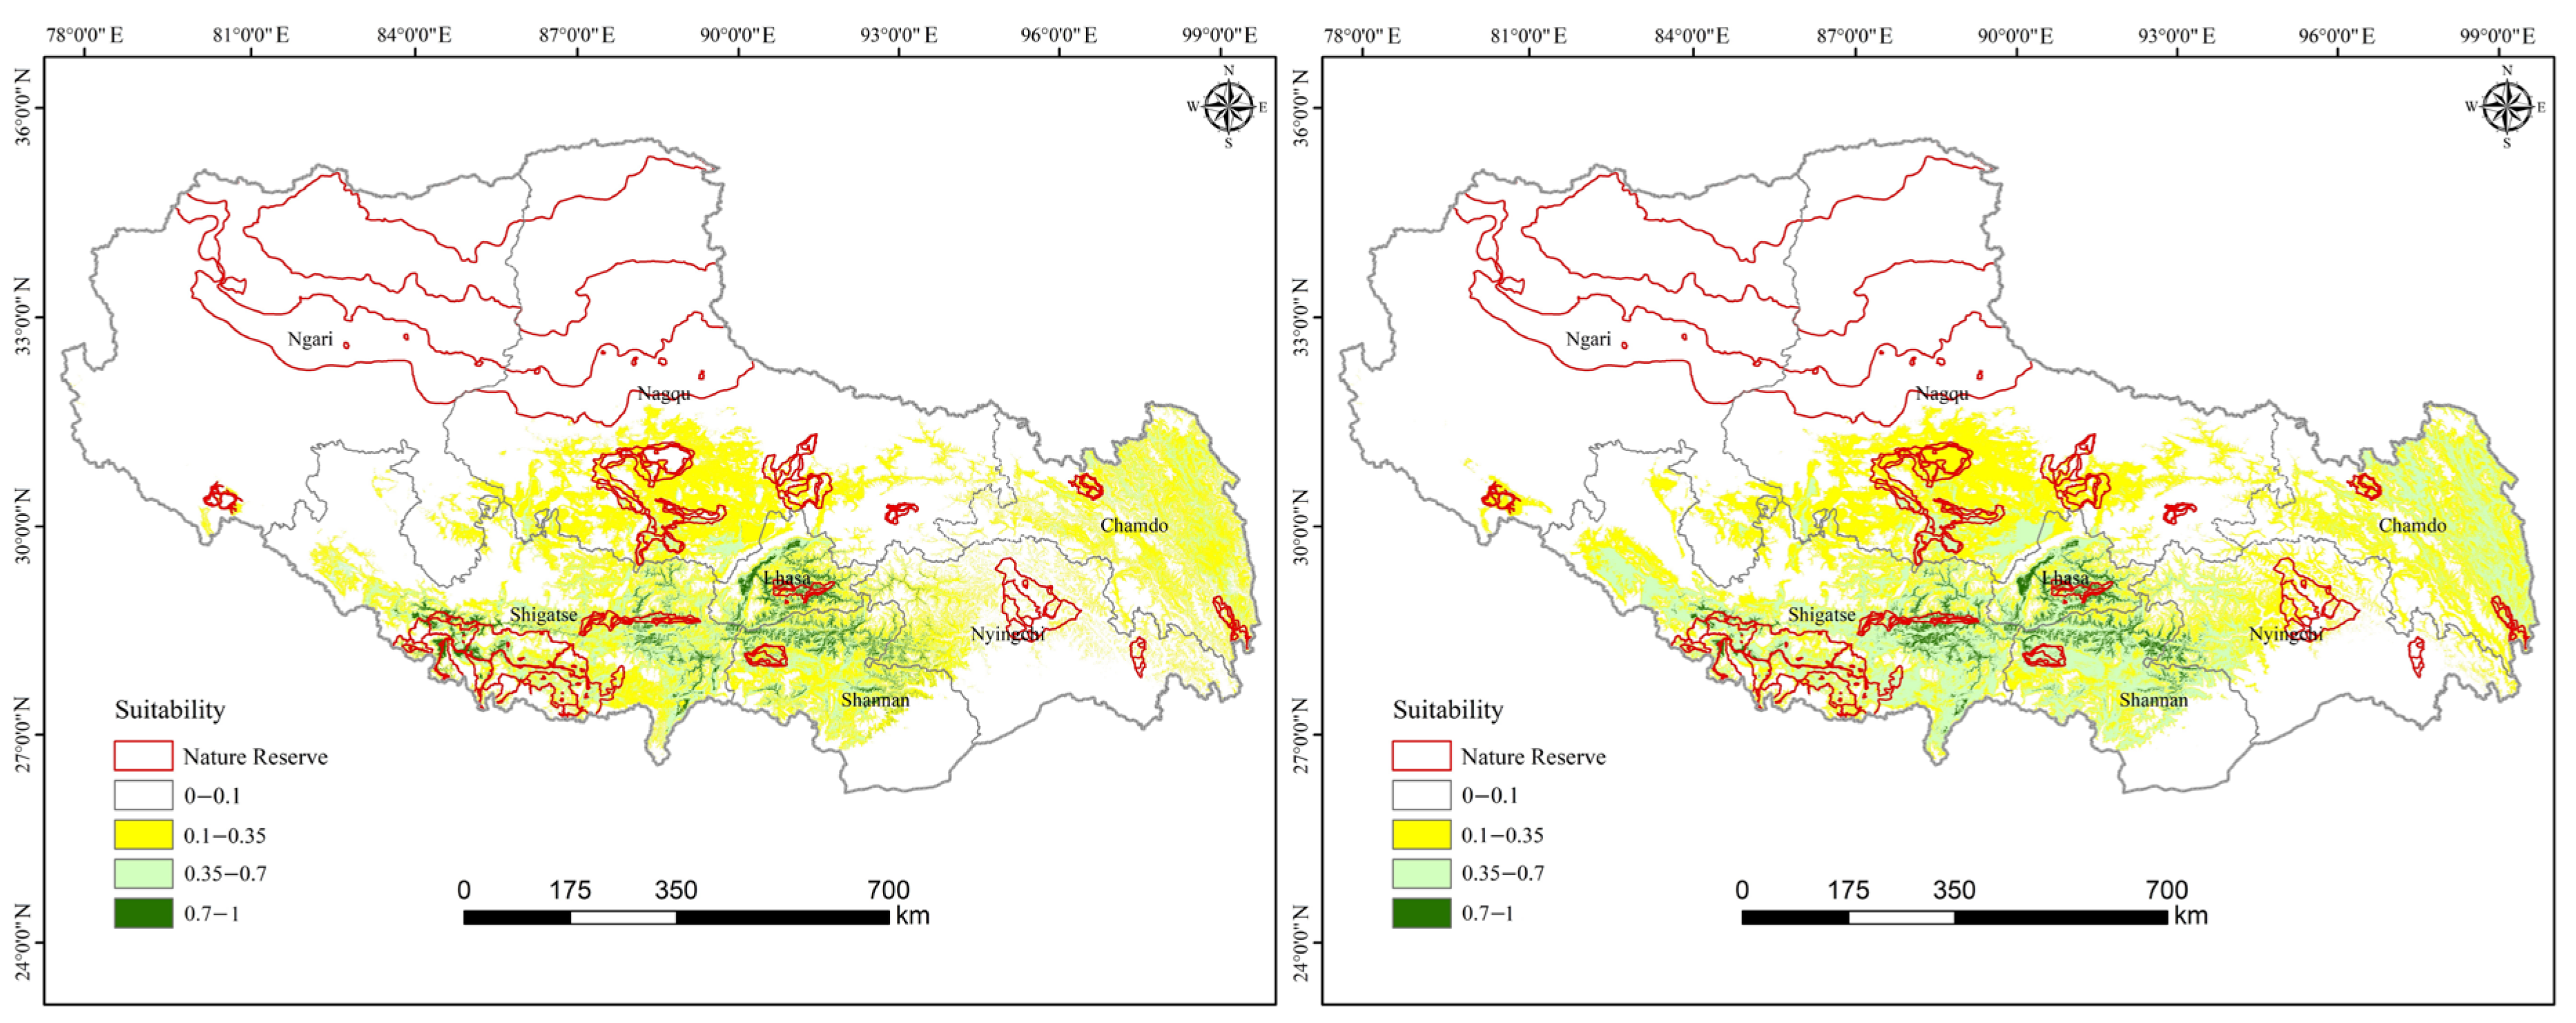
Utilizing the MaxEnt model, the current and future suitable habitat distributions of T. baileyi under the LCO scenario were well simulated (Figure 3). Both training and test AUC values exceeded 0.9, indicating excellent predictive accuracy. Currently, the HSH for T. baileyi was predominantly clustered in areas along the middle and lower reaches of the Yarlung Zangbo River that are rich in geothermal resources, including the cities of Lhasa, Shigatse, Shannan, and Nyingchi, covering approximately 18,403.80 km2 (1.50% of the study area).
Under the LCO scenario, our coupled CA–Markov and MaxEnt modelling framework projected a 5.98% (978.89 km2) reduction in HSH by 2050, decreasing to 15,401.32 km2 (Table 4). This contraction was largely fueled by landscape transformations, with HSH gradually degrading and transforming into medium-suitability habitats during 2020–2050.
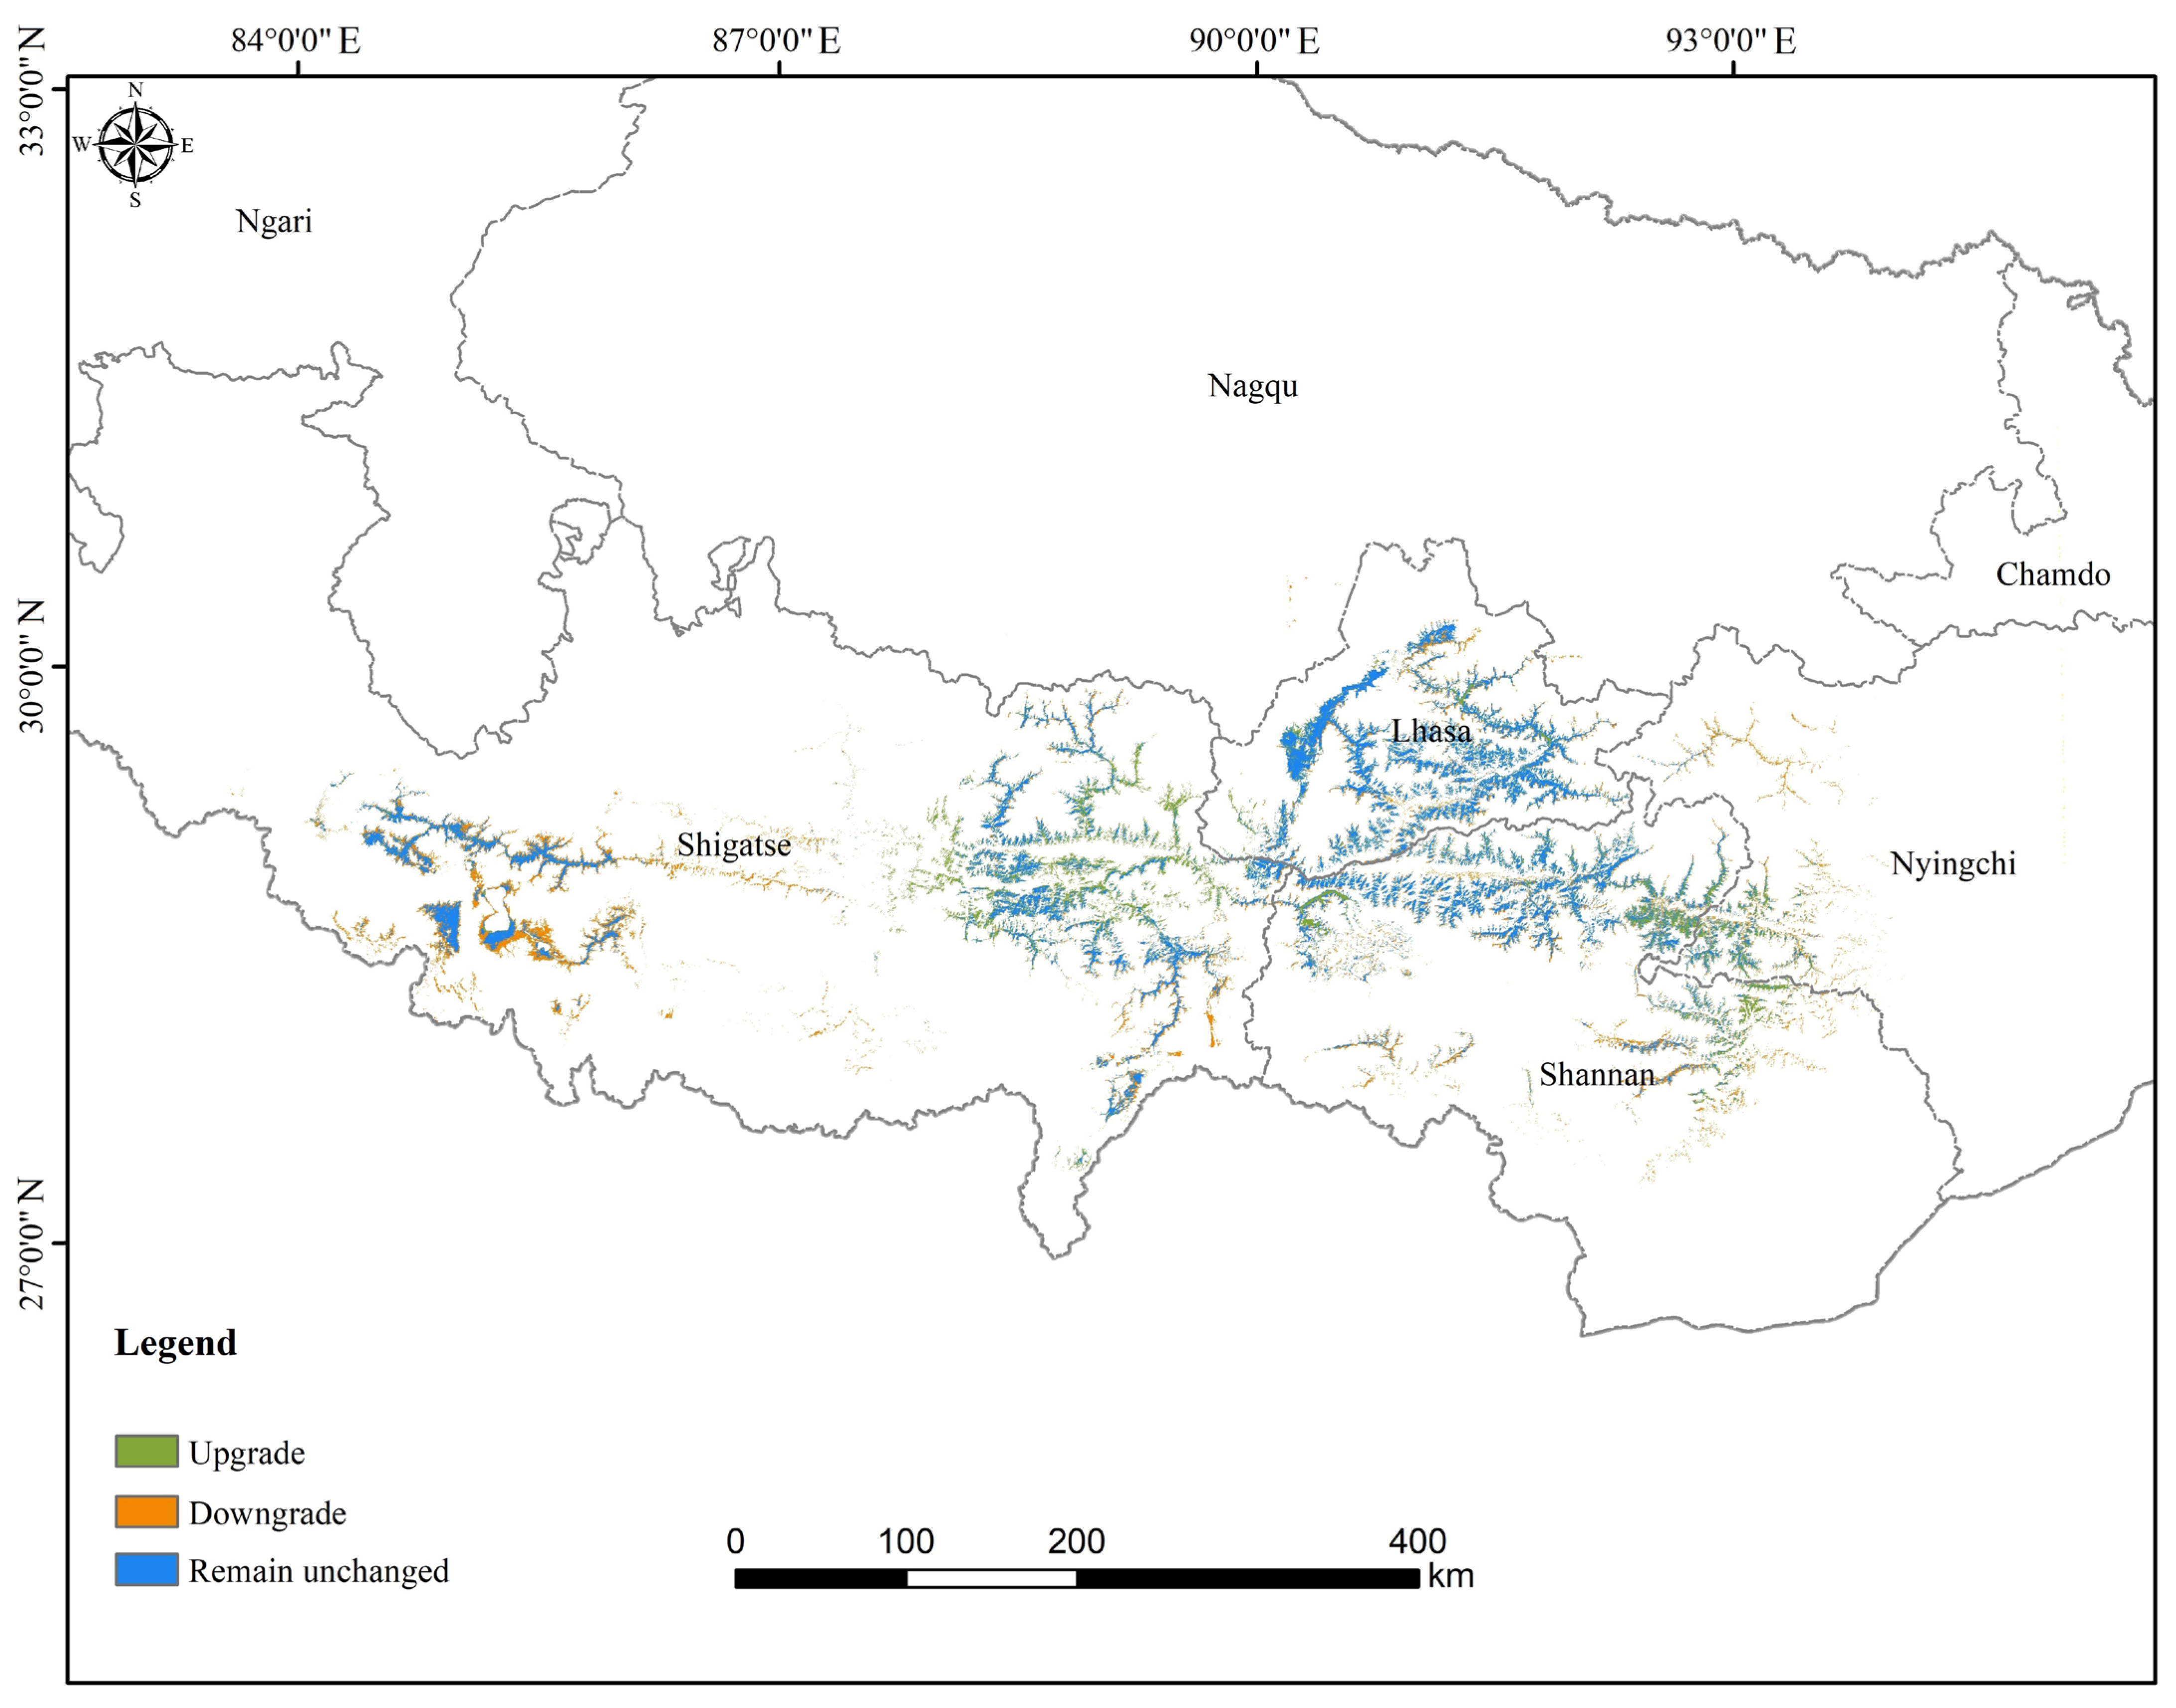
The spatial dynamics of HSHs under the LCO scenario are shown in Figure 4. Results revealed that 34.03% of the current HSH was degraded to medium-suitability habitats, while 4.26% of medium-suitability and 0.40% of low-suitability habitats transitioned upward to HSHs. Under this scenario, 29.85% of future HSHs originated from upward transitions of medium and low-suitability areas, and the remaining 70.15% were persistent HSHs maintained from current conditions. No transitions occurred between HSHs and unsuitable habitats. Spatial patterns (Figure 4) indicate that habitat degradation was concentrated in bare rock and bare soil areas of central Shigatse, whereas habitat improvement occurred primarily in eastern Shigatse and grasslands at the border area between the Nyingchi and Shannan prefectures.

3.2.2. Comparison of Current and Future Distributions Driven by Climate Change

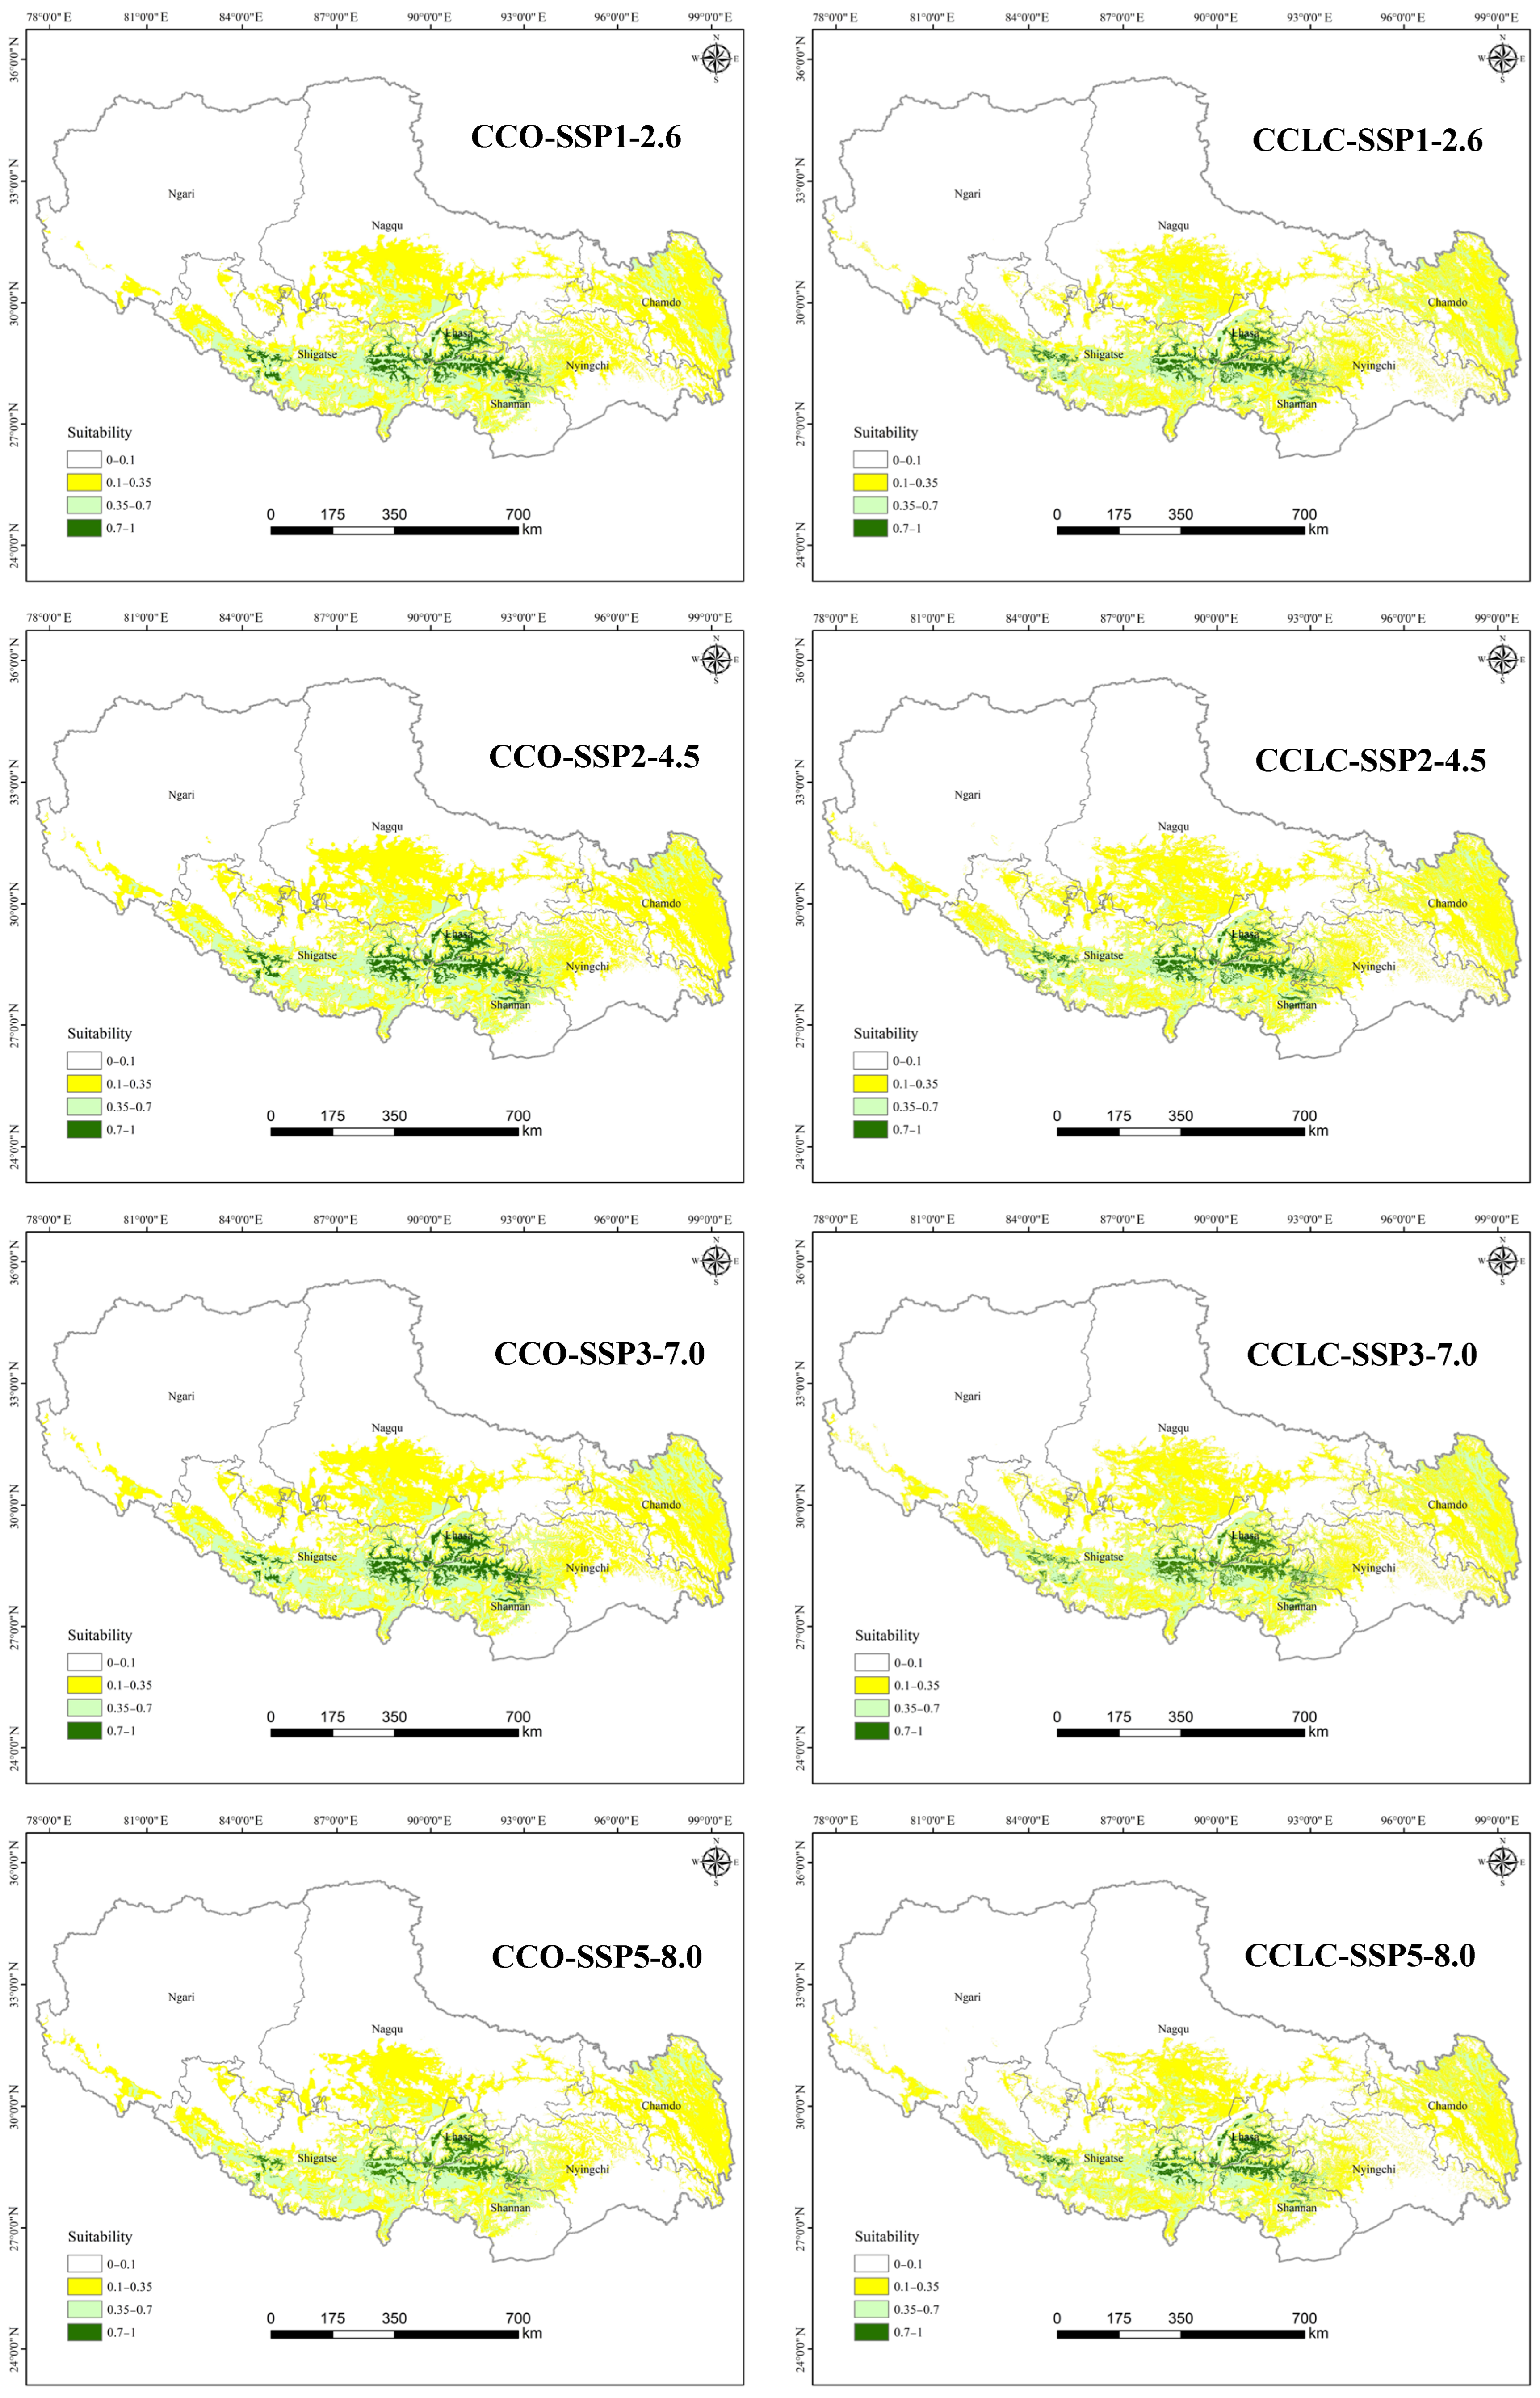
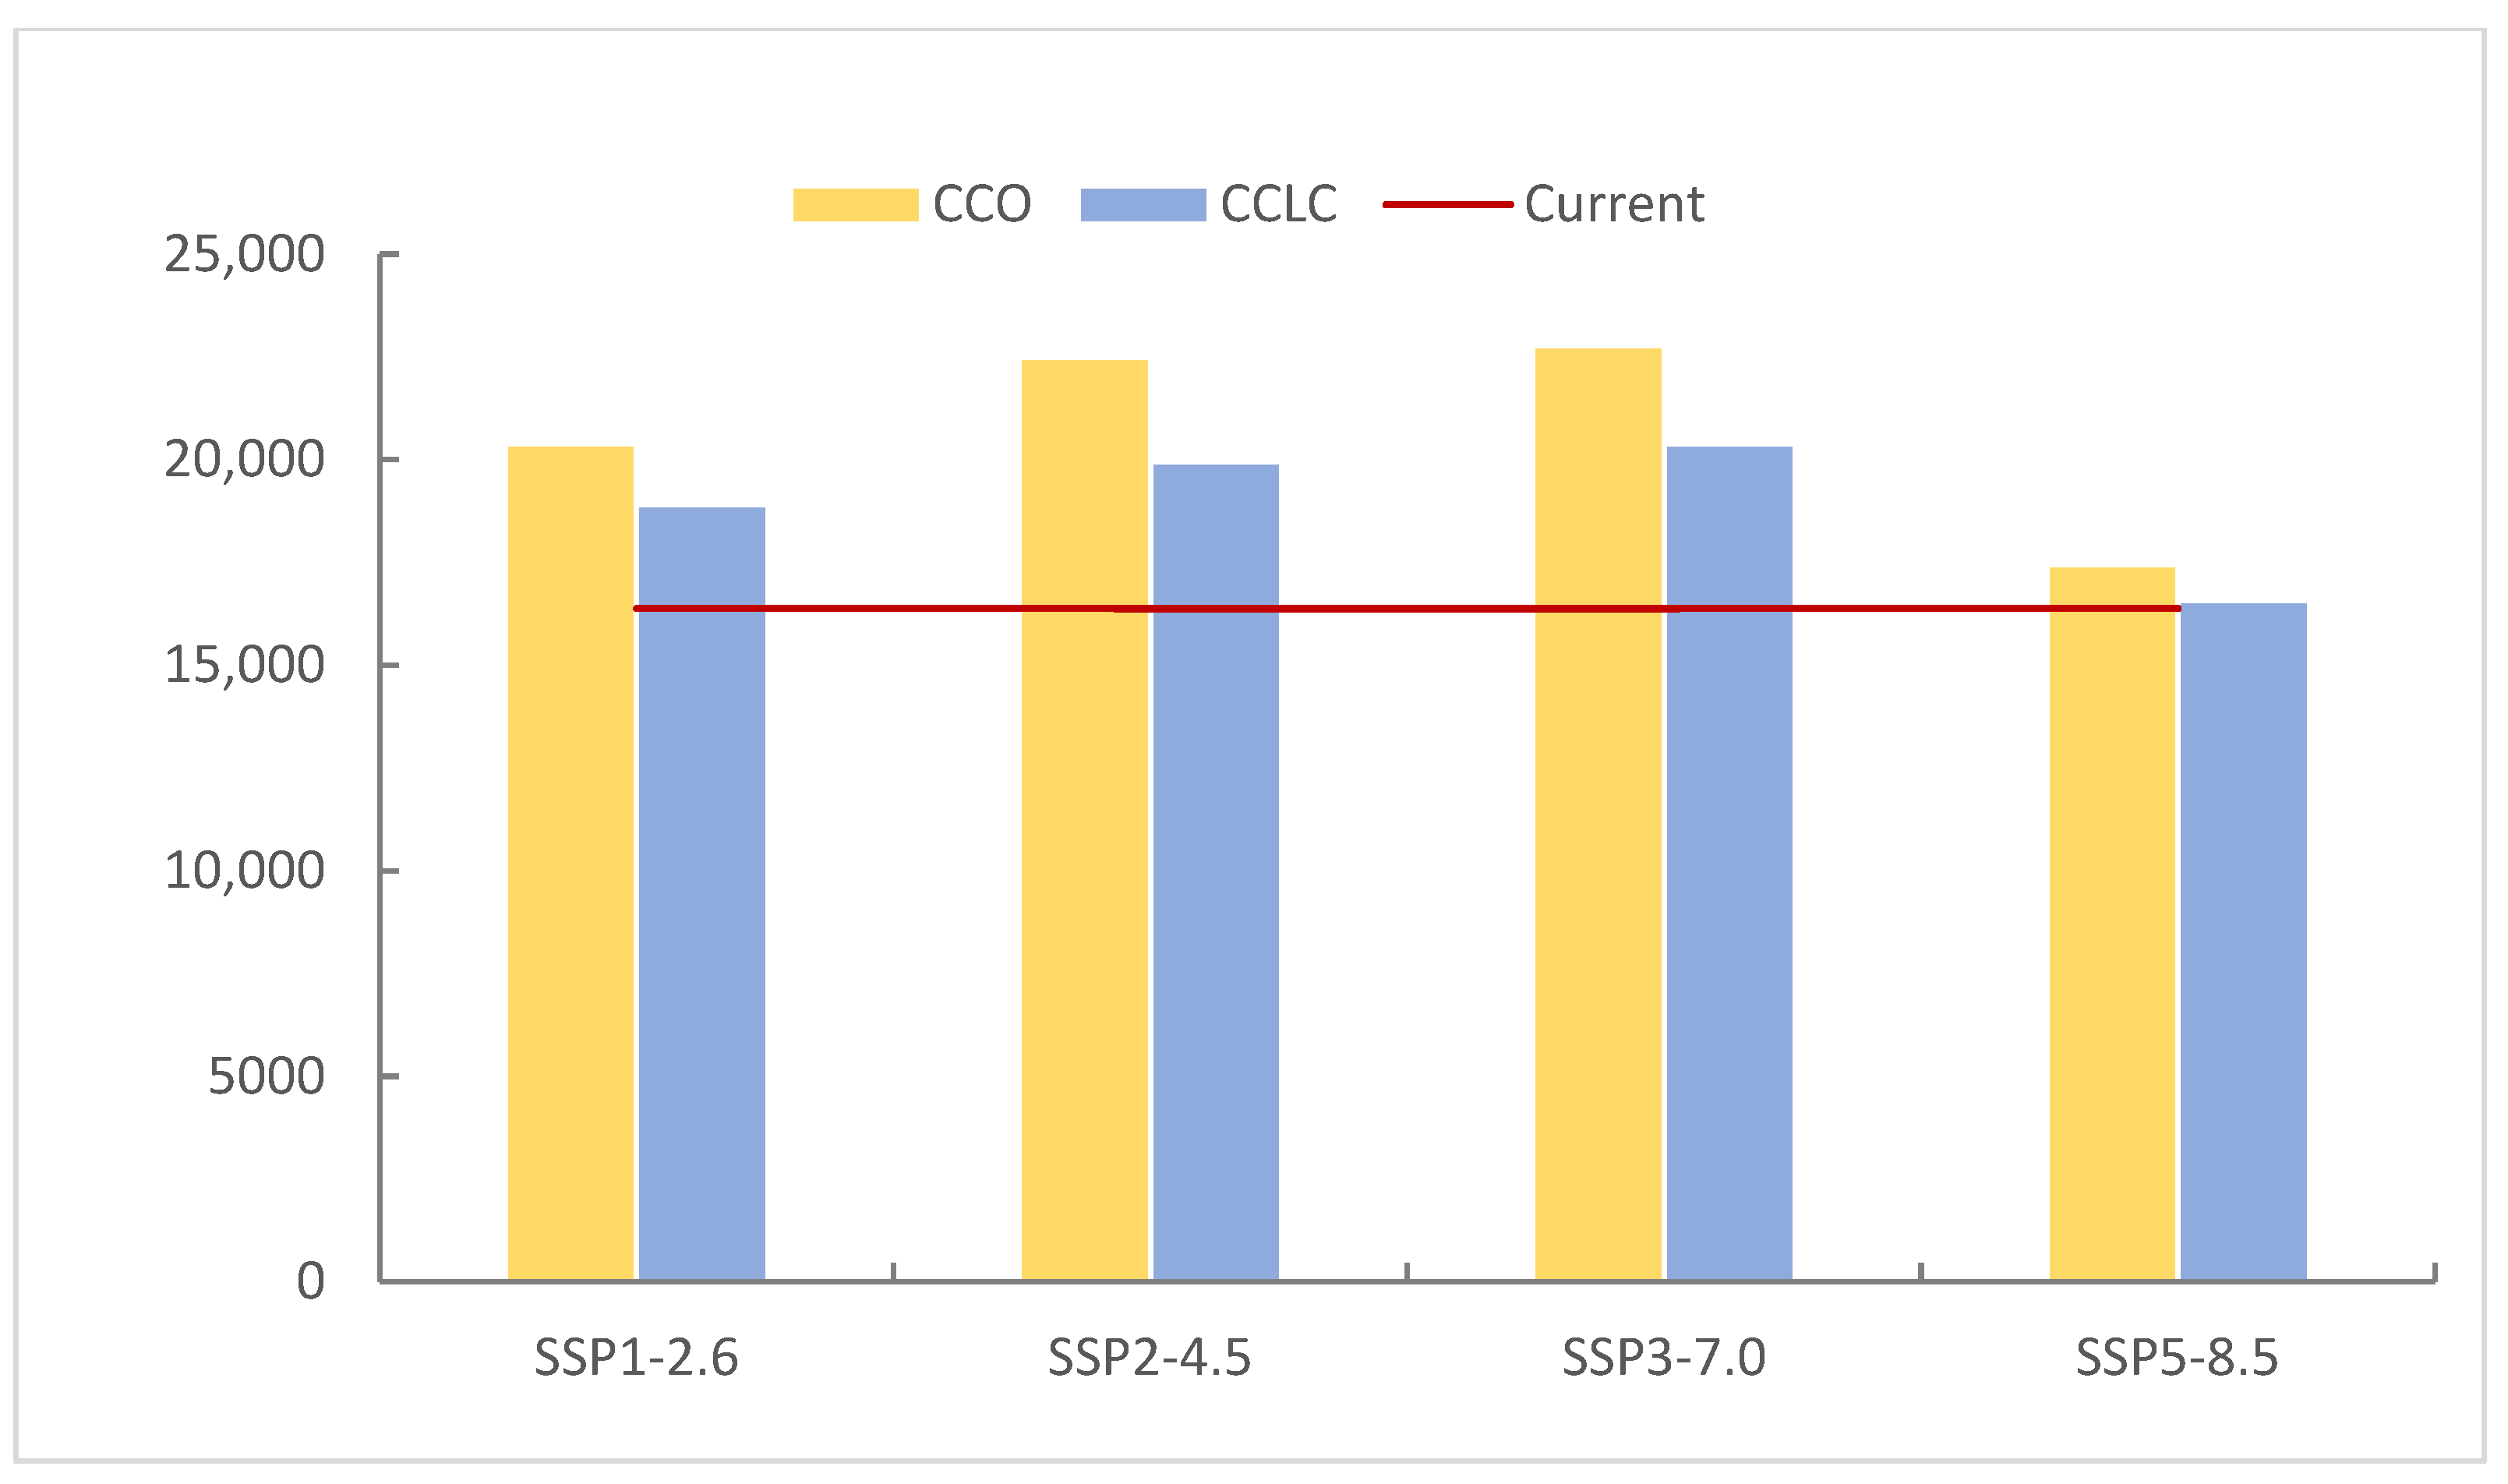
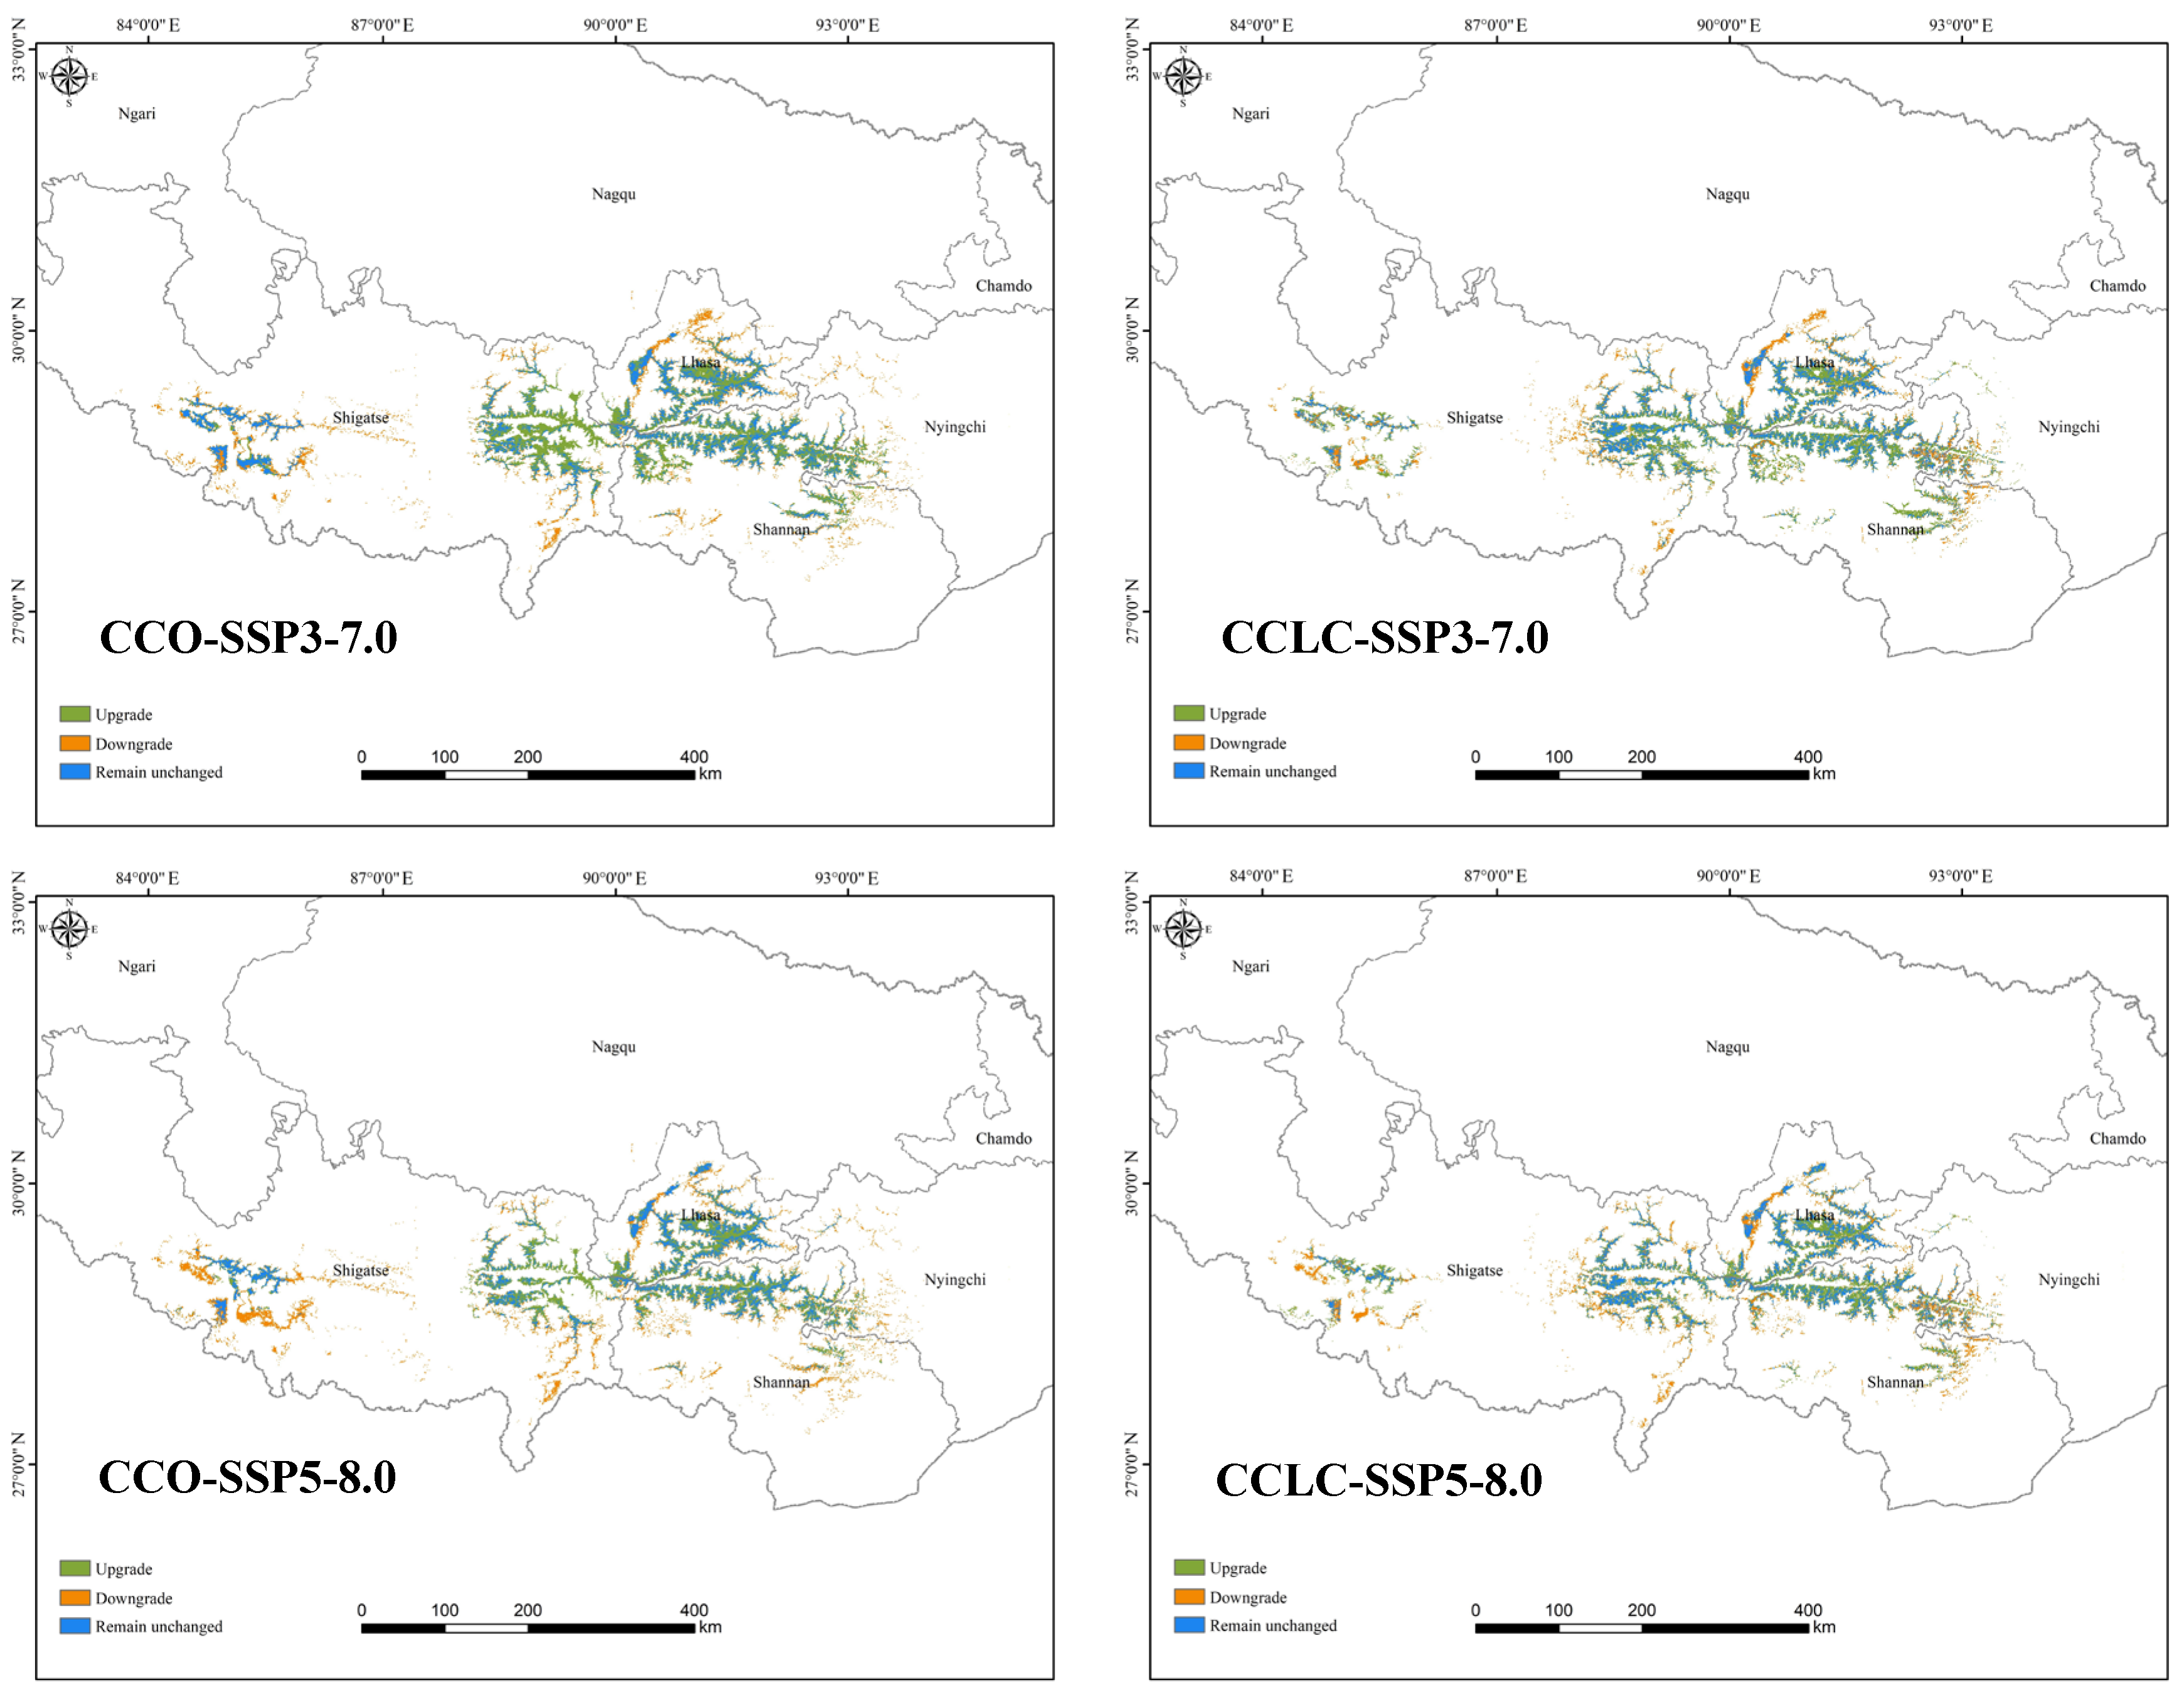
The simulated potential distributions of T. baileyi under four future climate change only scenarios (CCO-SSP1-2.6, CCO-SSP2-4.5, CCO-SSP3-7.0, and CCO-SSP5-8.5) for the 2050s are presented in Figure 5. Simulations revealed an expansion of HSH across all the scenarios relative to the current conditions (2020), with area increases of 24.03% (CCO-SSP1-2.6), 36.84% (CCO-SSP2-4.5), 38.55% (CCO-SSP3-7.0), and 6.00% (CCO-SSP5-8.5) (Table 4). Correlations between future emission levels and the HSH area displayed a convex trajectory, peaking in the CCO-SSP3-7.0 scenario (Figure 6). The HSH area reached its maximum extent of 22,694.66 km2 under the CCO-SSP3-7.0 scenario. However, under the highest emissions scenario (SSP5-8.5), the HSH growth rate drastically decelerated to 6.00% (from 38.55% under SSP3-7.0), and the predicted HSH area decreased to 17,367.78 km2. The medium-suitability habitats exhibited growth across all four climate change scenarios, with projected increases ranging from 2.79% to 20.47% relative to the baseline (2020) conditions. This pattern was mirrored in low-suitability habitats, which also exhibited universal gains under all scenarios, with projected increases of 5.29% to 27.30%. Conversely, unsuitable habitats exhibited an inverse pattern, with area reductions of −1.51% to −7.60% across all scenarios.
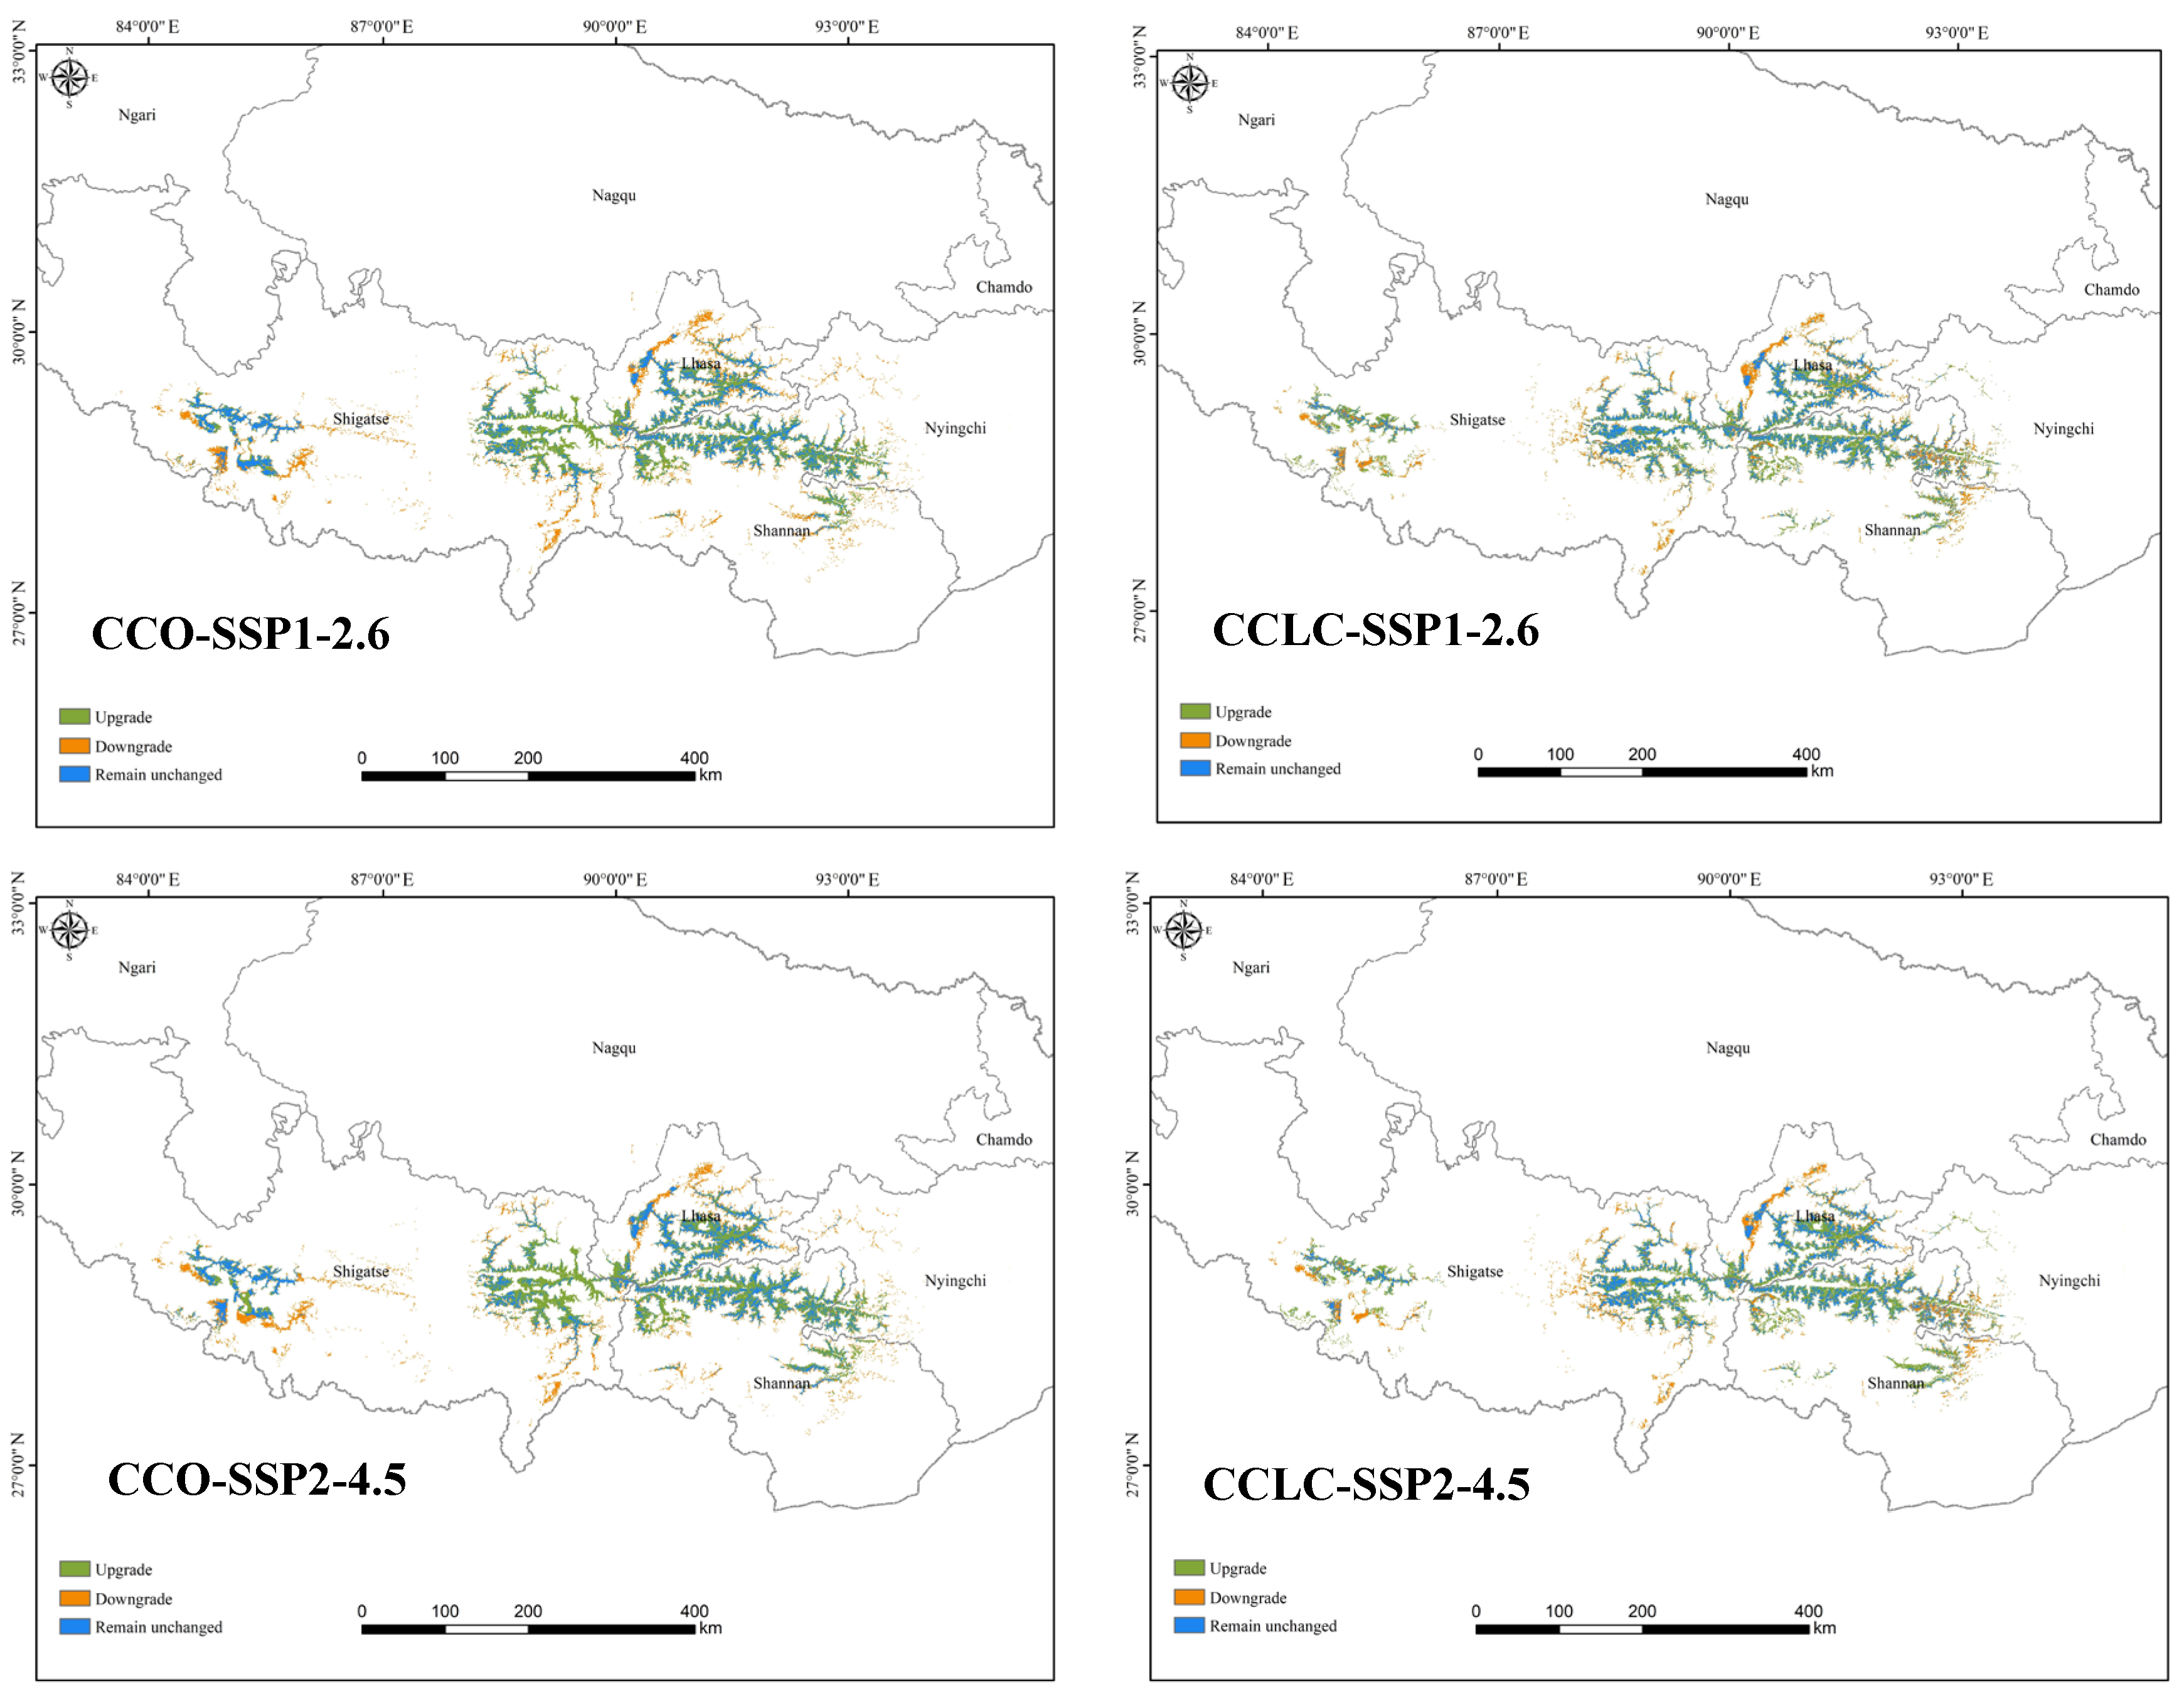
Figure 7 illustrates future HSH compositions under the four future climate change-only scenarios. Under the CCO-SSP1-2.6 scenario, 46.18% of the current HSH degraded to medium-suitability habitats, whereas 10.61% of the medium and 1.06% of the low-suitability habitats upgraded to HSH, forming 56.89% of the future HSH. Under the CCO-SSP2-4.5 scenario, 43.92% of HSH degradation was offset by 12.06% medium- and 1.19% low-suitability improvements, forming 58.47% of the future HSH and resulting in a 36.84% increase in future HSH. Under the CCO-SSP3-7.0 scenario, 43.32% of HSH loss was balanced by 12.20% of the gains in medium- and 1.22% of the gains in low-suitability habitats, forming 58.54% of the future HSH and resulting in a 38.55% increase in the future HSH. Under the CCO-SSP5-8.5 scenario, 51.44% of the current HSH degraded to lower-suitability habitats, whereas 9.06% of the medium- and 0.62% of the low-suitability habitats transitioned to HSH, forming 53.68% of the future HSH and resulting in a 6.03% increase in the future HSH. A key finding is the substantial transformation of the habitat landscape, characterized by concurrent degradation of current HSH and upgrades from lower-suitability classes. The overall increase in the total HSH area in the future scenarios masks this significant internal redistribution, indicating a future of heightened habitat turnover.

3.2.3. Comparison of Current and Future Distributions Driven by Both Climate Change and Landscape Change

Under these combined CCLC scenarios, the trends in HSH area changes mirrored those under the CCO scenarios. All four future emission scenarios exhibited increases in HSH relative to the current conditions (Figure 6), with area increases of 14.90% (CCO-SSP1-2.6), 21.36% (CCO-SSP2-4.5), 24.00% (CCO-SSP3-7.0), and 0.74% (CCO-SSP5-8.5). The gained area first increased and then decreased with increasing emission intensity scenarios, peaking in the CCO-SSP3-7.0 scenario before sharply declining under the CCO-SSP5-8.5 scenario, indicating a climatic optimum threshold. The HSH area peaked at 20,311.60 km2 under the CCO-SSP3-7.0 scenario and then decreased to 16,500.78 km2 under the CCO-SSP5-8.5 scenario, which was only 120.57 km2 larger than the current HSH area.
Despite consistent trends in habitat expansion, the comparative analysis between climate change-only (CCO) and combined climate–land-cover change (CCLC) scenarios revealed that HSH areas under the CCLC scenarios were consistently smaller than those under the CCO scenarios across all four future climate scenarios (SSP1-2.6, SSP2-4.5, SSP3-7.0, and SSP5-8.5) (Figure 6). That is, landscape changes attenuated the climate-driven habitat gains for T. baileyi. The effect of landscape change reduced potential climate benefits by 5.29–15.48%, underscoring the need for integrated management policies that address both climatic and anthropogenic pressures.
Habitat suitability transitions and future HSH compositions under the CCLC scenarios were analysed (Figure 7). Under the CCLC-SSP1-2.6 scenario, 43.92% of the current HSHs degraded to lower-suitability habitats, whereas 6.69% of the medium- and 0.04% of the low-suitability habitats upgraded to HSHs, forming 53.87% of the future HSH. Under the CCLC-SSP2-4.5 scenario, 42.16% HSH degradation was offset by 7.21% medium- and 0.04% low-suitability improvements, forming 54.95% of the future HSH, resulting in a 21.36% increase in future HSH. Under the CCLC-SSP3-7.0 scenario, 40.55% of HSH loss was balanced by 7.34% medium- and 0.03% low-suitability habitat gains, forming 54.69% of the future HSH, resulting in a 24.00% increase in future HSH. Under the CCLC-SSP5-8.5 scenario, 46.77% of the current HSH degraded to lower-suitability habitats, whereas 5.46% of the medium- and 0.02% of the low-suitability habitats transitioned to HSH, forming 50.06% of the future HSH. The results imply that medium-suitability habitat contributed the most upgradation to HSH, and the transition from the low-suitability habitat to HSH remained minimal (<0.05%) across the scenarios.

3.3. Centroid Shifts Under Different Scenarios

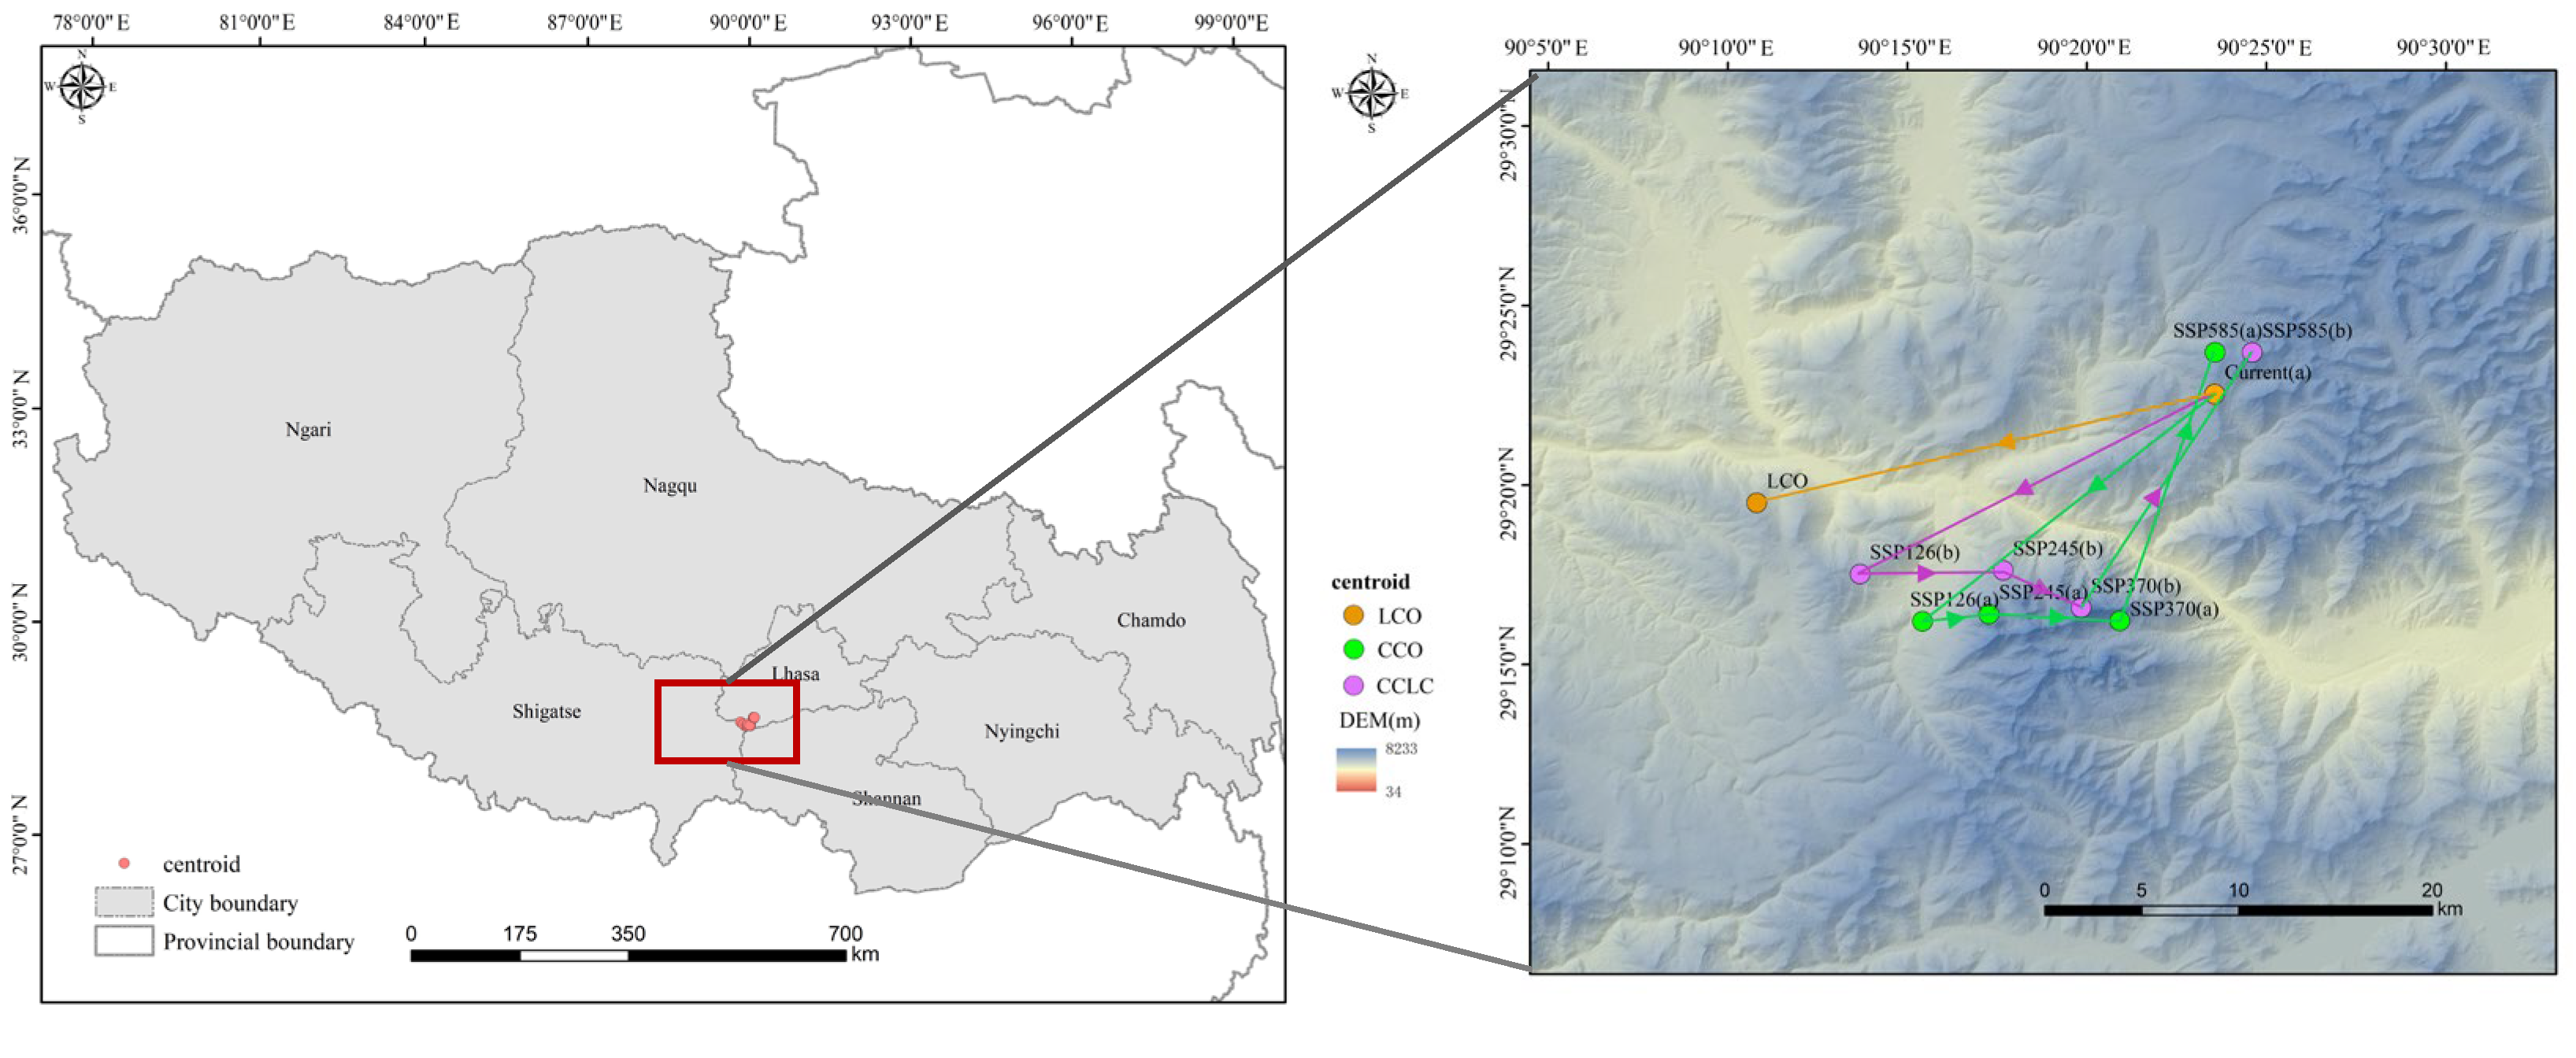
The distribution centroid shift serves as a key indicator of spatiotemporal habitat redistribution for species under environmental changes. As shown in Figure 8, the current distribution centroid of the T. baileyi HSH was located in southwestern Lhasa city (E90.39, N29.37), with an altitude of 5167 m.
Under the LCO scenario for the 2050s, accounting for only the influence of landscape changes, the centroid shifted southwestward, with the latitude lower than the current centroid by a distance of 21.48 km. Notably, this shift was also associated with a descent of 566 m in elevation, adding a critical dimension to the habitat change.
Under the CCO-SSP1-2.6 scenario for the 2050s, the centroid shifted southwestward by a smaller distance of 17.63 km to a lower elevation of 4361 m, indicating a potential for range expansion into low-elevation areas under mild warming. As emission levels increased, the centroid generally moved eastward under the CCO-SSP2-4.5 and CCO-SSP3-7.0 scenarios, shifting 3.02 km and then 5.92 km to the eastern part of Shigatse at elevations of 4679 m and 5567 m, respectively. In contrast, under the CCO-SSP5-8.5 scenario, the centroid moved northward to higher latitudes in Lhasa city, rising to 5609 m—a pattern indicative of a forced range contraction, in which the species was squeezed into higher elevations to escape extreme heat. Overall, the centroid’s elevation rose with increasing emission levels and exceeds the current centroid elevation under the CCO-SSP3-70 scenario.
Under the CCLC scenarios for the 2050s, combining both landscape change and climate change, the trend of centroid shifts was similar to that under the CCO scenarios but with relatively higher latitudes by distances of 18.48 km, 6.46 km, 4.01 km, and 15.24 km. The centroid’s elevation followed a ‘down-then-up’ trajectory with increasing emission levels (rising from 4718 m under the CCLC-SSP1-26 scenario to 5553 m under the CCLC-SSP3-70 scenario and then down to 5326 m under the CCLC-SSP5-85 scenario) and exceeded the current centroid elevation under the CCLC-SSP3-70 scenario.
In summary, with the exception of the CCO-SSP5-8.5 and CCLC5–8.5 scenarios, under which the centroids of T. baileyi shifted northwards to higher latitudes, all the other scenarios exhibited a predominant southwestward migration of centroids toward lower latitudes. This latitudinal shift was paralleled by a complex elevational trajectory: initial descent under low emissions signaled potential low-elevation expansion, whereas the subsequent ascent under intermediate and high emissions—particularly exceeding the current centroid elevation under SSP3-7.0 scenarios—reflected a forced upward contraction as thermal conditions deteriorated. Furthermore, the centroids exhibited progressive eastwards shifts with increasing emission levels until they surpassed a critical climatic threshold under the SSP5-8.5 scenario, beyond which the centroids reversed in direction to migrate northwards.

4. Discussion

4.1. Effects of the Critical Environmental Variables

The distribution of T. baileyi is tightly regulated by multiple environmental factors. Its distribution exhibits a unimodal response to both annual mean temperature and temperature seasonality, with an optimal range within the intervals (bio1: 0.62–6.50 °C; bio4: 583.26–715.59). This pattern highlights its strong dependence on the unique thermal regime of the Tibetan Plateau. The extreme winter cold on the plateau (often below −10 °C) poses a significant physiological challenge for an ectotherm. Consequently, T. baileyi is obligately dependent on geothermal springs, utilizing them as critical thermal refugia to maintain body temperature and survive periods of cold stress [19]. This behavioral thermoregulation is a key ecological adaptation enabling its persistence in this high-altitude environment.
The results indicate that temperature seasonality is the most critical factor influencing the distribution of T. baileyi. This suggests that although the species has evolved an efficient thermal-sensing system to detect and respond to ambient temperature seasonality, the substantial contribution of this factor (41.8%) implies that any changes in temperature seasonality, such as those caused by climate change, could have a significant impact on the habitat suitability and distribution range of the species.
The second most important factor, precipitation of the coldest quarter (15.1%), highlights the dependency of T. baileyi on specific moisture conditions during the coldest period of the year. This could be related to the availability of prey, species thermoregulation requirements, or the need for suitable micro-habitats during this season [57]. The primary prey of T. baileyi include Nanorana parkeri, Triplophysa, and Schizothorax oconnori, which are found in streams, rivers or still ponds [58]. The precipitation of the coldest quarter significantly impacts foraging efficiency for these prey species by constraining the snake’s activity and reducing prey availability. Low temperatures and snow cover limit the thermal opportunities for T. baileyi to forage, while simultaneously making its prey less active and accessible, thereby creating a compound effect that severely limits successful foraging during this critical period.
Land cover (13.8%) also played a notable role in determining the distribution of the species. This may be because these snakes have a strong preference for habitats (sparse grassland and bare rock) with hot springs as an adaptive strategy to climate change [18,22]. The commercial exploitation of hot springs and conversion of natural sparse grassland not only directly eliminates habitat but also disrupts the temperature and precipitation regimes critical for T. baileyi. This degradation leads to smaller, more isolated sub-populations with reduced genetic exchange and increased extinction risk [59]. Thus, effective conservation must proactively regulate land-use changes in key areas to maintain landscape connectivity and habitat quality [18].
The cumulative contribution of these top four factors reaching 80.9% suggests that conservation strategies for T. baileyi should prioritize areas where these environmental conditions are favourable and relatively stable. It also emphasizes the need for monitoring and understanding the interactions between these factors, as well as their potential changes due to anthropogenic activities and climate change, to ensure the long-term survival and distribution of the species. Additionally, further research could be conducted to investigate the specific mechanisms through which these factors affect T. baileyi, such as their impact on its behavior, physiology, and ecological interactions, which would provide more insights into the species’ ecological requirements and conservation needs.

4.2. Changes in Suitable Habitats Under Different Scenarios

The simulated changes in habitat suitability for T. baileyi under future scenarios reveal critical insights into the vulnerability and adaptive capacity of this species. Across all future scenarios, whether land-use change is incorporated or excluded, the unimodal response of HSH—peaking at SSP3-7.0 before declining sharply under SSP5-8.5—suggests a specific climatic optimum under appropriate warming. This pattern aligns with the complex effects of warming on ectotherms, where initial benefits may reverse into severe stresses [60]. The sharp decline under the highest emission scenarios (CCO scenarios: from 38.55% to 6.03%; CCLC scenarios: from 24.00% to 0.74%) underscores a fundamental shift in environmental suitability, likely driven by climate variables exceeding the species’ ecological niche limits. It has been found that exposure to extremely warm conditions may compel snakes to reduce daytime activity to avoid heat stress, thereby curtailing opportunities for foraging and reproduction. This is particularly threatening to species already inhabiting colder environments [61]. This highlights the vulnerability of T. baileyi to extreme climate change, regardless of landscape considerations.
Although the widespread expansion of high-, medium- and low-suitability habitats across almost all scenarios that consider future climate changes may suggest short-term adaptive potential, the underlying ecological processes and long-term conservation challenges require deeper exploration. Warming may “habitatize” previously marginal cold zones, such as alleviating winter physiological stress due to rising minimum temperatures, so that some medium- and low-suitability habitats could be upgraded to HSHs in the future. Notably, the universal decrease in unsuitable area (−1.51% to −7.60%) implies that climate change is restructuring rather than simply reducing or increasing the species’ fundamental niche.
Our projections reveal that future landscape changes are expected to reduce HSH for T. baileyi by 4.99–11.31% compared to a climate change-only future (Table 4). The offset was most severe under the SSP2-6.5 scenario, where HSH expansion (relative to the current conditions) plunged from +36.84% (CCO) to +21.36% (CCLC). This indicates that human activities, particularly geothermal exploitation, can suppress the transition from medium-suitability habitat to HSH, thereby curtailing potential habitat gains. For conservation planning, this underscores the critical need to explicitly regulate land-use changes, especially geothermal development, within and around current high- and medium-suitability habitats to secure the species’ adaptive capacity under global environmental change. The near absence of low-to-high-suitability habitat transitions under the CCLC scenarios (all smaller than 0.05%), compared with 0.62–1.22% under the CCO scenarios, reveals a critical constraint imposed by human activities, as well as stringent requirements of T. baileyi for the habitat geothermal environment. Such constraints likely arise from human activities such as urbanization and road construction, which degrade habitats and fragment landscapes [62].

4.3. Conservation Implications

The overlap between the national nature reserves and the varying suitability levels of T. baileyi habitats was computed (Figure 3). The area of HSH encompassed by the national nature reserves was 3459.82 km2, which accounted for only 21.12% of the simulated HSH, suggesting that the most critical habitats have not been adequately protected. The protected HSHs were distributed mainly in the Black-necked Crane National Nature Reserve in the middle reaches of the Yarlung Zangbo River. The core distribution of the hot-spring snake genus (Thermophis) encompasses the Yarlung Zangbo Suture Zone and the central Hengduan Mountains [15,22]—a distribution tightly linked to geothermal springs, an adaptation forged by the Tibetan Plateau’s uplift [25]. Critically, all three Thermophis species (T. baileyi, T. shangrila, and T. zhaoermii) are listed as Endangered (EN) on the IUCN Red List of Threatened Species due to their documented population declines, with their occurrence in nature reserves still unconfirmed [15,20,23]. Therefore, this assessment highlights a substantial gap in the current conservation network, underscoring the imperative to re-evaluate and strategically expand protected areas to fully encompass the core geothermal habitats essential for the genus’s survival.
Our field surveys found that this snake exists amidst widespread habitat modification, as nearly all hot springs have been altered or utilized for human purposes, leading to the degradation of key nesting sites and a loss of wetland area. Critically, our study indicates that the population is likely to decline under the pressures of landscape change or extreme climate warming. Ex situ conservation has proven extremely challenging and costly; our attempts to maintain the species in captivity at Tibet University and in facilities in inland China have all ended in failure. Given the widespread habitat degradation and the infeasibility of captive breeding, we conclude that reinforcing in situ conservation is urgently needed.

5. Conclusions

As the highest-altitude distributed reptile distributing only in the Tibetan Plateau, China, T. baileyi is an ideal species for studying the effects of global changes on high-altitude ectotherms. This study presented the first quantitative estimate of the global population size and predicted the distribution range of the snake by integrating empirical field data with mechanistic habitat modeling under multiple future scenarios.
We developed a novel multi-scenario framework to disentangle the independent and synergistic impacts of climate change and landscape change on its habitat suitability. Our results indicate that strengthening the protection of critical habitats for T. baileyi and adjusting conservation strategies to address the challenges posed by synergistic extreme climate and land cover change threats are essential.
On the one hand, more HSHs, especially areas around critical geothermal springs (Supplemental Table S4), need to be included in nature reserves. These micro-habitats support most of breeding populations and buffer thermal extremes [22]. On the other hand, although appropriate warming (SSP1-2.6 to SSP3-7.0) would expand HSHs, extreme emissions (SSP5-8.5) would yield nearly zero net gains. This finding underscores the need for dual mitigation—curbing emissions while regulating geothermal development. In addition, to mitigate habitat fragmentation and facilitate climate-driven range shifts, we urgently propose constructing climate-adaptive wildlife corridors along the projected migration paths, incorporating underpasses (box culverts) in roadkill hotspots caused by vehicular collisions. Since local communities traditionally uphold sacred reverence and protection customs toward snakes, building artificial snake dens and implementing community co-management to buffer anthropogenic pressures would be a culturally aligned and effective conservation strategy.
A recognized limitation of this study is the potential spatial bias in our species occurrence data. Records are inevitably clustered around accessible geothermal sites and historical survey localities, which may lead to an underestimation of the species’ fundamental niche and an overestimation of habitat suitability in poorly surveyed regions. Furthermore, our projections of HSH change are sensitive to the choice of threshold, which directly influences the absolute estimates of habitat gain and loss. In addition, our predictions assume niche conservatism and disregard potential evolutionary adaptations, a limitation common to SDM approaches [63]. Furthermore, the models do not account for interspecific interactions or direct anthropogenic pressures (e.g., tourism development near hot springs). Future studies integrating physiological tolerance assays and dispersal capacity models could help to refine these predictions. A key consideration in modeling the distribution of T. baileyi is its reliance on geothermal hot springs. Our study used Land Surface Temperature to identify areas with a suitable thermal regime at the landscape scale, providing a robust foundation for identifying potential habitats. We acknowledge that the direct mapping of all individual spring locations through future field surveys would be a valuable next step to enhance the spatial precision of habitat predictions.

Supplementary Materials

The following supporting information can be downloaded at: https://www.mdpi.com/article/10.3390/biology14111531/s1, Figure S1. Research framework of this study. Table S1. 68 Occurrence records of T. baileyi. Table S2. 54 Occurrence records of T. baileyi. Table S3. Land-use reclassification. Table S4. Priority Conservation Area. Material S1. Questionnaire for the Tibetan Hot-spring Snake (Thermophis baileyi).

Author Contributions

Y.P.: Writing—Original Draft, Visualization, Methodology, Formal Analysis, Conceptualization. R.H.: Data curation, Methodology, Formal analysis, Visualization. F.D.: Methodology, Formal analysis, Visualization. Y.L.: Methodology, Formal analysis, Visualization. T.S.: Methodology, Formal analysis, Visualization. Y.R.: Methodology, Formal analysis. S.H.: Supervision, Investigation. J.C.: Writing—Review & Editing, Validation, Supervision, Funding acquisition, Conceptualization. All authors have read and agreed to the published version of the manuscript.

Funding

This work was supported by the National Natural Science Foundation of China (32470534), the National Key R&D Program of China (2024YFF1307200), and Performance Incentive Specialized Project for Scientific Research Institutions of Chongqing (Grant No. cstc2022jxjl20003).

Institutional Review Board Statement

Not applicable.

Informed Consent Statement

Not applicable.

Data Availability Statement

The occurrence records of the Tibetan hot-spring snake in the paper are detailed in Supplemental Tables S1 and S2. The database sources and the original methodological papers of all environmental variables have been cited in the paper. The study involves no data subject to privacy or ethical restrictions.

Conflicts of Interest

The authors declare no conflicts of interest.

References

  1. Asamoah, E.F.; Beaumont, L.J.; Maina, J.M. Climate and land-use changes reduce the benefits of terrestrial protected areas. Nat. Clim. Change 2021, 11, 1105–1110. [Google Scholar] [CrossRef]
  2. IPBES. Summary for Policymakers of the Global Assessment Report on Biodiversity and Ecosystem Services of the Intergovernmental Science-Policy Platform on Biodiversity and Ecosystem Services; IPBES Secretariat: Bonn, Germany, 2019. [Google Scholar]
  3. Pacifici, M.; Foden, W.B.; Visconti, P.; Watson, J.E.M.; Butchart, S.H.M.; Kovacs, K.M.; Scheffers, B.R.; Hole, D.G.; Martin, T.G.; Akçakaya, H.R.; et al. Assessing species vulnerability to climate change. Nat. Clim. Change 2015, 5, 215–224. [Google Scholar] [CrossRef]
  4. Socolar, J.B.; Mills, S.C.; Gilroy, J.J.; Martínez-Revelo, D.E.; Medina-Uribe, C.A.; Parra-Sanchez, E.; Ramirez-Gutierrez, M.; Sand Sæbø, J.; Meneses, H.S.; Pérez, G.; et al. Tropical biodiversity loss from land-use change is severely underestimated by local-scale assessments. Nat. Ecol. Evol. 2025, 9, 1643–1655. [Google Scholar] [CrossRef] [PubMed]
  5. Davison, C.W.; Rahbek, C.; Morueta-Holme, N. Land-use change and biodiversity: Challenges for assembling evidence on the greatest threat to nature. Glob. Change Biol. 2021, 27, 5414–5429. [Google Scholar] [CrossRef]
  6. Newbold, T.; Hudson, L.N.; Hill, S.L.L.; Contu, S.; Lysenko, I.; Senior, R.A.; Börger, L.; Bennett, D.J.; Choimes, A.; Collen, B.; et al. Global effects of land use on local terrestrial biodiversity. Nature 2015, 520, 45–50. [Google Scholar] [CrossRef]
  7. Cabernard, L.; Pfister, S.; Hellweg, S. Biodiversity impacts of recent land-use change driven by increases in agri-food imports. Nat. Sustain. 2024, 7, 1512–1524. [Google Scholar] [CrossRef]
  8. Sinervo, B.; Méndez-de-la-Cruz, F.; Miles, D.B.; Heulin, B.; Bastiaans, E.; Villagrán-Santa Cruz, M.; Lara-Resendiz, R.; Martínez-Méndez, N.; Calderón-Espinosa, M.L.; Meza-Lázaro, R.N.; et al. Erosion of Lizard Diversity by Climate Change and Altered Thermal Niches. Science 2010, 328, 894–899. [Google Scholar] [CrossRef]
  9. Elmberg, J.; Palmheden, L.; Edelstam, C.; Hagman, M.; Kärvemo, S. Climate change-induced shifts in survival and size of the worlds’ northernmost oviparous snake: A 68-year study. PLoS ONE 2024, 19, e0300363. [Google Scholar] [CrossRef]
  10. Newbold, T.; Hudson, L.N.; Contu, S.; Hill, S.L.L.; Beck, J.; Liu, Y.; Meyer, C.; Phillips, H.R.P.; Scharlemann, J.P.W.; Purvis, A. Widespread winners and narrow-ranged losers: Land use homogenizes biodiversity in local assemblages worldwide. PLoS Biol. 2018, 16, e2006841. [Google Scholar] [CrossRef]
  11. Hayden Bofill, S.I.; Blom, M. Climate change from an ectotherm perspective: Evolutionary consequences and demographic change in amphibian and reptilian populations. Biodivers. Conserv. 2024, 33, 905–927. [Google Scholar] [CrossRef]
  12. He, M.; Feng, J.-C.; Liu, S.; Guo, P.; Zhao, E.-M. The phylogenetic position of Thermophis (Serpentes: Colubridae), an endemic snake from the Qinghai-Xizang Plateau, China. J. Nat. Hist. 2009, 43, 479–488. [Google Scholar] [CrossRef]
  13. Wall, F. Some new Asian snakes. J. Bombay Nat. Hist. Soc. 1907, 17, 612–618. [Google Scholar]
  14. Guo, P.; Liu, S.; Feng, J.C.; He, M. The description of a new species of Thermophis (Serpentes: Colubridae). Sichuan J. Zool. 2008, 27, 321. [Google Scholar] [CrossRef]
  15. Peng, L.; Lu, C.; Huang, S.; Guo, P.; Zhang, Y. A New Species of the Genus Thermophis (Serpentes: Colubridae) from Shangri-La, Northern Yunnan, China, with a Proposal for an Eclectic Rule for Species Delimitation. Asian Herpetol. Res. 2014, 5, 228–239. [Google Scholar] [CrossRef]
  16. Li, J.-T.; Gao, Y.-D.; Xie, L.; Deng, C.; Shi, P.; Guan, M.-L.; Huang, S.; Ren, J.-L.; Wu, D.-D.; Ding, L.; et al. Comparative genomic investigation of high-elevation adaptation in ectothermic snakes. Proc. Natl. Acad. Sci. USA 2018, 115, 8406–8411. [Google Scholar] [CrossRef] [PubMed]
  17. Hofmann, S.; Fritzsche, P.; Dorge, T.; Miehe, G.; Nothnagel, M. What Makes a Hot-Spring Habitat “Hot” for the Hot-Spring Snake: Distributional Data and Niche Modelling for the Genus Thermophis (Serpentes, Colubridae). Diversity 2021, 13, 325. [Google Scholar] [CrossRef]
  18. Sills, J.; Huang, S.; Peng, L. Tibetan hot-spring snakes under threat. Science 2019, 366, 193–194. [Google Scholar] [CrossRef]
  19. Yan, C.; Wu, W.; Dong, W.; Zhu, B.; Chang, J.; Lv, Y.; Yang, S.; Li, J.-T. Temperature acclimation in hot-spring snakes and the convergence of cold response. Innovation 2022, 3, 100295. [Google Scholar] [CrossRef]
  20. Hofmann, S. Population genetic structure and geographic differentiation in the hot spring snake Thermophis baileyi (Serpentes, Colubridae): Indications for glacial refuges in southern-central Tibet. Mol. Phylogenetics Evol. 2012, 63, 396–406. [Google Scholar] [CrossRef]
  21. Deng, T.; Wu, F.; Zhou, Z.; Su, T. Tibetan Plateau: An evolutionary junction for the history of modern biodiversity. Sci. China Earth Sci. 2020, 63, 172–187. [Google Scholar] [CrossRef]
  22. Dorge, T.; Hofmann, S.; Wangdwei, M.; Duoje, L.; Solhøy, T.; Miehe, G. The ecological specialist, Thermophis baileyi (Wall, 1907): New records, distribution and biogeographic conclusions. Herpetol. Bull. 2007, 31, 8–12. [Google Scholar]
  23. IUCN. The IUCN Red List of Threatened Species, Version 2025-2; IUCN: Gland, Switzerland, 2025.
  24. IUCN. The IUCN Red List of Threatened Species, Version 2010; IUCN: Gland, Switzerland, 2010.
  25. Yan, C.; Song, M.H.; Jiang, D.; Ren, J.L.; Lv, Y.; Chang, J.; Huang, S.; Zaher, H.; Li, J.T. Genomic evidence reveals intraspecific divergence of the hot-spring snake (Thermophis baileyi), an endangered reptile endemic to the Qinghai-Tibet plateau. Mol. Ecol. 2023, 32, 1335–1350. [Google Scholar] [CrossRef] [PubMed]
  26. Oitaven, L.P.C.; Calado, S.S.; de Moura, M.S.; Monrós, J.S.; de Moura, G.J.B. Influence of Seasonality and Habitat Variability on the Thermal Ecology of Gymnodactylus geckoides Spix, 1825 (Squamata, Phyllodactylidae) in Semi-Arid Caatinga Biome in Northeastern Brazil. Austral Ecol. 2025, 50, e70055. [Google Scholar] [CrossRef]
  27. Caruccio, R.; Vieira, R.C.; Verrastro, L.; Machado, D.M. Thermal biology, activity, and population parameters of Cnemidophorus vacariensis (Squamata, Teiidae), a lizard endemic to southern Brazil. Iheringia. Série Zool. 2011, 101, 283–295. [Google Scholar] [CrossRef]
  28. Giacometti, D.; Yagi, K.T.; Abney, C.R.; Jung, M.P.; Tattersall, G.J. Staying warm is not always the norm: Behavioural differences in thermoregulation of two snake species. Can. J. Zool. 2021, 99, 974–983. [Google Scholar] [CrossRef]
  29. Fey, S.B.; Vasseur, D.A.; Alujević, K.; Kroeker, K.J.; Logan, M.L.; O’Connor, M.I.; Rudolf, V.H.W.; DeLong, J.P.; Peacor, S.; Selden, R.L.; et al. Opportunities for behavioral rescue under rapid environmental change. Glob. Change Biol. 2019, 25, 3110–3120. [Google Scholar] [CrossRef]
  30. GBIF. Occurrence Download. Available online: https://www.gbif.org/species/2454079 (accessed on 16 July 2024).
  31. MEE. Technical Regulations for the Survey and Assessment of Amphibian and Reptile Diversity in County Areas; The Ministry of Ecology and Environment: Beijing, China, 2017.
  32. Fick, S.E.; Hijmans, R.J. WorldClim 2: New 1-km spatial resolution climate surfaces for global land areas. Int. J. Climatol. 2017, 37, 4302–4315. [Google Scholar] [CrossRef]
  33. Hijmans, R.J.; Cameron, S.E.; Parra, J.L.; Jones, P.G.; Jarvis, A. Very high resolution interpolated climate surfaces for global land areas. Int. J. Climatol. 2005, 25, 1965–1978. [Google Scholar] [CrossRef]
  34. O’Neill, B.C.; Tebaldi, C.; van Vuuren, D.P.; Eyring, V.; Friedlingstein, P.; Hurtt, G.; Knutti, R.; Kriegler, E.; Lamarque, J.F.; Lowe, J.; et al. The Scenario Model Intercomparison Project (ScenarioMIP) for CMIP6. Geosci. Model Dev. 2016, 9, 3461–3482. [Google Scholar] [CrossRef]
  35. Ermida, S.L.; Soares, P.; Mantas, V.; Göttsche, F.-M.; Trigo, I.F. Google Earth Engine Open-Source Code for Land Surface Temperature Estimation from the Landsat Series. Remote Sens. 2020, 12, 1471. [Google Scholar] [CrossRef]
  36. Zhang, X.; Liu, L.; Chen, X.; Gao, Y.; Xie, S.; Mi, J. GLC_FCS30: Global land-cover product with fine classification system at 30 m using time-series Landsat imagery. Earth Syst. Sci. Data 2021, 13, 2753–2776. [Google Scholar] [CrossRef]
  37. Tobler, W. Cellular Geography. Philos. Geogr. 1979, 20, 379–386. [Google Scholar] [CrossRef]
  38. Bell, E.J. Markov analysis of land use change—An application of stochastic processes to remotely sensed data. Socio-Econ. Plan. Sci. 1974, 8, 311–316. [Google Scholar] [CrossRef]
  39. de Oliveira Barros, K.; Alvares Soares Ribeiro, C.A.; Marcatti, G.E.; Lorenzon, A.S.; Martins de Castro, N.L.; Domingues, G.F.; Romário de Carvalho, J.; Rosa dos Santos, A. Markov chains and cellular automata to predict environments subject to desertification. J. Environ. Manag. 2018, 225, 160–167. [Google Scholar] [CrossRef]
  40. Myint, S.W.; Wang, L. Multicriteria decision approach for land use land cover change using Markov chain analysis and a cellular automata approach. Can. J. Remote Sens. 2006, 32, 390–404. [Google Scholar] [CrossRef]
  41. Wang, S.; Zheng, X. Dominant transition probability: Combining CA-Markov model to simulate land use change. Environ. Dev. Sustain. 2023, 25, 6829–6847. [Google Scholar] [CrossRef]
  42. Pontius, G.R.; Malanson, J. Comparison of the structure and accuracy of two land change models. Int. J. Geogr. Inf. Sci. 2005, 19, 243–265. [Google Scholar] [CrossRef]
  43. Mu, H.; Li, X.; Wen, Y.; Huang, J.; Du, P.; Su, W.; Miao, S.; Geng, M. A global record of annual terrestrial Human Footprint dataset from 2000 to 2018. Sci. Data 2022, 9, 176. [Google Scholar] [CrossRef]
  44. Liu, H.; Cheng, Y.; Liu, Z.; Li, Q.; Zhang, H.; Wei, W. Conflict or coordination? The spatiotemporal relationship between humans and nature on the Qinghai-Tibet Plateau. Earth’s Future 2023, 11, e2022EF003452. [Google Scholar] [CrossRef]
  45. Zhang, L.; Ren, Z.; Chen, B.; Gong, P.; Xu, B.; Fu, H. A Prolonged Artificial Nighttime-light Dataset of China (1984–2020). Sci. Data 2024, 11, 414. [Google Scholar] [CrossRef]
  46. Zhan, N.; Liu, W.; Ye, T.; Li, H.; Chen, S.; Ma, H. High-resolution livestock seasonal distribution data on the Qinghai-Tibet Plateau in 2020. Sci. Data 2023, 10, 142. [Google Scholar] [CrossRef]
  47. Phillips, S.J.; Anderson, R.P.; Schapire, R.E. Maximum entropy modeling of species geographic distributions. Ecol. Model. 2006, 190, 231–259. [Google Scholar] [CrossRef]
  48. Phillips, S.J.; Dudík, M. Modeling of species distributions with Maxent: New extensions and a comprehensive evaluation. Ecography 2008, 31, 161–175. [Google Scholar] [CrossRef]
  49. Jaynes, E.T. Information Theory and Statistical Mechanics. Phys. Rev. 1957, 106, 620–630. [Google Scholar] [CrossRef]
  50. Zhao, R.; Wang, S.; Chen, S. Predicting the potential habitat suitability of Saussurea species in China under future climate scenarios using the optimized Maximum Entropy (MaxEnt) model. J. Clean. Prod. 2024, 474, 143552. [Google Scholar] [CrossRef]
  51. Raffini, F.; Bertorelle, G.; Biello, R.; D’Urso, G.; Russo, D.; Bosso, L. From Nucleotides to Satellite Imagery: Approaches to Identify and Manage the Invasive Pathogen Xylella fastidiosa and Its Insect Vectors in Europe. Sustainability 2020, 12, 4508. [Google Scholar] [CrossRef]
  52. Elith, J.; Phillips, S.J.; Hastie, T.; Dudík, M.; Chee, Y.E.; Yates, C.J. A statistical explanation of MaxEnt for ecologists. Divers. Distrib. 2011, 17, 43–57. [Google Scholar] [CrossRef]
  53. Feng, X.; Park, D.S.; Liang, Y.; Pandey, R.; Papeş, M. Collinearity in ecological niche modeling: Confusions and challenges. Ecol. Evol. 2019, 9, 10365–10376. [Google Scholar] [CrossRef]
  54. De Marco, P.J.; Nóbrega, C.C. Evaluating collinearity effects on species distribution models: An approach based on virtual species simulation. PLoS ONE 2018, 13, e0202403. [Google Scholar] [CrossRef]
  55. Gong, S.; Gao, Y.; Duan, H.; Ge, Y.; Wei, Y. Incorporating physiological data into species distribution models to predict the potential distribution range of the red-eared slider in China. Ecol. Indic. 2023, 154, 110749. [Google Scholar] [CrossRef]
  56. Zhang, S.; Liu, X.; Li, R.; Wang, X.; Cheng, J.; Yang, Q.; Kong, H. AHP-GIS and MaxEnt for delineation of potential distribution of Arabica coffee plantation under future climate in Yunnan, China. Ecol. Indic. 2021, 132, 108339. [Google Scholar] [CrossRef]
  57. Oitaven, L.P.C.; Silva, B.B.M.R.; Gavilan, S.A.; Dias, E.J.R.; Chaves, M.F.; Lobo, L.M.; Gonzalez, J.S.M.; Mesquita, D.O.; de Moura, G.J.B. Relationships between body growth indices and environmental factors on the reproductive cycle of the Gymnodactylus geckoides Spix, 1825 (Squamata, Gymnophthalmidae) in Northeast Brazil. Cuad. De Herpetol. 2023, 37, 37–56. [Google Scholar]
  58. Li, J. Diet and Feeding Behavior of Thermophis baileyi, a Chinese Endemic Species (in Chinese). J. Tibet Univ. 2007, 22, 84–90. [Google Scholar]
  59. Clark, M.I.; Hileman, E.T.; Moore, J.A.; Faust, L.J.; Junge, R.E.; Reid, B.N.; Bradke, D.R.; Bradburd, G.S.; Fitzpatrick, S.W. Inbreeding reduces fitness in spatially structured populations of a threatened rattlesnake. Proc. Natl. Acad. Sci. USA 2025, 122, e2501745122. [Google Scholar] [CrossRef]
  60. Liu, W.-l.; Liu, P.; Cui, L.-x.; Meng, Y.; Tao, S.-a.; Han, X.-z.; Sun, B.-j. Moderate climate warming scenarios during embryonic and post-embryonic stages benefit a cold-climate lizard. Funct. Ecol. 2022, 36, 1137–1150. [Google Scholar] [CrossRef]
  61. Mizsei, E.; Sos, T.; Móré, A.; Wenner, B.; Rák, G.; Mebert, K. Restriction times on the rise: Mechanistic modelling of activity time of grassland vipers (Vipera spp.) in the face of climate change. Front. Zool. 2025, 22, 10. [Google Scholar] [CrossRef]
  62. Mu, H.; Guo, S.; Zhang, X.; Yuan, B.; Xia, Z.; Tang, P.; Zhang, W.; Zhang, P.; Li, X.; Du, P. Moving in the landscape: Omnidirectional connectivity dynamics in China from 1985 to 2020. Environ. Impact Assess. Rev. 2025, 110, 107721. [Google Scholar] [CrossRef]
  63. Lee-Yaw, J.A.; McCune, J.L.; Pironon, S.; Sheth, S.N. Species distribution models rarely predict the biology of real populations. Ecography 2022, 2022, e05877. [Google Scholar] [CrossRef]
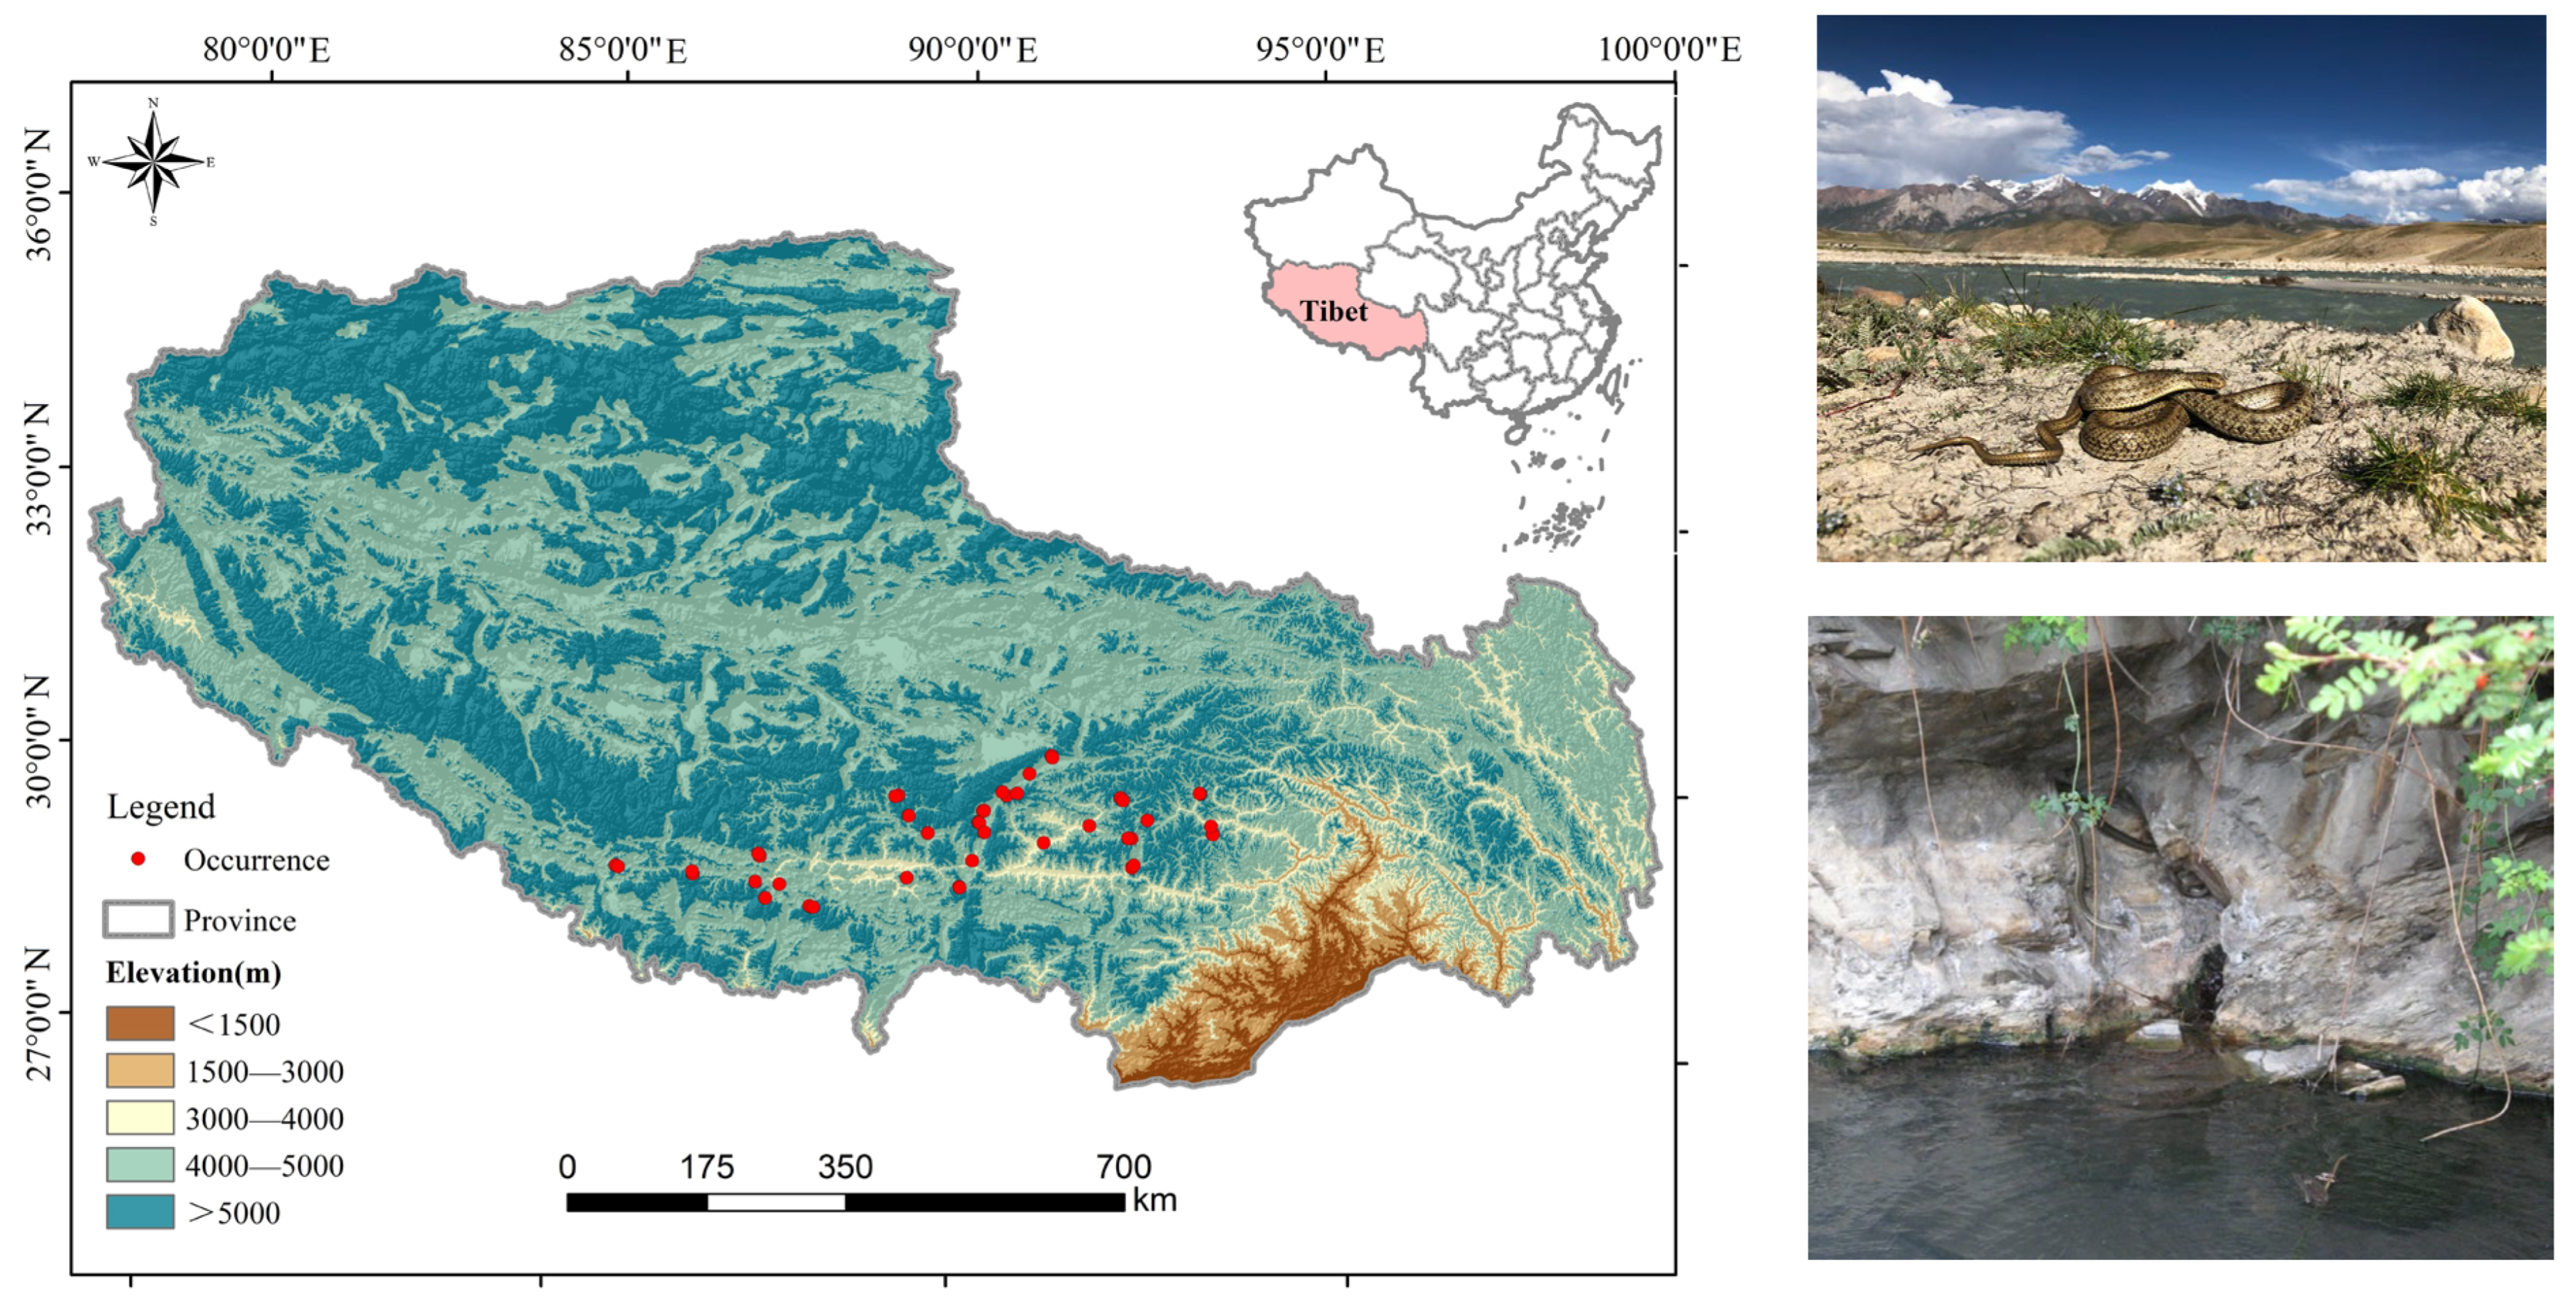
Figure 1. Occurrence records of T. baileyi used for building species distribution models.
Biology 14 01531 g001
Figure 2. Response curves of the relationships between the distribution probability of T. baileyi and the dominant environmental variables.
Biology 14 01531 g002
Figure 3. Current (left) and future (right) potentially suitable habitat distributions of T. baileyi under the LCO scenario.
Biology 14 01531 g003
Figure 4. Spatial dynamics of high-suitability habitats for T. baileyi under the LCO scenario from 2020 to 2050.
Biology 14 01531 g004
Figure 5. Predicted distributions of T. baileyi under the CCO and CCLC scenarios for the 2050s.
Biology 14 01531 g005
Figure 6. The different areas of HSH for T. baileyi under the current and future scenarios.
Biology 14 01531 g006
Figure 7. Future HSH compositions under the CCO and CCLC scenarios.
Biology 14 01531 g007aBiology 14 01531 g007b
Figure 8. Distribution centroid shifts of T. baileyi under different scenarios.
Biology 14 01531 g008
Table 1. Environmental variables used to simulate the potential distributions of T. baileyi.
CategoryVariablesDescriptionUnitSourceResolution
Bioclimatic variablesbio1Annual mean temperature°CWorldClim 2 database for the current and future periods [32]30 s
bio2Mean diurnal range°C
bio3Isothermality (bio2/bio7) (×100)
bio4Temperature seasonality (standard deviation ×100)
bio5Max temperature of the warmest month°C
bio6Min temperature of the coldest month°C
bio7Temperature annual range (Bio5-Bio6)°C
bio8The mean temperature of the wettest quarter°C
bio9The mean temperature of the driest quarter°C
bio10The mean temperature of the warmest quarter°C
bio11The mean temperature of the coldest quarter°C
bio12Annual precipitationmm
bio13Precipitation of the wettest monthmm
bio14Precipitation of the driest monthmm
bio15Precipitation seasonalitymm
bio16Precipitation of the wettest quartermm
bio17Precipitation of the driest quartermm
bio18Precipitation of the warmest quartermm
bio19Precipitation of the coldest quartermm
Terrain factorsDEMDigital Elevation ModelmGeospatial Data Cloud90 m
SlopeSlopemExtracted from DEM90 m
Habitat factorsLand cover35 land-cover categories for 1990, 2000, 2010 and 2020_[36]30 m
LSTLand Surface Temperature°CComputed from Landsat 4, 5, 7, and 8 within Google Earth Engine (GEE) [35]30 m
Table 2. Descriptions of the different scenarios.
ScenariosScenario Description
Landscape Change-Only ScenarioLCOThe predicted 2050 land-cover layer was imported into the simulation model to replace the 2020 land-cover layer, while the other variables remained unchanged.
Climate Change-Only (CCO) ScenarioCCO-SSP1-2.6The future 19 bioclimate variables (averages for 2041–2060) under SSP1-2.6, SSP2-4.5, SSP3-7.0, and SSP5-8.5 scenarios were separately imported into the simulation models to replace the current 19 bioclimate variables, while the other variables remained unchanged.
CCO-SSP2-4.5
CCO-SSP3-7.0
CCO-SSP5-8.5
Combined Climate–Landscape Change (CCLC) ScenarioCCLC-SSP1-2.6Both the future land-cover layer and future 19 bioclimate variables were imported to replace the corresponding current data.
CCLC-SSP2-4.5
CCLC-SSP3-7.0
CCLC-SSP5-8.5
Table 3. Dominant environmental variables for the potential distribution of T. baileyi.
VariablePercent Contribution (%)Permutation Importance
bio441.87.3
bio1915.12.9
Land cover13.85.4
bio110.23.2
bio126.26.3
bio113.847.1
LST3.70.5
bio92.416.4
bio142.11.8
Table 4. Simulated areas and increase/decrease rates of different suitability levels under current and future scenarios.
Current and Future ScenariosSimulated Areas/km2Increase/Decrease Rates (%)
UnsuitableLow SuitabilityMedium SuitabilityHigh SuitabilityUnsuitableLow SuitabilityMedium SuitabilityHigh Suitability
Current903,712.01191,890.3590,217.4416,380.21////
LCO838,683.21197,494.50150,620.9715,401.32−7.202.9266.95−5.98
CCOSSP1-2.6855,617.77220,188.49106,077.0320,316.71−5.3214.7517.5824.03
SSP2-4.5835,625.62244,272.7899,887.6422,413.96−7.5327.3010.7236.84
SSP3-7.0835,072.98235,748.58108,683.7822,694.66−7.6022.8620.4738.55
SSP580890,052.23202,048.2892,731.7117,367.78−1.515.292.796.03
CCLCSSP126876,995.89212,011.5194,371.5118,821.08−2.9610.494.6014.90
SSP245858,734.02234,776.3588,810.7819,878.84−4.9822.35−1.5621.36
SSP370855,752.27228,920.3097,215.8320,311.60−5.3119.307.7624.00
SSP580908,668.61194,841.8082,188.8216,500.780.551.54−8.900.74
Disclaimer/Publisher’s Note: The statements, opinions and data contained in all publications are solely those of the individual author(s) and contributor(s) and not of MDPI and/or the editor(s). MDPI and/or the editor(s) disclaim responsibility for any injury to people or property resulting from any ideas, methods, instructions or products referred to in the content.