Article

Mitogenomic Characterization of Microhyla fissipes and Its Implications for Phylogenetic Analysis in Microhylidae

School of Biological and Pharmaceutical Sciences, Mianyang Teachers’ College, Mianyang 621000, China
*
Author to whom correspondence should be addressed.
These authors contributed equally to this work.
Biology 2025, 14(10), 1342; https://doi.org/10.3390/biology14101342
Submission received: 31 July 2025 / Revised: 27 September 2025 / Accepted: 30 September 2025 / Published: 1 October 2025
(This article belongs to the Special Issue Progress in Wildlife Conservation, Management and Biological Research)

Abstract

Simple Summary

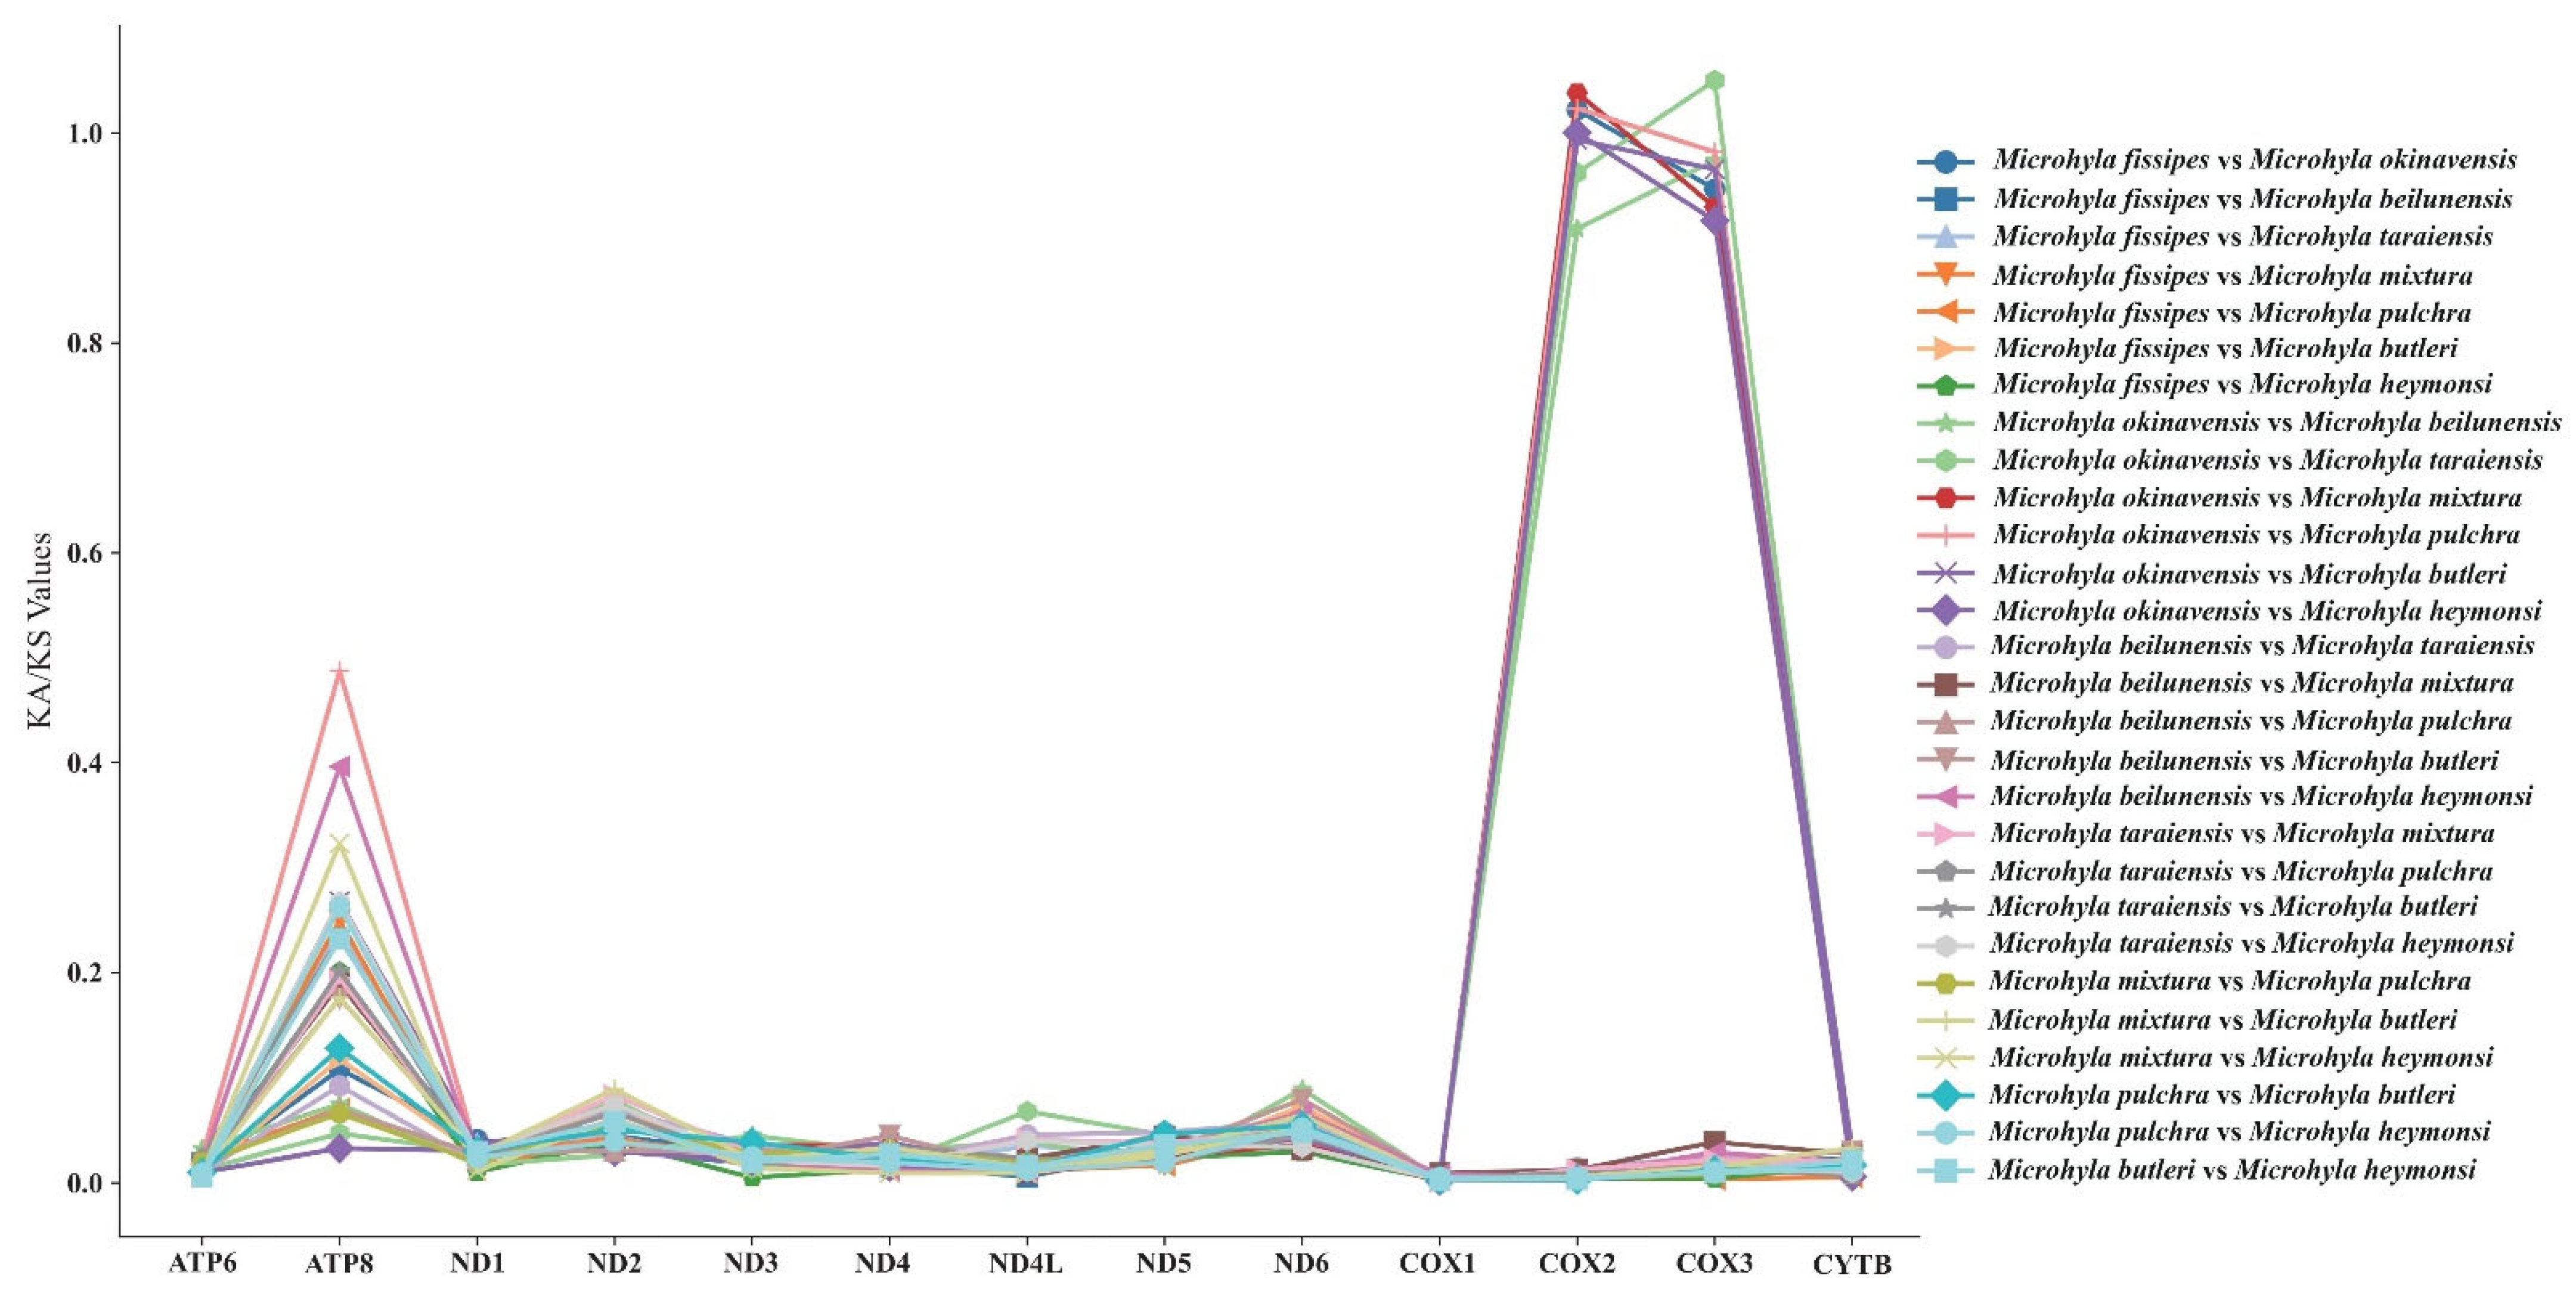
Microhyla fissipes, a species within the family Microhylidae, is distributed exclusively in Asia. This frog holds significant scientific and ecological importance, but research on this species remains limited to date. In this study, we report the characteristics of the mitochondrial genome of M. fissipes and, using these data, investigate the phylogenetic relationships within the family Microhylidae. The results indicate that the mitogenomic size of M. fissipes is 16,723 bp, arranged in a circular configuration, containing 13 protein-coding genes (PCGs), 22 tRNAs, 2 rRNAs, and 1 non-coding region. The nucleotide composition is 28.9% adenine (A), 31.01% thymine (T), 25.51% cytosine (C), and 14.58% guanine (G). Phylogenetic analysis indicated that Microhylidae can be divided into four monophyletic genera (Microhyla, Glyphoglossus, Kaloula, Anilany), with M. fissipes being most closely related to Microhyla heymonsi. Analysis indicates that the selection pressure ratios for most genes are less than 1, suggesting that these genes have undergone strong purifying selection. However, in the COX2 and COX3 genes, the Ka/Ks ratios between some species exceed 1, indicating that the evolutionary process aims to eliminate harmful mutations. This study enriches the basic biological data for M. fissipes and provides a fundamental reference for the conservation of M. fissipes and Microhyla.

Abstract

The microhylid frog Microhyla fissipes is a protected terrestrial wildlife species in China, recognized for its ecological, economic, and scientific value. However, its mitochondrial genome remains poorly characterized. To address this gap, we sequenced and annotated the complete mitogenome of M. fissipes to elucidate its structural organization and phylogenetic placement within Microhylidae. The assembled mitogenome is 16,723 bp in length and contains 37 genes, including 13 protein-coding genes, 2 rRNAs, and 22 tRNAs, along with one control region and the origin of heavy-strand replication. We also identified eight overlapping regions and eleven intergenic spacers. The overall base composition showed an A + T bias (59.91%) with negative AT-skew (−0.04) and GC-skew (−0.27). All tRNAs displayed typical cloverleaf secondary structures, except for trnS1, which lacked the D-arm. Phylogenetic reconstruction using both maximum likelihood and Bayesian inference strongly supported the monophyly of Microhylidae and revealed a sister-group relationship between Microhyla and Kaloula. Within Microhyla, M. fissipes was most closely related to M. heymonsi, with which it formed a well-supported clade that also included Microhyla okinavensis, Microhyla mixtura, and Microhyla beilunensis. Selection pressure analysis on protein-coding genes indicated widespread purifying selection (Ka/Ks < 1) across most genes, except for ATP8, COX2, and COX3, which may be under relaxed selective constraints. These findings offer valuable genomic resources for the conservation of M. fissipes and provide new insights into the phylogeny and evolution of microhylid frogs.

1. Introduction

The Microhyla fissipes is a small-sized frog (less than 30 mm) widespread in East Asia, inhabiting environments such as water puddles, depressions, and grassy areas; the species belongs to the family Microhylidae of the order Anura [1,2]. It is distributed in diverse habitats from subtropical basins (such as Sichuan) to islands (such as Hainan), making it an ideal subject for studying how climatic and geographical factors drive the evolution of amphibian mitochondrial genomes, as well as an important model for understanding the evolutionary dynamics of the family Microhylidae. This frog is easy to collect and rear, with a fast reproduction rate, making it an important experimental subject for molecular biology and ecological research. Its phylogenetic position also provides a unique opportunity to elucidate the ancestral differentiation patterns of Microhyla.
As transitional organisms bridging aquatic and terrestrial life forms, Amphibia hold significant status in evolutionary biology research. With the continuous deterioration of ecological environments and reduction in habitats, amphibian populations across species are confronting substantial survival pressures, even approaching extinction [3]. Due to their slower metabolic rates compared to endotherms and their hibernation habits, frogs generally exhibit a slower molecular evolutionary rate than mammals and birds [4]. The compact and highly conserved mitochondrial genome of M. fissipes provides a window into the adaptive evolution of amphibians between aquatic and terrestrial habitats. Mitochondrial genes, increasingly utilized as novel molecular markers in phylogenetic studies, have garnered increasing attention and application in evolutionary analyses owing to their advantageous characteristics including small molecular size, lack of introns, and maternal inheritance pattern [5].
The family Microhylidae includes Kaloula, Microhyla, Trichobatrachus, Hyperolius, Breviceps, and Hemissus, and their phylogenetic relationships are in good agreement with traditional taxonomy [6]. Recent advances have significantly enhanced our knowledge of Microhyla species diversity, yet reconstructing the evolutionary origins of this genus continues to present considerable scientific challenges [7]. And Kaloula and Microhyla each form a monophyletic group that is the sister group of the branch, indicating close affinities. Kaloula rugifera, Kaloula borealis, and Kaloula pulchra form the sister branch of the genus Microhyla [8]. In the phylogenetic tree studied by Zhao et al. [9], M. mixtura and M. okinavensis belonged to the same category of the genus Microhyla, and the two were presented in a topological pattern of neighboring branches, sharing relatively proximate nodes. In another phylogenetic analysis by Khatiwada et al. [10], it was observed that M. okinavensis and M. fissipes present a topological pattern of adjacent branches. It is evident that the phylogenetic relationships among M. okinavensis, M. fissipes, and M. mixtura remain unclear, highlighting the ongoing uncertainty in the evolutionary history of this genus. A high-quality mitochondrial genome of M. fissipes could provide reliable molecular markers to test hypotheses of convergent evolution or incomplete lineage sorting, thereby resolving these discrepancies. Despite extensive research on Microhyla, studies on the mitochondrial genome of M. fissipes remain notably lacking—a gap that hinders our understanding of its evolutionary history and taxonomy.
Previous studies on M. fissipes were largely confined to limited phylogenetic analyses—only conducting simple result analyses and involving a narrow range of taxa for tree construction—with overall taxonomic coverage remaining restricted [1,2]. In contrast, this research significantly expands the investigative scope and increases its analytical depth: while prior studies only put forward preliminary phylogenetic placements for this species, our work includes species from over ten families within the order Anura to perform a thorough phylogenetic reconstruction, which resolves previously unclear evolutionary relationships. Furthermore, we present the first estimates of divergence times for these groups, offering new insights into their evolutionary timeline. Additionally, we analyze selective pressures within Microhyla to identify functional constraints on the mitochondrial genome—efforts that not only refine M. fissipes’ phylogenetic framework but also provide novel evolutionary perspectives absent from previous publications.
Building on the identified gaps and our expanded analytical approach, we amplified M. fissipes’ complete mitogenome sequence, systematically analyzed its structural features, and further resolved the taxonomic status of this species and its close relatives. These actions not only fill the gap in comprehensive mitochondrial genome data for this group (as highlighted earlier) but also provide experimental evidence for future conservation genetics research on Microhyla species—laying a solid foundation for subsequent studies on their evolutionary trajectories and protective strategies.

2. Materials and Methods

2.1. Ethics Approval

All experimental procedures involving M. fissipes were performed in strict compliance with the Wildlife Protection Law of the People’s Republic of China and approved by the Scientific Research Ethics Committee of Mianyang Teachers’ College (Approval No. MSL202522). The study adhered to recognized animal welfare guidelines, and all efforts were made to minimize harm and discomfort to the animals throughout the research process.

2.2. Sample Collection and DNA Extraction

The samples of M. fissipes were collected in Mojia Town, Fucheng District, Mianyang City, Sichuan Province, Southwestern China (105.8′24.14″, 31.58′19.35″; 555 m above sea level). The interdigital webbing was sterilized with alcohol, after which approximately 25 mg of tissue was carefully excised. The area was then disinfected again prior to releasing the animal back into its natural habitat. Immediately following collection, tissue specimens were preserved under aseptic conditions in anhydrous ethanol to ensure structural and genetic integrity. All samples were stored at −20 °C. Total genomic DNA was extracted using a standard phenol/chloroform method [11]; its integrity was then determined by electrophoresis on a 0.9% agarose gel. The concentration of the extracted DNA samples was measured by spectrophotometry and the DNA was amplified by PCR.

2.3. PCR Amplification and Sequencing

Twelve overlapping fragments covering the entire mitogenome, each overlapping 200–350 bp, were obtained by PCR amplification and LA-PCR. PCR amplification was performed in a reaction volume of 25 µL, which consisted of 2.5 µL of 10× loading buffer, 2.0 µL of MgCl2 (2.5 mol/L), 1.5 µL of dNTP mixture (2.5 mM/L each), 1.0 µL of each primer pair (10 µmol/L), 1.0 µL of DNA template (20 ng/µL), 1.0 µL of each primer pair (10 µmol/L), 1.0 µL of DNA template (20 ng/µL), 0.6 µL of LA Taq polymerase (5 U/µL), and sterilized water. The PCR cycling procedure was as follows: pre-denaturation at 95 °C for 5 min, denaturation at 94 °C for 40 s, annealing at 48–62 °C for 45 s, extension at 72 °C for 1 min for 33 cycles, and extension at 72 °C for 10 min. The PCR products were detected by agarose gel electrophoresis to confirm the correct results, and then sequenced by Sanger. Finally, the mitochondrial sequence was obtained and registered in GenBank, and the accession number was PV 083740.

2.4. Mitogenome Assembly, Annotation and Sequence Analysis

Sequencing results were assembled, annotated and edited manually. The positions of protein-coding genes (PCGs), tRNAs, rRNA genes and D-loop regions were annotated by BLAST v1.8.4 comparison (https://blast.ncbi.nlm.nih.gov, accessed on 21 May 2025) to search for homologous sequences, which were then used as reference sequences. We constructed a mitogenome map by Proksee [12] (https://proksee.ca/, accessed on 25 May 2025) and searched for homologous sequences by tRNAscanSE [13] (https://trna.ucsc.edu/tRNAscan-SE/index.html, accessed on 26 May 2025) analyzed tRNA secondary structures using vertebrate mitochondrial genetic code sources in default search mode. With R2DT [14] (https://r2dt.bio/, accessed on 29 May 2025), we predicted the secondary structure of 12S rRNA, 16S rRNA. Secondary validation was also performed for tRNA genes using ARWEN 1.2.3 [15] software to ensure the correct structure. The MEGA 11.0 [16] software was employed to calculate the relative codon usage frequency (RSCU) and the individual base content. The AT-skews and GC-skews were calculated using the following formula AT-skew = (A − T)/(A + T) and GC-skew = (G − C)/(G + C) [17]. The overlapping regions between genes and gene spacing were calculated manually.

2.5. Phylogenetic Analysis

In order to explore the phylogenetic position of M. fissipes within its family, we selected 30 representative species covering major genera of Microhylidae based on taxonomic representativeness, geographic distribution, and data completeness. The phylogenetic trees were constructed using PhyloSuite [18] with 13 protein-coding genes, with Bufotes pewzowi and Bufo japonicus set as outgroups due to their close but distinct phylogenetic relationship with the ingroup taxa. Prior to the construction of the phylogenetic tree, multiple sequence comparisons were performed using MAFFT [19], and low-quality comparison sites in the file were trimmed using trimAl [20]. Phylogenetic trees were constructed by concatenating the trimmed PCG sequences the optimal nucleotide substitution model was identified using ModelFinder [21]. Phylogenetic analyses were performed using both maximum likelihood (ML) and Bayesian inference (BI) approaches: ML analysis was conducted with IQ-TREE [22] using 1000 bootstrap replicates, while BI analysis was performed with MrBayes [23] running 2,000,000 generations of Markov chain Monte Carlo simulations, sampling every 1000 generations with the first 25% discarded as burn-in. The final results of the phylogenetic analysis were visualized using the Interactive Tree of Life (iTOL) online tool (https://itol.embl.de/, accessed on 1 June 2025).

2.6. Divergence Time Estimates Focused on Microhylidae

The BEAST v1.8.4 software was to estimate the divergence time [24]. The general time-reversible (GTR) model was chosen as it best fit our dataset, accounting for unequal base frequencies and substitution rates between nucleotide pairs. This was combined with a rigorous molecular clock to estimate the time scales. The Yule process was used as a tree prioritization. The divergence time of M. fissipes was estimated (4.86–10.93 MYA) based on the fossil record obtained from the TimeTree website (http://www.timetree.org, accessed on 3 June 2025). The MCMC chain was run for 20,000,000 generations, with the first 10% discarded as aging. Parameters were recorded every 2000 generations and ESS values were checked using Tracer [25], with all ESS values exceeding 300, to ensure accurate results. The tree was generated using TreeAnnotator v1.8.4 [26] and the divergence time tree was viewed and embellished using FigTree v1.4.5 (http://tree.bio.ed.ac.uk/software/figtree/, accessed on 5 June 2025).

2.7. Ka and Ks Analysis

To better assess selective pressure among Microhyla species, we calculated the Ka/Ks values for 13 protein-coding genes across 8 species [27]. A Ka/Ks ratio of 1 indicates neutral mutations, meaning mutations are not influenced by selection and are randomly fixed. A Ka/Ks ratio greater than 1 indicates positive selection, suggesting that the gene is undergoing adaptive evolution, with amino acid changes being beneficial. A Ka/Ks ratio less than 1 indicates negative (purifying) selection, indicating that the gene is conserved, with amino acid changes being harmful. The calculation results aid in analyzing the evolutionary patterns of the species and provide a better understanding of the selective pressures between gene sequences of different species [28].

3. Results

3.1. Composition of the M. fissipes Mitochondrial Genome

The complete mitochondrial genome of M. fissipes consisted of 16,723 base pairs (bp), as detailed in Table S1 (Supplementary data) and shown in Figure 1. The analysis of the M. fissipes mitochondrial genome revealed 38 distinct regions, including 13 protein-coding genes (PCGs), 2 ribosomal RNAs (rRNAs), 22 transfer RNAs (tRNAs), and one non-coding region (D-loop). This gene structure aligns with the typical organization observed in most animal mitochondrial genomes [29]. The base composition analysis showed the following percentages—A (28.9%), T (31.01%), C (25.51%), and G (14.58%)—with an overall A + T content of 59.91% (Table 1). Additionally, we observed a slight negative AT-skew (−0.035) and GC-skew (−0.027). Previous studies have suggested that A + T-rich regions are a major factor contributing to length variation in mitochondrial genomes, which may also apply to M. fissipes [30]. The light chain (L chain) of the M. fissipes mitochondrial genome is responsible for encoding one PCG (ND6) and eight tRNAs (tRNA-Gln, tRNA-Ala, tRNA-Asn, tRNA-Cys, tRNA-Tyr, tRNA-Ser, tRNA-Glu, and tRNA-Pro), while most of the genes are located on the heavy chain (H chain) (Table S1—Supplementary data). Overlapping sequences and spacer regions were found in several genes, with the largest gene overlap (17 bp) occurring between ND5 and ND6 and the largest spacer region occurring between tRNA-Ser and ND5 (34 bp in length).

3.2. PCGs and Codon Usage Patterns of M. fissipes

The nucleotide composition of the 13 protein-coding genes (PCGs) in the mitochondria of M. fissipes was found to be analogous to that of other species of frogs. Thirteen PCGs had a total length of 11,301 bp. The AT content of the PCGs was found to be 60.45%, which is significantly higher than the 39.55% observed in the GC content. Additionally, negative values were identified for both AT skewness (−0.112) and GC skewness (−0.275), as presented in Table 1. The nucleotide biases of A and T were found to be analogous. Specifically, the first position of each codon exhibited the lowest AT content, the third position exhibited the highest AT content, and all AT-skews were positive, while AT-skews were negative in the second position. A thorough examination of the mitochondrial genome of amphibians reveals a pronounced bias in nucleotide composition, with the third codon position demonstrating the most significant deviations [31,32]. In this study, the majority of the codons terminated with either A or T. With the exception of COX1 and ND1, whose start codons were ATA and GTG, respectively, all others were ATG, which were triggered by GTG codons. With regard to the termination codons, ND1, ND3, ND4, ATP6, COX2, and COX3 exhibit incomplete termination. The distinguishing feature is that, among them, the termination codon of the ND2 gene is TAG, the termination codon of the ND5 and COX1 genes is AGG, the termination codon of ND6 is AGA, and the termination codon of the remaining genes is TAA.
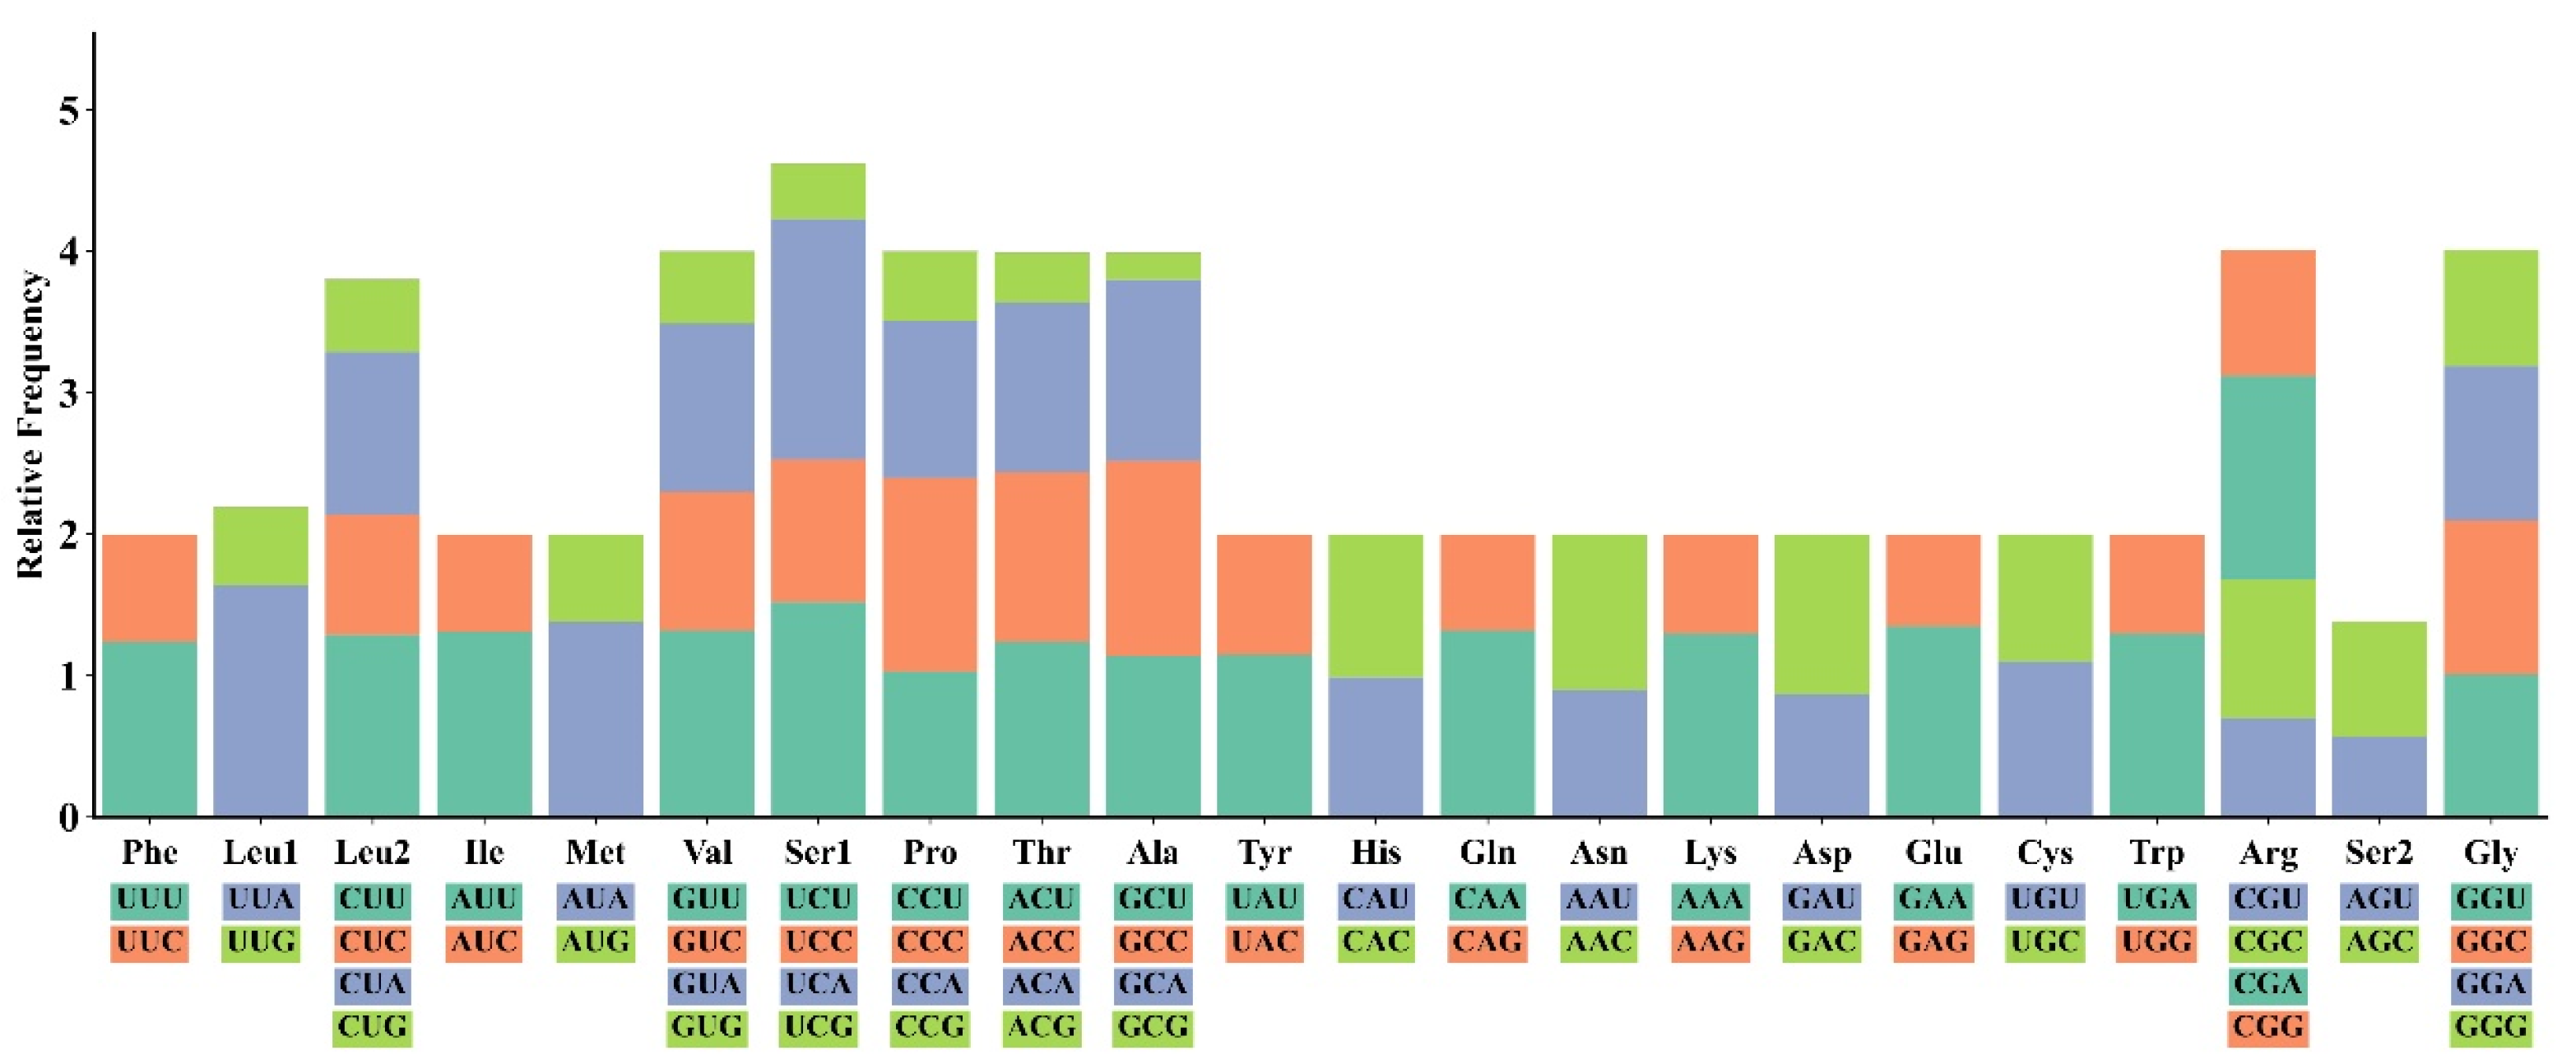
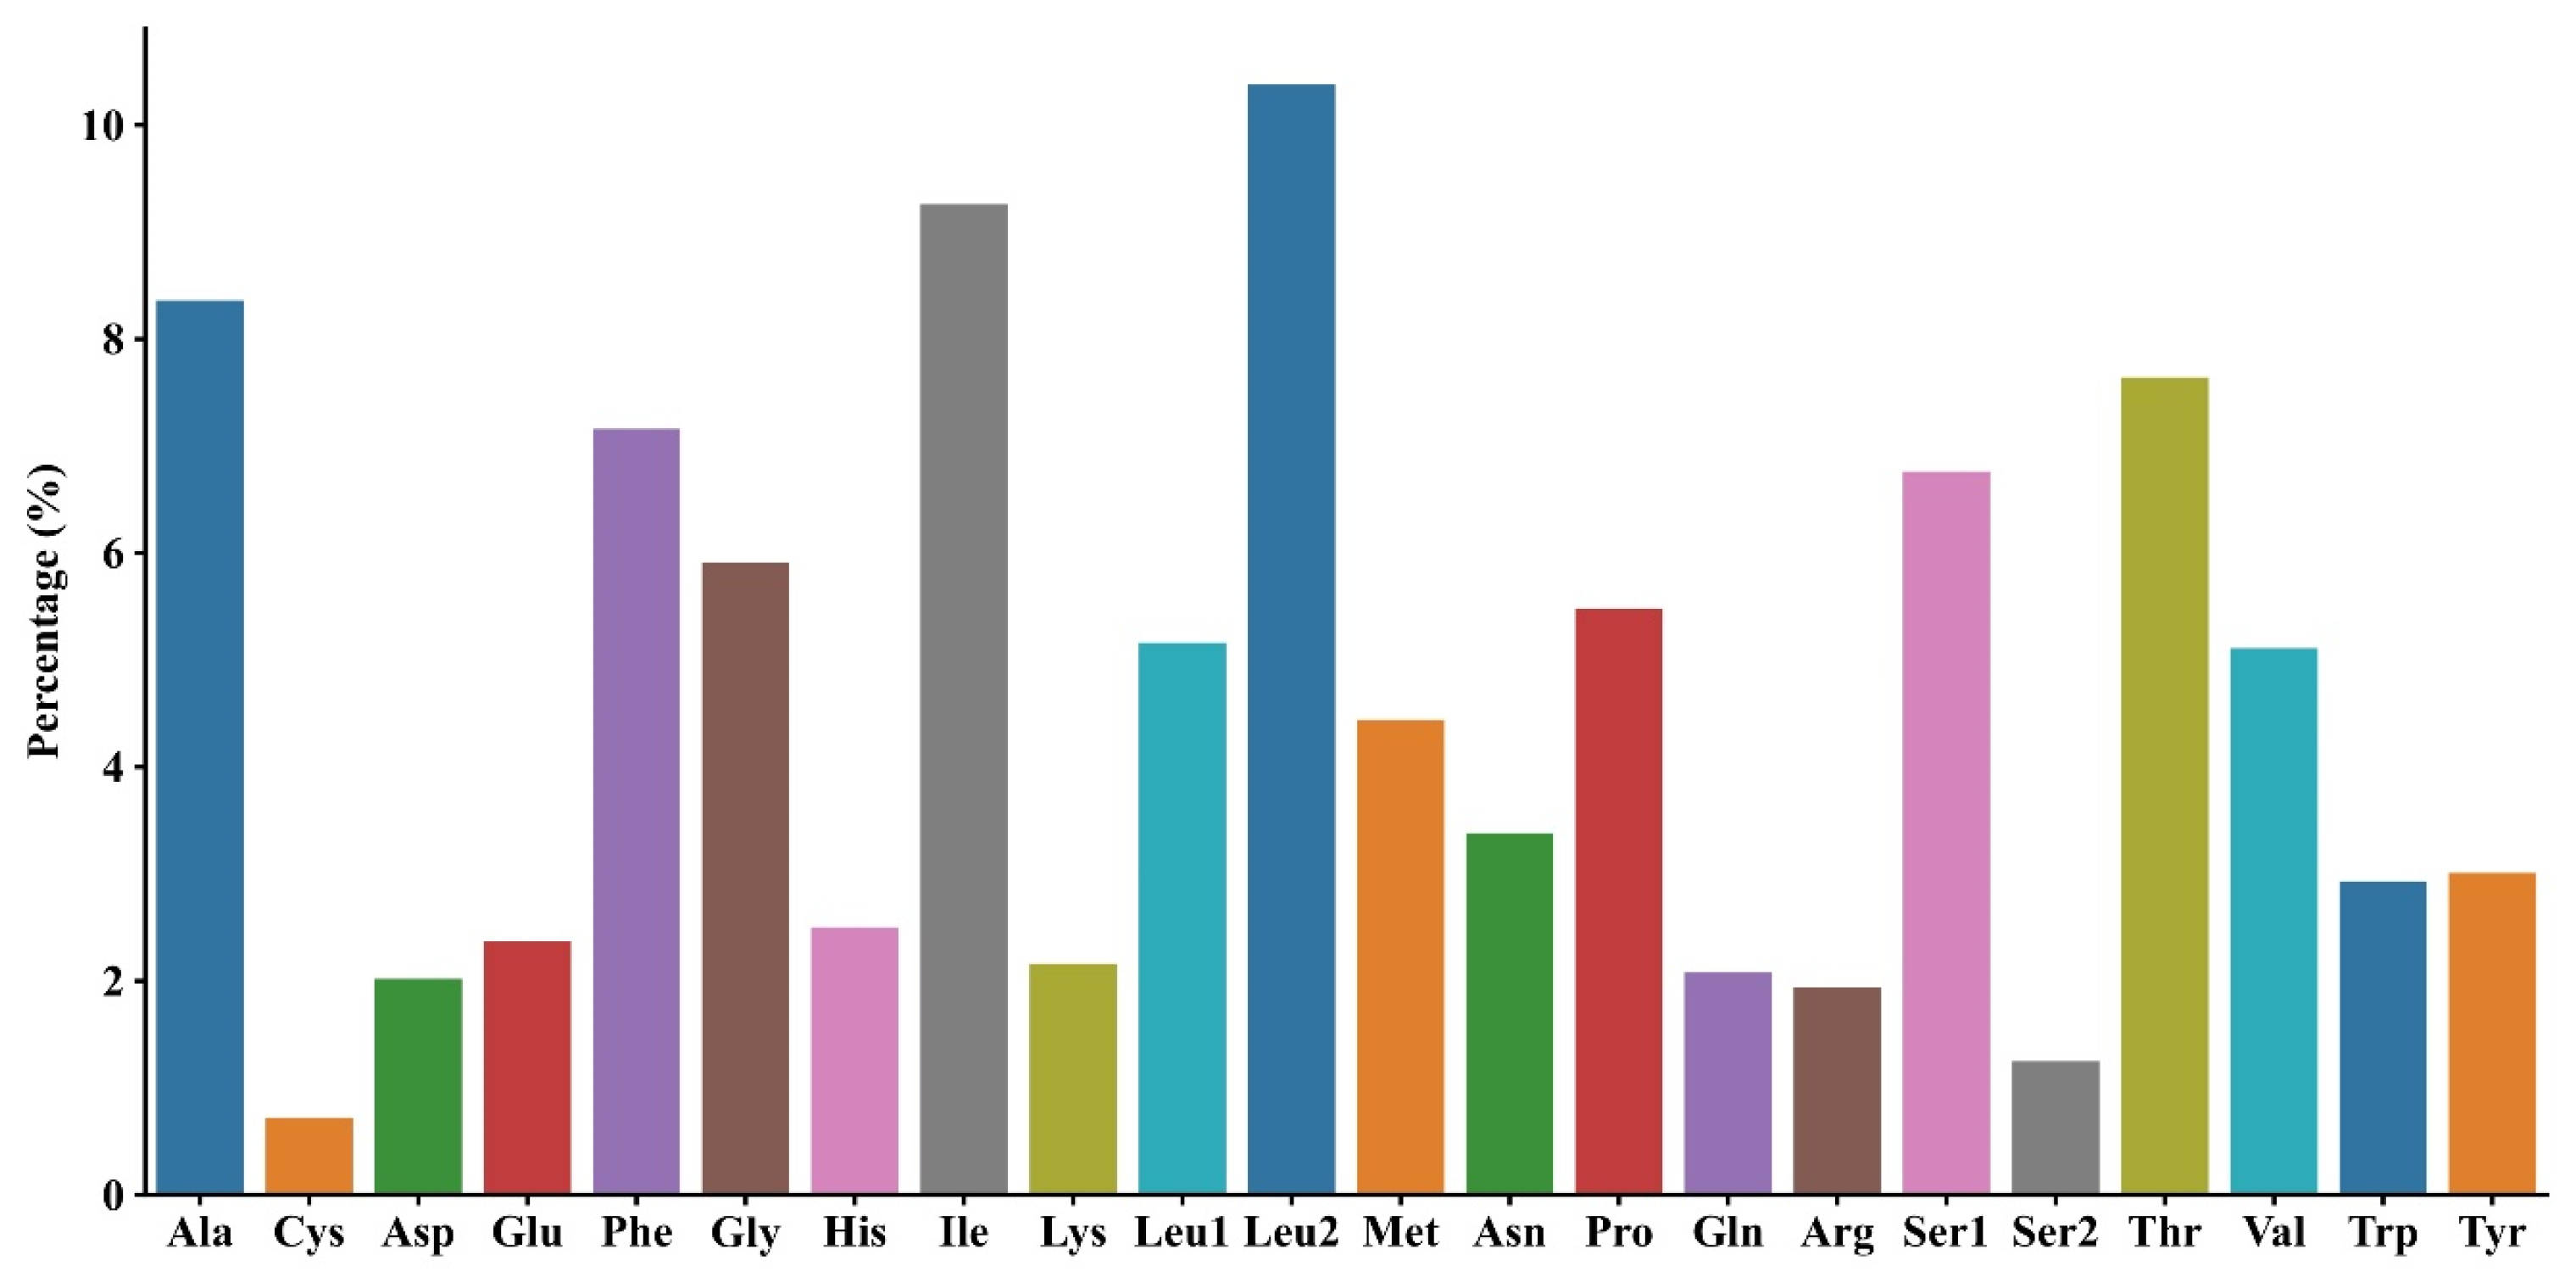
A total of 5574 codons were identified in the 13 PCGs of M. fissipes. The relative values of codon usage are demonstrated in Figure 2. It is noteworthy that AUU (isoleucine; Ile), UUU (phenylalanine; Phe), and UUA (leucine; Leu) were identified as the most commonly used codons. The least frequently used codons were GCG (alanine; Ala), CGU (arginine; Arg), and GUG (valine; Val). The AT bias in the M. fissipes mitochondrial genome was found to influence codon usage patterns. Our analysis identified overlapping gene arrangements in three pairs of protein-coding genes: ATP8 and ATP6, ND4L and ND4 on the same strand, and ND5 and ND6 on opposite strands. As illustrated in Figure 3, among the amino acids identified in M. fissipes, leucine (L) demonstrates the highest percentage (15.54%), exhibiting its presence across six distinct codons, classified as L1 and L2. Conversely, cysteine (C) exhibits the lowest percentage among the identified amino acids, with a representation of 0.72%. The results obtained from the study indicated that the T and A bases were more prevalent than the G and C bases. This finding suggests a significant preference for A or T at the third codon position, indicating a bias in the genetic code.

3.3. Transfer RNA and Ribosomal RNA Genes

A total of 22 tRNAs were identified in the mitogenome of M. fissipes, with the leucine and serine genes represented twice (Table S1—Supplementary data). The secondary structures of all tRNAs are shown in Figure S1, with sequence lengths ranging from 66 to 73 base pairs. Analysis of the predicted secondary structures revealed that trnS1 lacked the dihydrouracil (DHU) loop and therefore could not form a complete cloverleaf conformation. However, the remaining tRNAs were able to form the standard cloverleaf secondary structure. We found that the tRNA of M. fissipes is essentially characterized by the traditional A-U and G-C base pairing in the secondary structure of mitochondrial tRNAs, but it was also found to contain a number of mismatched base pairs, e.g., U-U, A-A, and A-C.
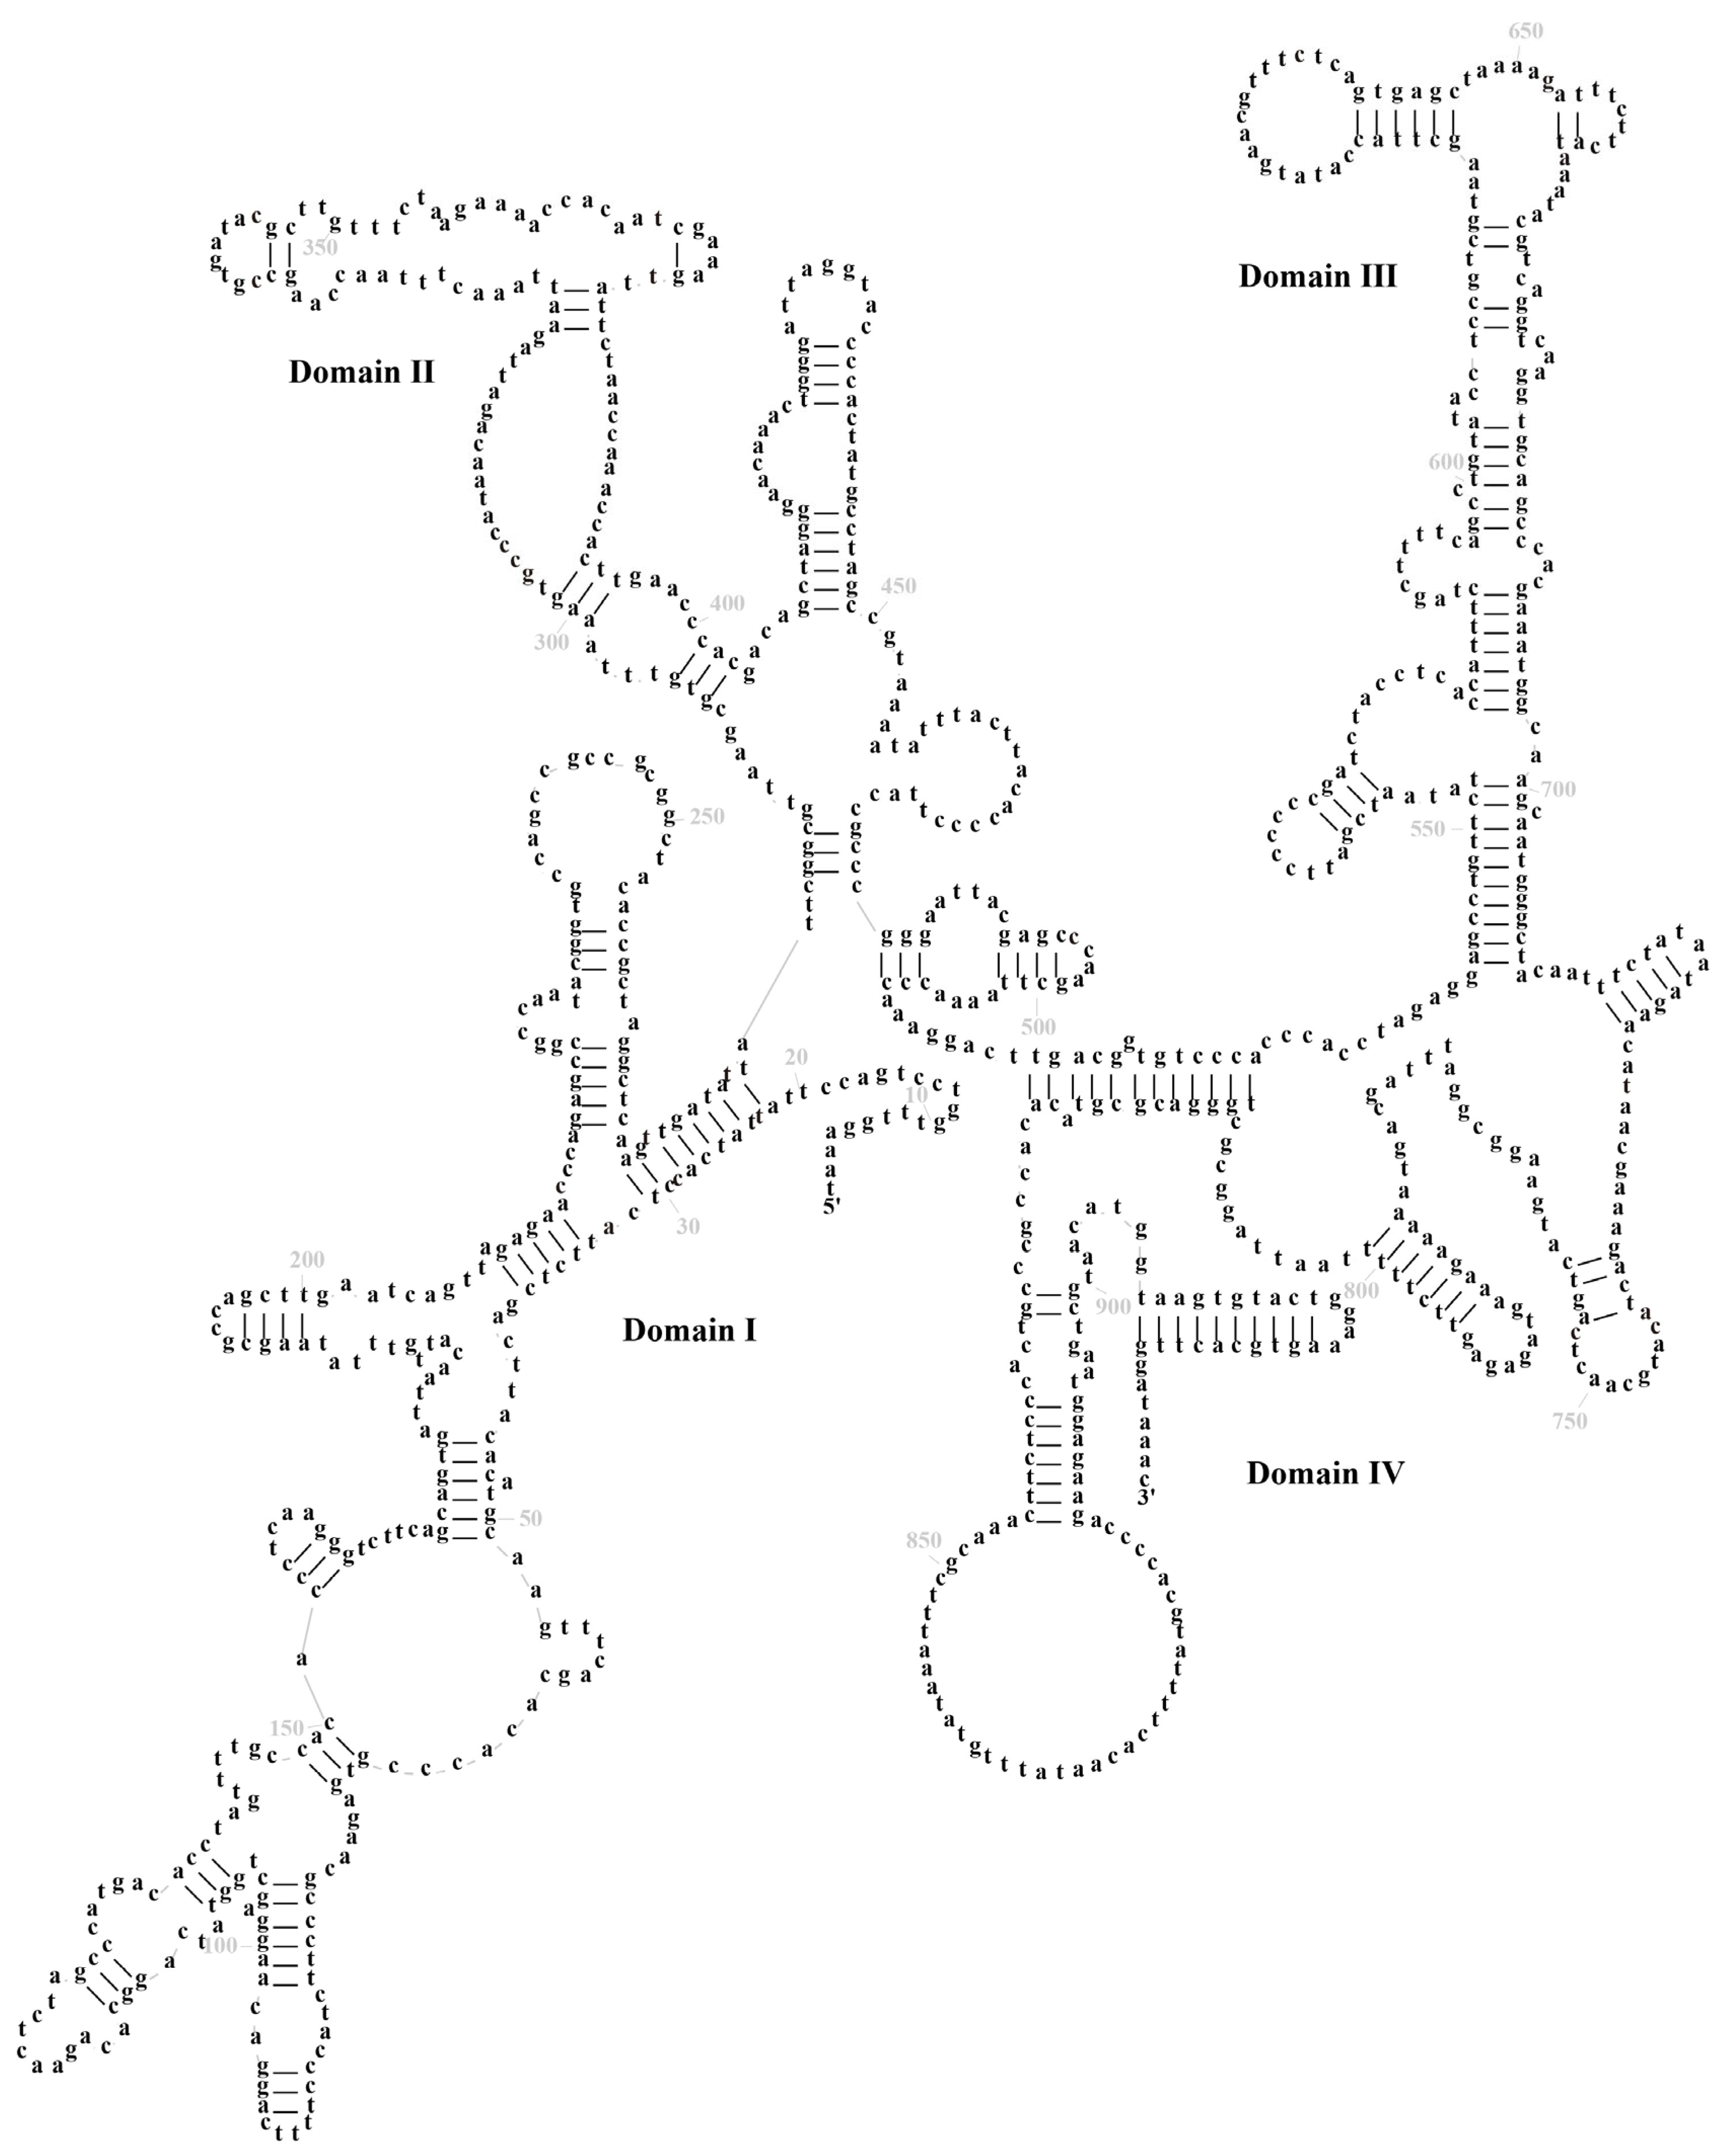
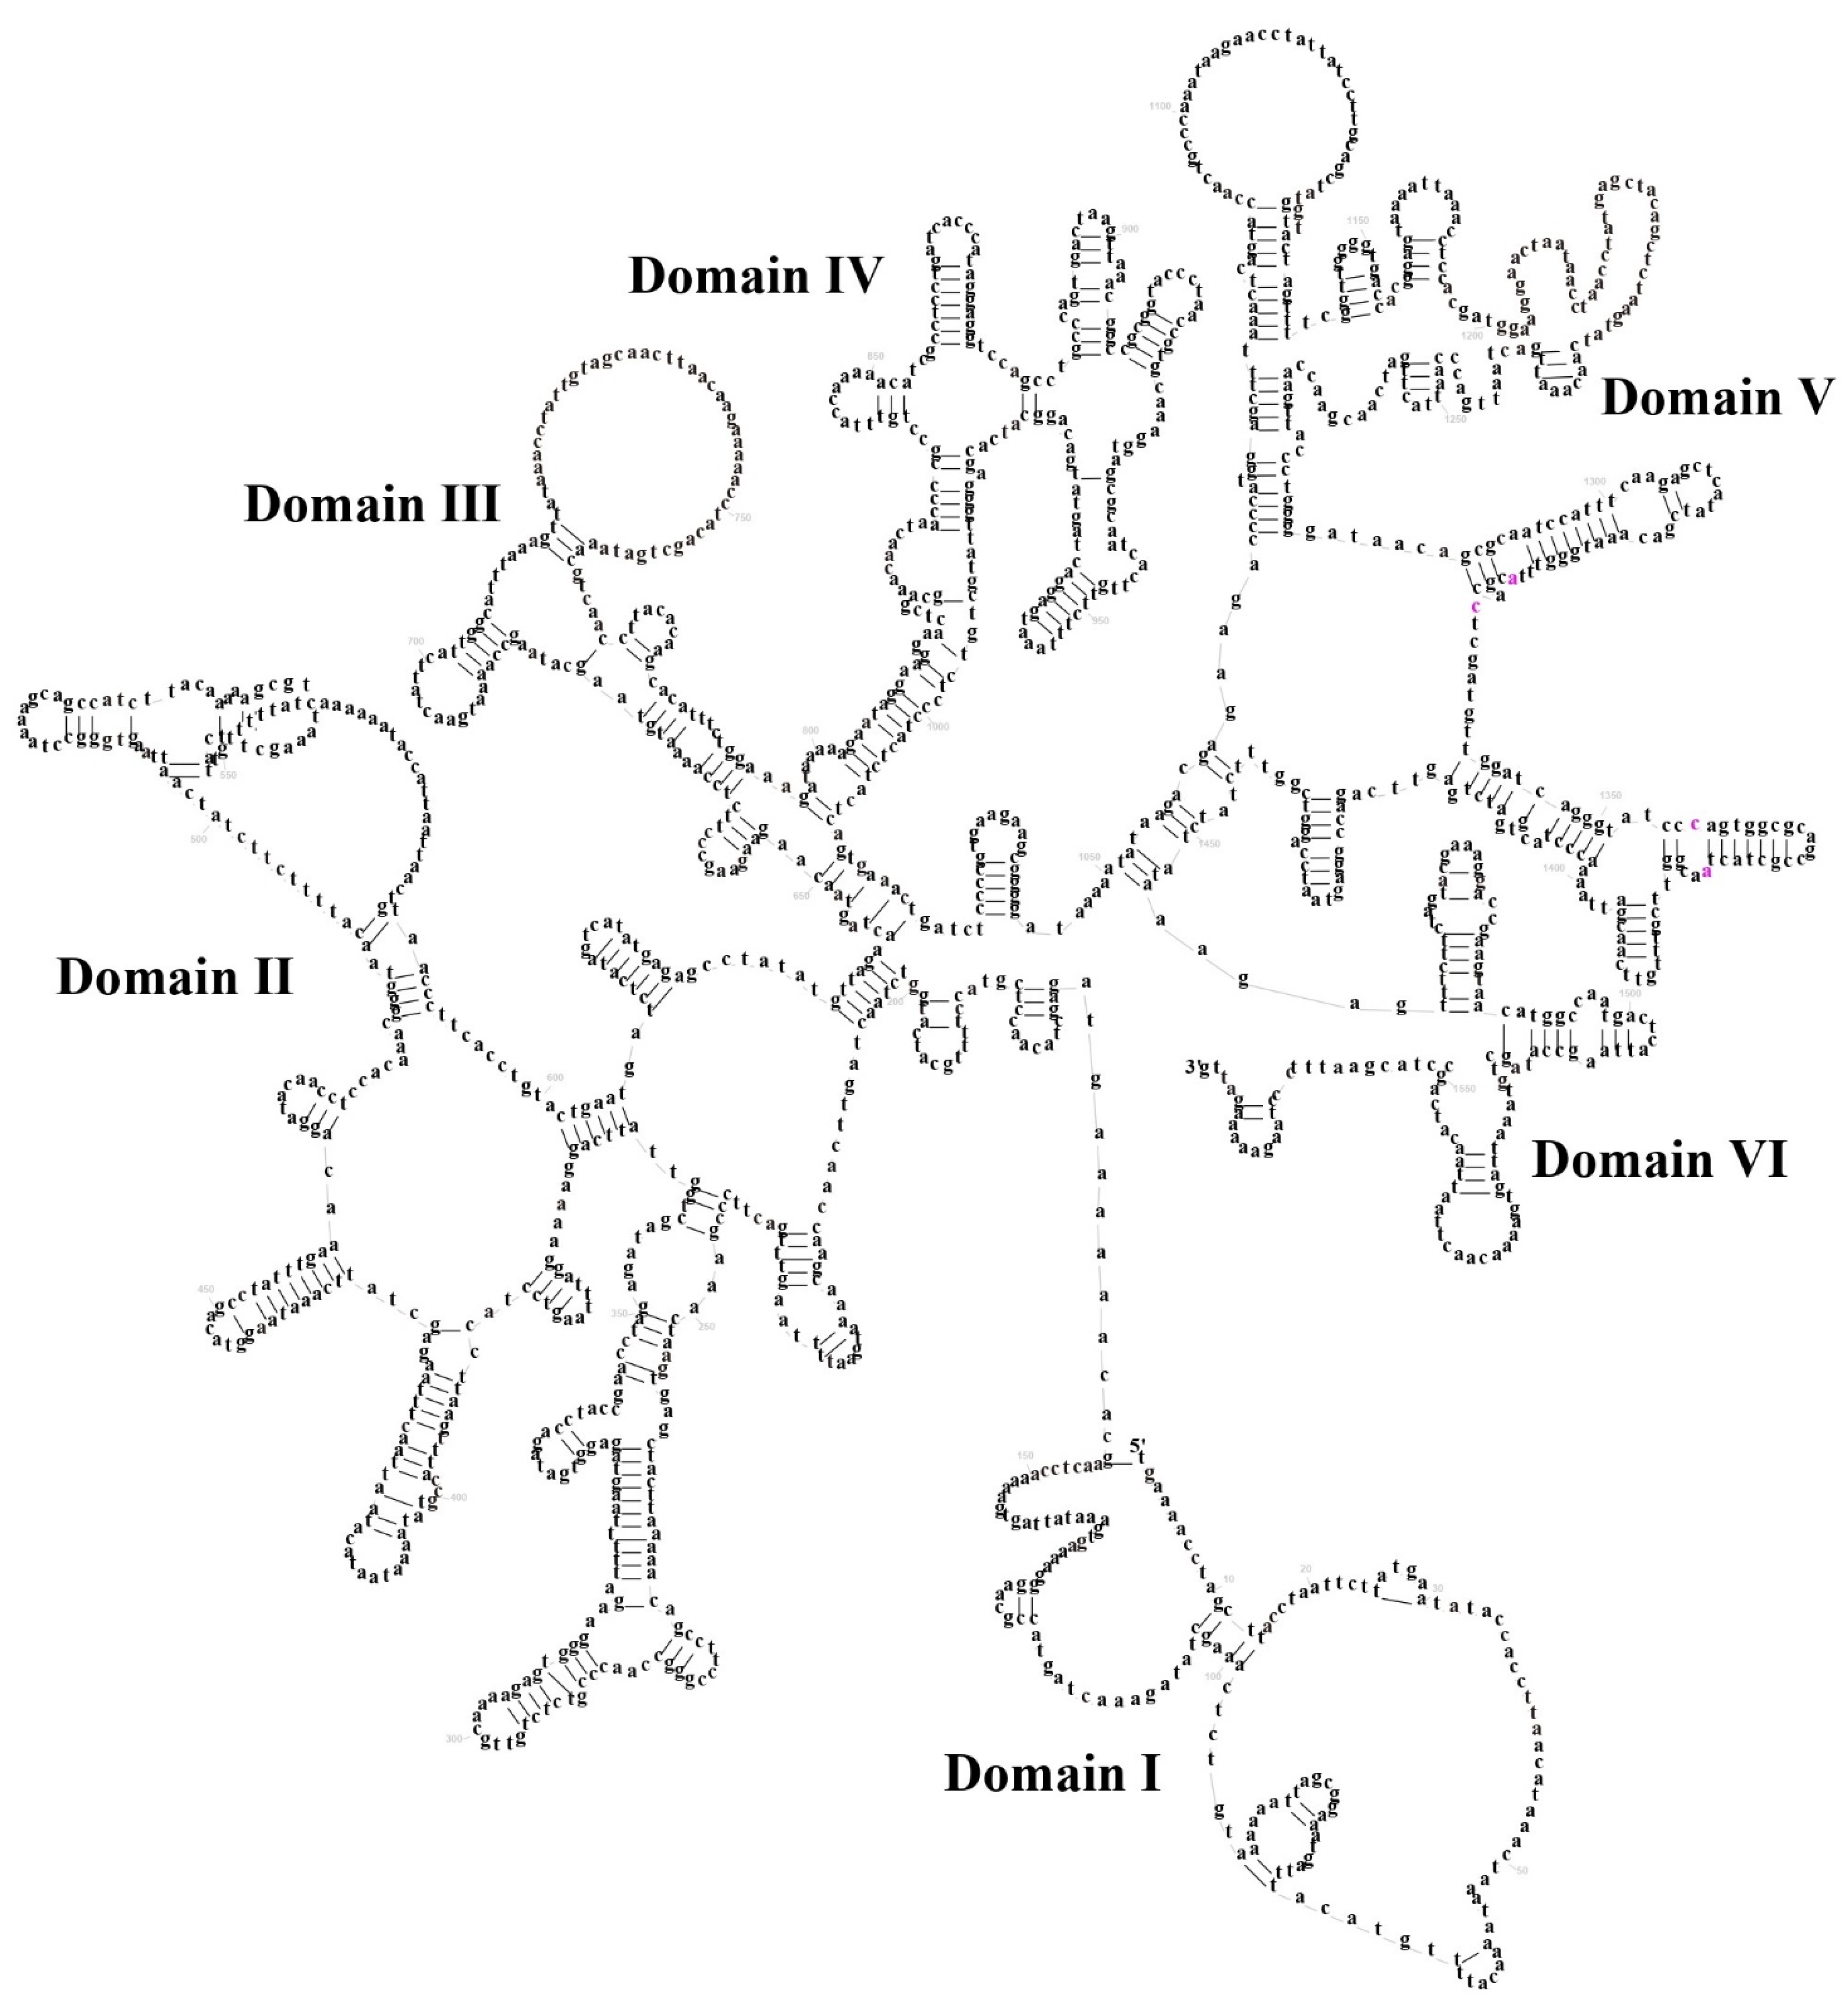
In M. fissipes, the total length of ribosomal RNA (rRNA) was determined to be 2516 base pairs (bp), with an A + T content of 58.62%. The 12S rRNA gene was found to span 937 bp, its position demarcated by the tRNA-Phe and tRNA-Val. The 16S rRNA gene was observed to be 1579 bp in length, situated between the tRNA-Val and tRNA-Leu (Table S1—Supplementary data). 12S and 16S rRNAs are located between tRNA-Phe and tRNA-Leu and separated by tRNA-Val, a feature that is common to the vertebrate mitogenome [33]. The predicted 12S rRNA and 16S rRNA gene secondary structures were constructed separately. The secondary structure of 12S rRNA comprises 40 stem–loop structures, encompassing domains I–IV. Domains I and II are classified as variable regions, while domains III and IV are designated as conserved regions (Figure 4). The secondary structure of 16S rRNA comprises 71 stem–loop structures, which form six structural domains (III–VI) (Figure 5). These domains are distinguished from one another by a single-stranded segment. Of particular note are structural domains I–III and VI, which exhibit variability, and structural domains IV and V, which demonstrate conservation. The initiation of L-strand replication (OL) with a 31-base pair (bp) segment between tRNA-Asn and tRNA-Cys may result in the formation of a stem–loop secondary structure, exhibiting characteristics analogous to most vertebrate motifs [29,31,34]. This motif has been demonstrated to be associated with the transition from RNA to DNA synthesis in humans [35].

3.4. The Control Region

A thorough investigation was conducted to ascertain the presence of conserved structural elements within the control region of M. fissipes. The largest non-coding region in the mitochondrial genome is the control region (CR, 1339 bp), with an AT content of 61.09%, located between Cytb and tRNA-Leu (Table S1—Supplementary data). Furthermore, the CR model demonstrates negative AT skew (−0.083) and GC skew (−0.278) in M. fissipes.

3.5. Synonymous and Nonsynonymous Substitution Rate

In order to assess the selection pressure on mitochondrial protein-coding genes, we analyzed the rate of non-synonymous (Ka) and synonymous (Ks) substitutions in 13 protein-coding genes between eight species (M. fissipes, M. okinavensis, M. beilunensis, M. taraiensis, M. mixtura, M. pulchra, M. butleri and M. heymonsi). An analysis of the data revealed that the majority of the genes exhibited Ka/Ks ratios less than 1 (Figure 6). This finding indicates that most of the genes undergo a strong purifying selection effect. In the COX2 and COX3 genes, the Ka/Ks ratio is greater than 1 between some species, while the remaining PCGs show purifying selection, indicating that the evolutionary process aims to eliminate harmful mutations. It is noteworthy that the Ka/Ks ratios of the Cytb, COX1, and ATP6 genes were marginally lower compared to the other genes. This finding suggests that these genes may exhibit a more conserved function in these regions. The results of this study contribute to the scientific community’s understanding of the evolutionary dynamics of the mitochondrial genome in the family Microhylidae. Furthermore, they have systematic implications for resolving phylogenetic relationships within the subfamily.

3.6. Phylogenetic Analyses

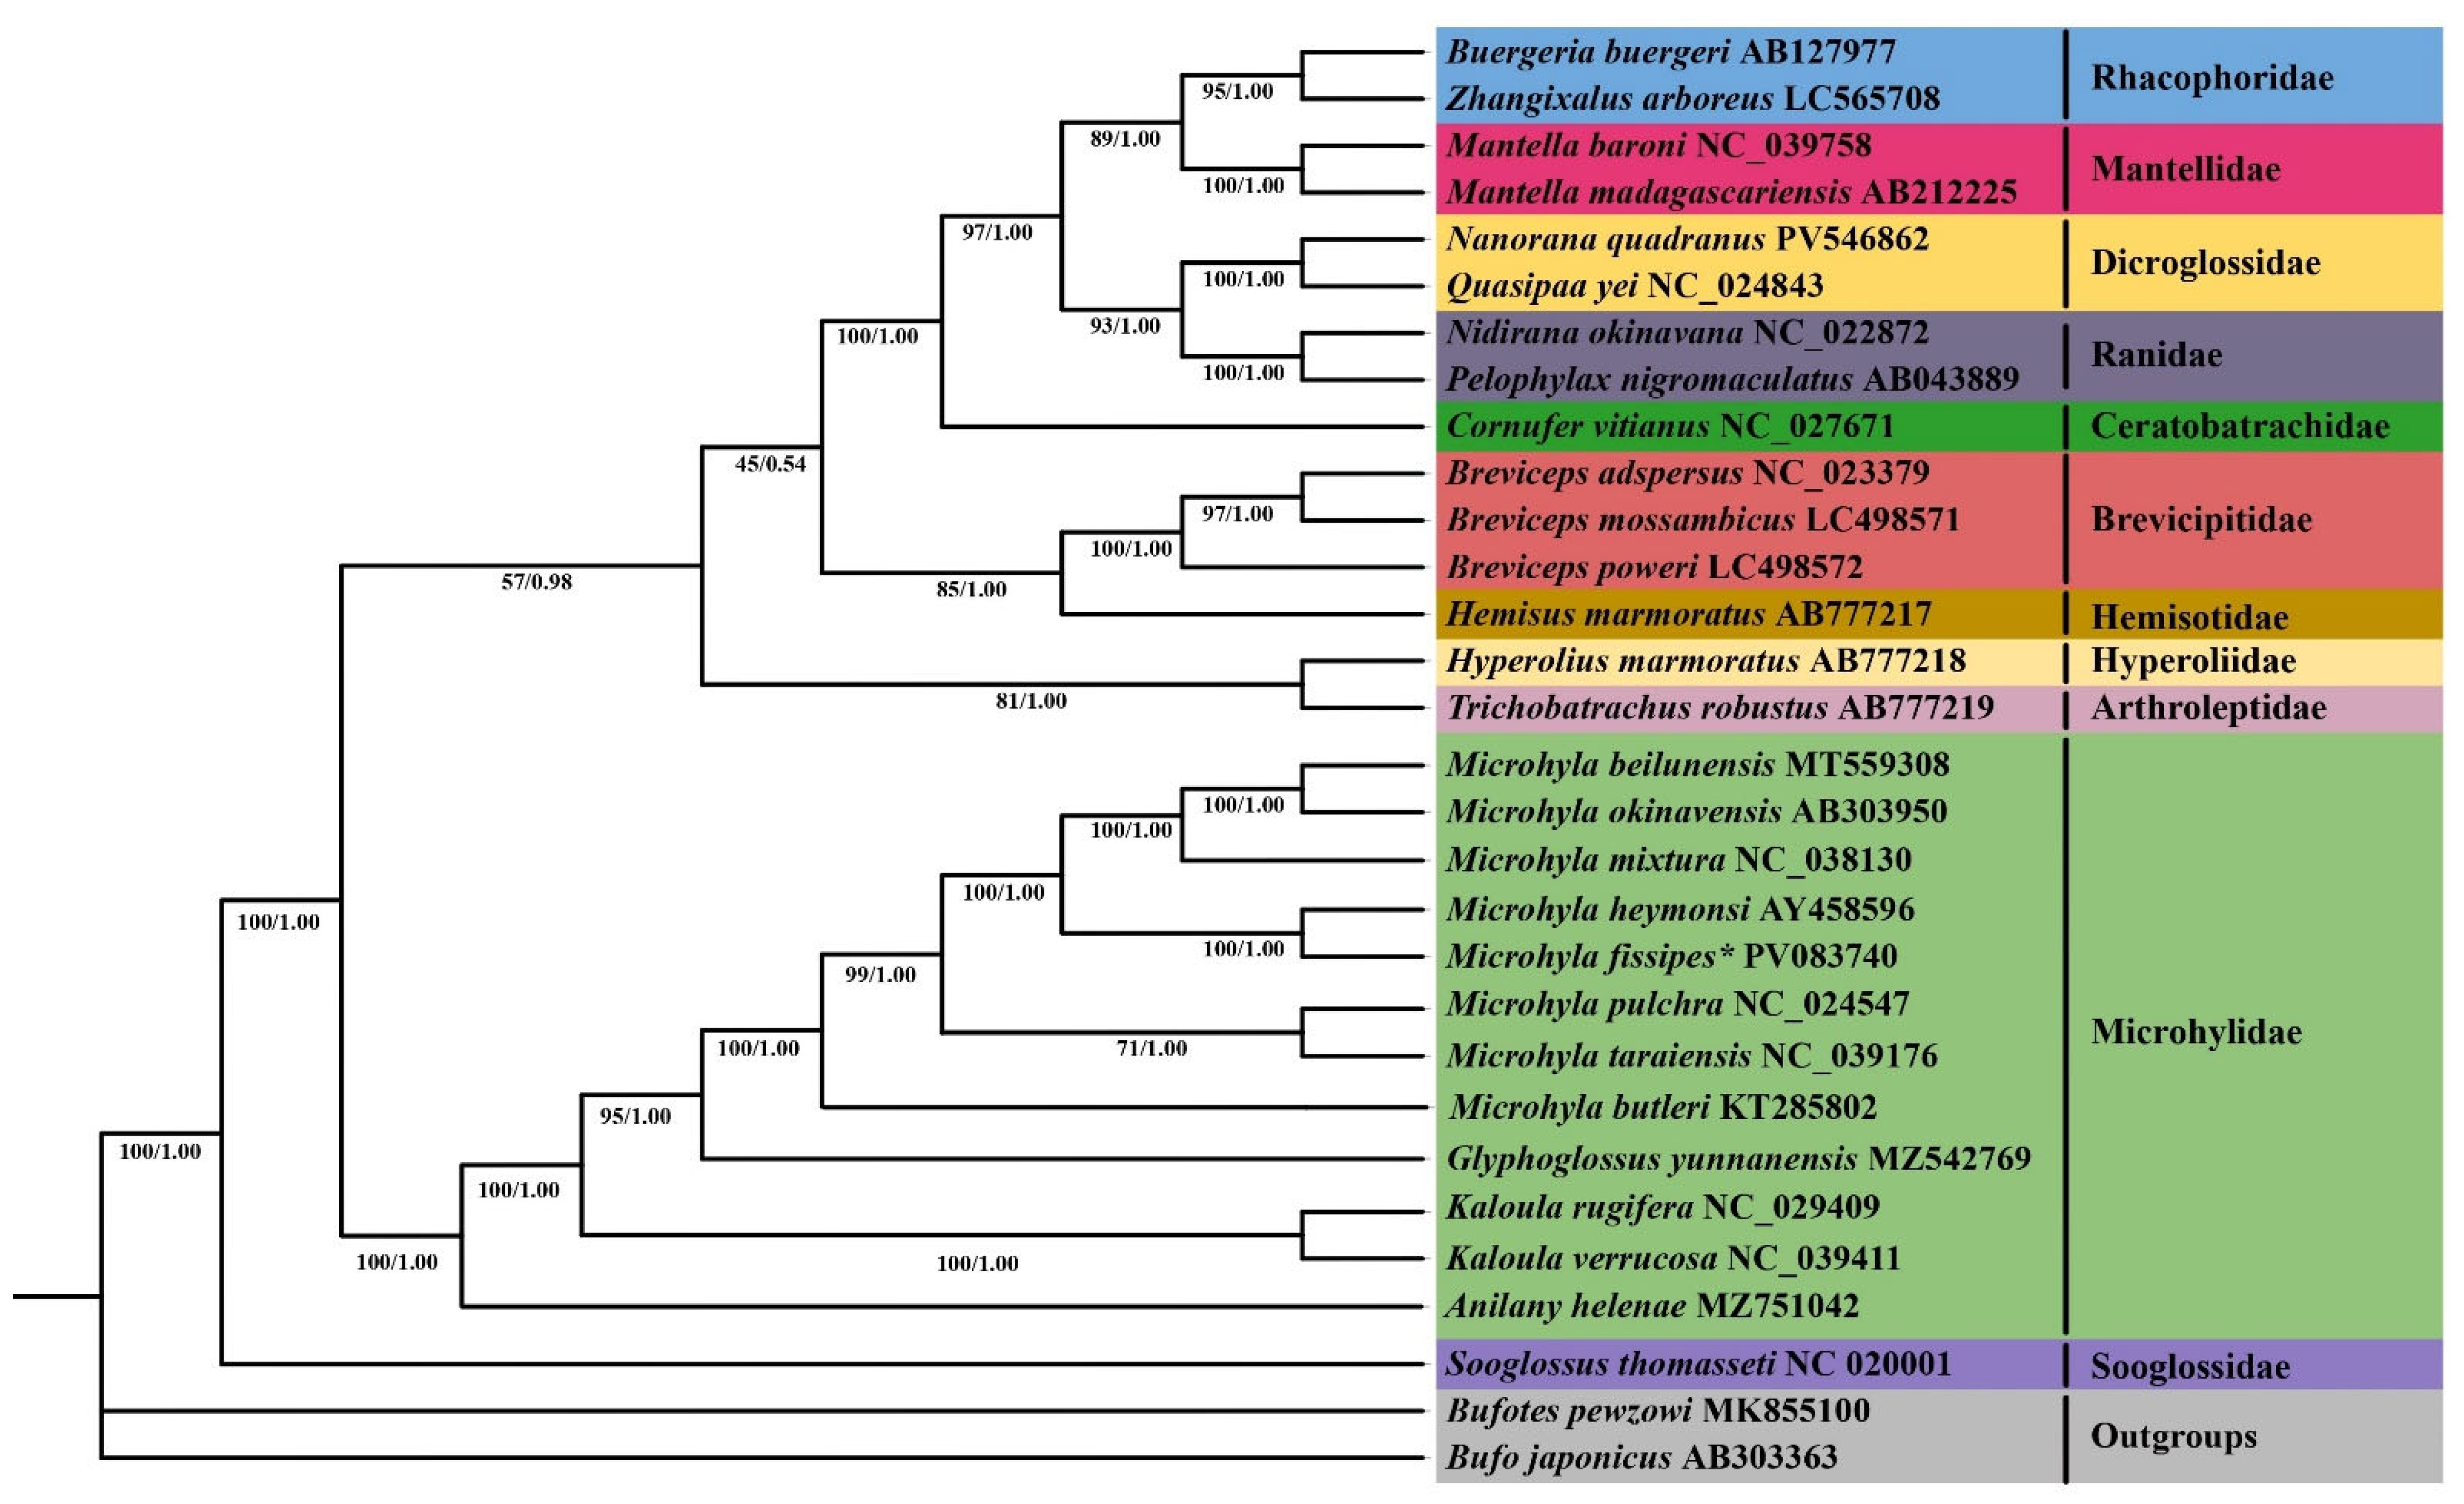
Phylogenetic trees were reconstructed based on 13 protein-coding genes from 30 species, using Bufotes pewzowi and Bufo japonicus as outgroups. Both maximum likelihood (ML) and Bayesian inference (BI) analyses produced identical topologies of species lineages (Figure 7). The results demonstrate that the phylogenetic relationships within Microhylidae—encompassing Kaloula, Microhyla, Glyphoglossus, and Anilany—are consistent with those reported in previous classification systems [6]. Among them, Microhyla and Glyphoglossus formed a sister group with a guide value of 95, indicating that they are more closely related genetically. Within the target lineage Microhyla, both ML and BI trees showed the following arrangement: (Microhyla butleri, ((Microhyla pulchra, Microhyla taraiensis), ((Microhyla fissipes, Microhyla heymonsi), (Microhyla mixtura, (Microhyla okinavensis, Microhyla beilunensis))))) (Figure 7). The study revealed that M. fissipes is sister to the branch comprising M. heymonsi, M. beilunensis, M. okinavensis, and M. mixtura. This finding is consistent with previous studies [1].

3.7. Divergence Time Estimation of Microhylidae Species

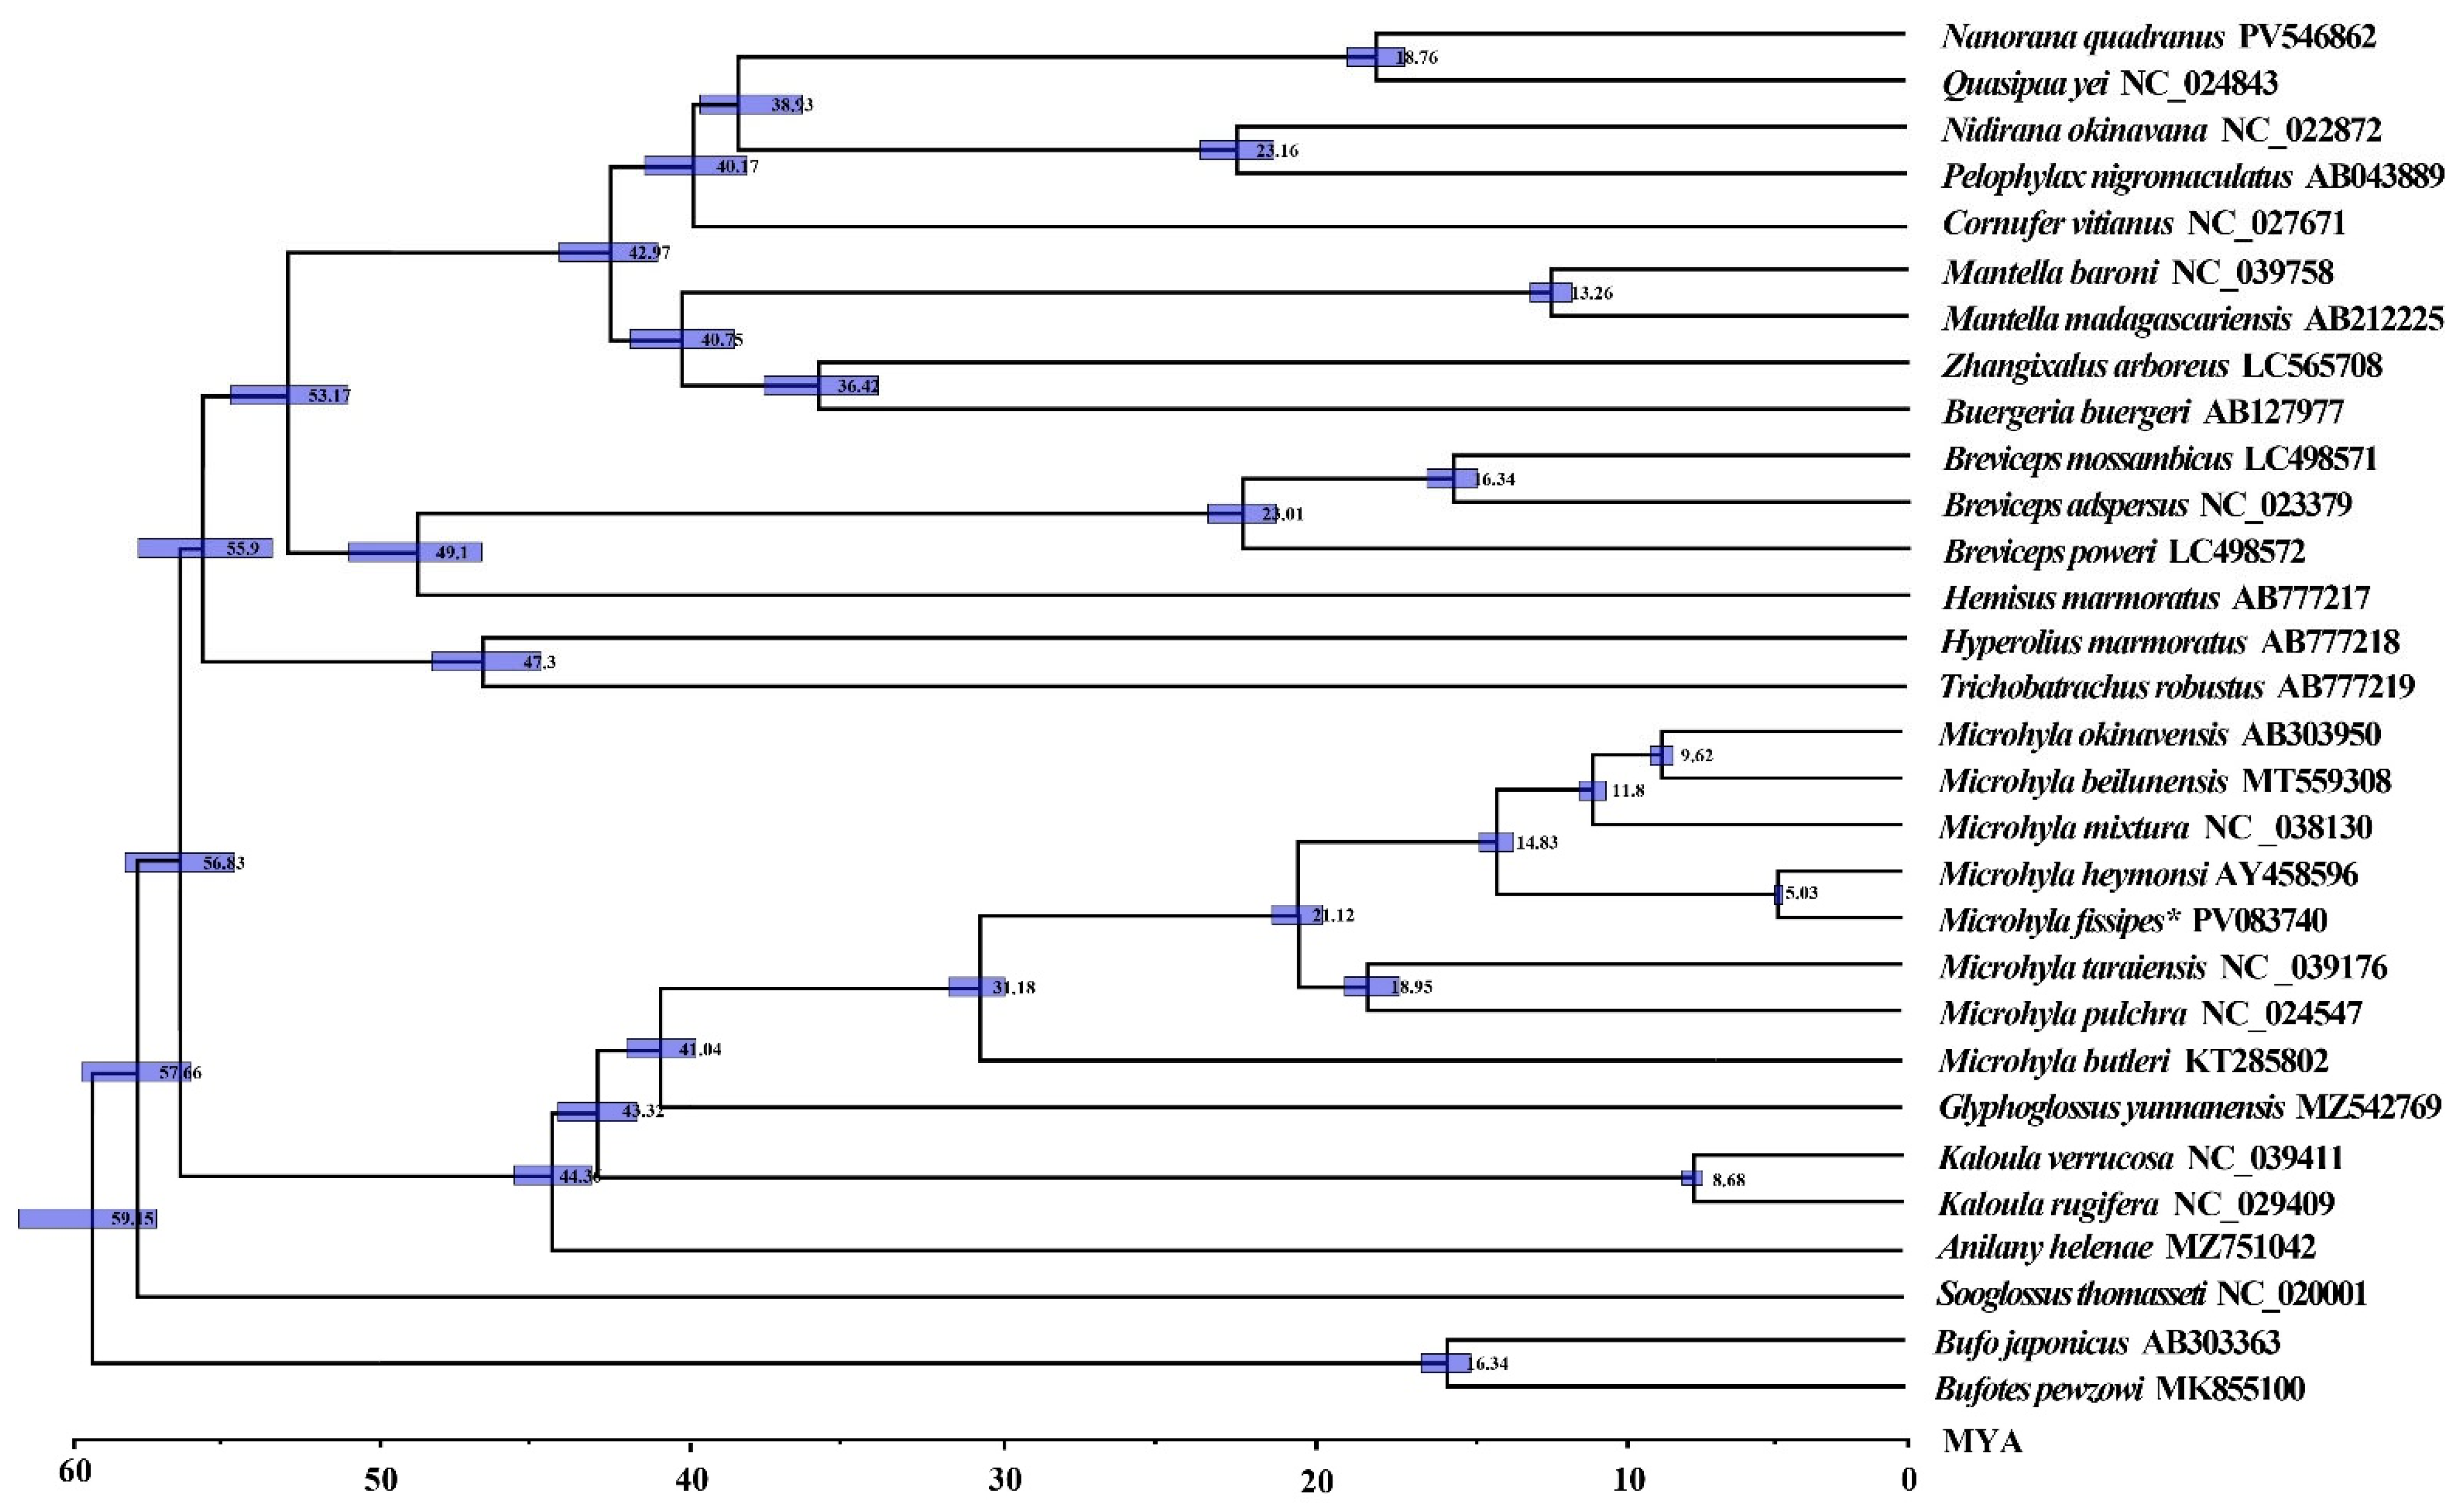
Divergence times among Microhylidae were estimated using Bayesian methods implemented in BEAST. The divergence of Microhyloidea occurred during the Eocene period of the Paleocene Epoch, approximately 56.83 Mya. Subsequently, it underwent a bifurcation into two main branches, one of which gave rise to families such as Rhacophoridae, Mantellidae, and Dicroglossidae (Figure 8). The divergence of M. fissipes and M. heymonsi is estimated to have occurred during the Neogene period of the Miocene epoch, approximately 5.03 Mya, while the origin of Microhyla can be traced back to the Eocene epoch, approximately 41.04 Mya.
The results of the present study suggest that Microhylidae originated in the Paleocene, with divergence among genera occurring afterward. During the Oligocene, this group underwent rapid diversification and dispersal, a phenomenon strongly shaped by concurrent geological and climatic shifts. The Paleocene (23–66 Mya) was characterized by an overall transition from warm to cool conditions, with intermittent temperature fluctuations that included an initial modest warming trend. Climatic temperatures reached their zenith during the early Eocene (33.7–53 Mya), followed by a pronounced cooling phase in the late Eocene. Throughout the middle and late Paleocene, the temperature decline was mainly due to increased global ice volume, sea level fall, expansion of grasslands, and reduction in vegetation cover, including tropical broadleaf forests [36]. The diversification of Microhylidae and its intragroup morphological disparity were strongly influenced by contemporaneous geological dynamics and the biogeographic patterns of their host plants during this epoch.

4. Discussion

4.1. Structural and Compositional Features of the M. fissipes Mitochondrial Genome

The mitogenome of M. fissipes exhibits a structure consistent with most vertebrates [8,29], characterized by a pronounced AT bias (59.91%)—a hallmark feature of vertebrate mitochondrial genomes likely influenced by selection related to replication and transcription efficiency [37]. This compositional tendency is further supported by negative AT-skew and GC-skew values, reflecting a nucleotide pattern where guanine (G) is the least abundant, a trend commonly observed in amphibians [38,39]. Such biases may contribute to mutation patterns and functional constraints within mitochondrial genes. The gene order and transcriptional direction are consistent with those reported in M. taraiensis [10]. The control region (CR) was confirmed to harbor key regulatory signals for replication and transcription initiation [40]. Additionally, as typical among amphibians, the total mitogenome length shows interspecific variation, which is also evident in M. fissipes [41].
A key feature observed in several protein-coding genes (ND1, ATP6, COX2, COX3, ND3, and ND4) is the presence of incomplete termination codons (T--), which are presumably converted to functional TAA stop codons via post-transcriptional polyadenylation [42]. Additionally, overlapping reading frames were detected in three gene pairs: ATP8-ATP6 (10 bp), ND4L-ND4 (7 bp), and ND5-ND6 (17 bp, opposite strand), along with shared nucleotides between certain protein-coding and tRNA genes. These compact genomic arrangements highlight the evolutionary pressure to minimize mtDNA size while maintaining functional integrity, a phenomenon widely documented across metazoan mitochondrial genomes [43]. The retention of these structural and compositional traits in M. fissipes underscores their critical role in mitochondrial function and evolutionary adaptation. Due to the lack of a dihydrouracil (DHU) ring in trnS1 in the secondary structure of tRNA, it cannot form a standard cloverleaf structure. As noted by Ohtsuki et al. [44], the lack of the DHU arm in tRNA-Ser suggests that incomplete tRNAs can still be adapted to the ribosome by adjusting their functional and structural conformation. And stem mismatches seem to be a common phenomenon in mitochondrial tRNA genes and may be repaired by a post-transcriptional editing process [45].

4.2. Phylogenetic Analysis of Microhylidae

Over the past decade, molecular assessments have revolutionized our understanding of amphibian diversity in tropical island ecosystems, consistently revealing substantial underestimations of species richness [46,47]. This pattern is particularly evident in morphologically conserved groups such as microhylid frogs, where pronounced genetic differentiation frequently occurs despite minimal morphological variation at the species level [48]. The genus Microhyla exemplifies this trend, with accumulating molecular evidence from multiple studies [49,50] demonstrating that current taxonomic frameworks significantly underestimate its true diversity. These molecular findings, which reveal a severe underestimation of species diversity, have urgent practical implications for the conservation of amphibians in tropical island ecosystems. Unidentified cryptic species cannot receive targeted conservation assessments and actions, and are at high risk of extinction. Specifically regarding the M. fissipes complex, our research suggests it may contain multiple deeply divergent cryptic species. This implies that the current understanding based on a single-species concept severely misleads conservation practices: the actual distribution range of each cryptic species may be far smaller than recorded, population sizes are significantly overestimated, and the unique threats they face cannot be accurately assessed. This situation is particularly concerning on tropical islands with fragile and highly fragmented habitats. There is an urgent need for comprehensive taxonomic revisions based on molecular evidence, followed by independent conservation assessments for each newly identified species and the development of tailored management strategies. This study contributes to this growing body of knowledge, providing important taxonomic insights into this morphologically complex yet genetically diverse amphibian group.
Recent molecular phylogenetic studies on Microhyla frogs have yielded both congruent and conflicting topologies depending on the genetic markers employed. Our analysis of 13 protein-coding genes, 2 rRNAs, and 22 tRNAs recovered a lineage structured as (Microhyla butleri, ((Microhyla pulchra, Microhyla taraiensis), ((Microhyla fissipes, Microhyla heymonsi), (Microhyla mixtura, (Microhyla okinavensis, Microhyla beilunensis))))), consistent with earlier findings by Kurabayashi et al. [51], jiang et al. [8] and Yong et al. [52], but differing from an alternative topology proposed by Matsui et al. [53]. However, other studies using different molecular datasets have generated discordant results: analyses of 12S rRNA, BDNF, tyrosinase, and 28S sequences placed M. butleri distant from M. ornata [54], while combined mitochondrial and nuclear gene datasets [55] and 12S rRNA sequences [56] supported distinct placements of M. butleri relative to other species. Our maximum likelihood and Bayesian analyses strongly support M. butleri in a basal position, corroborating van der Meijden et al. [57], Pyron & Wiens [55], and Howlader et al. [56], while also identifying M. fissipes as sister to M. okinavensis + M. mixtura + M. beilunensis and Glyphoglossus yunnanensis as sister to Microhyla—findings that align with previous microhylid phylogenies [51]. These results collectively highlight both consistent patterns and persistent conflicts in Microhyla systematics, underscoring the need for integrative taxonomic approaches to resolve these evolutionary relationships.

4.3. Divergence Time and Selective Pressure

The BEAST-derived chronogram (Figure 8) indicates that the most recent common ancestor (MRCA) of Microhyla and Glyphoglossus emerged during the late Paleocene to early Eocene (ca. 41.0 Mya, 95% HPD: 38.1–44.2). This estimate aligns with Feng et al. [58] (48.8 Mya, 45.9–53.2) and Gorin et al. [7] (50.8 Mya, 44.1–57.0) but predates Garg & Biju’s [59] proposed origin at 61.5 Mya (56.6–66.5). The Microhyla + Glyphoglossus clade underwent rapid radiation in the middle Eocene (43.8 Mya, 38.7–49.1), slightly more recent than Garg & Biju’s [59] estimation of 48.7 Mya (44.1–53.2) for this cladogenetic event. Subsequent diversification within these genus-level endemic lineages commenced in the early to mid-Oligocene (20–35 Mya), consistent with previous findings. Detailed node ages with corresponding 95% highest posterior density (HPD) intervals are provided in Figure 8.
Our results suggest that Microhylidae diverged around 56.83 Mya, consistent with published estimates [60]. The early Oligocene (~34 Mya) marked a critical period for Microhylidae diversification, coinciding with global climatic shifts following Antarctic glaciation [61]. These environmental changes, characterized by cooling and aridification, likely promoted allopatric speciation through habitat fragmentation while creating new ecological opportunities for amphibian radiation [62]. Such paleoclimatic conditions may explain both the timing and pattern of Microhylidae diversification, including the evolutionary trajectory of M. fissipes and closely related species. While mitochondrial phylogenies provide valuable insights, comprehensive understanding of Microhylidae evolution will require integration of nuclear genomic data with expanded taxonomic sampling and morphological evidence.
Analysis of selective pressures reveals distinct evolutionary patterns among mitochondrial protein-coding genes (PCGs) in M. fissipes. The majority of genes exhibit strong purifying selection (ω = ka/ks << 1), consistent with their essential metabolic functions [63,64]. Notably, COX1 demonstrates exceptional evolutionary constraint (ω as low as 0.0018), reflecting its critical role in oxygen reduction within the electron transport chain [65]. Such extreme conservation aligns with mitochondrial genes’ fundamental position in cellular energy production [66], where structural integrity must be maintained to preserve core metabolic functions. A striking exception emerges in ATP8, which shows significantly elevated ω values (0.2–0.4876) compared to other PCGs. This pattern suggests either: (1) reduced functional constraints due to its minor contribution to ATP synthase complex activity [67], or (2) positive selection at specific sites responding to environmental adaptations [68]. The observed pattern in M. fissipes corroborates widespread reports of relaxed selection on ATP8 across taxa [67], warranting future investigation through site-specific selection analyses to elucidate its evolutionary drivers.
Unlike other comparisons, the COX2 and COX3 genes in M. fissipes and M. okinavensis exhibit unusually high Ka/Ks ratios (approaching or slightly exceeding 1), significantly deviating from the expected pattern of strong purifying selection typically observed in mitochondrial core genes. This anomalous signal suggests that the relevant genes may have undergone a unique evolutionary trajectory: a temporary relaxation of functional constraints [69] (e.g., ecological niche shifts reducing selective pressure) or weak positive selection events [68] (e.g., subunits fine-tuned to adapt to specialized environments) may have driven the recent evolution of these key genes in the COX complex of this lineage. Notably, such high Ka/Ks values are observed exclusively in the M. okinavensis-related pair, indicating lineage-specific evolutionary dynamics [70]; while in other interspecific comparisons, COX2/COX3 strictly follow a purifying selection pattern (Ka/Ks << 1). Future studies should combine site-specific selection models with functional experiments to verify whether these mutations drove adaptive differentiation in the M. okinavensis lineage or reflect compensatory mechanisms in mitochondrial-nuclear coevolution.

5. Conclusions

Here, we characterized the complete mitochondrial genome of M. fissipes. Comparative genomic analysis demonstrated high conservation across Microhylidae species, evidenced by stable base composition, uniform genome size and organization, conserved protein-coding genes (PCGs) with consistent codon usage, and structurally conserved tRNA secondary folds. To elucidate phylogenetic relationships, we performed Bayesian inference (BI) and maximum likelihood (ML) analyses using 13 PCGs. The resulting phylogeny exhibited a well-resolved topology with robust nodal support across all branches. Both ML and BI methods yielded congruent tree topologies, strongly confirming the monophyly of recognized genera within the group. Our findings further clarify the phylogenetic relationships within Microhylidae, strongly supporting the clade (((Glyphoglossus, Microhyla), Kaloula), Anilany). Within Microhyla, both ML and BI analyses consistently recovered the following topology: (Microhyla butleri, ((Microhyla pulchra, Microhyla taraiensis), ((Microhyla fissipes, Microhyla heymonsi), (Microhyla mixtura, (Microhyla okinavensis, Microhyla beilunensis))))). Divergence time estimation places the origin of Microhylidae near the Paleocene-Eocene boundary (Paleogene period), providing key temporal context for the group’s evolutionary history. These results deliver essential phylogenetic insights, establishing a robust framework for future studies on Microhylidae systematics and evolution. The well-resolved relationships and divergence timing presented here will facilitate deeper investigations into the family’s diversification patterns and biogeographic history. This study emphasizes that accurate classification and delineation are the cornerstones of effective protection for morphologically protected amphibians, and M. fissipes serves as a model for incorporating molecular systematics into wildlife management frameworks.

Supplementary Materials

The following supporting information can be downloaded at: https://www.mdpi.com/article/10.3390/biology14101342/s1. Figure S1: Secondary structure predictions for 22 tRNA genes of Microhyla fissipes; Table S1: Annotation of the mitochondrial genome of Microhyla fissipes.

Author Contributions

S.S.: conceptualization, data curation, formal analysis, software, writing—original draft, writing—review and editing; S.C.: methodology, formal analysis, validation, visualization, writing—original draft, writing—review and editing; C.L.: formal analysis, sample collection, data curation; investigation, methodology, writing—original draft; H.H.: investigation, resources, data curation; Y.L.: formal analysis, methodology, investigation, visualization; L.J.: conceptualization, supervision, software, data curation, writing—original draft, writing—review and editing, project administration, funding acquisition. All authors have read and agreed to the published version of the manuscript.

Funding

This research was funded by the Natural Science Foundation Project of Science and Technology Department of Sichuan Province (grant number: 2023NSFSC0206); the Research Project of Ecological Security and Protection Key Laboratory of Sichuan Province (grant number: ESP2003) and National College Students’ Innovation Training Program (grant number: 202510639023).

Institutional Review Board Statement

Not applicable.

Informed Consent Statement

Not applicable.

Data Availability Statement

Mitochondrial genome sequence data supporting the findings of this study are openly available from GenBank of the National Center for Biotechnology Information (NCBI) at https://www.ncbi.nlm.nih.gov (accession number: PV083740).

Acknowledgments

We appreciate the people who assisted with the DNA preparation and helpful suggestions in the preparation of the manuscript.

Conflicts of Interest

The authors declare no conflicts of interest.

References

  1. Han, N.; Wu, Z.; Zhang, L.; Wei, X. The complete mitogenome of Microhyla fissipes (Anura: Microhylidae) and phylogenetic analysis using GenBank data mining. Mitochondrial DNA Part B 2019, 4, 3049–3050. [Google Scholar] [CrossRef]
  2. Lin, J.S.; Liu, F.R. The complete mitochondrial genome of Microhyla fissipes (Amphidia, Anura, Microhylidae) from Taiwan. Mitochondrial DNA Part B 2017, 2, 930–931. [Google Scholar] [CrossRef]
  3. Keeling, P.J.; Archibald, J.M. Organelle evolution: What’s in a name? Curr. Biol. 2008, 18, R345–R347. [Google Scholar] [CrossRef]
  4. Murat, F.; Mbengue, N.; Winge, S.B.; Trefzer, T.; Leushkin, E.; Sepp, M.; Cardoso-Moreira, M.; Schmidt, J.; Schneider, C.; Mößinger, K.; et al. The molecular evolution of spermatogenesis across mammals. Nature 2023, 613, 308–316. [Google Scholar] [CrossRef]
  5. Wang, R.; Tursun, M.; Shan, W. Complete Mitogenomes of Xinjiang Hares and Their Selective Pressure Considerations. Int. J. Mol. Sci. 2024, 25, 11925. [Google Scholar] [CrossRef] [PubMed]
  6. Kurabayashi, A.; Sumida, M. Afrobatrachian mitochondrial genomes: Genome reorganization, gene rearrangement mechanisms, and evolutionary trends of duplicated and rearranged genes. BMC Genom. 2013, 14, 633. [Google Scholar] [CrossRef]
  7. Gorin, V.A.; Solovyeva, E.N.; Hasan, M.; Okamiya, H.; Karunarathna, D.M.S.S.; Pawangkhanant, P.; de Silva, A.; Juthong, W.; Milto, K.D.; Nguyen, L.T.; et al. A little frog leaps a long way: Compounded colonizations of the Indian Subcontinent discovered in the tiny Oriental frog genus Microhyla (Amphibia: Microhylidae). PeerJ 2020, 8, e9411. [Google Scholar] [CrossRef]
  8. Jiang, L.; Zhao, L.; Cheng, D.; Zhu, L.; Zhang, M.; Ruan, Q.; Chen, W. The complete mitochondrial genome sequence of the Sichuan Digging Frog, Kaloula rugifera (Anura: Microhylidae) and its phylogenetic implications. Gene 2017, 626, 367–375. [Google Scholar] [CrossRef] [PubMed]
  9. Zhao, Y.; Meng, H.; Su, L. The complete mitochondrial genome of the mixtured pygmy frog Microhyla mixtura (Anura, Microhylidae). Conserv. Genet. Resour. 2018, 10, 427–430. [Google Scholar] [CrossRef]
  10. Khatiwada, J.R.; Wang, S.; Shu, G.; Xie, F.; Jiang, J. The mitochondrial genome of the Microhyla taraiensis (Anura: Microhylidae) and related phylogenetic analyses. Conserv. Genet. Resour. 2018, 10, 441–444. [Google Scholar] [CrossRef]
  11. Fedorin, N.D.; Chuykova, O.V.; Eprintsev, T.A. Modification of the Method for Isolating MicroRNA from Plants by Phenol–Chloroform Extraction Using Polyethylene Glycol 1500. Biochem. Suppl. Ser. B Biomed. Chem. 2023, 17, 26–30. [Google Scholar] [CrossRef]
  12. Grant, J.R.; Enns, E.; Marinier, E.; Mandal, A.; Herman, E.K.; Chen, C.; Graham, M.; van Domselaar, G.; Stothard, P. Proksee: In-depth characterization and visualization of bacterial genomes. Nucleic Acids Res. 2023, 51, W484–W492. [Google Scholar] [CrossRef] [PubMed]
  13. Chan, P.P.; Lin, B.Y.; Mak, A.J.; Lowe, T.M. tRNAscan-SE 2.0: Improved detection and functional classification of transfer RNA genes. Nucleic Acids Res. 2021, 49, 9077–9096. [Google Scholar] [CrossRef]
  14. Sweeney, B.A.; Hoksza, D.; Nawrocki, E.P.; Ribas, C.E.; Madeira, F.; Cannone, J.J.; Gutell, R.; Maddala, A.; Meade, C.D.; Williams, L.D.; et al. R2DT is a framework for predicting and visualising RNA secondary structure using templates. Nat. Commun. 2021, 12, 3494. [Google Scholar] [CrossRef]
  15. Laslett, D.; Canbäck, B. ARWEN: A program to detect tRNA genes in metazoan mitochondrial nucleotide sequences. Bioinformatics 2008, 24, 172–175. [Google Scholar] [CrossRef]
  16. Tamura, K.; Glen, S.; Sudhir, K. MEGA11: Molecular Evolutionary Genetics Analysis version 11. Mol. Biol. Evol. 2021, 38, 3022–3027. [Google Scholar] [CrossRef]
  17. Perna, N.T.; Kocher, T.D. Patterns of nucleotide composition at fourfold degenerate sites of animal mitochondrial genomes. J. Mol. Evol. 1995, 41, 353–358. [Google Scholar] [CrossRef]
  18. Zhang, D.; Gao, F.; Li, W.X.; Jakovli’c, I.; Zhou, H.; Zhang, J.; Wang, G.T. PhyloSuite: An integrated and scalable desktop platform for streamlined molecular sequence data management and evolutionary phylogenetics studies. Mol. Ecol. Resour. 2020, 20, 348–355. [Google Scholar] [CrossRef]
  19. Katoh, K.; Standley, D.M. MAFFT multiple sequence alignment software version 7: Improvements in performance and usability. Mol. Biol. Evol. 2013, 30, 772–780. [Google Scholar] [CrossRef] [PubMed]
  20. Capella-Gutiérrez, S.; Silla-Martínez, J.M.; Gabaldón, T. trimAl: A tool for automated alignment trimming in large-scale phylogenetic analyses. Bioinformatics 2009, 25, 1972–1973. [Google Scholar] [CrossRef]
  21. Kalyaanamoorthy, S.; Minh, B.Q.; Wong, T.K.F.; von Haeseler, A.; Jermiin, L.S. ModelFinder: Fast model selection for accurate phylogenetic estimates. Nat. Methods 2017, 14, 587–589. [Google Scholar] [CrossRef] [PubMed]
  22. Nguyen, L.T.; Schmidt, H.A.; von Haeseler, A.; Minh, B.Q. IQ-TREE: A fast and effective stochastic algorithm for estimating maximum-likelihood phylogenies. Mol. Biol. Evol. 2015, 32, 268–274. [Google Scholar] [CrossRef]
  23. Ronquist, F.; Teslenko, M.; van der Mark, P.; Ayres, D.L.; Darling, A.; Höhna, S.; Larget, B.; Liu, L.; Suchard, M.A.; Huelsenbeck, J.P. MrBayes 3.2: Efficient Bayesian phylogenetic inference and model choice across a large model space. Syst. Biol. 2012, 61, 539–542. [Google Scholar] [CrossRef]
  24. Drummond, A.J.; Suchard, M.A.; Xie, D.; Rambaut, A. Bayesian phylogenetics with BEAUti and the BEAST 1.7. Mol. Biol. Evol. 2012, 29, 1969–1973. [Google Scholar] [CrossRef]
  25. Rambaut, A.; Drummond, A.J.; Xie, D.; Baele, G.; Suchard, M.A. Posterior Summarization in Bayesian Phylogenetics Using Tracer 1.7. Syst. Biol. 2018, 67, 901–904. [Google Scholar] [CrossRef]
  26. Baele, G.; Carvalho, L.M.; Brusselmans, M.; Dudas, G.; Ji, X.; McCrone, J.T.; Lemey, P.; Suchard, M.A.; Rambaut, A. HIPSTR: Highest independent posterior subtree reconstruction in TreeAnnotator X. bioRxiv 2024, 12, 627395. [Google Scholar] [CrossRef]
  27. Zhang, Z.; Li, J.; Zhao, X.-Q.; Wang, J.; Wong, G.K.-S.; Yu, J. KaKs_Calculator: Calculating Ka and Ks through Model Selection and Model Averaging. Genom. Proteom. Bioinform. 2006, 4, 259–263. [Google Scholar] [CrossRef]
  28. Zhang, Z. KaKs_Calculator 3.0: Calculating Selective Pressure on Coding and Non-Coding Sequences. Genom. Proteom. Bioinform. 2022, 20, 536–540. [Google Scholar] [CrossRef] [PubMed]
  29. Boore, J.L. Animal Mitochondrial Genomes. Nucleic Acids Res. 1999, 27, 1767–1780. [Google Scholar] [CrossRef] [PubMed]
  30. Hassanin, A.; Léger, N.; Deutsch, J. Evidence for multiple reversals of asymmetric mutational constraints during the evolution of the mitochondrial genome of Metazoa, and consequences for phylogenetic inferences. Syst. Biol. 2005, 54, 277–298. [Google Scholar] [CrossRef]
  31. Liu, Z.Q.; Wang, Y.Q.; Bing, S. The mitochondrial genome organization of the rice frog, Fejervarya limnocharis, (Amphibia: Anura): A new gene order in the vertebrate mtDNA. Gene 2005, 346, 145–151. [Google Scholar] [CrossRef]
  32. Wu, X.; Li, Y.; Zhang, H.; Yan, L.; Wu, X.B. The complete mitochondrial genome of Microhyla pulchra (Amphidia, Anura, Microhylidae). Mitochondrial DNA A DNA Mapp. Mitochondrial DNA Part A 2016, 27, 40–41. [Google Scholar] [CrossRef]
  33. Chen, L.; Lin, Y.; Xiao, Q.; Lin, Y.; Du, Y.; Lin, C.; Ward-Fear, E.; Hu, C.; Qu, Y.; Li, H. Characterization of the complete mitochondrial genome of the many-lined sun skink (Eutropis multifasciata) and comparison with other Scincomorpha species. Genomics 2020, 113, 2526–2536. [Google Scholar] [CrossRef]
  34. Su, X.; Wu, X.B.; Yan, P.; Cao, S.Y.; Hu, Y.L. Rearrangement of a mitochondrial tRNA gene of the concave-eared torrent frog, Amolops tormotus. Gene 2007, 394, 25–34. [Google Scholar] [CrossRef] [PubMed]
  35. Hixson, J.E.; Brown, W.M. A comparison of the small ribosomal RNA genes from the mitochondrial DNA of the great apes and humans: Sequence, structure, evolution, and phylogenetic implications. Mol. Biol. Evol. 1986, 3, 1–18. [Google Scholar] [CrossRef] [PubMed]
  36. Dan, Z.; Zhang, Y.; Chen, Z. Characterization of the Complete Mitochondrial Genome of Three Satyrid Butterfly Species (Satyrinae:Amathusiini) and Reconstructed Phylogeny of Satyrinae. Int. J. Mol. Sci. 2025, 26, 2609. [Google Scholar] [CrossRef]
  37. Mayfield, J.E.; McKenna, J.F. AT rich sequences in vertebrate DNA. Chromosoma 1978, 67, 157–163. [Google Scholar] [CrossRef]
  38. Zhang, J.; Luu, B.E.; Yu, D.; Zhang, L.; Al-Attar, R.; Storey, K.B. The complete mitochondrial genome of Dryophytes versicolor: Phylogenetic relationship among Hylidae and mitochondrial protein-coding gene expression in response to freezing and anoxia. Int. J. Biol. Macromol. 2019, 132, 461–469. [Google Scholar] [CrossRef]
  39. Cai, Y.; Li, Q.; Zhang, J.; Storey, K.B.; Yu, D. Characterization of the mitochondrial genomes of two toads, Anaxyrus americanus (Anura: Bufonidae) and Bufotes pewzowi (Anura: Bufonidae), with phylogenetic and selection pressure analyses. PeerJ 2020, 8, e8901. [Google Scholar] [CrossRef]
  40. Kurabayashi, A.; Ueshima, R. Complete sequence of the mitochondrial DNA of the primitive opisthobranch gastropod Pupa strigosa: Systematic implication of the genome organization. Mol. Biol. Evol. 2000, 17, 266–277. [Google Scholar] [CrossRef] [PubMed]
  41. Wolstenholme, D.R. Animal mitochondrial DNA: Structure and evolution. Int. Rev. Cytol. 1992, 141, 173–216. [Google Scholar] [CrossRef]
  42. Ojala, D.; Montoya, J.; Attardi, G. tRNA punctuation model of RNA processing in human mitochondria. Nature 1981, 290, 470–474. [Google Scholar] [CrossRef]
  43. Curole, J.P.; Kocher, T.D. Mitogenomics: Digging deeper with complete mitochondrial genomes. Trends Ecol. Evol. 1999, 14, 394–398. [Google Scholar] [CrossRef]
  44. Ohtsuki, T.; Kawai, G.; Watanabe, K. The Minimal tRNA: Unique Structure of Ascaris suum Mitochondrial tRNASerUCU Having a Short T Arm and Lacking the Entire D Arm. FEBS Lett. 2002, 514, 37–43. [Google Scholar] [CrossRef] [PubMed]
  45. Lavrov, D.V.; Brown, W.M.; Boore, J.L. A novel type of RNA editing occurs in the mitochondrial tRNAs of the centipede Lithobius forficatus. Proc. Natl. Acad. Sci. USA 2000, 97, 13738–13742. [Google Scholar] [CrossRef]
  46. Meegaskumbura, M.; Bossuyt, F.; Pethiyagoda, R.; Manamendra-Arachchi, K.; Bahir, M.; Milinkovitch, M.C.; Schneider, C.J. Sri Lanka: An amphibian hot spot. Science 2002, 298, 379. [Google Scholar] [CrossRef]
  47. Oliver, P.M.; Iannella, A.; Richards, S.J.; Lee, M.S.Y. Mountain colonisation, miniaturisation and ecological evolution in a radiation of direct-developing New Guinea Frogs (Choerophryne, Microhylidae). PeerJ 2017, 5, e3077. [Google Scholar] [CrossRef] [PubMed]
  48. Das, A.; Garg, S.; Hamidy, A.; Smith, E.N.; Biju, S.D. A new species of Micryletta frog (Microhylidae) from Northeast India. PeerJ 2019, 7, e7012. [Google Scholar] [CrossRef]
  49. Poyarkov, N.A.; Nguyen, T.V.; Duong, T.V.; Gorin, V.A.; Yang, J. Anew limestone-dwelling species of Micryletta (Amphibia: Anura: Microhylidae) from northern Vietnam. PeerJ 2018, 6, e5771. [Google Scholar] [CrossRef] [PubMed]
  50. Alhadi, F.; Hamidy, A.; Farajallah, A.; Munir, M.; Atmaja, V.Y.; Garg, S.; Biju, S.D.; Smith, E.N. Rediscovery of Micryletta inornata (Boulenger, 1890) from Sumatra: Redescription, molecular identity and taxonomic implications. Zootaxa 2019, 4613, 111–126. [Google Scholar] [CrossRef]
  51. Kurabayashi, A.; Matsui, M.; Belabut, D.M.; Yong, H.S.; Ahmad, N.; Sudin, A.; Kuramoto, M.; Hamidy, A.; Sumida, M. From Antarctica or Asia? New colonization scenario for Australian-New Guinean narrow mouth toads suggested from the findings on a mysterious genus Gastrophrynoides. BMC Evol. Biol. 2011, 11, 175. [Google Scholar] [CrossRef]
  52. Yong, H.; Song, S.; Lim, P.; Eamsobhana, P.; Tan, J. Complete mitochondrial genome and phylogeny of Microhyla butleri (Amphibia: Anura: Microhylidae). Biochem. Syst. Ecol. 2016, 66, 243–253. [Google Scholar] [CrossRef]
  53. Matsui, M.; Hamidy, A.; Belabut, D.M.; Ahmad, N.; Panha, S.; Sudin, A.; Khonsue, W.; Oh, H.; Yong, H.; Jiang, J.; et al. Systematic relationships of Oriental tiny frogs of the family Microhylidae (Amphibia, Anura) as revealed by mtDNA genealogy. Mol. Phylogenet. Evol. 2011, 61, 167–176. [Google Scholar] [CrossRef]
  54. deSá, R.O.; Streicher, J.W.; Sekonyela, R.; Forlani, M.C.; Loader, S.P.; Greenbaum, E.; Haddad, C.F. Molecular phylogeny of microhylid frogs (Anura: Microhylidae) with emphasis on relationships among New World genera. BMC Evol. Biol. 2012, 12, 241. [Google Scholar] [CrossRef]
  55. Pyron, R.A.; Wiens, J.J. A large-scale phylogeny of Amphibia including over 2800 species, and a revised classification of extant frogs, salamanders, and caecilians. Mol. Phylogenet. Evol. 2011, 61, 543–583. [Google Scholar] [CrossRef]
  56. Howlader, M.S.A.; Nair, A.; Gopalan, S.V.; Merilä, J. A new species of Microhyla (Anura: Microhylidae) from Nilphamari, Bangladesh. PLoS ONE 2015, 10, e0119825. [Google Scholar] [CrossRef]
  57. Meijden, A.V.; Vences, M.; Hoegg, S.; Boistel, R.; Channing, A.; Meyer, A. Nuclear gene phylogeny of narrow-mouthed toads (Family: Microhylidae) and a discussion of competing hypotheses concerning their biogeographical origins. Mol. Phylogenet. Evol. 2007, 44, 1017–1030. [Google Scholar] [CrossRef] [PubMed]
  58. Feng, Y.; Blackburn, D.C.; Liang, D.; Hillis, D.M.; Wake, D.B.; Cannatella, D.C.; Zhang, P. Phylogenomics reveals rapid, simultaneous diversification of three major clades of Gondwanan frogs at the Cretaceous-Paleogene boundary. Proc. Natl. Acad. Sci. USA 2017, 114, E5864–E5870. [Google Scholar] [CrossRef]
  59. Garg, S.; Biju, S.D. New microhylid frog genus from Peninsular India with Southeast Asian affinity suggests multiple Cenozoic biotic exchanges between India and Eurasia. Sci. Rep. 2019, 9, 1906. [Google Scholar] [CrossRef] [PubMed]
  60. Peloso, P.L.V.; Frost, D.R.; Richards, S.J.; Rodrigues, M.T.; Donnellan, S.; Matsui, M.; Raxworthy, C.J.; Biju, S.D.; Lemmon, E.M.; Lemmon, A.R.; et al. The impact of anchored phylogenomics and taxon sampling on phylogenetic inference in narrow–mouthed frogs (Anura, Microhylidae). Cladistics 2016, 32, 113–140. [Google Scholar] [CrossRef]
  61. Zhang, J.; Hu, Y.; Zhu, C.; Flögel, S.; Fang, X.; Sun, J. Modeling the effects of global cooling and the Tethyan Seaway closure on North African and South Asian climates during the Middle Miocene Climate Transition. Palaeogeogr. Palaeoclimatol. Palaeoecol. 2023, 619, 111541. [Google Scholar] [CrossRef]
  62. Zachos, J.; Pagani, M.; Sloan, L.; Thomas, E.; Billups, K. Trends, Rhythms, and Aberrations in Global Climate 65 Ma to Present. Science 2001, 292, 686–693. [Google Scholar] [CrossRef]
  63. Gissi, C.; Iannelli, F.; Pesole, G. Evolution of the mitochondrial genome of Metazoa as exemplified by comparison of congeneric species. Heredity 2008, 101, 301–320. [Google Scholar] [CrossRef]
  64. Wang, J.; Tai, J.; Zhang, W.; He, K.; Lan, H.; Liu, H. Comparison of Seven Complete Mitochondrial Genomes from Lamprologus and Neolamprologus (Chordata, Teleostei, Perciformes) and the Phylogenetic Implications for Cichlidae. ZooKeys 2023, 1184, 115–132. [Google Scholar] [CrossRef]
  65. Ballard, J.W.; Whitlock, M.C. The incomplete natural history of mitochondria. Mol. Ecol. 2004, 13, 729–744. [Google Scholar] [CrossRef]
  66. Basu, U.; Bostwick, A.M.; Das, K.; Dittenhafer-Reed, K.E.; Patel, S.S. Structure, mechanism, and regulation of mitochondrial DNA transcription initiation. J. Biol. Chem. 2020, 295, 18406–18425. [Google Scholar] [CrossRef] [PubMed]
  67. Havird, J.C.; Noe, G.R.; Link, L.; Torres, A.; Logan, D.C.; Sloan, D.B.; Chicco, A.J. Do angiosperms with highly divergent mitochondrial genomes have altered mitochondrial function? Mitochondrion 2019, 49, 1–11. [Google Scholar] [CrossRef]
  68. Shen, Y.; Shi, P.; Sun, Y.; Zhang, Y. Relaxation of selective constraints on avian mitochondrial DNA following the degeneration of flight ability. Genome Res. 2009, 19, 1760–1765. [Google Scholar] [CrossRef]
  69. Garvin, M.R.; Bielawski, J.P.; Gharrett, A.J. Positive Darwinian selection in the piston that powers proton pumps in complex I of the mitochondria of Pacific salmon. PLoS ONE 2011, 6, e24127. [Google Scholar] [CrossRef]
  70. da-Fonseca, R.R.; Johnson, W.E.; O’Brien, S.J.; Ramos, M.J.; Antunes, A. The adaptive evolution of the mammalian mitochondrial genome. BMC Genom. 2008, 9, 119. [Google Scholar] [CrossRef] [PubMed]
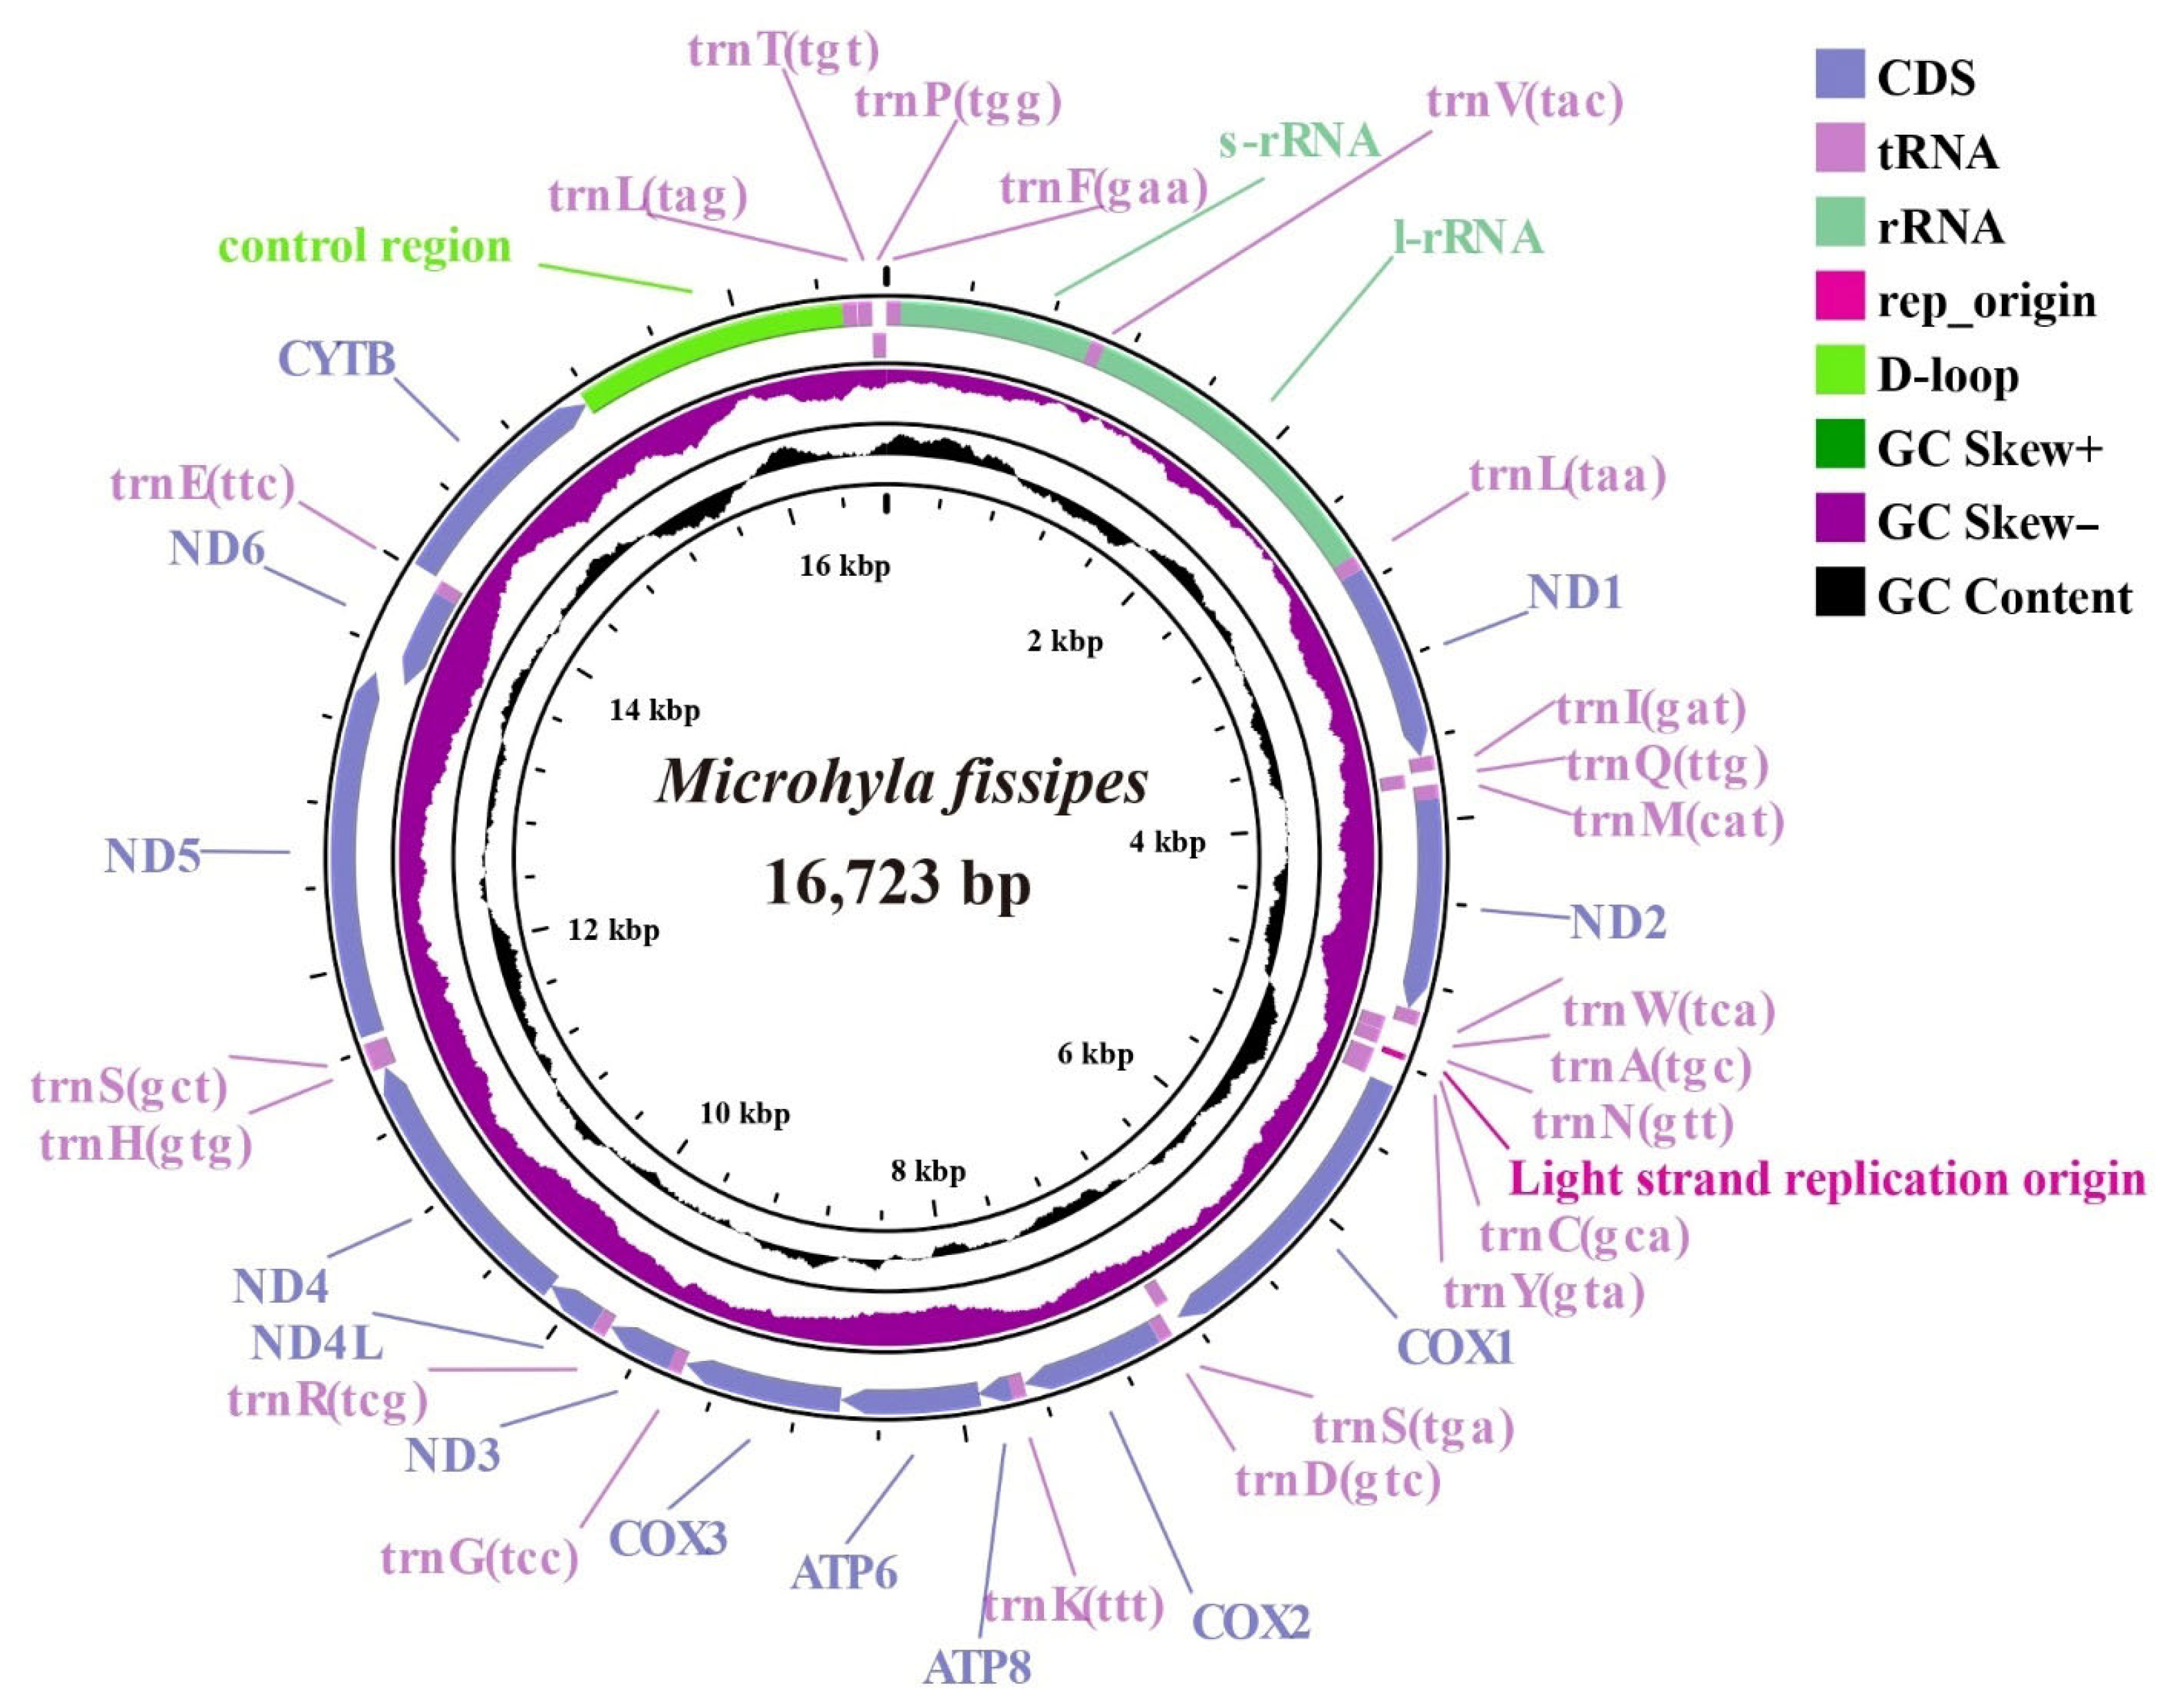
Figure 1. Complete mitogenome circles map of Microhyla fissipes; purple represents tRNA, green represents rRNA, and black areas represent GC content.
Biology 14 01342 g001
Figure 2. Relative Synonymous Codon Usage (RSCU) in Microhyla fissipes mitogenome.
Biology 14 01342 g002
Figure 3. Amino acid composition of protein-coding genes in Microhyla fissipes.
Biology 14 01342 g003
Figure 4. The prognostic map of 12S rRNA secondary structures in Microhyla fissipes.
Biology 14 01342 g004
Figure 5. The prognostic map of 16S rRNA secondary structures in Microhyla fissipes.
Biology 14 01342 g005
Figure 6. The Ka/Ks values among the Microhyla species.
Biology 14 01342 g006
Figure 7. Maximum-likelihood (ML) and Bayesian inference (BI) phylogenetic tree of sixteen frog species based on 13 protein-coding genes. ML bootstraps and BI posterior probabilities are shown at the node. The GenBank accession numbers are listed following species names. Species sequenced in this study are indicated by Latin names with asterisks.
Biology 14 01342 g007
Figure 8. The divergence time of Microhyloidea with 95% highest posterior probability density. Numbers nearby nodes refer to divergence times. Blue bars indicate 95% highest posterior density intervals (HPD) for nodes of interest. The “*” represents the current study.
Biology 14 01342 g008
Table 1. Nucleotide composition of different partitions from Microhyla fissipes mitogenomes.
RegionSize (bp)A (%)T (%)G (%)C (%)A + T (%)G + C (%)AT SkewGC Skew
Mitogenome16,72328.931.0114.5825.5159.9140.09−0.035−0.272
tRNAs153428.6828.2922.8220.2156.9843.020.0070.061
rRNAs251633.4725.1618.3623.0158.6241.380.142−0.112
PCGs11,30126.8333.6314.3425.2160.4539.55−0.112−0.275
PCGs (1st)376528.1525.7923.7222.3453.9446.060.0440.030
PCGs (2nd)376517.5841.4312.828.1859.0240.98−0.404−0.375
PCGs (3rd)376534.7933.556.5125.1568.3431.660.018−0.589
CR133928.0133.0814.0424.8761.0938.91−0.083−0.278
Disclaimer/Publisher’s Note: The statements, opinions and data contained in all publications are solely those of the individual author(s) and contributor(s) and not of MDPI and/or the editor(s). MDPI and/or the editor(s) disclaim responsibility for any injury to people or property resulting from any ideas, methods, instructions or products referred to in the content.