Article

Characterization of the Complete Mitogenome of Polypedates braueri (Anura, Rhacophoridae, Polypedates) and Insights into the Phylogenetic Relationships of Rhacophoridae

Key Laboratory for Molecular Biology and Biopharmaceutics, School of Life Science and Technology, Mianyang Teachers’ College, Mianyang 621000, China
*
Author to whom correspondence should be addressed.
These authors contributed equally to this work.
Biology 2025, 14(9), 1299; https://doi.org/10.3390/biology14091299
Submission received: 5 August 2025 / Revised: 13 September 2025 / Accepted: 16 September 2025 / Published: 20 September 2025
(This article belongs to the Special Issue Progress in Wildlife Conservation, Management and Biological Research)

Simple Summary

The white-lipped tree frogs, Polypedates braueri, belongs to the family Rhacophoridae. It is distributed in tropical and subtropical China. P. braueri holds significant scientific and eco-logical importance, yet it has received little attention so far. In this study, we reported the characterization of the mitogenome of P. braueri, and further investigated the phylogenetic relationships of Rhacophoridae. These results showed that the mitogenome of P. braueri had a total size of 20,254 bp, a circular arrangement, and contained 12 PCGs, 22 tRNAs, two rRNAs, and two non-coding regions. The base compositions were 29.70% A, 32.17% T, 23.05% C, and 15.08% G, respectively. Moreover, the phylogenetic analyses demonstrated that Rhacophoridae can be classified into four monophyletic genera, and P. braueri is closely related to Polypedates megacephalus and Polypedates leucomystax. The selective pressure analysis indicated that the COX1 and ND1 genes are particularly effective for distinguishing between closely related species within the genus Polypedates, whereas the ND4L gene is the optimal choice for conducting population-level genetic studies. The present study enriched the basic biological data for P. braueri and provided fundamental references for the conservation of P. braueri and Rhacophoridae.

Abstract

White-lipped tree frogs, Polypedates braueri, are currently included in the list of terrestrial wildlife with important ecological, scientific, and social value in China. Understanding the structure and characteristics of the mitochondrial genome provides essential information for resource conservation and phylogenetic analyses of P. braueri. While the complete mitochondrial genomes serve as important molecular markers for phylogenetic and genetic studies, the mitochondrial genome of P. braueri has received little attention. In this paper, we analyzed the characterization of the mitochondrial genome of P. braueri and investigated the phylogenetic relationships of Rhacophoridae. The complete mitochondrial genome of P. braueri was 20,254 bp in length, containing thirty-six genes (twelve protein-coding genes (PCGs), two ribosomal RNA genes (rRNAs), twenty-two transfer RNA genes (tRNAs)), three non-coding regions for the origin of light strand (OL), and two control regions (CR). There were six overlapping regions and seventeen intergenic spacer regions in the mitogenome. The mitogenome also showed a bias towards A + T content (61.87%) and had negative AT-skew (−0.039) and GC-skew (−0.209). All the PCGs employed the ATG, ATA, or ATT as the start codon and TAA, TAG, AGG, or single T as the stop codon. Additionally, all of the tRNAs displayed a typical cloverleaf secondary structure, except trnS1, which lacked the D arm. The phylogenetic analysis, based on the maximum likelihood (ML) and Bayesian inference (BI) methods, revealed that Rhacophoridae could be classified into four monophyletic genera. The phylogenetic status of P. braueri was closely related to that of Polypedates megacephalus and Polypedates leucomystax. Additionally, selective pressure analysis suggested that COX1 and ND1 were highly efficient for discriminating closely related species in the genus Polypedates, while ND4L was the most appropriate marker for population-level genetic analyses. The diversification of the Polypedates commenced during the Late Oligocene and extended into the Miocene. The present study provides valuable genomic information on P. braueri and new insights into the phylogenetic relationships of Rhacophoridae.

1. Introduction

The Rhacophoridae family represents one of the most diverse amphibian groups, ranking as the fifth largest within the Anura order, with approximately 450 described species [1]. Commonly known as tree frogs or shrub frogs, these arboreal species are widely distributed across tropical and subtropical Asia, extending into southern Africa, encompassing regions such as India, Sri Lanka, Japan, the Philippines, and the Greater Sundas. Among this diversity of species, the white-lipped tree frog (Polypedates braueri) [2] is widely distributed across southern China, including provinces such as Yunnan, Guangxi, Guangdong, and Taiwan [3]. Nevertheless, molecular biological studies on P. braueri remain limited, resulting in an unclear phylogenetic position. This knowledge gap underscores the importance of further research on this species, as it holds significant potential for advancing biodiversity and evolutionary studies in East Asia.
Mitochondria, crucial organelles for energy production in eukaryotic cells, retain their own semi-autonomous genetic material—the mitochondrial genome (mitogenome) [4,5,6]. The mitogenome is particularly valuable for evolutionary and phylogenetic studies due to its relatively rapid evolutionary rate, predominantly maternal inheritance pattern [7,8], compact size, conserved gene content, and accessibility [9,10]. Compared to individual mitochondrial genes, the complete mitogenome offers a more comprehensive genetic dataset [9], enhancing its utility. The typical vertebrate mitogenome structure comprises 37 genes: 13 protein-coding genes (PCGs), 2 ribosomal RNAs (12S and 16S rRNA), 22 transfer RNAs (tRNAs), and a major non-coding control region (CR or D-loop), forming a circular molecule generally ranging from 15 to 22 kilobase pairs in length [11].
Molecular phylogenetic analyses have established that Rhacophoridae is a monophyletic group, traditionally subdivided into two subfamilies, Buergerinae and Rhacophorinae [12]. However, the taxonomic system within the family, particularly at the genus level, has been subject to ongoing revision and debate, largely due to morphological conservatism and convergent evolution in key traits [13,14]. Recent advances in molecular systematics, particularly utilizing complete mitogenomic data and nuclear genes, have provided powerful tools to resolve these taxonomic discrepancies. For instance, comprehensive phylogenetic studies have led to the recognition and redefinition of several genera, such as Zhangixalus and Polypedates [13,15]. Despite these efforts, the relationships within certain groups, including the genus Polypedates, remain partially unresolved, with some proposed genera suggested to be para- or polyphyletic, indicating the need for further data and taxon sampling [12]. Previous studies have included P. Braueri in phylogenetic analyses: An et al. [16] conducted a comprehensive analysis including P. braueri and 13 other frog species, while Li et al. [17,18] demonstrated that P. braueri and Polypedates megacephalus constitute a well-supported monophyletic clade, with the genus Rhacophorus positioned as the sister group to Polypedates. Further evidence from Kuraishi et al. [19] revealed that P. braueri forms a distinct clade with P. cf. Mutus 1 and P. cf. Mutus 2, suggesting a recent common ancestry and late divergence. Consistent with these findings, the phylogenetic tree constructed by Yang et al. [20] positioned P. braueri and P. mutus in closely adjacent nodes with comparatively short branch lengths, further supporting their close evolutionary relationship.
To address the limitations of these studies and clarify the sister group relationships among P. braueri, Polypedates leucomystax, and P. megacephalus, this study aims to analyze the sequence characteristics of the complete mitogenome of P. braueri. By doing so, we seek to determine its phylogenetic position more accurately. These new molecular data will not only provide scientific evidence for the conservation of this species but could also lay an important foundation for the future exploration of molecular evolution within the genus.

2. Materials and Methods

2.1. Ethics Approval

All experimental procedures involving P. braueri strictly followed the Wildlife Protection Law of the People’s Republic of China and were approved by the Scientific Research Ethics Committee of Mianyang Teachers’ College (Approval No.: MSL202532). The study complied with established animal welfare guidelines, and every effort was made to reduce harm and discomfort to the animals during the entire research process.

2.2. Specimen Collection and DNA Extraction

The P. braueri specimens examined in this study were collected from Mount Eme, in Leshan City, Sichuan Province, Southwestern China (29°54′72.18″ N, 103°33′90.87″ E; elevation: 3099 m a.s.l). Immediately after capture, the interdigital webbing was disinfected with alcohol, after which roughly 50 mg of tissue was carefully removed. The site was then sterilized again before the animal was released back to its natural environment. Right after collection, tissue samples were preserved in anhydrous ethanol under aseptic conditions to maintain their structural and genetic integrity. All samples were subsequently stored at −20 °C in Sichuan Province’s Key Laboratory of Ecological Security and Conservation until further processing. Total genomic DNA was extracted from ethanol-preserved muscle tissues using a modified phenol/chloroform protocol [21]. Tissue samples (approximately 25 mg) were homogenized in STE buffer (10 mM Tris/HCl, 100 mM NaCl, 1 mM EDTA; pH 8.0) and digested with Proteinase K (0.1 mg/mL) at 55 °C for 4–12 h. Following organic extraction with phenol–chloroform– isoamyl alcohol (25:24:1), nucleic acids were ethanol-precipitated and resuspended in TE buffer (10 mM Tris/HCl, 1 mM EDTA; pH 8.0). DNA purity and concentration were assessed spectrophotometrically prior to PCR amplification.

2.3. Primer Design and PCR Amplification

The complete mitogenome was amplified through a series of twelve overlapping PCR fragments (200–350 bp overlap) using both conventional and long-amplification PCR approaches (Table S1). Primer design incorporated two strategies: (1) conserved regions were targeted by aligning sequences of closely related species, laying the foundation for subsequent experimental design, and (2) reference sequences used in this research were sourced from sequences previously published in the relevant literature [22]. Standard PCR reactions (TaKaRa LA Taq® kit, Dalian, China, 25 μL total volume) contained 2.5 μL 10× buffer, 2.0 μL MgCl2 (25 mM), 1.5 μL dNTPs (2.5 mM each), 1.0 μL each primer (10 μM), 1.0 μL template DNA (20 ng/μL), 0.6 μL LA Taq polymerase (5 U/μL), and nuclease-free water. Thermal cycling parameters included initial denaturation at 94 °C (5 min) and 35–40 cycles of 94 °C (20 s), 50 °C (30 s), and 72 °C (2–5 min), followed by final extension at 72 °C (10 min). Amplification products were size-verified by agarose gel electrophoresis, purified using commercial kits (E.Z.N.A.® Gel Extraction Kit, NC, USA), and subsequently sequenced bidirectionally via Sanger methodology.

2.4. Sequence Assembly, Analysis, and Annotation

The complete mitogenome of P. braueri was reconstructed using Sanger sequencing data processed through DNA Baser v5.20, with 200–350 bp overlapping regions ensuring accurate contig assembly. Following GenBank submission (accession: PV083739), comprehensive genomic characterization was performed using multiple bioinformatics tools: (1) DAMBE 7.0 [23] for PCG quantification and base composition analysis; (2) MEGA 11.0 [24] for RSCU calculation and AT/GC skew determination using standard formulas [GC − skew = (G − C)/(G + C); AT − skew = (A − T)/(A + T)] [25]; (3) MITOS v3.0.1 [26] to identify tRNA genes and map their secondary structures; based on the 12S and 16S rRNA sequences of the three species, the corresponding 12S rRNA and 16S rRNA secondary structure maps were drawn by R2DT v1.3 [27]; and (4) Proksee 3.0 [28] for genome visualization. Manual annotation complemented computational analyses, particularly for identifying spacer regions, gene overlaps, and conserved elements, including the origin of light-strand replication (OL) and control region (D-loop), through comparative genomics approaches.

2.5. Phylogenetic Analyses

To elucidate the phylogenetic position of P. braueri, we conducted comprehensive analyses using representative Rhacophoridae species. The study incorporated two rRNA and thirteen protein-coding gene (PCG) datasets, which were first processed using PhyloSuite [29]. After alignment analysis of these datasets, gaps and ambiguously aligned regions were removed to ensure the reliability of subsequent analyses; Microhyla pulchra and Breviceps adspersus were used as outgroups in the analyses. Sequence alignment was performed using MAFFT v7.505, employing standard mode for rRNA and codon-aware alignment for PCGs [30]. The concatenated data matrix was evaluated under the Akaike Information Criterion (AIC) to determine optimal substitution models [31]. Phylogenetic reconstruction was conducted through both Bayesian inference (BI) and maximum likelihood (ML) approaches. BI analysis was implemented in MrBayes 3.2.6 [32] using a partitioned model with two parallel runs of 200,000 generations, discarding the initial 25% as burn-in. Parallel ML analysis was performed using IQ-TREE v2.0.3 [33], with nodal support assessed through bootstrap values (BS) and posterior probabilities (PP). The resulting phylogeny robustly resolved the evolutionary relationships between P. braueri and its congeners, providing new insights into Rhacophoridae systematics.

2.6. Divergence Time Estimates Focused on Rhacophoridae

We estimated evolutionary divergence times using fossil calibration data from TimeTree (http://www.timetree.org, accessed on 25 July 2025), analyzed through BEAST v1.8.4 [34]. The analysis implemented a relaxed lognormal molecular clock with a Yule speciation prior, incorporating four key calibration points. The calibration points were selected based on comprehensive reviews of the anuran fossil record and previously established molecular dating studies to represent conservative, well-justified minimum and maximum bounds for these clades [18,35]. The respective time priors were set as follows: Rhacophoridae and Mantellidae split 73.1 ± 19.5 Mya; the most recent common ancestor (MRCA) of Rhacophorus dates back to 29.51 ± 4.56 Mya; the divergence age between the two clades Nanorana and Quasipaa is 38.1 ± 9.4 MYA. These lognormal distributions with soft bounds were chosen to incorporate the uncertainty associated with the fossil record and the phylogenetic placement of key fossils, a recommended practice to avoid overconfident and biased estimates [36]. Three independent Markov chain Monte Carlo (MCMC) runs were performed, each with 10 million generations sampled every 1000 steps, using a GTR + I + G substitution model. After discarding the initial 25% as burn-in, parameter convergence was verified in Tracer v1.7 (ESS > 200 for all parameters). Final divergence time estimates with 95% highest posterior density intervals were generated using TreeAnnotator v2.6.2 and visualized in FigTree v1.4.3.

2.7. Ka and Ks Analysis

To assess evolutionary selection pressures, we computed Ka/Ks ratios for 13 mitochondrial protein-coding genes across P. braueri, P. megacephalus and P. leucomystax. This metric compares nonsynonymous (Ka) versus synonymous (Ks) substitution rates, where Ka/Ks > 1 indicates positive selection, Ka/Ks = 1 suggests neutral evolution, and Ka/Ks < 1 reflects purifying selection [37]. Our comparative analysis of these ratios among Rhacophoridae species revealed distinct evolutionary trajectories, enabling a detailed interpretation of the selective constraints acting on different genomic regions. The Ka/Ks calculator implementation allowed for the precise quantification of these evolutionary forces, providing insights into the differential selective pressures shaping mitogenome evolution in these tree frog species.

3. Results

3.1. Mitochondrial Genome Structure

The complete mitogenome of P. braueri was determined to be 20,254 bp in length, which falls within the typical size range observed in other Rhacophoridae species (15,361–24,103 bp), while maintaining the characteristic circular double-stranded structure (Figure 1, Table 1). Its genomic organization includes 12 PCGs (lacking ATP8), 22 tRNAs, two rRNAs (12S and 16S), an OL region, and two D-loop regions. In contrast, P. leucomystax and P. megacephalus retain all 13 typical PCGs, with P. megacephalus uniquely possessing three D-loop regions. The strand-specific gene distribution follows conserved patterns: the L-strand encodes ND6 and eight tRNAs (tRNAPro, tRNAGln, tRNAAla, tRNAAsn, tRNACys, tRNATyr, tRNASer, and tRNAGlu), while the H-strand contains the remaining genes, mirroring the organization in P. impresus and P. mutus [1]. Notably, P. braueri contains a 167 bp non-coding sequence between tRNALys and ATP6, potentially representing the ancestral ATP8 locus [11,38], which is absent in congeners.
Base composition analysis revealed species-specific variation in nucleotide frequencies (Table S2): P. braueri (A: 29.70%, T: 32.17%, G: 15.08%, C: 23.05%), P. megacephalus (A: 30.59%, T: 30.76%, G: 24.47%, C: 14.17%), and P. leucomystax (A: 30.55%, T: 31.34%, G: 14.63%, C: 23.48%). All three species exhibited consistent AT bias (61.35–61.89%) across genomic regions, with D-loops showing the highest AT content. Skewness analysis demonstrated negative AT and GC skews in whole genomes, indicating T/C preference, while rRNAs displayed unique positive AT skew and negative GC skew patterns.
Comparative analysis identified conserved gene overlaps among species (Table 1 and Table S3): five in P. braueri versus six each in P. leucomystax and P. megacephalus. The largest overlaps occurred between tRNALeu/ND1 (27 bp in P. leucomystax) and COX1/tRNASer (13 bp in P. braueri and P. megacephalus), reflecting evolutionary constraints on mitogenomic compaction. These structural features demonstrate both conserved and divergent evolutionary trajectories in Rhacophoridae mitogenome organization.

3.2. Protein-Coding Genes and Codon Usage

The mitochondrial protein-coding genes (PCGs) of the three Rhacophoridae species exhibited similar genomic organization, with total lengths ranging from 11,116 bp to 13,051 bp, representing 54.14–54.88% of their complete mitogenomes. These PCGs displayed consistent nucleotide composition patterns across species, with A + T content varying minimally between 59.09% (P. megacephalus) and 59.99% (P. leucomystax)—a difference of less than 0.9%. All three species demonstrated significant AT bias (Table S2), accompanied by consistently negative AT (−0.062 to −0.106) and GC (−0.196 to −0.239) skew values in their PCGs, reflecting strand-specific compositional asymmetries characteristic of vertebrate mitogenomes.
Comparative analysis of mitochondrial protein-coding genes revealed distinct patterns in translation initiation and termination across the three Polypedates species (Table 2). While most genes employed standard ATN initiation codons, ND4 in P. megacephalus and P. leucomystax uniquely utilized GTG. Termination patterns showed greater diversity: seven genes (COX3, ND1-ND4, ATP6, CYTB) consistently used incomplete T-- stop codons, whereas COX2, ND4L, and ND5 terminated with TAA (except ND5 in P. braueri with TAG), and COX1/ND6 employed AGG. Notably, P. braueri exhibited more conserved codon usage, with both COX2 and ND4 initiating via ATG, contrasting with the ATA (COX2) and GTG (ND4) start codons observed in its congeners. These interspecific differences in translational signals suggest varying evolutionary constraints acting on mitochondrial gene regulation within the genus.
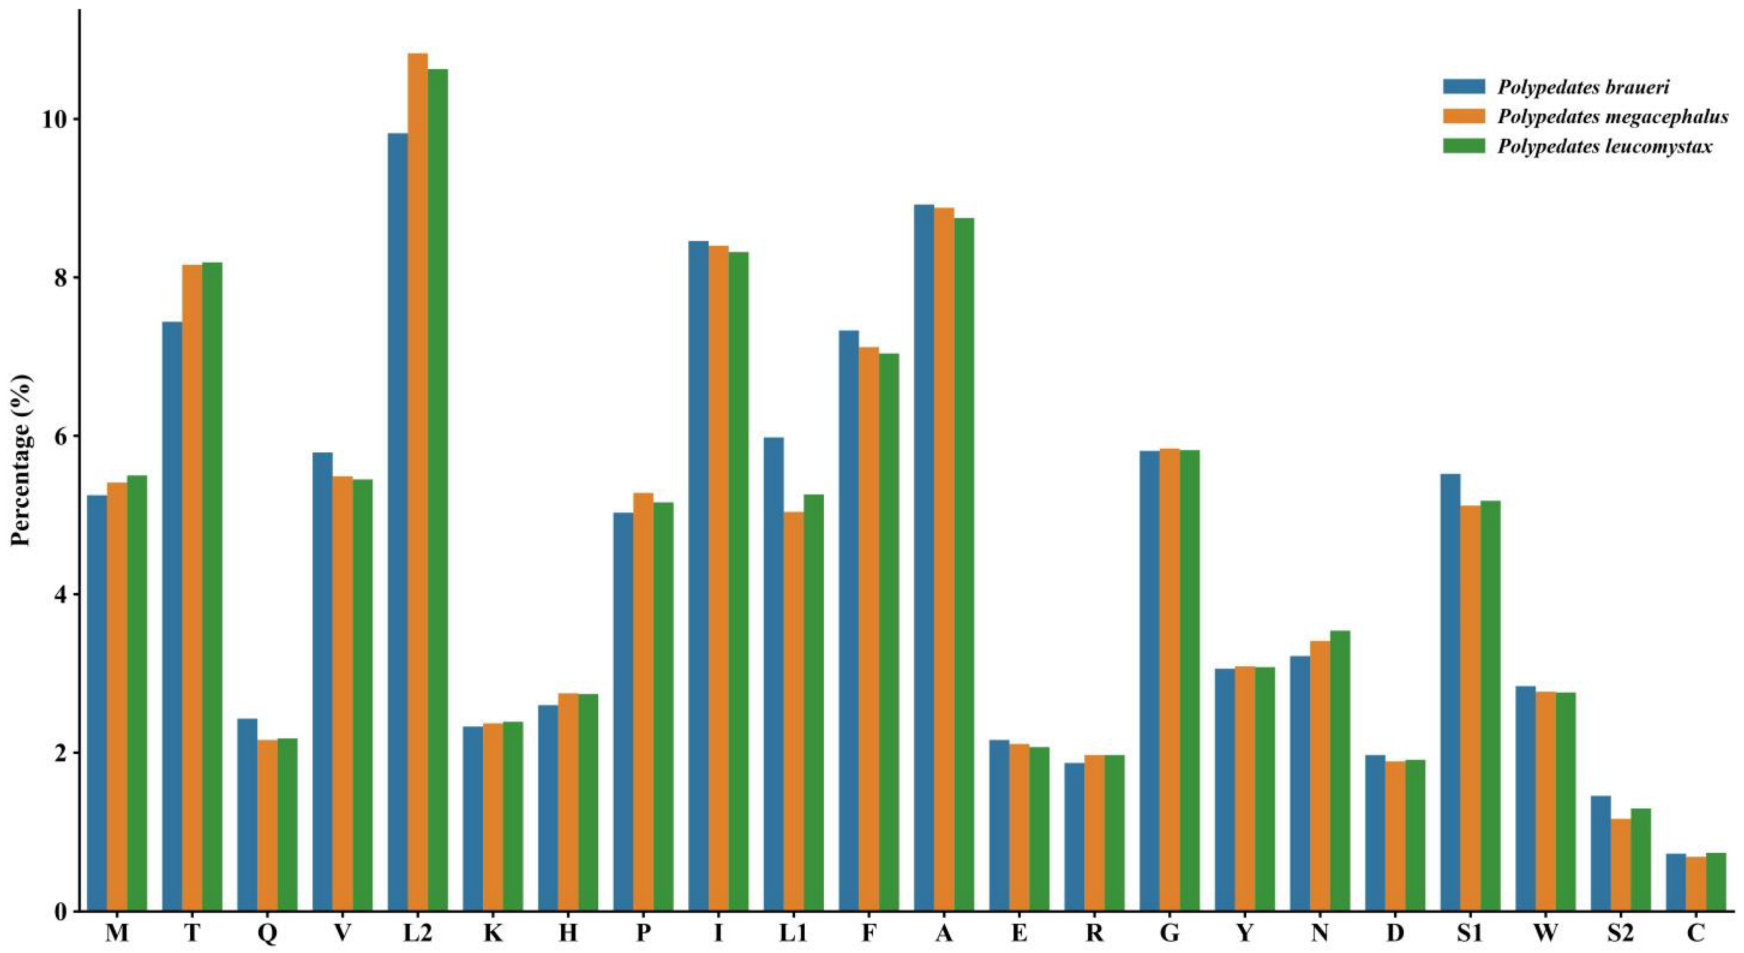
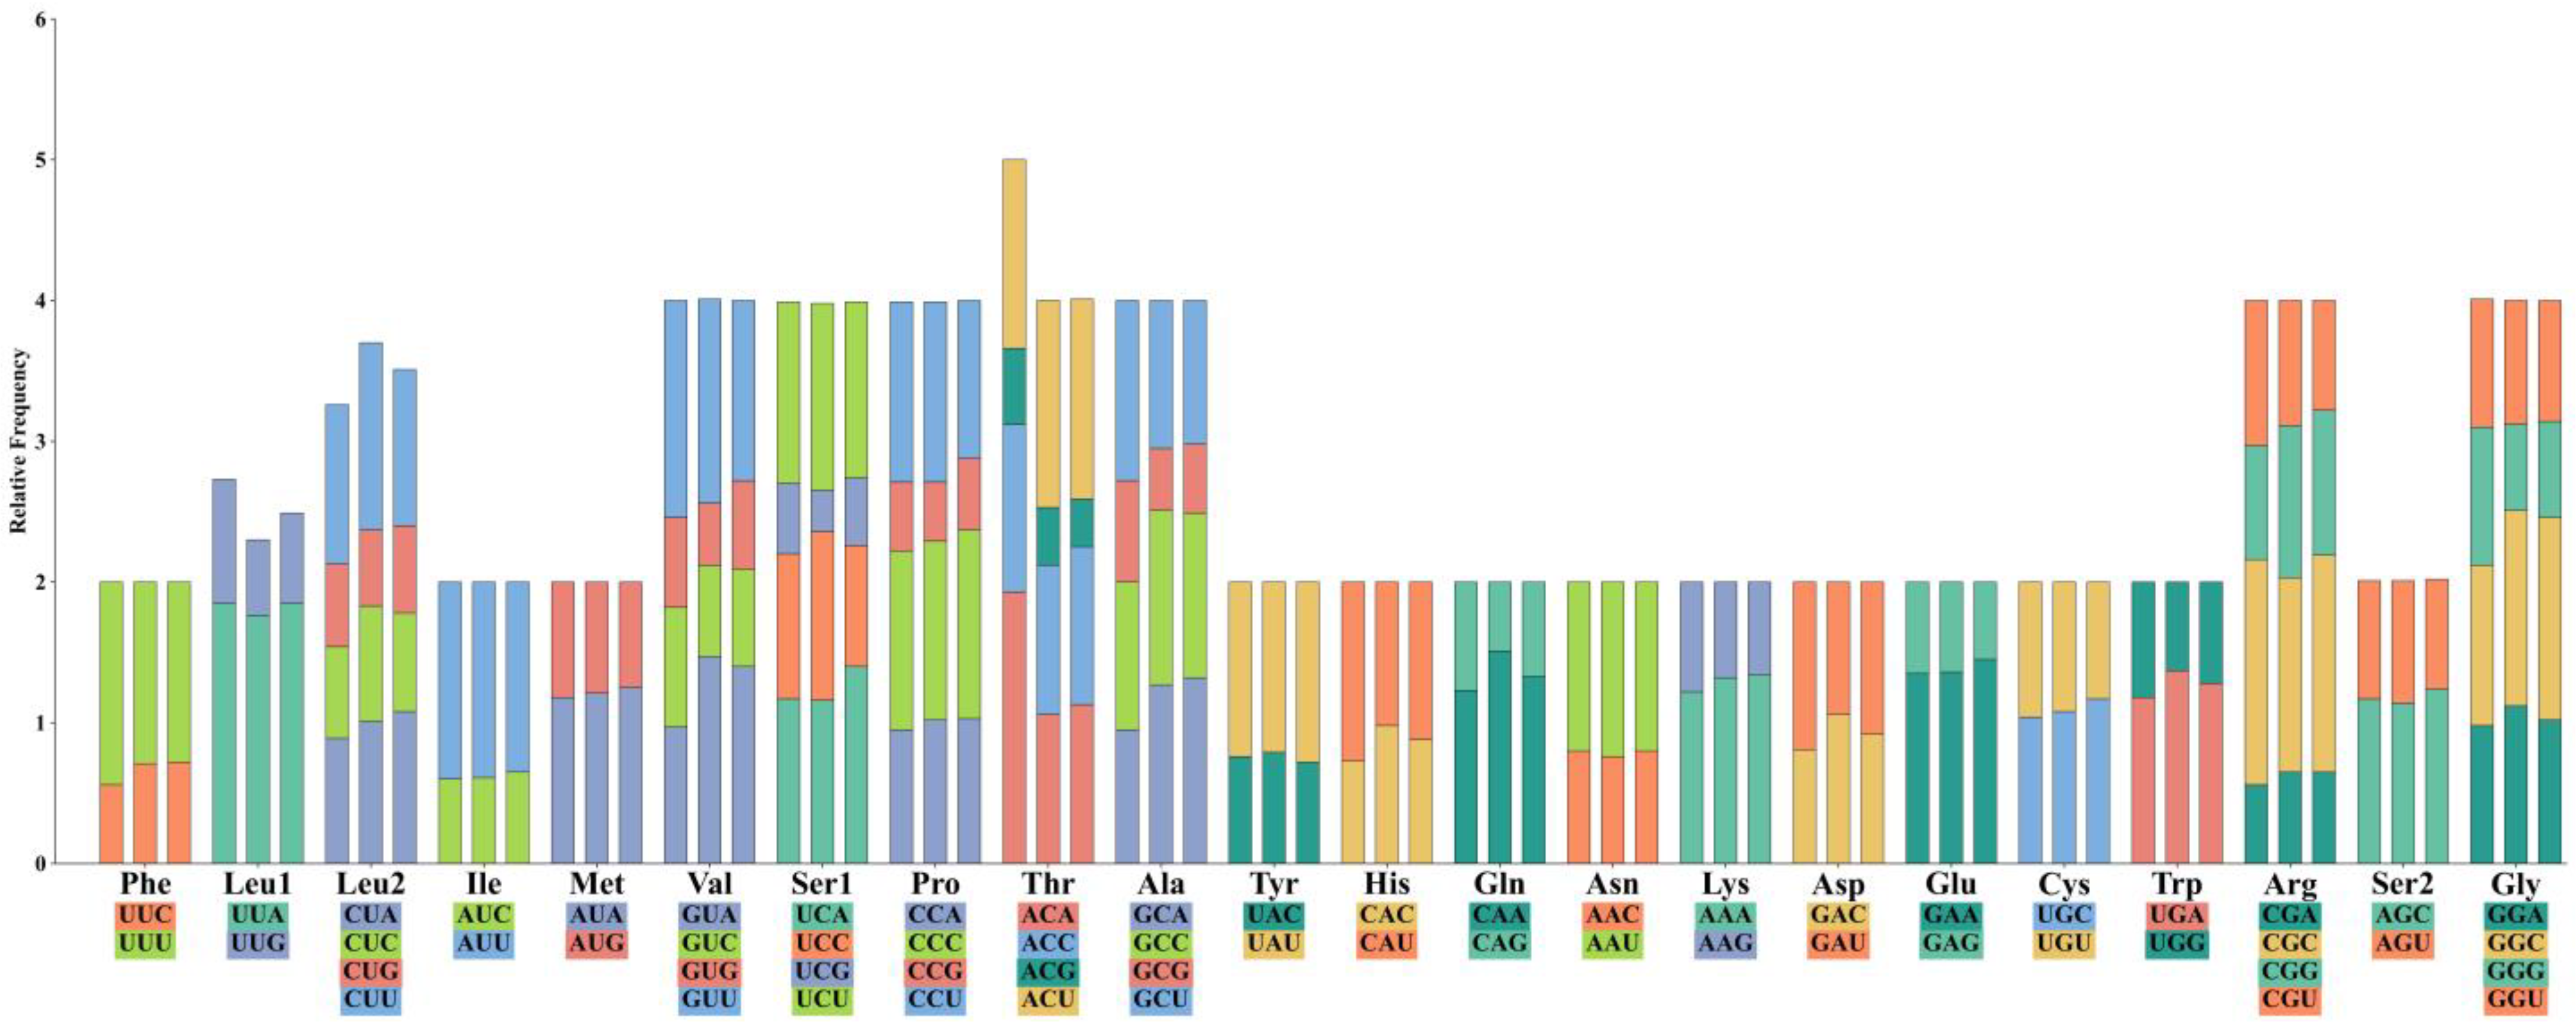
Analysis of 6751–8034 codons from three Polypedates species revealed conservative but different codon usage patterns. Overall, the proportion of amino acids in P. braueri is significantly higher than in the other two species, showing clear differences, which may be due to the lack of the ATP8 gene (Figure 2). Meanwhile, the proportions of amino acids in P. megacephalus and P. leucomystax are almost identical in value. Leucine emerged as the most abundant amino acid (15.62–17.79%), with its six codons divided into L1/L2 subcategories, while cysteine showed the lowest representation (0.71–0.89%). Relative Synonymous Codon Usage (RSCU) analysis identified U UU (Phe), UUA (Leu), and AAU (Asn) as the most frequent codons, occurring 266–325 times per genome (Figure 3). Interspecific comparisons demonstrated subtle variations in synonymous codon preference: P. braueri showed elevated UUU (Phe) frequency compared to congeners, while P. leucomystax exhibited higher CUC (Leu2) usage. Notably, threonine codons displayed significantly higher RSCU values in P. braueri, suggesting species-specific translational optimization despite the overall genomic AT bias. These patterns collectively underscore both the conserved and divergent evolutionary trajectories shaping mitochondrial translation efficiency in Rhacophoridae.

3.3. Transfer RNAs and Ribosomal RNA Genes

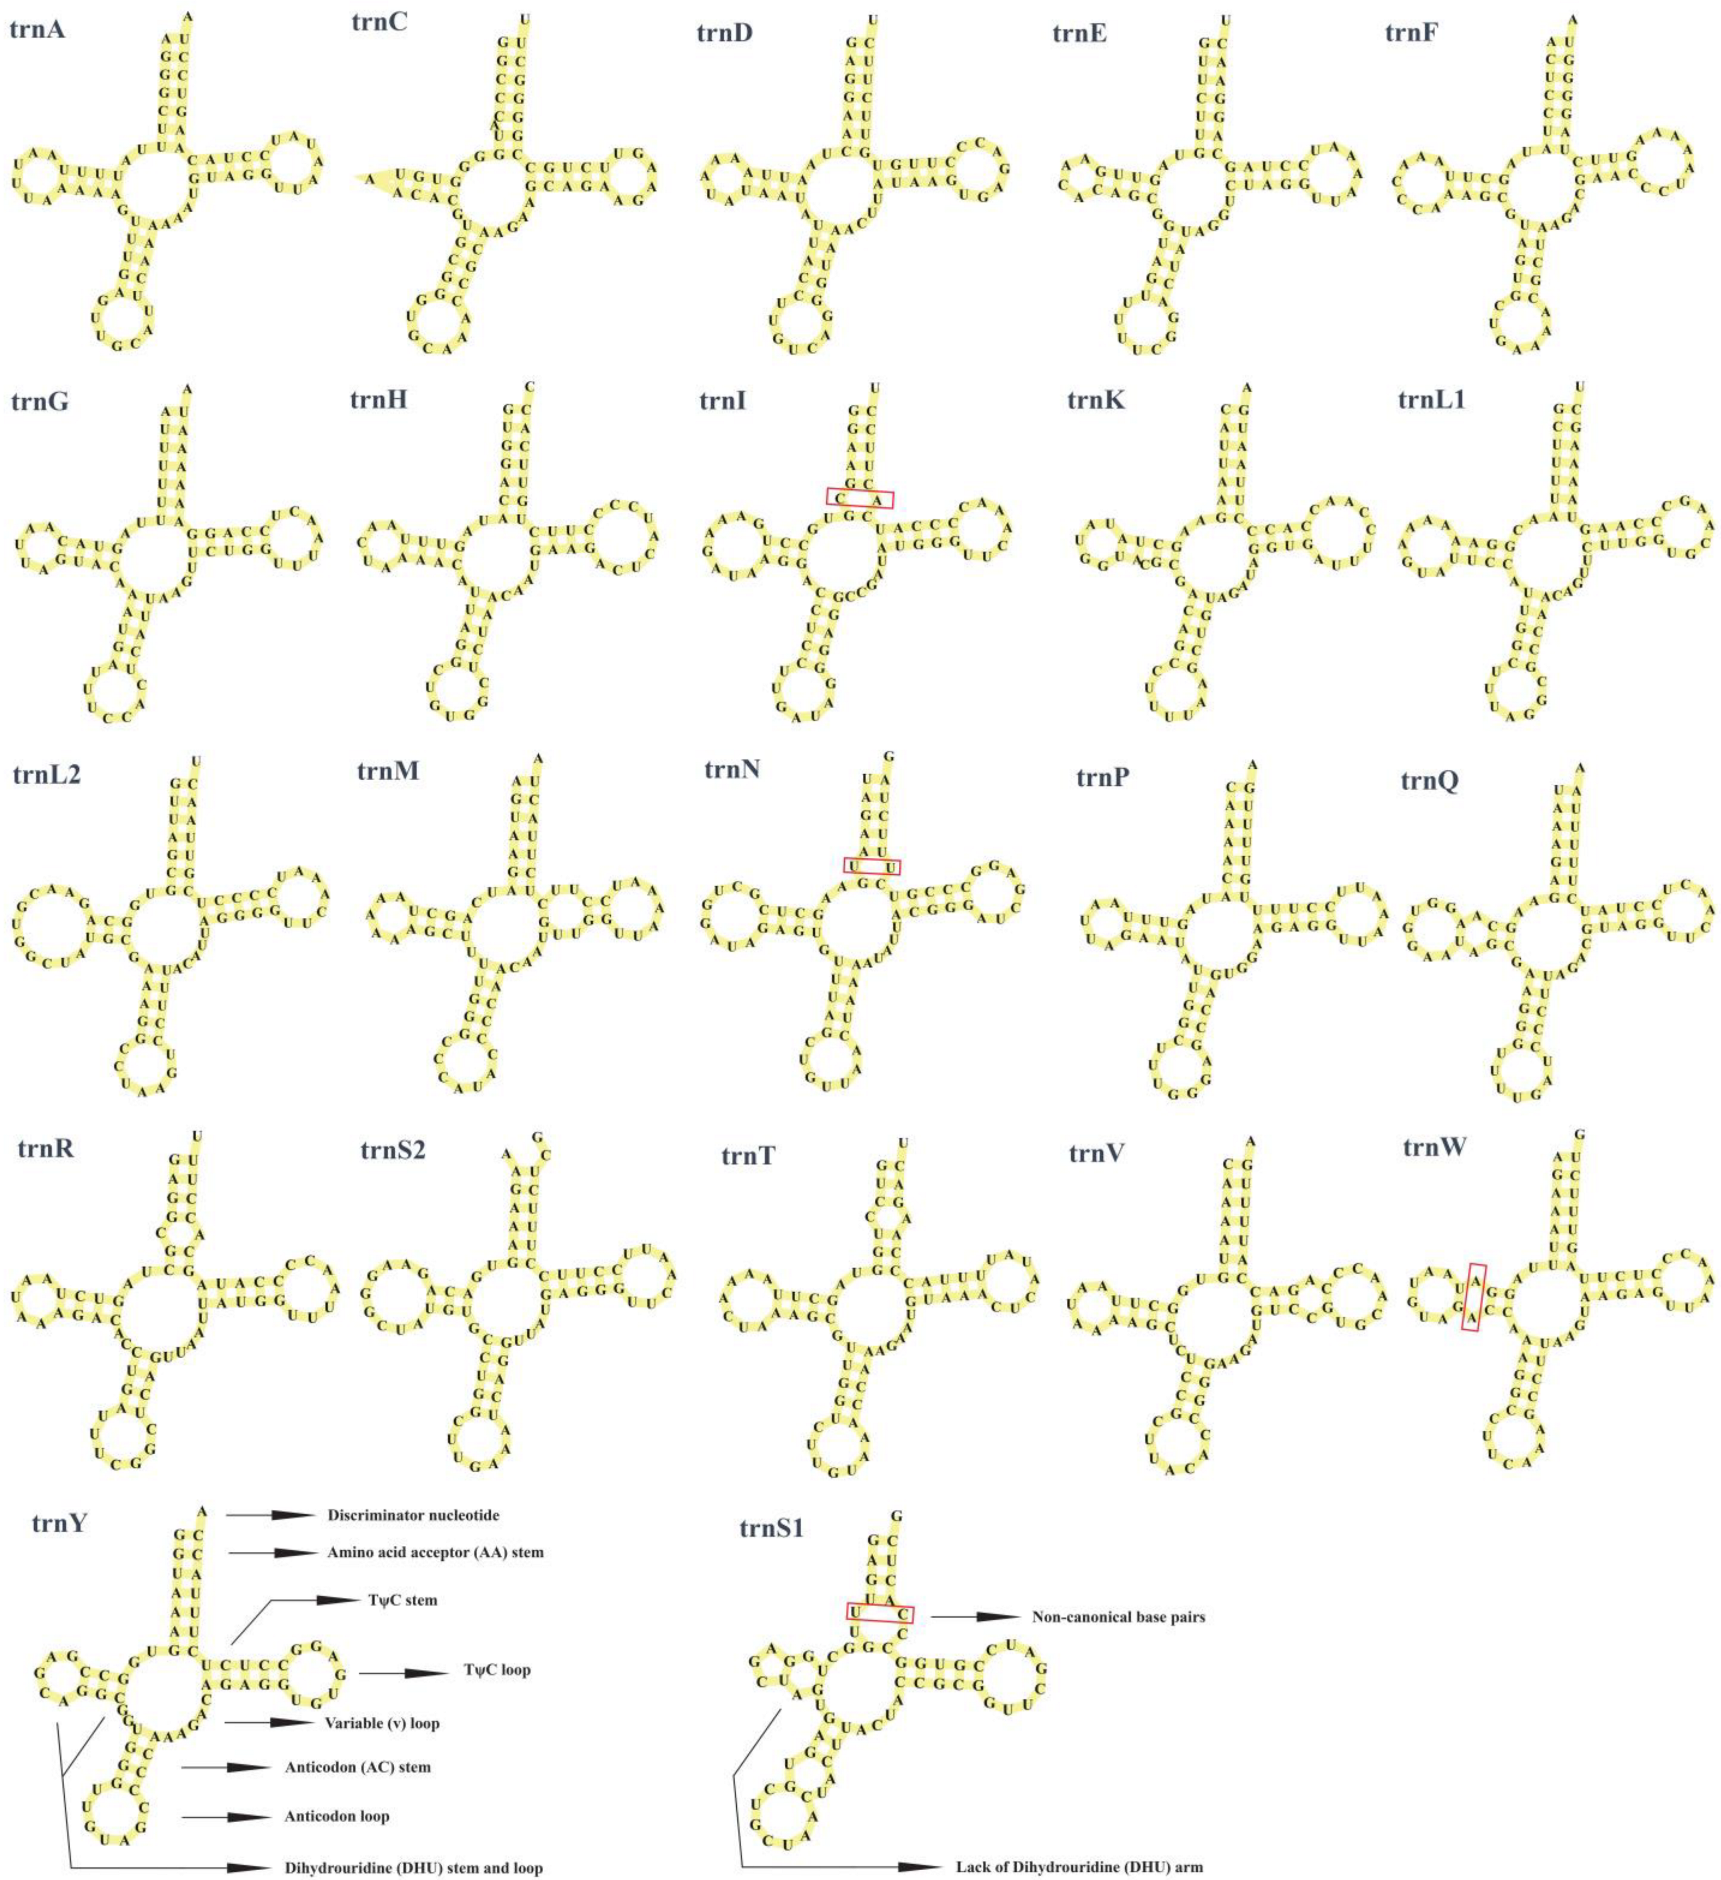
The mitochondrial genomes of all three species—P. braueri, P. leucomystax, and P. megacephalus—contained a complete set of 22–23 tRNAs, with lengths ranging from 64 to 74 bp (P. braueri), 65–74 bp (P. leucomystax), and 65–74 bp (P. megacephalus), respectively, with 14 encoded on the heavy strand and 8 on the light strand, collectively representing 6.36–7.51% of the total mitogenome length (1523–1535 bp) (Table S2). All tRNA sequences exhibited positive AT and GC skew values. Structural analysis revealed that while most tRNAs adopted the canonical cloverleaf configuration, notable exceptions were identified. The most striking deviation was observed in trnS1, which consistently lacked the entire dihydrouracil (DHU) arm across all three species (Figure 4). This atypical structure stands in contrast to the canonical cloverleaf form, exemplified by trnY. Furthermore, non-canonical base pairings (e.g., U-U, C-C, A-A, A-C, C-U) were prevalent throughout the tRNA structures (Figure 4, Figures S2 and S3). Among these, G-U wobble pairs were particularly common and are predicted to contribute to structural stability, as proposed by Varani and McClain [39]. These structural variations, particularly the reduced arm in trnS1, represent conserved genomic features within anurans, likely resulting from evolutionary constraints imposed by mitochondrial genome compaction.
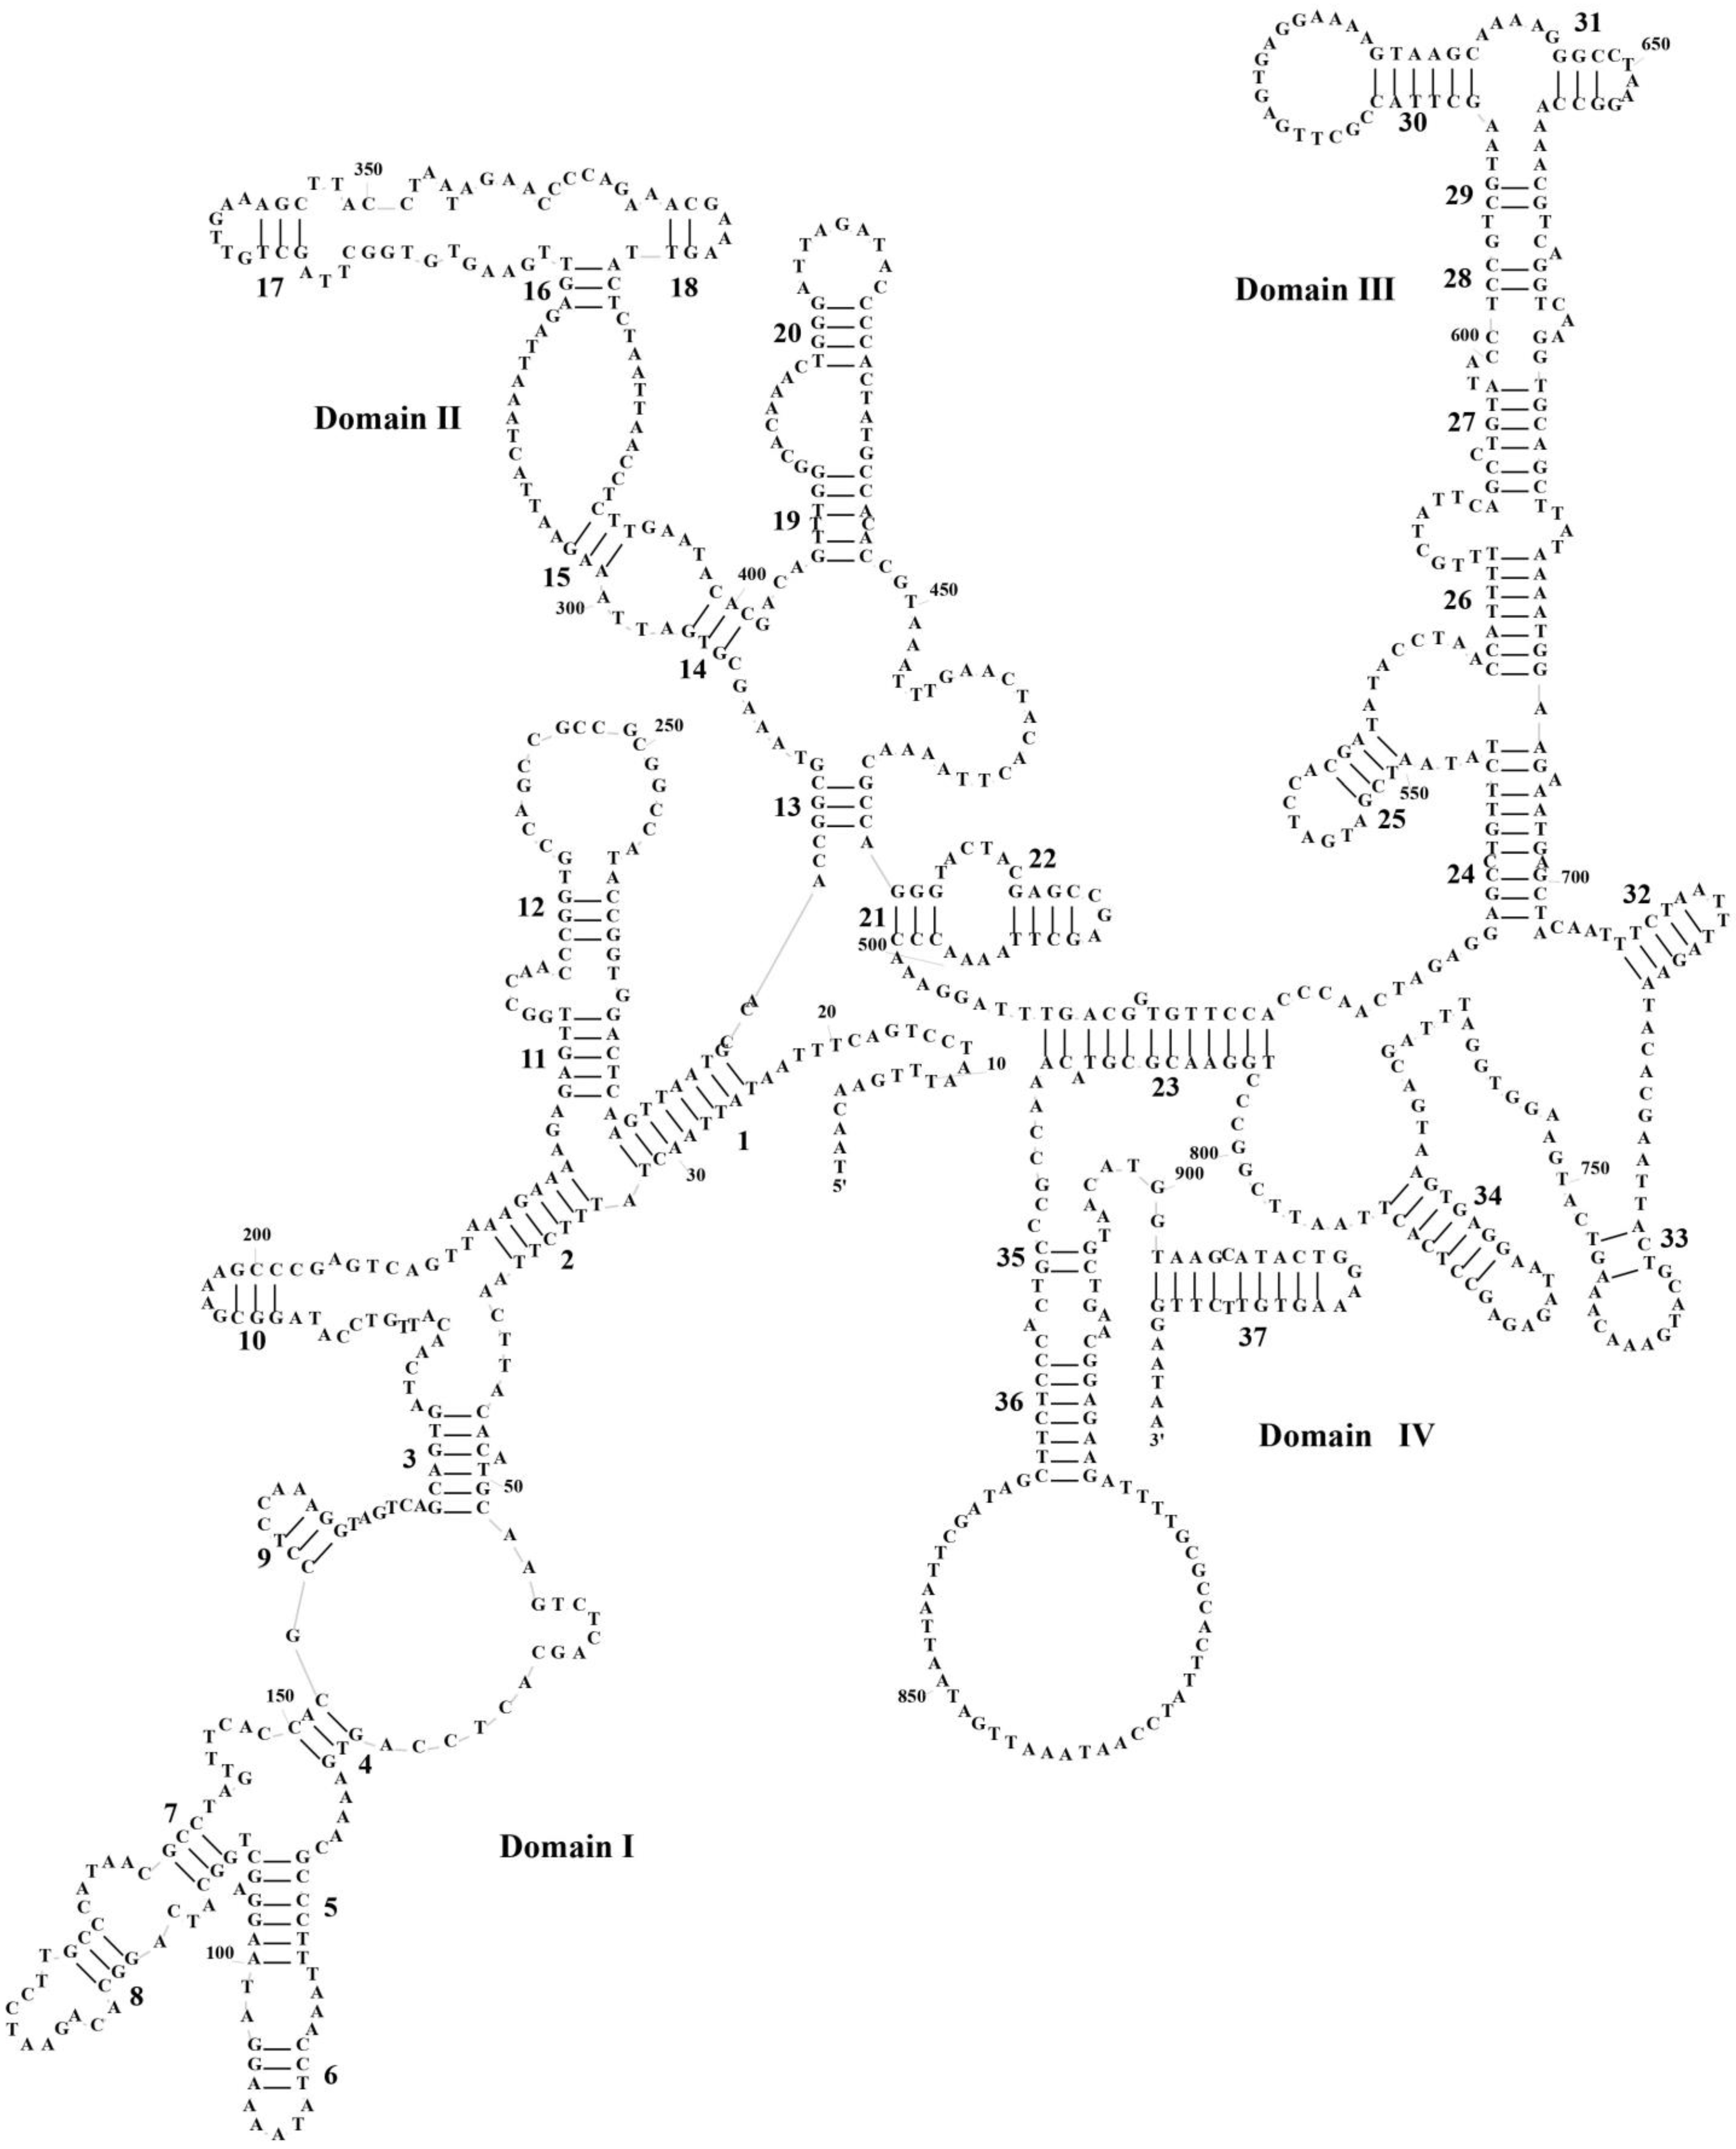
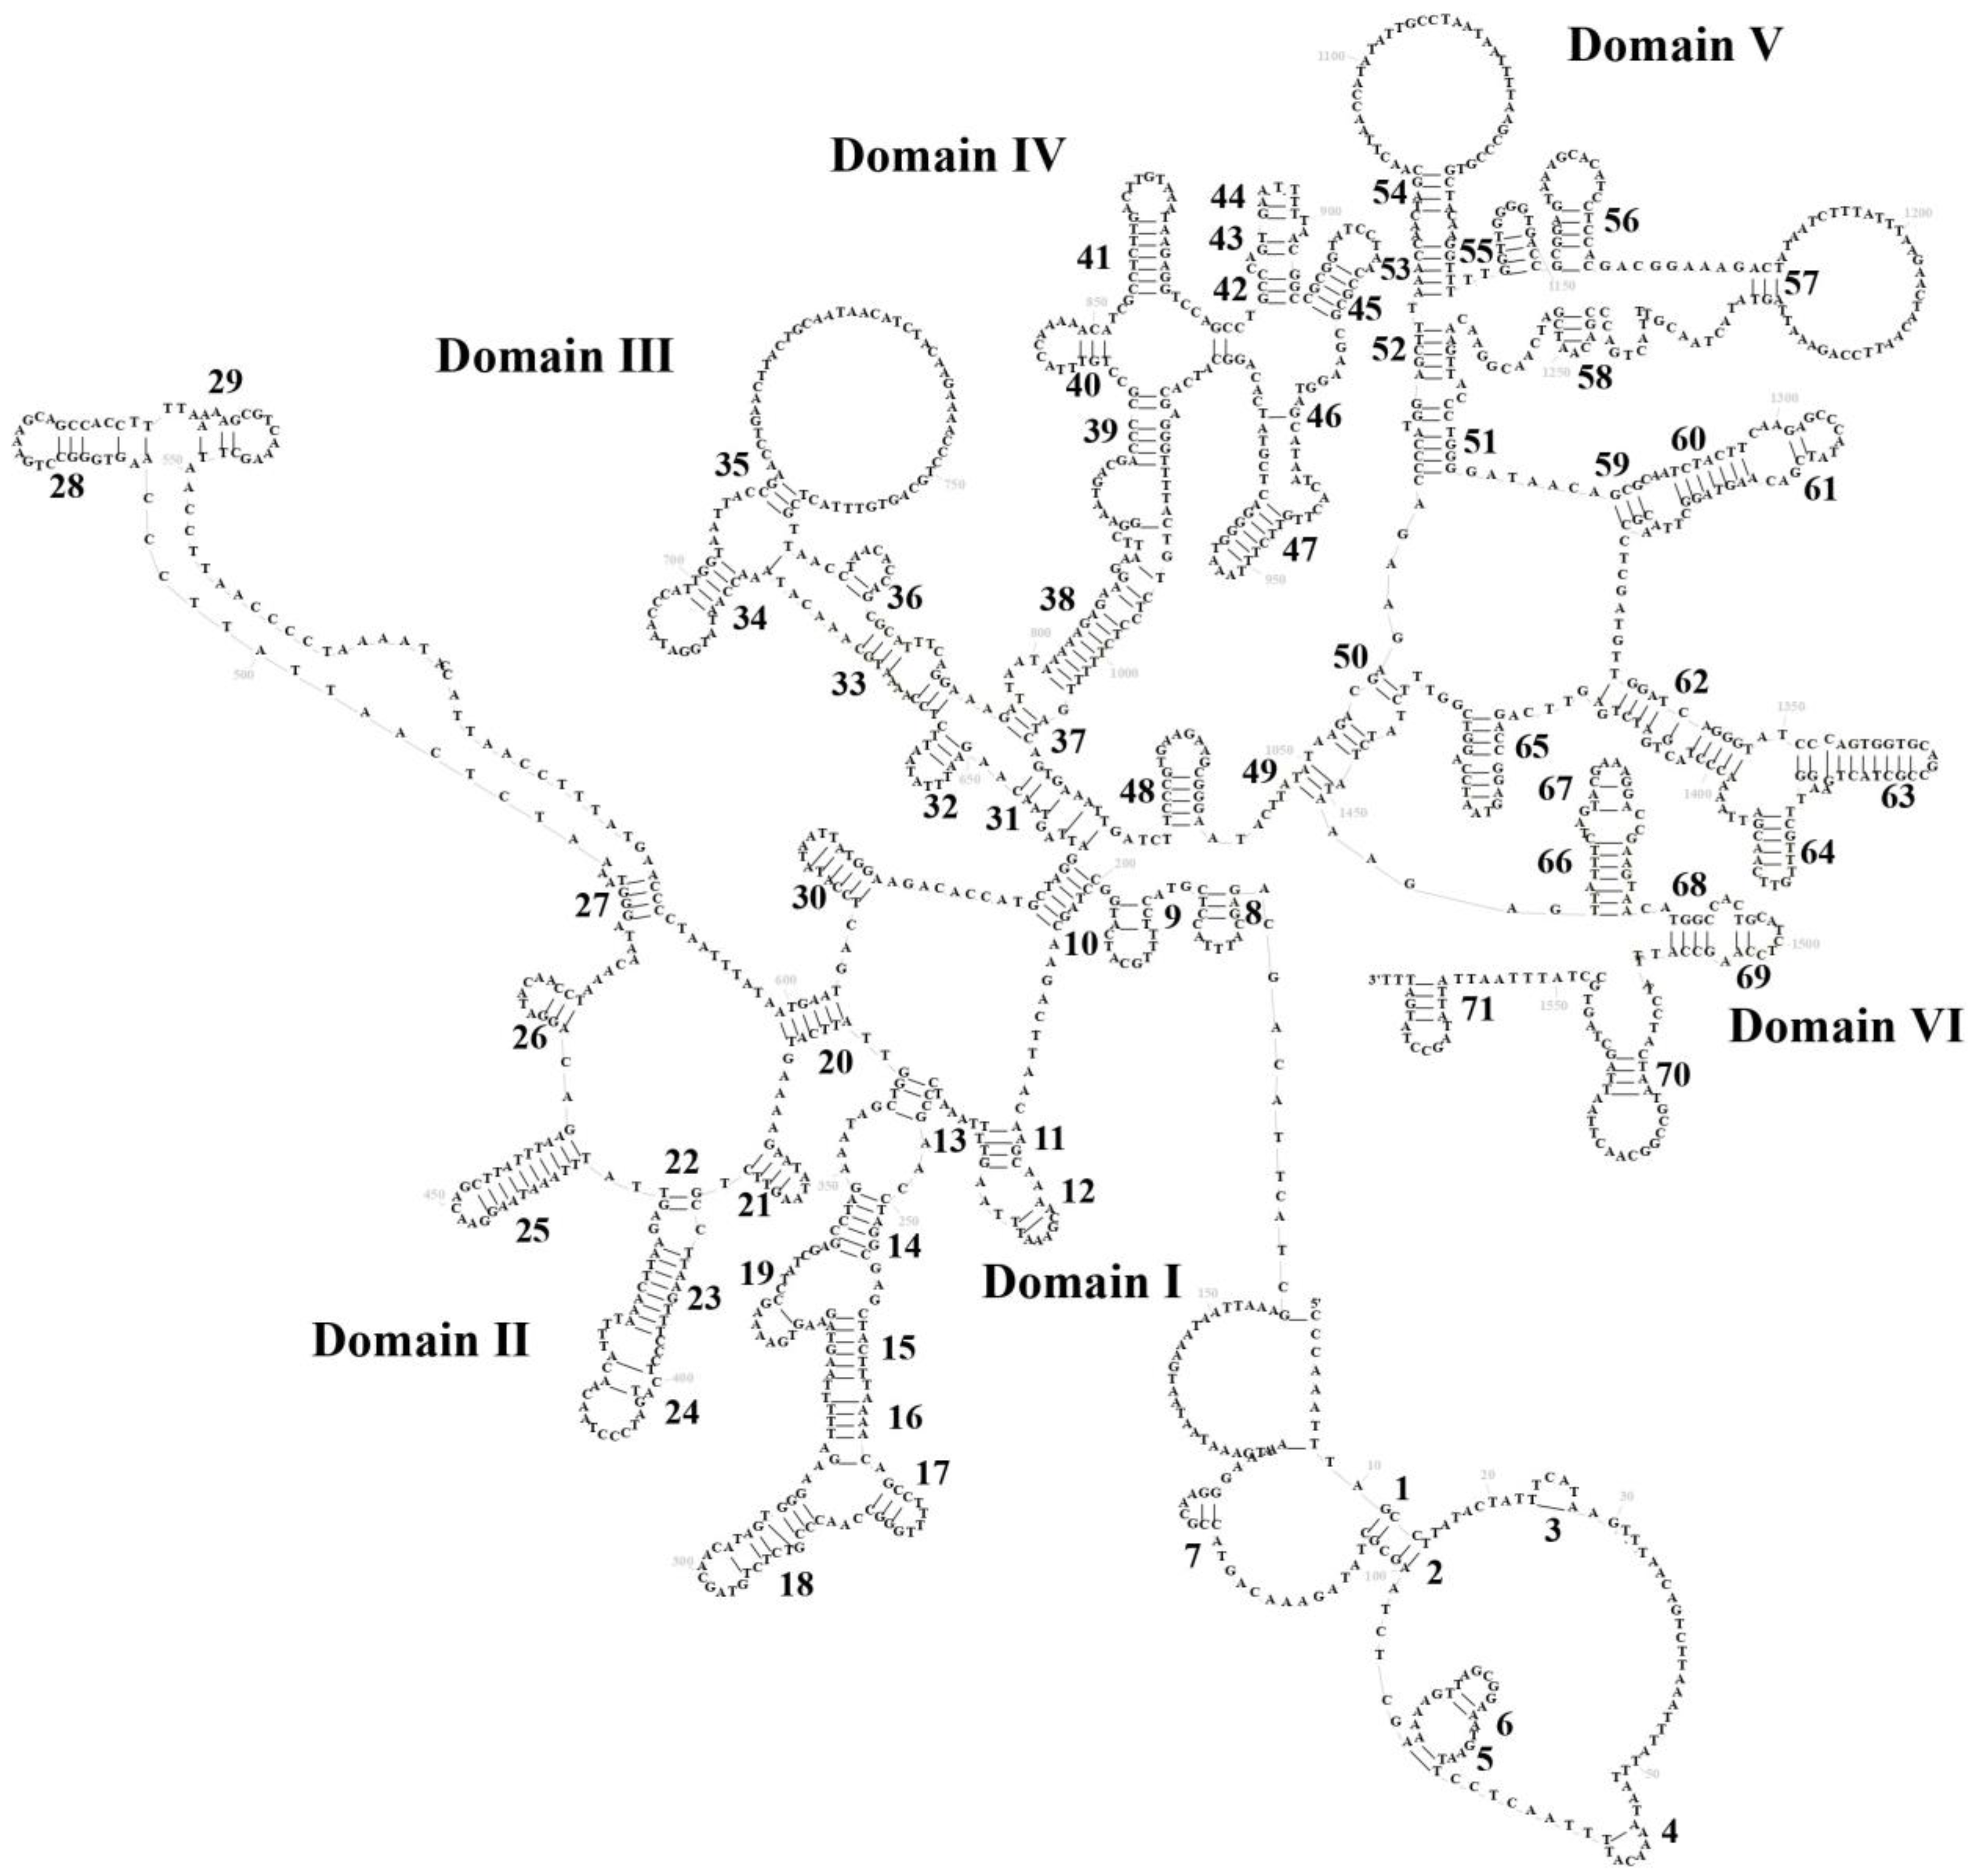
The mitogenomes of all three species maintain a conserved rRNA organization typical of vertebrates, with 12S rRNA (928–931 bp) positioned between tRNAPhe and tRNAVal, followed by 16S rRNA (1571–1574 bp) between tRNAVal and tRNALeu (Table 1). These rRNA genes uniformly exhibit AT bias and strand asymmetry, evidenced by negative GC-skew and positive AT-skew values across species (Table S2. Secondary structure predictions reveal highly conserved architectures: P. braueri’s 12S rRNA folds into four domains (I–IV) with 37 stem-loops, while its 16S rRNA forms six domains (I–VI) containing 71 stem-loops (Figure 5 and Figure 6)—a pattern mirrored in P. leucomystax and P. megacephalus (Figures S4–S7). Comparative analysis identifies key structural patterns: (1) stem regions show greater conservation through compensatory mutations, whereas loop regions accumulate more nucleotide substitutions; (2) 12S rRNA displays stronger evolutionary constraint than 16S rRNA, particularly in its four domains; and (3) 16S rRNA exhibits domain-specific variability, with domains I–IV being more plastic than conserved domains IV–V. These findings highlight how structural elements evolve under differential selective pressures while maintaining core ribosomal functions.

3.4. Control Region

Comparative genomic analysis revealed distinct structural organization of control regions (CRs) in three Polypedates species. Both P. braueri and P. leucomystax possess two CRs flanking ND5 (designated CR1 and CR2), while P. megacephalus uniquely contains three CRs (CR1-CR3). The CRs exhibited substantial length variation, ranging from 1524 bp (P. leucomystax CR1) to 3187 bp (P. leucomystax CR2), with all species showing characteristically high A + T content (66.26–75.09%) and guanine depletion, consistent with vertebrate mitochondrial strand asymmetry [39]. These repetitive elements displayed low sequence conservation despite high intragenomic similarity, suggesting their involvement in transcriptional regulation and replication initiation. The CR multiplicity likely arose through either independent [40] or concerted evolution [41], potentially enhancing respiratory chain protein expression efficiency [42]. Notably, P. braueri contained a 167 bp intergenic spacer between tRNALys and ATP6 that may represent a degenerate ATP8 locus, possibly explaining this gene’s absence in the species.

3.5. Phylogenetic Analysis

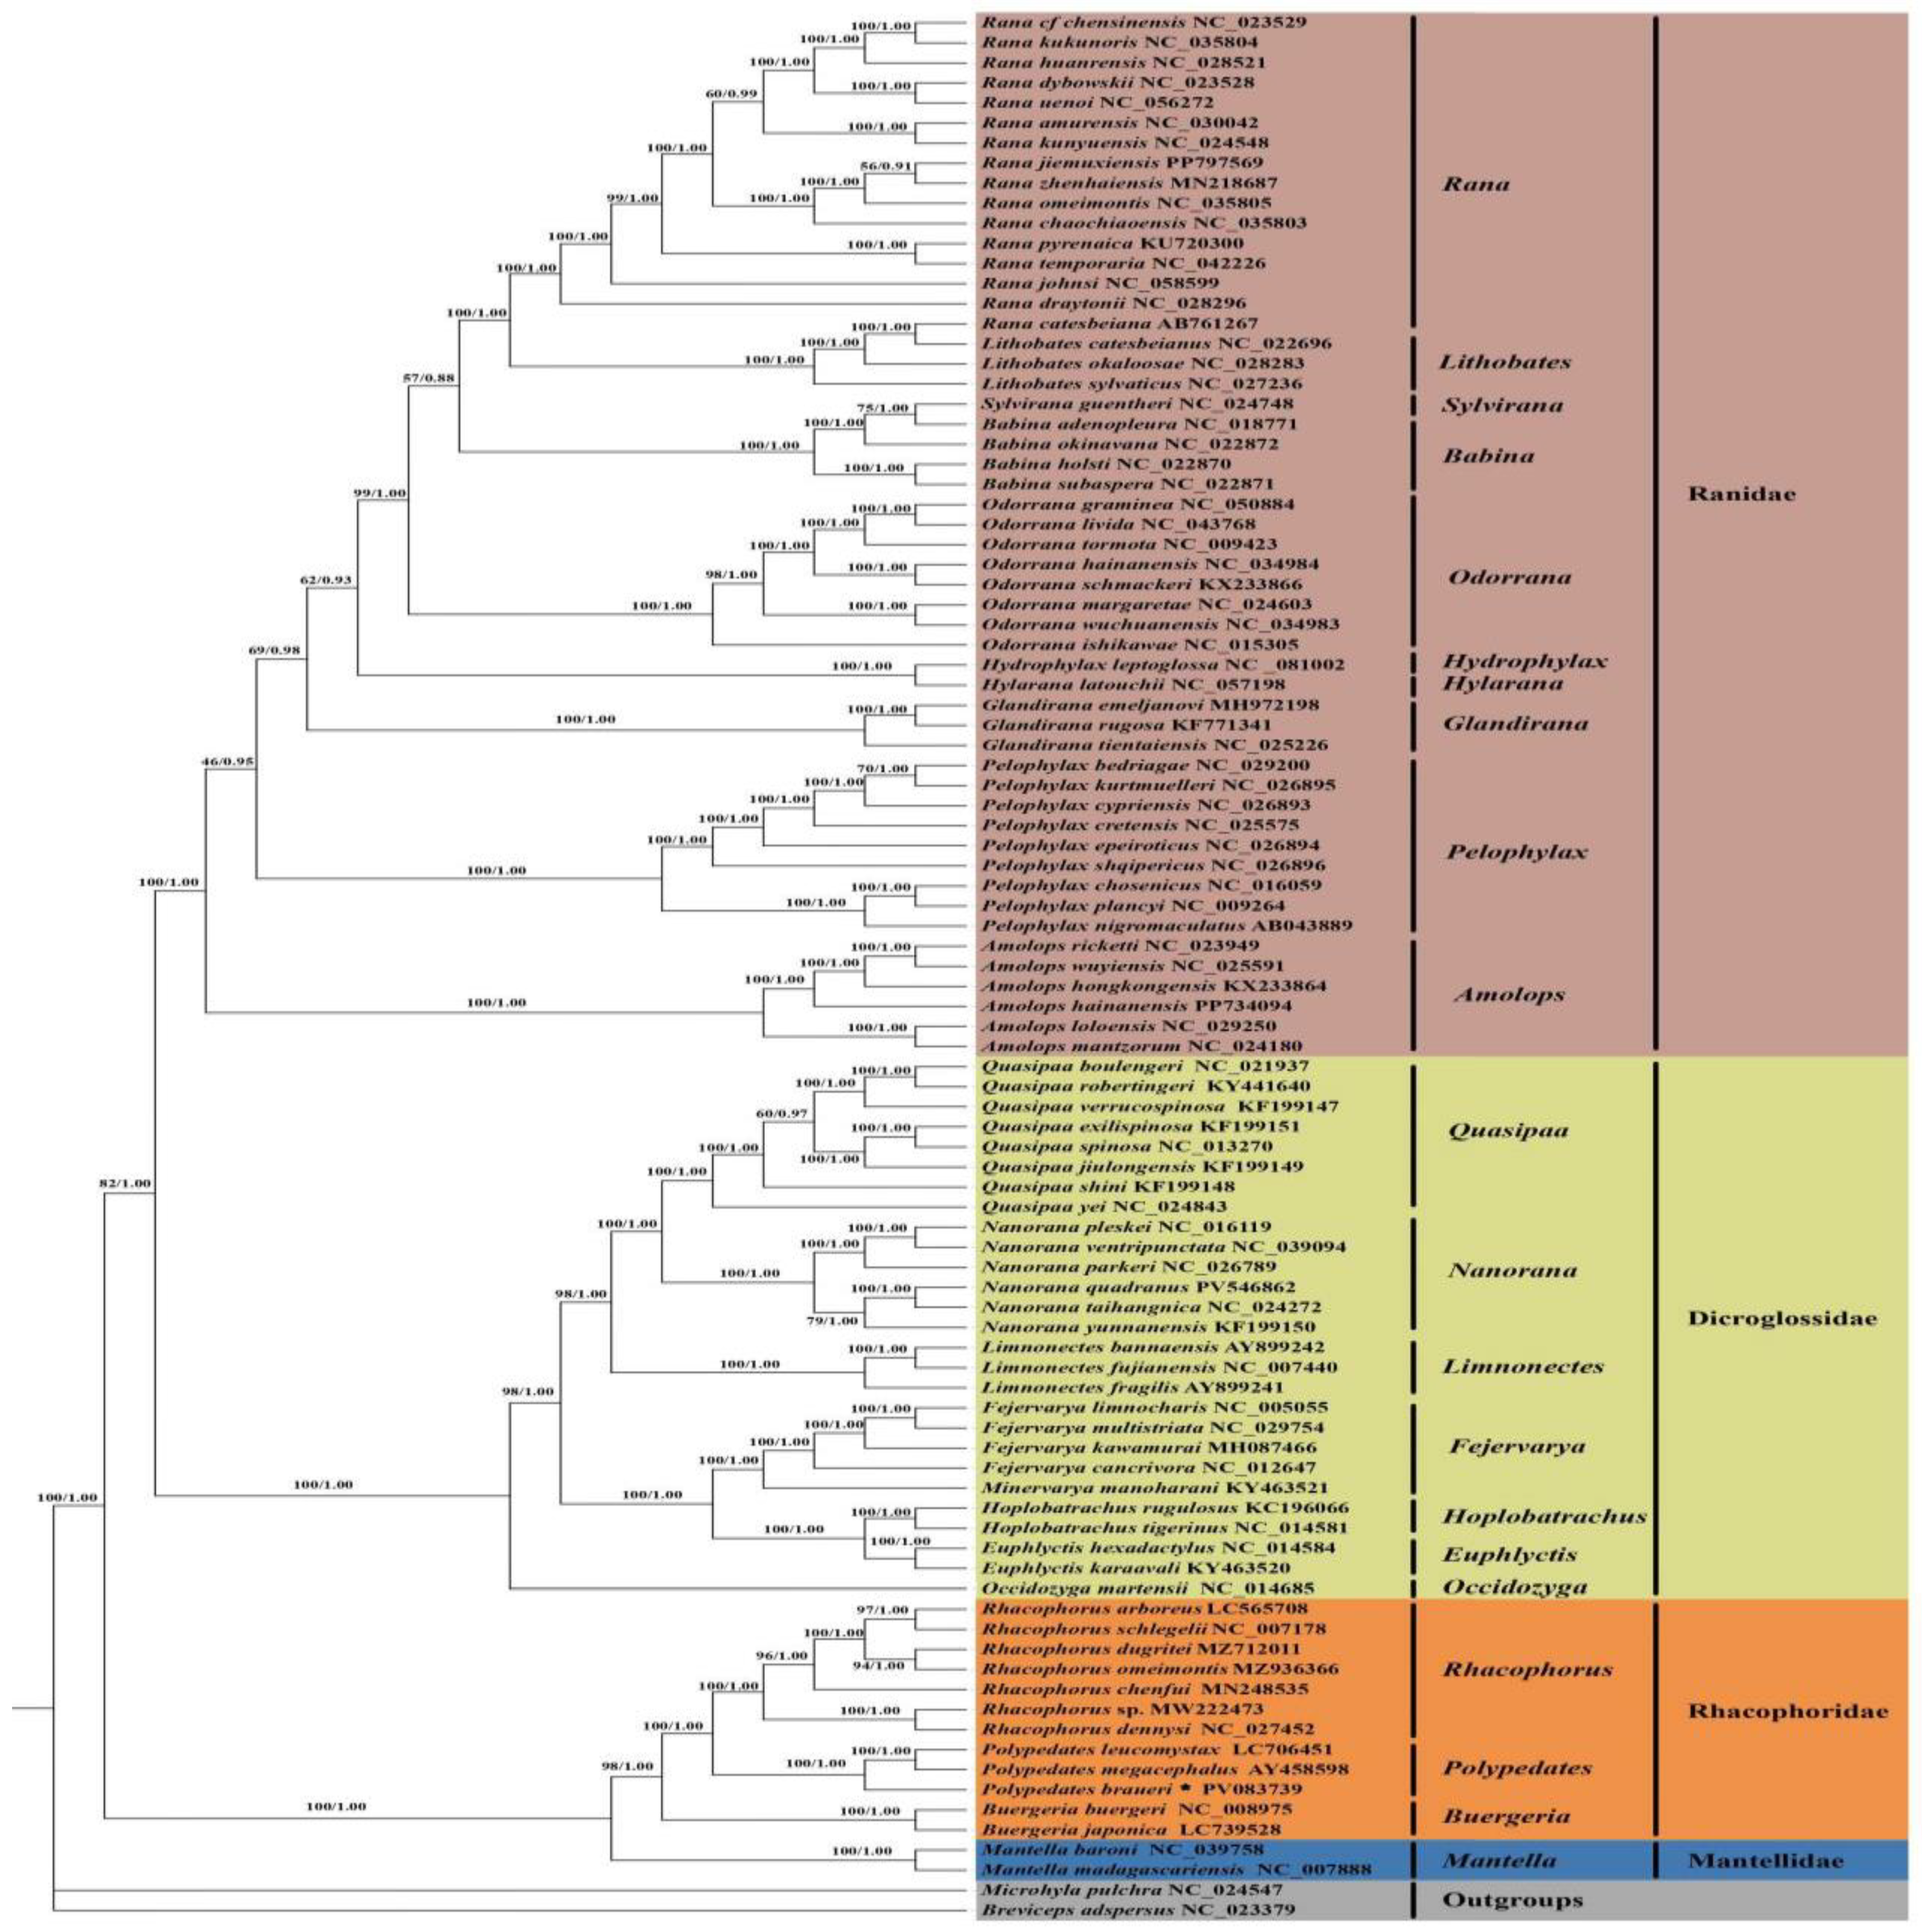
Comparative analysis of mitogenomes from 95 anuran species representing four families (Ranidae, Dicroglossidae, Rhacophoridae, and Mantellidae) revealed robust phylogenetic relationships through both maximum likelihood and Bayesian inference approaches, using Microhyla pulchra and Breviceps adspersus as outgroups. The resulting phylogenies exhibited strong congruence between analytical methods, with high nodal support (bootstrap/posterior probability > 0.95) for most clades (Figure 7). Rhacophoridae emerged as monophyletic, comprising three well-supported genera (Rhacophorus, Polypedates, and Buergeria) that collectively formed a sister group to Mantellidae. Within Rhacophoridae, Rhacophorus formed a distinct clade with Polypedates as its immediate sister group, where P. braueri, P. megacephalus, and P. leucomystax clustered together, with P. megacephalus and P. leucomystax being sister species. The phylogenetic topology clarified long-standing systematic relationships, revealing a ((Mantellidae + Rhacophoridae) + (Dicroglossidae + Ranidae)) structure. This supports the early divergence of Rhacophoridae and Mantellidae from other anuran lineages, consistent with previous molecular studies [43].

3.6. Divergence Time Estimation

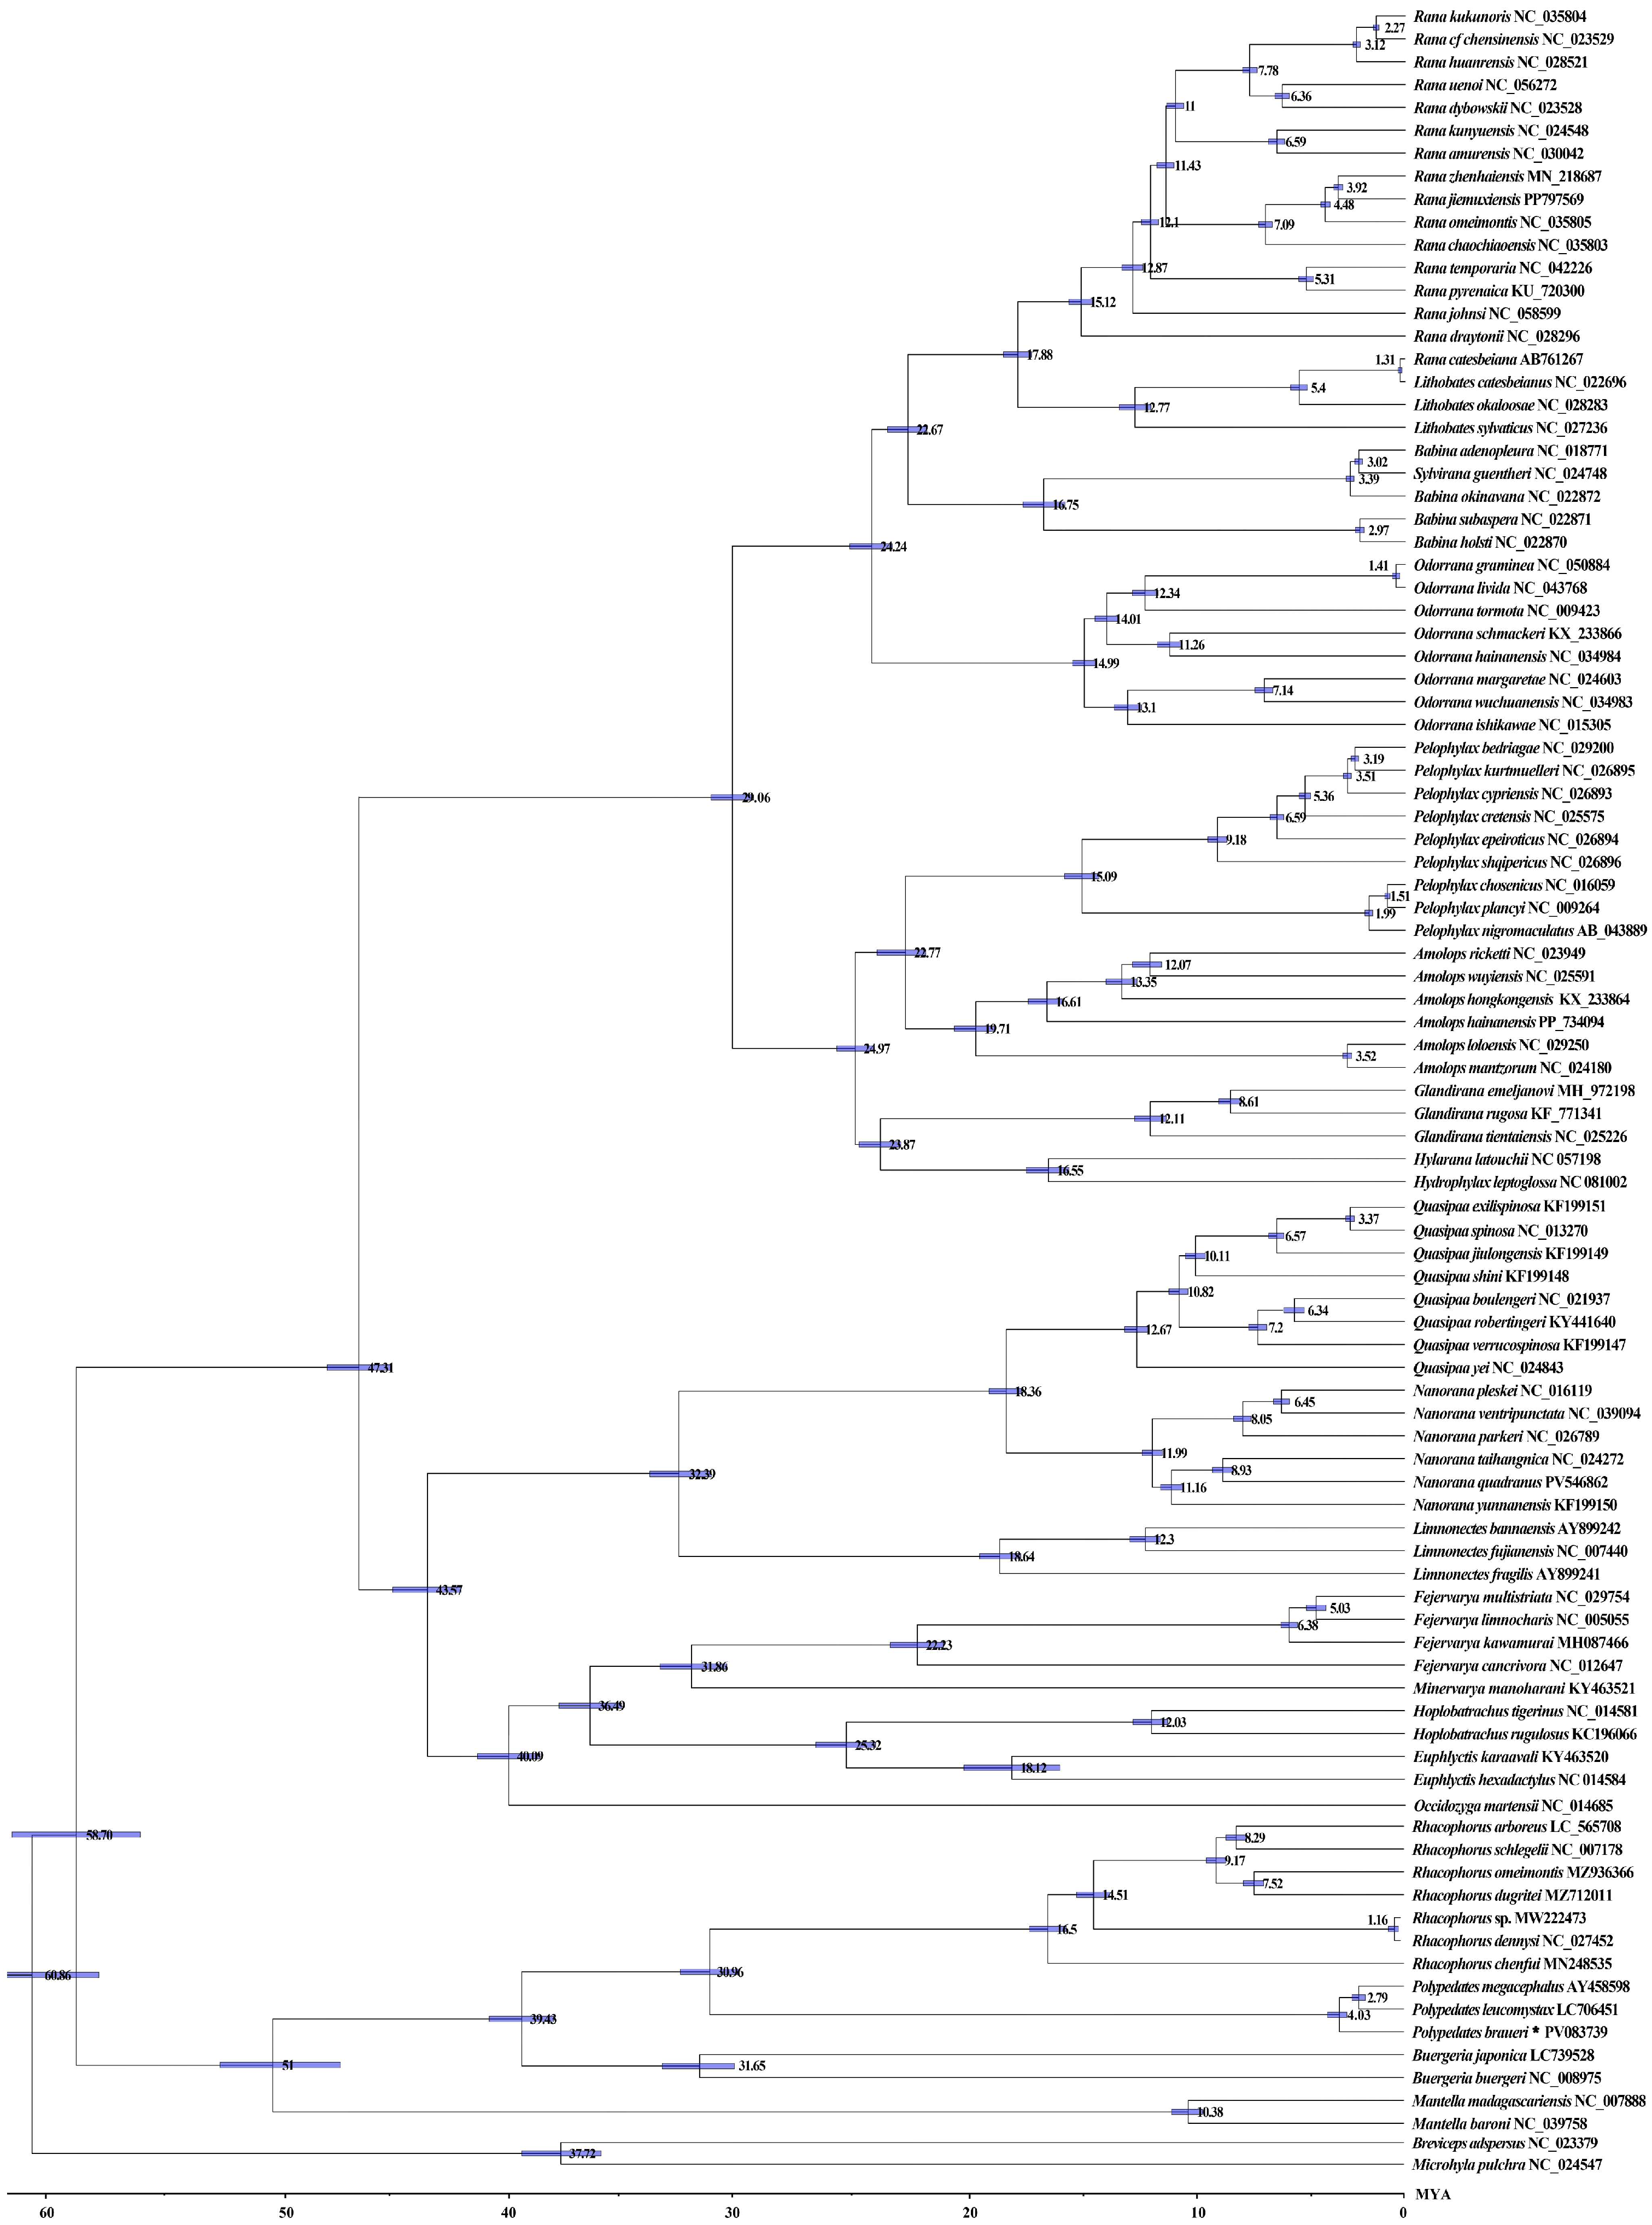
Our molecular dating analysis using BEAST v1.8.4, incorporating 13 protein-coding genes from 95 species across four families, reveals a revised evolutionary timeline for Rhacophoridae. The family likely originated during the Eocene (~42.19 Mya) with subsequent diversification extending into the Miocene (Figure 8), suggesting a more recent radiation than previously estimated. Key divergence events include the separation of Buergeria in the late Eocene (~39.43 Mya), Polypedates in the mid-Oligocene (~30.96 Mya), and the speciation event separating Rhacophorus occurred during the Miocene (~16.5 Mya). Within Polypedates, P. braueri diverged earlier (~4.03 Mya) than the P. leucomystax-P. megacephalus split (~2.79 Mya). These diversification patterns correlate with major climatic shifts, including Eocene–Oligocene cooling and mid-Miocene warming characterized by elevated temperatures, reduced atmospheric oxygen, and lower COX2 levels compared to present conditions. The warmer Miocene climate, particularly, may have driven the observed rapid diversification within Rhacophoridae.

3.7. Non-Synonymous and Synonymous Substitution Rates

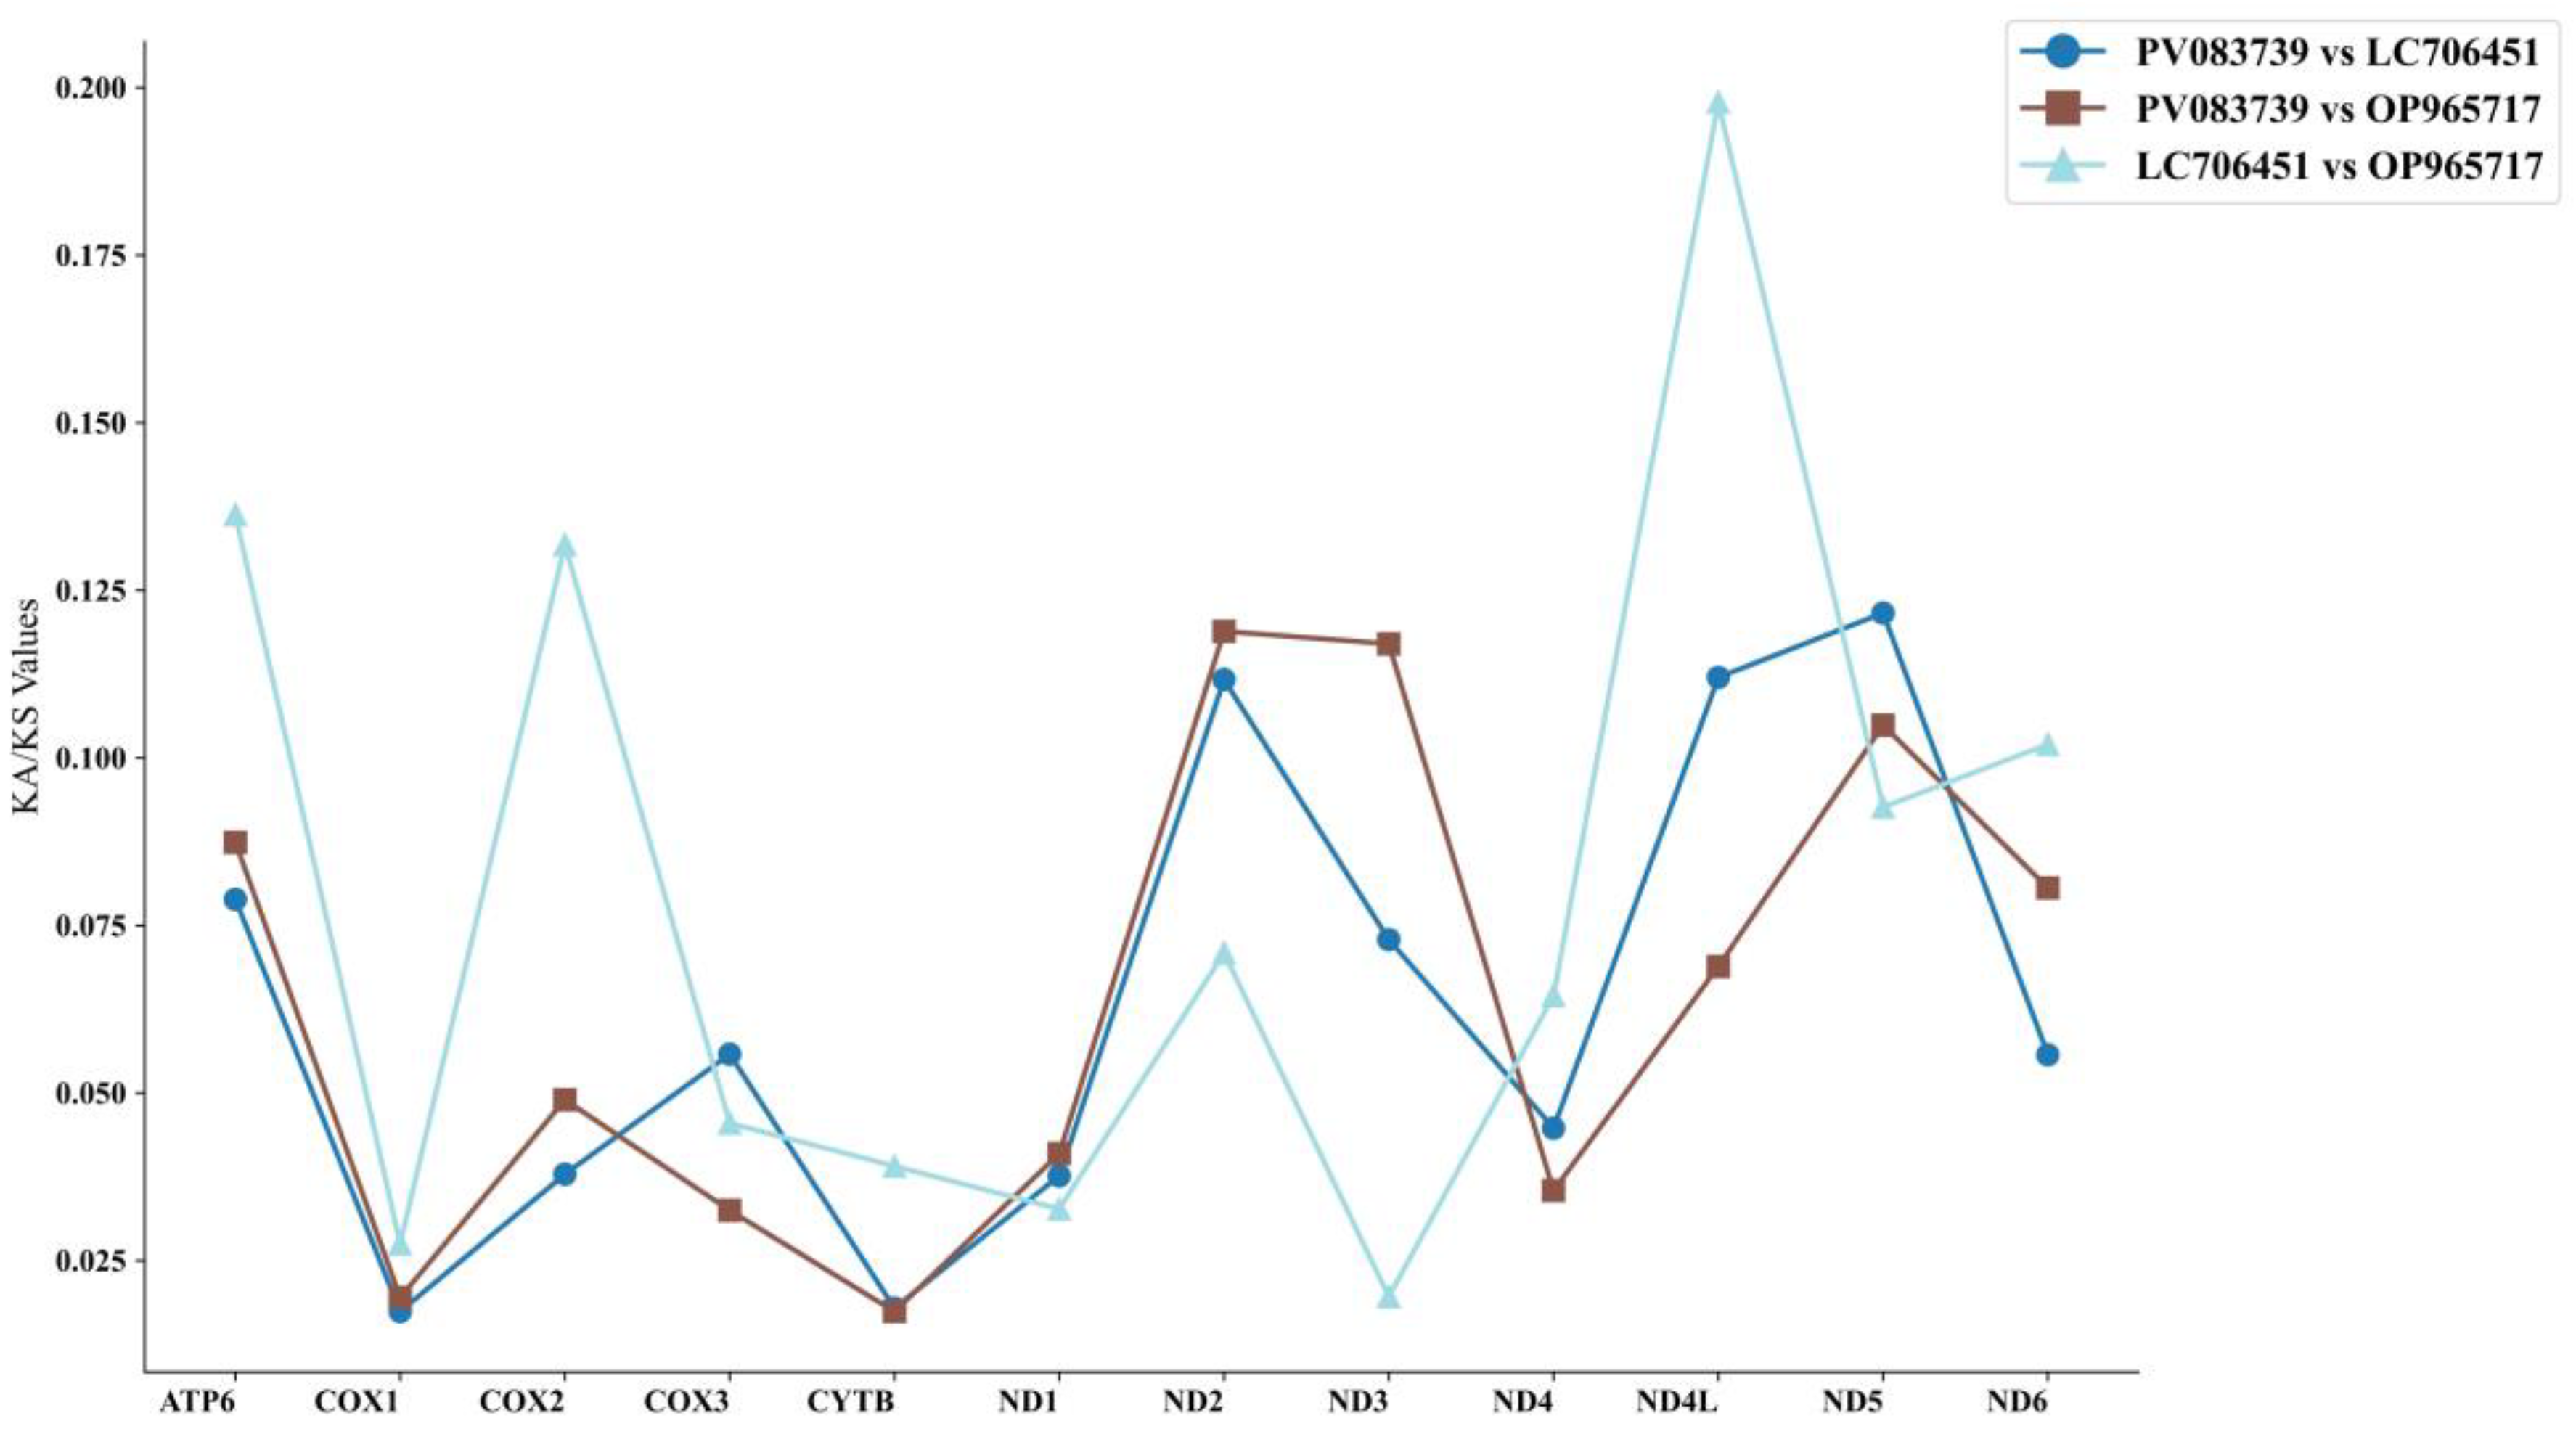
Following the identification of ATP8 gene loss in P. braueri, we conducted a comprehensive analysis of evolutionary selection pressures by comparing nonsynonymous (Ka) and synonymous (Ks) substitution rates across the remaining 12 mitochondrial protein-coding genes. The Ka/Ks ratio analysis, a robust metric for detecting molecular evolution patterns, demonstrated that all examined genes exhibited values significantly below 1 (Figure 9) [44], indicating pervasive purifying selection maintaining functional protein structures. Notably, different patterns emerge between genomic functional groups. Genes encoding complex I core catalytic subunits (ND subunits, especially ND4) and complex IV core catalytic subunits (COX1, COX2, and COX3) exhibit strong purification selection (COX1 has the lowest Ka/Ks ratio), consistent with their integral role in proton transport and electron transport in the electron transport chain (ETC). Similarly, CYTB (complex III) and ATP6 (complex V) also exhibit extreme conservatism (particularly the very low Ka/Ks ratio of CYTB), highlighting the strict functional limitations of these key components of oxidative phosphorylation. While ND4L and ND5 are still in the purification selection process, their Ka/Ks values are slightly higher relative to the ETC core elements described above, suggesting that the restrictions may be slightly relaxed, or the intramolecular functional landscape is different. The strong protective properties of COX1 observed in this study are consistent with these broader ETC core gene evolutionary patterns.
This differential evolutionary rate pattern suggests varying degrees of functional constraint across the mitochondrial genome, with these electron transport chain components being under the most stringent selective pressures. The extreme conservation of COX1, coupled with its appropriate sequence length and informativeness, highlights its potential as a core marker for resolving deep phylogenetic relationships within Rhacophoridae when analyzed in combination with other mitochondrial loci. These findings not only elucidate the evolutionary dynamics of mitochondrial genes in Polypedates but also provide valuable insights for selecting optimal molecular markers in amphibian systematics.

4. Discussion

4.1. Mitogenome Sructural Analyses of Genus Polypedates

The mitogenomes of all three Polypedates species exhibit a pronounced AT bias, ranging from 61.35% to 61.89% (Table S2), which may reflect selective pressures to minimize energetic costs during transcription [45,46]. These genomes display compact organization, evidenced by frequent gene overlaps and reduced intergenic spacers, consistent with strong selection for genomic economy [4,47]. Codon usage analysis reveals conserved start/stop codons and a distinct AT preference at the third codon positions, patterns commonly observed in vertebrate mitochondrial DNA [48,49]. The prevalent incomplete T- stop codons and atypical tRNASer structures, known features of anuran mitogenomes [50,51], appear functionally maintained through compensatory molecular mechanisms [52]. These conserved genomic features collectively underscore the evolutionary optimization of Polypedates mitochondrial DNA, balancing functional integrity with metabolic efficiency.
The expanded mitogenomes observed in certain anurans primarily result from duplicated control regions (CRs) [53,54,55]. Among the studied Polypedates species, P. braueri and P. leucomystax possess two adjacent CRs separated by a single ND5 gene, while P. megacephalus exhibits three CRs flanking two ND5 genes. Similar CR duplications have been documented in mantellid tree frogs, where homologous or illegitimate recombination events likely generated these structural variations [55,56]. These observations support our hypothesis that recombination mechanisms, including gene conversion and unequal crossover during mitochondrial DNA replication [57], underlie the CR multiplicity in Polypedates. Such recombination processes may explain the heterogeneous structural domains observed in CRs and represent an important aspect of mitochondrial genome evolution in anurans [58].

4.2. Phylogenetic Analysis and Divergence Time Estimation

Extensive molecular evidence has consistently supported the monophyletic status of Mantellidae and Rhacophoridae as sister taxa [58,59,60,61]. The phylogenetic position of Dicroglossinae relative to Ranidae remains a subject of ongoing debate. For instance, Bayesian analyses conducted by Cui et al. [1] and earlier studies focusing on mitochondrial protein-coding genes (PCGs) [62,63] have consistently recovered Dicroglossinae as the sister group to Ranidae. In contrast, our study’s maximum likelihood analyses, alongside recent multilocus investigations, support a distinct alternative topology—one in which Mantellidae and Rhacophoridae together form the sister clade to Ranidae. These conflicting results highlight the need for further research (e.g., expanded taxon sampling or the integration of additional genetic markers) to resolve the ambiguous phylogenetic relationship between Dicroglossinae and Ranidae. These results collectively suggest a robust phylogenetic framework for these anuran families: (Pyxicephalidae + (Dicroglossinae + ((Mantellidae + Rhacophoridae) + Ranidae))) [59,61], with our data specifically supporting the relationship ((Dicroglossidae + Ranidae) + (Mantellidae + Rhacophoridae)). The congruence between our mitochondrial data and previous nuclear–mitochondrial combined analyses [1,59,61] underscores the importance of utilizing multiple molecular markers for resolving deep phylogenetic relationships, an approach that has proven successful in other vertebrate groups, including snakes [64]. Furthermore, the well-supported sister relationship between P. braueri and the P. megacephalus-P. leucomystax clade [16] provides additional resolution within this phylogenetic framework.
Phylogenetic evidence reveals that the spatiotemporal diversification of Rhacophoridae correlates strongly with major paleoclimatic events. Molecular dating estimates place the most recent common ancestor of Mantellidae and Rhacophoridae in the late Paleocene (58.70 Ma, 95% HPD: 54.23–62.32 Ma) [12], with the crown group Rhacophoridae originating during the Early Eocene Climatic Optimum (∼51 Ma, 95% HPD: 47.51–53.5 Ma). In addition, our estimate of the origin of Rhacophoridae is slightly earlier than the previously reported ∼49 Ma (Eocene) and significantly later than the [60] Cretaceous (∼77 Ma) estimate. We believe that these differences are mainly due to key differences in fossil calibration strategies. Some earlier studies ruled out this critical calibration or relied on more obscure fossil priors, likely leading to an underestimation of nodal age. The subsequent radiation of major rhacophorid lineages occurred predominantly during the Eocene, with the Rhacophorinae (excluding Buergeria) diverging near the Middle Eocene Climatic Optimum (39.43 Ma, 95% HPD: 34.25–43.40 Ma)-a finding congruent with Chen et al.’s results [12]. Notably, the most species-rich clades emerged synchronously around 35 Ma, a timeframe that coincides with the Eocene-Oligocene transition, a period of significant global cooling and Antarctic glaciation [65,66]. Furthermore, a substantial number of speciation events appear to align with the Miocene, an epoch characterized by prolonged warming and increased precipitation patterns, particularly in Asia [67]. For key nodes in Rhacophoridae, such as the differentiation of Buergeria (estimated here at 39.43 Ma), our results are about the same as those in Ref. [55], but earlier than those in Ref. [60]. This cross-study consistency with some studies but not others underscores the importance of selecting appropriate calibration points and molecular clock models. Although formal statistical tests require future expansion of datasets, the repeated consistency between our differentiation estimates and independently documented climate thresholds [68] suggests a biologically credible causal link. These results not only clarify the evolutionary timeline of Rhacophoridae but also demonstrate the effectiveness of time-independent Bayesian methods for amphibian differentiation dating, suggesting that future research needs to combine process-based biogeographic models (e.g., BioGeoBEARS) with broader species-level sampling and clear statistical tests of diversification rates (e.g., BAMM, FiSSE), The relative role of climate and other driving factors in the evolution of Rhacophoridae was strictly distinguished. Global climate change, including shifts in monsoon climates and global warming, has been identified as a key driver of the diversification of Polypedates species. For instance, fluctuations in monsoon intensity during the Neogene and Quaternary periods altered hydrological regimes and vegetation cover across Southeast and East Asia—core distribution areas of Polypedates—creating fragmented habitats and new ecological niches [23]. These changes forced Polypedates populations to adapt to divergent microclimates (e.g., varying rainfall patterns, temperature gradients) or become geographically isolated, reducing gene flow and facilitating genetic differentiation. Meanwhile, long-term global warming has expanded suitable thermal ranges for some Polypedates lineages, enabling their dispersal into previously uninhabitable regions and promoting sympatric or parapatric speciation through ecological partitioning. Collectively, such climate-driven environmental changes have directly and indirectly accelerated the diversification of Polypedates by shaping their distribution, population connectivity, and adaptive evolution [18,67].

4.3. Inference into ATP8 Gene Loss in Polypedates Frogs

In this study, which focused on phylogenetic relationships and non-coding region (NCR) sequence alignments of two Polypedates species, we identified a shared ATP8 pseudogene sequence between the two taxa. Leveraging robust phylogenetic frameworks and sequence alignment outcomes, we categorized the evolutionary origins of the large NCR in P. megacephalus and the small NCR in P. braueri into two distinct pathways. The first pathway involves the initial formation of tandem repeats in the COII–tRNALys region of P. megacephalus, followed by random mutations in the redundant copies of the COII gene, tRNALys, and ATP8. The second pathway entails the direct random mutation of ATP8 genes in P. braueri, leading to the formation of its small NCR. Notably, ATP8 loss in these two Polypedates species occurred via different routes and within distinct phylogenetic clusters. Parallel evolution has been documented in other anuran lineages with identical gene orders [23,69]; this precedent, combined with our current observations, suggests that ATP8 absence in Polypedates frogs may also result from parallel evolution. Specifically, the co-occurrence of these molecular traits indicates that independent ATP8 loss-of-function events have emerged via parallel evolutionary mechanisms across distinct Polypedates clades [1]. The loss of mitochondrial ATP8 does not necessarily abrogate its physiological function, as mitochondrial sequences often have nuclear counterparts—such nuclear copies of mitochondrial DNA have been detected across diverse organisms, including invertebrates, vertebrates, fungi, and plants [70]. While ATP8 loss has been reported in several metazoan species phylogenetically distant from frogs (e.g., nematodes [47,71], mollusks [72,73], and rotifers [68,73]), most of these taxa are invertebrates. Among vertebrates, however, ATP8 absence has thus far only been observed in the genus Polypedates, implying this trait could serve as a distinguishing feature of Polypedates frogs relative to other vertebrate groups. Typically, NCRs derived from gene non-functionalization tend to be eliminated from mitochondrial genomes. This is because metazoan mitogenomes are under strong selective pressure to maintain genome minimization [74], and repetitive or redundant sequences are prone to rapid deletion [32]. Notably, a more compact mitogenome is associated with a faster self-replication rate [23], further supporting the likelihood of NCR removal in these lineages.

4.4. Selective Pressure of Genus Polypedates

Comparative analyses of three Polypedates species revealed strong purifying selection acting on mitochondrial protein-coding genes, evidenced by Ka/Ks ratios consistently below 1 (P. braueri and relatives) [8,74,75]. This evolutionary pattern reflects stringent functional constraints, where non-synonymous mutations disrupting critical protein functions are selectively removed, maintaining structural and functional stability [76]. Notably, COX1 demonstrated exceptional evolutionary conservation, exhibiting the lowest Ka/Ks values (0.0174–0.0275) across all examined species pairs [77,78]. This high level of conservation strongly implies that COX1 plays a critical role in mitochondrial oxidative phosphorylation—where even minor amino acid changes could disrupt its enzymatic function or structural stability, thus subjecting the gene to strong purifying selection to retain its essential physiological role. However, substantial variation in selection pressures was observed among both genes and lineages [12,45,79], potentially attributable to (1) differential functional constraints within the oxidative phosphorylation pathway [8,12] and (2) distinct evolutionary trajectories among species [69]. These findings not only reinforce the remarkable evolutionary stability characteristic of mitogenomes but also illuminate the complex selective landscape governing mitochondrial evolution in Polypedates species, offering novel insights into the differential evolutionary dynamics across genomic regions. To enhance our understanding of molecular evolution in these lineages, subsequent investigations should integrate three key approaches: (1) expanded taxonomic sampling to improve phylogenetic resolution, (2) the implementation of codon-based selection models to detect potential localized adaptive evolution, and (3) combined analyses of structural and functional constraints to identify specific sites under positive selection. Such multidimensional analyses would significantly refine our capacity to discriminate between background purifying selection and rare adaptive signals within these conserved mitochondrial genomes, while providing greater evolutionary context for the observed selection patterns.
For P. braueri mitogenomes missing the APT8 gene, it was not possible to calculate selection pressure for this, but the absence of mitochondrial genes may not prevent them from continuing to perform their physiological functions through nuclear translocation [80] and deletion of the ATP8 gene has been found in a number of postnatal animals, most of which are invertebrates. However, in vertebrates, deletion of the ATP8 gene has only been found in the genus Polypedates, so this may be a distinguishing feature from other vertebrates [1]. Future studies could incorporate broader species sampling, more precise phylogenetic frameworks, and site-specific selection models to further resolve the presence of localized positive selection sites or adaptive evolutionary signals within these genes.

5. Conclusions

The present study reports the complete mitogenome of P. braueri, which spans 20,254 bp and includes twelve protein-coding genes (PCGs), 22 tRNAs, 2 rRNAs, and two non-coding regions (OL and CR). Phylogenetic analysis confirmed the monophyly of Rhacophoridae, which comprises three well-supported genera (Rhacophorus, Polypedates, and Buergeria) and forms a sister group to Mantellidae. Within Rhacophoridae, Rhacophorus constitutes a distinct clade with Polypedates as its sister group, wherein P. braueri, P. megacephalus, and P. leucomystax form a cohesive cluster, with P. megacephalus and P. leucomystax exhibiting a sister relationship. These findings provide essential genetic data to support the management and conservation of P. braueri and related Polypedates species. However, further investigation involving extensive sampling is necessary to clarify the taxonomic status and evolutionary relationships within this genus.

Supplementary Materials

The following supporting information can be downloaded at: https://www.mdpi.com/article/10.3390/biology14091299/s1, Figure S1: Species distribution map of Polypedates braueri, Polypedates megacephalus, and Polypedates leucomystax; Figure S2: The secondary structural predictions for the 22 tRNA genes in Polypedates leucomystax; Figure S3: The secondary structural predictions for the 22 tRNA genes in Polypedates megacephalus;. Figure S4: The prognostic map of 12S rRNA secondary structures in Polypedates leucomystax; Figure S5: The prognostic map of 16S rRNA secondary structures in Polypedates leucomystax; Figure S6: The prognostic map of 12S rRNA secondary structures in Polypedates megacephalus; Figure S7: The prognostic map of 16S rRNA secondary structures in Polypedates megacephalus; Table S1: PCR primers for the Polypedates braueri mitochondrial genome; Table S2: Annotation of the mitochondrial genome of Polypedates braueri, Polypedates megacephalus and Polypedates leucomystax; Table S3: Overlapping and intergenic spacer sections of the mitochondrial genomes of Polypedates braueri, Polypedates megacephalus, and Polypedates leucomystax. Numbers indicate intergenic spaces (positive values) or intergenic overlap (negative values). Reference [20] is cited in the Supplementary Materials.

Author Contributions

Conceptualization, S.C., H.H. and L.J.; methodology, S.S., H.H. and C.L.; software, S.S., S.C. and C.L.; formal analysis, S.S., K.H. and X.X.; resources, H.H.; data curation, S.S. and L.J.; visualization, S.S., S.C. and H.H.; writing—original draft preparation, S.C. and S.S.; writing—review and editing, S.S., H.H. and L.J.; project administration, S.C.; supervision, X.X., K.H. and C.L.; funding acquisition, LJ. All authors have read and agreed to the published version of the manuscript.

Funding

This research was funded by the Natural Science Foundation Project of Science and Technology Department of Sichuan Province (grant number: 2023NSFSC0206) and the Research Project of Ecological Security and Protection Key Laboratory of Sichuan Province (grant number: ESP2003).

Institutional Review Board Statement

The animal study protocol was approved by the Scientific Research Ethics Committee of Mianyang Teachers’ College (Approval No.: MSL202532). The approval date is 30 July 2025.

Informed Consent Statement

Not applicable.

Data Availability Statement

Mitochondrial genome sequence data supporting the findings of this study are openly available from GenBank of the National Center for Biotechnology Information (NCBI) at https://www.ncbi.nlm.nih.gov (accession number: PV083739).

Acknowledgments

We thank Changwu Wang and other colleagues for their assistance in sample collection and experiments.

Conflicts of Interest

The authors declare no conflicts of interest.

References

  1. Cui, L.; Huang, A.; He, Z.; Ao, L.; Ge, F.; Fan, X.; Zeng, B.; Yang, M.; Yang, D.; Ni, Q.; et al. Complete Mitogenomes of Polypedates Tree Frogs Unveil Gene Rearrangement and Concerted Evolution within Rhacophoridae. Animals 2022, 12, 2449. [Google Scholar] [CrossRef]
  2. McDonough, K. Amphibian Species of the World: An Online Reference (Version 6). Ref. Rev. 2014, 28, 32. [Google Scholar] [CrossRef]
  3. Pan, S.; Dang, N.; Wang, J.; Zheng, Y.; Rao, D.; Li, J. Molecular Phylogeny Supports the Validity of Polypedates impresus Yang 2008. Asian Herpetol. Res. 2013, 4, 124–133. [Google Scholar] [CrossRef]
  4. Curole, J.P.; Kocher, T.D. Mitogenomics: Digging deeper with complete mitochondrial genomes. Trends Ecol. Evol. 1999, 14, 394–398. [Google Scholar] [CrossRef]
  5. Nass, S.; Nass, M.M. Intramitochondrial fibers with DNA characteristics. II. Enzymatic and other hydrolytic treatments. J. Cell Biol. 1963, 19, 613–629. [Google Scholar] [CrossRef]
  6. Keeling, P.J.; Archibald, J.M. Organelle evolution: What’s in a name? Curr. Biol. 2008, 18, 345–347. [Google Scholar] [CrossRef]
  7. Birky, C.W., Jr. The inheritance of genes in mitochondria and chloroplasts: Laws, mechanisms, and models. Annu. Rev. Genet. 2001, 35, 125–148. [Google Scholar] [CrossRef] [PubMed]
  8. Sato, M.; Sato, K. Maternal inheritance of mitochondrial DNA by diverse mechanisms to eliminate paternal mitochondrial DNA. Biochim. Biophys. Acta 2013, 1833, 1979–1984. [Google Scholar] [CrossRef] [PubMed]
  9. Gong, L.; Jiang, H.; Zhu, K.; Lu, X.; Liu, L.; Liu, B.; Jiang, L.; Ye, Y.; Lü, Z. Large-scale mitochondrial gene rearrangements in the hermit crab Pagurus nigrofascia and phylogenetic analysis of the Anomura. Gene 2019, 695, 75–83. [Google Scholar] [CrossRef]
  10. Wu, Q.L.; Li, Q.; Gu, Y.; Shi, B.C.; van Achterberg, C.; Wei, S.J.; Chen, X.X. The complete mitochondrial genome of Taeniogonalos taihorina (Bischoff) (Hymenoptera: Trigonalyidae) reveals a novel gene rearrangement pattern in the Hymenoptera. Gene 2014, 543, 76–84. [Google Scholar] [CrossRef] [PubMed]
  11. Huang, A.; Liu, S.; Li, H.; Luo, H.; Ni, Q.; Yao, Y.; Xu, H.; Zeng, B.; Li, Y.; Wei, Z.; et al. The revised complete mitogenome sequence of the tree frog Polypedates megacephalus (Anura, Rhacophoridae) by next-generation sequencing and phylogenetic analysis. PeerJ 2019, 7, e7415. [Google Scholar] [CrossRef] [PubMed]
  12. Chen, J.M.; Prendini, E.; Wu, Y.H.; Zhang, B.L.; Suwannapoom, C.; Chen, H.M.; Jin, J.Q.; Lemmon, E.M.; Lemmon, A.R.; Stuart, B.L.; et al. An integrative phylogenomic approach illuminates the evolutionary history of Old World tree frogs (Anura: Rhacophoridae). Mol. Phylogenet. Evol. 2020, 145, 106724. [Google Scholar] [CrossRef] [PubMed]
  13. Li, J.T.; Che, J.; Bain, R.H.; Zhao, E.M.; Zhang, Y.P. Molecular phylogeny of Rhacophoridae (Anura): A framework of taxonomic reassignment of species within the genera Aquixalus, Chiromantis, Rhacophorus, and Philautus. Mol. Phylogenet. Evol. 2008, 48, 302–312. [Google Scholar] [CrossRef]
  14. Mahony, S.; Foley, N.M.; Biju, S.D.; Teeling, E.C. Teeling, evolutionary history of the Asian horned frogs (Megophryinae):Integrative approaches to timetree dating in the absence of a fossil record. Mol. Biol. Evol. 2017, 34, 744–771. [Google Scholar]
  15. Jiang, D.; Jiang, K.; Ren, J.; Wu, J.; Li, J. Resurrection of the genus Leptomantis, with description of a new genus to the family Rhacophoridae (Amphibia: Anura). Asian Herpetol. Res. 2019, 10, 1–12. [Google Scholar]
  16. An, H.; Haijun, L.; Hongdi, L.; Qingyong, N.; Yongfang, Y.; Huailiang, X.; Bo, Z.; Ying, L.; Zhimin, W.; Mingwang, Z. The complete mitochondrial genome of the tree frog, Polypedates braueri (Anura, Rhacophoridae). Mitochondrial DNA B 2019, 4, 1739–1740. [Google Scholar]
  17. Liu, Y.; Yang, M.; Jiang, Y.; Han, F.; Li, Y.; Ni, Q.; Yao, Y.; Xu, H.; Zhang, M. The near complete mitochondrial genome of white-lipped Treefrog, Polypedates braueri (Anura, Rhacophoridae). Mitochondrial DNA Part A 2017, 28, 271–272. [Google Scholar] [CrossRef]
  18. Tamura, K.; Stecher, G.; Peterson, D.; Filipski, A.; Kumar, S. MEGA6: Molecular Evolutionary Genetics Analysis version 6.0. Mol. Biol. Evol. 2013, 30, 2725–2729. [Google Scholar] [CrossRef]
  19. Kuraishi, N.; Matsui, M.; Hamidy, A.; Belabut, D.M.; Ahmad, N.; Panha, S.; Sudin, A.; Yong, H.S.; Jiang, J.; Ota, H.; et al. Phylogenetic and taxonomic relationships of the Polypedates leucomystax complex (Amphibia). Zool. Scr. 2012, 42, 54–70. [Google Scholar] [CrossRef]
  20. Yuan, L.M.; Deng, X.L.; Jiang, D.C.; Klaus, S.; Orlov, N.L.; Yang, K.; Li, J.T. Geographical range evolution of the genus Polypedates (Anura: Rhacophoridae) from the Oligocene to present. Zool. Res. 2021, 42, 116–123. [Google Scholar] [CrossRef]
  21. Fedorin, N.D.; Chuykova, O.V.; Eprintsev, T.A. Modification of the Method for Isolating MicroRNA from Plants by Phenol–Chloroform Extraction Using Polyethylene Glycol 1500. Biochem. Moscow. Suppl. Ser. B. 2023, 17, 26–30. [Google Scholar] [CrossRef]
  22. Kurabayashi, A.; Sumida, M. PCR primers for the neobatrachian mitochondrial genome. Curr. Herpetol. 2009, 28, 1–11. [Google Scholar] [CrossRef]
  23. Xia, X. DAMBE7: New and improved tools for data analysis in molecular biology and evolution. Mol. Biol. Evol. 2018, 35, 1550–1552. [Google Scholar] [CrossRef]
  24. Tamura, K.; Glen, S.; Sudhir, K. MEGA11: Molecular Evolutionary Genetics Analysis version 11. Mol. Biol. Evol. 2021, 38, 302–307. [Google Scholar] [CrossRef]
  25. Perna, N.T.; Kocher, T.D. Patterns of nucleotide composition at fourfold degenerate sites of animal mitochondrial genomes. J. Mol. Evol. 1995, 41, 353–358. [Google Scholar] [CrossRef]
  26. Bernt, M.; Donath, A.; Jühling, F.; Externbrink, F.; Florentz, C.; Fritzsch, G.; Pütz, J.; Middendorf, M.; Stadler, P.F. MITOS: Improved de novo metazoan mitochondrial genome annotation. Mol. Phylogenet. Evol. 2013, 69, 313–319. [Google Scholar] [CrossRef] [PubMed]
  27. Sweeney, B.A.; Hoksza, D.; Nawrocki, E.P.; Ribas, C.E.; Madeira, F.; Cannone, J.J.; Gutell, R.; Maddala, A.; Meade, C.D.; Williams, L.D.; et al. R2DT is a framework for predicting and visualising RNA secondary structure using templates. Nat. Commun. 2021, 12, 3494. [Google Scholar] [CrossRef]
  28. Grant, J.R.; Enns, E.; Marinier, E.; Mandal, A.; Herman, E.K.; Chen, C.; Graham, M.; van Domselaar, G.; Stothard, P. Proksee: In-depth characterization and visualization of bacterial genomes. Nucleic Acids Res. 2023, 51, W484–W492. [Google Scholar] [CrossRef] [PubMed]
  29. Zhang, D.; Gao, F.; Li, W.X.; Jakovli’c, I.; Zou, H.; Zhang, J.; Wang, G.T. PhyloSuite: An integrated and scalable desktop platform for streamlined molecular sequence data management and evolutionary phylogenetics studies. Mol. Ecol. Resour. 2020, 20, 348–355. [Google Scholar] [CrossRef]
  30. Katoh, K.; Standley, D.M. MAFFT multiple sequence alignment software version 7: Improvements in performance and usability. Mol. Biol. Evol. 2013, 30, 772–780. [Google Scholar] [CrossRef]
  31. Darriba, D.; Taboada, G.L.; Doallo, R.; Posada, D. jModelTest 2: More models, new heuristics and parallel computing. Nat. Methods. 2012, 9, 772. [Google Scholar] [CrossRef]
  32. Ronquist, F.; Teslenko, M.; van der Mark, P.; Ayres, D.L.; Darling, A.; Höhna, S.; Larget, B.; Liu, L.; Suchard, M.A.; Huelsenbeck, J.P. MrBayes 3.2: Efficient Bayesian phylogenetic inference and model choice across a large model space. Syst. Biol. 2012, 61, 539–542. [Google Scholar] [CrossRef]
  33. Nguyen, L.T.; Schmidt, H.A.; von Haeseler, A.; Minh, B.Q. IQ-TREE: A fast and effective stochastic algorithm for estimating maximum-likelihood phylogenies. Mol. Biol. Evol. 2015, 32, 268–274. [Google Scholar] [CrossRef]
  34. Drummond, A.J.; Suchard, M.A.; Xie, D.; Rambaut, A. Bayesian phylogenetics with BEAUti and the BEAST 1.7. Mol. Biol. Evol. 2012, 29, 1969–1973. [Google Scholar] [CrossRef] [PubMed]
  35. Zhang, P.; Zhou, H.; Chen, Y.; Liu, Y.; Qu, L. Mitogenomic perspectives on the origin and phylogeny of living amphibians. Syst. Biol. 2005, 54, 391–400. [Google Scholar] [CrossRef] [PubMed]
  36. Tamura, K.; Battistuzzi, F.U.; Billing-Ross, P.; Murillo, O.; Filipski, A.; Kumar, S. Estimating divergence times in large molecular phylogenies. Proc. Natl. Acad. Sci. USA 2012, 109, 19333–19338. [Google Scholar] [CrossRef]
  37. Zhang, Z. KaKs_Calculator 3.0: Calculating Selective Pressure on Coding and Non-Coding Sequences. Genom. Proteom. Bioinform. 2022, 20, 536–540. [Google Scholar] [CrossRef] [PubMed]
  38. Zhang, P.; Zhou, H.; Liang, D.; Liu, Y.; Chen, Y.; Qu, L. The complete mitochondrial genome of a tree frog, Polypedates megacephalus (Amphibia: Anura: Rhacophoridae), and a novel gene organization in living amphibians. Gene 2005, 346, 133–143. [Google Scholar] [CrossRef]
  39. Varani, G.; McClain, W.H. The G x UWobble Base Pair. A Fundamental Building Block of RNA Structure Crucial to RNA Function in Diverse Biological Systems. EMBO Rep. 2000, 1, 18–23. [Google Scholar] [CrossRef]
  40. Zheng, C.; Nie, L.; Wang, J.; Zhou, H.; Hou, H.; Wang, H.; Liu, J. Recombination and evolution of duplicate control regions in the mitochondrial genome of the Asian big-headed turtle, Platysternon megacephalum. PLoS ONE 2013, 8, e82854. [Google Scholar] [CrossRef][Green Version]
  41. Akiyama, T.; Nishida, C.; Momose, K.; Onuma, M.; Takami, K.; Masuda, R. Gene duplication and concerted evolution of mitochondrial DNA in crane species. Mol. Phylogenet. Evol. 2017, 106, 158–163. [Google Scholar] [CrossRef] [PubMed]
  42. Zhuang, X.; Cheng, C.H. ND6 gene lost and found: Evolution of mitochondrial gene rearrangement in antarctic notothenioids. Mol. Biol. Evol. 2010, 27, 1391–1403. [Google Scholar] [CrossRef] [PubMed]
  43. Pyron, R.A.; Wiens, J.J. A large-scale phylogeny of Amphibia including over 2800 species, and a revised classification of extant frogs, salamanders, and caecilians. Mol. Phylogenet. Evol. 2011, 61, 543–583. [Google Scholar] [CrossRef]
  44. Meiklejohn, C.D.; Montooth, K.L.; Rand, D.M. Positive and negative selection on the mitochondrial genome. Trends Genet. 2007, 23, 259–263. [Google Scholar] [CrossRef] [PubMed]
  45. Chen, W.; Lu, G.; Bork, P.; Hu, S.; Lercher, M.J. Energy efficiency trade-offs drive nucleotide usage in transcribed regions. Nat. Commun. 2016, 7, 11334. [Google Scholar] [CrossRef]
  46. Li, X.; Yan, L.; Pape, T.; Gao, Y.; Zhang, D. Evolutionary insights into bot flies (Insecta: Diptera: Oestridae) from comparative analysis of the mitochondrial genomes. Int. J. Biol. Macromol. 2020, 149, 371–380. [Google Scholar] [CrossRef]
  47. Yokobori, S.; Fukuda, N.; Nakamura, M.; Aoyama, T.; Oshima, T. Long-term conservation of six duplicated structural genes in cephalopod mitochondrial genomes. Mol. Biol. Evol. 2004, 21, 2034–2046. [Google Scholar] [CrossRef]
  48. Zhou, M.; Yu, J.; Li, B.; Ouyang, B.; Yang, J. The complete mitochondrial genome of Budorcas taxicolor tibetana (Artiodactyla: Bovidae) and comparison with other Caprinae species: Insight into the phylogeny of the genus Budorcas. Int. J. Biol. Macromol. 2019, 121, 223–232. [Google Scholar] [CrossRef]
  49. Sun, C.; Liu, H.; Min, X.; Lu, C. Mitogenome of the little owl Athene noctua and phylogenetic analysis of Strigidae. Int. J. Biol. Macromol. 2020, 151, 924–931. [Google Scholar] [CrossRef]
  50. Boore, J.L. Animal mitochondrial genomes. Nucleic Acids Res. 1999, 27, 1767–1780. [Google Scholar] [CrossRef]
  51. Miya, M.; Kawaguchi, A.; Nishida, M. Mitogenomic exploration of higher teleostean phylogenies: A case study for moderate-scale evolutionary genomics with 38 newly determined complete mitochondrial DNA sequences. Mol. Biol. Evol. 2001, 18, 1993–2009. [Google Scholar] [CrossRef]
  52. Steinberg, S.; Cedergren, R. Structural compensation in atypical mitochondrial tRNAs. Nat. Struct. Biol. 1994, 1, 507–510. [Google Scholar] [CrossRef]
  53. Kurabayashi, A.; Usuki, C.; Mikami, N.; Fujii, T.; Yonekawa, H.; Sumida, M.; Hasegawa, M. Complete nucleotide sequence of the mitochondrial genome of a Malagasy poison frog Mantella madagascariensis: Evolutionary implications on mitochondrial genomes of higher anuran groups. Mol. Phylogenet. Evol. 2006, 39, 223–236. [Google Scholar] [CrossRef]
  54. Igawa, T.; Kurabayashi, A.; Usuki, C.; Fujii, T.; Sumida, M. Complete mitochondrial genomes of three neobatrachian anurans: A case study of divergence time estimation using different data and calibration settings. Gene 2008, 407, 116–129. [Google Scholar] [CrossRef]
  55. Kurabayashi, A.; Yoshikawa, N.; Sato, N.; Hayashi, Y.; Oumi, S.; Fujii, T.; Sumida, M. Complete mitochondrial DNA sequence of the endangered frog Odorrana ishikawae (family Ranidae) and unexpected diversity of mt gene arrangements in ranids. Mol. Phylogenet. Evol. 2010, 56, 543–553. [Google Scholar] [CrossRef] [PubMed]
  56. Kurabayashi, A.; Sumida, M. Afrobatrachian mitochondrial genomes: Genome reorganization, gene rearrangement mechanisms, and evolutionary trends of duplicated and rearranged genes. BMC Genom. 2013, 14, 633. [Google Scholar] [CrossRef] [PubMed]
  57. Ladoukakis, E.D.; Zouros, E. Recombination in animal mitochondrial DNA: Evidence from published sequences. Mol. Biol. Evol. 2001, 18, 2127–2131. [Google Scholar] [CrossRef][Green Version]
  58. Meegaskumbura, M.; Senevirathne, G.; Biju, S.; Garg, S.; Meegaskumbura, S.; Pethiyagoda, R.; Hanken, J.; Schneider, C.J. Patterns of reproductive-mode evolution in Old World tree frogs (Anura, Rhacophoridae). Zool. Scr. 2015, 44, 509–522. [Google Scholar] [CrossRef]
  59. Feng, Y.; Blackburn, D.C.; Liang, D.; Hillis, D.M.; Wake, D.B.; Cannatella, D.C.; Zhang, P. Phylogenomics reveals rapid, simultaneous diversification of three major clades of Gondwanan frogs at the Cretaceous–Paleogene boundary. Proc. Natl. Acad. Sci. USA 2017, 114, E5864–E5870. [Google Scholar] [CrossRef]
  60. Li, J.; Li, Y.; Klaus, S.; Rao, D.; Hillis, D.M.; Zhang, Y. Diversification of rhacophorid frogs provides evidence for accelerated faunal exchange between India and Eurasia during the Oligocene. Proc. Natl. Acad. Sci. USA 2013, 110, 3441–3446. [Google Scholar] [CrossRef]
  61. Yuan, Z.; Zhang, B.; Raxworthy, C.J.; Weisrock, D.W.; Hime, P.M.; Jin, J.; Lemmon, E.M.; Lemmon, A.R.; Holland, S.D.; Kortyna, M.L. Natatanuran frogs used the Indian Plate to step-stone disperse and radiate across the Indian Ocean. Natl. Sci. Rev. 2018, 6, 10–14. [Google Scholar] [CrossRef]
  62. Chen, G.; Wang, B.; Liu, J.; Xie, F.; Jiang, J. Complete mitochondrial genome of Nanorana pleskei (Amphibia: Anura: Dicroglossidae) and evolutionary characteristics. Curr. Zool. 2011, 57, 785–805. [Google Scholar] [CrossRef]
  63. Ren, Z.; Zhu, B.; Ma, E.; Wen, J.; Tu, T.; Cao, Y.; Hasegawa, M.; Zhong, Y. Complete nucleotide sequence and gene arrangement of the mitochondrial genome of the crab-eating frog Fejervarya cancrivora and evolutionary implications. Gene 2009, 441, 148–155. [Google Scholar] [CrossRef]
  64. Li, J.; Liang, D.; Wang, Y.; Guo, P.; Huang, S.; Zhang, P. A large-scale systematic framework of Chinese snakes based on a unified multilocus marker system. Mol. Phylogenet. Evol. 2020, 148, 106807. [Google Scholar] [CrossRef]
  65. Ballard, J.W.; Whitlock, M.C. The incomplete natural history of mitochondria. Mol. Ecol. 2004, 13, 729–744. [Google Scholar] [CrossRef]
  66. Pan, T.; Zhang, Y.; Wang, H.; Wu, J.; Kang, X.; Qian, L.; Chen, J.; Rao, D.; Jiang, J.; Zhang, B. The reanalysis of biogeography of the Asian tree frog, Rhacophorus (Anura: Rhacophoridae): Geographic shifts and climatic change influenced the dispersal process and diversification. PeerJ 2017, 5, e3995. [Google Scholar] [CrossRef]
  67. Scouras, A.; Beckenbach, K.; Arndt, A.; Smith, M.J. Complete mitochondrial genome DNA sequence for two ophiuroids and a holothuroid: The utility of protein gene sequence and gene maps in the analyses of deep deuterostome phylogeny. Mol. Phylogenet. Evol. 2004, 31, 50–65. [Google Scholar] [CrossRef]
  68. Bain, R.H.; Hurley, M.M. A biogeographic synthesis of the amphibians and reptiles of Indochina. Bull. Am. Mus. Nat. Hist. 2011, 360, 1–138. [Google Scholar] [CrossRef]
  69. Zhang, D.X.; Hewitt, G.M. Highly conserved nuclear copies of the mitochondrial control region in the desert locust Schistocerca gregaria: Some implications for population studies. Mol Ecol. 1996, 5, 295–300. [Google Scholar] [CrossRef]
  70. Lavrov, D.V.; Brown, W.M. Trichinella spiralis mtDNA: A nematode mitochondrial genome that encodes a putative ATP8 and normally structured tRNAs and has a gene arrangement relatable to those of coelomate metazoans. Genetics 2001, 157, 621–637. [Google Scholar] [CrossRef]
  71. Uliano-Silva, M.; Americo, J.A.; Costa, I.; Schomaker-Bastos, A.; de Freitas Rebelo, M.; Prosdocimi, F. The complete mitochondrial genome of the golden mussel Limnoperna fortunei and comparative mitogenomics of Mytilidae. Gene 2016, 577, 202–208. [Google Scholar] [CrossRef]
  72. Suga, K.; Mark Welch, D.B.; Tanaka, Y.; Sakakura, Y.; Hagiwara, A. Two circular chromosomes of unequal copy number make up the mitochondrial genome of the rotifer Brachionus plicatilis. Mol. Biol. Evol. 2008, 25, 1129–1137. [Google Scholar] [CrossRef]
  73. Steinauer, M.L.; Nickol, B.B.; Broughton, R.; Ortí, G. First sequenced mitochondrial genome from the phylum Acanthocephala (Leptorhynchoides thecatus)and its phylogenetic position within Metazoa. J. Mol. Evol. 2005, 60, 706–715. [Google Scholar] [CrossRef]
  74. Yang, Z. PAML 4: Phylogenetic analysis by maximum likelihood. Mol. Biol. Evol. 2007, 24, 1586–1591. [Google Scholar] [CrossRef]
  75. Rand, D.M. Population genetics of the cytoplasm and the units of selection on mitochondrial DNA in Drosophila melanogaster. Genetica 2011, 139, 685–697. [Google Scholar] [CrossRef][Green Version]
  76. Castresana, J. Cytochrome b phylogeny and the taxonomy of great apes and mammals. Mol. Biol. Evol. 2001, 18, 465–471. [Google Scholar] [CrossRef]
  77. Gissi, C.; Iannelli, F.; Pesole, G. Evolution of the mitochondrial genome of Metazoa as exemplified by comparison of congeneric species. Heredity 2008, 101, 301–320. [Google Scholar] [CrossRef]
  78. Nee, S.; May, R.M.; Harvey, P.H. The reconstructed evolutionary process. Philos. Trans. R Soc. Lond. B Biol. Sci. 1994, 344, 305–311. [Google Scholar]
  79. Bromham, L. Why do species vary in their rate of molecular evolution? Biol. Lett. 2009, 5, 401–404. [Google Scholar] [CrossRef]
  80. da Fonseca, R.R.; Johnson, W.E.; O’Brien, S.J.; Ramos, M.J.; Antunes, A. The adaptive evolution of the mammalian mitochondrial genome. BMC Genom. 2008, 9, 119. [Google Scholar] [CrossRef]
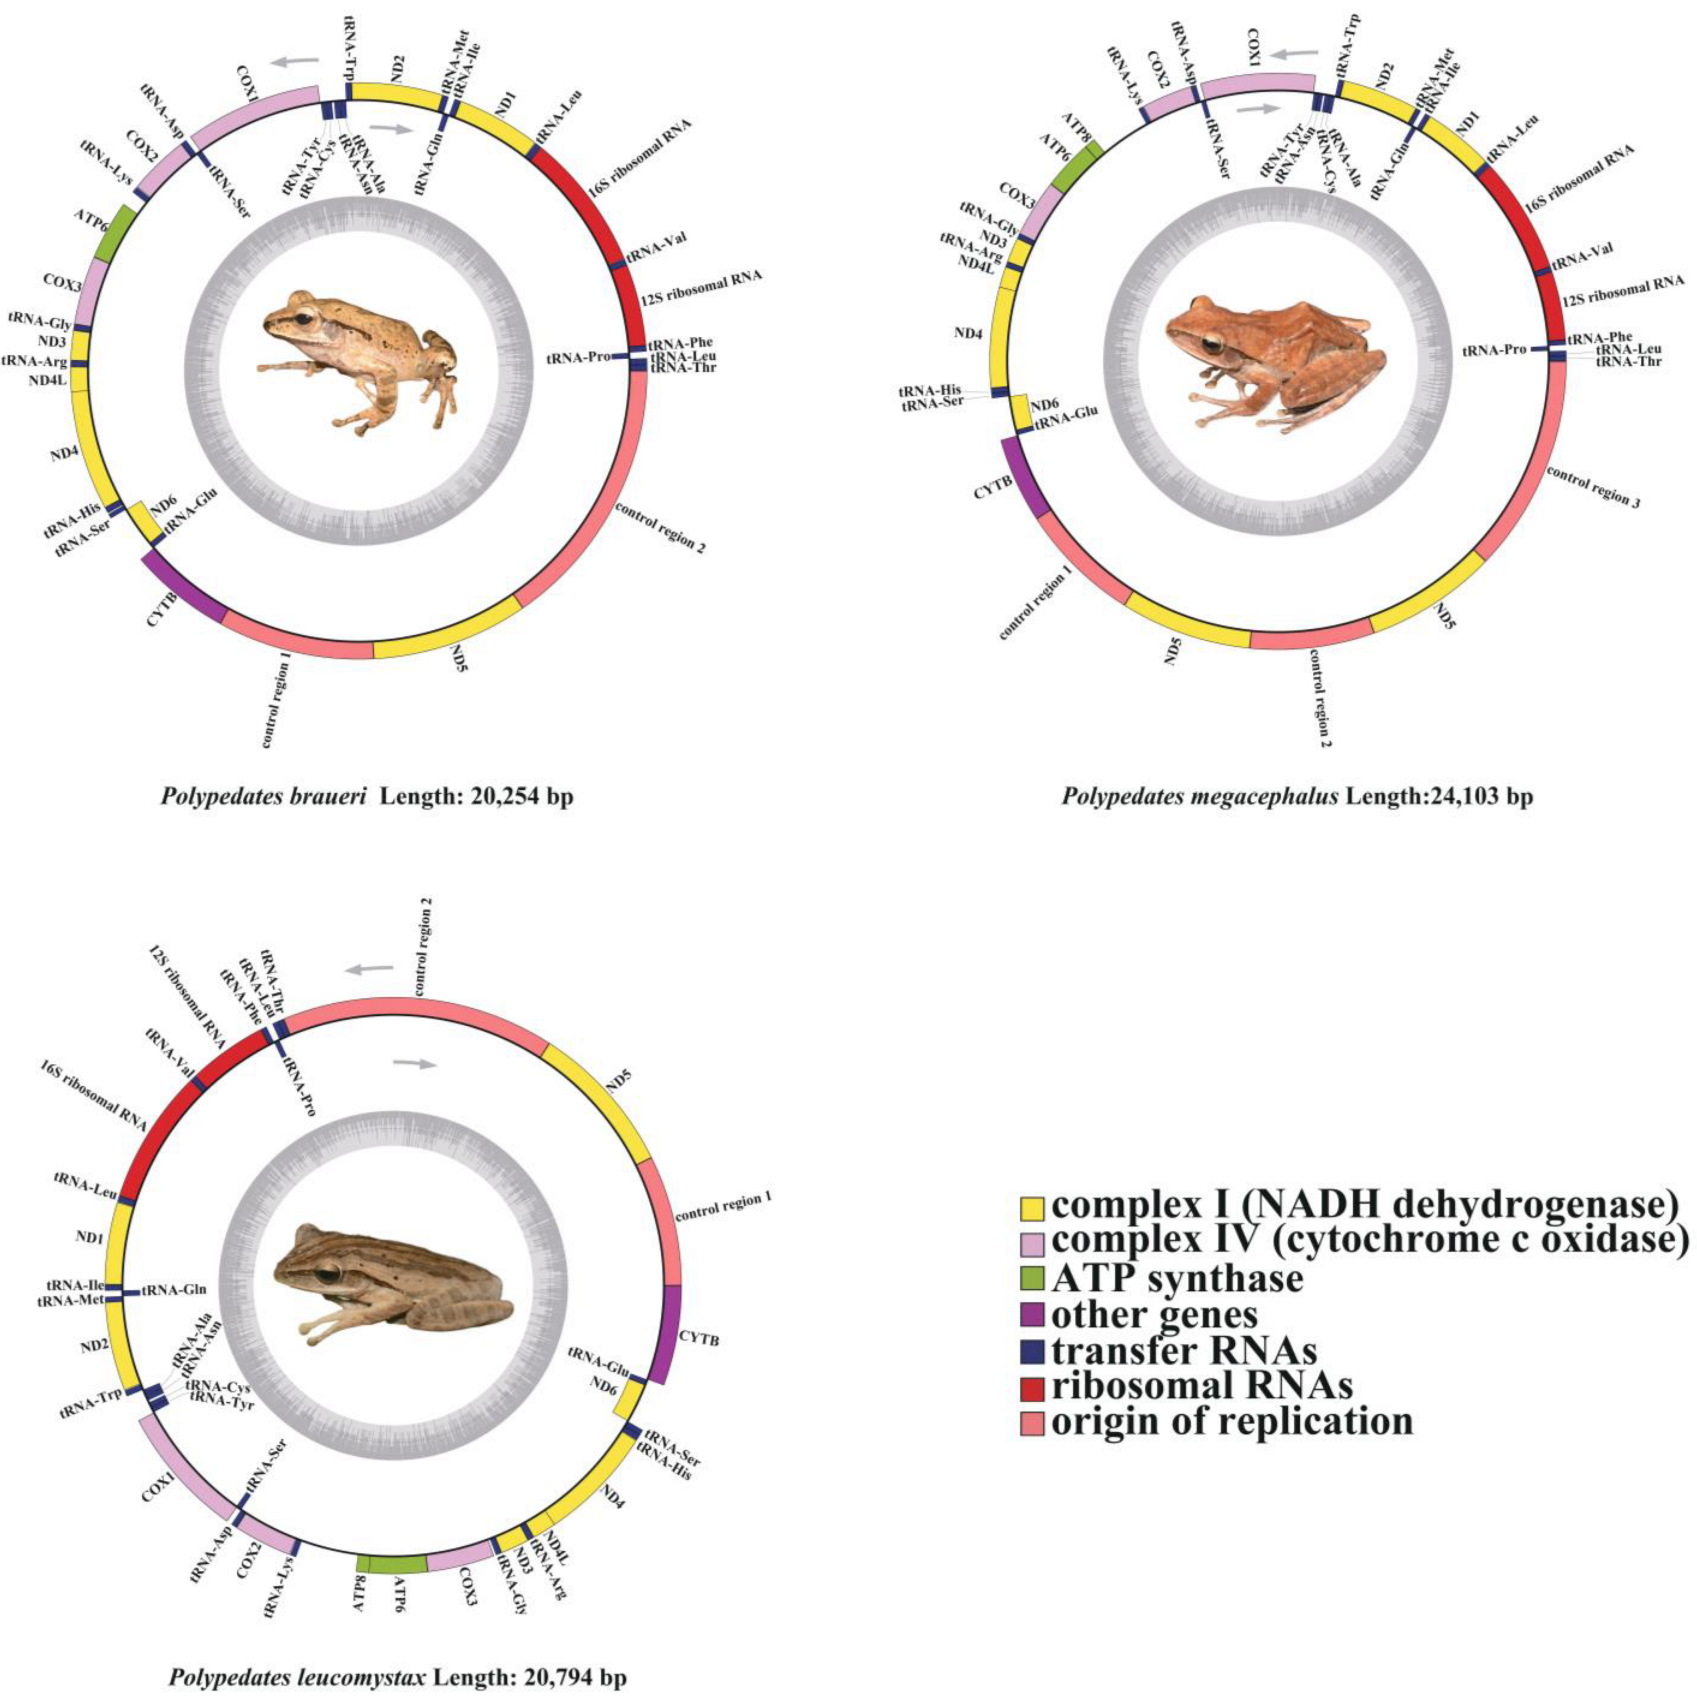
Figure 1. Mitogenomes of Polypedates braueri, Polypedates megacephalus, and Polypedates leucomystax. Their distribution map is shown in Figure S1. Genes encoded on the H chain are directed to the outer ring, while genes encoded on the L chain are shown inside the ring. Gene abbreviations are as follows: ATP6 and ATP8 (subunits 6 and 8 of ATPase), COX1-COX3 (cytochrome c oxidase subunits 1–3), CYTB (cytochrome b), and ND1-ND6 and ND4L (subunits 1–6 and 4L of NADH dehydrogenase). The gray inner circle indicates the amount of GC content. Protein-coding genes and those for rRNAs are represented using standard abbreviations. Arrows indicate the orientation of gene transcription.
Biology 14 01299 g001
Figure 2. Amino acid content of PCGs in Polypedates braueri, Polypedates megacephalus, and Polypedates leucomystax. Each amino acid is represented by an abbreviation. It should be noted that leucine and serine are encoded by two different genetic codons, respectively, and are presented separately.
Biology 14 01299 g002
Figure 3. The frequency of synonymous codon usage (RSCU) of the three species are Polypedates braueri, Polypedates megacephalus and Polypedates leucomystax from left to right. The codon family is located in the X-axis and the RSCU value is located in the Y-axis.
Biology 14 01299 g003
Figure 4. Predicted secondary structures of the atypical trnS1 and standard trnY from Polypedates braueri (structures are highly consistent across the three studied species). The acceptor (AA), dihydrouracil (DHU), anticodon (AC), and TΨC (TC) arms are indicated. Non-canonical base pairs are highlighted with red boxes.
Biology 14 01299 g004
Figure 5. The prognostic map of 12S rRNA secondary structures in Polypedates braueri. Domains I-IV represent the four structural domains, and the black numbers labeled in the diagram represent the number of neckloop structures.
Biology 14 01299 g005
Figure 6. The prognostic map of 16S rRNA secondary structures in Polypedates braueri. Domains I–VI represent the four structural domains, and the black numbers labeled in the plots represent the number of neckloop structures.
Biology 14 01299 g006
Figure 7. Phylogenetic trees for four families (Ranidae, Dicroglossidae, Rhacophoridae, Mantellidae) constructed using Bayesian a posteriori probability (BI) and polynomial a posteriori probability (ML) techniques based on the sequences of the 13 PCGs + 2 tRNAs; the number on each branch represents the Bayesian a posteriori probability/polynomial a posteriori probability of the Bootstrap values. The symbol “*” represents the sequence generated in this study.
Biology 14 01299 g007
Figure 8. Divergence time estimation for Rhacophoridae, inferred with BEAST v1.8.4 based on 13 PCGs. Numbers near nodes refer to divergence times. The 95% highest posterior distribution (HPD) is reported using blue bars. The symbol “*” represents the sequence generated in this study.
Biology 14 01299 g008
Figure 9. The Ka/Ks values among the Polypedates braueri, Polypedates leucomystax and Polypedates megacephalus. Note: PV083739, LC706451, and OP965717 represent Polypedates braueri, Polypedates leucomystax, and Polypedates megacephalus, respectively.
Biology 14 01299 g009
Table 1. Annotation of the mitochondrial genome of Polypedates braueri, Polypedates megacephalus, and Polypedates leucomystax.
GenePositionSizePositionSizePositionSizeStrand
FromToFromToFromTo
P.leucomystaxP. megacephalusP.braueri
tRNAThr170701717117272H
tRNALeu711417172143727314472H
tRNAPro147215691492176914821669L
tRNAPhe217286702192887021828770H
12SrRNA287121492828712169302861216931H
tRNAVal121512836912171285691217128569H
16SrRNA128428571574128628561571128828611574H
tRNALeu285829317428592932742863293674H
ND129353895961293638969629403900961H
tRNAIle389639667138973967713901397171H
tRNAGln396640367139674037713971404171L
tRNAMet403641046940374105694041410969H
ND2407851341057410651411036411051451036H
tRNATrp514152117151425212715146521570H
tRNAAla521352827052135282705216528570L
tRNAAsn528453567352845356735287535973L
OL535953842653595384265362538726H
tRNACys538454486553845448655387545064L
tRNATyr544955156754495515675452551867L
COX1552070731554552070731554552370761554H
tRNASer706171317170617131717064713471L
tRNAAsp713372016971337201697136720469H
COX2720278916907202789169072057894690H
tRNALys789779667078977966707900797071H
ATP88676882815386808832153H
ATP6881695036888829950767981388816679H
COX3950410,287784950810,29178488179600784H
tRNAGly10,31210,3796810,29210,359689601966969H
ND310,38010,71934010,36010,699340967010,009340H
tRNAArg10,72010,7897010,70010,7686910,01010,07869H
ND4L10,79011,07428510,76911,05328510,08010,364285H
ND411,06812,427136011,04712,409136310,35811,7201363H
tRNAHis12,43112,4996912,41012,4786911,72111,78969H
tRNASer12,50012,5676812,47912,5466811,80111,85656H
ND612,57013,06149212,54913,04049211,85912,350492L
tRNAGlu13,06213,1306913,04113,1096912,41812,35168L
CYTB13,13514,304117013,11414,269115612,42313,5721150H
CR114,30515,828152414,27015,920165113,57315,3251753H
ND515,82917,607177915,92117,699177915,32617,1071782H
CR217,60820,794318717,70019,384168517,10820,2543147H
ND519,38521,1631779H
CR321,16424,1032940H
Table 2. Start and stop codons of mitogenomes of Polypedates braueri, Polypedates megacephalus, and Polypedates leucomystax.
GeneCodonCodonCodon
StartStopStartStopStartStop
P. leucomystaxP. megacephalusP. braueri
ND1ATGT--ATGT--ATGT--
ND2ATGT--ATTT--ATTT--
COX1ATAAGGATAAGGATAAGG
COX2ATATAAATATAAATGTAA
ATP8ATGTAGATGTAG------
ATP6ATGT--ATAT--ATAT--
COX3ATGT--ATGT--ATGT--
ND3ATGT--ATGT--ATGT--
ND4LATGTAAATGTAAATGTAA
ND4GTGT--GTGT--ATGT--
ND6ATGAGGATGAGGATGAGG
CYTPATGT--ATGT--ATGT--
ND5ATGTAAATGTAAATGTAG
Disclaimer/Publisher’s Note: The statements, opinions and data contained in all publications are solely those of the individual author(s) and contributor(s) and not of MDPI and/or the editor(s). MDPI and/or the editor(s) disclaim responsibility for any injury to people or property resulting from any ideas, methods, instructions or products referred to in the content.