Article

Genome-Wide Analysis and Functional Characterization of Small Heat Shock Proteins in Allium sativum L. Under Multiple Abiotic Stresses

1
College of Horticulture and Plant Protection, Inner Mongolia Agricultural University, Hohhot 010018, China
2
School of Business, Jiangsu Ocean University, Cangwu Road, Haizhou District, Lianyungang 222005, China
*
Author to whom correspondence should be addressed.
These authors contributed equally to this work and should be regarded as co-first authors.
Biology 2025, 14(10), 1326; https://doi.org/10.3390/biology14101326
Submission received: 16 July 2025 / Revised: 8 August 2025 / Accepted: 24 September 2025 / Published: 25 September 2025

Simple Summary

Climate change and extreme weather expose garlic plants to abiotic stresses such as heat and salinity, leading to reduced yields and compromised crop quality. To elucidate the molecular mechanisms underlying garlic’s response to environmental stress, we conducted a comprehensive genome-wide analysis to identify heat shock proteins (HSPs), a class of molecular chaperones responsible for maintaining protein homeostasis by preventing misfolding and aggregation induced by stress conditions. A total of 114 HSP genes were identified and analyzed in terms of their subcellular localization, cis-regulatory elements responsive to stress signals, and expression patterns across various tissues and stress conditions. Functional validation in Saccharomyces cerevisiae demonstrated that overexpression of one selected HSP gene significantly enhances thermotolerance. These findings provide valuable insights into the molecular basis of stress adaptation in garlic and highlight candidate genes for breeding or genetic engineering aimed at improving heat and salt tolerance. Strengthening garlic’s resilience to environmental stress will contribute to stable agricultural production and food security.

Abstract

Small heat shock proteins play a pivotal role in maintaining protein homeostasis under abiotic stress conditions and are indispensable for plant viability. In the present study, a comprehensive characterization of this gene family in Allium sativum was conducted through genome-wide sequence identification, phylogenetic reconstruction, conserved motif analysis, promoter cis-element profiling, transcriptomic investigation, quantitative real-time PCR, subcellular localization, and yeast-based functional assays. A total of 114 small heat shock protein genes were identified across eight chromosomes and subsequently classified into ten phylogenetic subgroups. All encoded proteins conserved the α-crystallin domain, whereas their exon–intron architectures and promoter elements responsive to environmental stress or phytohormones exhibited considerable diversity. The predicted proteins range from 130 to 364 amino acids, with isoelectric points (pI) spanning 3.97 to 9.95 and GRAVY values from −1.131 to −0.014, indicating predominantly hydrophilic characteristics. Subcellular localization analysis revealed a broad distribution across the cytoplasm, chloroplasts, mitochondria, and other compartments, with the majority (74 proteins) localized in the cytoplasm. Synteny analysis uncovered two segmentally duplicated gene pairs (AsHSP20-80/31, and AsHSP20-81/32), both showing strong purifying selection (Ka/Ks = 0.0459 and 0.2545, respectively), suggesting functional conservation. Expression profiling demonstrated predominant transcript accumulation in bulbs and floral organs, with significant induction under heat, salinity, and jasmonic acid treatments. qRT–PCR validation further confirmed that several candidate genes, notably AsHSP20-94 and AsHSP20-79, were strongly and consistently upregulated across multiple stress conditions, underscoring their roles as core stress-responsive regulators. Subcellular localization experiments demonstrated that representative proteins are targeted to the cytoplasm, nucleus and chloroplasts. Furthermore, heterologous expression of AsHSP20-79 in yeast conferred marked thermotolerance. Collectively, these findings reveal extensive expansion and functional divergence of the small heat shock protein gene family in garlic and provide valuable candidate genes for improving stress resilience in this important crop species.

1. Introduction

Plants are constantly exposed to various abiotic stresses, such as extreme temperatures, drought and high salinity. These environmental challenges disrupt cellular homeostasis by compromising membrane stability, altering osmotic regulation and ion balance, and leading to protein misfolding and the accumulation of reactive oxygen species (ROS) [1]. Among these, heat and salt stress are particularly harmful, as they interfere with photosynthesis, osmotic regulation and cellular metabolism, ultimately limiting growth and reducing crop yield and quality [2]. To cope with these environmental challenges, plants rely on a complex network of protective mechanisms, among which heat shock proteins (HSPs) play a pivotal role. HSPs are rapidly and robustly induced in response to abiotic stress and function as molecular chaperones that stabilize cellular proteins, facilitate proper folding, prevent aggregation and assist in the refolding or degradation of damaged proteins [3,4]. These actions are essential for maintaining proteostasis under stress conditions and ensuring cell survival. Unlike other regulatory proteins, HSPs act directly at the protein level to mitigate stress-induced damage [5,6], making them core components of the plant stress defense system. Their involvement in multiple stress-response pathways—including those triggered by heat and salinity—highlights their versatility and critical role in enhancing plant resilience.
HSPs and their regulatory networks serve as central molecular components of the plant defense system against temperature stress [7]. Eukaryotic HSPs are classified into five major families based on molecular weight: HSP110, HSP90, HSP70, HSP60 and small HSPs (sHSPs) [8]. Among these, sHSPs (also referred to as HSP20s), with molecular masses ranging from 12 to 42 kDa, contain a highly conserved α-crystallin domain (ACD) and function as the first line of defense by facilitating protein folding and preventing aggregation [9,10]. Based on sequence similarity and subcellular localization, plant sHSPs are categorized into 12 subfamilies: cytosol/nucleus CI–CVII, mitochondria MI–MII, plastid P, endoplasmic reticulum ER and peroxisome Po. Each subfamily performs specialized functions within its respective compartment, collectively contributing to acquired thermotolerance, ROS scavenging and signal regulation.
Previous studies have demonstrated that most HSP20s are strongly induced by various abiotic and biotic stresses—including heat, drought, salinity, cold, heavy metals, hypoxia and pathogen attack—thereby enhancing plant tolerance to these adverse conditions [11]. For example, overexpression of MdHsp18.2b enhances salt stress resistance [12], Bacillus pumilus infection resistance and anthocyanin accumulation in apple calli. In Brachypodium distachyon, overexpression of BdHSP genes improves thermotolerance [13], while PpHSP20-32 overexpression in peach increases both plant height and heat resistance [14].
Garlic (Allium sativum L.) is a globally significant vegetable crop known for its abundance of bioactive constituents, including allicin, polyphenolic compounds and fructans, which collectively contribute to its pronounced antioxidant, antimicrobial and health-enhancing properties. The garlic genome is notably large, with an estimated size of approximately 16 gigabases and comprises about 91.3% repetitive sequences. Phylogenomic evidence indicates that the garlic genome has undergone three distinct whole genome duplication events. The first two duplications occurred prior to the divergence from Asparagus officinalis, estimated at approximately 80.8 million years ago, while the third duplication event was inferred to have occurred around 17.9 million years ago [15], and a recent transposable element burst approximately 0.2–0.3 Mya [16]. These genomic events not only contributed to the massive expansion of the garlic genome but also provided the genetic basis for the duplication, diversification and neofunctionalization of many gene families, including HSP20s.
In recent years, the HSP20 gene family has been extensively characterized in various plant species such as Arabidopsis thaliana [17], Zea mays [18], Prunus persica L. [14] and Cucumis sativus [19]. These studies provide strong evidence supporting the role of HSP20s in enhancing plant tolerance to heat, salinity, drought and oxidative stress. Functional analyses have further demonstrated that overexpression of specific sHSP genes can enhance plant resilience by reducing ROS accumulation and protecting protein structures under stress conditions. Despite these advances, systematic investigations of the HSP20 family in garlic are lacking. Prior research in garlic has primarily focused on heat shock transcription factors (HSFs) or limited members of the HSP70/90 families [20], with little emphasis on genome-wide identification and functional validation of the HSP20 family. To address the current lack of systematic investigation, a total of 114 AsHSP20 genes were identified and comprehensively characterized using the complete garlic genome sequence. A series of integrated analyses was conducted, encompassing subfamily classification, phylogenetic reconstruction, conserved motif identification, gene structure analysis, promoter cis-element profiling, tissue-specific and stress-inducible expression patterns based on transcriptome data and quantitative real-time PCR, subcellular localization and functional validation in yeast under heat stress conditions. Additional analyses included Gene Ontology enrichment and prediction of protein interaction networks. Collectively, these results bridge a critical knowledge gap in the systematic exploration of the HSP20 gene family in garlic and offer valuable genetic resources and theoretical insights for elucidating the evolutionary mechanisms underlying small heat shock protein-mediated stress adaptation in Allium species, thereby facilitating the molecular breeding of stress-tolerant garlic cultivars.

2. Materials and Methods

2.1. Genome-Wide Identification of HSP20 Genes

Genomic and protein sequences of garlic were retrieved from the AlliumDB database (https://allium.qau.edu.cn/, accessed on 18 March 2025) [21], and Arabidopsis thaliana sequences were obtained from the NCBI database (https://www.ncbi.nlm.nih.gov/, accessed on 18 March 2025). A. thaliana HSP20 protein sequences (AtHSP) were sourced from The Arabidopsis Information Resource (TAIR, version 10, http://www.arabidopsis.org, accessed on 18 March 2025) [22]. A local protein database was established, and BLASTP searches (E-value < 1 × 10⁻⁵) were conducted using NCBI BLAST+ (v2.11.0) to identify candidate HSP20 family members by sequence alignment. The HMM (Hidden Markov Model) profile of the HSP20 domain (PF00011) was downloaded from the Pfam database (http://pfam-legacy.xfam.org/, accessed on 18 March 2025) and applied with HMMER v3.3.2 (http://hmmer.org/, accessed on 18 March 2025) to further screen potential HSP20 proteins [23]. Candidate sequences were validated using SMART 2.8 (http://smart.embl-heidelberg.de/, accessed on 18 March 2025) [24] and the NCBI Conserved Domain Database (CDD, https://www.ncbi.nlm.nih.gov/cdd, accessed on 18 March 2025) [25] to confirm domain integrity. Physicochemical properties—sequence length, molecular weight, theoretical isoelectric point, instability index, aliphatic index and grand average of hydropathicity (GRAVY)—were computed with ProtParam (ExPASy, https://web.expasy.org/protparam/, accessed on 18 March 2025) [26]. Transmembrane regions were predicted using TMHMM 2.0 (DTU Health Tech, https://services.healthtech.dtu.dk/services/TMHMM-2.0/), subcellular localization with Cell-PLoc 2.0 (SJTU, http://www.csbio.sjtu.edu.cn/bioinf/Cell-PLoc-2/, accessed on 18 March 2025) and secondary structure with SOPMA (I-TASSER, https://npsa-prabi.ibcp.fr/cgi-bin/npsa_automat.pl?page=npsa_sopma.html, accessed on 18 March 2025).

2.2. Phylogenetic and Gene Structure Analyses

Full-length HSP20 protein sequences from garlic and A. thaliana were retrieved from UniProt (https://www.uniprot.org/, accessed on 20 March 2025). Multiple sequence alignment was performed with ClustalX 1.81 (http://www.clustal.org/clustal2/, accessed on 20 March 2025) and manually adjusted in Jalview (v2.11.2.5). A neighbor-joining phylogenetic tree was constructed in MEGA 11.0 (https://www.megasoftware.net/) using the Poisson model with 1000 bootstrap replicates. Exon–intron structures were inferred by aligning genomic and cDNA sequences and visualized using the Gene Structure Display Server (GSDS 2.0; http://gsds.gao-lab.org/, accessed on 20 March 2025). Conserved motifs were identified with MEME Suite (v5.4.1; http://meme.nbcr.net/meme/intro.html, accessed on 20 March 2025) [27], setting the maximum number of motifs to 10 and motif width between 6 and 50 residues.

2.3. Chromosomal Localization, Duplication and Synteny

Chromosomal coordinates of AsHSP20 genes were extracted from the garlic genome GFF3 file and visualized using TBtools v1.09876 (https://github.com/CJ-Chen/TBtools-II, accessed on 20 March 2025) [28]. Tandem and segmental duplications were identified by MCScanX (http://chibba.pgml.uga.edu/mcscan2/, accessed on 20 March 2025) and plotted with TBtools’ “Dual Synteny Plotter” module. Interspecific synteny among garlic, onion and Welsh onion was also mapped and displayed in TBtools [28].

2.4. Cis-Regulatory Element Analysis, Protein–Protein Interaction Network and Gene Ontology Enrichment

Promoter regions (2000 bp upstream of the ATG) for each AsHSP20 gene were extracted with TBtools and analyzed for cis-acting elements using PlantCARE (http://bioinformatics.psb.ugent.be/webtools/plantcare/html/, accessed on 28 March 2025) [29]. Identified elements were categorized by function—hormone response, light response, stress response and visualized as heatmaps in HemI v1.0.3.7. GO annotation analysis was conducted by extracting the DNA sequences 2000 bp upstream of the psmyb coding sequences using the GXFSequences Extract tool in TBtools. Eggnog (http://eggnog5.embl.de/, accessed on 28 March 2025) [30] was used for the GO annotation analysis, and the results were visualized using WeGo (https://wego.genomics.cn/, accessed on 28 March 2025) [31]. The protein–protein interaction (PPI) network of the AsHSP20 family was constructed using Cytoscape software (version 3.9.1). First, the protein sequences of HSP genes were submitted to the STRING database (https://string-db.org/, accessed on 28 March 2025) for interaction prediction. The minimum required interaction score was set to a high-confidence threshold (≥0.700) to ensure the reliability of the predicted interactions. The resulting interaction data were then imported into Cytoscape for network visualization and analysis.

2.5. Plant Material and Stress Treatments

The garlic variety selected is “Zipi”, and this variety is stored in the onion and garlic germplasm resource nursery of Inner Mongolia Agricultural University. Uniform, disease-free garlic cloves were surface-sterilized in 70% ethanol for 5 min, rinsed with sterile water. The plants were grown using half-strength Hoagland nutrient solution as the growth medium and germinated at 23–25 °C under a 16 h light/8 h dark cycle until seedlings reached 12–15 cm (≈3 weeks). For stress assays, seedlings were treated with 39 °C (high-temperature stress) [32], 200 mM NaCl (salt stress) [33] or 100 µM MeJA (methyl jasmonate) [34] for 6, 12 and 24 h. Control plants remained at 23 °C. Leaf samples were harvested at each time point, immediately frozen in liquid nitrogen and stored at −80 °C. For each treatment, three biological replicates were collected.

2.6. Quantitative Real-Time PCR

Total RNA was extracted using the RNAprep Pure Plant Kit (Tiangen Biotech, Beijing, China) and reverse-transcribed with PrimeScript™ RT Master Mix (TaKaRa Biotechnology, Dalian, China). Gene-specific primers (Supplementary Table S1) were designed with Primer 5 (Premier Biosoft, Palo Alto, CA, USA) and synthesized by Sangon Biotech (Shanghai, China). qRT–PCR was performed on an FTC-3000P Real-Time PCR System (Funglyn Biotech, Toronto, ON, Canada) using SYBR® Premix Ex Taq™ II (Tli RNaseH Plus, RR820A; TaKaRa Biotechnology). GAPDH and UBQ were initially tested as candidate reference genes based on previous garlic studies, but due to their variable expression under heat (39 °C), salt (200 mM NaCl) and MeJA (100 µM) stresses, actin was ultimately selected for normalization due to its stable expression. β-Actin served as an internal control [30], and the control (CK) plants were used as an external control [35]. Relative expression levels were calculated by the 2−ΔΔCT method [36]. Regarding tissue-specific expression analysis, the data were obtained from public transcriptome datasets available in the NCBI SRA database (PRJNA243415).

2.7. High-Temperature Stress Assay in Transgenic Yeast

The pYES2 expression vector harboring AsHSP20-79 was constructed and introduced into Saccharomyces cerevisiae strain BY4741 using the lithium acetate/polyethylene glycol (LiAc/PEG) method. Transformed yeast colonies were selected on synthetic complete medium lacking uracil (SC–Ura) supplemented with 2% galactose to ensure selection of Ura transformants and induction of the GAL1 promoter. Yeast cells transformed with the empty pYES2 vector were included as negative controls [20]. These control strains were cultured and induced under the same conditions (SC–Ura medium supplemented with 2% galactose) and subjected to identical functional assays. Galactose-induced expression was initiated at 30 °C and 39 °C, and growth was monitored by measuring optical density at 600 nm (OD600) after 12 h. Cell suspensions were adjusted to an OD600 of 0.8, serially diluted (100 to 10−5), and spotted onto SG-Ura plates (synthetic galactose medium lacking uracil). Plates were incubated at 30 °C, 35 °C, 37 °C, 39 °C, and 41 °C for 3 days to evaluate thermotolerance.

2.8. Subcellular Localization of AsHSP20 Proteins

The coding sequences of AsHSP20 genes (excluding stop codons) were cloned into the plant expression vector pCAMBIA1302, which contains a CaMV 35S promoter to drive constitutive expression in plants. The resulting GFP fusion constructs and empty vector (control) were introduced into Agrobacterium tumefaciens strain GV3101 using the heat-shock method [37]. Transformed Agrobacterium cultures were grown, harvested, and resuspended in infiltration buffer (10 mM MES, 10 mM MgCl2, 200 μM acetosyringone, pH 5.6) to an OD600 of 0.8. Agroinfiltration was performed by infiltrating the bacterial suspension into the abaxial sides of fully expanded leaves from 4–6-week-old Nicotiana benthamiana plants using a needleless syringe. For co-localization analysis, Agrobacterium cultures harboring GFP constructs were mixed at a 1:1 ratio with those containing organelle-specific markers (Chlo-mCherry, NLS-mCherry or NES-mCherry). After 48–72 h of incubation under standard growth conditions, fluorescence signals of GFP and mCherry were observed using a Nikon C2 Plus confocal laser-scanning microscope (Nikon, Tokyo, Japan). Bright-field and merged images were also captured. All experiments were performed in at least three independent biological replicates.

3. Results

3.1. Identification of Family Members

To identify the HSP20 gene family in garlic, the HSP20 protein sequences from Arabidopsis thaliana were used to construct a hidden Markov model (HMM). A total of 114 HSP20 genes were identified in the garlic genome and designated as AsHSP20-1 to AsHSP20-114 according to their chromosomal positions (Table 1). The predicted AsHSP20 proteins range from 130 (AsHSP20-27) to 364 (AsHSP20-69) amino acid residues, with calculated isoelectric points (pI) of 3.97 (AsHSP20-95)–9.95 (AsHSP20-67) and molecular weights of 15.09 (AsHSP20-25)–41.15 (AsHSP20-69) kDa. The instability indices vary between 31.01 (AsHSP20-69) and 57.43 (AsHSP20-35), while the aliphatic indices range from 54.94 (AsHSP20-95) to 102.39 (AsHSP20-78). The grand average of hydropathicity (GRAVY) values are between –1.131(AsHSP20-29) and –0.014 (AsHSP20-18), indicating hydrophilic properties. Subcellular localization predictions suggest that AsHSP20 proteins are distributed among the cytoplasm, chloroplast, nucleus, mitochondria, peroxisome, and extracellular compartments, with the majority—74 members—predicted to localize in the cytoplasm.

3.2. Phylogenetic Analysis

A phylogenetic tree was constructed based on the amino acid sequences of 19 A. thaliana and 114 garlic HSP20 proteins (Figure 1). According to phylogenetic clustering and predicted subcellular localization, the 114 AsHSP20 proteins were assigned to 10 subfamilies: cytosolic CI–CVII (containing 50, 14, 1, 0, 1,7, and 1 members, respectively), mitochondrial MI–MII (28 and 1), endoplasmic reticulum (ER; 3), and plastid (P; 6). Two proteins (AsHSP20-62 and AsHSP20-63) did not cluster into any established subfamily and were designated as unclassified. Among the defined subfamilies, ten—CI, CII, CIII, CV, CVI, CVII, MI, MII, ER, Po (peroxisome), and P—harbor garlic HSP20 members. Notably, 74 (64.91%) of the AsHSP20 proteins belong to the cytosolic subfamilies CI–CVII, indicating that the cytosol is likely the primary functional compartment for the HSP20 family in garlic.

3.3. Conserved Motif and Gene Structure Analysis

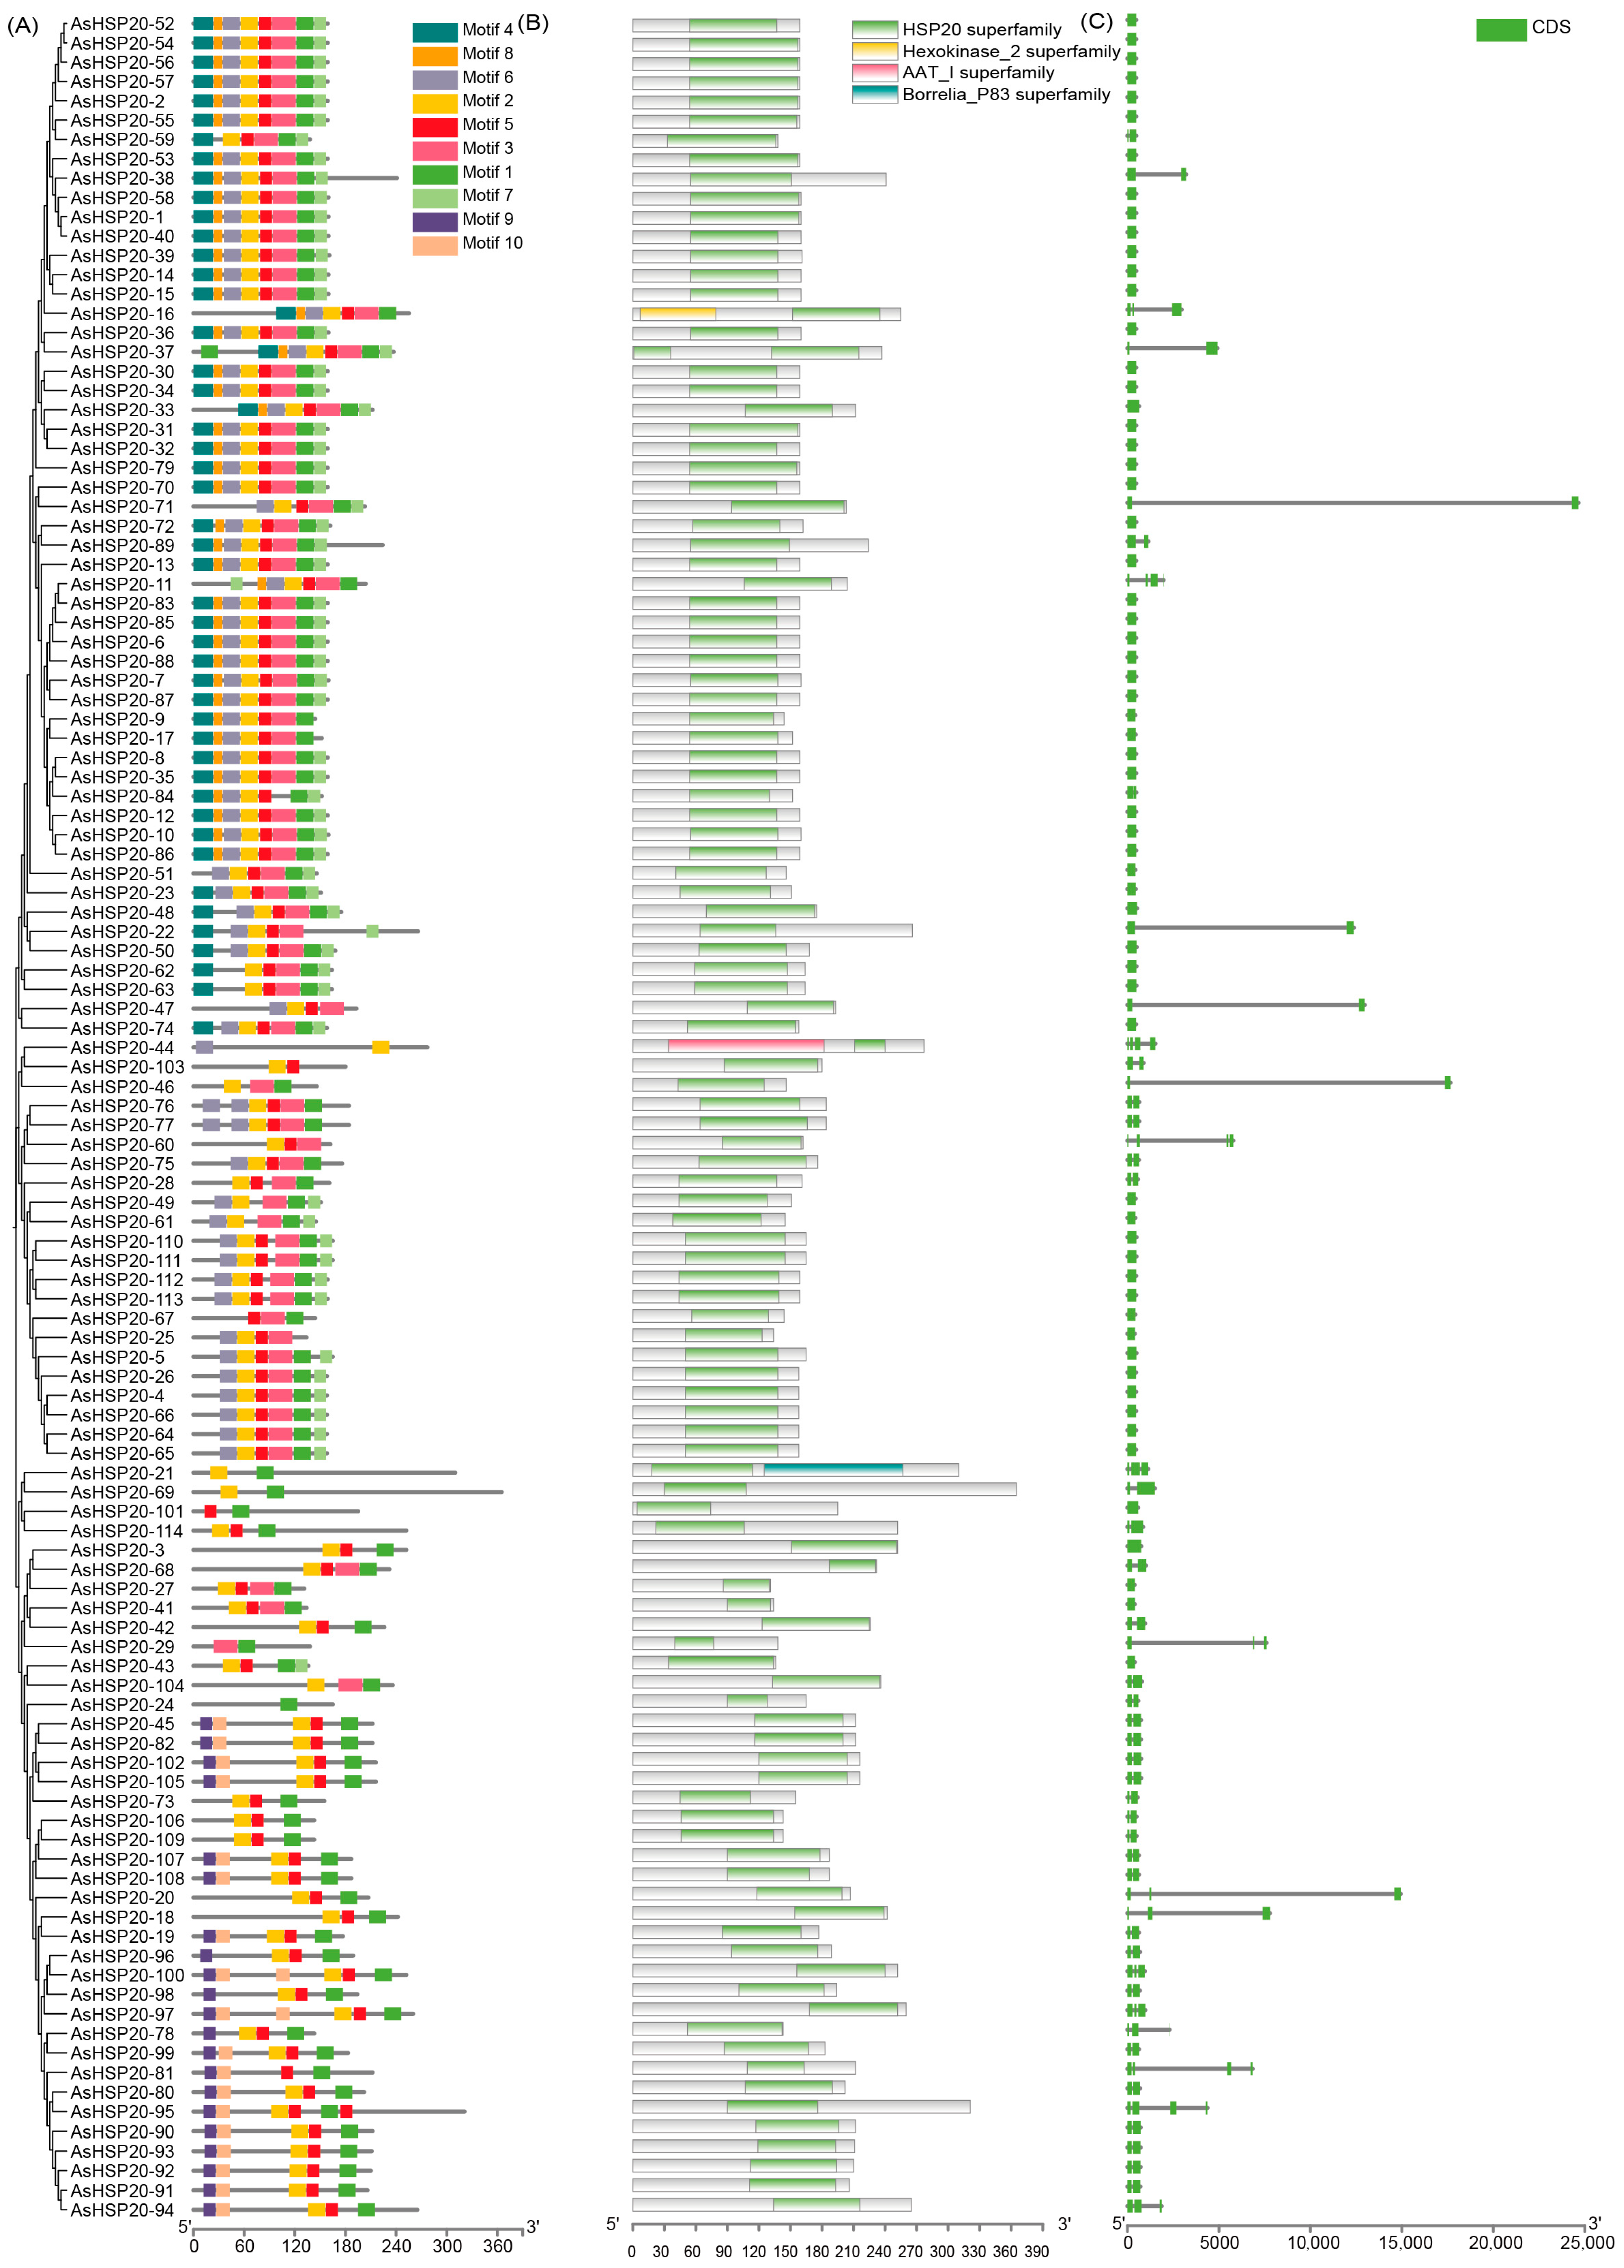
Ten conserved motifs (Motif 1–10) were identified in the AsHSP20 family using MEME (Figure 2A), with motif lengths ranging from 11 to 29 amino acids. Among these, Motif 3 is the longest (29 aa), Motif 8 is the shortest (11 aa), and Motifs 1, 2, and 6 are each 21 aa in length (Supplementary Table S2). Each AsHSP20 protein contains between 1 and 7 conserved motifs, with most members harboring 2–7 motifs; only AsHSP20-24 contains a single motif.
Most AsHSP20 proteins retain the characteristic α-crystallin domain (100–150 aa), which is essential for chaperone activity. Additionally, several members harbor extra superfamily domains, such as Hexokinase_2 (e.g., AsHSP20-47 and AsHSP20-62), AAT_I (AsHSP20-38), and Borrelia_P83 (AsHSP20-74), suggesting that these proteins may have acquired novel or extended functions through domain fusion events (Figure 2B). Gene structure analysis (Figure 2C) showed that among the 114 AsHSP20 genes, 62 (54.4%) contain a single exon, 38 (33.3%) have two exons, 10 (8.8%) have three exons, and 4 (3.5%) possess four exons, indicating an overall simple gene architecture.

3.4. Chromosomal Localization

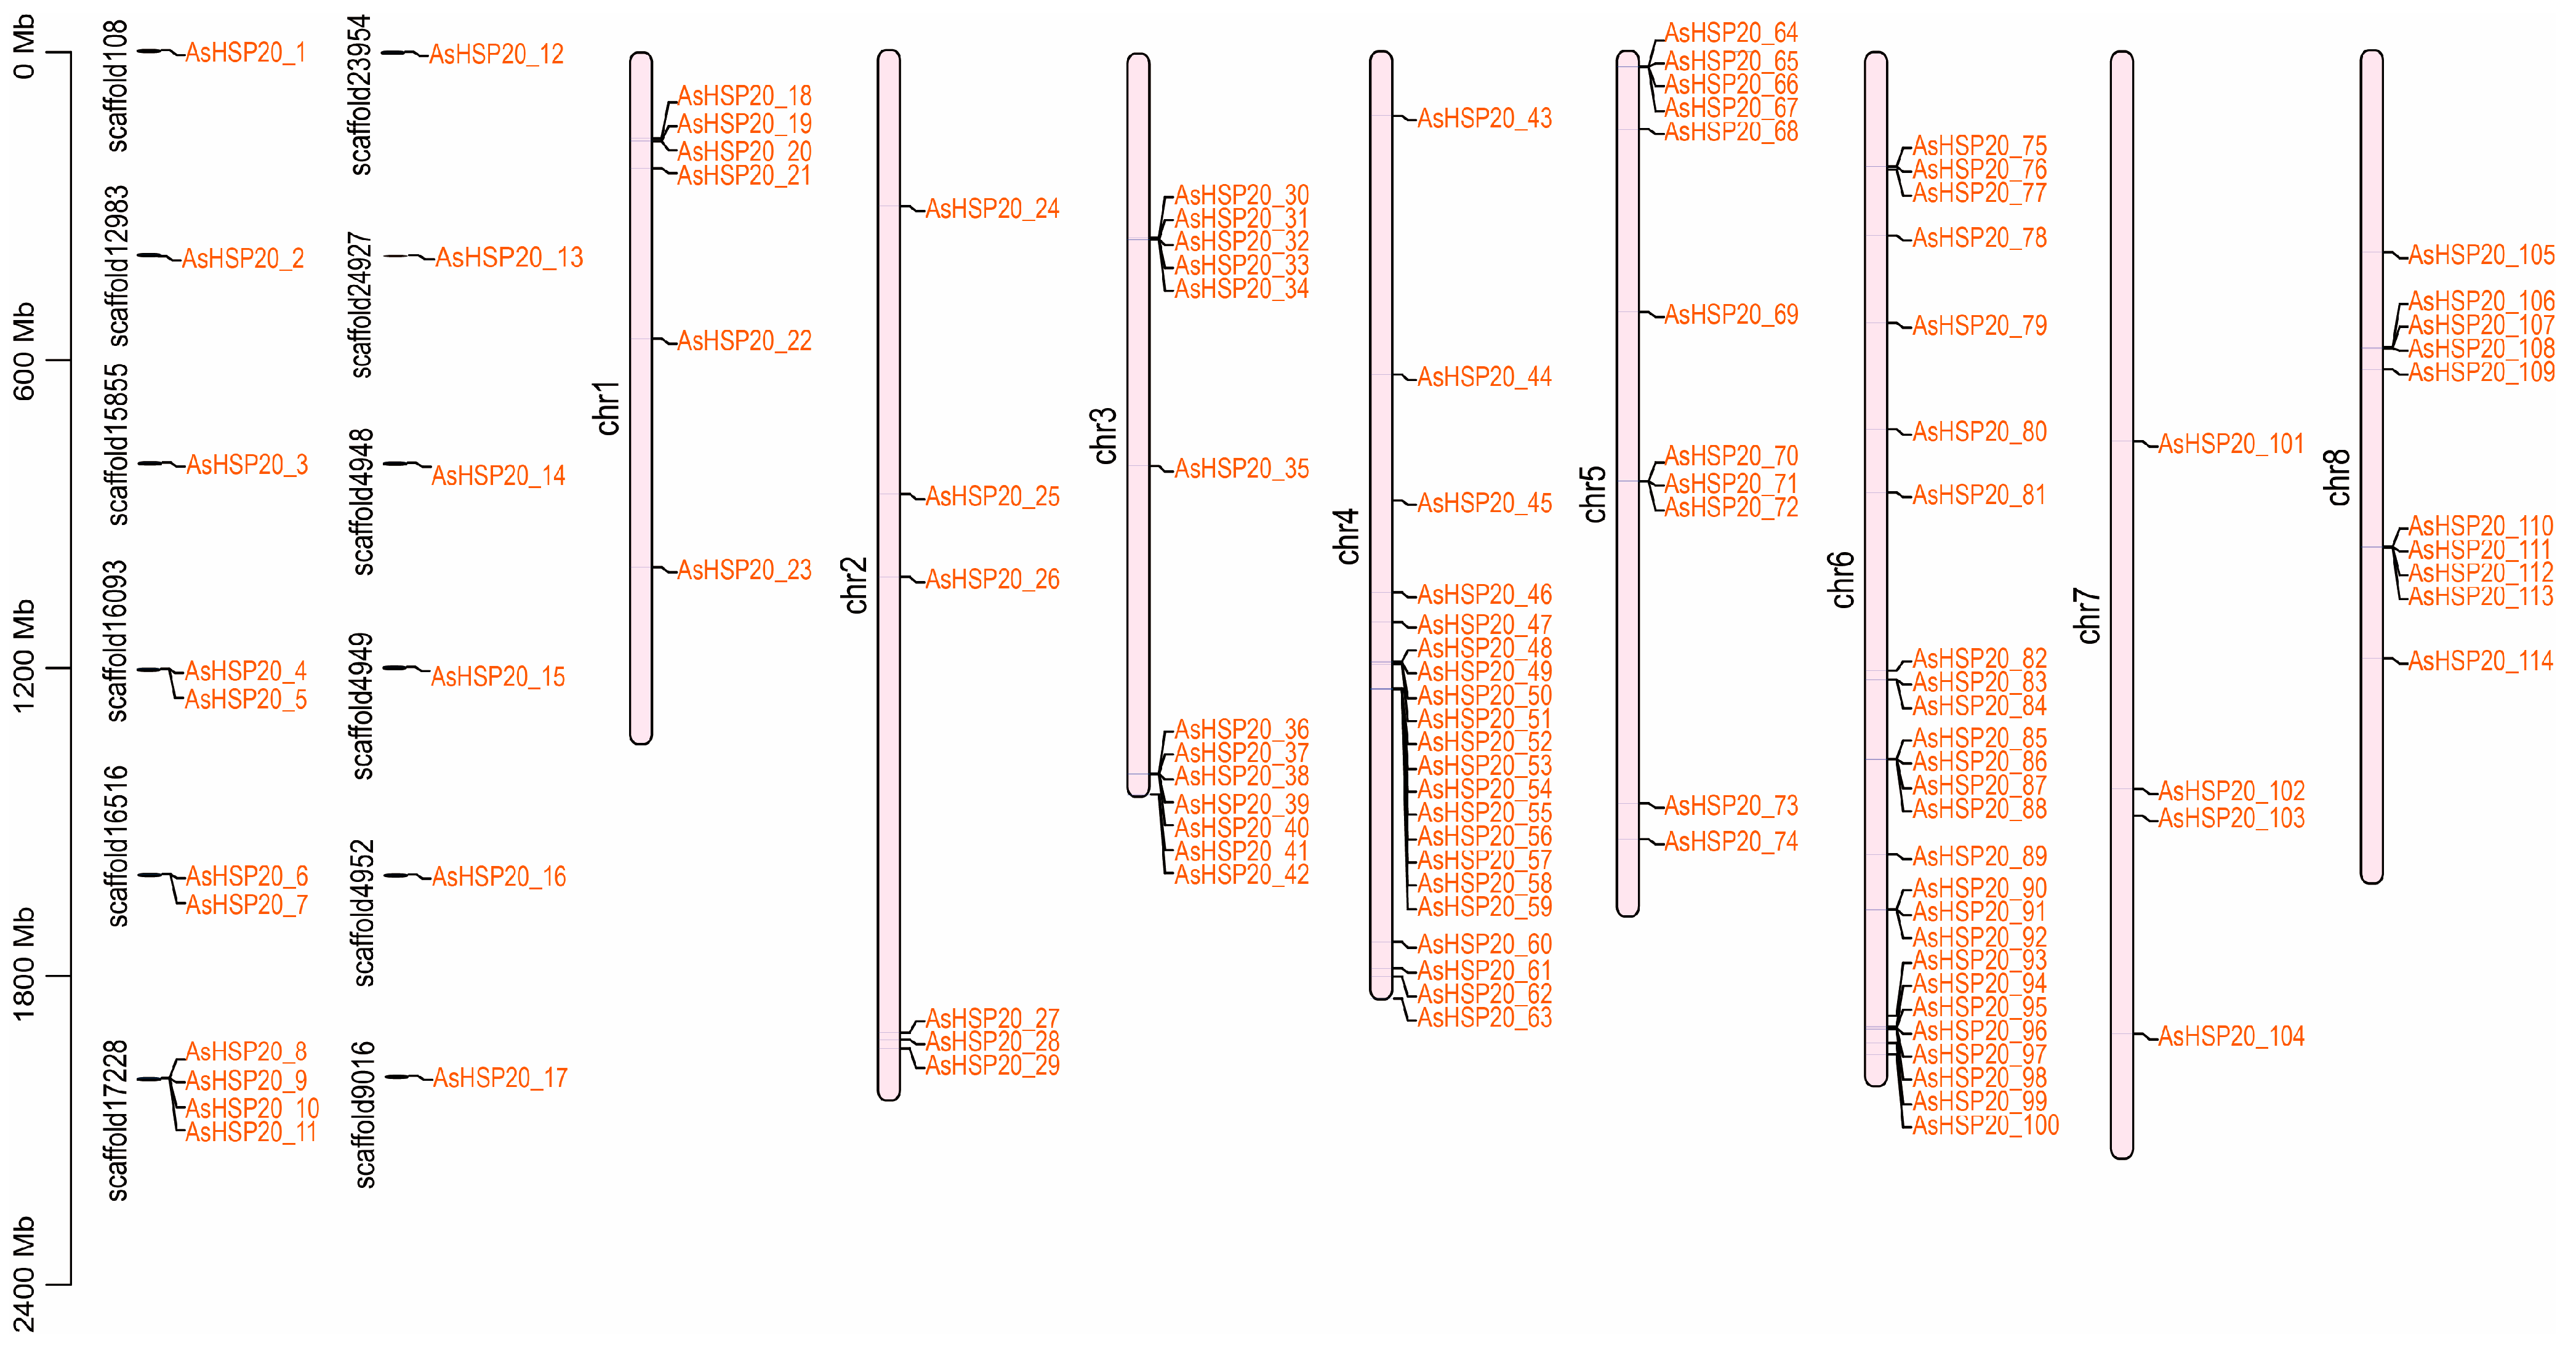
Chromosomal localization analysis revealed that 97 AsHSP20 genes are distributed across the eight garlic chromosomes, while the remaining 17 genes are located on 12 unanchored scaffolds. The number of AsHSP20 genes per chromosome ranges from 4 to 26 (Figure 3). Chromosome 6 harbors the largest cluster, with 26 genes (26.8% of the mapped members), whereas chromosome 7 contains the fewest, with only four genes (AsHSP20-101, -102, -103 and -104; 4.12%). Most AsHSP20 genes are situated in the distal regions of the chromosomes. The pronounced clustering of AsHSP20 genes on chromosomes 4 and 6 likely reflects tandem and segmental duplication events that have driven the expansion and functional diversification of this gene family.

3.5. Inter Species Collinearity Analysis

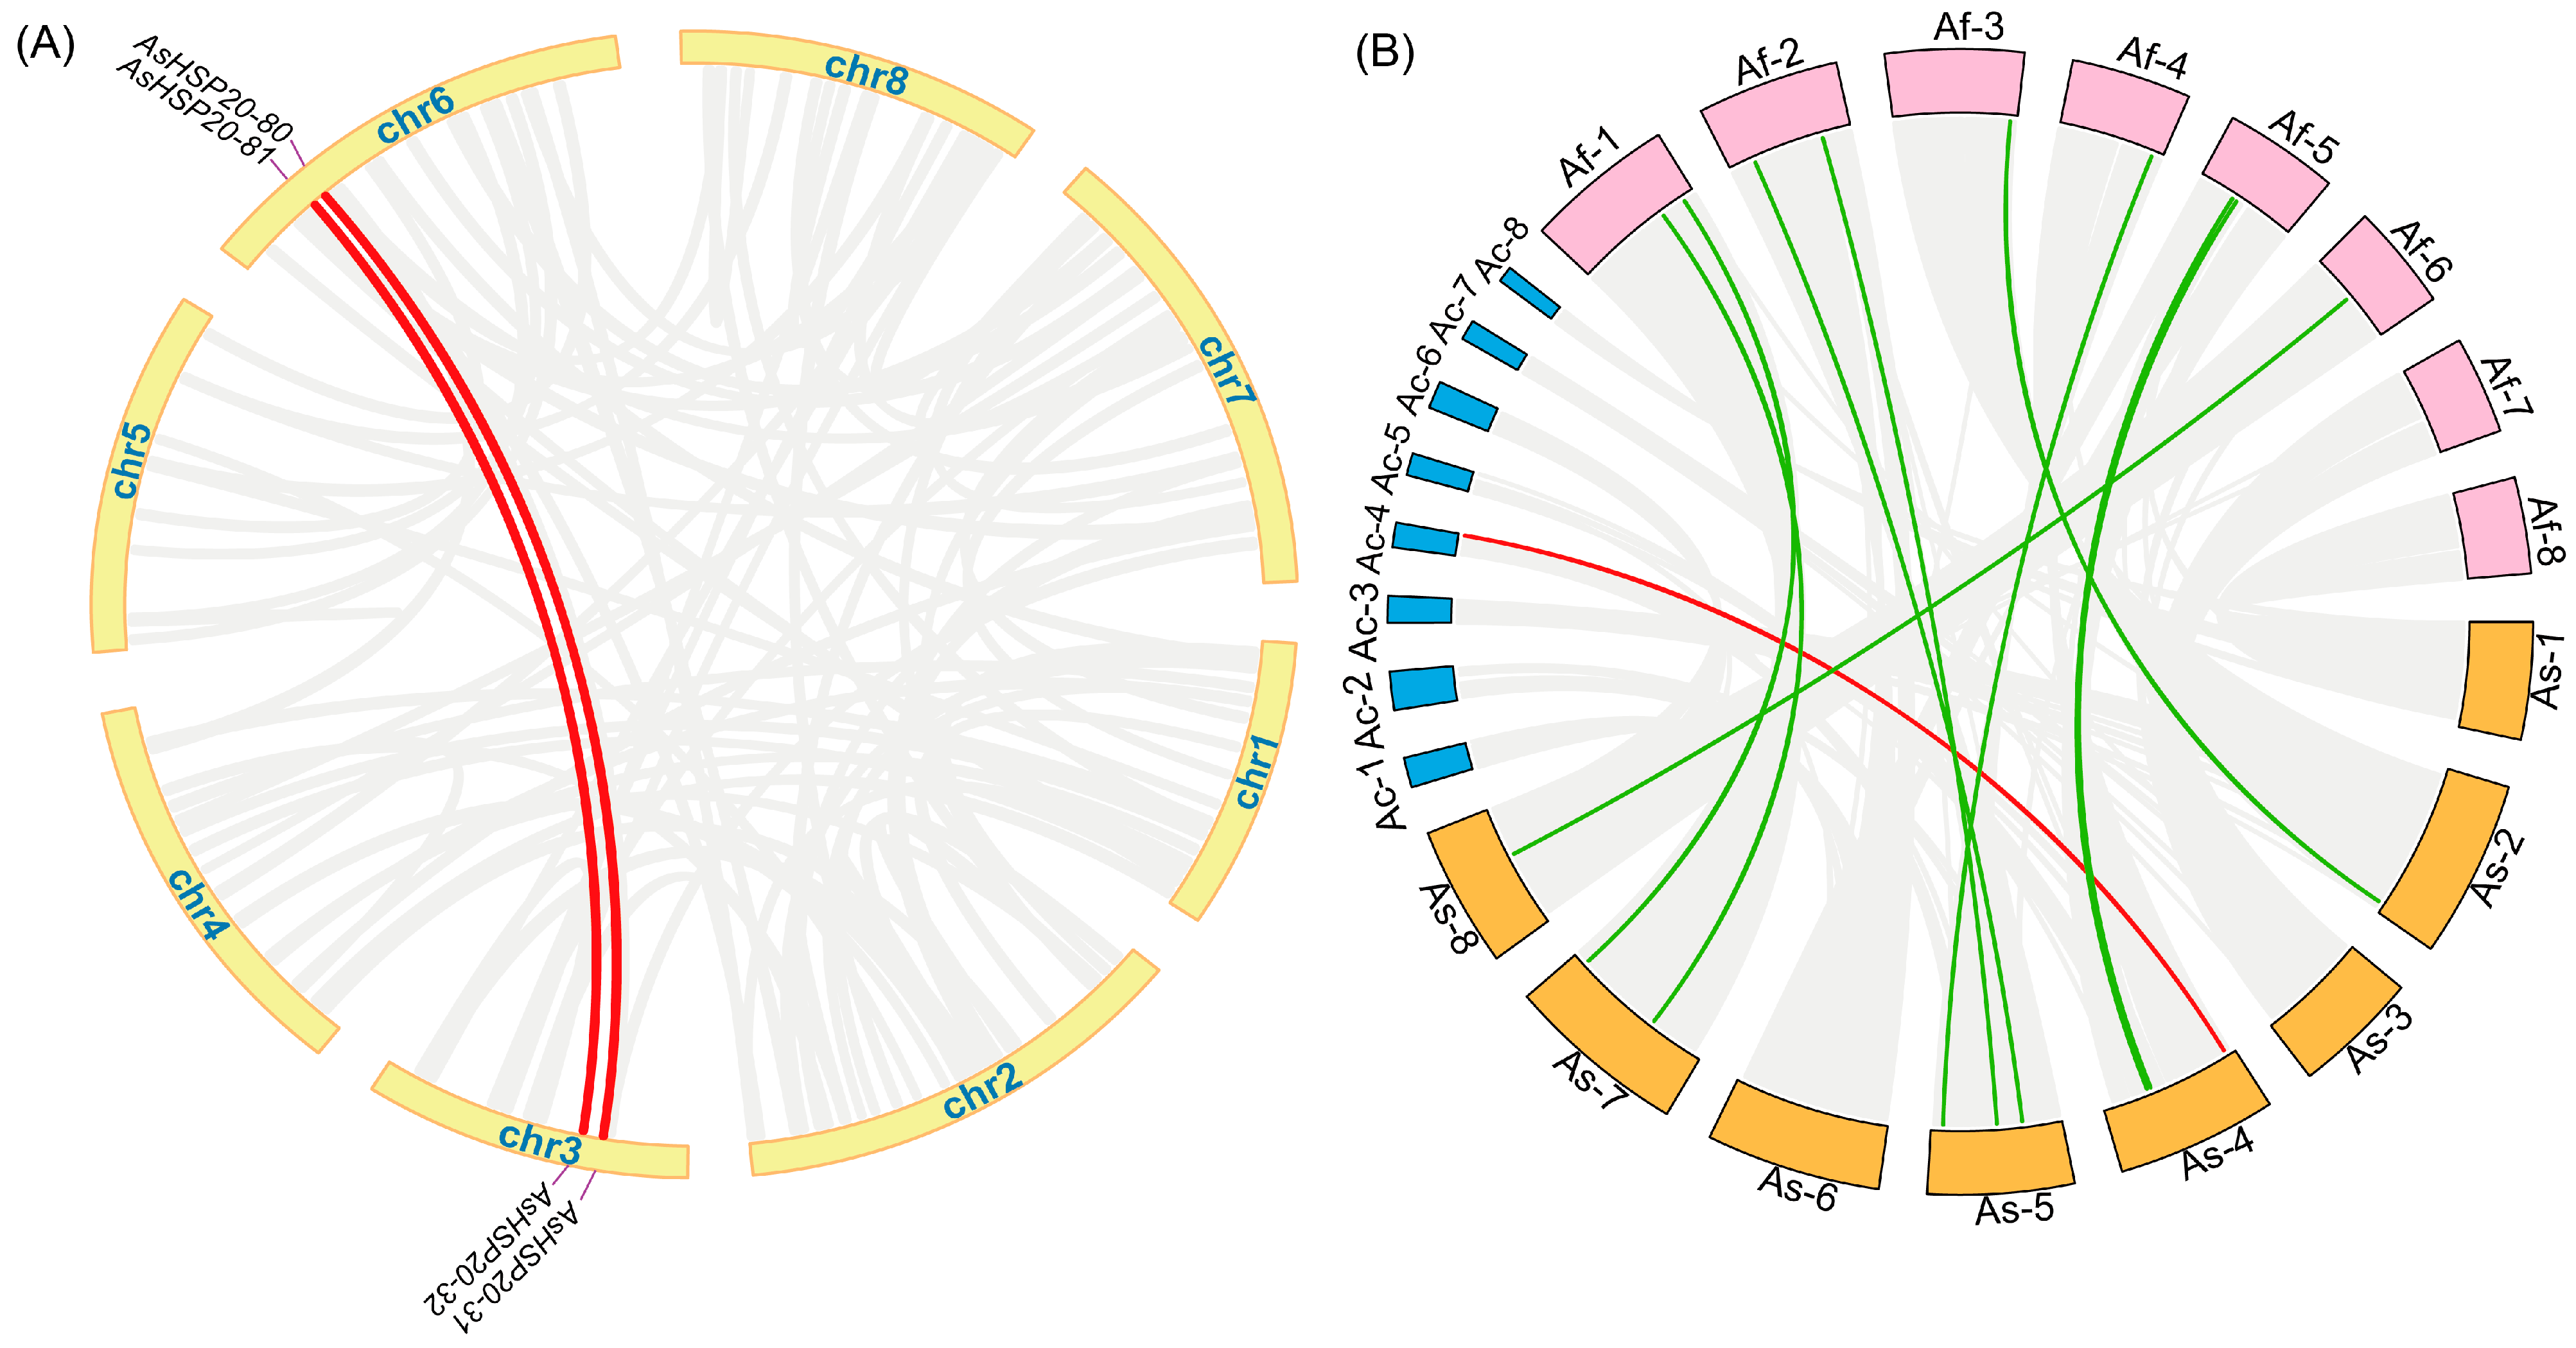
Whole genome synteny analysis of the 114 AsHSP20 loci using MCScanX revealed two prominent segmental duplication pairs—AsHSP20-80/AsHSP20-31 and AsHSP20-81/AsHSP20-32 on chromosome 3 and 6—which are highlighted in (Figure 4). The Ka/Ks ratios for these pairs (0.0459 and 0.2545, respectively) are both well below 1, indicating strong purifying selection (Supplementary Table S3); the exceptionally low ratio of 0.0459 suggests an almost complete conservation at the nucleotide level, with minimal to no accumulation of non-synonymous substitutions, while the 0.2545 ratio suggests limited subfunctionalization or regulatory divergence alongside retention of core chaperone activity. To assess conservation across closely related species, HSP20 genes from garlic (A. sativum), onion (A. cepa) and Welsh onion (A. fistulosum) were mapped to their respective genomes and visualized in a chord diagram (Figure 4). A single red chord marks the only one to one orthologous pair between garlic and onion (AsHSP20-43/g513289.t1), whereas ten green chords link garlic to Welsh onion: eight denote one to one orthologs and two (AsHSP20-49 and AsHSP20-52) each correspond to two A. fistulosum homologs. These patterns underscore both the high conservation of the HSP20 family within the Allium genus and a lineage specific expansion in Welsh onion.

3.6. Analysis of Cis-Acting Elements in Promoter Regions

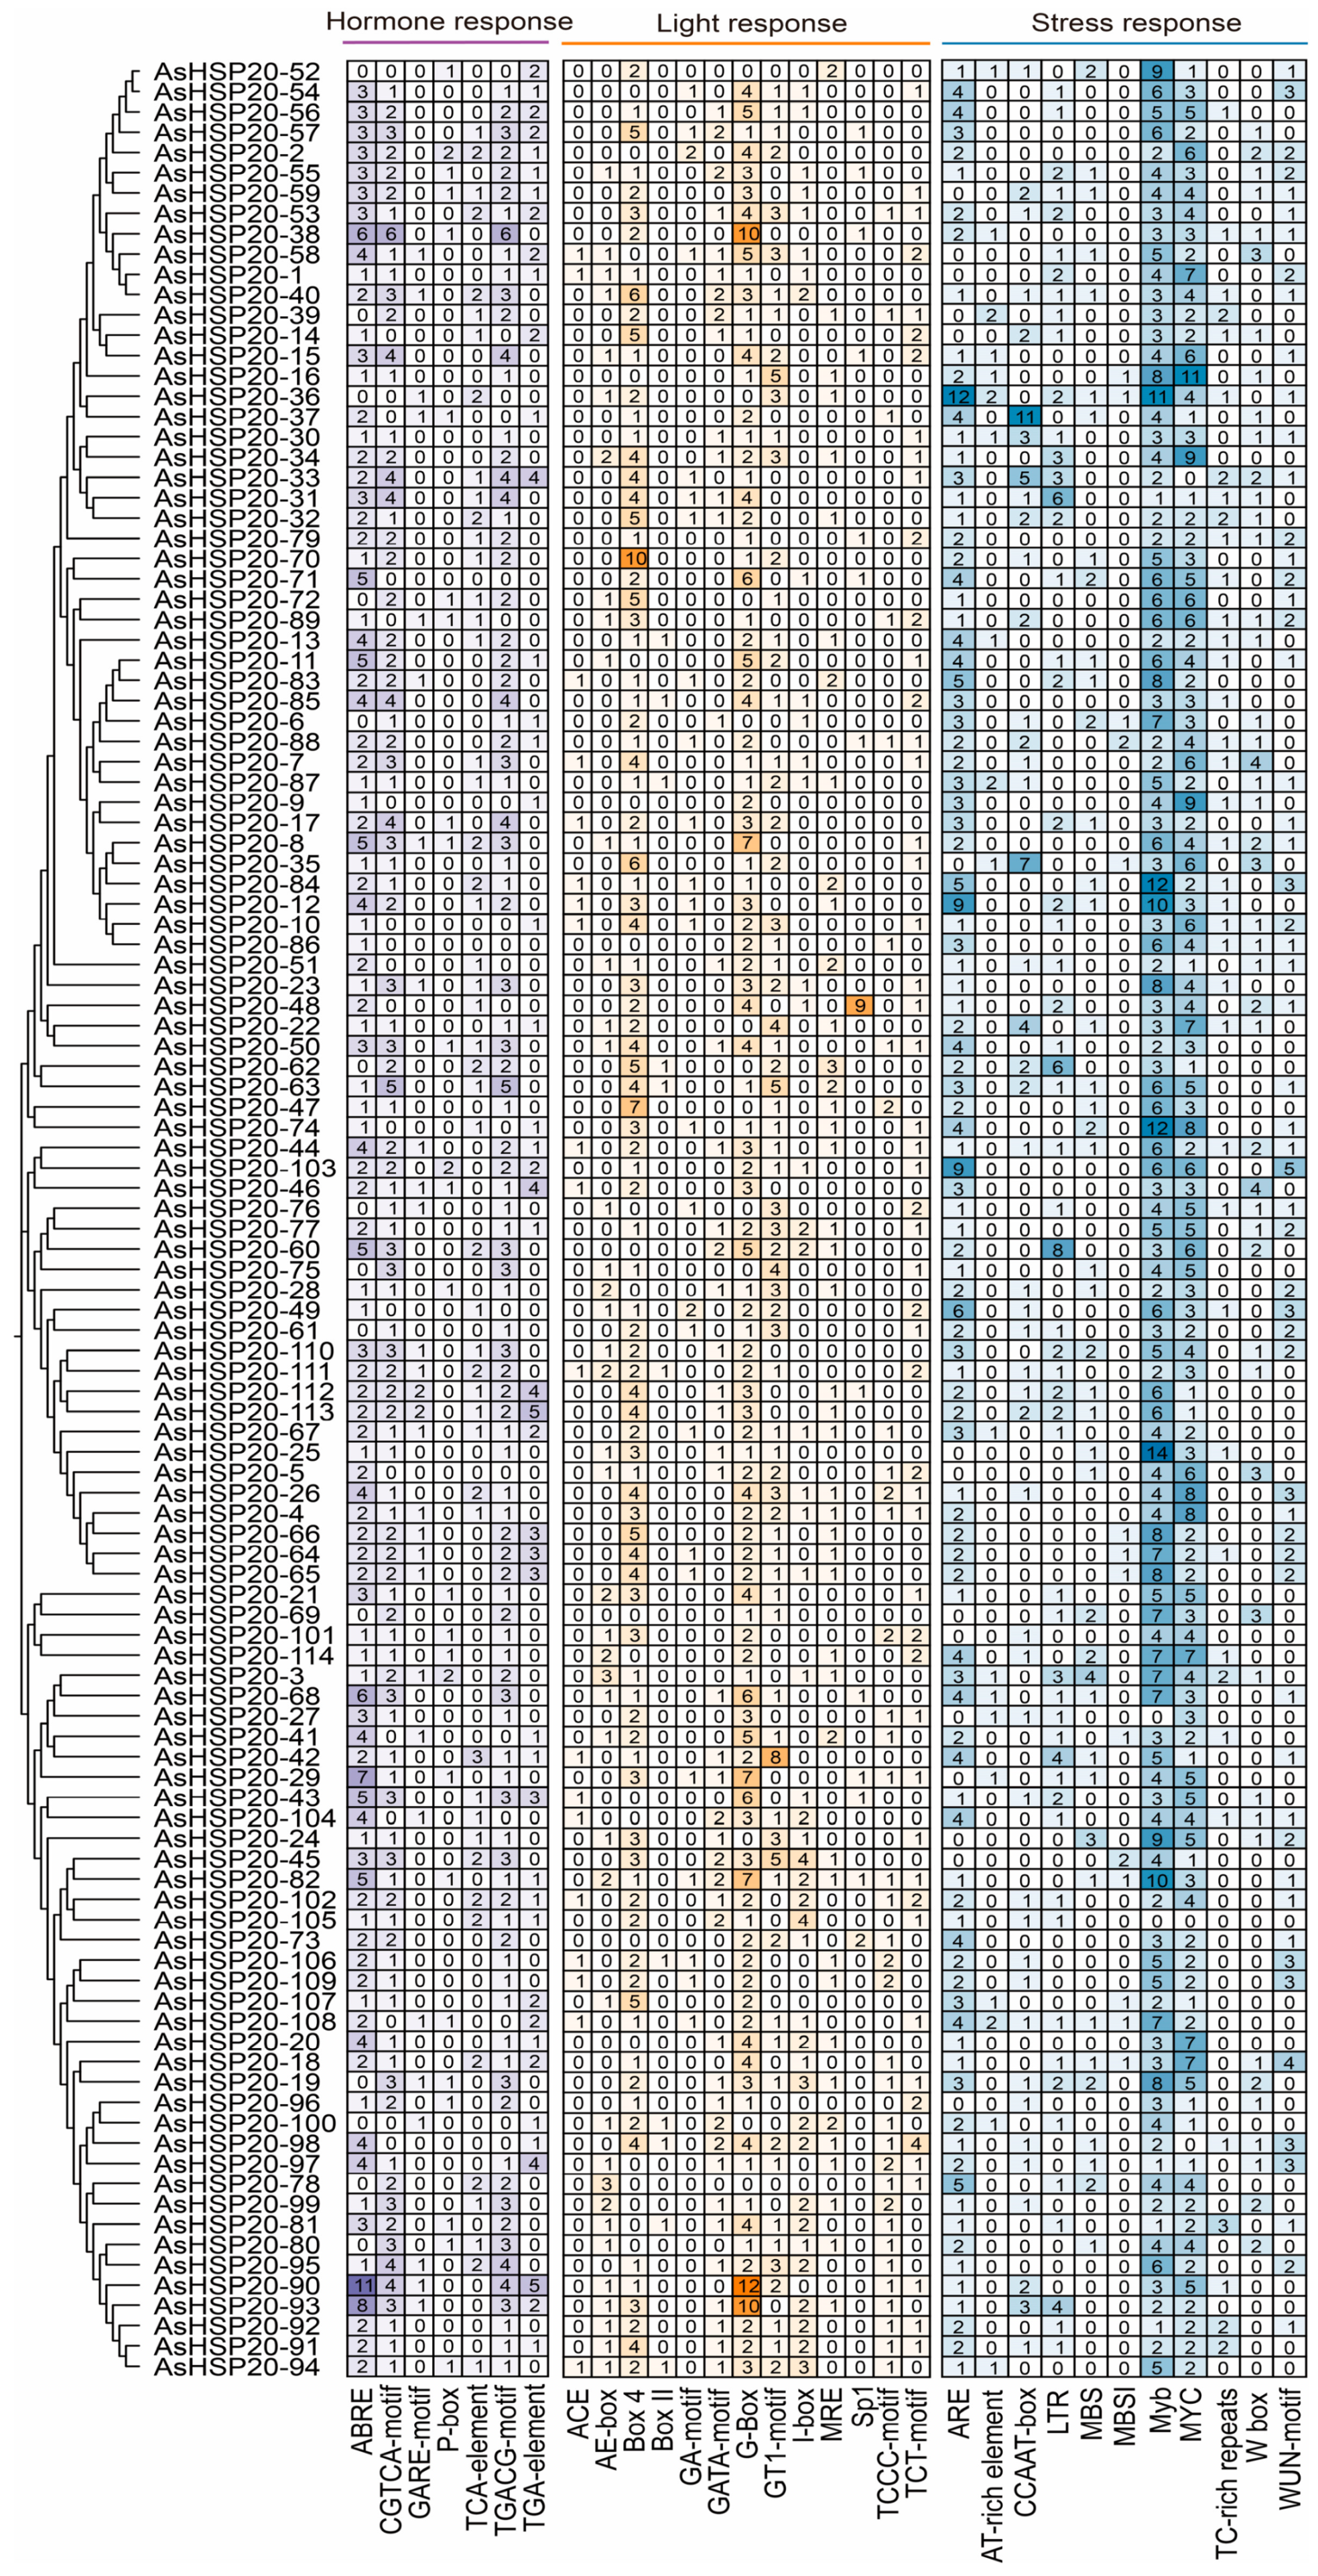
Promoter regions, defined as the 2 kilobase sequences upstream of the coding regions of all AsHSP20 genes, were systematically analyzed for cis-acting regulatory elements and subsequently categorized into three major classes: hormone responsive, light responsive and stress responsive elements (Figure 5). Although every promoter contains a diverse array of elements, their relative abundance varies greatly, reflecting gene specific divergence in regulatory potential. Abscisic acid responsive cis-elements (ABRE) and methyl jasmonate motifs (CGTCA-motif and TGACG-motif) are ubiquitous, with particularly high densities in the promoters of AsHSP20-90, -38 and -93, suggesting strong responsiveness to ABA and MeJA. In contrast, AsHSP20-3 and -8 promoters are enriched in P-box and GARE-motif sites, implicating these genes in gibberellin signaling. Core light responsive motifs such as Box 4, G-box and GT1-motif appear broadly across the family but are exceptionally abundant in AsHSP20-90, -93 and -70, indicating potential regulation by photoperiod or light intensity. Stress-responsive elements—including low temperature response (LTR), drought response (MBS), MYC/MYB transcription factor binding sites and pathogen-related TC-rich repeats—are most prevalent in AsHSP20-3, -36, -74 and -16; Hierarchical clustering of element profiles further grouped genes by regulatory complexity: for example, AsHSP20-90, -93, and -60 share a balanced, multi-signal repertoire, whereas AsHSP20-96, -27 and -105 possess simpler element combinations indicative of more restricted control.

3.7. Expression Pattern Analysis

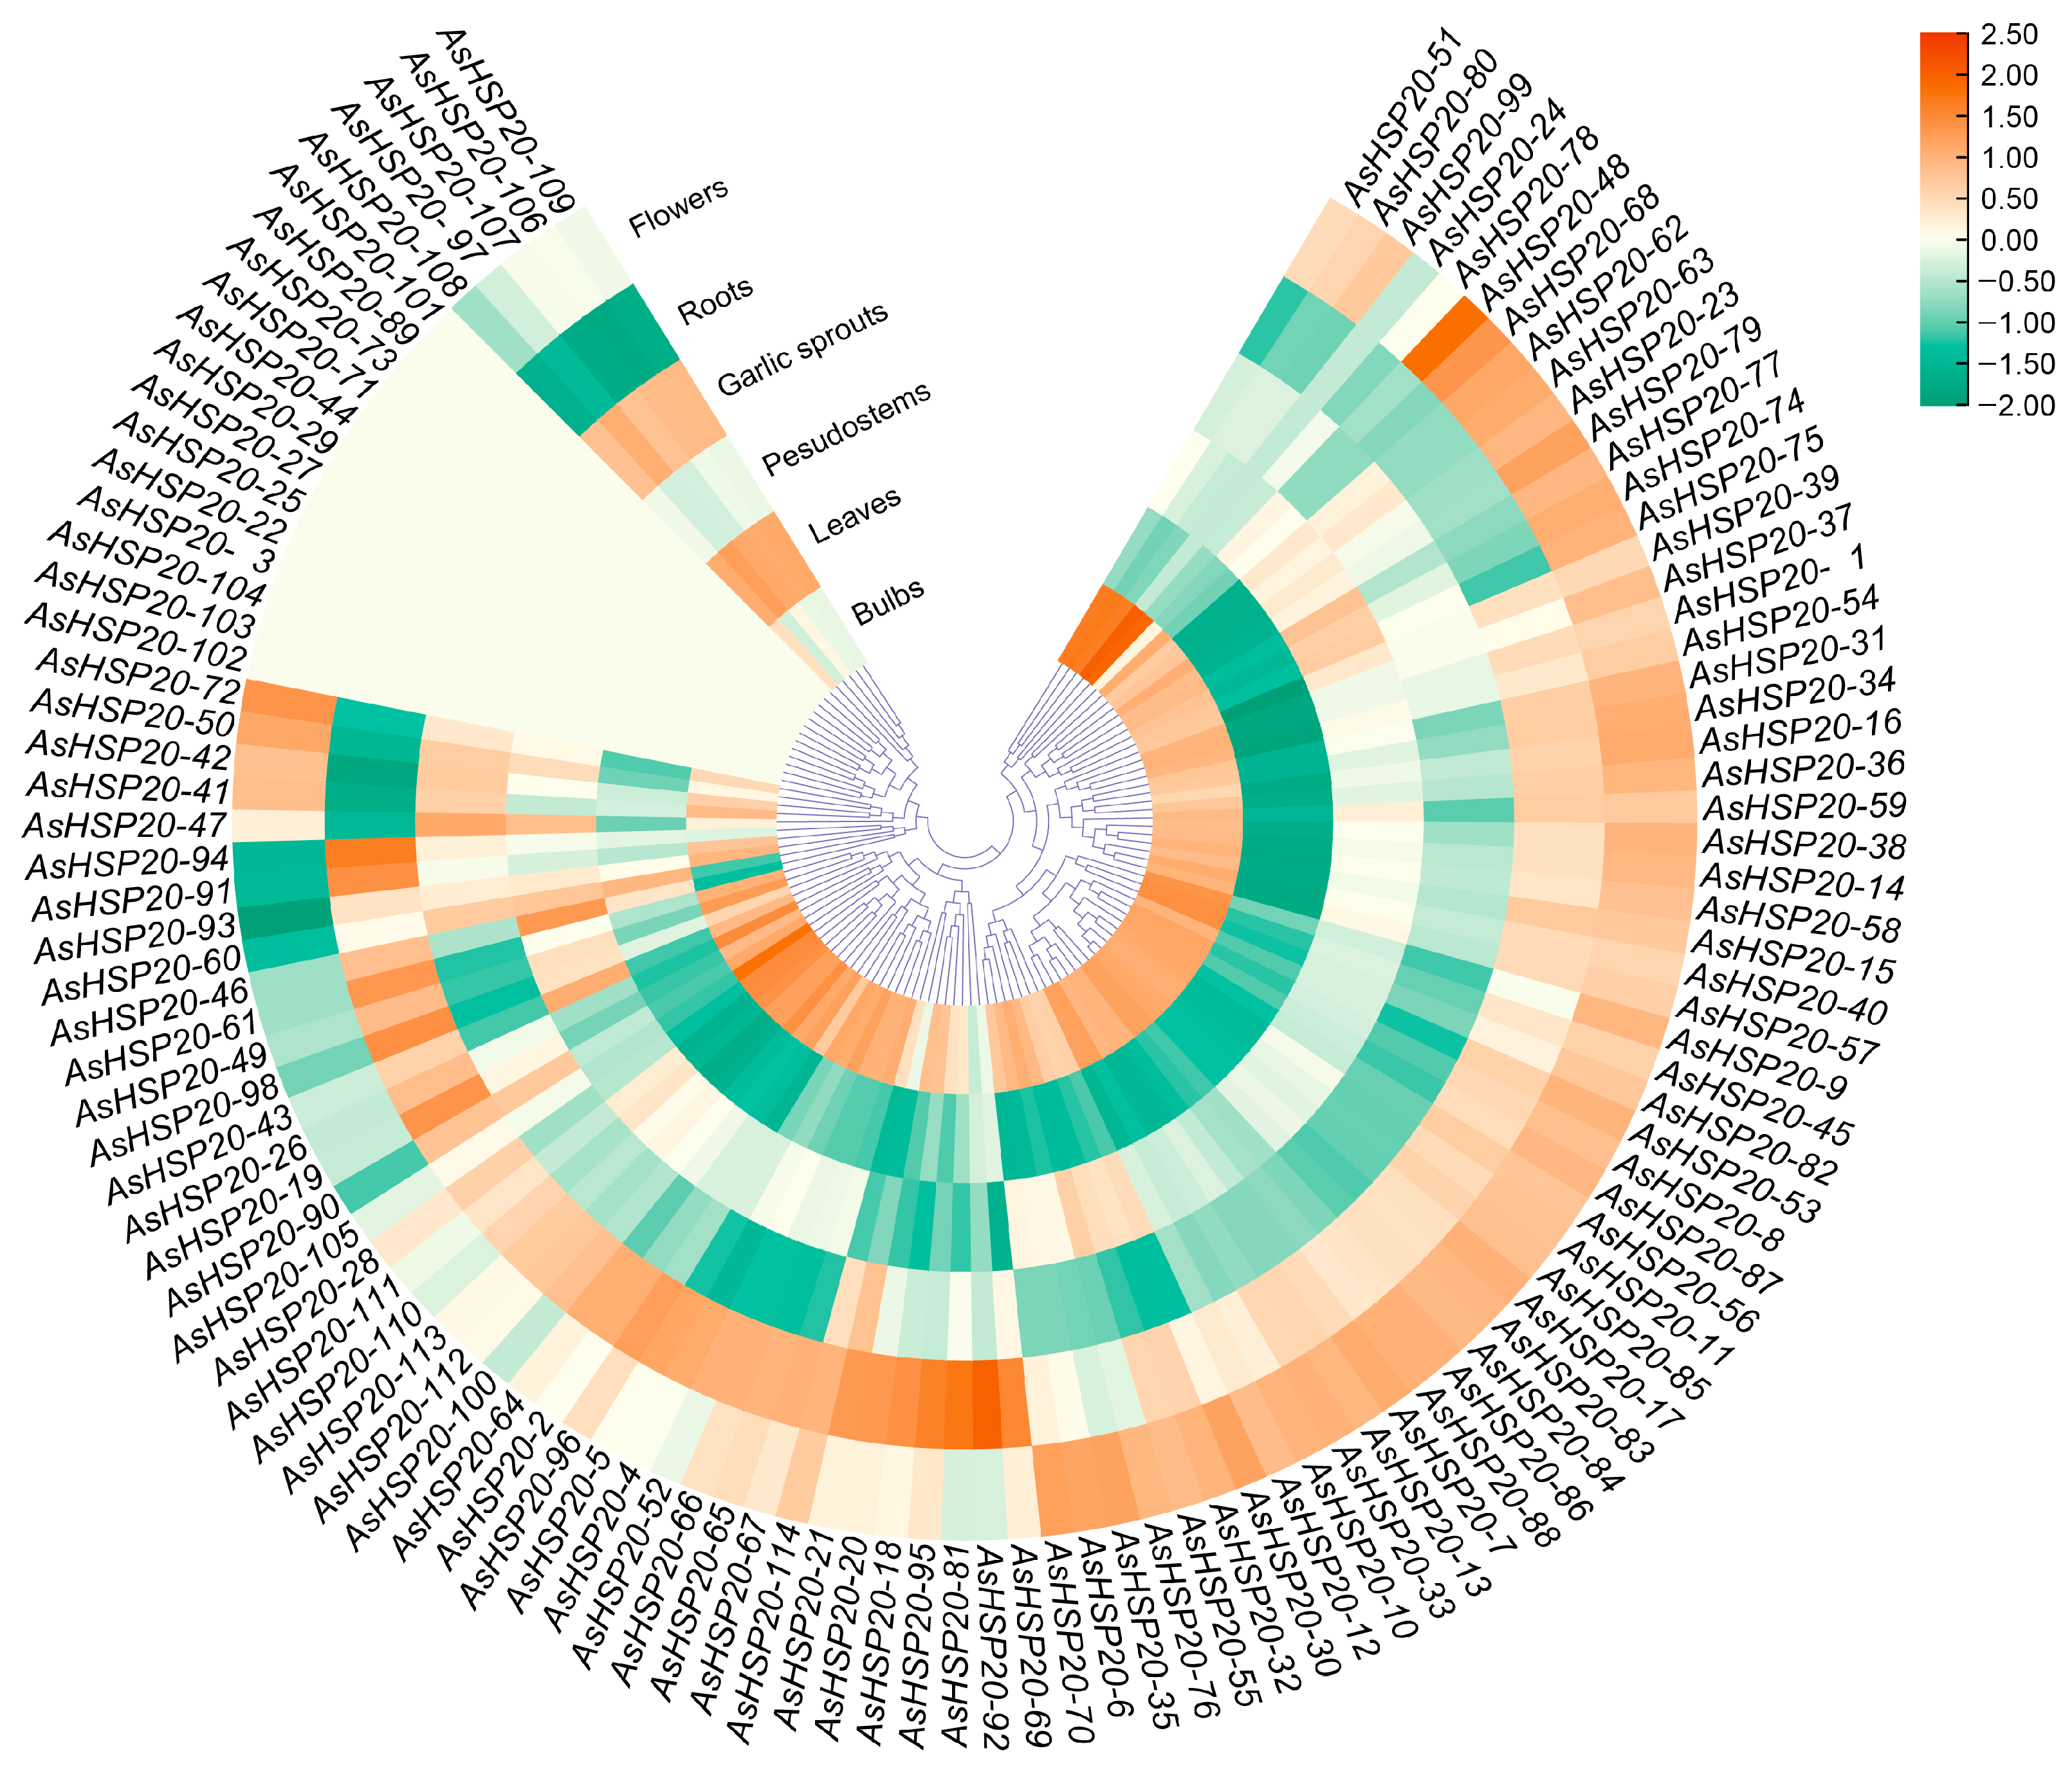
Transcriptome profiling across six tissues (PRJNA243415) revealed distinct expression clusters among the 114 AsHSP20 genes (Figure 6). Most members exhibit their highest transcript accumulation in bulbs and floral tissues, indicating that these organs may serve as primary sites for HSP20-mediated cellular protection. In contrast, leaves and garlic sprouts generally display low expression levels. At the individual gene level, AsHSP20-79 demonstrates broad organ-specific expression, with particularly high transcript abundance observed in bulbs, pseudostems, sprouts and flowers; AsHSP20-94 peaks in leaves; AsHSP20-92 shows high expression in roots, AsHSP20-81 was selected due to its broader organ-specific expression profile across bulbs, pseudostems, garlic sprouts, and flowers. Co-expression clustering further highlights tissue associations: AsHSP20-79, -81 and -84 cluster together with elevated expression in bulbs, roots and flowers, the majority of sHSP genes show markedly lower expression levels in aerial tissues such as garlic sprouts and leaves compared to bulbs, roots and floral organs. While AsHSP20-69, -81, -91, -92 and -94 are confined to underground tissues. Additionally, we identified a larger subset of genes—including AsHSP20-3, -7, -22, -25, -27, -29, -44, -71, -73, -89, -101, -102, -103 and -104—that show negligible or undetectable expression under normal conditions, suggesting that they may be stringently regulated and primarily inducible under stress conditions. In contrast, genes such as AsHSP20-26 and -29 demonstrated preferential expression in aerial parts, particularly leaves and sprouts, implying possible functional specialization in aboveground tissue development or stress adaptation.

3.8. qRT–PCR Analysis

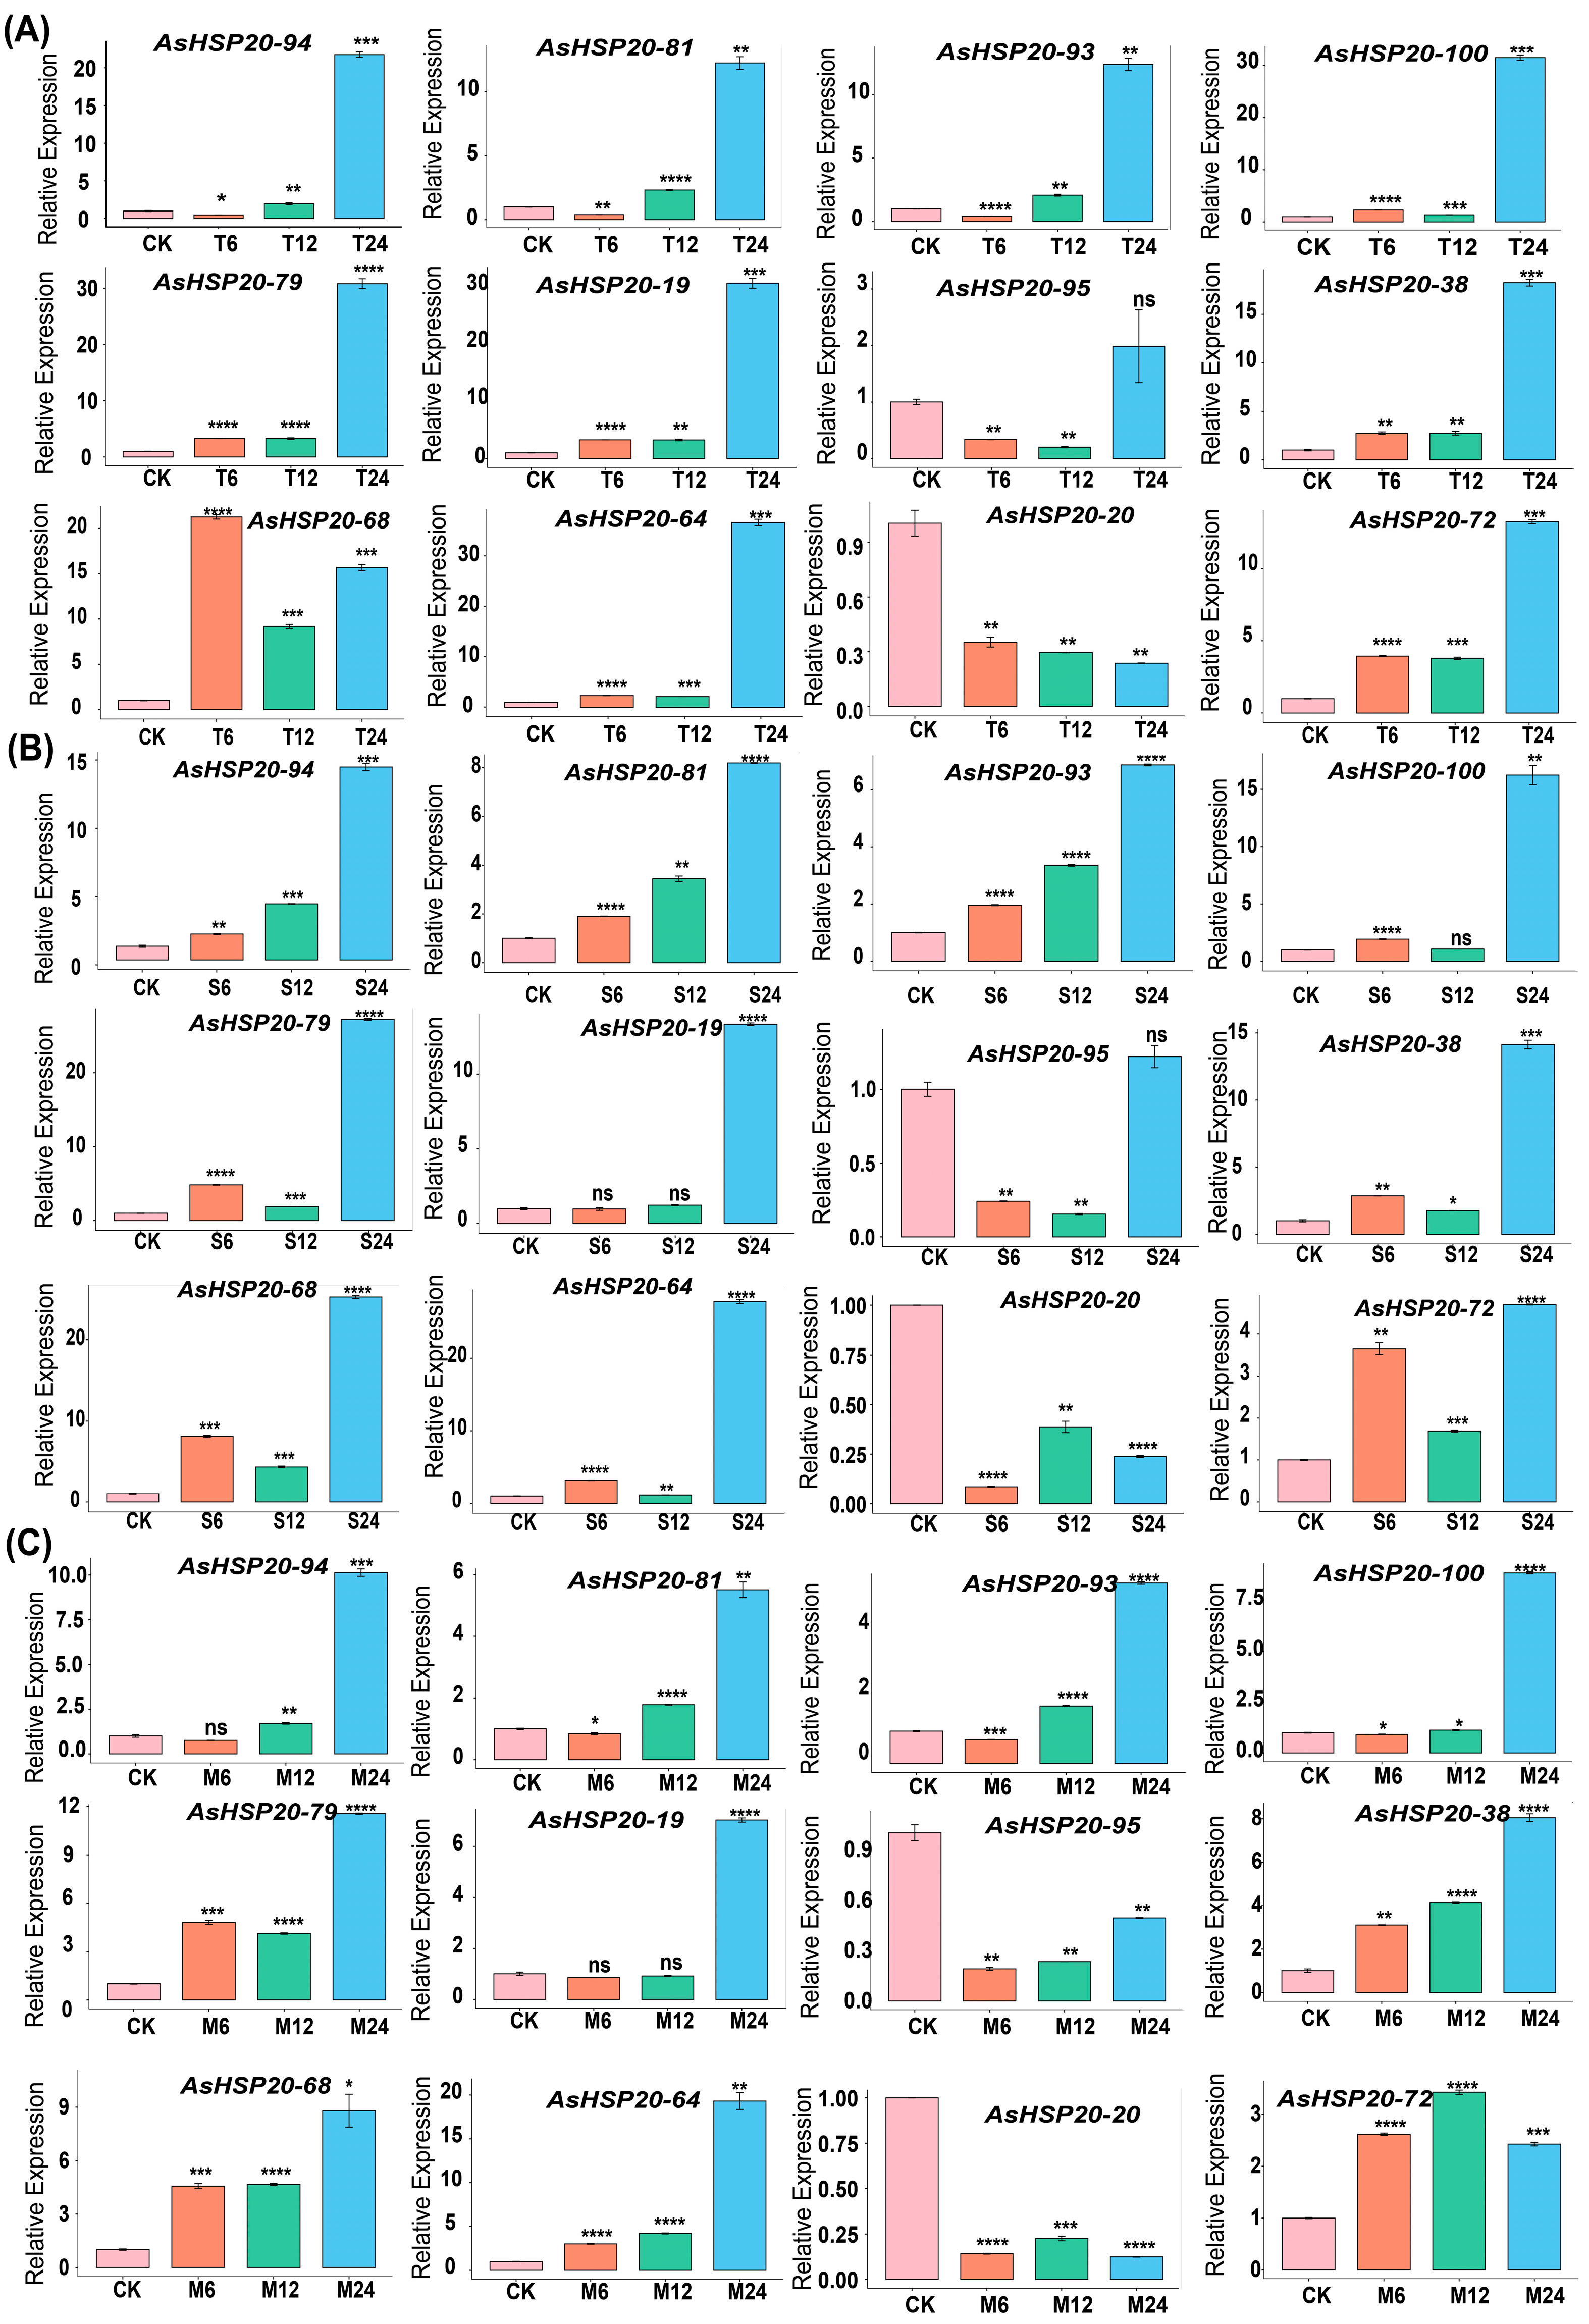
To validate the stress-responsive expression patterns of AsHSP20 genes observed in transcriptomic analysis and clustering, we selected twelve representative members (AsHSP20-94, -81, -93, -79, -100, -95, -64, -68, -72, -38, -20 and -26) for quantitative real-time PCR (qRT-PCR) (Figure 7). These genes were chosen based on their high basal expression levels in garlic leaves—the tissue most sensitive to abiotic stress and their differential responsiveness under various treatments. Leaves are typically the primary sites of physiological and phenotypic changes during environmental stress, making them an ideal tissue for identifying stress-related gene activity. Garlic plants were subjected to heat (39 °C), salt (200 mM NaCl) and methyl jasmonate (100 µM MeJA) treatments, and leaf samples were collected at 0, 6, 12 and 24 h for analysis.
Under heat stress (Figure 7A), AsHSP20-94, -81, -93, -100, -79 and -95 were significantly induced by 24 h, with transcript levels increasing in a time-dependent manner. In particular, AsHSP20-79 exhibited the highest fold-change at 24 h, suggesting a central regulatory role in the heat-shock response. Conversely, AsHSP20-38 and -20 displayed progressive downregulation over the treatment period, indicating that these genes may be repressed by high temperature or function predominantly under non-stress conditions. Under salt treatment (Figure 7B), AsHSP20-94, -81, -93 and -79 again showed strong induction at 24 h, with AsHSP20-79 reaching the greatest expression level. In contrast, AsHSP20-95, -20 and -72 exhibited negligible changes throughout the salt exposure, implying either insensitivity to salinity or involvement in more complex regulatory pathways. Following MeJA application (Figure 7C), AsHSP20-94, -79 and -64 were markedly upregulated at 24 h, with AsHSP20-64 displaying the most pronounced response. Notably, AsHSP20-95 and -20 again showed sustained downregulation under MeJA treatment, while AsHSP20-95, and -20 exhibited persistent repression under both salt and MeJA stresses, consistent with potential roles as negative regulators or stress-suppressed factors.
Together, these qRT–PCR results confirm that most selected AsHSP20 genes are rapidly and robustly induced by heat, salt and MeJA, with AsHSP20-94 and -79 emerging as particularly versatile multi-stress markers. Meanwhile, the downregulated subset may participate in energy reallocation or negative feedback during stress responses.

3.9. Protein–Protein Interaction Network and Gene Ontology Enrichment

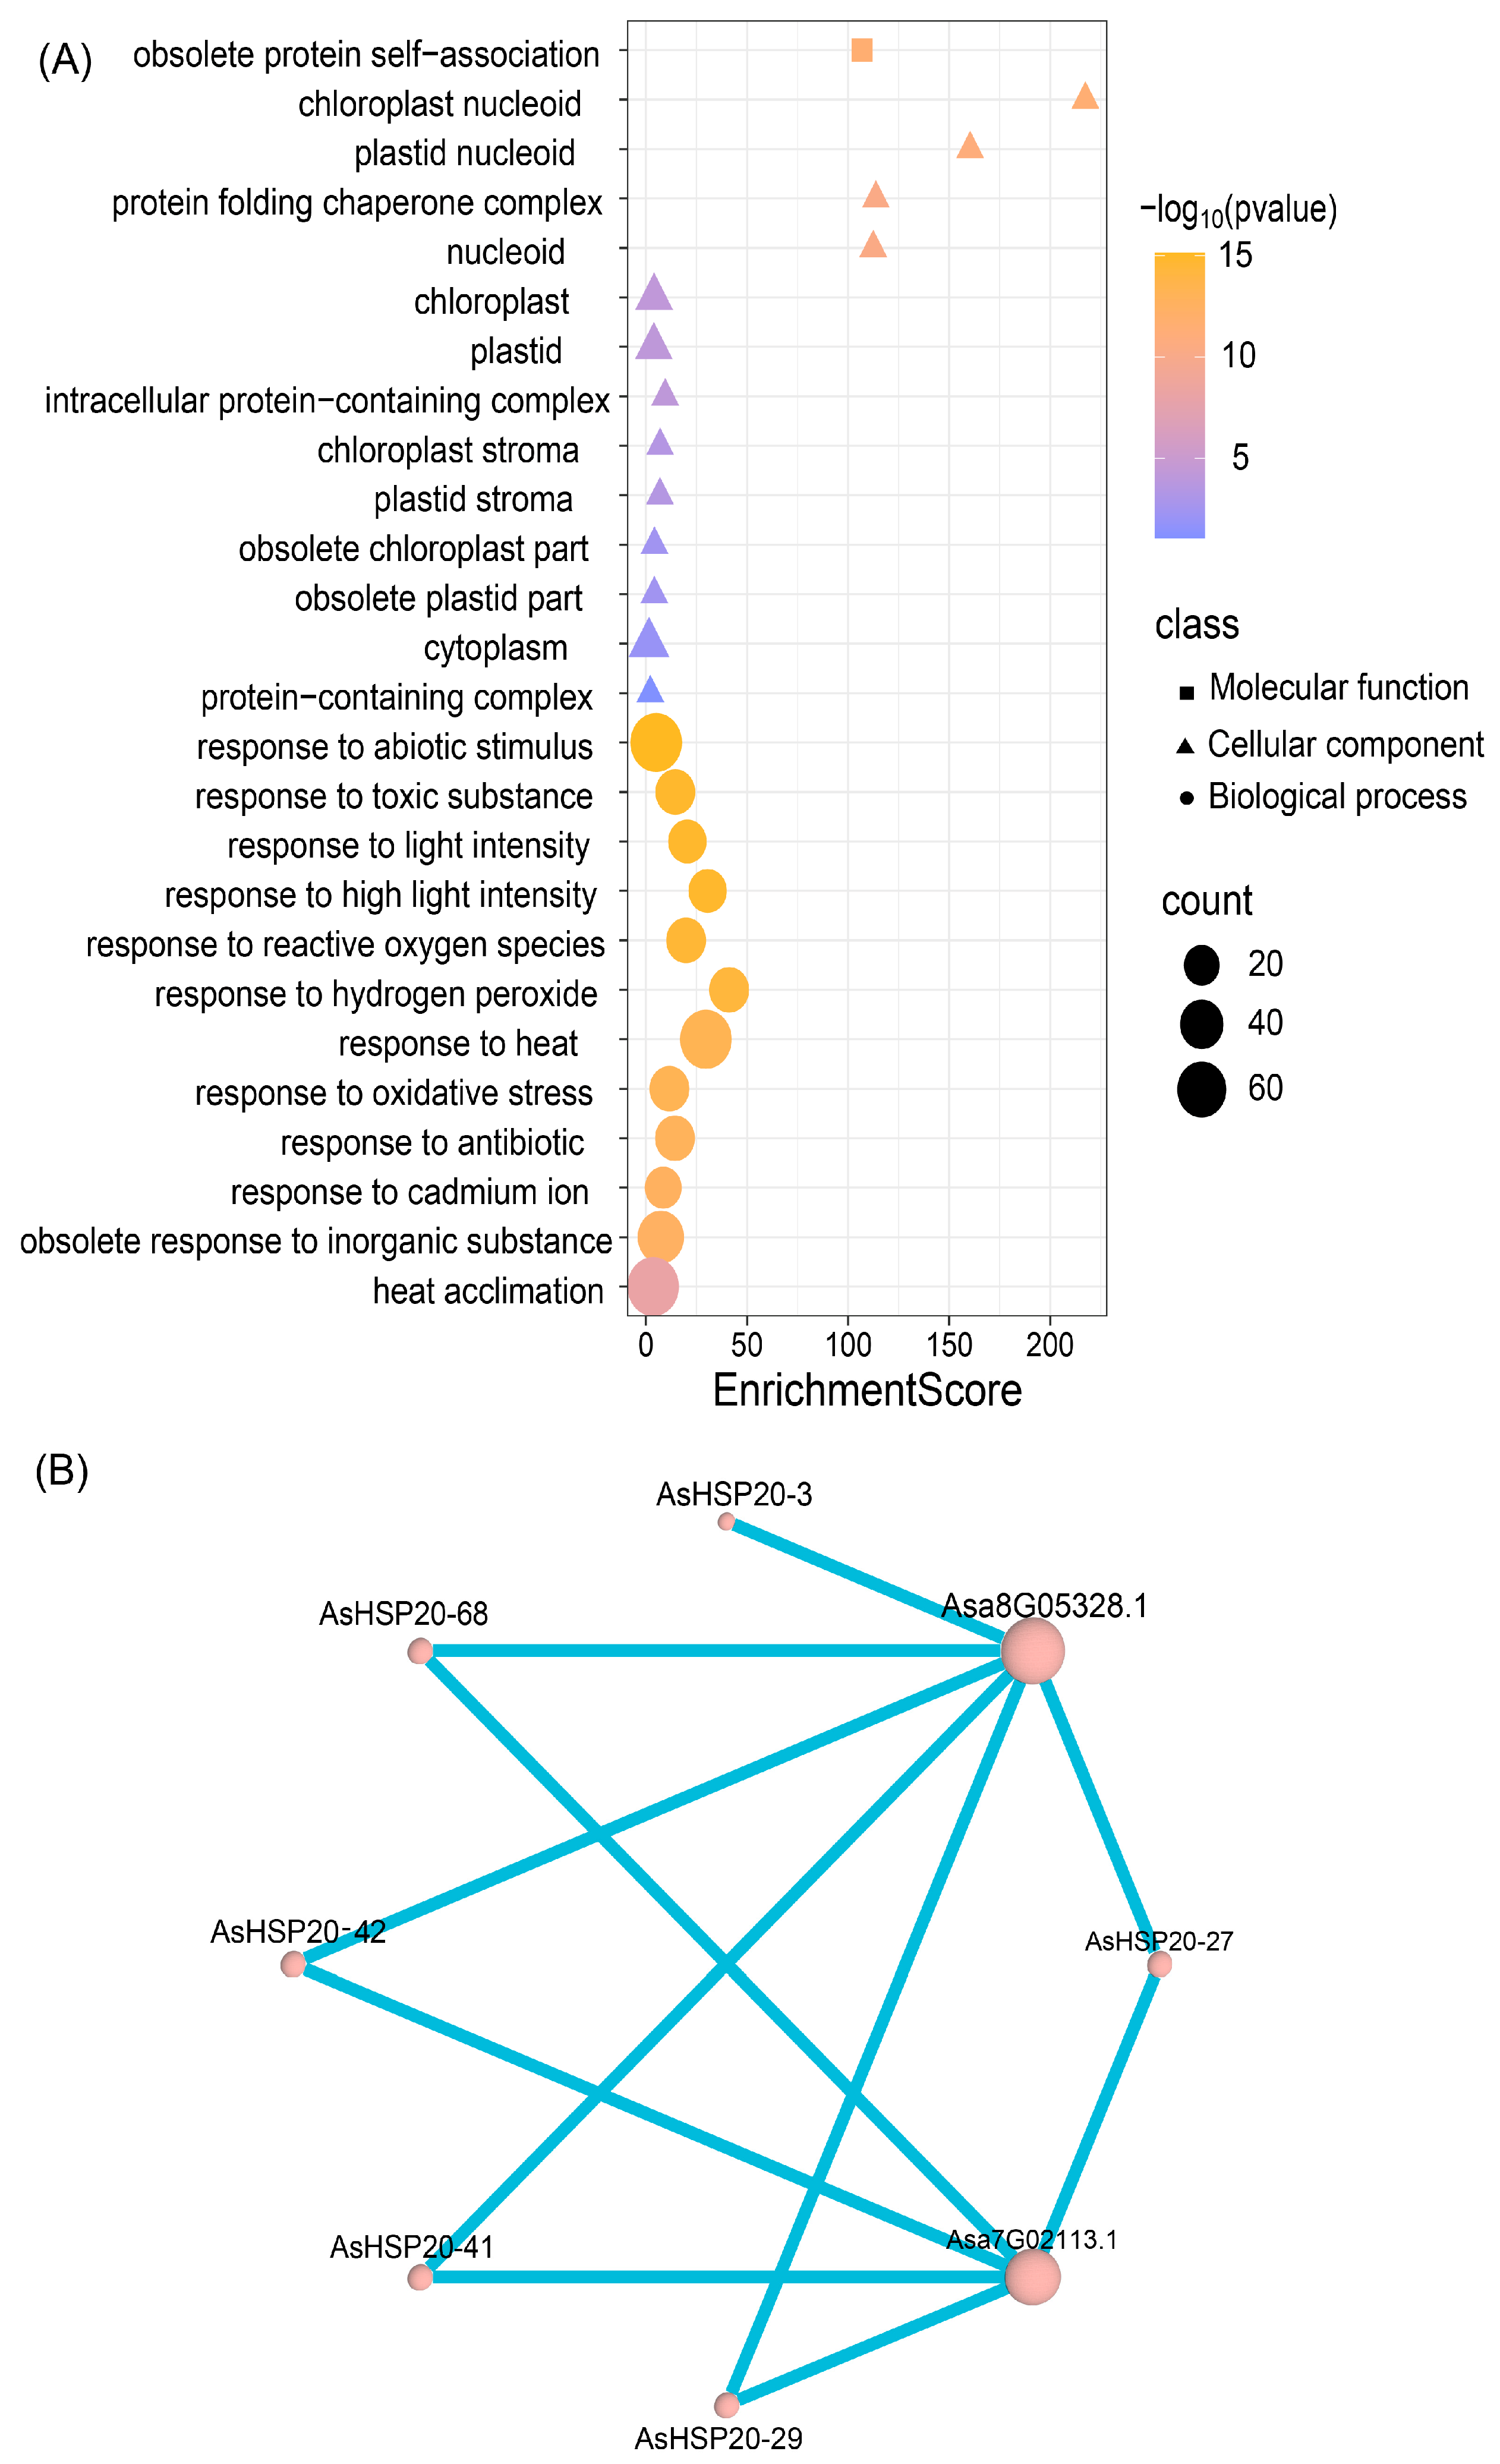
To explore potential functional partnerships, Gene Ontology enrichment and predicted protein–protein interaction (PPI) analyses were performed. GO enrichment (Figure 8A) revealed significant overrepresentation of biological processes such as “response to abiotic stimulus (GO:0009628),” (Supplementary Table S4)” response to heat (GO:0009408),” “response to light intensity (GO:0009642),” “reactive oxygen species homeostasis (GO:0000304)” and “heat acclimation (GO:0010286).” At the cellular component level, terms including “protein folding chaperone complex (GO:0101031),” “chloroplast (GO:0009507)” and “plastid nucleoid (GO:0042646)” were enriched, indicating involvement in organelle-associated proteostasis. The PPI network (Figure 8B) positions several AsHSP20 proteins—namely AsHSP20-3, -42, -29 and -68—as central hubs interacting with multiple stress-related or uncharacterized partners (e.g., Asa8G05328.1, Asa7G02113.1), suggesting that HSP20s integrate complex signaling pathways to regulate protein stability under stress.

3.10. Subcellular Localization

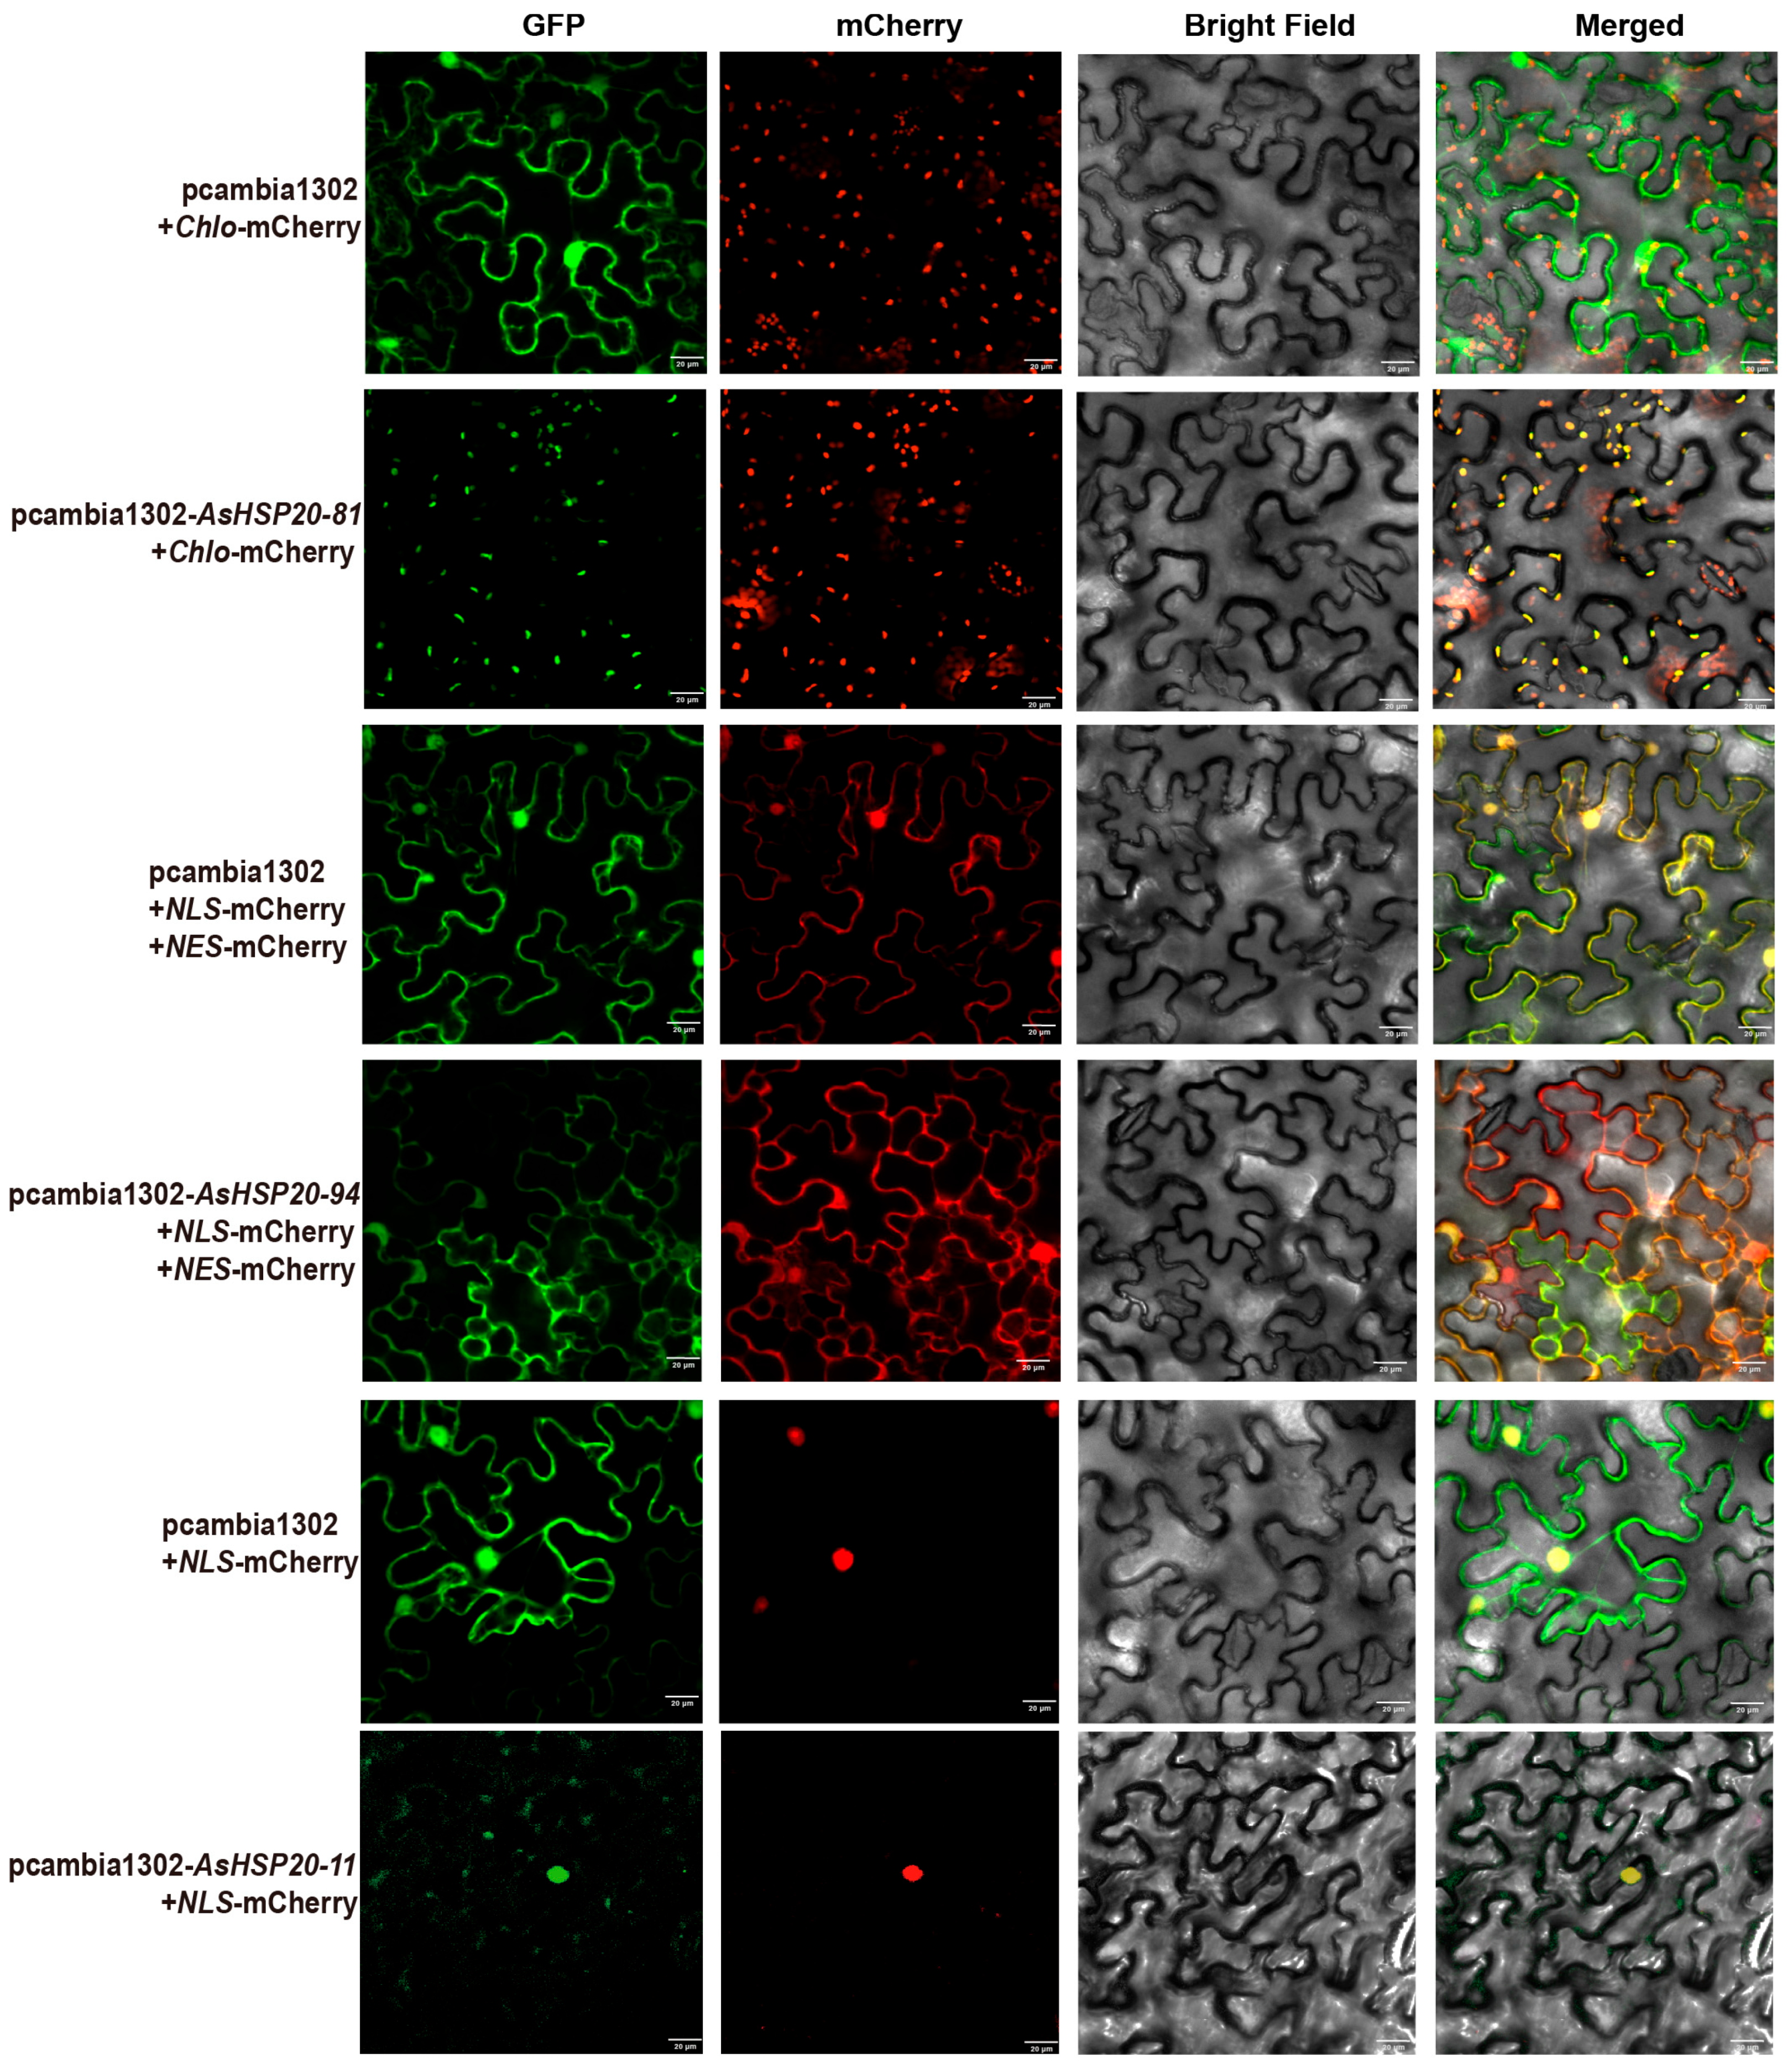
To validate the subcellular targeting of selected AsHSP20 proteins, we now clarify that AsHSP20-81, AsHSP20-94, and AsHSP20-11 were selected for subcellular localization analysis due to their distinct predicted localizations (chloroplast, cytosol, and nucleus, respectively), allowing us to assess the accuracy of the computational predictions across different compartments. GFP fusions of AsHSP20-81, AsHSP20-94 and AsHSP20-11 were transiently co-expressed in Nicotiana benthamiana lower epidermal cells alongside organelle markers (Figure 9): Chlo-mCherry for chloroplasts, NLS-mCherry for nuclei and NES-mCherry for cytosol. Confocal microscopy of the empty-vector controls (pCAMBIA1302 + Chlo-mCherry or pCAMBIA1302 + NLS-mCherry + NES-mCherry) confirmed marker specificity: GFP fluorescence was ubiquitous, Chlo-mCherry appeared as punctate chloroplast signals, NES-mCherry filled the cytoplasm, and NLS-mCherry accumulated in the nucleus, with no off-target overlap.
Under these conditions, AsHSP20-81-GFP produced punctate signals that overlapped almost completely with Chlo-mCherry, indicating chloroplast localization. AsHSP20-94-GFP fluorescence co-distributed with NES-mCherry but did not overlap with NLS-mCherry, demonstrating a predominantly cytosolic localization. In contrast, AsHSP20-11-GFP signals were concentrated in the nucleus, co-localizing with NLS-mCherry.
These observations reveal that AsHSP20 family members exhibit distinct subcellular partitioning—targeting chloroplasts, cytosol or nucleus—which likely underpins their diverse chaperone and regulatory functions within different cellular compartments.

3.11. Yeast Transgenic Verification

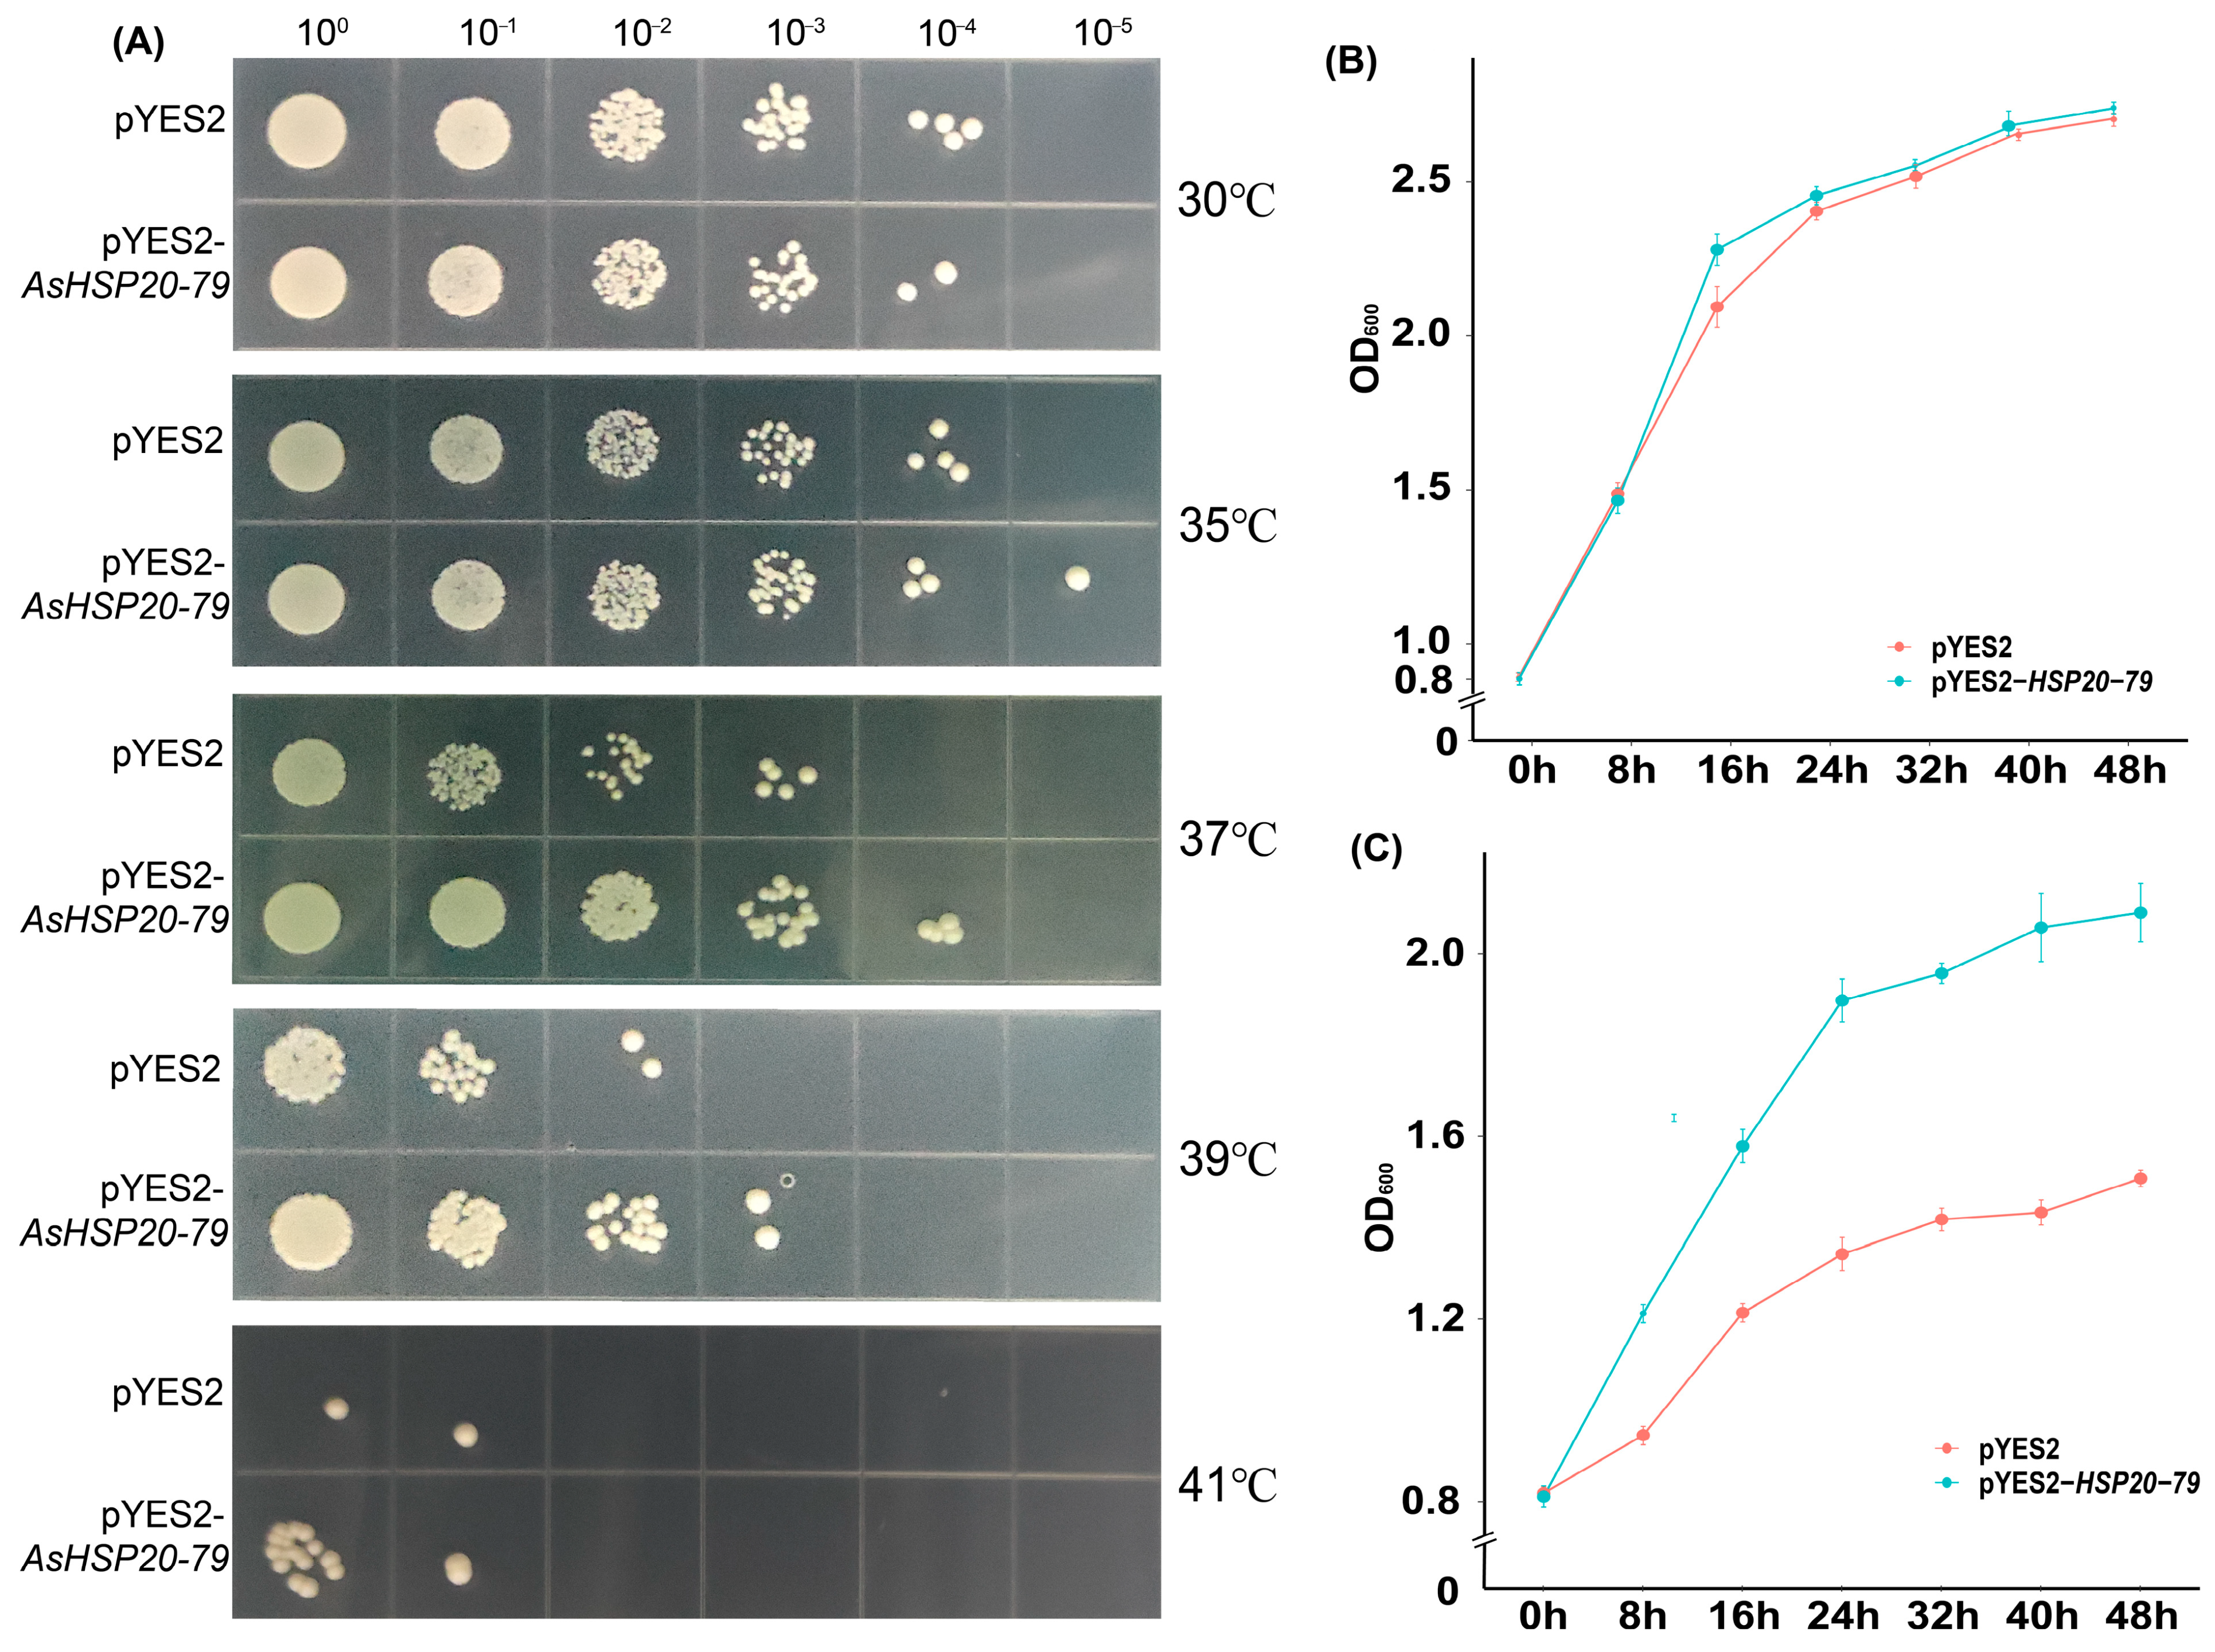
To further validate the role of AsHSP20-79 in thermotolerance, we conducted a thermotolerance assay using a yeast expression system, selecting this gene based on its high basal expression across tissues and strong induction under various abiotic and hormonal stresses. AsHSP20-79 was overexpressed in Saccharomyces cerevisiae, and both spot growth and liquid culture assays were performed at different temperatures. In spot assays (Figure 10A), both the control (pYES2) and the AsHSP20-79 transformants showed comparable growth at 30 °C. At 35 °C, a slight growth advantage became evident in the transformants, which became more pronounced at 37 °C and 39 °C, where the AsHSP20-79–expressing strain maintained visible colony formation even at higher dilutions, while the control strain exhibited reduced viability. At 41 °C, although both strains showed limited growth, the transformants still formed stronger colonies than the control. In liquid culture, the growth curves of both strains overlapped closely at 30 °C, with OD600 values rising from approximately 0.9 to 2.7 over 48 h (Figure 10B), indicating that AsHSP20-79 expression does not affect yeast proliferation under normal conditions. However, under heat stress at 39 °C (Figure 10C), the AsHSP20-79 transformants exhibited a markedly higher growth rate starting from 16 h, ultimately reaching an OD600 of ~2.05 at 48 h, compared to ~1.45 for the control. This clearly indicates that AsHSP20-79 promotes yeast cell growth and survival under high-temperature stress. Collectively, these results demonstrate that AsHSP20-79 enhances thermotolerance in yeast, with its protective effects becoming detectable from 35 °C and intensifying at higher temperature.

4. Discussion

sHSPs or HSP20s constitute the largest subclass of plant heat shock proteins, acting as frontline molecular chaperones to stabilize denatured proteins, prevent aggregation, and preserve proteostasis under abiotic stress. While previous genome-wide surveys in model plants such as Arabidopsis thaliana [17], rice [9,38], maize [18] and potato [39] have catalogued sHSP repertoires numbering between 19 and 48 members, the identification of 114 AsHSP20 genes in garlic represents an unprecedented expansion. This dramatic increase likely reflects both ancient and recent duplication events that have been tolerated and retained owing to the compensatory advantages they confer to this clonally propagated crop [40,41].
Chromosomal mapping revealed that AsHSP20 loci are non-randomly distributed, with pronounced clusters in the distal regions of chromosomes 4 and 6—areas known to be hotspots for tandem and segmental duplications. The presence of highly conserved segmental duplication pairs (e.g., AsHSP20-80/-31 and AsHSP20-81/-32), together with uniformly low Ka/Ks ratios (<0.3), indicates strong purifying selection preserving core chaperone functions while permitting subtle regulatory or tissue-specific divergence. Tandem duplications—evidenced by adjacent gene arrays—likely arose through unequal crossing-over or transposon-mediated recombination, further amplifying the family and potentially facilitating rapid local adaptation to fluctuating environments. In Rhododendron, most HSP20 genes also exhibit Ka/Ks < 1 (purifying selection), yet a small subset in low-altitude species shows Ka/Ks > 1, implying episodes of positive selection linked to higher temperature or drought adaptation [42]. By contrast, all duplicated AsHSP20 gene pairs have Ka/Ks < 0.3, demonstrating that purifying selection has uniformly dominated their evolution. To test whether any AsHSP20 members have since acquired adaptive functions, future work should compare their expression profiles across ecological gradients (e.g., differing altitudes or abiotic stress regimes) via transcriptomic analyses.
The extreme redundancy of HSP20 genes in garlic contrasts sharply with the smaller complements in sexual species, suggesting that a high copy number may compensate for reduced allelic diversity inherent in asexual reproduction. Indeed, gene dosage effects could amplify protective capacity under acute stress, while paralog-specific expression patterns might fine-tune responses across tissues and developmental stages. The retention of so many paralogs also raises intriguing questions about neofunctionalization versus subfunctionalization. Our discovery of extra domains, such as Hexokinase_2 [43] and AAT_I [44], in a subset of AsHSP20 proteins argues for neofunctional roles in carbohydrate metabolism or amino acid transport—functions not typically associated with classical sHSPs. It will be essential in future studies to validate these potential moonlighting activities experimentally. Analysis of AsHSP20 gene structures uncovers two distinct patterns. Most stress-inducible paralogs are intron-poor or entirely intronless—mirroring rice, where 74% of HSP20 genes lack introns [9], a feature likely enabling ultra-rapid transcriptional induction under heat stress [45]. By contrast, AsHSP20s with multiple introns may undergo alternative splicing to generate diverse isoforms, supporting tissue-specific regulation.
Subcellular localization patterns underscore the versatility of AsHSP20 functions. Nearly two-thirds of AsHSP20 proteins localize to the cytosol, positioning them at the nexus of early stress signaling and proteome surveillance [38]. Cytosolic sHSPs likely collaborate with ATP-dependent chaperones (HSP70/HSP100) to sort misfolded substrates, decide their fate, and assist in refolding during cellular recovery [46]. Meanwhile, approximately one third of the family targets chloroplasts, organelles highly sensitive to heat and light-induced damage. The co-occurrence of AsHSP20–PTAC5 interactions in our PPI network, together with the known role of PTAC5 in maintaining plastid transcriptional competency, suggests that chloroplast sHSPs may stabilize not only protein complexes such as PSII and RuBisCO but also ribonucleoprotein assemblies critical for photosynthetic gene expression [47]. Such dual protection could be pivotal for sustaining photosynthetic efficiency during temperature extremes.
Promoter analysis uncovered multilayered regulatory circuits in AsHSP20 genes, integrating hormonal, heat, and environmental signals. In addition to abundant ABRE (ABA-responsive) and MeJA-responsive motifs—which tether AsHSP20s to abscisic acid and jasmonate pathways (central to drought and defense responses)—we also identified numerous heat shock elements (HSEs) in their promoters, consistent with the pivotal role of heat shock transcription factors (HSFs) in driving HSP expression under temperature stress [48]. For example, overexpression of PeHSFA3 in poplar activates multiple PeHSP20 genes (PeHSP16A, PeHSP22C, PeHSP21-2) during heat stress, enhancing thermotolerance [49], and AcHsfA2–1 in kiwifruit strongly induces AcHsp20-1/2/3 promoters to improve heat resilience [50]. The particularly high density of MeJA motifs in AsHSP20-90, -38, and -93 aligns with their strong induction by methyl jasmonate and with reports that jasmonates prime HSF activity in tomato to boost heat tolerance [51]. Meanwhile, the enrichment of light-responsive elements in AsHSP20-90, -93, and -70 suggests potential diurnal control, possibly synchronizing chaperone accumulation with daily temperature peaks.
Tissue-specific profiling of AsHSP20s highlights both conserved and divergent patterns when compared across species. In geophytes such as Allium cepa [52], small HSP transcripts accumulate at high basal levels in the bulbs even under non-stress conditions, paralleling the strong constitutive expression of AsHSP20s in A. sativum bulbs. Likewise, the elevated AsHSP20 abundance in floral organs echoes the petal-specific induction of sHSP17.5-CI in rose during flower opening [53]. In photosynthetic tissues, AsHSP20-93 shows a leaf-restricted pattern similar to Arabidopsis thaliana sHSP17.6, which localizes to chloroplasts and maintains proteostasis during normal growth [54]. Root-specific expression of AsHSP20-92 likewise mirrors reports in rice, where OsHSP17 family members protect root meristems from soil temperature fluctuations [55]. Intriguingly, a subset of AsHSP20 genes is virtually silent under control conditions—akin to the “inducible reserve” pools described in soybean and Arabidopsis that only activate under severe stress [56]. These latent paralogs may represent untapped resources for engineering stress resilience in specific organs.
Under heat stress (39 °C), AsHSP20-79 transcripts rose sharply and peaking at ~30-fold by 24 h—mirroring the rapid induction of ClHSP20-7 in watermelon (up to 18-fold at 4 h) [57] and several GhHSP20 paralogs in cotton (>10-fold at 3 h) [58]. In response to 200 mM NaCl, AsHSP20-79 exhibited sustained upregulation, comparable to the salt-induced expression of JrsHSP17.3 in walnut (Juglans regia; 7–9-fold) [59] and CaHSP22.0 in pepper (6–8-fold) [60]; conversely, AsHSP20-38 and AsHSP20-20 were repressed by ~2–3-fold after 24 h, reflecting the downregulation of AsHSP17 in creeping bentgrass and MdHsp18.2b in apple calli under prolonged salt exposure [12,61]. Following 100 µM MeJA treatment, AsHSP20-79 and AsHSP20-64 were broadly induced (15–2-fold), akin to the MeJA responsiveness of SlHSP17.7 in tomato (5–10-fold) [51]. Conversely, the observed downregulation of AsHSP20-20 under prolonged stress may be mediated by class B heat shock factors (HSFB1/HSFB2b), which in Arabidopsis have been shown to repress heat inducible HSP genes during extended stress and recovery, thereby preventing hyperactivation of the heat shock response and facilitating homeostatic restoration [62]. By contrast, the broad and sustained upregulation of AsHSP20-79 across heat, salt, and MeJA treatments suggests integration into multiple signaling cascades—possibly mediated by crosstalk between HSFs and jasmonate-responsive transcription factors (e.g., MYC2), as well as stress-activated MAPK modules—that coordinate both abiotic stress responses and defense hormone signaling [63]. These data demonstrate that distinct AsHSP20 members are differentially wired into heat, salt and jasmonate signaling networks, in line with patterns seen across diverse angiosperms.
GO enrichment analysis of AsHSP20s revealed significant overrepresentation of “response to reactive oxygen species” and “response to hydrogen peroxide,” as well as “response to light intensity”, “chloroplast “and “heat acclimation”. These enrichments align with its predicted chloroplast localization and suggest that AsHSP20 limits ROS accumulation [8] and preserves chloroplast function by stabilizing antioxidant enzymes or safeguarding PSII reaction centers [47]. Additionally, AsHSP20 may interact with PTAC5 to maintain or reassemble the PEP transcription complex, ensuring continued expression of plastid-encoded genes under heat stress [64]. In contrast, wheat TaHSPs [65], while sharing core chaperone activities such as protein folding and ATP binding with AsHSP20, display a broad subcellular distribution—including cytosol, mitochondria, endoplasmic reticulum, and chloroplasts—reflecting wider functional diversity. AsHSP20’s specialization in chloroplast protection thus underscores its species- and organelle-specific role within the HSP20 family.
Because stable genetic transformation of A. sativum is technically challenging and time-consuming, we used Saccharomyces cerevisiae as a preliminary eukaryotic system for functional screening. Overexpression of AsHSP20-79 in yeast conferred a clear growth advantage at 37–39 °C compared with empty-vector controls, paralleling results with CI-subfamily HSP20s from low-altitude Rhododendron species, which also enhanced yeast thermotolerance when overexpressed [42]. Mechanistically, the protein’s α-crystallin domain mediates oligomerization into large complexes that rapidly sequester unfolding intermediates, thereby preventing irreversible aggregation. In cooperation with the HSP70 and HSP40 machinery, it also refolds substrate proteins to sustain proteome integrity [66]. Promoter dissection revealed multiple heat shock elements (HSEs), indicating likely HSF-driven induction in planta, and emerging evidence points to modulation of sHSP activity by ROS and Ca2+ signaling during stress [67]. Together, these results provide preliminary evidence that AsHSP20-79 acts as a positive regulator of cellular heat tolerance in eukaryotes and highlight its potential for engineering thermotolerance in crops.
In conclusion, this study provides the first comprehensive genomic and functional framework for the HSP20 family in garlic, detailing its remarkable expansion, structural innovations, diversified regulatory landscapes, and pivotal roles in stress adaptation. Future work should leverage CRISPR/Cas9-mediated mutagenesis and promoter swapping to dissect in planta functions of key paralogs, as well as employ proteomics to identify endogenous client proteins. Ultimately, these insights pave the way for molecular breeding of garlic cultivars with enhanced environmental robustness, addressing the pressing need for resilient crops in a warming world.

5. Conclusions

This study presents the first comprehensive survey of the HSP20 family in garlic, identifying 114 AsHSP20 genes and uncovering remarkable diversity in their gene structures, subcellular localizations, promoter architectures and expression patterns. Evidence from phylogenetic, motif and synteny analyses indicates that the family has undergone extensive tandem and segmental duplications, driving evolutionary expansion and functional divergence. Tissue-specific and stress-inducible expression profiling—together with qRT–PCR validation and heterologous assays of AsHSP20-79—demonstrates that these genes are rapidly and robustly regulated by heat, salt and methyl jasmonate treatments, and that AsHSP20-79 in particular confers thermotolerance in yeast. Collectively, these findings illuminate compartment-specific chaperone roles and promoter-mediated regulatory mechanisms by which HSP20s enhance abiotic stress resilience in garlic. The gene catalog and functional insights generated here lay a solid foundation for dissecting HSP20-driven regulatory networks and for harnessing key family members in future molecular breeding efforts aimed at improving garlic stress tolerance.

Supplementary Materials

The following supporting information can be downloaded at: https://www.mdpi.com/article/10.3390/biology14101326/s1, Table S1: List of the primers used in the study. Table S2: List of Conserved Motifs and Corresponding Sequences in AsHSP20s. Table S3: Ka and Ks values of highlight homologous gene pairs of HSP20 gene family in A. sativum. Table S4: Gene ontology (GO) annotation analysis of AsHSP20s.

Author Contributions

Conceptualization, Methodology, Investigation, Formal analysis, Software, Writing—original draft—N.L.; Conceptualization, Visualization, Methodology, Formal analysis, Writing—review and editing—B.H.; Conceptualization, Funding acquisition, Project administration, Supervision, Data curation, Writing—review and editing, Writing—original draft—Z.C. All authors have read and agreed to the published version of the manuscript.

Funding

This research received no external funding.

Institutional Review Board Statement

Ethical review and approval were not required for this study, as it involved only the analysis of publicly available data from the NCBI database and did not involve human participants or animals.

Informed Consent Statement

Informed consent was not applicable to this study, as no human participants were involved and all data analyzed were obtained from publicly available databases.

Data Availability Statement

Data will be made available on request.

Conflicts of Interest

The authors declare that they have no known competing financial interests or personal relationships that could have appeared to influence the work reported in this paper.

References

  1. Wang, Y.-X.; Xu, J.-H. The heat shock transcription factors regulate response mechanisms to abiotic stresses in plants. Crop Des. 2025, 4, 100109. [Google Scholar] [CrossRef]
  2. Zahra, N.; Hafeez, M.B.; Ghaffar, A.; Kausar, A.; Zeidi, M.A.; Siddique, K.H.M.; Farooq, M. Plant photosynthesis under heat stress: Effects and management. Environ. Exp. Bot. 2023, 206, 105178. [Google Scholar] [CrossRef]
  3. Molinier, J.; Ries, G.; Zipfel, C.; Hohn, B. Transgeneration memory of stress in plants. Nature 2006, 442, 1046–1049. [Google Scholar] [CrossRef]
  4. Tian, F.; Hu, X.-L.; Yao, T.; Yang, X.; Chen, J.-G.; Lu, M.-Z.; Zhang, J. Recent Advances in the Roles of HSFs and HSPs in Heat Stress Response in Woody Plants. Front. Plant Sci. 2021, 12, 704905. [Google Scholar] [CrossRef]
  5. Naaz, S.; Pande, A.; Laxmi, A. Nitric oxide-mediated thermomemory: A new perspective on plant heat stress resilience. Front. Plant Sci. 2025, 16, 1525336. [Google Scholar] [CrossRef]
  6. Staacke, T.; Mueller-Roeber, B.; Balazadeh, S. Stress resilience in plants: The complex interplay between heat stress memory and resetting. New Phytol. 2025, 245, 2402–2421. [Google Scholar] [CrossRef] [PubMed]
  7. Farnsworth, P.; Kamalendra, S. Structure function relationship among α-crystallin related small heat shock proteins. Exp. Eye Res. 2004, 79, 787–794. [Google Scholar] [CrossRef]
  8. Wang, W.; Vinocur, B.; Shoseyov, O.; Altman, A. Role of Plant heat-shock Proteins and Molecular Chaperones in the Abiotic Stress Response. Trends Plant Sci. 2004, 9, 244–252. [Google Scholar] [CrossRef]
  9. Sarkar, N.K.; Kim, Y.-K.; Grover, A. Rice sHsp genes: Genomic organization and expression profiling under stress and development. BMC Genom. 2009, 10, 393. [Google Scholar] [CrossRef]
  10. Van Montfort, R.; Slingsby, C.; Vierling, E. Structure and function of the small heat shock protein/α-crystallin family of molecular chaperones. Adv. Protein Chem. 2001, 105–156. [Google Scholar] [CrossRef]
  11. Tan, G.-F.; Wang, Z.; Li, M.; Wang, G.-L.; Jiang, Q.; Xiong, A.-S. De novo assembly and transcriptome characterization: Novel insights into the temperature stress in Cryptotaenia japonica Hassk. Acta Physiol. Plant. 2014, 37, 1–12. [Google Scholar] [CrossRef]
  12. Zhang, F.J.; Li, Z.Y.; Zhang, D.E.; Ma, N.; Wang, Y.X.; Zhang, T.T.; Zhao, Q.; Zhang, Z.; You, C.X.; Lu, X.Y. Identification of Hsp20 gene family in Malus domestica and functional characterization of Hsp20 class I gene MdHsp18.2b. Physiol. Plant. 2024, 176, e14288. [Google Scholar] [CrossRef]
  13. Li, N.; Jiang, M.; Li, P.; Li, X. Identification, expression, and functional analysis of Hsf and Hsp20 gene families in Brachypodium distachyon under heat stress. PeerJ 2021, 9, e12267. [Google Scholar] [CrossRef] [PubMed]
  14. Lian, X.; Wang, Q.; Li, T.; Gao, H.; Li, H.; Zheng, X.; Wang, X.; Zhang, H.; Cheng, J.; Wang, W.; et al. Phylogenetic and Transcriptional Analyses of the HSP20 Gene Family in Peach Revealed That PpHSP20-32 Is Involved in Plant Height and Heat Tolerance. Int. J. Mol. Sci. 2022, 23, 10849. [Google Scholar] [CrossRef] [PubMed]
  15. Sun, X.; Zhu, S.; Li, N.; Cheng, Y.; Zhao, J.; Qiao, X.; Lu, L.; Liu, S.; Wang, Y.; Liu, C.; et al. A Chromosome-Level Genome Assembly of Garlic (Allium sativum) Provides Insights into Genome Evolution and Allicin Biosynthesis. Mol. Plant 2020, 13, 1328–1339. [Google Scholar] [CrossRef]
  16. Peška, V.; Mandáková, T.; Ihradská, V.; Fajkus, J. Comparative Dissection of Three Giant Genomes: Allium cepa, Allium sativum, and Allium ursinum. Int. J. Mol. Sci. 2019, 20, 733. [Google Scholar] [CrossRef]
  17. Zhong, L.; Shi, Y.; Xu, S.; Xie, S.; Huang, X.; Li, Y.; Qu, C.; Liu, J.; Liao, J.; Huang, Y.; et al. Heterologous overexpression of heat shock protein 20 genes of different species of yellow Camellia in Arabidopsis thaliana reveals their roles in high calcium resistance. BMC Plant Biol. 2024, 24, 5. [Google Scholar] [CrossRef]
  18. Xue, M.; You, Y.; Zhang, L.; Cao, J.; Xu, M.; Chen, S. ZmHsp18 screened from the ZmHsp20 gene family confers thermotolerance in maize. BMC Plant Biol. 2024, 24, 1048. [Google Scholar] [CrossRef]
  19. Huang, J.; Hai, Z.; Wang, R.; Yu, Y.; Chen, X.; Liang, W.; Wang, H. Genome-wide analysis of HSP20 gene family and expression patterns under heat stress in cucumber (Cucumis sativus L.). Front. Plant Sci. 2022, 13, 968418. [Google Scholar] [CrossRef]
  20. Hao, X.; He, S. Genome-wide identification, classification and expression analysis of the heat shock transcription factor family in Garlic (Allium sativum L.). BMC Plant Biol. 2024, 24, 421. [Google Scholar] [CrossRef]
  21. Yang, P.; Yuan, Y.; Yan, C.; Jia, Y.; You, Q.; Da, L.; Lou, A.; Lv, B.; Zhang, Z.; Liu, Y. AlliumDB: A central portal for comparative and functional genomics in Allium. Hortic. Res. 2024, 11, uhad285. [Google Scholar] [CrossRef]
  22. Reiser, L.; Bakker, E.; Subramaniam, S.; Chen, X.; Sawant, S.; Kartik, K.; Trilok, P.; Berardini, T.Z. The Arabidopsis Information Resource in 2024. Genetics 2024, 227, iyae027. [Google Scholar] [CrossRef] [PubMed]
  23. Finn, R.D.; Clements, J.; Eddy, S.R. HMMER web server: Interactive sequence similarity searching. Nucleic Acids Res. 2011, 39, W29–W37. [Google Scholar] [CrossRef] [PubMed]
  24. Letunic, I.; Khedkar, S.; Bork, P. SMART: Recent updates, new developments and status in 2020. Nucleic Acids Res. 2020, 49, D458–D460. [Google Scholar] [CrossRef] [PubMed]
  25. Wang, J.; Chitsaz, F.; Derbyshire, M.K.; Gonzales, N.R.; Gwadz, M.; Lu, S.; Marchler, G.H.; Song, J.; Thanki, N.; Yamashita, R.A.; et al. The conserved domain database in 2023. Nucleic Acids Res. 2022, 51, D384–D388. [Google Scholar] [CrossRef]
  26. Artimo, P.; Jonnalagedda, M.; Arnold, K.; Baratin, D.; Csardi, G.; de Castro, E.; Duvaud, S.; Flegel, V.; Fortier, A.; Gasteiger, E.; et al. ExPASy: SIB bioinformatics resource portal. Nucleic Acids Res. 2012, 40, W597–W603. [Google Scholar] [CrossRef]
  27. Mistry, J.; Finn, R.D.; Eddy, S.R.; Bateman, A.; Punta, M. Challenges in homology search: HMMER3 and convergent evolution of coiled-coil regions. Nucleic Acids Res. 2013, 41, e121. [Google Scholar] [CrossRef]
  28. Chen, C.; Chen, H.; Zhang, Y.; Thomas, H.R.; Frank, M.H.; He, Y.; Xia, R. TBtools: An Integrative Toolkit Developed for Interactive Analyses of Big Biological Data. Mol. Plant 2020, 13, 1194–1202. [Google Scholar] [CrossRef]
  29. Lescot, M. PlantCARE, a database of plant cis-acting regulatory elements and a portal to tools for in silico analysis of promoter sequences. Nucleic Acids Res. 2002, 30, 325–327. [Google Scholar] [CrossRef]
  30. Huerta-Cepas, J.; Szklarczyk, D.; Heller, D.; Hernández-Plaza, A.; Forslund, S.K.; Cook, H.; Mende, D.R.; Letunic, I.; Rattei, T.; Jensen, L.J.; et al. eggNOG 5.0: A hierarchical, functionally and phylogenetically annotated orthology resource based on 5090 organisms and 2502 viruses. Nucleic Acids Res. 2019, 47, D309–D314. [Google Scholar] [CrossRef]
  31. Ye, J.; Zhang, Y.; Cui, H.; Liu, J.; Wu, Y.; Cheng, Y.; Xu, H.; Huang, X.; Li, S.; Zhou, A.; et al. WEGO 2.0: A web tool for analyzing and plotting GO annotations, 2018 update. Nucleic Acids Res. 2018, 46, W71–W75. [Google Scholar] [CrossRef]
  32. Yang, Q.-Q.; Fan, J.-D.; Liu, C.-Y.; Zhao, Y.-Q.; Xu, Z.-S.; Lu, X.-J.; Ge, J.; Zhang, B.-W.; Li, M.-Q.; Yang, Y.; et al. Physiological and transcriptome analysis of changes in endogenous hormone contents and related synthesis and signaling genes during the heat stress in garlic (Allium sativum L.). BMC Plant Biol. 2025, 25, 1–20. [Google Scholar] [CrossRef]
  33. Wang, G.-L.; Ren, X.-Q.; Liu, J.-X.; Yang, F.; Wang, Y.-P.; Xiong, A.-S. Transcript profiling reveals an important role of cell wall remodeling and hormone signaling under salt stress in garlic. Plant Physiol. Biochem. 2019, 135, 87–98. [Google Scholar] [CrossRef] [PubMed]
  34. Akan, S.; Tuna Gunes, N.; Yanmaz, R. Methyl jasmonate and low temperature can help for keeping some physicochemical quality parameters in garlic (Allium sativum L.) cloves. Food Chem. 2019, 270, 546–553. [Google Scholar] [CrossRef] [PubMed]
  35. Wang, G.; Tian, C.; Wang, Y.; Wan, F.; Hu, L.; Xiong, A.; Tian, J. Selection of reliable reference genes for quantitative RT-PCR in garlic under salt stress. PeerJ 2019, 7, e7319. [Google Scholar] [CrossRef] [PubMed]
  36. Livak, K.J.; Schmittgen, T.D. Analysis of Relative Gene Expression Data Using Real-Time Quantitative PCR and the 2−ΔΔCT Method. Methods 2001, 25, 402–408. [Google Scholar] [CrossRef]
  37. Yang, W.; Zhou, C.; Guo, Y.; Niu, S.; El-Kassaby, Y.A.; Li, W. Genome-wide identification of the Pinus tabuliformis CONSTANS-like gene family and their potential roles in reproductive cone development. Int. J. Biol. Macromol. 2024, 254, 127621. [Google Scholar] [CrossRef]
  38. Mani, N.; Ramakrishna, K.; Kaza, S. Characterization of rice small heat shock proteins targeted to different cellular organelles. Cell Stress Chaperones 2015, 20, 451–460. [Google Scholar] [CrossRef]
  39. Zhao, P.; Wang, D.; Wang, R.; Kong, N.; Zhang, C.; Yang, C.; Wu, W.; Ma, H.; Chen, Q. Genome-wide analysis of the potato Hsp20 gene family: Identification, genomic organization and expression profiles in response to heat stress. BMC Genom. 2018, 19, 61. [Google Scholar] [CrossRef]
  40. Blanc, G.; Wolfe, K.H. Widespread Paleopolyploidy in Model Plant Species Inferred from Age Distributions of Duplicate Genes. Plant Cell 2004, 16, 1667–1678. [Google Scholar] [CrossRef]
  41. Hanada, K.; Zou, C.; Lehti-Shiu, M.D.; Shinozaki, K.; Shiu, S.-H. Importance of Lineage-Specific Expansion of Plant Tandem Duplicates in the Adaptive Response to Environmental Stimuli. Plant Physiol. 2008, 148, 993–1003. [Google Scholar] [CrossRef] [PubMed]
  42. Zhang, X.-M.; Cao, Y.-Q.; Liu, M.-X.; Liu, B.; Zhou, H.; Xia, Y.-P.; Wang, X.-Y. Phylogenetic and expression analysis of HSP20 gene family in Rhododendron species of different altitudes. Int. J. Biol. Macromol. 2025, 309, 143125. [Google Scholar] [CrossRef] [PubMed]
  43. Fang, P.; Long, X.; Kav, N.N.V.; Fang, Y.; Qin, Y.; Yang, J.; Xiao, X. The Hexokinases HbHXK2 and 4 Are Key Enzymes Involved in Glucose Metabolism and Contribute to Rubber Productivity in Hevea Brasiliensis (para Rubber tree). Ind. Crops Prod. 2020, 159, 113025. [Google Scholar] [CrossRef]
  44. Liu, Y.; Gao, Z.; Liang, C.; Wei, Y.; Li, Y.; Zhang, Y.; Zhang, Y. Genome-Wide Analysis of the Aspartate Aminotransferase Family in Brassica Rapa and the Role of BraASP1 in Response to Nitrogen Starvation. Int. J. Mol. Sci. 2025, 26, 1586. [Google Scholar] [CrossRef]
  45. Jeffares, D.C.; Penkett, C.J.; Bähler, J. Rapidly regulated genes are intron poor. Trends Genet 2008, 24, 375–378. [Google Scholar] [CrossRef]
  46. Lee, G.J.; Vierling, E. A Small Heat Shock Protein Cooperates with Heat Shock Protein 70 Systems to Reactivate a Heat-Denatured Protein. Plant Physiol. 2000, 122, 189–198. [Google Scholar] [CrossRef]
  47. Neta-Sharir, I.; Isaacson, T.; Lurie, S.; Weiss, D. Dual Role for Tomato Heat Shock Protein 21: Protecting Photosystem II from Oxidative Stress and Promoting Color Changes during Fruit Maturation. Plant Cell 2005, 17, 1829–1838. [Google Scholar] [CrossRef]
  48. Jacob, P.; Hirt, H.; Bendahmane, A. The heat-shock protein/chaperone network and multiple stress resistance. Plant Biotechnol. J. 2017, 15, 405–414. [Google Scholar] [CrossRef]
  49. Ren, S.-x.; Zou, H.-l.; Cui, J.-w.; Shen, N.; Bao, H.-y.; Gan, Q.; Wang, L.; Lu, Z.-g.; Jin, B. PeHSFA3 is essential for the heat-stress response of Populus × euramericana. Ind. Crops Prod. 2024, 219, 119054. [Google Scholar] [CrossRef]
  50. Shen, R.-J.; Xing, M.-Y.; Wang, W.-Q.; Su, W.-Y.; Zhu, J.-Z.; Li, K.-F.; Zhang, Y.; Allan, A.C.; Grierson, D.; Yin, X.-R.; et al. Over-expression of heat shock factor AcHsfA2-1 upregulates transcripts of multiple genes and enhances heat tolerance of kiwifruit plants. Environ. Exp. Bot. 2023, 207, 105196. [Google Scholar] [CrossRef]
  51. Ding, C.-K.; Wang, C.Y.; Gross, K.C.; Smith, D.L. Reduction of chilling injury and transcript accumulation of heat shock proteins in tomato fruit by methyl jasmonate and methyl salicylate. Plant Sci. 2001, 161, 1153–1159. [Google Scholar] [CrossRef]
  52. Galsurker, O.; Doron-Faigenboim, A.; Teper-Bamnolker, P.; Daus, A.; Lers, A.; Eshel, D. Differential response to heat stress in outer and inner onion bulb scales. J. Exp. Bot. 2018, 69, 4047–4064. [Google Scholar] [CrossRef]
  53. Dafny-Yelin, M.; Tzfira, T.; Vainstein, A.; Adam, Z. Non-redundant functions of sHSP-CIs in acquired thermotolerance and their role in early seed development in Arabidopsis. Plant Mol. Biol. 2008, 67, 363–373. [Google Scholar] [CrossRef]
  54. Waters, E.R.; Vierling, E. Plant small heat shock proteins—Evolutionary and functional diversity. New Phytol. 2020, 227, 24–37. [Google Scholar] [CrossRef]
  55. Wang, A.; Yu, X.; Mao, Y.; Liu, Y.; Liu, G.; Liu, Y.; Niu, X. Overexpression of a small heat-shock-protein gene enhances tolerance to abiotic stresses in rice. Plant Breed. 2015, 134, 384–393. [Google Scholar] [CrossRef]
  56. Wu, J.; Gao, T.; Hu, J.; Zhao, L.; Yu, C.; Ma, F. Research advances in function and regulation mechanisms of plant small heat shock proteins (sHSPs) under environmental stresses. Sci. Total Environ. 2022, 825, 154054. [Google Scholar] [CrossRef]
  57. He, Y.; Yao, Y.; Li, L.; Li, Y.; Gao, J.; Fan, M. A heat-shock 20 protein isolated from watermelon (ClHSP22.8) negatively regulates the response of Arabidopsis to salt stress via multiple signaling pathways. PeerJ 2021, 9, e10524. [Google Scholar] [CrossRef]
  58. Ma, W.; Zhao, T.; Li, J.; Liu, B.; Fang, L.; Hu, Y.; Zhang, T. Identification and characterization of the GhHsp20 gene family in Gossypium hirsutum. Sci. Rep. 2016, 6, 32517. [Google Scholar] [CrossRef]
  59. Zhai, M.; Sun, Y.; Jia, C.; Peng, S.; Liu, Z.; Yang, G. Over-expression of JrsHSP17.3 gene from Juglans regia confer the tolerance to abnormal temperature and NaCl stresses. J. Plant Biol. 2016, 59, 549–558. [Google Scholar] [CrossRef]
  60. Sun, J.-T.; Cheng, G.-X.; Huang, L.-J.; Liu, S.; Ali, M.; Khan, A.; Yu, Q.-H.; Yang, S.-B.; Luo, D.-X.; Gong, Z.-H. Modified expression of a heat shock protein gene, CaHSP22.0, results in high sensitivity to heat and salt stress in pepper (Capsicum annuum L.). Sci. Hortic. 2019, 249, 364–373. [Google Scholar] [CrossRef]
  61. Sun, X.; Sun, C.; Li, Z.; Hu, Q.; Han, L.; Luo, H. AsHSP17, a creeping bentgrass small heat shock protein modulates plant photosynthesis and ABA-dependent and independent signalling to attenuate plant response to abiotic stress. Plant Cell Environ. 2016, 39, 1320–1337. [Google Scholar] [CrossRef]
  62. Ikeda, M.; Mitsuda, N.; Ohme-Takagi, M. Arabidopsis HsfB1 and HsfB2b Act as Repressors of the Expression of Heat-Inducible Hsfs But Positively Regulate the Acquired Thermotolerance. Plant Physiol. 2011, 157, 1243–1254. [Google Scholar] [CrossRef] [PubMed]
  63. Song, C.; Cao, Y.; Dai, J.; Li, G.; Muhammad Aamir, M.; Chen, C.; Deng, H. The Multifaceted Roles of MYC2 in Plants: Toward Transcriptional Reprogramming and Stress Tolerance by Jasmonate Signaling. Front. Plant Sci. 2022, 13. [Google Scholar] [CrossRef]
  64. Zhong, L.; Zhou, W.; Wang, H.; Ding, S.; Lu, Q.; Wen, X.; Peng, L.; Zhang, L.; Lu, C. Chloroplast Small Heat Shock Protein HSP21 Interacts with Plastid Nucleoid Protein pTAC5 and Is Essential for Chloroplast Development in Arabidopsis under Heat Stress. Plant Cell 2013, 25, 2925–2943. [Google Scholar] [CrossRef] [PubMed]
  65. Kumar, A.; Sharma, S.; Chunduri, V.; Kaur, A.; Kaur, S.; Malhotra, N.; Kumar, A.; Kapoor, P.; Kumari, A.; Kaur, J.; et al. Genome-wide Identification and Characterization of Heat Shock Protein Family Reveals Role in Development and Stress Conditions in Triticum aestivum L. Sci Rep. 2020, 10, 7858. [Google Scholar] [CrossRef] [PubMed]
  66. Mogk, A.; Schlieker, C.; Friedrich, K.L.; Schönfeld, H.-J.; Vierling, E.; Bukau, B. Refolding of substrates bound to small Hsps relies on a disaggregation reaction mediated most efficiently by ClpB/DnaK. J. Biol. Chem. 2003, 278, 31033–31042. [Google Scholar] [CrossRef]
  67. Kang, X.; Zhao, L.; Liu, X. Calcium signaling and the response to heat shock in crop plants. Int. J. Mol. Sci. 2023, 25, 324. [Google Scholar] [CrossRef]
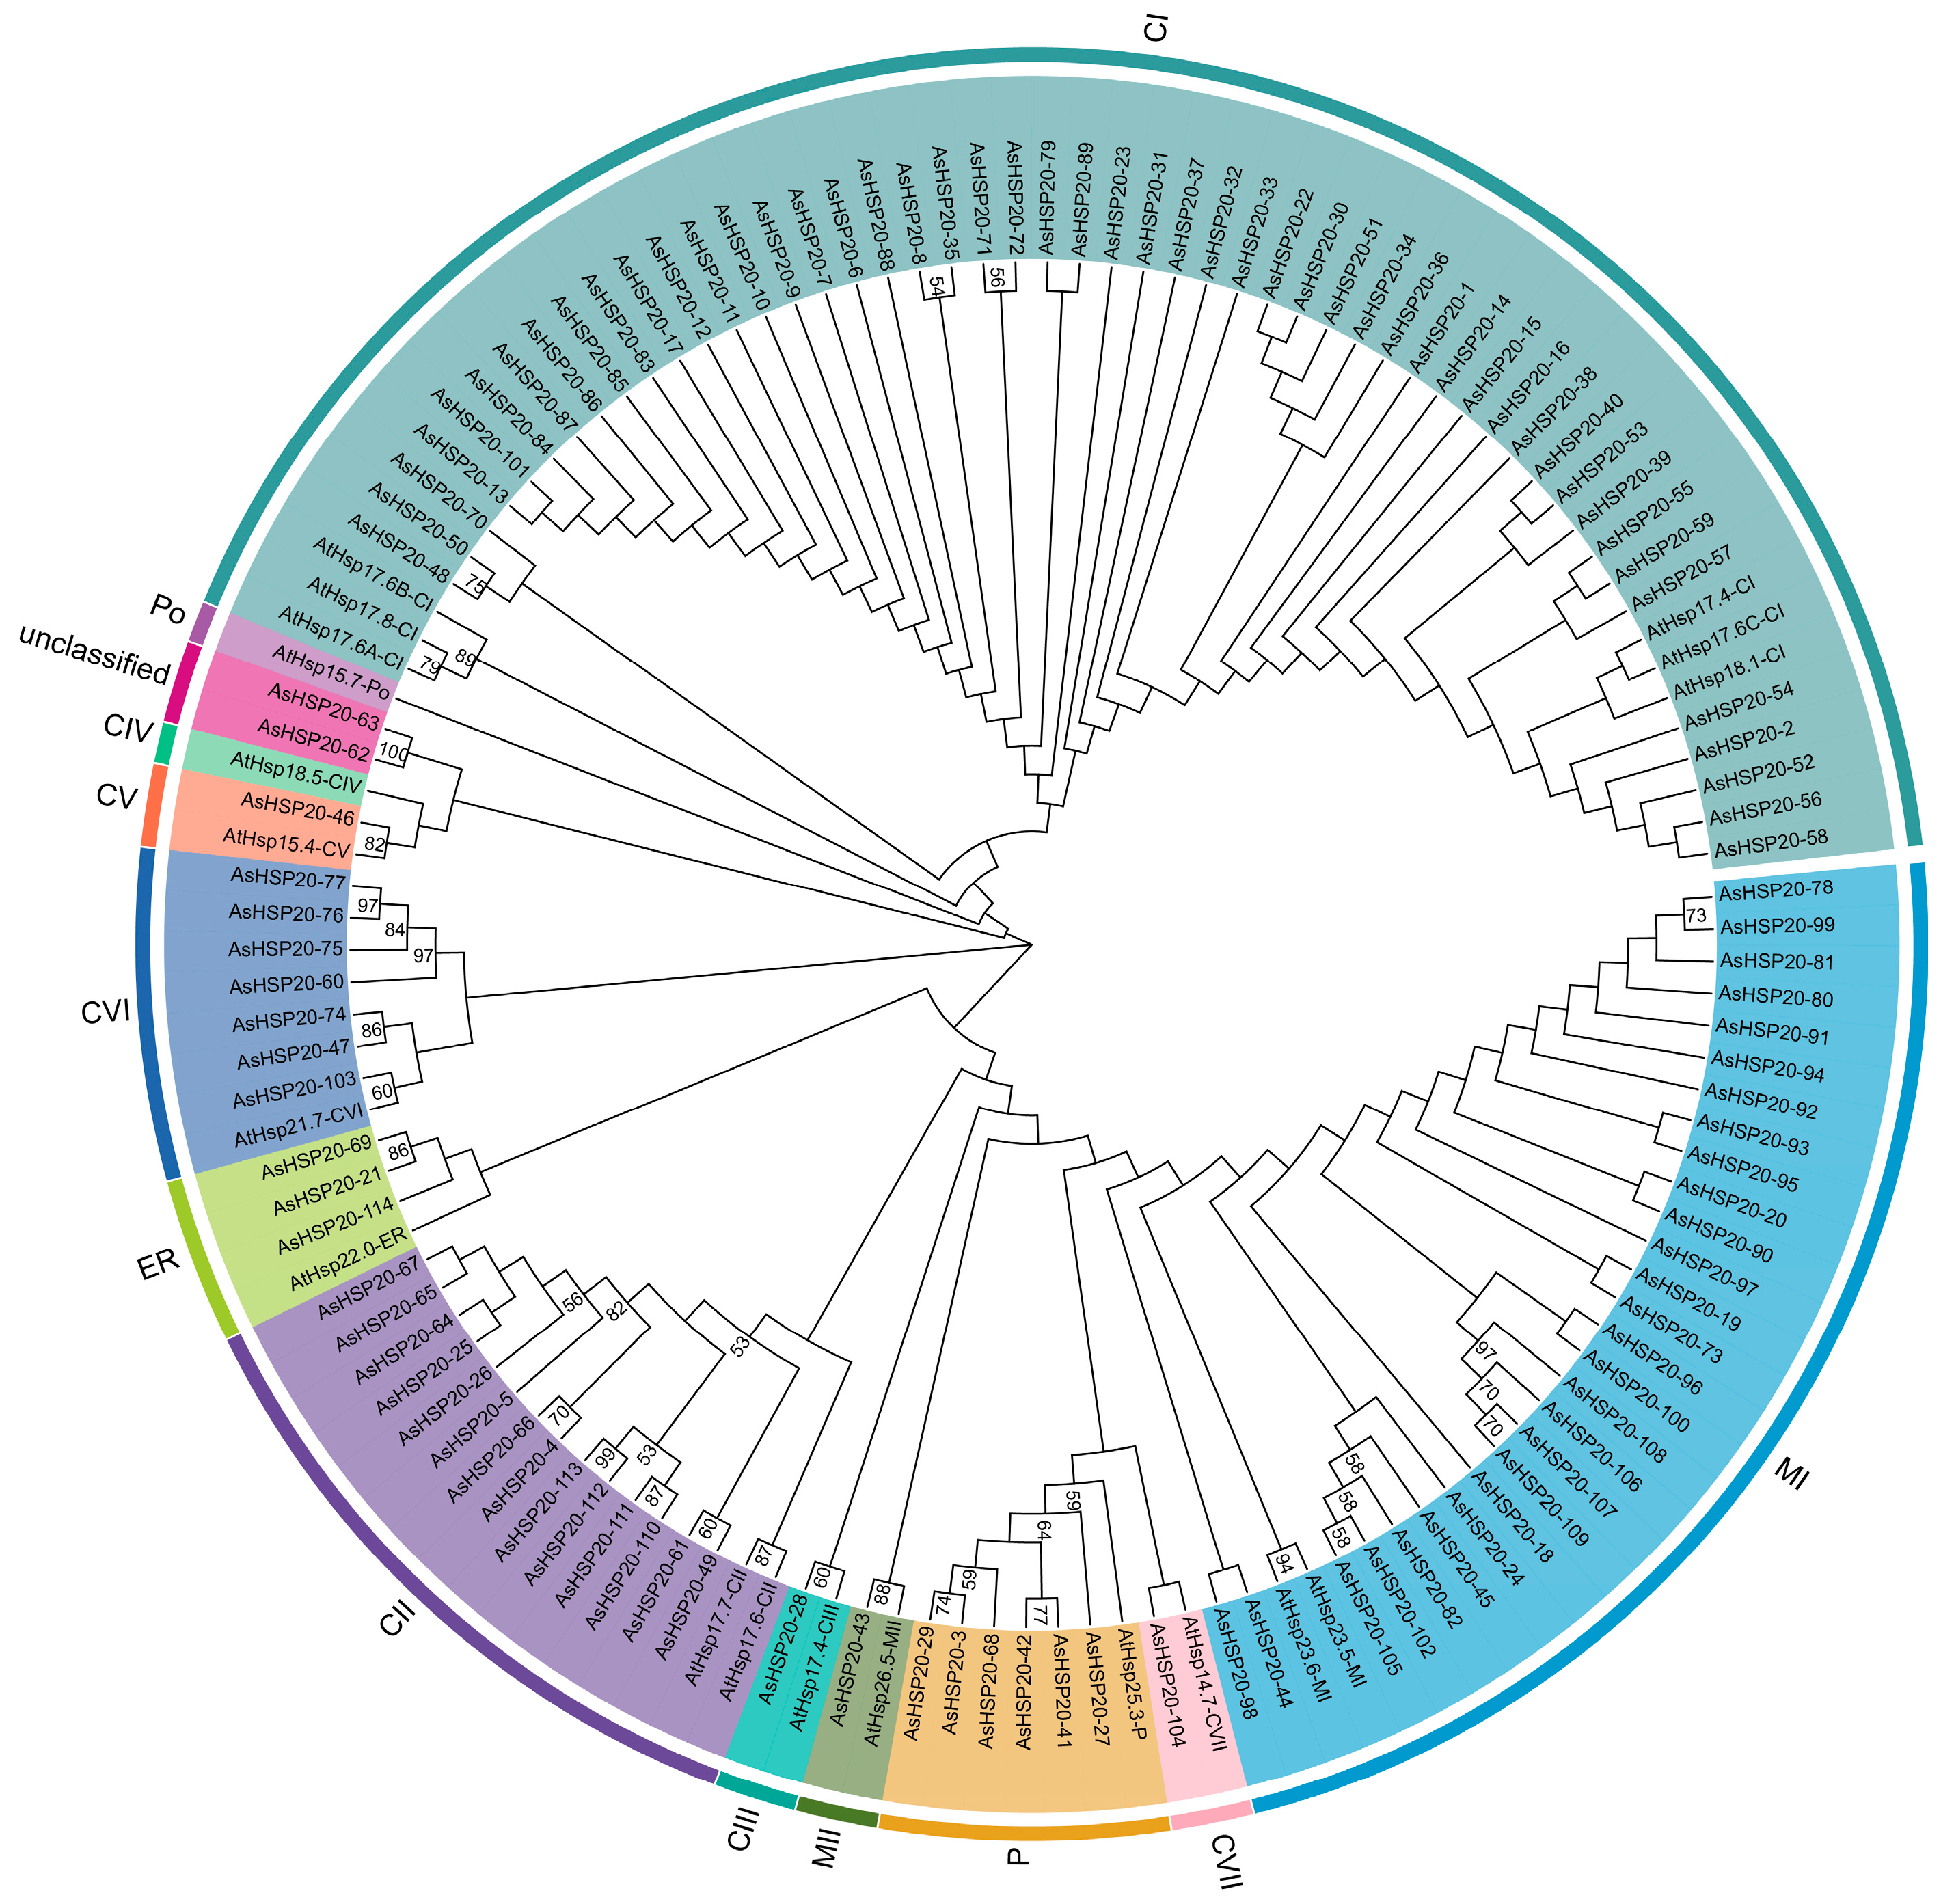
Figure 1. Phylogenetic analysis of the HSP20 gene family in A. sativum. An unrooted neighbor-joining tree was constructed in MEGA X using the full-length amino acid sequences of 114 AsHSP20 proteins, the Poisson substitution model and pairwise deletion of gaps. Bootstrap values from 1000 replicates (shown at nodes) ≥ 50% are indicated. Based on sequence homology, the AsHSP20 proteins cluster into 10 subfamilies (CI–CIII, CV–CVII, MI, MII, ER, P) plus an unclassified group, each marked by a distinct colored arc. The scale bar represents 0.1 amino acid substitutions per site.
Biology 14 01326 g001
Figure 2. Conserved motif composition, domain architecture and gene structure of the AsHSP20 family. AsHSP20 genes are ordered according to their phylogenetic relationships in Figure 1. (A) Distribution of ten conserved motifs in AsHSP20 proteins as identified by MEME. Each colored box (motifs 1–10) corresponds to a unique amino acid signature; lengths of proteins are depicted to scale (scale bar at bottom, in amino acids). (B) Domain composition of AsHSP20 proteins based on Pfam annotation. Green boxes denote the HSP20 α-crystallin domain; other colors indicate ancillary domains (Hexokinase_2, AAT_I, Borrelia_P83). Unannotated regions are shown as light gray bars. Protein lengths are shown to scale. (C) Exon–intron organization of AsHSP20 genes. Solid green boxes represent coding sequences (CDS), and thin black lines indicate introns; 5′ and 3′untranslated regions were omitted for clarity. Gene lengths (including introns) are drawn to scale (scale at bottom, in base pairs).
Biology 14 01326 g002
Figure 3. Chromosomal distribution of the AsHSP20 gene family in A. sativum. The genomic positions of AsHSP20 genes are mapped onto unanchored scaffolds (left) and the eight assembled garlic chromosomes (chr1–chr8; (right)). Scaffold IDs are shown adjacent to each scaffold, and individual AsHSP20 genes are labelled at their approximate physical locations. A scale bar (in megabases) on the left indicates physical distance.
Biology 14 01326 g003
Figure 4. Genome wide segmental duplication and interspecies synteny of the AsHSP20 gene family in A. sativum. (A) Circos plot depicting intraspecies segmental duplication events among AsHSP20 genes. The outer ring represents the eight chromosomes of A. sativum; red ribbons link duplicated AsHSP20 gene pairs, while gray ribbons show background genome wide collinear regions. (B) Synteny analysis among A. sativum (As, orange), A. cepa (Ac, blue) and A. fistulosum (Af, pink). Colored blocks around the circle denote individual chromosomes; ribbons indicate homologous gene pairs, with red lines marking As–Ac syntenic links and green lines marking As–Af syntenic links.
Biology 14 01326 g004
Figure 5. Cis-regulatory element composition in the promoter regions of AsHSP20 genes. Promoter sequences (2 kb upstream of the translation start site) of each AsHSP20 gene were analyzed using the PlantCARE database. The adjacent phylogenetic tree (left) clusters AsHSP20 proteins as in Figure 1. The heatmap grid shows the number of occurrences of each cis-element in individual promoters. Cis-acting elements were classified based on functional categories and represented using distinct colors: hormone responsive elements (purple), light responsive elements (yellow), and stress responsive elements (blue).
Biology 14 01326 g005
Figure 6. Tissue-specific expression profiles of AsHSP20 genes in A. sativum. A circular heatmap illustrates the relative transcript abundance of 114 AsHSP20 family members across six tissues: bulbs, leaves, pseudostems, garlic sprouts, roots and flowers. Genes are ordered by hierarchical clustering based on their expression patterns across these tissues (inner dendrogram), grouping members with similar profiles. Concentric rings from inside to outside represent expression in bulbs, leaves, pseudostems, garlic sprouts, roots and flowers, respectively. Transcript levels (FPKM) were log2-transformed and normalized; the color gradient from green through white to orange denotes low (≤−2), medium (≈0) and high (≥+2) expression.
Biology 14 01326 g006
Figure 7. qRT-PCR analysis of selected AsHSP20 genes in garlic under various stress treatments. Relative transcript levels of AsHSP20s were determined by qRT-PCR and calculated using the 2−ΔΔCt method with AsACTIN as the internal reference. Seedlings were subjected to (A) heat stress (39 °C), (B) salt stress (200 mM NaCl) or (C) methyl jasmonate treatment (100 µM) for 6, 12 and 24 h; “CK”denotes untreated control plants. Data presented as mean; three biological replicates (n = 3), ±= SD of three technical replicates. Asterisks indicate significant differences relative to CK at each time point (One-way analysis of variance (ANOVA) followed by Duncan’s multiple range test: * p < 0.05, ** p < 0.01, *** p < 0.001,**** p < 0.0001; “ns” indicates not significant.
Biology 14 01326 g007
Figure 8. (A) Gene Ontology (GO) enrichment bubble plot of the heat shock protein (HSP) gene family in garlic. The plot displays enriched GO terms across the three main GO categories: Molecular Function, Cellular Component, and Biological Process. The x-axis represents the enrichment score, point color indicates significance level (–log10(p-value), with a gradient from blue to orange showing increasing significance), point shape denotes GO category (■ Molecular Function, ▲ Cellular Component, ● Biological Process), and point size corresponds to the number of genes enriched in each GO term. (B) Protein–protein interaction (PPI) network of selected HSP genes in garlic. Nodes represent individual HSP genes, with node size indicating the degree of connectivity. Edge thickness reflects the strength of interactions between genes. Asa8G05328.1 and Asa7G02113.1 are identified as central nodes with strong interactions with multiple other HSP genes.
Biology 14 01326 g008
Figure 9. Subcellular localization of AsHSP20–GFP fusions in Nicotiana benthamiana leaf epidermal cells. Transiently expressed constructs were imaged for GFP fluorescence (first column), mCherry fluorescence (second column), bright-field (third column) and merged channels (fourth column). In the first row, free GFP co-expressed with the chloroplast marker Chlo-mCherry displays diffuse stromal GFP signal alongside red chloroplast fluorescence. In the second row, AsHSP20-81-GFP co-expressed with Chlo-mCherry yields a yellow merged signal within chloroplasts, indicating plastid targeting. The third row shows free GFP co-expressed with both NLS-mCherry and NES-mCherry markers, confirming dual nuclear and cytoplasmic distribution. In the fourth row, AsHSP20-94-GFP co-expressed with NLS- and NES-mCherry similarly localizes to both the nucleus and cytoplasm. The fifth row presents free GFP co-expressed with NLS-mCherry alone, demonstrating exclusive nuclear red fluorescence of the marker. Finally, in the sixth row, AsHSP20-11-GFP co-expressed with NLS-mCherry produces a yellow merged signal confined to the nucleus, revealing predominant nuclear localization of the fusion protein. Scale bars = 20 μm.
Biology 14 01326 g009
Figure 10. Heterologous expression of AsHSP20-79 enhances thermotolerance in yeast. Saccharomyces cerevisiae INVSc1 cells carrying the empty vector pYES2 or the AsHSP20-79 expression construct (pYES2-AsHSP20-79) were grown in SD-Ura medium to mid-log phase (OD600 ≈ 0.8). (A) Ten-fold serial dilutions (100–10−5) were spotted onto SD-Ura agar and incubated at 30, 35, 37, 39 and 41 °C for 72 h. (B) Growth kinetics at 30 °C and (C) at 39 °C were monitored by measuring OD600 at 0, 8, 16, 24, 32, 40 and 48 h. Data are presented as mean ± SD of three independent experiments, demonstrating that AsHSP20-79 expression significantly improves yeast survival and growth under elevated temperatures.
Biology 14 01326 g010
Table 1. The characteristics of the AsHSP20 gene family.
No.NameSequence IDNumber of
Amino Acid
Molecular WeightTheoretical pIInstability
Index
Aliphatic
Index
Grand Average
of Hydropathicity
Subcellular
Localization
1AsHSP20-1Asa0G00144.115918,139.535.5856.3169.25−0.695Cytoplasm
2AsHSP20-2Asa0G00606.115818,067.535.8450.6674.62−0.687Cytoplasm
3AsHSP20-3Asa0G01177.125128,755.79.5350.4683.9−0.514Chloroplast
4AsHSP20-4Asa0G01213.115717,658.255.7935.1875.16−0.597Cytoplasm
5AsHSP20-5Asa0G01214.116418,416.186.1933.5870.73−0.699Cytoplasm
6AsHSP20-6Asa0G01290.115818,040.55.8449.9171.52−0.732Cytoplasm
7AsHSP20-7Asa0G01291.115918,154.525.5652.4271.07−0.751Cytoplasm
8AsHSP20-8Asa0G01440.115818,056.55.8352.4370.89−0.748Cytoplasm
9AsHSP20-9Asa0G01441.114316,504.75.7856.8368.18−0.685Cytoplasm
10AsHSP20-10Asa0G01442.115918,127.545.8252.9571.07−0.736Cytoplasm
11AsHSP20-11Asa0G01443.120323,184.115.6138.0164.33−0.897Nucleus
12AsHSP20-12Asa0G02746.115817,999.455.8349.9171.52−0.715Cytoplasm
13AsHSP20-13Asa0G02962.115818,084.515.5851.9170.89−0.749Cytoplasm
14AsHSP20-14Asa0G04879.115918,061.435.4350.4567.99−0.713Cytoplasm
15AsHSP20-15Asa0G04881.115918,121.545.4350.5167.99−0.699Cytoplasm
16AsHSP20-16Asa0G04883.125528,913.755.0251.0181.76−0.54Cytoplasm
17AsHSP20-17Asa0G05708.115117,233.366.3351.5361.99−0.845Cytoplasm
18AsHSP20-18Asa1G00674.124126,723.784.9850.14102.7−0.014Mitochondria
19AsHSP20-19Asa1G00690.117619,328.195.837.689.83−0.241Chloroplast
20AsHSP20-20Asa1G00698.120623,916.619.4746.5883.74−0.582Cytoplasm
21AsHSP20-21Asa1G00886.130935,742.268.8340.3765.05−1.144Cytoplasm
22AsHSP20-22Asa1G02085.126529,746.89.2247.8771.7−0.528Chloroplast
23AsHSP20-23Asa1G03670.115117,129.225.0649.266.49−0.784Cytoplasm
24AsHSP20-24Asa2G01049.116418,497.865.1549.6973.78−0.564Peroxisome
25AsHSP20-25Asa2G03191.113315,090.125.7435.370.45−0.614Cytoplasm
26AsHSP20-26Asa2G03812.115717,651.225.5932.8774.52−0.616Cytoplasm
27AsHSP20-27Asa2G07035.113015,223.415.3848.2874.85−0.793Cytoplasm
28AsHSP20-28Asa2G07089.116017,709.245.7644.1283.31−0.458Nucleus
29AsHSP20-29Asa2G07141.113715,715.829.1735.2966.13−1.131Nucleus
30AsHSP20-30Asa3G01343.115818,151.615.9942.9572.78−0.749Cytoplasm
31AsHSP20-31Asa3G01354.115818,062.455.8243.7273.35−0.709Cytoplasm
32AsHSP20-32Asa3G01355.115818,058.426.1946.9570.89−0.777Cytoplasm
33AsHSP20-33Asa3G01357.121124,285.485.7748.4775.78−0.626Extracellular
34AsHSP20-34Asa3G01358.115818,130.545.8241.9370.32−0.779Cytoplasm
35AsHSP20-35Asa3G02930.115818,198.665.8357.4371.52−0.78Cytoplasm
36AsHSP20-36Asa3G05026.115917,964.385.5750.6367.99−0.673Cytoplasm
37AsHSP20-37Asa3G05028.123627,183.159.5449.5171.4−0.795Cytoplasm
38AsHSP20-38Asa3G05030.124027,130.255.145.7665.38−0.873Cytoplasm
39AsHSP20-39Asa3G05031.116018,020.385.8347.7267.56−0.703Cytoplasm
40AsHSP20-40Asa3G05032.115918,163.595.5955.1167.99−0.734Cytoplasm
41AsHSP20-41Asa3G05113.113315,672.915.0939.2768.8−0.793Cytoplasm
42AsHSP20-42Asa3G05114.122525,733.829.4248.2574.53−0.644Chloroplast
43AsHSP20-43Asa4G00429.113515,283.215.1343.584.37−0.597Chloroplast
44AsHSP20-44Asa4G02369.127631,962.669.0748.8678.01−0.519Nucleus
45AsHSP20-45Asa4G03225.121123,503.476.6656.5980−0.665Chloroplast
46AsHSP20-46Asa4G03797.114516,458.889.955.2784.69−0.51Cytoplasm
47AsHSP20-47Asa4G04043.119221,970.199.1146.2182.71−0.66Cytoplasm
48AsHSP20-48Asa4G04292.117419,748.485.649.4780.57−0.444Cytoplasm
49AsHSP20-49Asa4G04294.115016,984.375.5536.9679.2−0.593Cytoplasm
50AsHSP20-50Asa4G04295.116718,884.465.2143.3478.14−0.432Cytoplasm
51AsHSP20-51Asa4G04310.114516,369.665.8246.674−0.61Chloroplast
52AsHSP20-52Asa4G04540.115818,022.455.8453.8273.99−0.712Cytoplasm
53AsHSP20-53Asa4G04541.115818,042.555.7344.3373.35−0.632Cytoplasm
54AsHSP20-54Asa4G04542.115817,977.455.5846.3277.66−0.637Cytoplasm
55AsHSP20-55Asa4G04543.115817,868.25.5755.6574.62−0.653Cytoplasm
56AsHSP20-56Asa4G04545.115817,999.375.449.0573.99−0.7Cytoplasm
57AsHSP20-57Asa4G04549.115818,024.425.8452.1774.62−0.694Cytoplasm
58AsHSP20-58Asa4G04550.115918,168.525.5755.4868.62−0.716Cytoplasm
59AsHSP20-59Asa4G04555.113715,729.835.5651.0773.94−0.711Cytoplasm
60AsHSP20-60Asa4G06279.116118,106.776.8440.7287.14−0.313Cytoplasm
61AsHSP20-61Asa4G06421.114416,262.565.5445.5677.08−0.632Cytoplasm
62AsHSP20-62Asa4G06481.116318,743.398.7542.6766.81−0.696Cytoplasm
63AsHSP20-63Asa4G06617.116318,743.398.7542.6766.81−0.696Cytoplasm
64AsHSP20-64Asa5G00107.115717,684.295.7934.774.52−0.619Cytoplasm
65AsHSP20-65Asa5G00109.115717,714.325.5235.1874.52−0.596Cytoplasm
66AsHSP20-66Asa5G00110.115717,658.255.7935.1875.16−0.597Cytoplasm
67AsHSP20-67Asa5G00111.114416,457.799.9572.5659.51−1.116Chloroplast
68AsHSP20-68Asa5G00687.123126,254.388.756.5375.06−0.615Chloroplast
69AsHSP20-69Asa5G01992.136441,148.267.7431.0161.46−1.069Mitochondria
70AsHSP20-70Asa5G03263.115818,139.66.7744.2170.19−0.739Cytoplasm
71AsHSP20-71Asa5G03264.120223,326.286.2752.1862.67−1.052Chloroplast
72AsHSP20-72Asa5G03265.116118,468.976.248.0368.32−0.775Cytoplasm
73AsHSP20-73Asa5G05424.115418,137.426.7650.4781.04−0.899Cytoplasm
74AsHSP20-74Asa5G05661.115718,014.736.2150.1886.24−0.657Cytoplasm
75AsHSP20-75Asa6G00868.117519,933.256.6634.1394.69−0.399Extracellular
76AsHSP20-76Asa6G00869.118320,814.256.3635.8292.68−0.374Chloroplast
77AsHSP20-77Asa6G00885.118320,809.216.3637.5794.26−0.38Chloroplast
78AsHSP20-78Asa6G01385.114215,912.538.5636.17102.39−0.342Mitochondria
79AsHSP20-79Asa6G02013.115818,175.65.8451.3666.58−0.782Cytoplasm
80AsHSP20-80Asa6G02870.120122,824.076.7744.8281.59−0.53Chloroplast
81AsHSP20-81Asa6G03303.121123,694.789.4344.3875.5−0.55Chloroplast
82AsHSP20-82Asa6G04489.121123,446.466.6756.2279.53−0.631Chloroplast
83AsHSP20-83Asa6G04532.115818,026.485.8349.3771.52−0.732Cytoplasm
84AsHSP20-84Asa6G04534.115117,129.425.5651.4775.5−0.756Cytoplasm
85AsHSP20-85Asa6G05099.115818,070.595.8348.0472.72−0.696Cytoplasm
86AsHSP20-86Asa6G05100.115817,972.395.8250.4570.89−0.699Cytoplasm
87AsHSP20-87Asa6G05101.115818,098.585.8353.2770.89−0.775Cytoplasm
88AsHSP20-88Asa6G05102.115818,022.495.8452.3570.89−0.74Cytoplasm
89AsHSP20-89Asa6G05713.122325,172.888.4247.4586.05−0.396Mitochondria
90AsHSP20-90Asa6G06028.121123,594.819.3251.0374.45−0.654Chloroplast
91AsHSP20-91Asa6G06030.120522,974.095.8537.5672.93−0.497Chloroplast
92AsHSP20-92Asa6G06033.120923,406.586.7751.3277.08−0.554Chloroplast
93AsHSP20-93Asa6G06784.121023,730.916.8644.2778.57−0.548Chloroplast
94AsHSP20-94Asa6G06852.126429,904.885.7441.8180.61−0.528Cytoplasm
95AsHSP20-95Asa6G06861.132035,578.353.9751.854.94−1.213Chloroplast
96AsHSP20-96Asa6G06867.118821,325.276.7843.2986.06−0.621Cytoplasm
97AsHSP20-97Asa6G06873.125928,998.918.4648.981.74−0.464Cytoplasm
98AsHSP20-98Asa6G06874.119322,206.229.0442.2777.77−0.791Chloroplast
99AsHSP20-99Asa6G06974.118220,251.137.7144.4492.2−0.394Chloroplast
100AsHSP20-100Asa6G07048.125128,187.725.6640.8277.69−0.563Chloroplast
101AsHSP20-101Asa7G02785.119421,729.868.9842.3381.44−0.582Cytoplasm
102AsHSP20-102Asa7G05180.121523,979.157.7753.9476.23−0.601Chloroplast
103AsHSP20-103Asa7G05384.117920,697.545.2647.476.15−0.578Cytoplasm
104AsHSP20-104Asa7G06920.123526,777.349.1156.9272.17−0.769Chloroplast
105AsHSP20-105Asa8G01375.121523,965.126.6659.2575.77−0.589Chloroplast
106AsHSP20-106Asa8G02037.114216,716.654.9547.3363.1−1.128Cytoplasm
107AsHSP20-107Asa8G02053.118621,194.915.4145.5873.49−0.762Chloroplast
108AsHSP20-108Asa8G02054.118621,078.925.6644.2178.17−0.659Chloroplast
109AsHSP20-109Asa8G02220.114216,716.654.9547.3363.1−1.128Cytoplasm
110AsHSP20-110Asa8G03628.116418,250.026.633.4878.41−0.538Cytoplasm
111AsHSP20-111Asa8G03629.116418,248.056.632.3679.02−0.522Cytoplasm
112AsHSP20-112Asa8G03632.115817,662.336.5335.3275.13−0.63Cytoplasm
113AsHSP20-113Asa8G03635.115817,648.316.5334.7875.13−0.63Cytoplasm
114AsHSP20-114Asa8G04457.125128,493.489.7535.6160.2−0.941Chloroplast
Disclaimer/Publisher’s Note: The statements, opinions and data contained in all publications are solely those of the individual author(s) and contributor(s) and not of MDPI and/or the editor(s). MDPI and/or the editor(s) disclaim responsibility for any injury to people or property resulting from any ideas, methods, instructions or products referred to in the content.