Article

Blue Light and Temperature Actigraphy Measures Predicting Metabolic Health Are Linked to Melatonin Receptor Polymorphism

1
Department of Biology, Tyumen Medical University, 625023 Tyumen, Russia
2
Laboratory for Chronobiology and Chronomedicine, Research Institute of Biomedicine and Biomedical Technologies, Tyumen Medical University, 625023 Tyumen, Russia
3
Tyumen Cardiology Research Center, Tomsk National Research Medical Center, Russian Academy of Sciences, 634009 Tomsk, Russia
4
Institute of Neurosciences and Medicine, 630117 Novosibirsk, Russia
5
Department Engineering and Architecture, Institute of Building Technology and Energy, Lucerne University of Applied Sciences and Arts, 6048 Horw, Switzerland
6
Laboratory for Genomics, Proteomics, and Metabolomics, Research Institute of Biomedicine and Biomedical Technologies, Medical University, 625023 Tyumen, Russia
7
Laboratory of Genetics, Institute of Biology of the Karelian Science Center, Russian Academy of Sciences, 185910 Petrozavodsk, Russia
8
Department of Biological & Medical Physics UNESCO, Medical University, 625023 Tyumen, Russia
9
Department of Molecular Immunology and Biotechnology, Institute of Physiology of the Federal Research Centre Komi Science Centre, Ural Branch of the Russian Academy of Sciences, 167982 Syktyvkar, Russia
10
Healthcare Institution of Yamalo-Nenets Autonomous Okrug “Tarko-Sale Central District Hospital”, 629850 Urengoy, Russia
11
Institute of Biology/Zoology, Martin Luther University, 06108 Halle-Wittenberg, Germany
12
Department of Integrated Biology and Physiology, University of Minnesota, Minneapolis, MN 55455, USA
*
Author to whom correspondence should be addressed.
Biology 2024, 13(1), 22; https://doi.org/10.3390/biology13010022
Submission received: 15 November 2023 / Revised: 29 December 2023 / Accepted: 29 December 2023 / Published: 30 December 2023

Abstract

:

Simple Summary

We examined the relationship between the circadian rhythms of activity, wrist temperature (wT), blue light exposure (BLE) and sleep with proxies of metabolic health (body mass index (BMI), leptin and cortisol) in Arctic residents during a single week at the spring equinox. We found that nocturnal BLE within a distinct time window is associated with a higher BMI but not with the actigraphy indices of sleep or motor activity. We determined an evening time window of non-overlapping 95% confidence intervals of BLE between groups with BMI < 25 and BMI > 25 kg/m2 between 9:30 p.m. and 0:30 a.m., with a threshold that is less than 1 lx. The area under the curve delineated by nocturnal BLE above recommended reference values represents the novel nocturnal excess index (NEIbl), which was the best actigraphy-based predictor of BMI. A higher BMI was also associated with lower 24 h wT, an association mostly characterizing those carrying the MTNR1B rs10830963 G-allele. In this allele carriers, a higher BMI was also closely related to NEIbl. A higher wake-after-sleep onset (WASO) correlated with higher leptin. Higher cortisol was associated with another novel index, the Daylight Deficit Index of blue light, DDIbl, and with an earlier onset of BLE.

Abstract

This study explores the relationship between the light features of the Arctic spring equinox and circadian rhythms, sleep and metabolic health. Residents (N = 62) provided week-long actigraphy measures, including light exposure, which were related to body mass index (BMI), leptin and cortisol. Lower wrist temperature (wT) and higher evening blue light exposure (BLE), expressed as a novel index, the nocturnal excess index (NEIbl), were the most sensitive actigraphy measures associated with BMI. A higher BMI was linked to nocturnal BLE within distinct time windows. These associations were present specifically in carriers of the MTNR1B rs10830963 G-allele. A larger wake-after-sleep onset (WASO), smaller 24 h amplitude and earlier phase of the activity rhythm were associated with higher leptin. Higher cortisol was associated with an earlier M10 onset of BLE and with our other novel index, the Daylight Deficit Index of blue light, DDIbl. We also found sex-, age- and population-dependent differences in the parametric and non-parametric indices of BLE, wT and physical activity, while there were no differences in any sleep characteristics. Overall, this study determined sensitive actigraphy markers of light exposure and wT predictive of metabolic health and showed that these markers are linked to melatonin receptor polymorphism.

1. Introduction

We dedicate this paper to the memory of our dear colleague, Dr. Konstantin Danilenko, who helped initiate this project but sadly passed away on 18 January 2023.
Light is a pivotal factor in maintaining the alignment of circadian clocks with environmental time cues and adjusting to natural seasonal changes [1,2,3]. The 24 h light–dark cycle provides a major signal strengthening the internal synchronization of circadian processes during consecutive cycles, increasing the circadian amplitude of physiological processes [4,5,6]. The benefits of light for the circadian system and health imperatively depend on the circadian phase and change from the early morning to the late evening hours [1,2,7]. At certain moments, the benefits of daylight fade, and the hazardous effects of light at night (LAN) emerge [7]. This turning point can depend on endogenous factors such as the intrinsic circadian period and habitual sleep phase. It also may depend on chronotype and the availability of sunlight and its timing which varies greatly over the year and most drastically with the seasons at high latitudes. Of note, outdoor light at night correlates with eveningness in adolescents [8], while sufficient daylight during camping advances the circadian phase [9,10].
The Arctic light environment is challenging to the circadian system, health and well-being [11,12,13,14,15,16]. Previous studies also suggested that disruption of the circadian system has an adverse impact on metabolic health [17,18,19,20,21,22,23,24,25,26].
Novel actigraphy wearables [27] allow the collection of objective, continuous 24/7 information not only on circadian and sleep markers, such as motor activity and wrist temperature, but also on light exposure. Some devices include distinct spectral domains [28] of which blue light is of greater interest since intrinsically photosensitive retinal ganglion cells (ipRGCs), also known as melanopsin-expressing retinal ganglion cells (mRGCs), are particularly sensitive to blue light [29,30]. After over twenty years of epidemiological studies, including actigraphy, evidence for an association between body mass index (BMI) and sleep parameters remains elusive [31]. On the other hand, light exposure in terms of its intensity and timing showed a correlation with body weight in adults [32]. Constantino et al. [33] reported an association between more fragmented rhythms of activity and light at night with higher BMI. This study also showed associations between higher urbanization and smaller 24 h amplitude of light exposure with an increased risk of being overweight or obese. In a community-dwelling adult population, a higher BMI was best associated with a smaller relative amplitude (RA) of the rest–activity pattern, an integrative index reflecting higher night activity to lower daytime activity in relation to higher BMI [34]. Similar results showing lower metabolic risks with larger RA were obtained in adolescents [35,36]. Such changes can be modulated by different patterns of light exposure, as physical activity and light exposure are closely related [37]. Indeed, Obayashi et al. found that mean exposure to nighttime light above 3 lux is associated with a higher BMI and waist-to-height ratio [38] and a higher risk of diabetes [39]. Recent work in 552 community-dwelling adults, 63–84 years of age, linked LAN to actigraphic changes—delayed onset of least nocturnal activity and light exposure (as measured by the L5 index: 5 h of least activity/light exposure), lower inter-daily stability and smaller amplitude of activity and light exposure, which were associated with the prevalence of obesity, diabetes and hypertension [40].
Actigraphic studies incorporating the analysis of light exposure in association with BMI or other proxies of metabolic health in Arctic residents are currently lacking. The physiological and circadian effect of light depends on the timing and duration of light exposure. Therefore, we hypothesized that there is a need to introduce a novel relevant index for the assessment of the cumulative effect of nocturnal light excess and to compare it with other actigraphy-derived measures. Our study was performed in nearby locations in the Arctic; all data were collected during the same week within each season.
We included the rs10830963 polymorphism of the melatonin receptor MTNR1B gene since it is associated with metabolic risks and circadian rhythms [41,42,43,44,45,46] and may serve as a connection between circadian disruption due to impaired light signaling and metabolic response [41,46], including the circadian rhythm of temperature [44]. The pineal gland hormone melatonin is a well-documented substance that mediates the influence of outdoor light cues on the inner circadian machinery. Seasonal changes in the length of the dark phase lead to parallel shifts in the duration and timing of the onset of melatonin secretion. Melatonin exerts its effects via its own receptors, MTNR1A and MTNR1B, as well as through receptor-independent mechanisms [15]. Polymorphic variations in the MTNR1B gene have a profound effect on gene expression and protein properties. Associations between the carriage of the MTNR1B rs10830963 minor G-allele and the affected modulation of the metabolic response to melatonin and light were evident in previous studies [42,43,44]. Carriers of the minor G-allele of the MTNR1B rs10830963 snp represent a large part of populations that have elevated fasting glucose and higher risks of metabolic disorders, particularly type 2 diabetes mellitus [41]. They also have changed and prolonged patterns of melatonin secretion [42] that can be related to chronotype [43] or reduced light signaling due to retinal ganglion cell loss [44]. Also, carriers of this polymorphism can gain different effects as an outcome of weight loss programs [47].

2. Materials and Methods

This cross-sectional “Light Arctic” study adhered to the tenets of the Declaration of Helsinki and was approved by the Ethics Committee of Tyumen State Medical University (Protocol No. 101, 13 September 2021). Written informed consent was obtained from all participants.

2.1. Subjects and Data Collection

The “Light Arctic” study, phase 1 spring equinox, was conducted on residential populations of three nearby locations: Salekhard, 66°53′ Latitude North, 66°60′ Longitude East, Aksarka settlement, 66°33′ Latitude North, 67°48′ Longitude East, during 22 March–8 April 2022, and Urengoy town, 65°58′ Latitude North, 76°63′ Longitude East, during 18 March–2 April 2023. Dates were chosen to be as close to the equinox as possible and to avoid covering dates of yearly local celebratory community events. Voluntary participants (N = 156) aged 12 to 59 years were enrolled; 62 (38 representing non-native and 24 native populations) completed the study, providing data of sufficient quality according to the study protocol. All participants (mean age ± SD: 36.24 ± 14.21 years; 82.3% women) had a 5-day work/2-day free weekly schedule; none was engaged in night shift work, crossing more than 2 time zones 3 weeks before the survey or diagnosed with a sleep disorder. Exclusion criteria were severe and/or unstable diseases, including neurodegenerative diseases, history of acute coronary or cerebral blood flow disorders, severe cardiac arrhythmias, arterial hypertension of the third stage or uncontrolled blood pressure, angina pectoris FC III-IV, mental illness, drug and/or alcohol addiction, type I diabetes mellitus, severe thyroid diseases, malignant neoplasms, epilepsy, tuberculosis, taking beta-blockers, acute illness during the last week before examination, pregnancy or breast feeding and children under 3 years of age. All adult participants were office workers and their offspring; 10 participants under 16 years represented residents of the Aksarka Boarding School for natives. Weight (in kilograms) and height (in meters) of study participants were measured using medical height meter and scales at local medical units where participants arrived on the last day of actigraphy (the day of blood sampling). They were used to calculate body mass index (BMI = weight/height2). BMI of 12- to 16-year-olds was adjusted for age and sex for categorization into normal weight/overweight/obesity, as previously recommended [48].

2.2. Actigraphy

All participants completed sleep diaries and provided 7-day actigraphy wearing the ActTrust 2 (Condor Instruments, SP, Brazil) hardware on the non-dominant hand during the second week of the study. Motor activity (Proportional Integrative Mode, PIM), wrist skin temperature (wT), light intensity in lux (LI) and blue light intensity (BLI) in μw/cm2 were measured using ActTrust 2 at 1 min intervals. PIM estimates the area under the rectified analog signal for each epoch and measures movement intensity by summing the deviations from 0 V every 10th of a second [49]. PIM was used since it was shown to provide the highest correlation with polysomnography for sleep characteristics [50]. BLI measured with the RGB (Red Green Blue) sensor of ActTrust 2 has an out-of-range sensitivity with a secondary sensitivity peak at a wavelength of 680 nm [51] that comprises the match to the melanopic sensitivity curve to an otherwise close match between the B sensor (peak sensitivity at 470 nm) and the sensitivity of melanopsin. The mismatch between the B sensor and the melanopic sensitivity curve can be expected to be around 25% [52]. Of note, the spectral sensitivity of non-visual responses might change over time [53]. Parametric indices (MESOR, 24 h amplitude and acrophase) were estimated for PIM, wT and exposure to ambient light and blue light, and non-parametric indices inter-daily stability (IS), intra-daily variability (IV), relative amplitude (RA), circadian function index (CFI), the maximum 10 h period (M10), M10 onset, the least 5 h period (L5) and L5 onset were estimated for PIM and blue light intensity using the ActStudio software (Condor Instruments, São Paulo, Brazil) (https://condorinst.com/en/actstudio-software/ accessed on 15 May 2023). In addition, we calculated our novel indices: blue light Daytime Deficit Index (DDIbl), the area of blue light exposure below the reference curve between 6 a.m. and 8 p.m., and blue light nocturnal excess index (NEIbl), the area of blue light exposure above the reference curve between 8 p.m. and 5 a.m. Reference curves (Supplemental Table S1) considered close to natural gradual changes in blue light exposure were based in part on recent blue light exposure recommendations [7]. The international standard CIE S 026:2018 “CIE System for Metrology of Optical Radiation for ipRGC-Influenced Responses to Light”, defines five spectral weighting functions for the five retinal photoreceptor classes (S-cones, M-cones, L-cones, rods and melanopsin-based photoreception of ipRGCs) [54]. The five α-opic irradiances are expressed in μw/cm2, and the corresponding photometric quantities are the five α-opic equivalent daylight illuminances (“α-opic EDIs”), which are expressed in lux (CIE. S 026/E:2018.). Each α-opic EDI represents the (equivalent) illuminance of the standard illuminant D65 that produces the same α-opic irradiance as the test light. Brown et al. recommend at least 250 lx melanopic EDI (mEDI) (33 μw/cm2) during daytime, no more than 10 lx mEDI (1.33 μw/cm2) three hours before bedtime and less than 1 lx mEDI (0.1 μw/cm2) during sleep. Further details for calculations of DDIbl and NEIbl are provided in Supplementary Table S1.
The following sleep parameters were also calculated using the ActStudio software: bedtime, wake time, time in bed, total sleep time, sleep efficiency, sleep latency and wake after sleep onset (WASO), or minutes awake during the sleep period between sleep time and wake time. Sleep diaries were used to check the data and remove artifacts. Volunteers were also asked to trigger an alarm button at times of going to bed and waking up. Primary analyses of sleep–wake data were performed using the ActStudio software, which applies algorithms based on the method of Cole et al., 1992 [55].

2.3. Biochemical Assessment

After completion of actimetry, all participants provided blood samples, which were collected using a vacutainer from the ulnar vein, in the morning (8:00–9:00), after a 12 h fast. Blood samples were washed with a HydroFlex microplate mixer, Tecan, Grödig, Austria. The biochemical kit Leptin Sandwich ELISA produced by DRG Instruments GmbH (Marburg, Germany) and a set of reagents for quantitative enzyme immunoassay of cortisol in human serum (SteroidIFA-cortisol, St. Petersburg LLC Alkor Bio, St. Petersburg, Russia) were used. All biochemical tests were performed in the certified laboratory of the Tyumen Medical University’s Research Institute of Biomedicine and Biomedical Technologies.

2.4. Genotyping

The same operator, who was not aware of the participant’s characteristics, performed the genotyping. Blood samples were collected via standard protocols from 50 participants. DNA was isolated from patients’ samples using DiaGene DNA Isolation Kit (Dia-M; Moscow, Russia) according to the manufacturer’s instructions. The real-time polymerase chain reaction was performed using iCycler Real Time System with iQ5 Manager software of Bio-Rad Laboratories Inc. (Hercules, CA, USA). Polymorphic gene variants were identified using SNP Screen Kit (Syntol; Moscow, Russia) for MTNR1B rs10830963. In each reaction, two allele-specific hybridizations were used to detect two alleles of the studied polymorphism, independently on two fluorescence channels (ROX and FAM).

2.5. Data and Statistical Analyses

In addition to ActStudio, which provided primary analyses of actigraphy data, original files were used to analyze raw, normalized and log10-transformed data of ambient light exposure, blue light exposure, PIM and wT by ANOVA and cosinor analysis [56]. The software packages Excel, STATISTICA 6 and SPSS 23.0 were used for statistical analyses. ANOVA/MANOVA tests of equality of group means were performed. The Shapiro–Wilk’s W-test was applied to check for normality of distributions. If variables were distributed normally (W-test’s p-value > 0.05), a one-way ANOVA was used. Otherwise, the Mann–Whitney, Kruskal–Wallis and post hoc tests were used. A statistical comparison of correlation strength was performed with the cocor free online software [57]. Linear regression analyses were applied to assess the relationship of actigraphy measures with BMI, leptin and cortisol. Multiple regression analyses with co-factors of sex and population (natives vs. non-natives) and age as continuous variable were added to regression models. The level of statistical significance was set at 5%. Benjamini–Hochberg’s False Discovery Rate correction using an FDR value 0.1 or higher was applied to adjust p-values for multiple testing. R charts were constructed to describe linear associations of light exposure at a given time epoch with BMI and leptin values. Correlation coefficients from linear regression of 48 consecutive 30 min averages of BLE obtained from each participant were used for ANOVA and cosinor analyses to describe the dependence of these r values on time.

3. Results

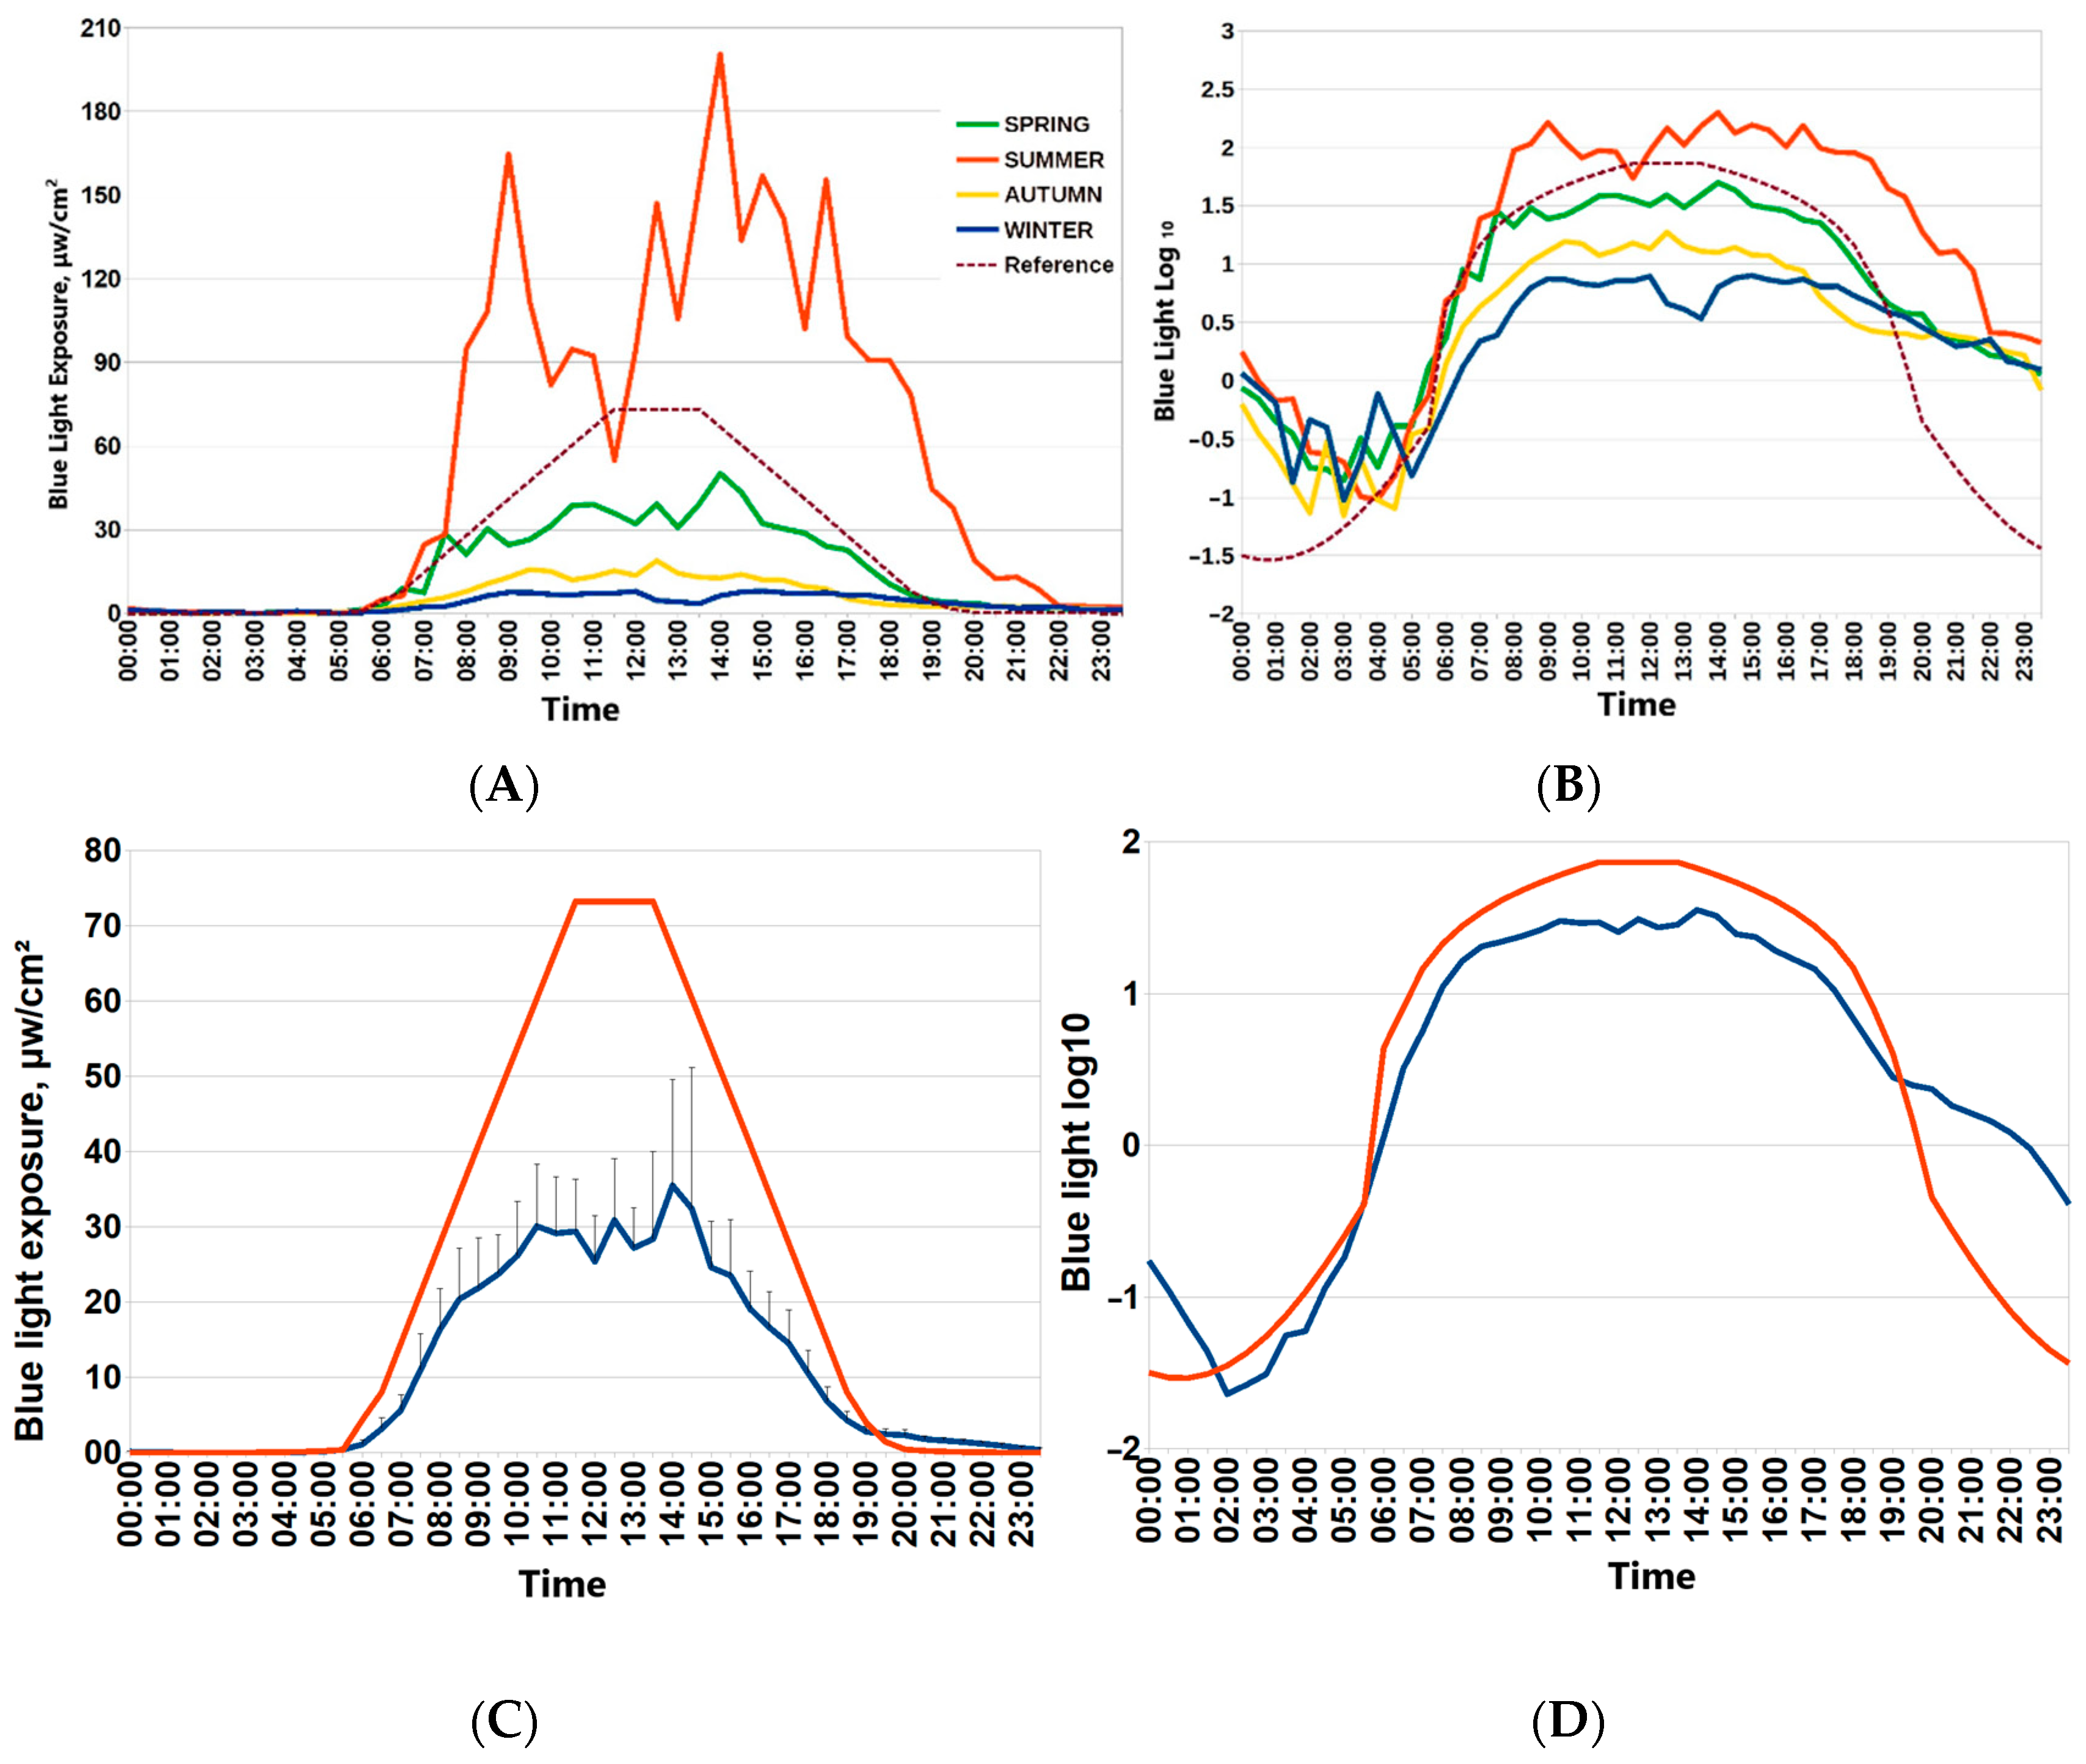
3.1. Seasonal Features of Light Exposure in the Arctic Spring as a Season with the Most Favorable Circadian Light Environment

Participants of the “Light Arctic” study provided seven-day actimetry in each season: during the winter solstice, spring equinox, summer solstice and autumn equinox. For this paper, spring was chosen as a reference point to provide seasonal assessments for associations of the ambient light environment with circadian physiology, sleep and metabolism. Figure 1 depicts 24 h patterns of light exposure during four Arctic seasons (around spring and autumn equinoxes, around polar summer and polar winter). Drastic changes in ambient light exposure are evident. Individual mean values of blue light exposure in consecutive 30 min epochs were used to depict the average 24 h patterns of light exposure in each season. Light exposure around the spring equinox was closest to the recommended reference curve for circadian light hygiene [7] (Figure 1). The lower row of Figure 1 depicts mean values of raw blue light exposure against the reference curve and the optimal light exposure log10-transformed values of blue light exposure for consecutive 30 min epochs.

3.2. General Characteristics of Participants of the Spring Equinox Session

Table 1 provides general characteristics of BMI and age depending on sex, indigeneity and MTNR1B rs10830963 polymorphism for all participants and separately within two age groups. There were no differences for mean age or BMI within each age group (12–16 y or >20 y), between sexes, populations or between carriers and non-carriers of the MTNR1B rs10830963 G-allele. Overall, natives have lower compliance with protocol requirements; 10 out of the 24 natives (41.7%) who completed the study represented the Aksarka Boarding School. Hence, natives’ mean age and BMI were lower overall. All participants of the younger age group were classified as normal-weight after correction for age and sex. They were considered together with lean adults (BMI < 25) in primary statistical analyses before corrections for age, sex and indigeneity were applied.

3.3. Blue Light Nocturnal Excess and Lower Wrist Temperature Predict Body Mass Index

BMI was best predicted by leptin, wrist temperature (wT) MESOR and our novel index, NEIbl. Table 2 shows actigraphy-based associations with BMI in the Arctic residents during the spring equinox. NEIbl and wT MESOR were validated as the best predictors for BMI either after Benjamini–Hochberg’s FDR correction at FDR = 0.1 or in a multiple regression model after correction for the co-factors of age, sex and population.
Multiple regression model and stepwise forward multiple regression analyses confirm that these two actigraphy-based endpoints improve the prediction of BMI after considering age, gender and population as co-factors. In a stepwise forward multiple regression model (r2 = 0.637, p < 0.0001), NEIbl and wT MESOR remained predictors of BMI: leptin (standardized coefficient b = 0.619; p < 0.0001), wT MESOR (b = −0.298; p = 0.001), NEIbl (b = 0.242; p = 0.006) and gender (b = −0.184; p = 0.051).
Figure 2 depicts particular hours when the association between blue light exposure and BMI is statistically significant. Not only are there differences in nocturnal blue light exposure among the three BMI groups, but the association (gauged by the correlation coefficient) also depends on time. The time course of r values between BMI and blue light exposure in successive 30 min epochs over the whole 24 h day can be approximated by a cosine function with an estimated acrophase of 23:34 (11:34 p.m.). Furthermore, we determined an evening time window of non-overlapping 95% confidence intervals of blue light exposure between groups of participants with a BMI <25 or >25, Supplemental Table S2.

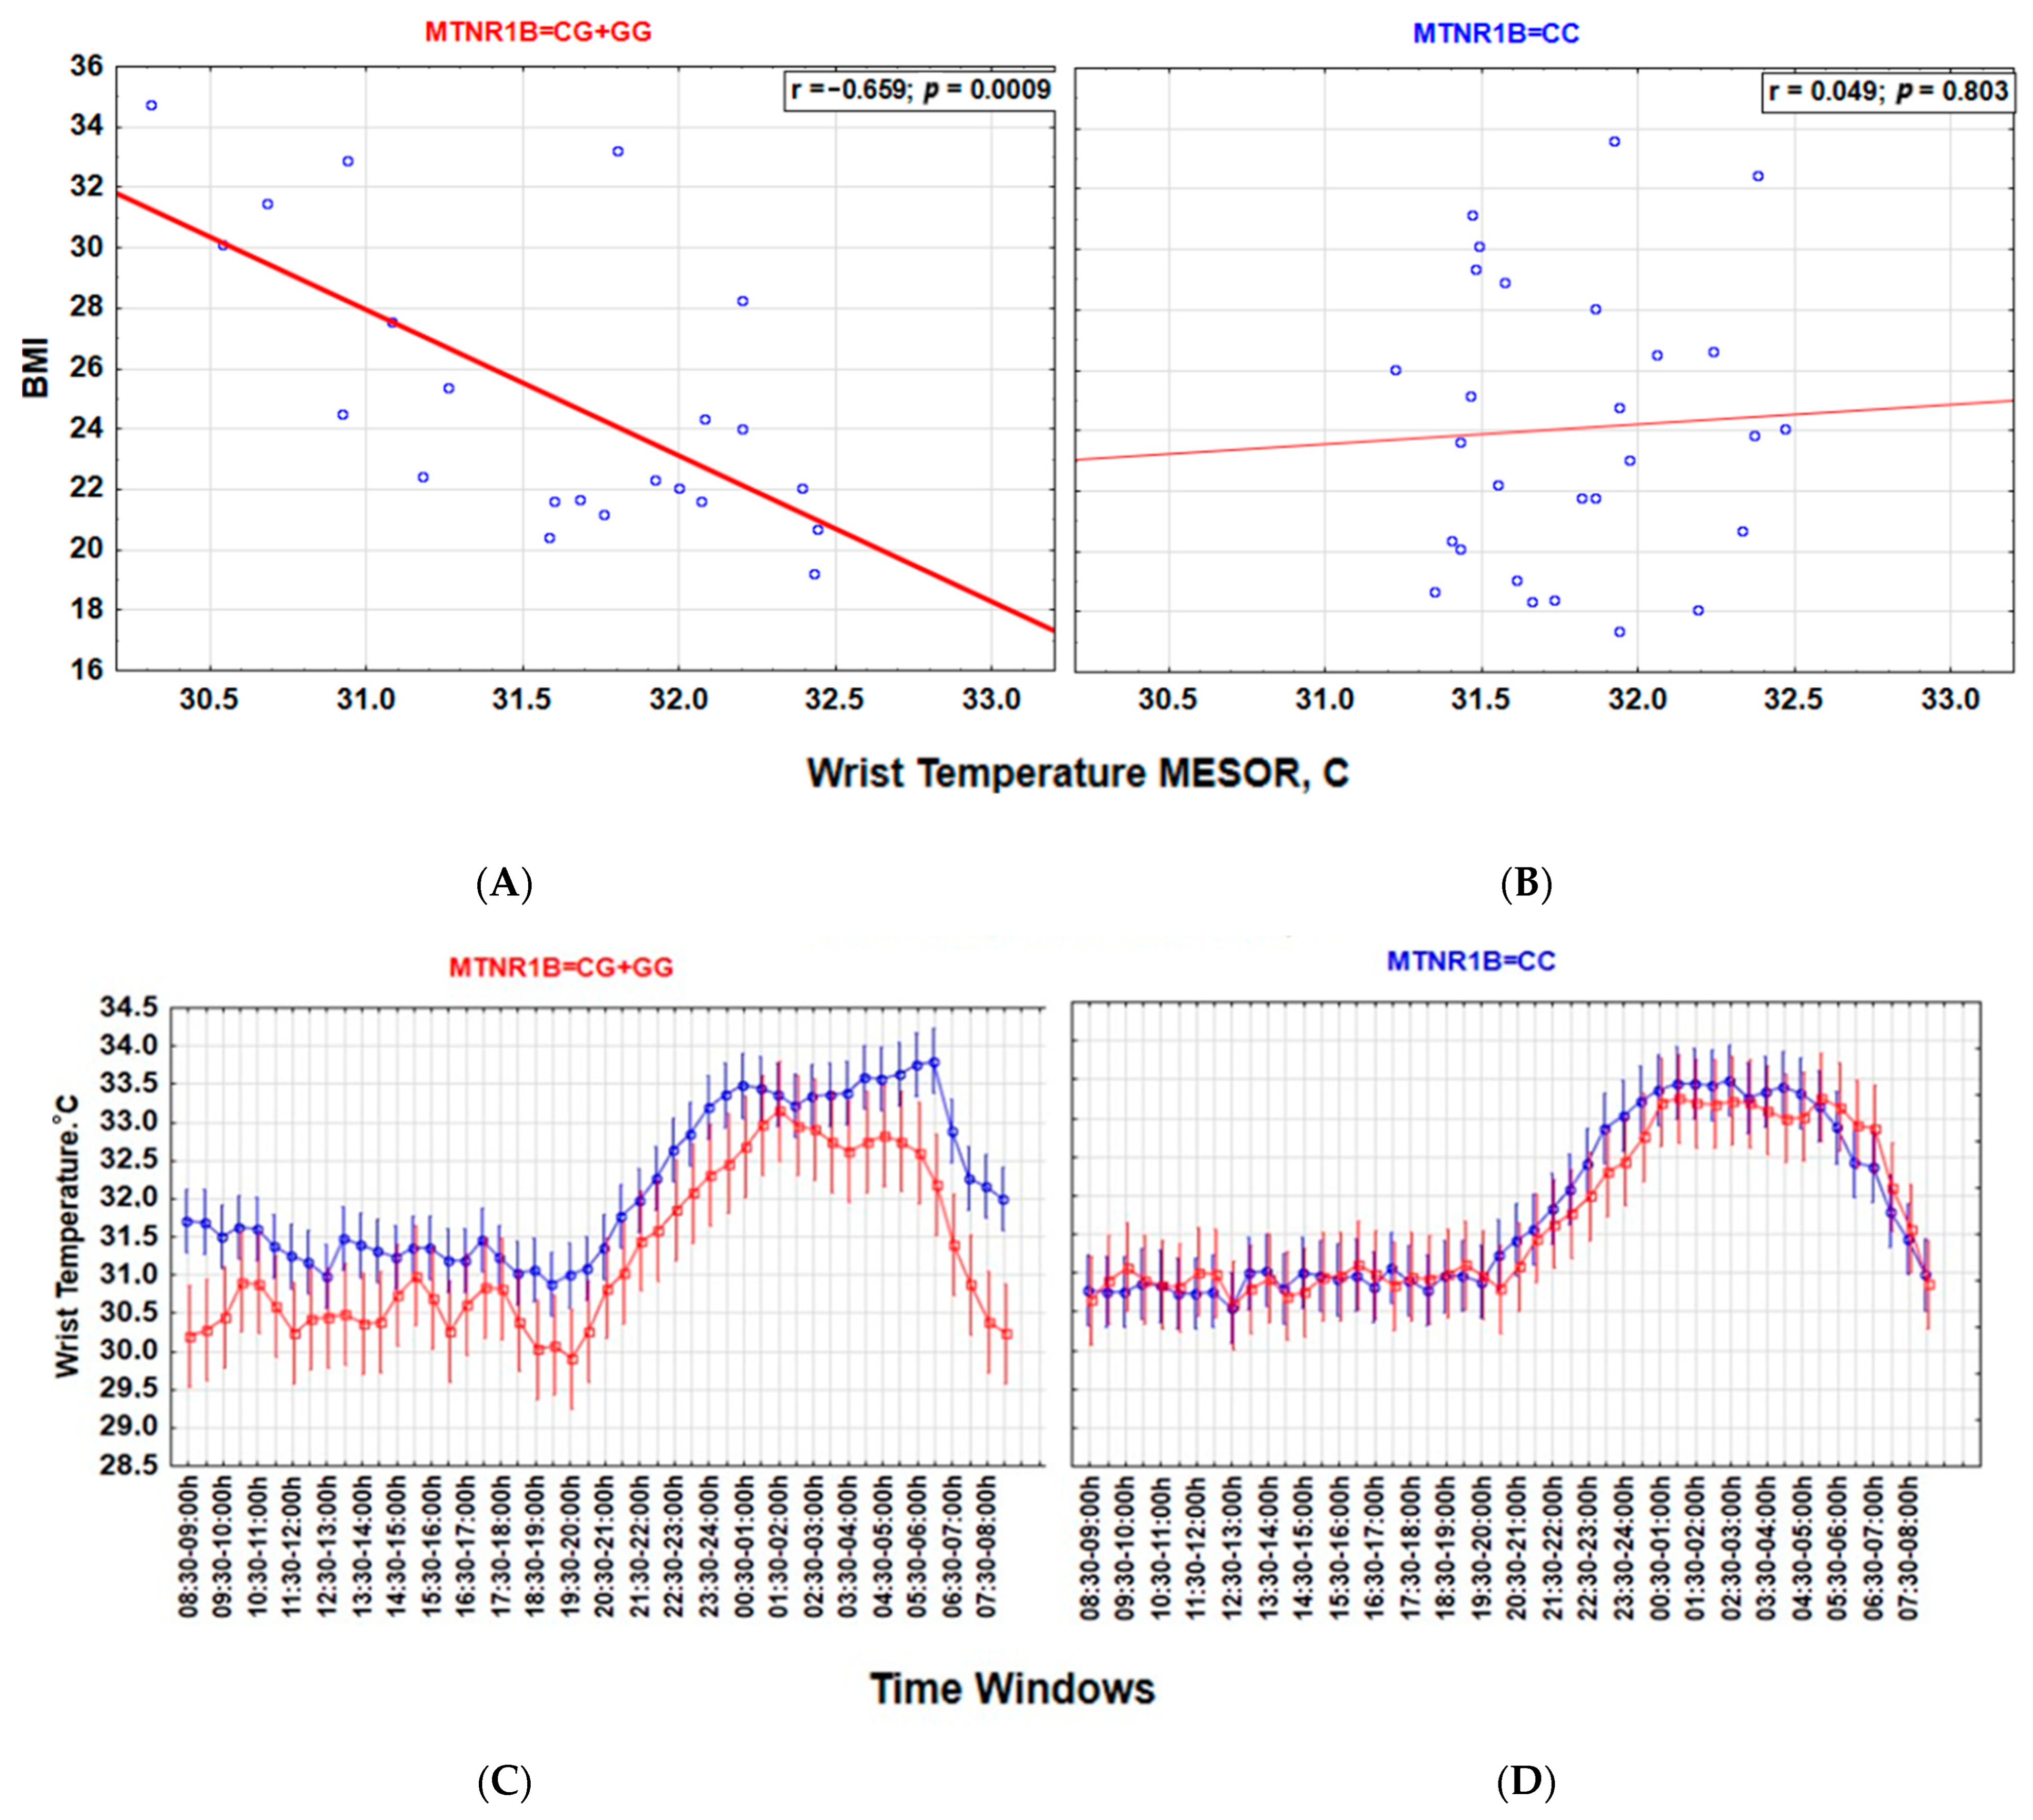
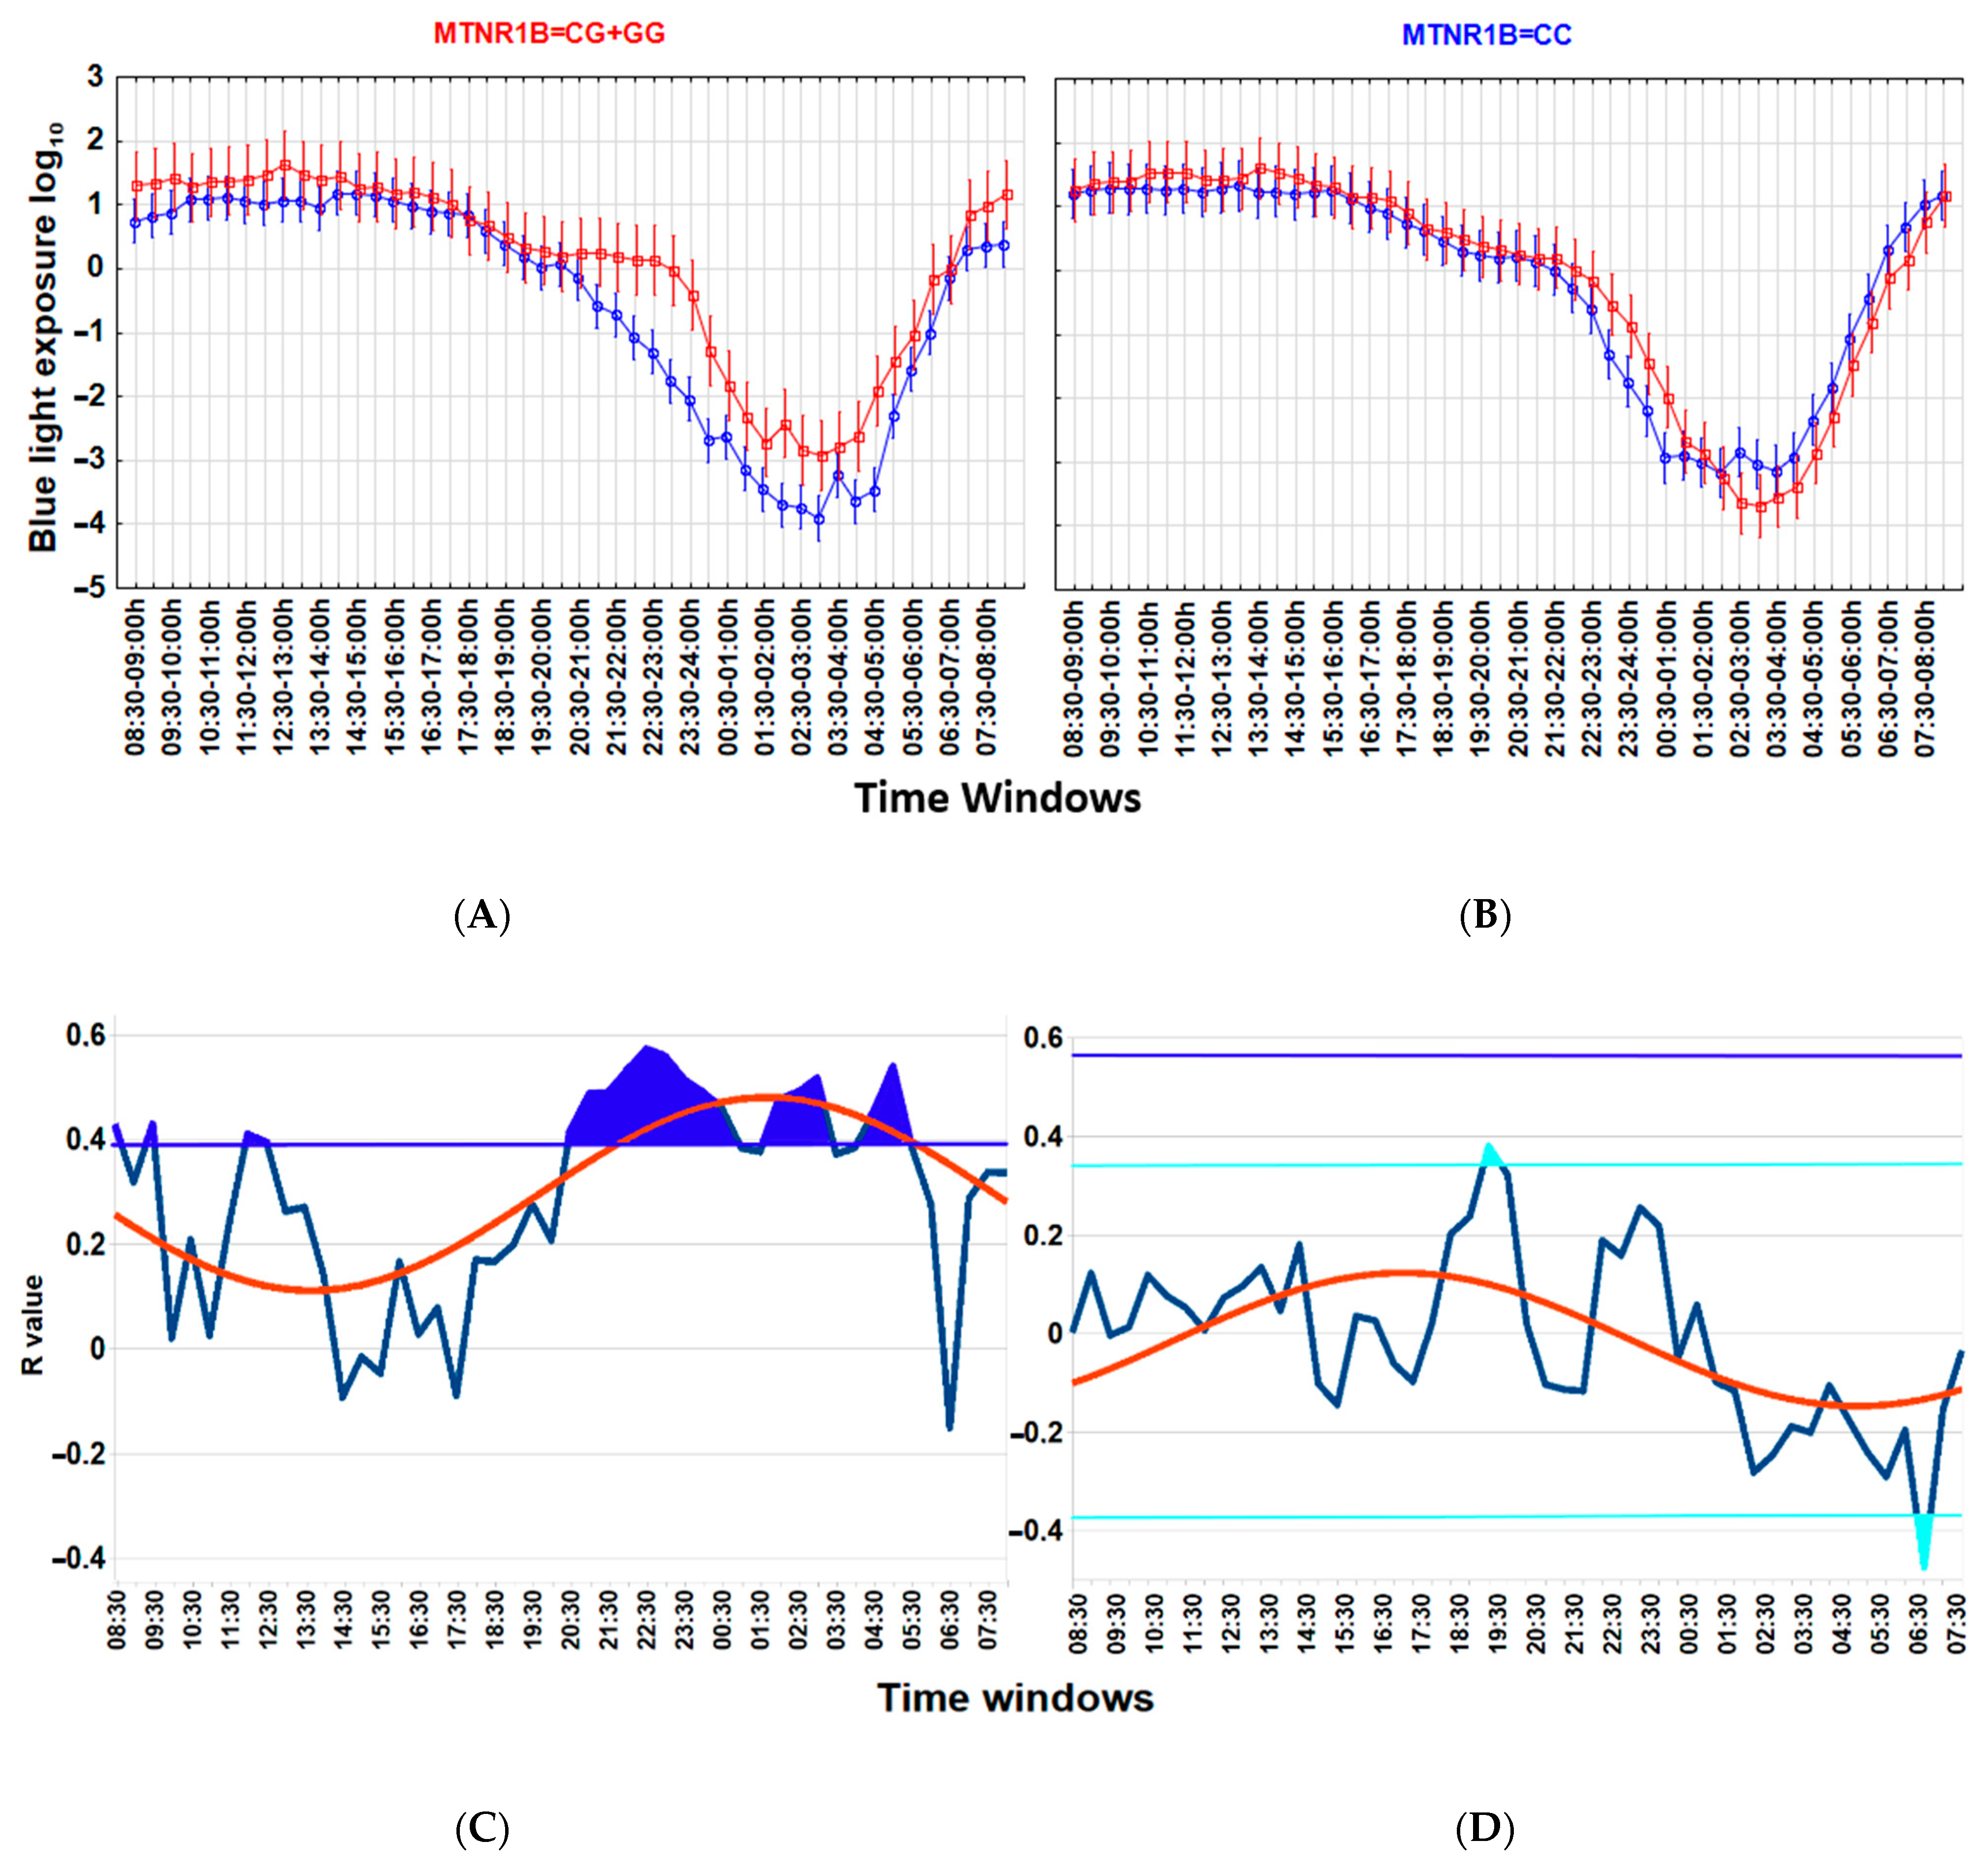
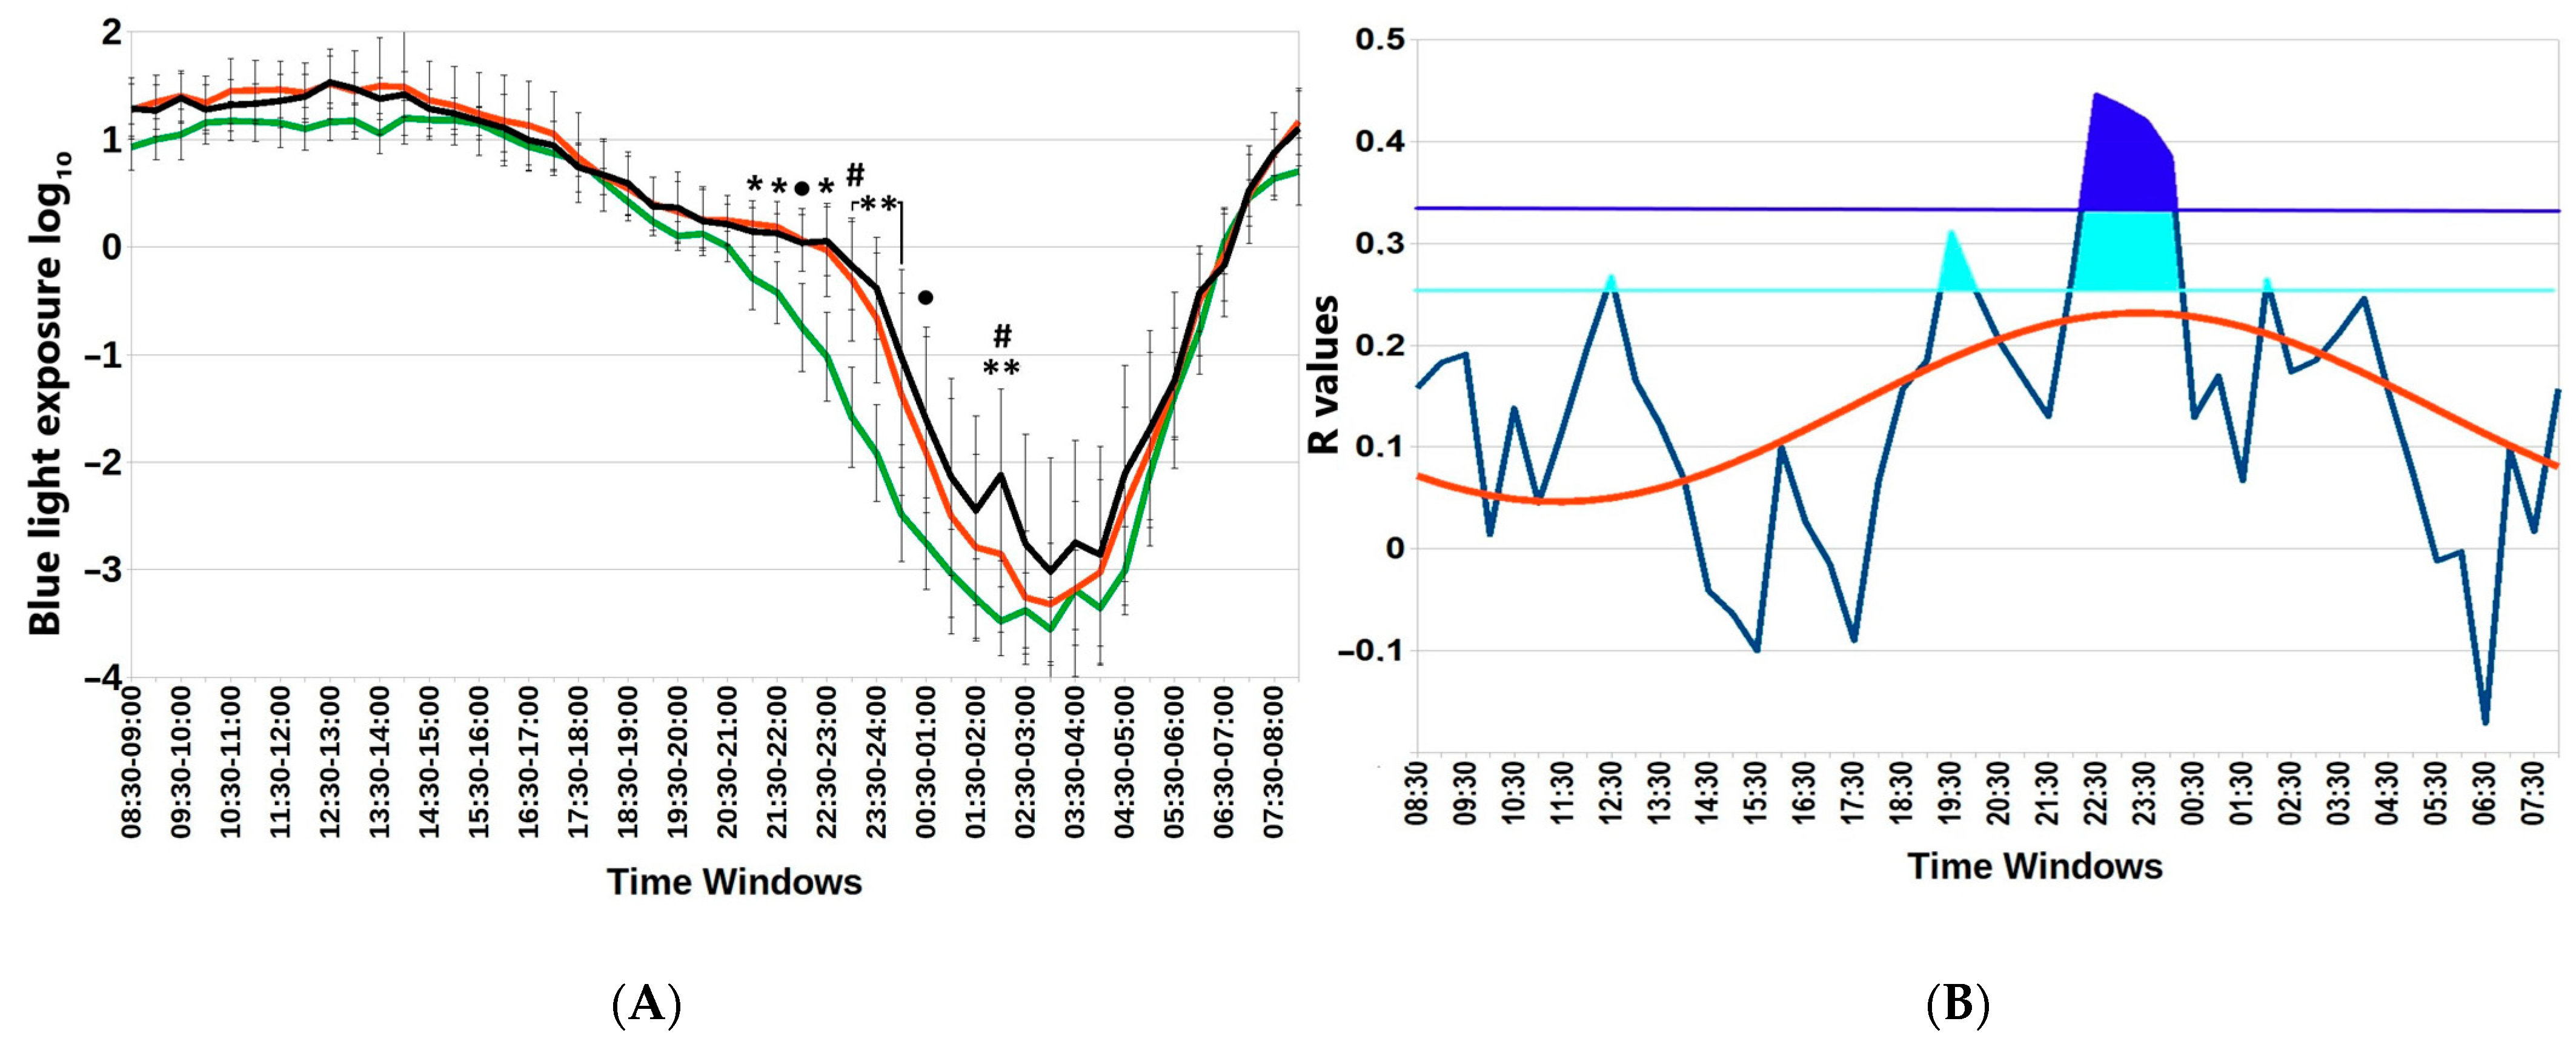
3.4. MTNR1B Polymorphism Accounts for the Interaction between Light, Wrist Temperature and Metabolic Health

Associations between a lower wT MESOR and a higher BMI (Figure 3), as well as between higher nocturnal blue light exposure and a higher BMI (Figure 4), are particularly strong among carriers of the G-allele of MTNR1B rs10830963 C > G SNP polymorphism but not evident among those with the MTNR1B rs10830963 CC genotype. The correlation between BMI and NEIbl is statistically significant among the G-allele carriers (r = 0.465; p = 0.029) but not among those with the CC genotype (r = 0.104; p = 0.599). The Time * BMI * MTNR1B interaction for log10(blue light) is also significant (F(47, 2832) = 1.504, p = 0.015) (Figure 4), as is the BMI * MTNR1B interaction for NEIbl (F(1, 46) = 5.083, p = 0.029); NEIbl is significantly higher in MTNR1B rs10830963 G-allele carriers with a BMI > 25 (p = 0.031). There are no other significant differences for actigraphy-based characteristics between carriers and non-carriers of the MTNR1B G-allele depending on BMI (Supplemental Table S3).

3.5. Associations of Leptin and Cortisol with Actimetry-Derived Indices

Table 3 contains details of actigraphy-derived associations with leptin and cortisol in Arctic residents during the spring equinox. After correction for multiple testing at Benjamini–Hochberg’s FDI = 0.1, a higher wake-after-sleep onset (WASO) and smaller M10, MESOR and 24 h amplitude of activity were associated with higher leptin (r = −0.339, p = 0.008, and r = −0.289, p = 0.024, respectively); rather surprisingly, higher leptin was also associated with an earlier 24 h phase of activity (r = −0.279, p = 0.030) and lower wrist temperature (r = −0.302, p = 0.014). In a multiple regression model, after correction for co-factors of age, sex and population, only the correlation with WASO remained significant (b = 0.240; p = 0.049). An earlier M10 onset of blue light exposure and a higher Daylight Deficit Index, DDIbl, were associated with higher cortisol (r = −0.317, p = 0.014, and r = 0.254, p = 0.050, respectively) but not after correction for multiple testing with Benjamini–Hochberg’s FDI = 0.1. An earlier M10 onset of BLE and DDIbl, however, remained equally significant correlates of higher cortisol in a multiple regression model after correction for the co-factors of age, sex and population (whole model r2 = 0.255; DDIbl, b = 0.353; p = 0.011; M10 onset, b = 0.310; p = 0.016).

3.6. Age-, Sex- and Indigeneity-Related Aspects of Actigraphy-Based Indices

Natives had a significantly higher DDIbl (p < 0.05) and lower NEIbl (p < 0.001), despite the fact that other parametric and non-parametric indices of blue light exposure did not significantly differ from those of non-natives (Table 4). Natives had higher overall daytime activity, MESOR, 24 h amplitude, M10 (p < 0.001) and wT MESOR (p < 0.01), suggesting that between-group differences in blue light indices were not related to less outdoor light exposure that is commonly linked to motor activity. Adult participants had an earlier 24 h phase of blue light exposure and a lower DDIbl (p < 0.01) that led to a higher RAbl (p < 0.05), despite having higher nocturnal blue light exposure, as gauged by NEIbl (p < 0.01) or log10(L5) (p < 0.01). Adults also had a higher and later onset of L5 activity (p < 0.05), a smaller circadian amplitude (p < 0.05) and a smaller RA of activity (p < 0.001). Male participants had more blue light exposure, gauged by the MESOR, 24 h amplitude (p < 0.01) or M10 (p < 0.05). They, however, had a lower IS and a later 24 h phase of activity (p < 0.05). There were no other significant differences in actigraphy-derived sleep characteristics between populations, sexes or age groups.

4. Discussion

Arctic residents are exposed to ambient light with drastic seasonal differences. The amount of light and the alternation and duration of light/dark phases within 24 h change swiftly during spring and autumn. It reaches marginal conditions such as polar day (sun remains above the horizon throughout the 24 h) and polar night (sun’s disc is visible above the horizon for less than three hours for 30 days). At 66- to 67-degree latitude North (locations of this study), polar summer days last for 30 days (7 June—6 July), and the day length in the winter is less than three hours for about 4 weeks (8 December—4 January). We compared real-time light exposure in this longitudinal year-long survey in Arctic residents among week-long records obtained within each season. We observed that the spring equinox was the most comfortable season in terms of dynamic light features, which fit most closely the recommendations for 24 h indoor light schedules [7].
We started our analyses of actigraphy data and their relationship with metabolic proxies of health and genetic factors during the spring equinox. We found that a higher BMI is linked to a lower wT MESOR and a higher evening BLE. The association between BMI and BLE occurs exclusively within distinct time windows and is best expressed by an area above the reference curve, represented by a sine function fitted over the recommended threshold for the proper light hygiene standards (Figure 1). Other actigraphy indices of sleep or motor activity were not closely linked to BMI. Remarkably, associations of BMI with wrist temperature and evening BLE are closely coupled to carrying the MTNR1B rs10830963 G-allele. Importantly, these differences in evening BLE were subtle, however clearly pronounced after log10 transformation of BLE data, and were linked to a particular time window.
The timing of light exposure is critical [58,59] and discriminates between its beneficial and harmful effects [21,60]. The 24 h amplitude of light signaling, or the dynamic range between daytime and nighttime light exposure, is another factor that is decisive for health and well-being [21,26,61,62]. Overall, daylight is beneficial and strengthens the alignment power of light signaling [4,9,63], whereas light at night is linked to circadian misalignment and is detrimental to health [64,65,66]. Light at night is linked to adverse metabolic changes and weight gain in laboratory animals [67,68,69] and humans [60,70,71,72,73,74].
Morning bright light treatment reduced body fat and appetite in overweight women [75]. Light exposure above a 500 lux threshold early during the daytime is associated with lower body weight independently of sleep timing, duration and total activity in adults [32]. The direction of this relationship, however, was opposite in children [76]. Individual differences in metabolic responses to light and circadian misalignment by light at the wrong time are pronounced [77] and depend on light sensitivity that can be modulated by genetic factors [78] and sex [79,80] and reduced with advancing age [81,82]. Light sensitivity can differ within a 50-fold range among individuals. Light sensitivity may depend on yet unrecognized genetic factors distinct from those determining the chronotype, circadian phase and intrinsic period, as no relationship between individual sensitivity to light and dim light melatonin onset, DLMO, phase angle between DLMO and habitual bedtime or light-exposure history was found [83]. Some individuals are sensitive to very dim blue light [83,84], suggesting that even low blue light irradiance may have consequences for the circadian system and health. The effects of timing of light exposure on metabolic health throughout the 24 h scale could be best modeled by a sinusoidal function, as phase response curves to light exist for melatonin [85] and also for lipids and hepatic proteins [25].
As a gauge of peripheral thermoregulation, wrist temperature, which can be assessed by monitoring, is a promising digital biomarker for numerous diseases [86]. The relationship between the circadian rhythm of temperature and metabolic features is well known for mammalian species and humans. A higher body temperature and smaller 24 h amplitude are generally linked to a higher body mass [87]. The circadian dynamics of insulin resistance and glucose turnover are also associated with the circadian rhythm of temperature, affecting the relationship between heat production and heat loss during activity and rest periods [87,88,89]. A lower mean wT in obese vs. normal-weight women was found during three-day measurements with the Thermochron iButton [90], accompanied by a flattened 24 h wT pattern. It was associated with a dampened midday–midnight difference of cortisol and melatonin. A higher BMI was associated with a smaller amplitude and a lower intra-daily variability of the 24 h rhythm of wT in 192 adult women [91]. Similarly (since physiological and circadian relations between wT and body temperature are opposite), a higher average (“over the entire study”) core temperature in obesity and a higher core temperature in women vs. men were reported [92]. Also, a higher nocturnal body temperature in pre-diabetic patients and a dampened 24 h amplitude in diabetic patients were observed [93]. Another study, however, found sex-related (higher in women) but not obesity-related differences in core temperature [94], alerting us to the need to study mutations in core-temperature-regulating genes. Indeed, in this work, we discovered a close MTN1B-linked relationship for the association between the wT MESOR and BMI. This finding is in agreement with previous studies. MTNR1B also mediates the effect of melatonin on insulin gene expression [95]. The MTNR1B rs10830963 G-allele may be a link between circadian rhythm alterations, metabolic disorders and diabetes [41,96]. This SNP is associated with disrupted circadian phenotypes and also with altered melatonin secretion [42,43,44]. Both factors are prerequisites for metabolic disturbances and diabetes [41].
At night and during human sleep, heat production decreases, and heat loss from distal body parts increases [88]. Light at night affects metabolism and energy expenditure. Under controlled conditions of constant activity, evening and nocturnal light affected body temperature [97,98,99], possibly by influencing melatonin secretion [100]. BLE prior to bedtime significantly decreased fat oxidation and increased the respiratory quotient, an indicator of the carbohydrate-to-fat oxidation ratio [101]. It may increase obesity risk due to disturbances of circadian rhythms affecting resting/nocturnal nutrient metabolism. Recent work showed that the ambient light environment modulates postprandial metabolism, thermo-modulation and energy expenditure in a time-of-day-dependent manner [59].
Herein, we show that BLE is subtly, though significantly, higher within a distinct time window in individuals with a higher BMI. This association is linked to the presence of the MTNR1B G-allele. Remarkably, these distinct features of nocturnal BLE are not linked to any differences in actigraphy-derived characteristics of sleep or motor activity but are linked to a lower wT MESOR. Overall, this result prompts an assumption that, at least in Arctic residents, enhanced nocturnal light hygiene to prevent blue light overexposure above the threshold (Supplemental Table S3) could be most effective in carriers of the G-allele of the MTNR1B rs10830963 C > G SNP polymorphism to support metabolic health. Of note, this threshold relates to values of light exposure that are lower than 1 lx.
We also found an association between a higher WASO and higher leptin and higher cortisol with a higher DDIbl and with an earlier M10 onset of BLE that remained statistically significant after accounting for age, sex and indigeneity. Leptin and cortisol are stress-marker hormones, closely linked to metabolic health [102]. On the other hand, these hormones have pronounced circadian rhythms that are somewhat inverse in phase, suggesting antagonistic modulation, at least in some individuals [102]. Leptin inhibits the action of cortisol centrally in the hypothalamus [103] and peripherally in the adrenal gland [104]. Leptin increases with a higher BMI and usually is higher in women than men [105,106]. Leptin has an evident 24 h rhythm with an average amplitude above 20% of the mean and a nocturnal phase similar to that of melatonin [107]. Unlike melatonin, the amplitude and phase of the 24 h rhythm in leptin seem to not be affected by the metabolic state [107]. Conditions of compromised sleep exposure to morning blue light increased leptin [108], while nighttime use of electronic devices resulted in moderate suppression of leptin [109]. However, no effect of blue-enriched light or timing of its exposure (morning vs. evening) was found in conditions of non-deprived sleep [58]. Bright light of about 10,000 lux reduces cortisol at both rising and descending phases when compared to dim light conditions [110]. Daytime bright light, however, had no effect [111]; there was no effect either of dynamic “natural light modulation” scenarios on cortisol [112]. These findings suggest that the effect of light on cortisol may depend on previous light exposure and on the extent of difference between introduced light exposure vs. preexisted light exposure.
The current study has its strengths and limitations. The major strength of the study was that all actigraphy was performed simultaneously during the same week of the same season in nearby geographical locations. Limitations include the fact that most volunteers in this study were women; results herein hence apply mainly to adult women residing in the Arctic. Results may also be biased by individual differences related to the menstrual cycle. Therefore, this aspect should be addressed in future studies.

5. Conclusions

This study revealed that in Arctic residents during the spring equinox, a higher BMI is linked to nocturnal BLE within distinct time windows and to a lower wT MESOR, irrespective of any detectable differences in the actigraphy indices of sleep or motor activity. This link is coupled to the MTNR1B rs10830963 G-allele. We determined actigraphy-based predictors of leptin and cortisol. We also provided low nocturnal BLE thresholds for optimal metabolic health between a 9 p.m. and 1 a.m. time window and suggested a novel index, which estimates such excess.
In our future work, we will examine follow-ups of these findings during other seasons, particularly during winter as a most light-deficient season in the Arctic.

6. Patents

Three patents (RU) are pending.

Supplementary Materials

The following supporting information can be downloaded at https://www.mdpi.com/article/10.3390/biology13010022/s1, Figure S1: Similar amplitude and phase of wrist temperature and motor activity in Arctic residents with different body mass index (BMI) values; Table S1: Reference values for blue light exposure (BLE) per time epoch, used to calculate nocturnal excess index; Table S2: Comparative analysis of blue light exposure averaged over 30 min epochs in Arctic residents with BMI < 25 vs. BMI > 25; Table S3: Actigraphy-derived characteristics depending on body mass index (BMI) and MTNR1B G-allele in Arctic residents during spring equinox.

Author Contributions

D.G., K.D. and M.B. designed the study. D.G., K.D., O.S., S.K., M.B., G.C. and D.W. developed methods. D.G., A.M., K.V., S.L. and M.M. collected data. D.G., A.S., K.V., G.C., S.K., N.Y. and D.W. analyzed and interpreted the data. D.G., O.S., S.K., M.B., G.C. and D.W. prepared the manuscript. D.G. and I.P. acquired funding. D.G., K.D., O.S., A.M., S.L. and I.P. supervised the project. Approve the final version of the manuscript: all authors. All authors have read and agreed to the published version of the manuscript.

Funding

This study was supported by the West-Siberian Science and Education Center, Government of Tyumen District, Decree of 20.11.2020, No. 928-rp. The study was supported in part by the Ministry of Science and Higher Education (government topic FMEN 2022-0009). The funding organizations had no role in the design or conduct of this research. The author(s) have no proprietary or commercial interest in any materials discussed in this article.

Institutional Review Board Statement

This cross-sectional study adhered to the tenets of the Declaration of Helsinki and was approved by the Ethics Committee of Tyumen State Medical University (Protocol No. 101, 13 September 2021).

Informed Consent Statement

Written informed consent was obtained from all participants.

Data Availability Statement

The data presented in this study are available upon reasonable request from the corresponding author. The data are not publicly available due to privacy.

Acknowledgments

We are grateful to all participants of this study and medical personnel at Aksarka Boarding School, Salekhard, and Urengoy.

Conflicts of Interest

The authors report no conflicts of interest.

References

  1. LeGates, T.A.; Fernandez, D.C.; Hattar, S. Light as a central modulator of circadian rhythms, sleep and affect. Nat. Rev. Neurosci. 2014, 15, 443–454. [Google Scholar] [CrossRef] [PubMed]
  2. Blume, C.; Garbazza, C.; Spitschan, M. Effects of light on human circadian rhythms, sleep and mood. Somnologie 2019, 23, 147–156. [Google Scholar] [CrossRef] [PubMed]
  3. Wirz-Justice, A.; Skene, D.J.; Münch, M. The relevance of daylight for humans. Biochem. Pharmacol. 2021, 191, 114304. [Google Scholar] [CrossRef]
  4. Roenneberg, T.; Kantermann, T.; Juda, M.; Vetter, C.; Allebrandt, K.V. Light and the human circadian clock. Handb. Exp. Pharmacol. 2013, 217, 311–331. [Google Scholar]
  5. Husse, J.; Eichele, G.; Oster, H. Synchronization of the mammalian circadian timing system: Light can control peripheral clocks independently of the SCN clock: Alternate routes of entrainment optimize the alignment of the body’s circadian clock network with external time. BioEssays 2015, 37, 1119–1128. [Google Scholar] [CrossRef]
  6. Bano-Otalora, B.; Martial, F.; Harding, C.; Bechtold, D.A.; Allen, A.E.; Brown, T.M.; Belle, M.D.; Lucas, R.J. Bright daytime light enhances circadian amplitude in a diurnal mammal. Proc. Natl. Acad. Sci. USA 2021, 118, e2100094118. [Google Scholar] [CrossRef] [PubMed]
  7. Brown, T.M.; Brainard, G.C.; Cajochen, C.; Czeisler, C.A.; Hanifin, J.P.; Lockley, S.W.; Lucas, R.J.; Münch, M.; O’Hagan, J.B.; Peirson, S.N.; et al. Recommendations for daytime, evening, and nighttime indoor light exposure to best support physiology, sleep, and wakefulness in healthy adults. PLoS Biol. 2022, 20, e3001571. [Google Scholar] [CrossRef]
  8. Vollmer, C.; Michel, U.; Randler, C. Outdoor light at night (LAN) is correlated with eveningness in adolescents. Chronobiol. Int. 2012, 29, 502–508. [Google Scholar] [CrossRef]
  9. Wright, K.P., Jr.; McHill, A.W.; Birks, B.R.; Griffin, B.R.; Rusterholz, T.; Chinoy, E.D. Entrainment of the human circadian clock to the natural light-dark cycle. Curr. Biol. 2013, 23, 1554–1558. [Google Scholar] [CrossRef]
  10. Eto, T.; Kitamura, S.; Nishimura, K.; Takeoka, K.; Nishimura, Y.; Lee, S.I.; Ohashi, M.; Shikano, A.; Noi, S.; Higuchi, S. Circadian phase advances in children during camping life according to the natural light-dark cycle. J. Physiol. Anthropol. 2022, 41, 42. [Google Scholar] [CrossRef]
  11. Gapon, L.I.; Shurkevich, N.P.; Vetoshkin, A.S.; Gubin, D.G. The rhythms of arterial pressure and heart rate in individuals with arterial hypertension under the conditions of Far North. Klin. Med. 2006, 84, 39–44. [Google Scholar]
  12. Arendt, J. Biological rhythms during residence in Polar Regions. Chronobiol. Int. 2012, 29, 379–394. [Google Scholar] [CrossRef] [PubMed]
  13. Gubin, D.; Cornelissen, G.; Weinert, D.; Vetoshkin, A.S.; Gapon, L.I.; Shurkevich, N.P.; Poshinov, F.V.; Belozerova, N.V.; Danilova, L.A. Circadian disruption and Vascular Variability Disorders (VVD)—Mechanisms linking aging, disease state and Arctic shift-work: Applications for chronotherapy. World Heart J. 2013, 5, 285–306. [Google Scholar]
  14. Paul, M.A.; Love, R.J.; Hawton, A.; Brett, K.; McCreary, D.R.; Arendt, J. Sleep deficits in the High Arctic summer in relation to light exposure and behaviour: Use of melatonin as a countermeasure. Sleep. Med. 2015, 16, 406–413. [Google Scholar] [CrossRef] [PubMed]
  15. Danilenko, K.V.; Kobelev, E.; Semenova, E.A.; Aftanas, L.I. Summer-winter difference in 24-h melatonin rhythms in subjects on a 5-workdays schedule in Siberia without daylight saving time transitions. Physiol. Behav. 2019, 212, 112686. [Google Scholar] [CrossRef] [PubMed]
  16. Unnarsdóttir, A.B.; Hauksdóttir, A.; Aspelund, T.; Gunnarsdóttir, V.; Tómasson, G.; Jakobsdóttir, J.; Anna Valdimarsdóttir, U.; Thordardottir, E.B. Sleep disturbances among women in a Subarctic region: A nationwide study. Sleep 2022, 45, zsac100. [Google Scholar] [CrossRef] [PubMed]
  17. Sahar, S.; Sassone-Corsi, P. Regulation of metabolism: The circadian clock dictates the time. Trends Endocrinol. Metab. 2012, 23, 1–8. [Google Scholar] [CrossRef]
  18. Gnocchi, D.; Pedrelli, M.; Hurt-Camejo, E.; Parini, P. Lipids around the Clock: Focus on Circadian Rhythms and Lipid Metabolism. Biology 2015, 4, 104–132. [Google Scholar] [CrossRef]
  19. Jha Kumar, P.; Challet, E.; Kalsbeek, A. Circadian rhythms in glucose and lipid metabolism in nocturnal and diurnal mammals. Mol. Cell Endocrinol. 2015, 418 Pt 1, 74–88. [Google Scholar] [CrossRef]
  20. Gooley, J.J. Circadian regulation of lipid metabolism. Proc. Nutr. Soc. 2016, 75, 440–450. [Google Scholar] [CrossRef]
  21. Plano, S.A.; Casiraghi, L.P.; García Moro, P.; Paladino, N.; Golombek, D.A.; Chiesa, J.J. Circadian and Metabolic Effects of Light: Implications in Weight Homeostasis and Health. Front. Neurol. 2017, 8, 558. [Google Scholar] [CrossRef] [PubMed]
  22. Poggiogalle, E.; Jamshed, H.; Peterson, C.M. Circadian regulation of glucose, lipid, and energy metabolism in humans. Metabolism 2018, 84, 11–27. [Google Scholar] [CrossRef] [PubMed]
  23. Cornelissen, G. Circadian disruption and metabolic disease risk. In Functional Foods and Nutraceuticals in Metabolic and Non-Communicable Diseases; Singh, R., Watanabe, S., Isaza, A., Eds.; Academic Press: New York, NY, USA, 2022; pp. 513–524. [Google Scholar]
  24. Okuliarova, M.; Rumanova, V.S.; Stebelova, K.; Zeman, M. Dim Light at Night Disturbs Molecular Pathways of Lipid Metabolism. Int. J. Mol. Sci. 2020, 21, 6919. [Google Scholar] [CrossRef] [PubMed]
  25. Kent, B.A.; Rahman, S.A.; St. Hilaire, M.A.; Grant, L.K.; Rüger, M.; Czeisler, C.A.; Lockley, S.W. Circadian lipid and hepatic protein rhythms shift with a phase response curve different than melatonin. Nat. Commun. 2022, 13, 681. [Google Scholar] [CrossRef] [PubMed]
  26. Ishihara, A.; Courville, A.B.; Chen, K.Y. The Complex Effects of Light on Metabolism in Humans. Nutrients 2023, 15, 1391. [Google Scholar] [CrossRef] [PubMed]
  27. Danilenko, K.V.; Stefani, O.; Voronin, K.A.; Mezhakova, M.S.; Petrov, I.M.; Borisenkov, M.F.; Markov, A.A.; Gubin, D.G. Wearable Light-and-Motion Dataloggers for Sleep/Wake Research: A Review. Appl. Sci. 2022, 12, 11794. [Google Scholar] [CrossRef]
  28. Stampfli, J.; Schrader, B.; di Battista, C.; Häfliger, R.; Schälli, O.; Wichmann, G.; Zumbühl, C.; Blattner, P.; Cajochen, C.; Lazar, R.; et al. The Light-Dosimeter: A new device to help advance research on the non-visual responses to light. Light. Res. Technol. 2023, 55, 474–486. [Google Scholar] [CrossRef] [PubMed]
  29. Berson, D.M.; Dunn, F.A.; Takao, M. Phototransduction by retinal ganglion cells that set the circadian clock. Science 2002, 295, 1070–1073. [Google Scholar] [CrossRef]
  30. Mure, L.S. Intrinsically Photosensitive Retinal Ganglion Cells of the Human Retina. Front. Neurol. 2021, 12, 636330. [Google Scholar] [CrossRef]
  31. Garfield, V. The Association Between Body Mass Index (BMI) and Sleep Duration: Where Are We after nearly Two Decades of Epidemiological Research? Int. J. Environ. Res. Public Health 2019, 16, 4327. [Google Scholar] [CrossRef]
  32. Reid, K.J.; Santostasi, G.; Baron, K.G.; Wilson, J.; Kang, J.; Zee, P.C. Timing and intensity of light correlate with body weight in adults. PLoS ONE 2014, 9, e92251. [Google Scholar] [CrossRef] [PubMed]
  33. Constantino, D.B.; Xavier, N.B.; Levandovski, R.; Roenneberg, T.; Hidalgo, M.P.; Pilz, L.K. Relationship between Circadian Strain, Light Exposure, and Body Mass Index in Rural and Urban Quilombola Communities. Front. Physiol. 2022, 12, 773969. [Google Scholar] [CrossRef] [PubMed]
  34. Cespedes Feliciano, E.M.; Quante, M.; Weng, J.; Mitchell, J.A.; James, P.; Marinac, C.R.; Mariani, S.; Redline, S.; Kerr, J.; Godbole, S.; et al. Actigraphy-Derived Daily Rest-Activity Patterns and Body Mass Index in Community-Dwelling Adults. Sleep 2017, 40, zsx168. [Google Scholar] [CrossRef] [PubMed]
  35. Quante, M.; Cespedes Feliciano, E.M.; Rifas-Shiman, S.L.; Mariani, S.; Kaplan, E.R.; Rueschman, M.; Oken, E.; Taveras, E.M.; Redline, S. Association of Daily Rest-Activity Patterns with Adiposity and Cardiometabolic Risk Measures in Teens. J. Adolesc. Health 2019, 65, 224–231. [Google Scholar] [CrossRef] [PubMed]
  36. Qian, J.; Martinez-Lozano, N.; Tvarijonaviciute, A.; Rios, R.; Scheer, F.A.J.L.; Garaulet, M. Blunted rest-activity rhythms link to higher body mass index and inflammatory markers in children. Sleep 2021, 44, zsaa256. [Google Scholar] [CrossRef] [PubMed]
  37. Weinert, D.; Gubin, D. The Impact of Physical Activity on the Circadian System: Benefits for Health, Performance and Wellbeing. Appl. Sci. 2022, 12, 9220. [Google Scholar] [CrossRef]
  38. Obayashi, K.; Saeki, K.; Kurumatani, N. Ambient Light Exposure and Changes in Obesity Parameters: A Longitudinal Study of the HEIJO-KYO Cohort. J. Clin. Endocrinol. Metab. 2016, 101, 3539–3547. [Google Scholar] [CrossRef] [PubMed]
  39. Obayashi, K.; Yamagami, Y.; Kurumatani, N.; Saeki, K. Bedroom lighting environment and incident diabetes mellitus: A longitudinal study of the HEIJO-KYO cohort. Sleep Med. 2020, 65, 1–3. [Google Scholar] [CrossRef]
  40. Kim, M.; Vu, T.H.; Maas, M.B.; Braun, R.I.; Wolf, M.S.; Roenneberg, T.; Daviglus, M.L.; Reid, K.J.; Zee, P.C. Light at night in older age is associated with obesity, diabetes, and hypertension. Sleep 2023, 46, zsac130. [Google Scholar] [CrossRef]
  41. Zhu, H.; Zhao, Z.J.; Liu, H.Y.; Cai, J.; Lu, Q.K.; Ji, L.D.; Xu, J. The melatonin receptor 1B gene links circadian rhythms and type 2 diabetes mellitus: An evolutionary story. Ann. Med. 2023, 55, 1262–1286. [Google Scholar] [CrossRef]
  42. Lane, J.M.; Chang, A.M.; Bjonnes, A.C.; Aeschbach, D.; Anderson, C.; Cade, B.E.; Cain, S.W.; Czeisler, C.A.; Gharib, S.A.; Gooley, J.J.; et al. Impact of Common Diabetes Risk Variant in MTNR1B on Sleep, Circadian, and Melatonin Physiology. Diabetes 2016, 65, 1741–1751. [Google Scholar] [CrossRef]
  43. Tan, X.; Ciuculete, D.M.; Schiöth, H.B.; Benedict, C. Associations between chronotype, MTNR1B genotype and risk of type 2 diabetes in UK Biobank. J. Intern. Med. 2020, 287, 189–196. [Google Scholar] [CrossRef] [PubMed]
  44. Gubin, D.; Neroev, V.; Malishevskaya, T.; Cornelissen, G.; Astakhov, S.Y.; Kolomeichuk, S.; Yuzhakova, N.; Kabitskaya, Y.; Weinert, D. Melatonin mitigates disrupted circadian rhythms, lowers intraocular pressure, and improves retinal ganglion cells function in glaucoma. J. Pineal Res. 2021, 70, e12730. [Google Scholar] [CrossRef] [PubMed]
  45. Vejrazkova, D.; Vankova, M.; Vcelak, J.; Krejci, H.; Anderlova, K.; Tura, A.; Pacini, G.; Sumova, A.; Sladek, M.; Bendlova, B. The rs10830963 Polymorphism of the MTNR1B Gene: Association with Abnormal Glucose, Insulin and C-peptide Kinetics. Front. Endocrinol. 2022, 13, 868364. [Google Scholar] [CrossRef] [PubMed]
  46. Xia, A.Y.; Zhu, H.; Zhao, Z.J.; Liu, H.Y.; Wang, P.H.; Ji, L.D.; Xu, J. Molecular Mechanisms of the Melatonin Receptor Pathway Linking Circadian Rhythm to Type 2 Diabetes Mellitus. Nutrients 2023, 15, 1406. [Google Scholar] [CrossRef]
  47. Goni, L.; Sun, D.; Heianza, Y.; Wang, T.; Huang, T.; Martínez, J.A.; Shang, X.; Bray, G.A.; Smith, S.R.; Sacks, F.M.; et al. A circadian rhythm-related MTNR1B genetic variant modulates the effect of weight-loss diets on changes in adiposity and body composition: The POUNDS Lost trial. Eur. J. Nutr. 2019, 58, 1381–1389. [Google Scholar] [CrossRef]
  48. de Onis, M.; Onyango, A.W.; Borghi, E.; Siyam, A.; Nishida, C.; Siekmann, J. Development of a WHO growth reference for school-aged children and adolescents. Bull. World Health Organ. 2007, 85, 660–667. [Google Scholar] [CrossRef]
  49. Girardin, J.-L.; Kripke, D.F.; Mason, W.J.; Elliott, J.A.; Youngstedt, S.D. Sleep estimation from wrist movement quantified by different actigraphic modalities. J. Neurosci. Methods 2001, 105, 185–191. [Google Scholar]
  50. Blackwell, T.; Redline, S.; Ancoli-Israel, S.; Schneider, J.L.; Surovec, S.; Johnson, N.L.; Cauley, J.A.; Stone, K.L. Study of Osteoporotic Fractures Research Group. Comparison of sleep parameters from actigraphy and polysomnography in older women: The SOF study. Sleep 2008, 1, 283–291. [Google Scholar] [CrossRef]
  51. Price, L.L.; Lyachev, A.; Khazova, M. Optical performance characterization of light-logging actigraphy dosimeters. J. Opt. Soc. Am. A 2017, 34, 545–557. [Google Scholar] [CrossRef]
  52. Price, L.L.A.; Lyachev, A. Modification of a personal dosimetry device for logging melanopic irradiance. Light. Res. Technol. 2017, 49, 922–927. [Google Scholar] [CrossRef]
  53. St Hilaire, M.A.; Ámundadóttir, M.L.; Rahman, S.A.; Rajaratnam, S.M.W.; Rüger, M.; Brainard, G.C.; Czeisler, C.A.; Andersen, M.; Gooley, J.J.; Lockley, S.W. The spectral sensitivity of human circadian phase resetting and melatonin suppression to light changes dynamically with light duration. Proc. Natl. Acad. Sci. USA 2022, 119, e2205301119. [Google Scholar] [CrossRef] [PubMed]
  54. CIE S 026/E:2018; CIE System for Metrology of Optical Radiation for ipRGC-Influenced Responses to Light. CIE Central Bureau: Vienna, Austria, 2018.
  55. Cole, R.J.; Kripke, D.F.; Gruen, W.; Mullaney, D.J.; Gillin, J.C. Automatic sleep/wake identification from wrist activity. Sleep 1992, 15, 461–469. [Google Scholar] [CrossRef] [PubMed]
  56. Cornelissen, G. Cosinor-based rhythmometry. Theor. Biol. Med. Model. 2014, 11, 16. [Google Scholar] [CrossRef] [PubMed]
  57. Diedenhofen, B.; Much, J. Cocor: A comprehensive solution for the statistical comparison of correlations. PLoS ONE 2015, 10, e0121945. [Google Scholar] [CrossRef] [PubMed]
  58. Cheung, I.N.; Zee, P.C.; Shalman, D.; Malkani, R.G.; Kang, J.; Reid, K.J. Morning and Evening Blue-Enriched Light Exposure Alters Metabolic Function in Normal Weight Adults. PLoS ONE 2016, 11, e0155601. [Google Scholar] [CrossRef] [PubMed]
  59. Harmsen, J.F.; Wefers, J.; Doligkeit, D.; Schlangen, L.; Dautzenberg, B.; Rense, P.; van Moorsel, D.; Hoeks, J.; Moonen-Kornips, E.; Gordijn, M.C.M.; et al. The influence of bright and dim light on substrate metabolism, energy expenditure and thermoregulation in insulin-resistant individuals depends on time of day. Diabetologia 2022, 65, 721–732. [Google Scholar] [CrossRef] [PubMed]
  60. Fleury, G.; Masís-Vargas, A.; Kalsbeek, A. Metabolic Implications of Exposure to Light at Night: Lessons from Animal and Human Studies. Obesity 2020, 28 (Suppl. S1), S18–S28. [Google Scholar] [CrossRef]
  61. Benedito-Silva, A.A.; Evans, S.; Viana Mendes, J.; Castro, J.; Gonçalves, B.D.S.B.; Ruiz, F.S.; Beijamini, F.; Evangelista, F.S.; Vallada, H.; Krieger, J.E.; et al. Association between light exposure and metabolic syndrome in a rural Brazilian town. PLoS ONE 2020, 15, e0238772. [Google Scholar] [CrossRef]
  62. Meléndez-Fernández, O.H.; Walton, J.C.; DeVries, A.C.; Nelson, R.J. The role of daylight exposure on body mass in male mice. Physiol. Behav. 2023, 266, 114186. [Google Scholar] [CrossRef]
  63. von Gall, C. The Effects of Light and the Circadian System on Rhythmic Brain Function. Int. J. Mol. Sci. 2022, 23, 2778. [Google Scholar] [CrossRef] [PubMed]
  64. Cho, Y.; Ryu, S.H.; Lee, B.R.; Kim, K.H.; Lee, E.; Choi, J. Effects of artificial light at night on human health: A literature review of observational and experimental studies applied to exposure assessment. Chronobiol. Int. 2015, 32, 1294–1310. [Google Scholar] [CrossRef] [PubMed]
  65. Touitou, Y.; Reinberg, A.; Touitou, D. Association between light at night, melatonin secretion, sleep deprivation, and the internal clock: Health impacts and mechanisms of circadian disruption. Life Sci. 2017, 173, 94–106. [Google Scholar] [CrossRef] [PubMed]
  66. Bumgarner, J.R.; Nelson, R.J. Light at Night and Disrupted Circadian Rhythms Alter Physiology and Behavior. Integr. Comp. Biol. 2021, 61, 1160–1169. [Google Scholar] [CrossRef] [PubMed]
  67. Fonken, L.K.; Aubrecht, T.G.; Meléndez-Fernández, O.H.; Weil, Z.M.; Nelson, R.J. Dim light at night disrupts molecular circadian rhythms and increases body weight. J. Biol. Rhythm. 2013, 28, 262–271. [Google Scholar] [CrossRef] [PubMed]
  68. Aubrecht, T.G.; Jenkins, R.; Nelson, R.J. Dim light at night increases body mass of female mice. Chronobiol. Int. 2015, 32, 557–560. [Google Scholar] [CrossRef] [PubMed]
  69. Opperhuizen, A.L.; Stenvers, D.J.; Jansen, R.D.; Foppen, E.; Fliers, E.; Kalsbeek, A. Light at night acutely impairs glucose tolerance in a time-, intensity- and wavelength-dependent manner in rats. Diabetologia 2017, 60, 1333–1343. [Google Scholar] [CrossRef] [PubMed]
  70. McFadden, E.; Jones, M.E.; Schoemaker, M.J.; Ashworth, A.; Swerdlow, A.J. The relationship between obesity and exposure to light at night: Cross-sectional analyses of over 100,000 women in the Breakthrough Generations Study. Am. J. Epidemiol. 2014, 180, 245–250. [Google Scholar] [CrossRef]
  71. Nelson, R.J.; Chbeir, S. Dark matters: Effects of light at night on metabolism. Proc. Nutr. Soc. 2018, 77, 223–229. [Google Scholar] [CrossRef]
  72. Park, Y.M.; White, A.J.; Jackson, C.L.; Weinberg, C.R.; Sandler, D.P. Association of Exposure to Artificial Light at Night While Sleeping with Risk of Obesity in Women. JAMA Intern. Med. 2019, 179, 1061–1071. [Google Scholar] [CrossRef]
  73. Zhang, X.; Zheng, R.; Xin, Z.; Zhao, Z.; Li, M.; Wang, T.; Xu, M.; Lu, J.; Wang, S.; Li, H.; et al. Sex- and age-specific association between outdoor light at night and obesity in Chinese adults: A national cross-sectional study of 98,658 participants from 162 study sites. Front. Endocrinol. 2023, 14, 1119658. [Google Scholar] [CrossRef] [PubMed]
  74. Xu, Y.J.; Xie, Z.Y.; Gong, Y.C.; Wang, L.B.; Xie, Y.Y.; Lin, L.Z.; Zeng, X.W.; Yang, B.Y.; Zhang, W.; Liu, R.Q.; et al. The association between outdoor light at night exposure and adult obesity in Northeastern China. Int. J. Environ. Health Res. 2023, 10, 1–11. [Google Scholar] [CrossRef] [PubMed]
  75. Danilenko, K.V.; Mustafina, S.V.; Pechenkina, E.A. Bright light for weight loss: Results of a controlled crossover trial. Obes. Facts 2013, 6, 28–38. [Google Scholar] [CrossRef] [PubMed]
  76. Pattinson, C.L.; Allan, A.C.; Staton, S.L.; Thorpe, K.J.; Smith, S.S. Environmental Light Exposure Is Associated with Increased Body Mass in Children. PLoS ONE 2016, 11, e0143578. [Google Scholar] [CrossRef] [PubMed]
  77. Melanson, E.L.; Ritchie, H.K.; Dear, T.B.; Catenacci, V.; Shea, K.; Connick, E.; Moehlman, T.M.; Stothard, E.R.; Higgins, J.; McHill, A.W.; et al. Daytime bright light exposure, metabolism, and individual differences in wake and sleep energy expenditure during circadian entrainment and misalignment. Neurobiol. Sleep Circadian Rhythm. 2018, 4, 49–56. [Google Scholar] [CrossRef] [PubMed]
  78. Burns, A.C.; Phillips, A.J.K.; Rutter, M.K.; Saxena, R.; Cain, S.W.; Lane, J.M. Genome-wide gene by environment study of time spent in daylight and chronotype identifies emerging genetic architecture underlying light sensitivity. Sleep 2023, 46, zsac287. [Google Scholar] [CrossRef] [PubMed]
  79. Chellappa, S.L.; Steiner, R.; Oelhafen, P.; Cajochen, C. Sex differences in light sensitivity impact on brightness perception, vigilant attention and sleep in humans. Sci. Rep. 2017, 7, 14215. [Google Scholar] [CrossRef] [PubMed]
  80. Qian, J.; Morris, C.J.; Caputo, R.; Wang, W.; Garaulet, M.; Scheer, F.A.J.L. Sex differences in the circadian misalignment effects on energy regulation. Proc. Natl. Acad. Sci. USA 2019, 116, 23806–23812. [Google Scholar] [CrossRef]
  81. Figueiro, M.G.; Overington, D. Self-luminous devices and melatonin suppression in adolescents. Light. Res. Technol. 2016, 48, 966–975. [Google Scholar] [CrossRef]
  82. Chellappa, S.L. Aging, light sensitivity and circadian health. Aging 2021, 13, 25604–25606. [Google Scholar] [CrossRef]
  83. Phillips, A.J.K.; Vidafar, P.; Burns, A.C.; McGlashan, E.M.; Anderson, C.; Rajaratnam, S.M.W.; Lockley, S.W.; Cain, S.W. High sensitivity and interindividual variability in the response of the human circadian system to evening light. Proc. Natl. Acad. Sci. USA 2019, 116, 12019–12024. [Google Scholar] [CrossRef] [PubMed]
  84. Vartanian, G.V.; Li, B.Y.; Chervenak, A.P.; Walch, O.J.; Pack, W.; Ala-Laurila, P.; Wong, K.Y. Melatonin Suppression by Light in Humans Is More Sensitive than Previously Reported. J. Biol. Rhythm. 2015, 30, 351–354. [Google Scholar] [CrossRef] [PubMed]
  85. Khalsa, S.B.; Jewett, M.E.; Cajochen, C.; Czeisler, C.A. A phase response curve to single bright light pulses in human subjects. J. Physiol. 2003, 549 Pt 3, 945–952. [Google Scholar] [CrossRef] [PubMed]
  86. Brooks, T.G.; Lahens, N.F.; Grant, G.R.; Sheline, Y.I.; FitzGerald, G.A.; Skarke, C. Diurnal rhythms of wrist temperature are associated with future disease risk in the UK Biobank. Nat. Commun. 2023, 14, 5172. [Google Scholar] [CrossRef] [PubMed]
  87. Refinetti, R. Circadian rhythmicity of body temperature and metabolism. Temperature 2020, 7, 321–362. [Google Scholar] [CrossRef] [PubMed]
  88. Kräuchi, K.; Wirz-Justice, A. Circadian clues to sleep onset mechanisms. Neuropsychopharmacology 2001, 25, S92–S96. [Google Scholar] [CrossRef] [PubMed]
  89. Kalsbeek, A.; la Fleur, S.; Fliers, E. Circadian control of glucose metabolism. Mol. Metab. 2014, 3, 372–383. [Google Scholar] [CrossRef] [PubMed]
  90. Corbalán-Tutau, M.D.; Madrid, J.A.; Ordovás, J.M.; Smith, C.E.; Nicolás, F.; Garaulet, M. Differences in daily rhythms of wrist temperature between obese and normal-weight women: Associations with metabolic syndrome features. Chronobiol. Int. 2011, 28, 425–433. [Google Scholar] [CrossRef]
  91. Zerón-Rugerio, M.F.; Diez-Noguera, A.; Izquierdo-Pulido, M.; Cambras, T. Adiposity and body mass index of young women are associated with altered 24-hour profile of wrist temperature and sleep quality. Chronobiol. Int. 2020, 37, 1580–1590. [Google Scholar] [CrossRef]
  92. Hoffmann, M.E.; Rodriguez, S.M.; Zeiss, D.M.; Wachsberg, K.N.; Kushner, R.F.; Landsberg, L.; Linsenmeier, R.A. 24-h core temperature in obese and lean men and women. Obesity 2012, 20, 1585–1590. [Google Scholar] [CrossRef]
  93. Gubin, D.G.; Nelaeva, A.A.; Uzhakova, A.E.; Hasanova, Y.V.; Cornelissen, G.; Weinert, D. Disrupted circadian rhythms of body temperature, heart rate and fasting blood glucose in prediabetes and type 2 diabetes mellitus. Chronobiol. Int. 2017, 34, 1136–1148. [Google Scholar] [CrossRef] [PubMed]
  94. Heikens, M.J.; Gorbach, A.M.; Eden, H.S.; Savastano, D.M.; Chen, K.Y.; Skarulis, M.C.; Yanovski, J.A. Core body temperature in obesity. Am. J. Clin. Nutr. 2011, 93, 963–967. [Google Scholar] [CrossRef] [PubMed]
  95. Li, Y.; Wu, H.; Liu, N.; Cao, X.; Yang, Z.; Lu, B.; Hu, R.; Wang, X.; Wen, J. Melatonin exerts an inhibitory effect on insulin gene transcription via MTNR1B and the downstream Raf-1/ERK signaling pathway. Int. J. Mol. Med. 2018, 41, 955–961. [Google Scholar] [CrossRef] [PubMed]
  96. Hu, C.; Jia, W. Linking MTNR1B variants to diabetes: The role of circadian rhythms. Diabetes. 2016, 65, 1490–1492. [Google Scholar] [CrossRef] [PubMed]
  97. Dijk, D.J.; Cajochen, C.; Borbély, A.A. Effect of a single 3-hour exposure to bright light on core body temperature and sleep in humans. Neurosci. Lett. 1991, 121, 59–62. [Google Scholar] [CrossRef] [PubMed]
  98. Cajochen, C.; Dijk, D.J.; Borbély, A.A. Dynamics of EEG slow-wave activity and core body temperature in human sleep after exposure to bright light. Sleep 1992, 15, 337–343. [Google Scholar] [PubMed]
  99. Gubin, D.G.; Weinert, D.; Rybina, S.V.; Danilova, L.A.; Solovieva, S.V.; Durov, A.M.; Prokopiev, N.Y.; Ushakov, P.A. Activity, sleep and ambient light have a different impact on circadian blood pressure, heart rate and body temperature rhythms. Chronobiol. Int. 2017, 34, 632–649. [Google Scholar] [CrossRef] [PubMed]
  100. Gubin, D.; Weinert, D.; Solovieva, S.V.; Durov, A.M.; Litvinova, N.S.; Danilova, L.A.; Prokopiev, N.Y.; Trushnikov, D.Y.; Kartashova, E.A. Melatonin attenuates light-at-night effects on systolic blood pressure and body temperature but does not affect diastolic blood pressure and heart rate circadian rhythms. Biol. Rhythm. Res. 2020, 51, 780–793. [Google Scholar] [CrossRef]
  101. Choi, Y.; Nakamura, Y.; Akazawa, N.; Park, I.; Kwak, H.B.; Tokuyama, K.; Maeda, S. Effects of nocturnal light exposure on circadian rhythm and energy metabolism in healthy adults: A randomized crossover trial. Chronobiol. Int. 2022, 39, 602–612. [Google Scholar] [CrossRef]
  102. Aschbacher, K.; Rodriguez-Fernandez, M.; van Wietmarschen, H.; Tomiyama, A.J.; Jain, S.; Epel, E.; Doyle, F.J., 3rd; van der Greef, J. The hypothalamic-pituitary-adrenal-leptin axis and metabolic health: A systems approach to resilience, robustness and control. Interface Focus 2014, 4, 20140020. [Google Scholar] [CrossRef]
  103. Malcher-Lopes, R.; Di, S.; Marcheselli, V.S.; Weng, F.J.; Stuart, C.T.; Bazan, N.G.; Tasker, J.G. Opposing crosstalk between leptin and glucocorticoids rapidly modulates synaptic excitation via endocannabinoid release. J. Neurosci. 2006, 26, 6643–6650. [Google Scholar] [CrossRef] [PubMed]
  104. Pralong, F.P.; Roduit, R.; Waeber, G.; Castillo, E.; Mosimann, F.; Thorens, B.; Gaillard, R.C. Leptin inhibits directly glucocorticoid secretion by normal human and rat adrenal gland. Endocrinology 1998, 139, 4264–4268. [Google Scholar] [CrossRef] [PubMed]
  105. Paul, R.F.; Hassan, M.; Nazar, H.S.; Gillani, S.; Afzal, N.; Qayyum, I. Effect of body mass index on serum leptin levels. J. Ayub. Med. Coll. Abbottabad. 2011, 23, 40–43. [Google Scholar] [PubMed]
  106. Cheng, J.; Luo, Y.; Li, Y.; Zhang, F.; Zhang, X.; Zhou, X.; Ji, L. Sex- and body mass index-specific reference intervals for serum leptin: A population based study in China. Nutr. Metab. 2022, 19, 54. [Google Scholar] [CrossRef] [PubMed]
  107. Mäntele, S.; Otway, D.T.; Middleton, B.; Bretschneider, S.; Wright, J.; Robertson, M.D.; Skene, D.J.; Johnston, J.D. Daily rhythms of plasma melatonin, but not plasma leptin or leptin mRNA, vary between lean, obese and type 2 diabetic men. PLoS ONE 2012, 7, e37123. [Google Scholar] [CrossRef] [PubMed]
  108. Figueiro, M.G.; Plitnick, B.; Rea, M.S. Light modulates leptin and ghrelin in sleep-restricted adults. Int. J. Endocrinol. 2012, 2012, 530726. [Google Scholar] [CrossRef] [PubMed]
  109. Driller, M.W.; Jacobson, G.; Uiga, L. Hunger hormone and sleep responses to the built-in blue-light filter on an electronic device: A pilot study. Sleep Sci. 2019, 12, 171–177. [Google Scholar] [CrossRef]
  110. Jung, C.M.; Khalsa, S.B.; Scheer, F.A.; Cajochen, C.; Lockley, S.W.; Czeisler, C.A.; Wright, K.P., Jr. Acute effects of bright light exposure on cortisol levels. J. Biol. Rhythm. 2010, 25, 208–216. [Google Scholar] [CrossRef]
  111. Leproult, R.; Colecchia, E.F.; L’Hermite-Balériaux, M.; Van Cauter, E. Transition from dim to bright light in the morning induces an immediate elevation of cortisol levels. J. Clin. Endocrinol. Metab. 2001, 86, 151–157. [Google Scholar] [CrossRef]
  112. Schöllhorn, I.; Deuring, G.; Stefani, O.; Strumberger, M.A.; Rosburg, T.; Lemoine, P.; Pross, A.; Wingert, B.; Mager, R.; Cajochen, C. Effects of nature-adapted lighting solutions (“Virtual Sky”) on subjective and objective correlates of sleepiness, well-being, visual and cognitive performance at the workplace. PLoS ONE 2023, 18, e0288690. [Google Scholar] [CrossRef]
Figure 1. Twenty-four-hour patterns of blue light exposure in the Arctic by seasons. (A,B) Mean blue light exposure during four seasons (spring equinox, autumn equinox, winter polar night, summer polar day) in Arctic residents. (C) Mean values of blue light exposure for consecutive 30 min epochs during spring equinox (blue line) against reference curve of optimal light exposure (red line). Vertical bars denote 95% confidence intervals. Reference curve for optimal blue light exposure is dashed brown line. (D) log10-transformed values of blue light exposure for consecutive 30 min epochs during spring equinox (blue line) against log10-transformed reference curve of the optimal light exposure (red line).
Biology 13 00022 g001
Figure 2. Subtle differences in nocturnal blue light exposure challenge metabolic health in the Arctic spring. (A) Distinct 30 min time windows of blue light exposure in Arctic residents with different body mass index (BMI) values. Twenty-four-hour patterns of blue light exposure, expressed as log10 in normal weight (BMI < 25); overweight (BMI = 25–30) and obese (BMI > 30) individuals are depicted. Vertical bars denote 95% confidence intervals. Green lines BMI <25; red lines BMI >25; black lines BMI >30 ● p < 0.1 (22:00–22:30; 00:30–01:00); * p < 0.05 (21:00–22:00); ** p < 0.01 (23:00–00:30; 02:00–02:30) for mean-rank differences between BMI < 25 and 25–30; # p < 0.05 (23:00–23:30 and 02:00–02:30) for mean-rank differences between BMI = 25–30 and >30. Note higher exposure to blue light in the evening and early night among overweight and obese compared to lean participants. (B) Chart of r-values from linear regression of BMI with respect to blue light exposure (ordinate) in consecutive 30 min time windows (abscissa) (blue curve). Horizontal light blue line corresponds to the threshold of significance at p < 0.05; dark-blue horizontal line: threshold of significance after Benjamini–Hochberg’s correction for multiple testing at 0.1. Red curve: cosinor model rejects zero-amplitude assumption of no rhythmicity (p = 0.002), acrophase = 23:24.
Biology 13 00022 g002
Figure 3. MTNR1B rs10830963 G-allele defines the association between body mass index (BMI) and wrist temperature (wT) MESOR. (A,B) Lower wT MESOR is associated with BMI in G-allele carriers but not in those with the CC genotype. Strength of correlation between wT MESOR and BMI is significantly stronger in MTNR1B G-allele carriers ((A), r = −0.659; p = 0.0009, n = 22) than in those with the CC genotype ((B), r = 0.049; p = 0.803, n = 28); z = −2.825, p = 0.005. (C,D) Twenty-four-hour patterns show lower wT, particularly in the morning, in overweight G-allele carriers than in normal-weight G-allele carriers (C); this difference is absent in those with the CC genotype (D). Vertical bars denote 95% confidence intervals. blue BMI < 25; red BMI > 25.
Biology 13 00022 g003
Figure 4. Association between higher nocturnal blue light exposure and higher body mass index (BMI) is linked to the MTNR1B rs10830963 G-allele. (A,B) ANOVA for Time*group interaction, blue light exposure log10 in MTNR1B G-allele carriers (A), F(47, 1584) = 1.982, p = 0.0001; in those with the MTNR1B CC genotype (B), F(47, 1248) =1.383, p = 0.046. Time * BMI * MTNR1B interaction for blue light exposure log10 is significant, F(47, 2832) =1.504, p = 0.015. Thirty-minute time windows of normalized wrist temperature and activity in Arctic residents with different BMIs. Vertical bars denote 95% confidence intervals. (C,D) Chart of r-values from a linear regression of BMI with blue light exposure (ordinate) in consecutive 30 min time windows (abscissa) (blue curve). (C) G-allele carriers; (D) CC genotype (non-carriers). Horizontal light blue line corresponds to the threshold of significance at p < 0.05; dark-blue horizontal line corresponds to the threshold of significance after Benjamini–Hochberg’s correction for multiple testing at 0.1. Thresholds are similar for G-allele carriers. Red curve: cosinor model rejects zero-amplitude assumption of no rhythmicity; p < 0.00001, acrophase = 01:41 for G-allele carriers, CG + GG genotypes; p = 0.0002; acrophase = 17:15 for CC genotype. Correlation of the higher evening blue light exposure with the higher BMI after correction for multiple testing is significant in G-allele carriers during time epochs shaded in blue.
Biology 13 00022 g004
Table 1. General characteristics of body mass index and age depending on sex, indigeneity and MTNR1B rs10830963 polymorphism and within age groups.
SexIndigeneityMTNR1B Genotype
Females
(n)
Males
(n)
p-ValueNon-Natives
(n)
Natives
(n)
p-ValueGG + GC
(n)
CC
(n)
p-Value
Age28.4 ± 12.6
(51)
38.0 ± 14.0 (11)0.04140.7 ± 11.0
(38)
29.2 ± 15.9 (24)0.00139.8 ± 12.6
(22)
40.4 ± 11.4 (28)0.854
Age,
>20 y.
37.1 ± 3.8
(41)
43.7 ± 8.6
(7)
0.05443.0 ± 8.0
(35)
42.0 ± 9.6
(13)
0.70943.6 ± 8.4
(19)
42.5 ± 8.5
(26)
0.675
Age,
12–16 y.
13.0 ± 1.4
(10)
14.4 ± 1.4
(4)
0.10914.0 ± 2.6
(3)
14.0 ± 1.2
(11)
0.99915.3 ± 1.5
(3)
12.5 ± 0.7
(2)
0.100
BMI24.2 ± 4.6
(51)
24.2 ± 4.9
(11)
0.99525.4 ± 4.6
(38)
22.2 ± 4.6
(24)
0.01025.1 ± 4.7
(22)
24.1 ± 4.7
(28)
0.456
BMI,
>20 y.
25.1 ± 5.0
(41)
26.8 ± 3.4
(7)
0.48925.8 ± 4.5
(35)
24.1 ± 5.4
(13)
0.27825.8 ± 4.6
(19)
24.1 ± 5.4
(26)
0.312
BMI,
12–16 y.
20.2 ± 1.7
(10)
19.5 ± 1.5
(4)
0.38920.3 ± 1.5
(3)
19.9 ± 1.7
(11)
0.75020.4 ± 1.2
(3)
20.2 ± 2.2
(2)
0.896
Mean values and standard deviations are indicated. p-values are from one-way ANOVA. N in parentheses—number of participants included in the study.
Table 2. Actigraphy-based associations with body mass index (BMI) in Arctic residents during spring equinox (n = 62).
VariableBMI GroupsRegression with BMI
1. Normal
(<25, n = 40)
2. Overweight (25–30, n = 11)3. Obesity
(30–35, n = 11)
K-W p-ValuerpMR + CF p
Activity, PIM #
MESOR2606 ± 6092226 ± 5392708 ± 10750.257−0.0790.5410.494
24 h A2002 ± 6381633 ± 4471823 ± 8530.182−0.2340.0670.727
Phase14:47 ± 1:1614:54 ± 1:2214:31 ± 1:160.854−0.1530.2340.222
M104270 ± 10703650 ± 8164288 ± 18610.208−0.1200.3540.428
M10 Onset9:08 ± 1:178:32 ± 1:258:58 ± 1:000.4020.1750.1740.334
L5231 ± 208124 ± 69271 ± 2420.0680.0770.5540.855
L5 Onset1:34 ± 1:111:29 ± 1:132:04 ± 1:230.406−0.1230.3420.843
IV0.888 ± 0.1670.847 ± 0.1640.836 ± 0.1800.484−0.1470.2550.178
IS0.563 ± 0.1130.523 ± 0.1030.497 ± 0.0670.068−0.1860.1470.894
RA0.893 ± 0.0650.903 ± 0.0500.836 ± 0.0710.056−0.3450.006 *0.299
CFI0.676 ± 0.0580.663 ± 0.0560.600 ± 0.0710.546−0.1720.1820.994
Wrist temperature, °C #
MESOR31.99 ± 0.5031.63 ± 0.4031.29 ± 0.640.002 1–3−0.491<0.0001 *0.008 *
24 h A1.42 ± 0.531.29 ± 0.571.29 ± 0.590.694−0.0720.5760.161
Phase2:58 ± 1:272:19 ± 1:432:22:1:500.397−0.3220.011 *0.012 *
Sleep characteristics, hh:mm #
Bedtime22:35 ± 0:5622:59 ± 1:1522:49 ± 1:330.587−0.0030.9830.618
Wake time6:51 ± 1:037:13 ± 1:387:07 ± 2:090.395−0.0280.8260.576
Sleep phase2:43 ± 0:543:06 ± 1:152:54 ± 1:330.514−0.0400.7600.432
Time in bed8:13 ± 0:508:13 ± 1:278:17 ± 2:060.6630.0130.9210.931
Total sleep7:19 ± 0:447:10 ± 1:187:22 ± 2:060.4670.0740.5680.767
Sleep latency, min02.05 ± 1.683.08 ± 2.923.18 ± 2.630.279−0.2280.0750.174
Sleep efficiency, %88.67 ± 4.0385.58 ± 6.2488.15 ± 6.730.396−0.2070.1060.613
WASO0:50 ± 0:210:58 ± 0:270:50 ± 0:300.6190.1470.2540.721
Blue light, μw/cm2 #
MESOR9.65 ± 7.0015.23 ± 10.1912.46 ± 5.750.0740.1580.2210.146
24 h A13.89 ± 9.7822.54 ± 15.8118.11 ± 9.570.1360.1490.2490.167
Phase12:58 ± 0:5312:34 ± 0:5112:58 ± 0:290.6990.0990.4420.420
M1019.81 ± 11.9834.06 ± 23.2826.44 ± 13.430.0750.1780.1660.661
M10 Onset7:57 ± 0:517:43 ± 0:397:57 ± 0:380.7800.0800.5350.550
L50.06 ± 0.140.07 ± 0.160.10 ± 0.110.1260.0860.5060.006 *
L5 Onset1:15 ± 1:470:40 ± 0:432:26 ± 2:200.035 2–3−0.2370.0630.505
L5 log10−2.42 ± 1.28−2.29 ± 1.25−1.55 ± 0.930.1290.3080.015 *0.185
IV0.937 ± 0.3520.924 ± 0.3610.879 ± 0.2970.933−0.0410.7520.168
IS0.381 ± 0.1330.444 ± 0.1880.375 ± 0.1050.4550.1030.4280.110
RA0.988 ± 0.0230.985 ± 0.0220.969 ± 0.0270.022 1–3−0.3000.018 *0.148
DDIbl367 ± 106277 ± 150313 ± 1060.052−0.1850.1500.943
NEIbl1.49 ± 1.583.37 ± 3.383.39 ± 2.210.003 1–2/1–30.4170.0008 *0.005 *
All values in the groups are mean ± SD. 24 h A—24 h amplitude; M10—average value of 10 h of greatest activity or blue light exposure; L5—5 h of lowest activity or blue light exposure; IV—intra-daily variability; IS—inter-daily stability; RA—relative amplitude; DDIbl—daylight deficiency index; NEIbl—nocturnal excess index; CFI—circadian function index; K-W p—Kruskall–Wallis p-value, where numbers show significant differences between particular BMI groups; phases and onset times are indicated in hh:mm; DDIbl and NEIbl in μw/cm2 × hour; significant differences between the groups, post Tukey HST; and non-zero correlations are in bold. * Significant after correction for multiple testing at Benjamini–Hochberg’s FDR = 0.10; MR + CF p—p-value from multiple regression model including all related variables after correction for co-factors of age, sex and population. #—unless otherwise indicated.
Table 3. Actigraphy-based associations with leptin and cortisol in Arctic residents during spring equinox (n = 62).
VariableLeptinCortisol
rpMR + CF prpMR + CF p
Activity (power integrative mode)
MESOR−0.2880.0240.132−0.1740.1840.374
24 h Amplitude−0.2890.024 *0.583−0.1340.3080.360
Phase−0.2790.030 *0.2100.1860.1550.071
M10−0.3080.0160.208−0.2050.1160.177
M10 Onset−0.2420.0600.325−0.1160.3780.518
L50.0690.5970.809−0.2660.0400.074
L5 Onset0.0790.5450.807−0.0330.8020.969
IV−0.0450.7280.277−0.0170.8950.686
IS0.1230.3440.8190.0120.9270.685
RA−0.1590.2220.8670.2270.0810.077
CFI0.0150.9120.631−0.0490.7080.910
Wrist temperature
MESOR−0.1300.3180.2990.1060.4200.269
24 h Amplitude−0.1590.2200.2350.1140.3870.617
Phase−0.3020.014 *0.1040.0030.9820.788
Sleep characteristics
Bedtime0.2140.0980.132−0.1610.2200.166
Wake time−0.0130.3870.7770.1370.2980.317
Sleep phase0.1790.1670.353−0.1680.2010.353
Time in bed−0.0780.5500.258−0.0340.7950.657
Total sleep0.0360.7850.571−0.0270.8400.678
Sleep latency−0.0610.6400.8500.0540.6800.773
Sleep efficiency, %−0.1790.1670.3360.0700.5950.618
WASO−0.3390.008 *0.0490.0320.2200.836
Blue light
MESOR−0.0990.4460.390−0.1870.1520.324
24 h Amplitude−0.1100.3990.344−0.2010.1230.909
Phase−0.1620.2130.668−0.1470.2620.546
M10−0.0820.5320.408−0.2410.0640.186
M10 Onset−0.1300.3180.776−0.3170.0140.016
L50.0170.8990.085−0.0580.6590.425
L5 Onset0.1820.1610.309−0.0100.9340.679
L5 log100.1780.1690.412−0.0100.9340.995
IV0.2280.0780.0520.2150.1000.093
IS−0.0370.4280.052−0.0920.4860.571
RA−0.1750.1770.713−0.0790.5500.248
DDIbl0.0470.7330.7620.2560.0490.148
NEIbl0.1550.2340.115−0.1500.2510.650
M10—average value of 10 h of greatest activity or blue light exposure; L5—5 h of lowest activity or blue light exposure; IV—intra-daily variability; IS—inter-daily stability; RA—relative amplitude; DDIbl—daylight deficiency index of blue light; NEIbl— nocturnal excess index of blue light; CFI—circadian function index; phases and onset times are indicated in hh:mm; DDIbl and NEIbl in μw/cm2 × hour; significant differences between the groups, post Tukey HST, and non-zero correlations after FDR correction for multiple testing are in bold. * after correction for multiple testing at Benjamini–Hochberg’s FDR = 0.10; MR + CF p—p-value from multiple regression model including all related variables after correction for co-factors of age, sex and population.
Table 4. Population-, age- and sex-related differences in actigraphy-based indices in Arctic residents during spring equinox (n = 62).
VariablePopulationAgeSex
Non-Natives
(n = 38)
Natives
(n = 24)
12–16
(n = 14)
20–59
(n = 48)
Males
(n = 11)
Females
(n = 51)
Activity, PIM
MESOR2263 ± 5343022 ± 706 ***2803 ± 6872485 ± 7032706 ± 8232525 ± 685
24 h Amplitude1596 ± 4012393 ± 695 **2472 ± 7481739 ± 532 *2232 ± 9691834 ± 558
Phase14:33 ± 1:2415:05 ± 0:5614:48 ± 0:4914:45 ± 1:2215:29 ± 1:0414:36 ± 1.15 *
M103634 ± 8125000 ± 1279 ***4842 ± 12883965 ± 11254606 ± 15824067 ± 1112
M10 Onset8:43 ± 1:259:27 ± 0:499:15 ± 1:008:56 ± 1:209:32 ± 0:518:53 ± 1:19
L5217 ± 219222 ± 171125 ± 46246 ± 219 *151 ± 79234 ± 215
L5 Onset1:42 ± 1:201:32 ± 1:020:54 ± 0:521:51 ± 1:14 *1:36 ± 1:141:39 ± 1:14
IV0.894 ± 0.1730.837 ± 0.1560.881 ± 0.1830.869 ± 0.1650.820 ± 0.1570.883 ± 0.169
IS0.519 ± 0.0980.584 ± 0.1100.597 ± 0.1210.529 ± 0.0980.448 ± 0.1220.565 ± 0.092 *
RA0.872 ± 0.0730.905 ± 0.0520.948 ± 0.0190.867 ± 0.065 ***0.899 ± 0.0570.882 ± 0.069
CFI0.651 ± 0.0570.695 ± 0.0540.699 ± 0.0560.660 ± 0.0580.654 ± 0.0650.671 ± 0.058
Wrist temperature, °C
MESOR31.63 ± 0.5332.07 ± 0.55 *32.26 ± 0.5631.67 ± 0.5131.55 ± 0.7331.86 ± 0.53
24 h Amplitude1.49 ± 0.581.19 ± 0.44 *1.29 ± 0.521.40 ± 0.551.60 ± 0.511.33 ± 0.54
Phase2:25 ± 1:393:16 ± 1:182:59:1:362:41:1:343:27 ± 1:022:36 ± 1:38
Sleep characteristics, hh:mm
Bedtime22:42 ± 1:1422:42 ± 0:5422:28 ± 1:0122:46 ± 1:1222:58 ± 1:1622:38 ± 1:05
Wake time7:01 ± 1:316:52 ± 1:096:51 ± 2:096:59 ± 1:297:36 ± 2:066:49 ± 1:09
Sleep phase2:51 ± 1:122:45 ± 0:542:39 ± 0:452:52 ± 1:103:17 ± 1:222:43 ± 0:57
Time in bed8:17 ± 1:238:08 ± 0:588:20 ± 0:598:12 ± 1:188:38 ± 1:348:08 ± 1:09
Total sleep7:18 ± 1:177:17 ± 0:587:34 ± 0:547:13 ± 1:147:50 ± 1:407:11 ± 1:01
Sleep latency, min02.58 ± 2.3502.21 ± 1.801.78 ± 1.582.63 ± 2.2701.92 ± 2.3602.55 ± 2.12
Sleep efficiency, %88.67 ± 4.0385.58 ± 6.2488.15 ± 6.7388.15 ± 6.7388.59 ± 6.3587.90 ± 4.79
WASO0:54 ± 0:270:47 ± 0:180:42 ± 0:170:54 ± 0:250:45 ± 0:210:53 ± 0:24
Blue light, μw/cm2
MESOR13.00 ± 7.838.20 ± 6.368.10 ± 6.3612.03 ± 7.8316.98 ± 11.739.88 ± 5.90 **
24 h Amplitude18.61 ± 12.3812.31 ± 8.3012.18 ± 10.2917.34 ± 11.4625.21 ± 17.0314.22 ± 8.77 **
Phase12:46 ± 0:5213:07 ± 0:5513:27 ± 1:0212:44 ± 0:48 *13:30 ± 1:1812:48 ± 0:46
M1027.00 ± 16.9118.00 ± 14.6018.54 ± 14.6024.96 ± 15.6234.18 ± 21.5521.21 ± 13.06 *
M10 Onset7:50 ± 0:468:01 ± 0:478:10 ± 0:517:49 ± 0:448:15 ± 0:557:50 ± 0:44
L50.100 ± 0.1690.024 ± 0.0490.003 ± 0.0060.091 ± 0.1540.075 ± 0.1580.070 ± 0.138
L5 Onset1:34 ± 2:101:01 ± 1:010:29 ± 0:481:36 ± 1:571:13 ± 1:211:23 ± 1:55
L5 log10−2.02 ± 1.28−2.60 ± 1.13−3.40 ± 0.88−1.90 ± 1.13 **−2.35 ± 1.43−2.22 ± 1.22
IV0.915 ± 0.3410.904 ± 0.3451.030 ± 0.3510.894 ± 0.3341.077 ± 0.3850.892 ± 0.324
IS0.397 ± 0.1530.382 ± 0.1190.362 ± 0.1340.400 ± 0.1420.322 ± 0.1810.406 ± 0.127
RA0.980 ± 0.0290.992 ± 0.0140.999 ± 0.0010.980 ± 0.026 *0.988 ± 0.0220.984 ± 0.025
DDIbl308 ± 88394 ± 64 **400 ± 96324 ± 119 *282 ± 175354 ± 100
NEIbl2.81 ± 2.391.12 ± 1.50 ***0.89 ± 1.652.56 ± 2.29 **2.55 ± 2.252.07 ± 2.28
All values in the groups are mean ± SD. M10—average value of 10 h of greatest activity or blue light exposure; L5—5 h of lowest activity or blue light exposure; IV—intra-daily variability; IS—inter-daily stability; RA—relative amplitude; DDIbl—daylight deficiency index of blue light; NEIbl—nocturnal excess index of blue light; CFI—circadian function index; phases and onset times are indicated in hh:mm; DDIbl and NEIbl in μw/cm2 × hour; significant differences from Mann–Whitney rank-sum test are in bold: * p < 0.05; ** p < 0.01; *** p < 0.001.
Disclaimer/Publisher’s Note: The statements, opinions and data contained in all publications are solely those of the individual author(s) and contributor(s) and not of MDPI and/or the editor(s). MDPI and/or the editor(s) disclaim responsibility for any injury to people or property resulting from any ideas, methods, instructions or products referred to in the content.

