Article

Insights into the Mitochondrial Genetic Makeup and Miocene Colonization of Primitive Flatfishes (Pleuronectiformes: Psettodidae) in the East Atlantic and Indo-West Pacific Ocean

1
Institute of Fisheries Science, Pukyong National University, Busan 48513, Republic of Korea
2
Department of Marine Biology, Pukyong National University, Busan 48513, Republic of Korea
3
Research Center for Conservation of Marine and Inland Water Resources, National Research and Innovation Agency, Cibinong 16911, Indonesia
4
Institute of Marine Life Science, Pukyong National University, Busan 48513, Republic of Korea
5
Marine Integrated Biomedical Technology Center, National Key Research Institutes in Universities, Pukyong National University, Busan 48513, Republic of Korea
6
The Ministry of Livestock, Fisheries and Animal Industries (MINEPIA), Yaounde 00237, Cameroon
7
Fisheries Resources Management Division, National Institute of Fisheries Science, Busan 46083, Republic of Korea
*
Author to whom correspondence should be addressed.
These authors contributed equally to this work.
Biology 2023, 12(10), 1317; https://doi.org/10.3390/biology12101317
Submission received: 21 August 2023 / Revised: 25 September 2023 / Accepted: 6 October 2023 / Published: 9 October 2023
(This article belongs to the Special Issue Integrating Science into Aquatic Conservation)

Abstract

:

Simple Summary

The present research enriches our comprehension of the mitogenomic genetic features, genetic diversity, evolutionary past, and conservation prerequisites of Psettodes flatfishes on a global scale. This study focuses on the matrilineal evolutionary path of these primitive groups, with a specific emphasis on the complete mitogenome of the Psettodes belcheri and casting light on its genetic composition, structural traits, and evolutionary chronicle. Exploring genetic variations and phylogenetic relationships uncovers the intricate evolutionary links between Psettodes species and their broader context within the Pleuronectiformes species. The complex interplay of hydrographic conditions, ocean currents, and ecological factors emerges as pivotal in shaping the evolutionary landscape of these flatfishes. Given the potential consequences for conservation, this study highlights the necessity for a holistic comprehension of marine environments and the ramifications of climate change and human interventions on flatfish species.

Abstract

The mitogenomic evolution of the Psettodes flatfishes is still poorly known from their range distribution in eastern Atlantic and Indo-West Pacific Oceans. The study delves into the matrilineal evolutionary pathway of these primitive flatfishes, with a specific focus on the complete mitogenome of the Psettodes belcheri species, as determined through next-generation sequencing. The mitogenome in question spans a length of 16,747 base pairs and comprises a total of 37 genes, including 13 protein-coding genes, 2 ribosomal RNA genes, 22 transfer RNA genes, and a control region. Notably, the mitogenome of P. belcheri exhibits a bias towards AT base pairs, with a composition of 54.15%, mirroring a similar bias observed in its close relative, Psettodes erumei, which showcases percentages of 53.07% and 53.61%. Most of the protein-coding genes commence with an ATG initiation codon, except for Cytochrome c oxidase I (COI), which initiates with a GTG codon. Additionally, four protein-coding genes commence with a TAA termination codon, while seven others exhibit incomplete termination codons. Furthermore, two protein-coding genes, namely NAD1 and NAD6, terminate with AGG and TAG stop codons, respectively. In the mitogenome of P. belcheri, the majority of transfer RNAs demonstrate the classical cloverleaf secondary structures, except for tRNA-serine, which lacks a DHU stem. Comparative analysis of conserved blocks within the control regions of two Psettodidae species unveiled that the CSB-II block extended to a length of 51 base pairs, surpassing the other blocks and encompassing highly variable sites. A comprehensive phylogenetic analysis using mitochondrial genomes (13 concatenated PCGs) categorized various Pleuronectiformes species, highlighting the basal position of the Psettodidae family and showed monophyletic clustering of Psettodes species. The approximate divergence time (35−10 MYA) between P. belcheri and P. erumei was estimated, providing insights into their separation and colonization during the early Miocene. The TimeTree analysis also estimated the divergence of two suborders, Psettodoidei and Pleuronectoidei, during the late Paleocene to early Eocene (56.87 MYA). The distribution patterns of Psettodes flatfishes were influenced by ocean currents and environmental conditions, contributing to their ecological speciation. In the face of climate change and anthropogenic activities, the conservation implications of Psettodes flatfishes are emphasized, underscoring the need for regulated harvesting and adaptive management strategies to ensure their survival in changing marine ecosystems. Overall, this study contributes to understanding the evolutionary history, genetic diversity, and conservation needs of Psettodes flatfishes globally. However, the multifaceted exploration of mitogenome and larger-scale genomic data of Psettodes flatfish will provide invaluable insights into their genetic characterization, evolutionary history, environmental adaptation, and conservation in the eastern Atlantic and Indo-West Pacific Oceans.

1. Introduction

Flatfishes, also known as flounders, soles, halibuts, turbots, plaices, and tonguefishes, are classified as Pleuronectiformes. This order is split into two suborders: Psettodoidei, which includes the single-family Psettodidae, and Pleuronectoidei, which includes 13 families [1]. Flatfishes live mostly in tropical and subtropical marine habitats, preferring shallow parts of the continental shelf with soft sandy bottoms [2]. Their evolutionary journey, particularly marked by cranial asymmetry and unique scale structures, has facilitated their successful adaptation and dominance in benthic aquatic habitats [3,4,5]. The genus Psettodes is a “primitive” flatfish group within the monotypic Psettodidae family, with three recognized species: Psettodes belcheri, Psettodes bennettii, and Psettodes erumei [6]. While P. erumei, commonly referred to as the Indian halibut, ranges expansively across the Red Sea and the Indo-West Pacific Ocean, the other two species are confined to the eastern Atlantic. Intriguingly, the ranges of P. belcheri and P. bennettii exhibit partial overlap, spanning from the west Sahara to the Liberian coast.
The economic significance of flatfishes has led to their frequent capture through demersal trawling in marine ecosystems [7]. The Indian halibut (P. erumei) is heavily harvested within the tropical fishing zone as defined by the United Nations Food and Agriculture Organization (FAO) [8]. Despite this heavy exploitation, the IUCN Red List classifies information on the status of these three Psettodes species as ‘Data Deficient.’ [9]. Furthermore, the extraordinary transformation from bilateral pelagic larval symmetry to adult flattened symmetry limits flatfishes to demersal zones on the sea bottom, owing to their unusual temperature-mediated spawning behavior [10]. While most flatfish species have either a right-sided (dextral) or a left-sided (sinistral) mouth, several species, including Psettodes, display varying degrees of dextral to sinistral polymorphism [11]. This sexual dimorphism in external morphology often poses challenges in species identification. Moreover, this characteristic complexity in external appearance frequently hinders precise species differentiation among flatfishes [12].
The integration of molecular data has become integral in the exploration of global flatfish species, encompassing diverse aspects such as species identification [13], systematic classification [14], phylogenetic relationships [15], and population structure estimation [16]. Genetic information has also found utility in identifying valuable commercial species and managing aquaculture stocks [17,18]. The acquisition of comprehensive genomic resources is pivotal for advancing flatfish research and its manifold applications [19]. While the origins of flatfishes have long been debated, recent molecular insights lend support to the concept of a ‘lower-percoid’ origin, a perspective gaining prominence in the field of teleost ichthyology [20,21,22]. The taxonomic placement of Psettodes has stirred argument, especially in the context of analyses involving nuclear and mitogenomic data. This genus consistently diverges from other flatfishes (Pleuronectiformes), instead aligning with other carangimorphs [23,24,25,26]. A comprehensive phylogenetic analysis utilizing 1000 ultraconserved DNA element loci across 45 carangimorphs subsequently solidified the monophyly of flatfishes [27]. Later studies, involving complete mitogenome-based phylogeny and molecular clock analyses, offered insights into the enigmatic placement and evolutionary divergence of the Psettodes genus within the context of other carangimorphs and pleuronectoids [28,29]. However, these investigations were limited to a single Psettodes taxon (P. erumei) from the Indo-Pacific region, highlighting the need for expanded inquiries involving other congeners from the Atlantic Ocean.
An integrated strategy that looks beyond superficial investigation is required for an accurate appraisal of speciation within maritime ecosystems. Advances in technology, spanning maritime engineering to genomics, are facilitating the investigation of marine speciation [30,31]. To enhance our grasp of Psettodes’ maternal evolutionary path, this study seeks to construct the complete mitogenome of P. belcheri, elucidate its genomic attributes, and establish its phylogenetic relationships. This endeavor contributes to understanding the maternal evolution of these ancient lineages in marine environments, strengthening the mitogenomic repository of flatfishes, and expanding our scientific insight into the Psettodidae family on a global scale. While marine habitats harbor a diverse array of life forms, our understanding of speciation in marine ecosystems is comparatively limited compared with freshwater systems, necessitating urgent exploration of the mechanisms driving speciation and adaptation [32]. Given the unique distribution of Psettodidae flatfishes across the eastern Atlantic, Red Sea, and Indo-West Pacific Ocean, this study also aims to estimate the divergence time between two Psettodidae species (P. belcheri and P. erumei) and investigate potential evolutionary scenarios within the marine environment.

2. Materials and Methods

2.1. Sampling and Species Identification

A solitary specimen of the spottail spiny turbot, scientifically known as P. belcheri, was acquired from the estuaries of the Kineke River (latitude 2.938611° N, longitude 9.911667° E) located in Kribi, Cameroon (Figure 1). The identification process was meticulously carried out in accordance with available taxonomic keys [33]. Upon euthanizing the specimen with MS-222 (200 mg/L), muscle tissue was aseptically collected from the ventral thoracic region. The voucher specimen was duly archived in 10% formaldehyde at the Fisheries and Animal Industries department (MINEPIA) in Yaoundé, Cameroon. Simultaneously, a tissue sample was preserved at the Department of Marine Biology, Pukyong National University in Busan, South Korea. The Institutional Animal Care and Use Committee of the host institute granted approval (Approval Code: PKNUIACUC-2022-72, dated 16 December 2022) for the utilization of deceased fish muscle tissue in molecular investigations. To enhance our comprehension of their geographical distribution, global maps of Pleuronectiformes, inclusive of the range distributions of P. belcheri and its congeners (P. erumei and P. bennettii), were obtained in .shp file format from the IUCN database (https://www.iucnredlist.org/, accessed on 15 August 2023) (Figure 1).

2.2. DNA Extraction, Mitogenome Sequencing, and Assembly

The AccuPrep® Genomic DNA extraction kit, manufactured by Bioneer in Daejeon, Republic of Korea, was utilized to extract genomic DNA, following the established standard protocol. The quality and quantity of the resulting genomic DNA were meticulously evaluated employing a NanoDrop spectrophotometer (Thermo Fisher Scientific D1000, WA, USA). To obtain the comprehensive mitogenome of P. belcheri, sequencing procedures were executed using the NovaSeq platform, provided by Illumina and accessible at Macrogen (https://dna.macrogen.com/, accessed on 15 August 2023) in Daejeon, Republic of Korea. The sequencing libraries were prepared following the manufacturer’s instructions for the TruSeq Nano DNA High-Throughput Library Prep Kit (Illumina, Inc., San Diego, CA, USA). In short, 100 ng of genomic DNA underwent fragmentation using adaptive focused acoustic technology (Covaris, Woburn, MA, USA), resulting in blunt-ended dsDNA molecules with 5′-phosphorylation. After the end-repair step, DNA fragments were size selected using a bead-based method. These fragments were then modified with the addition of a single ‘A’ base and ligated with TruSeq DNA UD Indexing adapters. Subsequently, the products were purified and enriched through PCR to create the final DNA library. Library quantification was performed using qPCR, following the qPCR Quantification Protocol Guide (KAPA Library Quantification kits for Illumina Sequencing platforms), and quality assessment was carried out using Agilent Technologies 4200 TapeStation D1000 screentape (Agilent Technologies, Santa Clara, CA, USA). Finally, paired-end (2 × 150 bp) sequencing was performed by Macrogen using the NovaSeq platform (Illumina, Inc., San Diego, CA, USA). Over 20 million raw reads underwent processing using the Cutadapt tool (http://code.google.com/p/cutadapt/, accessed on 15 August 2023) to trim adapters and remove low-quality bases, with a Phred quality score (Q score) cutoff of 20. The Geneious Prime version 2023.0.1 was used to assemble the targeted genome from the high-quality paired-end NGS reads. This assembly was accomplished by employing reference mapping with the mitogenome of a closely related species as a reference, and we employed default mapping algorithms. Mitogenome assembly was accomplished by scrutinizing the alignment of overlapping regions via MEGA X [34]. The boundaries and orientations of individual genes were validated using the MITOS v806 (http://mitos.bioinf.uni-leipzig.de, accessed on 15 August 2023) and MitoAnnotator (http://mitofish.aori.u-tokyo.ac.jp/annotation/input/, accessed on 15 August 2023) web servers [35,36]. To further corroborate protein-coding genes (PCGs), the translated putative amino acid sequences were scrutinized using the Open Reading Frame Finder web tool (https://www.ncbi.nlm.nih.gov/orffinder/, accessed on 15 August 2023), based on the vertebrate mitochondrial genetic code. The resultant mitogenome of P. belcheri was duly submitted to the global GenBank database.

2.3. Mitogenomic Characterization

A spherical representation of the generated mitogenome was crafted using MitoAnnotator (http://mitofish.aori.u-tokyo.ac.jp/annotation/input/, accessed on 15 August 2023). A comprehensive comparative analysis was carried out to assess the mitogenomic architecture and variations within our generated sequence in relation to two pre-existing mitogenomes from a single congener, P. erumei (FJ606835, sourced from China, and AP006835, sourced from Japan). The calculation of intergenic spacers, which separate adjacent genes, and overlapping regions was performed manually. To determine the nucleotide compositions of protein-coding genes (PCGs), ribosomal RNA (rRNA), transfer RNA (tRNA), and the control region (CR), we employed MEGA X [34]. Similarly, base composition skews, as previously detailed, were computed using the following formulas: AT-skew = [A − T]/[A + T], GC-skew = [G − C]/[G + C] [37]. The verification of initiation and termination codons for each PCG, as well as adherence to the vertebrate mitochondrial genetic code, was carried out using MEGA X. Additionally, the boundaries of rRNA and tRNA genes were confirmed through the use of the tRNAscan-SE Search Server 2.0 in conjunction with ARWEN 1.2 [38,39]. Structural domains within the control region were delineated through CLUSTAL X alignments [40], and tandem repeats were explored utilizing the online Tandem Repeats Finder web tool (https://tandem.bu.edu/trf/trf.html, accessed on 15 August 2023) [41].

2.4. Genetic Distance, Phylogenetic Analyses, and TimeTree Estimation

Genetic distances were computed using the Kimura 2-parameter (K2P) method within MEGA X. Due to the unavailability of the complete mitogenome of P. bennettii, intra-species and inter-species distances were determined using the widely employed mitochondrial COI gene. To elucidate the matrilineal phylogenetic connections, 14 mitogenomes from 13 Pleuronectiformes species were sourced from the GenBank database (accessed on 15 August 2023) [28,42,43,44,45,46,47,48,49] (Table S1). Dataset preparation adhered to methodologies outlined in two recent Pleuronectiformes studies [26,50]. The spotfin flounder, Cyclopsetta fimbriata, was categorized within the recently established family Cyclopsettidae (=Paralichthyidae II). Additionally, two Cynoglossidae species were included: Cynoglossus gracilis (=Cynoglossidae I) and Symphurus orientalis (=Cynoglossidae II). The mitogenome of Lates calcarifer (DQ010541), from the Centropomidae family, was incorporated as an outgroup. Concatenation of all 13 PCGs was executed using the iTaxoTools 0.1 tool to construct the dataset for phylogenetic analysis [51]. In order to prevent inadvertent gaps within the dataset alignment, we consciously excluded the non-coding rRNA genes and control regions from the current phylogenetic analysis. Model selection yielded the ‘GTR + G + I’ model as the most suitable, determined by the lowest Bayesian Information Criterion (BIC) score using PartitionFinder 2 through CIPRES Science Gateway v3.3 and JModelTest v2 [52,53,54]. Employing Mr. Bayes 3.1.2, a Bayesian (BA) tree was constructed, employing nst = 6, along with one cold and three hot Metropolis-coupled Markov Chain Monte Carlo (MCMC) chains. The analysis spanned 10,000,000 generations with tree sampling at every 100th generation and 25% of samples discarded as burn in [55]. Visualization of the BA tree was accomplished using the iTOL v4 web server (https://itol.embl.de/login.cgi, accessed on 15 August 2023) [56]. Additionally, the divergence time estimation was performed using the RelTime method following standard protocol as implemented in MEGA X [57]. This approach was intended to reduce the large computational time involved in Bayesian methods [58,59]. After loading the sequences data, the constructed maximum-likelihood topology (.nwk format) was used as a baseline tree. After specifying the outgroup taxa, the TimeTree computation incorporated two calibration constraints through the calibration editor: the divergence from the sister lineage of Citharidae (55.54 MYA) and Achiridae (49.73 MYA), as established in a previous study [28].

3. Results and Discussion

3.1. Mitogenomic Structure and Organization

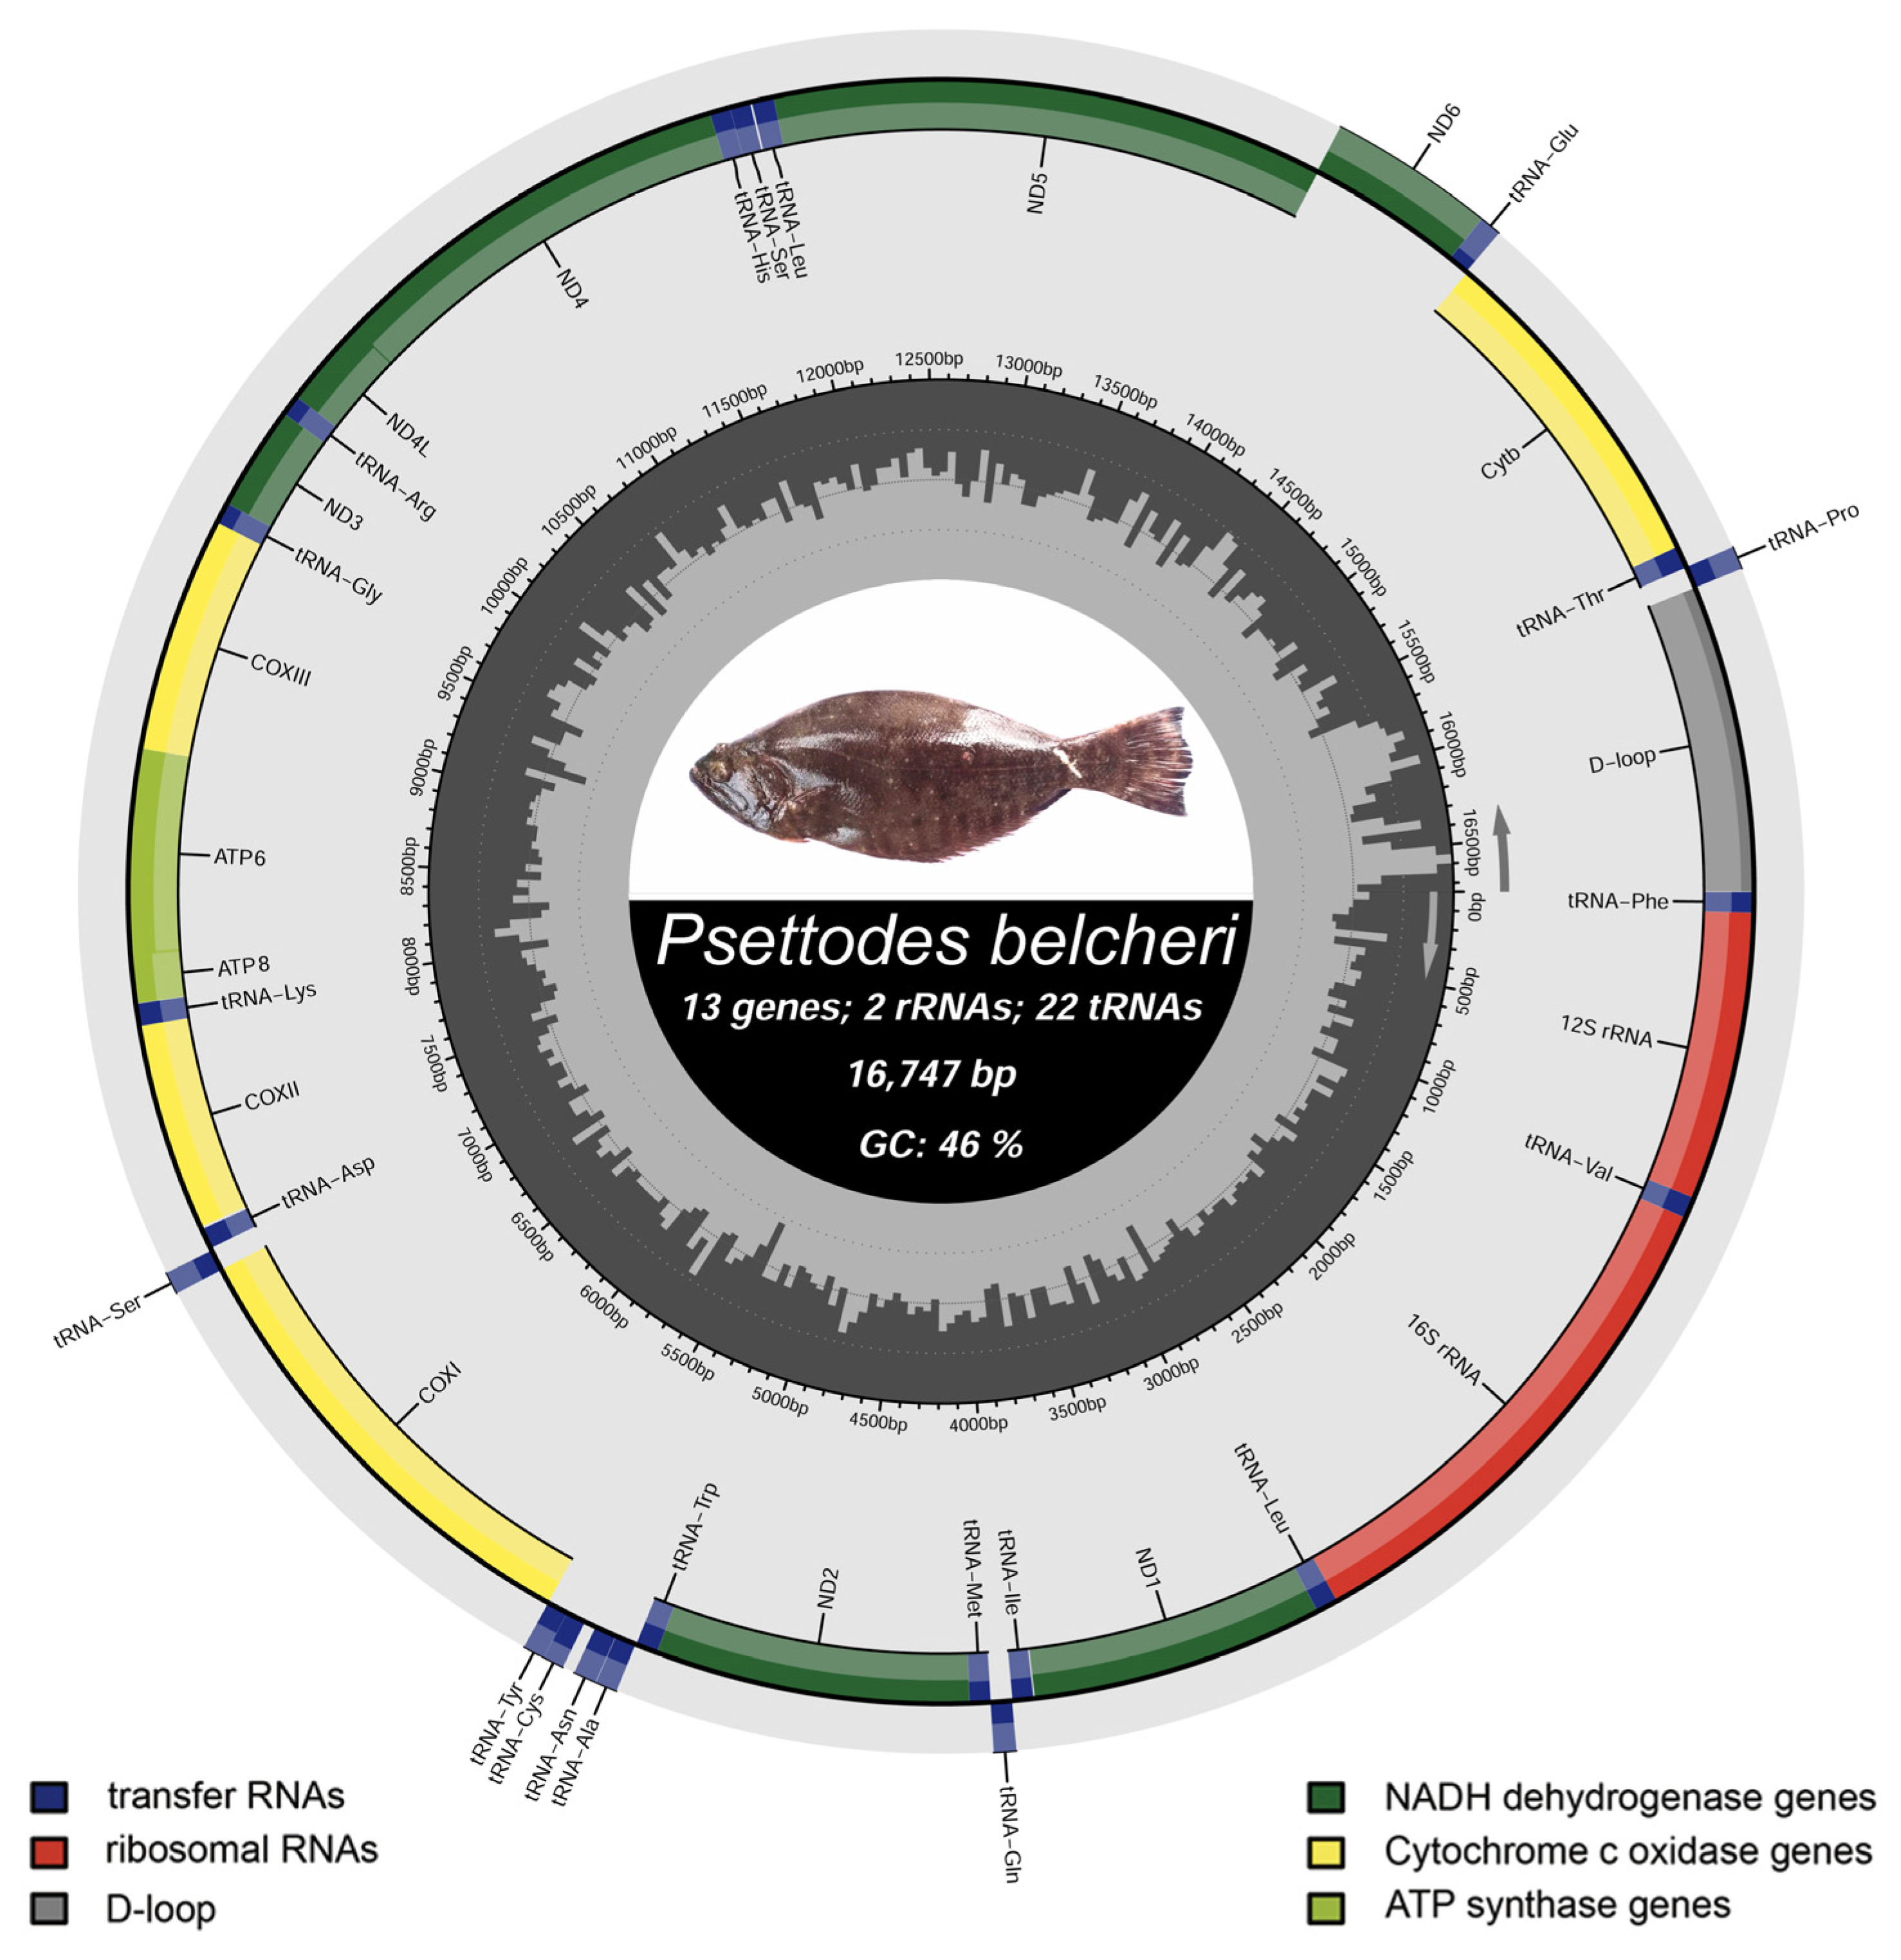
In this study, the mitogenome of P. belcheri (16,739 bp) was characterized and assigned the GenBank accession number OR231239. The circular mitogenome of P. belcheri comprised 13 protein-coding genes (PCGs), 22 transfer RNA genes (tRNAs), 2 ribosomal RNA genes (rRNAs), and a non-coding AT-rich control region (CR). Among these, 28 genes (12 PCGs, 2 rRNAs, and 14 tRNAs) were positioned on the heavy strand, while NAD6 and 8 tRNAs (trnQ, trnA, trnN, trnC, trnY, trnS2, trnE, and trnP) were situated on the light strand (Table 1, Figure 2).
A similar distribution of genes on heavy and light strands was evident in other Pleuronectiformes species, with total lengths ranging from 16,506 bp (C. fimbriata, family Cyclopsettidae, AP014590) to 18,706 bp (Samariscus latus, family Samaridae, KF494223). Variability in mitogenomic lengths was largely attributed to duplications in the control regions (CRs) [44]. The mitogenome of P. belcheri showcased five overlapping regions, spanning a total of 14 bp. The longest overlap (7 bp) was observed between ATP synthase 8 (atp8) and ATP synthase 6 (atp6). Similarly, both P. erumei mitogenomes (FJ606835 and AP006835) displayed five overlapping regions totaling 23 bp, with the longest overlap (10 bp) between atp8 and atp6, mirroring P. belcheri. Moreover, P. belcheri exhibited 15 intergenic spacer regions spanning a total of 106 bp, with the longest (38 bp) situated between trnN and trnC. Conversely, P. erumei mitogenomes contained 11 intergenic spacer regions spanning 77–78 bp, with the longest (37–38 bp) found between trnN and trnC (Table S2). Nucleotide composition analysis revealed the AT-biased nature of P. belcheri mitogenome (54.15%), encompassing 28.09% A, 16.24% G, 29.56% C, and 26.06% T. Similar AT richness was observed in the nucleotide composition of the other two P. erumei mitogenomes, ranging from 53.07% to 53.61% (Table 2). The AT skew and GC skew of P. belcheri mitogenome were recorded as 0.037 and −0.291, respectively. Comparative analysis of P. erumei mitogenomes demonstrated an AT skew range of 0.076 to 0.077, and a GC skew range of −0.323 to −0.328 (Table 2). This consistent nucleotide composition pattern and AT bias were also observed in other previously described fish mitogenomes [60,61]. The genetic variations identified within the Psettodes mitogenome may be tied to their evolutionary progression and energy metabolism, echoing findings in other fish species [62]. This research offers valuable insights into the structural attributes of Psettodes mitogenomes, which hold significance in deciphering the functionalities of these mitogenomes and their encoded genes.

3.2. Protein-Coding Genes

A cumulative length of 11,427 bp in P. belcheri mitogenome was occupied by a total of 13 protein-coding genes (PCGs), accounting for 68.27% of the whole sequence. Among these, the shortest PCG was ATP8, spanning 165 bp, while NAD5 represented the longest PCG with a length of 1839 bp. In both P. erumei mitogenomes, the total length of PCGs ranged from 11,426 bp (68.49%) to 11,427 bp (65.99%). The PCGs of P. belcheri were characterized by an AT bias of 52.73%, accompanied by AT skew and GC skew values of −0.052 and −0.323, respectively (Table 2). Similarly, the mitogenomes of P. erumei displayed an AT bias ranging from 50.95% to 51.12%, coupled with AT skew values of −0.008 to −0.006 and GC skew values of −0.363 to −0.361. Most of the PCGs commenced with an ATG (Methionine) initiation codon, except for COI, which began with a GTG (Valine) codon. A parallel pattern of initiation codons was apparent in all PCGs of the other two P. erumei mitogenomes. Among the PCGs, the conventional TAA termination codon was observed in four instances (COI, ATP8, NAD4L, and NAD5), while seven PCGs featured incomplete stop codons (T--/TA-). Additionally, two PCGs, NAD1 and NAD6, terminated with AGG and TAG stop codons, respectively. A corresponding distribution of stop codons was also noted in P. erumei mitogenomes (Table 2 and Table S3). These incomplete stop codons could potentially be completed with TAA during RNA processing, as previously suggested [63]. As observed in other fish species, the identified genetic disparities might lead to the independent selection of PCGs [64]. PCGs play pivotal roles in oxidative phosphorylation, ATP synthesis, and the encoding of proteins within the electron transport pathways. Consequently, the inclusion of mitogenomes from various Psettodes species could facilitate the exploration of variations in gene expression and energy utilization.

3.3. Ribosomal RNA and Transfer RNA Genes

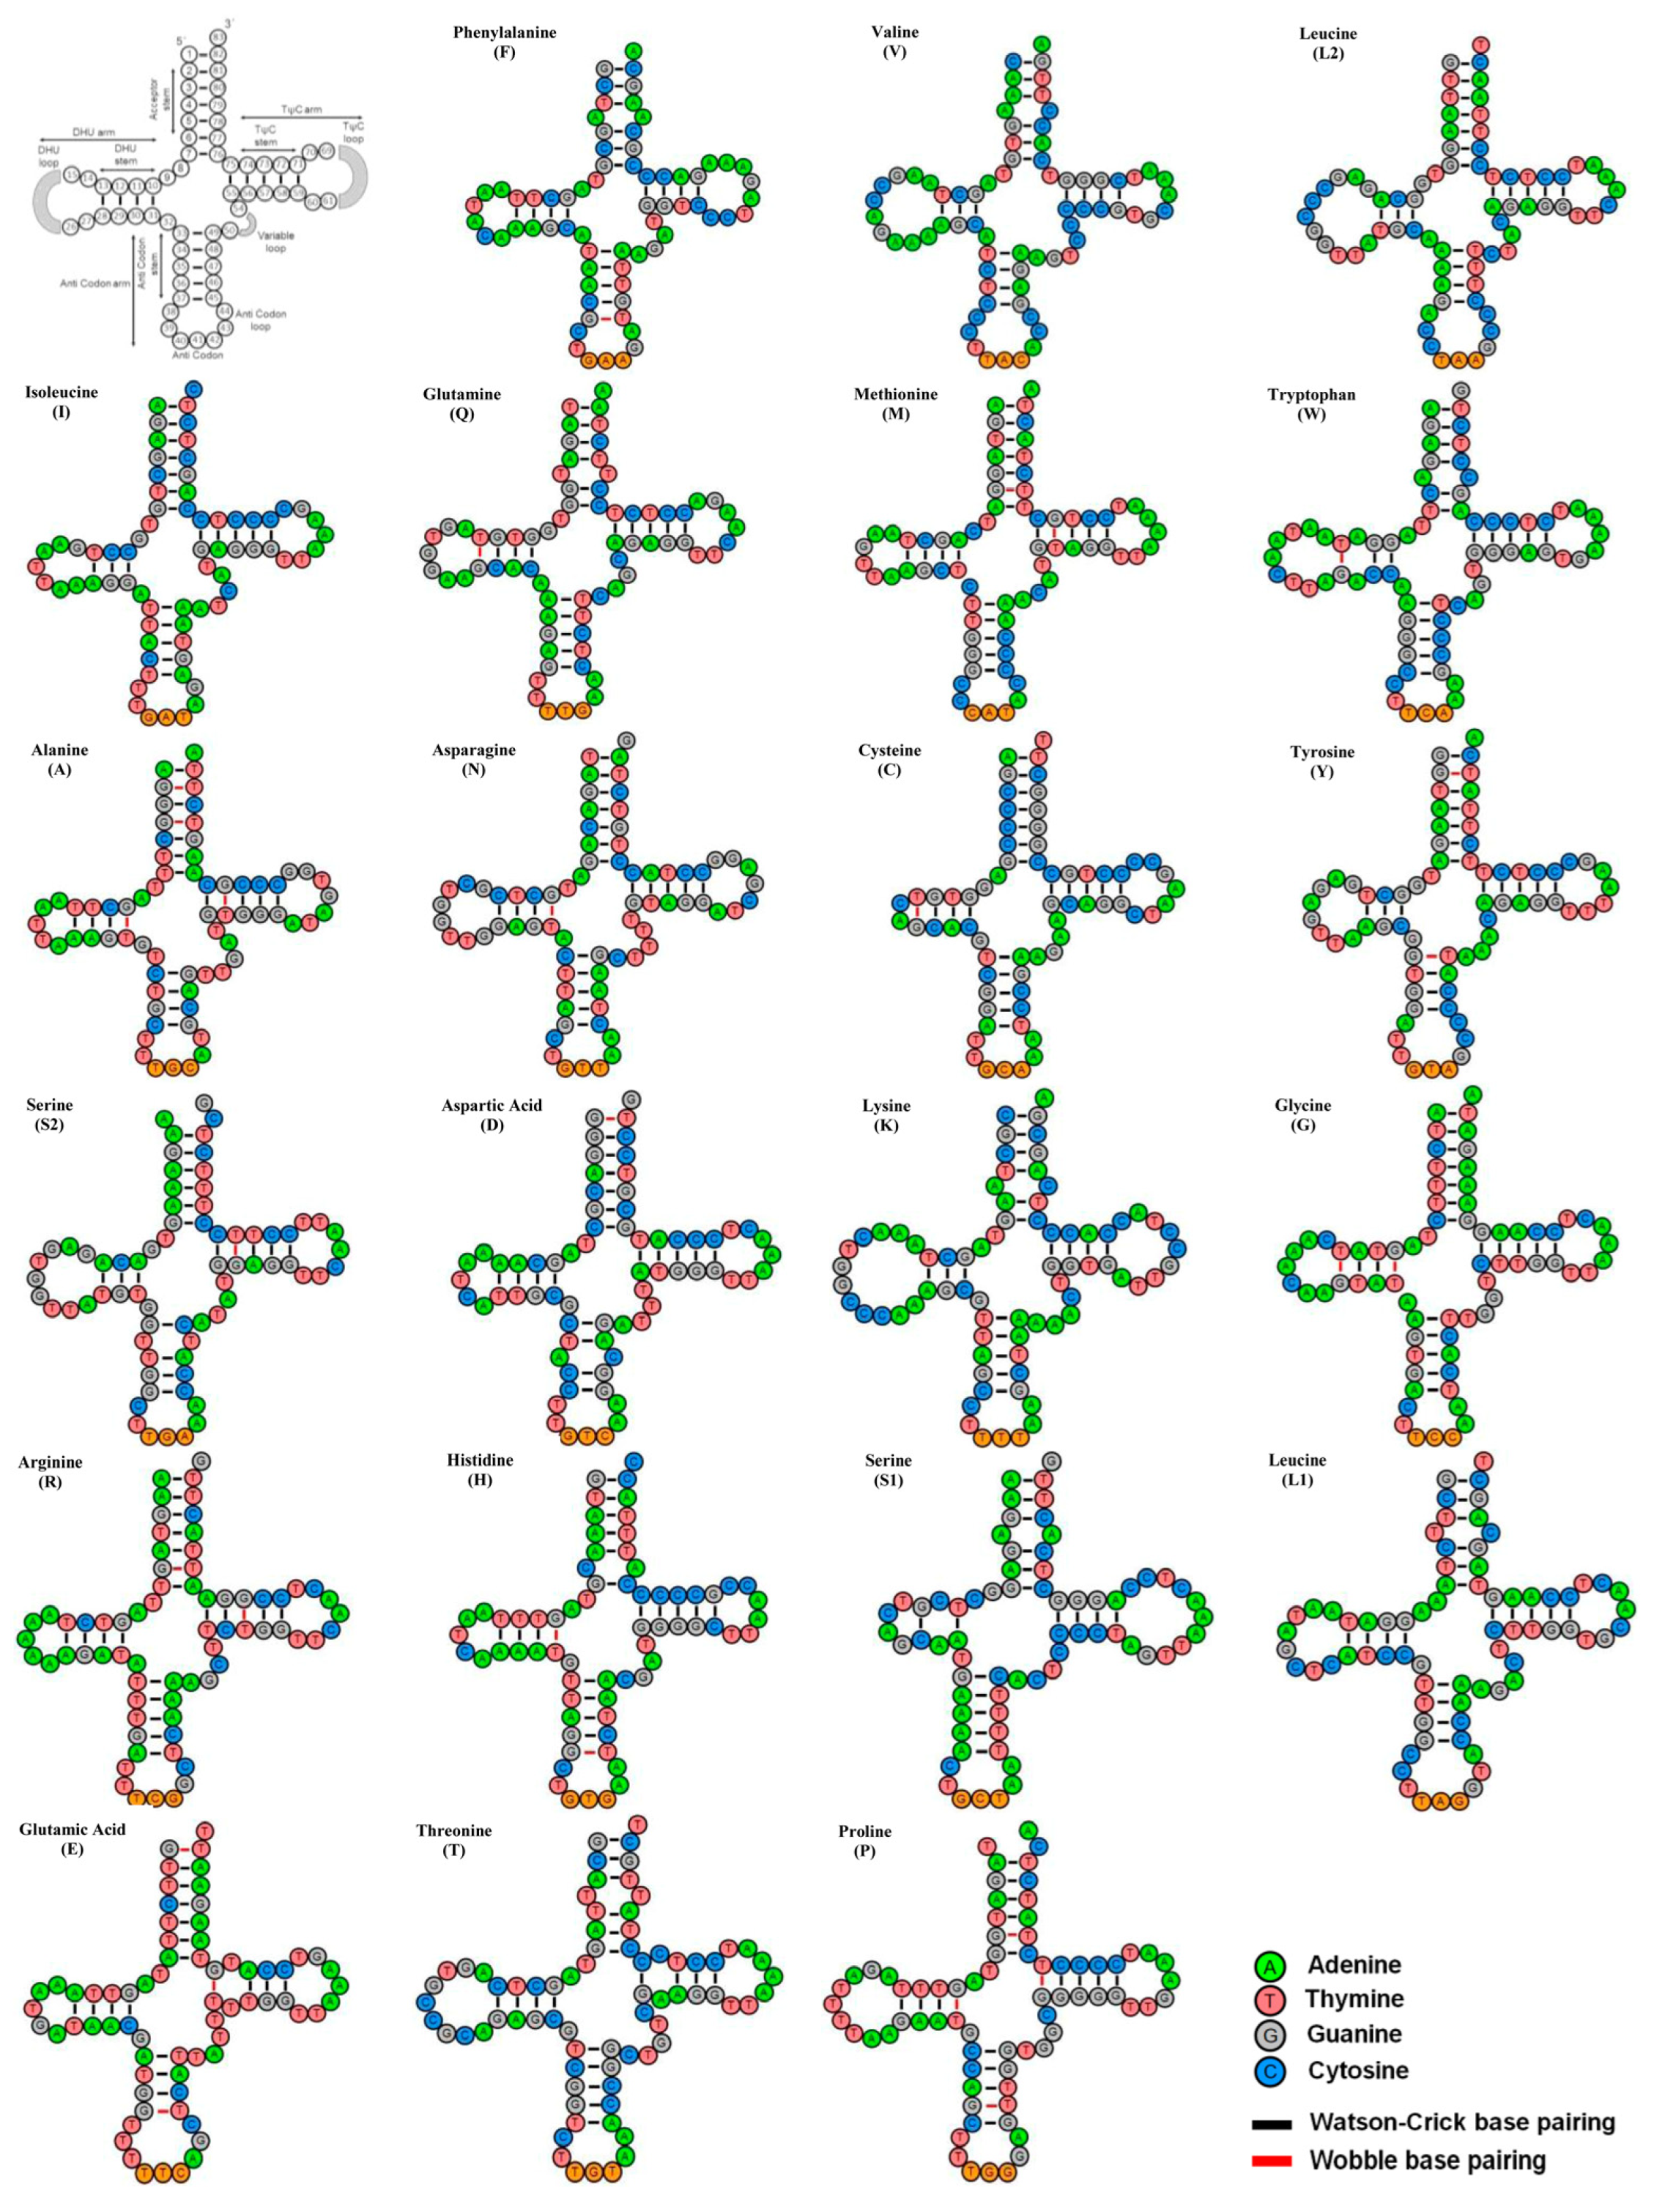
Within the P. belcheri mitogenome, the ribosomal RNA genes collectively spanned 2689 bp, equivalent to 16.06% of the complete mitogenome. This encompassed a small ribosomal RNA (12S rRNA) measuring 961 bp and a large ribosomal RNA (16S rRNA) with a length of 1702 bp. Comparatively, the total length of P. erumei’s rRNAs (2680 bp) was shorter than that of P. belcheri (Table 2). The ribosomal RNAs AT composition ranged from 52.81% (P. belcheri) to 52.99% (P. erumei). Comparative analysis indicated AT skew values ranging from 0.190 (P. belcheri) to 0.227 (P. erumei), while GC skew values ranged from −0.113 (P. erumei) to −0.073 (P. belcheri) in the ribosomal RNA (Table 2). These rRNA genes’ structural arrangement, notably the conserved loops, offer critical insights into the catalytic chemical processes underlying protein synthesis [65]. Additionally, the P. belcheri mitogenome featured 22 tRNA genes, exhibiting varying lengths from 66 bp (trnC) to 75 bp (trnK), collectively constituting 1556 bp or 9.29% of the entire mitogenome. The combined tRNA length in both P. erumei mitogenomes was shorter (1553 bp and 1554 bp) than that of P. belcheri (Table 2). The tRNAs displayed an AT bias in both P. belcheri (55.14%) and P. erumei (54.02% to 54.12%). AT skew values ranged from 0.006 (P. erumei) to 0.009 (P. belcheri), while GC skew values ranged from 0.032 (P. belcheri and P. erumei, AP006835) to 0.036 (P. erumei, FJ606835) (Table 2). Most tRNAs were predicted to adopt the typical cloverleaf secondary structure, except for trnS1, which lacked the DHU stem, consistent with findings in other Pleuronectiformes [66,67]. These genetic attributes are pivotal for shaping transfer RNAs secondary structures and their functional roles within diverse biological systems [68]. In terms of comparative structural features, 15 tRNA genes (trnA, trnF, trnQ, trnM, trnW, trnN, trnC, trnY, trnS2, trnD, trnG, trnR, trnH, trnE, trnP) were constructed through both conventional Watson–Crick base (A=T and G≡C) pairing and wobble base pairing (G-T), while the remaining seven tRNA genes were exclusively built with Watson–Crick base pairs (Figure 3).

3.4. Features of Control Region and Gene Arrangements

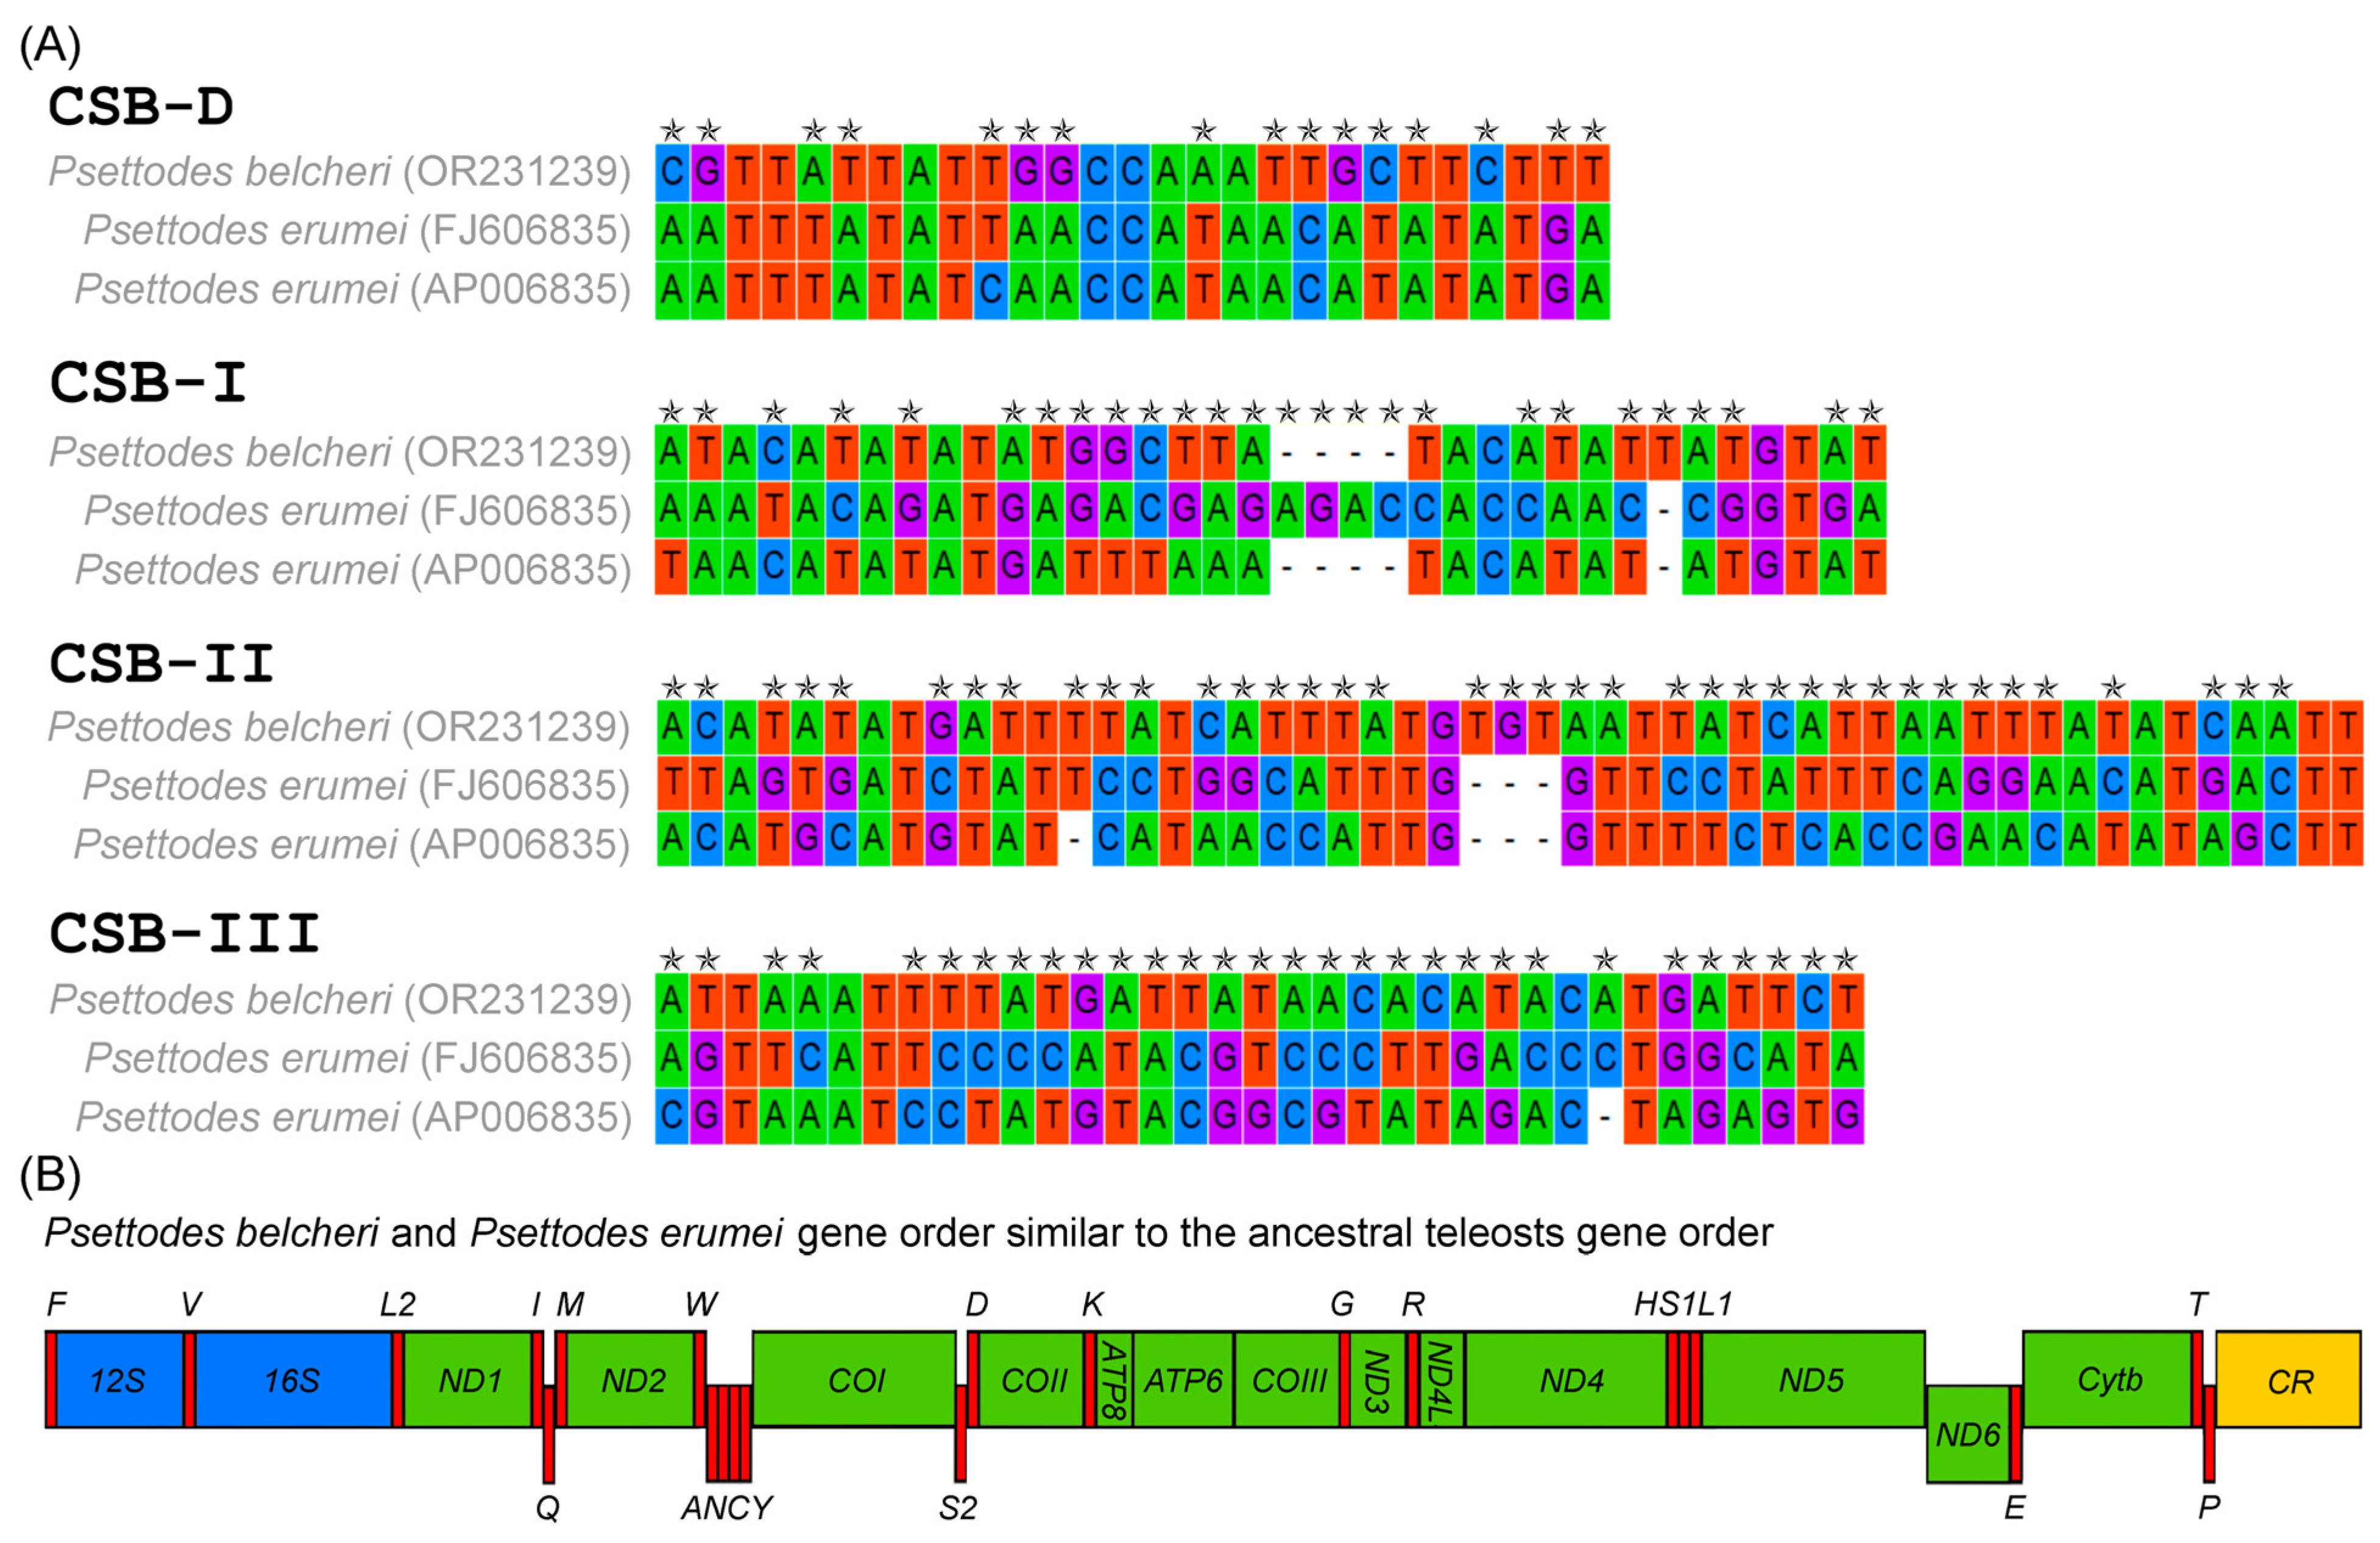
The comprehensive length of P. belcheri control region (CR) reached 1015 bp, comprising 63.65% AT content. Conversely, the complete lengths of P. erumei’s CRs varied, ranging from 968 bp to 1601 bp. The AT skew fluctuated between −0.050 (P. belcheri) and 0.074 (P. erumei), while the GC skew ranged from −0.337 (P. erumei, AP006835) to −0.241 (P. erumei, FJ606835) (Table 2). P. belcheri mitogenome recorded more than two copies of 72 bp tandem repeats, whereas the mitogenomes of P. erumei hosted over eight copies (FJ606835) and more than twelve copies (AP006835) of 56 bp repeats. Four conserved blocks (CSB-D, CSB-I, CSB-II, and CSB-III) were detected in both P. belcheri and P. erumei mitogenomes, consistent with their presence in other teleost fishes [66,69]. Of these blocks, CSB-II was the longest at 51 bp, compared with CSB-D (27 bp), CSB-I (36 bp), and CSB-III (35 bp) (Figure 4A). Comparative analyses unveiled substantial nucleotide variability and parsimony informative nucleotides within CSB-II relative to the other three conserved domains. This AT-rich regulatory region holds the potential for assessing population structures and identifying inter- and intra-specific differences among Psettodes species via these variable nucleotides. As demonstrated in other species, such conserved domains are integral for mitochondrial genome replication and transcription [69,70]. Intriguingly, these primitive Pleuronectiformes fishes maintain a gene order within their mitochondrial genomes that aligns with that of ancestral teleosts [71] (Figure 4B). However, Pleuronectiformes mitogenomes exhibit repeated instances of control region duplications and gene rearrangements [72,73,74,75,76]. These mechanisms involving genomic rearrangement through double replications, random loss, dimer-mitogenomes, and non-random loss contribute to understanding the structural diversity of mitogenomes and the intricacies of mitochondrial genome evolution.

3.5. Genetic Distances and Mitogenomic Phylogeny

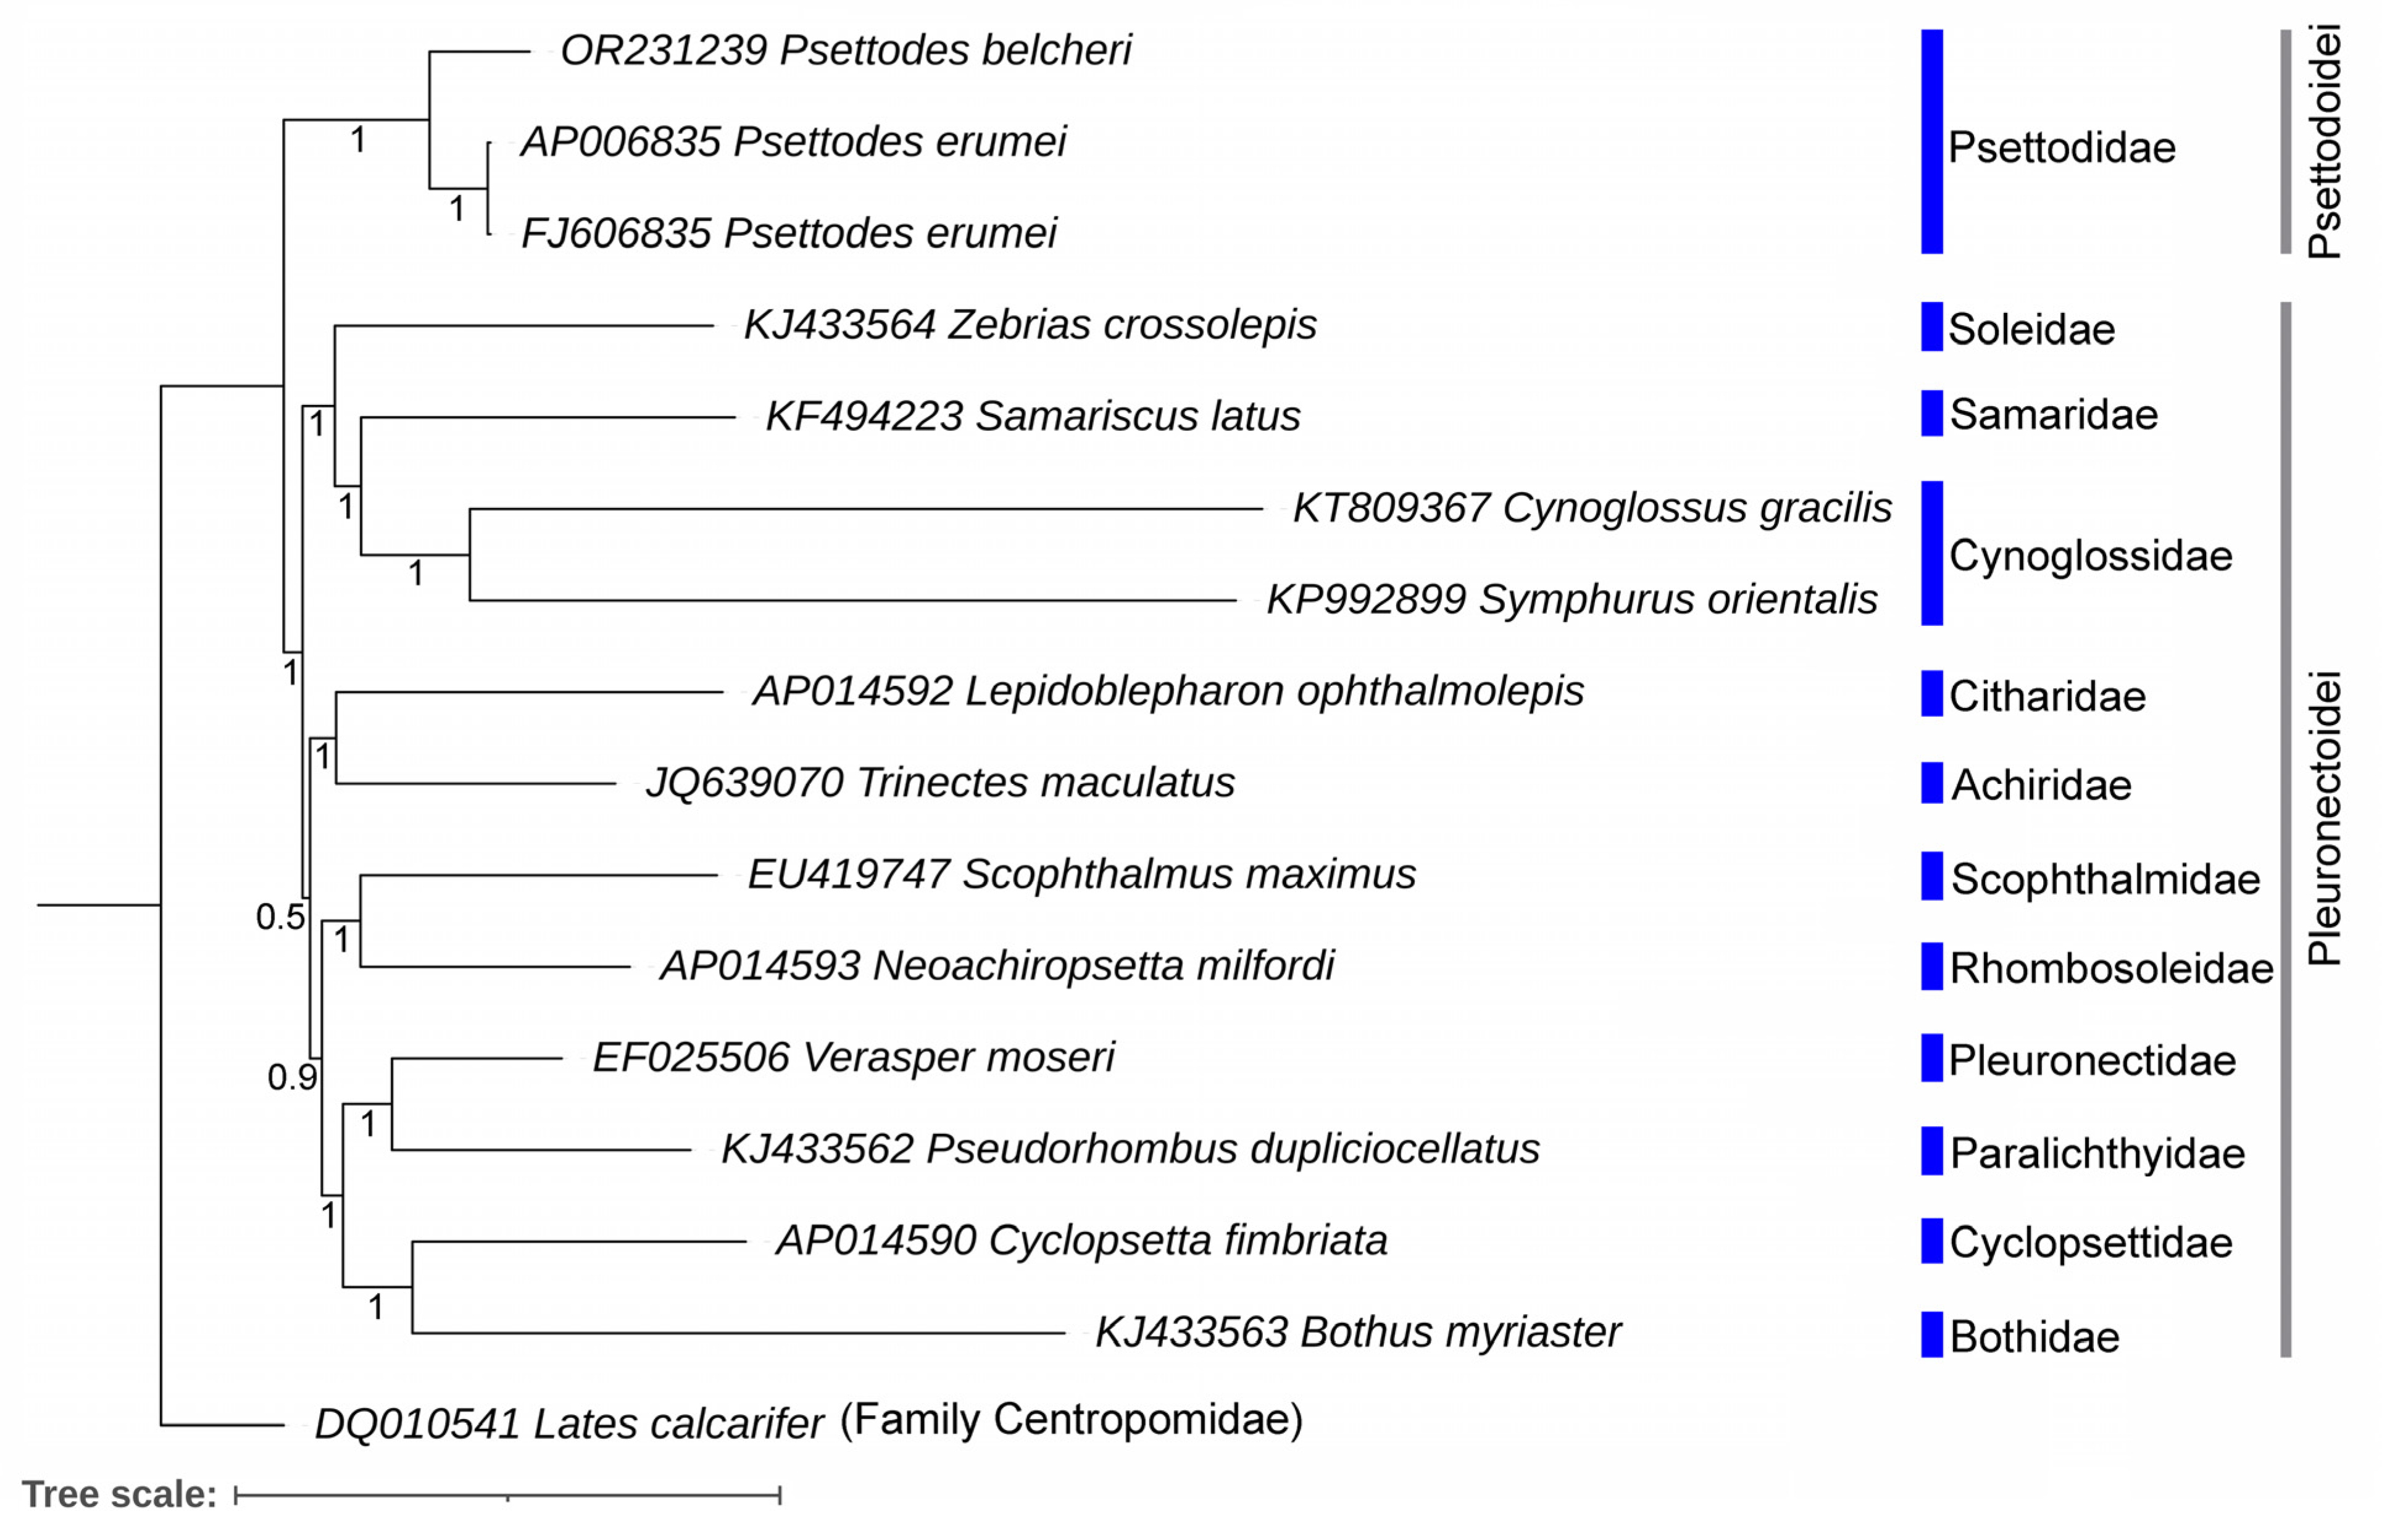
The species under investigation, P. belcheri, displayed substantial inter-species genetic distances of 14.00% and 17.30% when compared with its congeners P. bennettii and P. erumei, respectively, as confirmed through the analysis of the COI gene (Figure S1). A particularly noteworthy finding is the pronounced genetic divergence of 14% observed between P. belcheri and P. bennettii, despite their shared presence in the western Atlantic. This genetic disparity, noteworthy in the context of their parapatric distribution and significant overlap, points to a significant level of reproductive isolation between these species. The examination of population genetic structures within P. belcheri and P. bennettii will provide valuable insights into their migratory patterns within the mutual habitat of the eastern Atlantic Ocean. Employing a phylogenetic analysis grounded in mitogenomes, the study effectively categorized all studied Pleuronectiformes flatfishes using a concatenation of 13 PCGs, supported by robust posterior probability (Figure 5). The resultant phylogeny derived from mitogenomes aligns harmoniously with previous evolutionary hypotheses concerning Pleuronectiformes species [26,28,29]. Importantly, representative species from the suborders Psettodoidei and Pleuronectoidei formed coherent monophyletic clusters within the present topology. The spottail spiny turbot, P. belcheri, clustered consistently with its congeners, most notably P. erumei. The family Psettodidae emerged as the basal node of Pleuronectiformes, occupying a unique position as an ancestral group among other flatfish families. Furthermore, the conducted cladistic analysis showcased a sister relationship between C. gracilis (=Cynoglossidae I) and S. orientalis (=Cynoglossidae II) (Figure 5). The application of mitochondrial genome-based and phylogenomic assessments has proven successful in elucidating higher teleostean phylogenies, encompassing flatfishes [77,78,79]. To establish the precise matrilineal evolution of Psettodes flatfishes within the monotypic family Psettodidae, the generation of the P. bennettii mitogenome emerges as a pivotal task. Notably, a wealth of genetic data, spanning multi-locus exon-capture data and whole genome sequencing, has recently provided fresh insights into the phylogeny and genetic evolution of flatfishes [80,81,82,83,84,85]. The integration of such extensive genetic information depicts the potential to illuminate the evolutionary landscape of primitive Psettodes flatfishes in the near future.

3.6. Divergence Time and Diversification

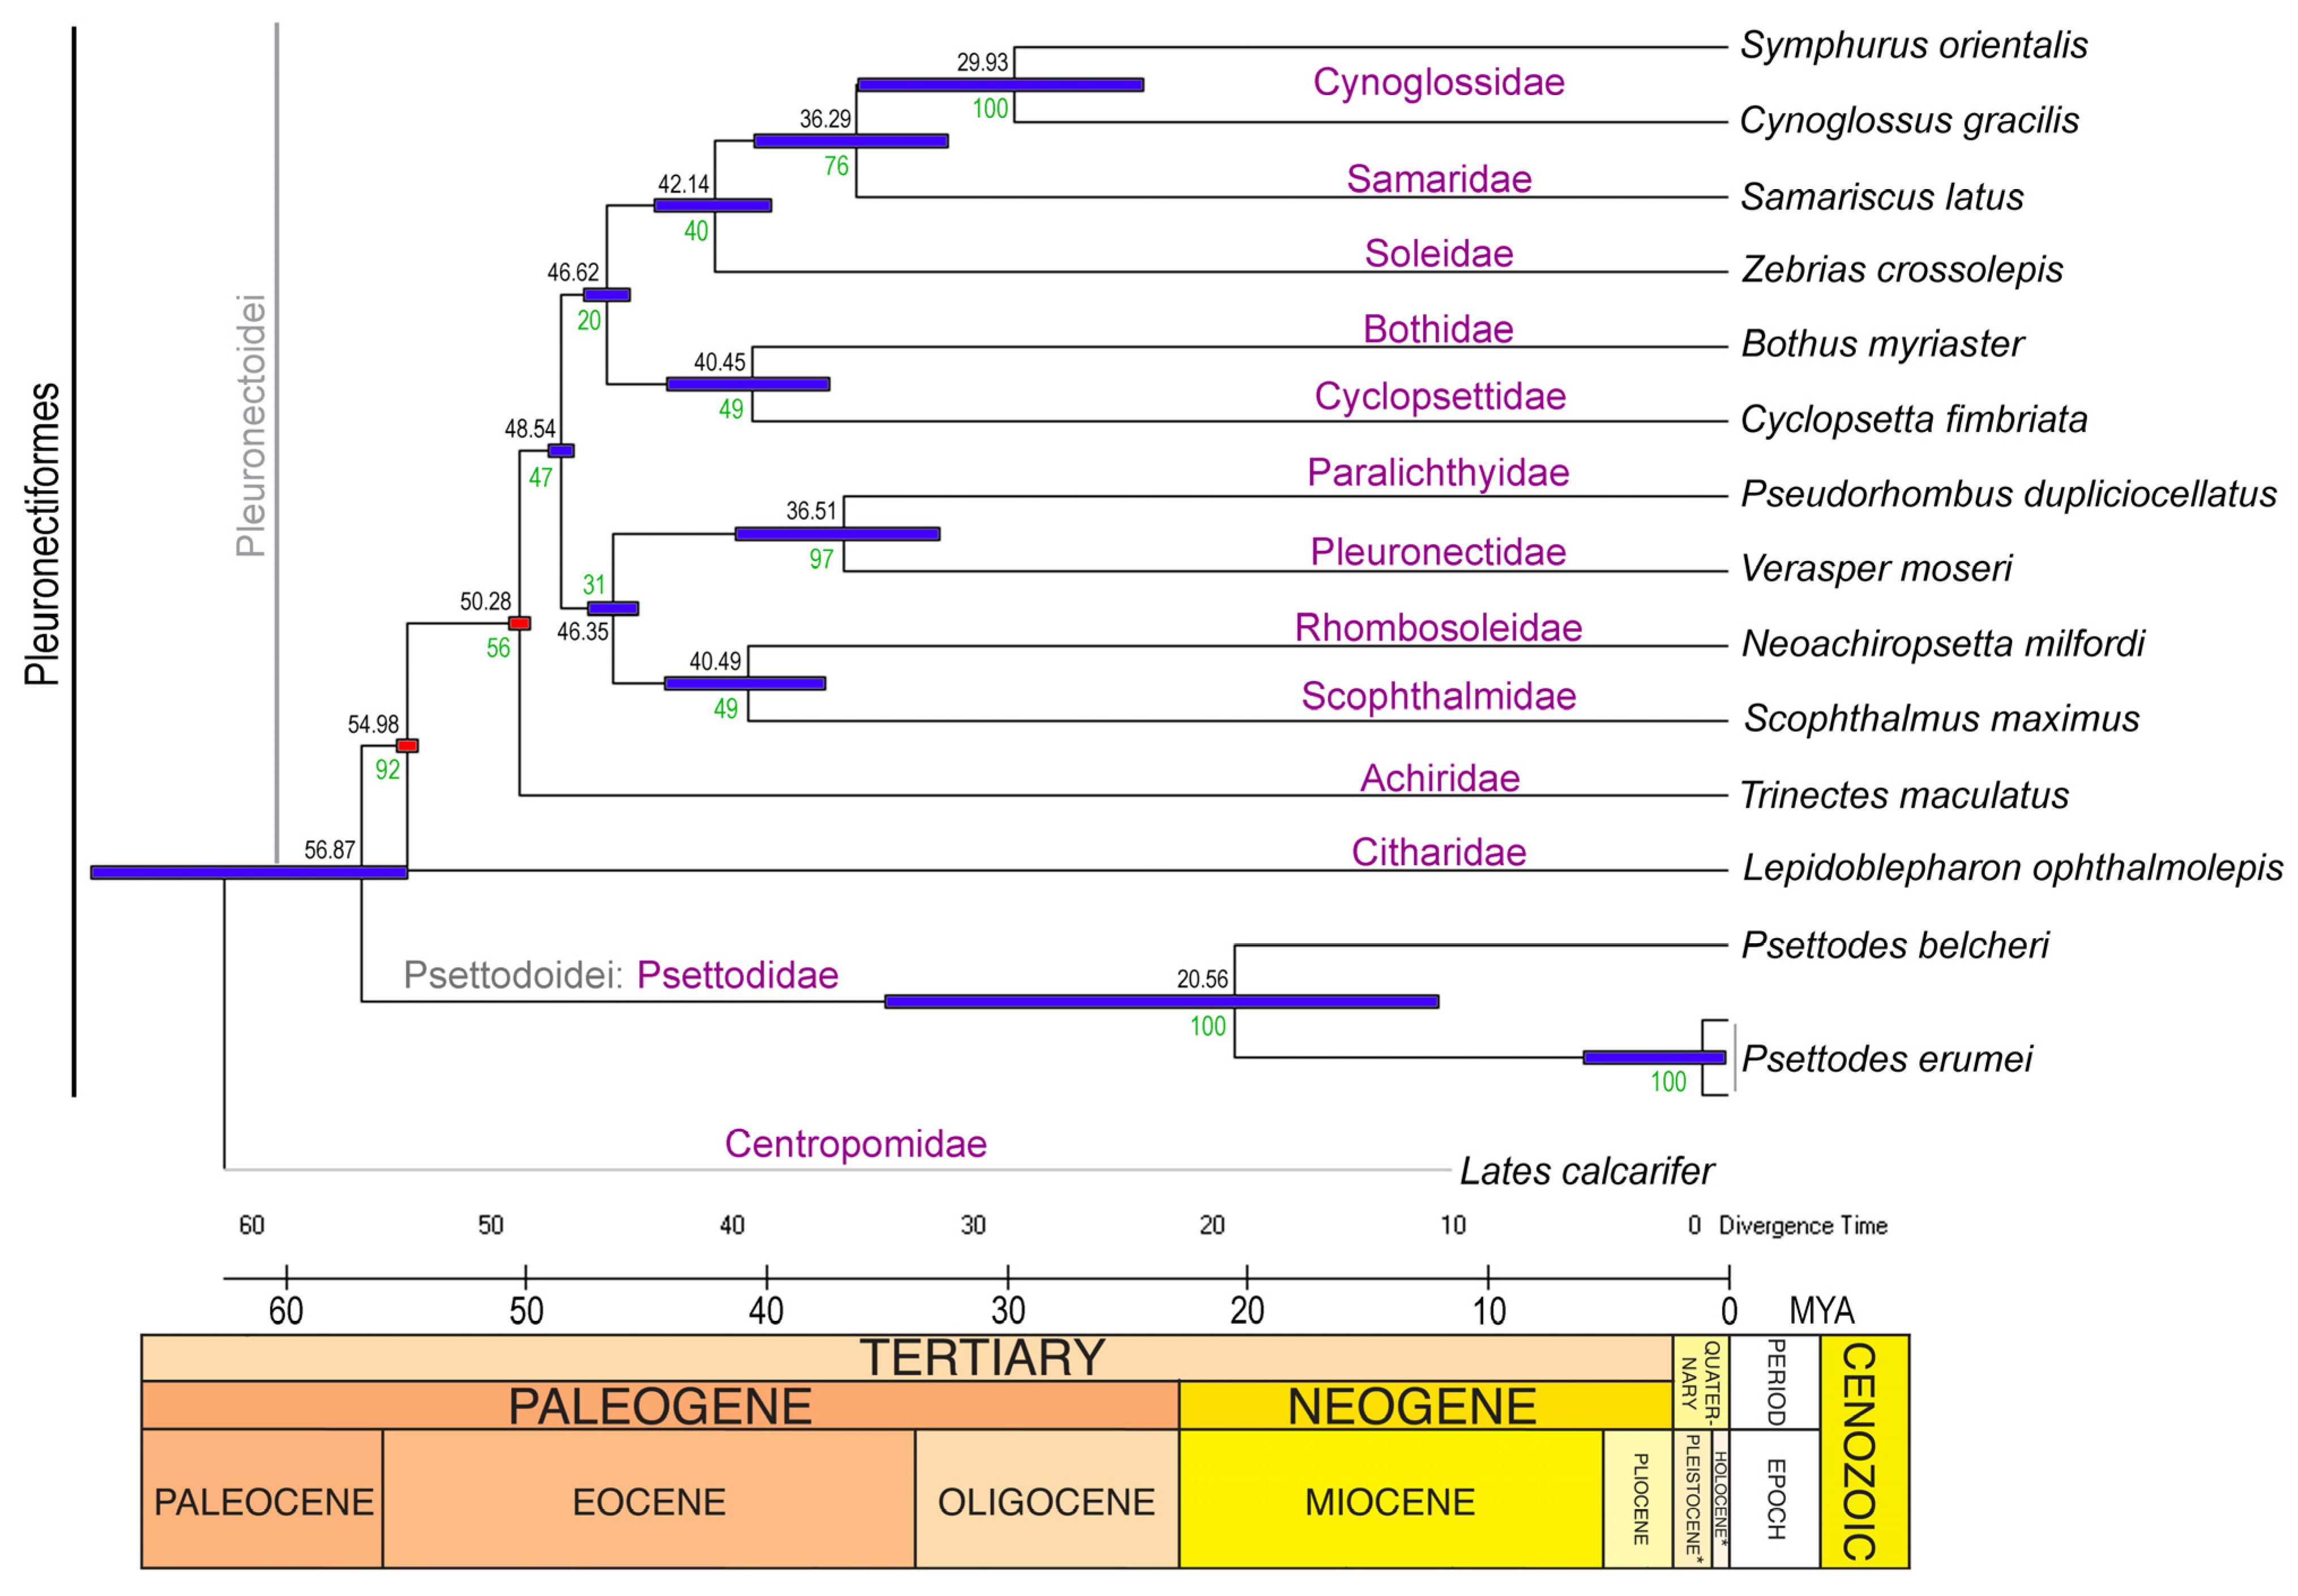
The application of TimeTree analyses has illuminated the temporal aspects of the evolutionary history of P. belcheri and P. erumei. These two species have a wide divergence time during the late Eocene to early Miocene, approximately 35 to 10 million years ago (MYA) (Figure 6). Remarkably, the family Psettodidae (suborder Psettodoidei) demonstrated an early divergence of approximately 56.87 MYA from other flatfish families (suborder Pleuronectoidei) during the late Paleocene to early Eocene (Figure 6). The other Pleuronectoidei flatfish families diverged from each other between the Oligocene and early Eocene periods, with dates ranging from 29.93 MYA to 54.98 MYA (Figure 6). The distribution pattern of Psettodes flatfishes, specifically within the family Psettodidae, has fascinated many ichthyologists. The interannual variability in early life phenology and dispersal of flatfishes has been established as being influenced by bathymetry, changes in water salinity, oceanic temperature, and wind conditions [86,87]. Thus, the study of the evolution and diversification of marine fishes necessitates a discussion that takes into account genetic connectivity, divergent selection, as well as possible demographic and ecological opportunities [88].
The Miocene epoch, spanning from around 23 million to 5.3 million years ago, marked a period of substantial environmental transformation on Earth [89]. This era witnessed shifts in both climate and oceanic conditions, representing a transition between the stable warmth of the early Cenozoic and the later variable and colder conditions [90]. During the Miocene, elevated temperatures contributed to higher sea levels through the melting of polar ice and seawater expansion [91]. Furthermore, the tectonic activity in the Miocene shaped ocean basins and seafloor topography, with the collision of tectonic plates, influencing ocean currents and marine habitats. Consequently, coastlines took on different configurations than those seen today, with numerous present-day land areas submerged under shallow seas. The epoch was characterized by significant biological evolution, with the emergence of contemporary marine species lineages influencing the rich biodiversity of modern oceans [92,93]. Such diversification was prompted by factors such as varying oceanic temperatures, changing sea levels, and the availability of ecological niches.
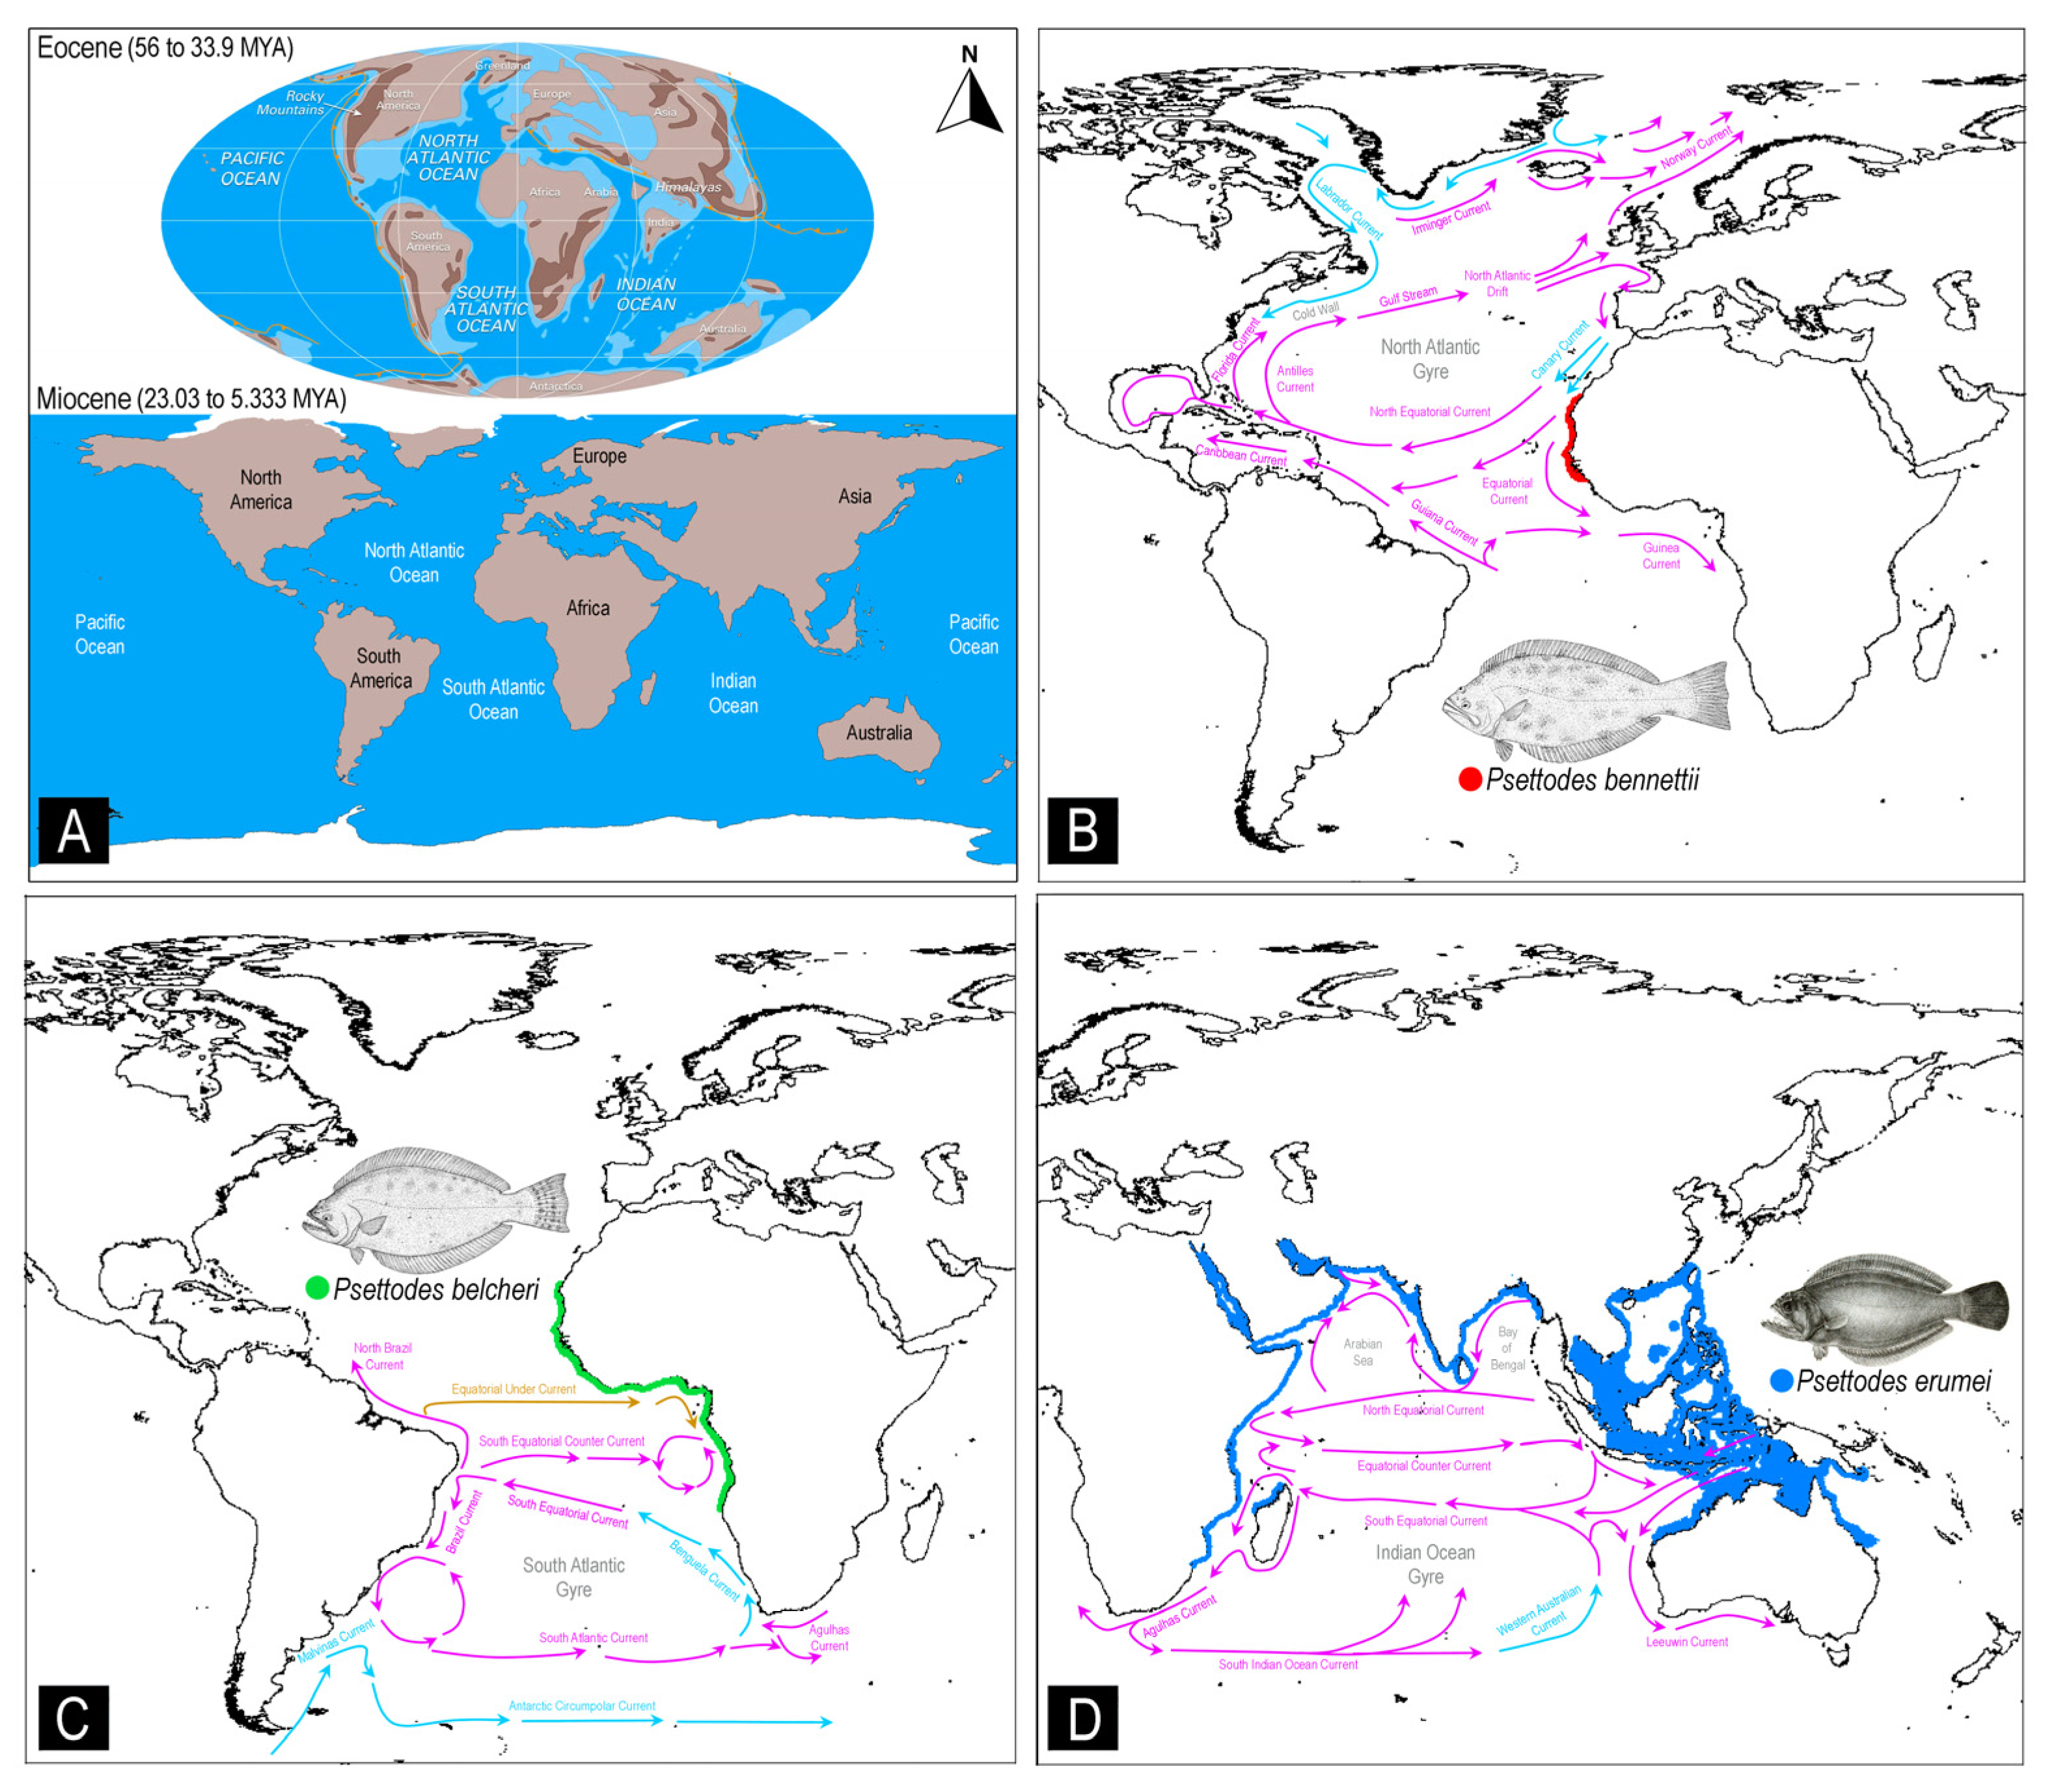
In the context of understanding the evolutionary scenarios of Psettodes flatfishes, particularly following their colonization in the eastern Atlantic and Indo-West Pacific regions by the demersal lineage, a critical integration of the maximum-likelihood time-tree computation framework and marine ecological factors becomes essential. Notably, while P. belcheri is distributed across both the South and North Atlantic Oceans, spanning the western coast of Africa from Angola to western Sahara, P. bennettii is confined solely to the North Atlantic, with a distribution encompassing Gambia, Guinea, Guinea-Bissau, Mauritania, Morocco, Senegal, and Western Sahara. The sympatric speciation of these two species may be attributed to ecological selection within the pelagic environment. Since ancient time, the hydrographic and climatic conditions in the North and South Atlantic Oceans have differed significantly due to the Coriolis effect induced by Earth’s rotation (Figure 7A). In the North Atlantic, the circulation of oceanic currents results in distinct oceanic gyres, with the warm Gulf Stream current flowing northward and the cold Canary Current flowing southward [94]. The interplay of these currents, along with the North Equatorial Current, contributes to the formation of the North Atlantic gyre (Figure 7B). Conversely, the southern Atlantic Ocean features counterclockwise current circulation, dominated by the anticyclonic subtropical gyre and bounded by several major surface ocean currents (the Antarctic Circumpolar Current, the Benguela Current, the South Equatorial Current, the Brazil Current, and the Malvinas Current) (Figure 7C).
The Indian Ocean, characterized by the presence of the Arabian Sea and the Bay of Bengal, as well as warm and cold currents such as the Western Australian cold current, forms the Indian Ocean gyre. The divergence time of Psettodidae from other Pleuronectiformes during the late Paleocene to early Eocene suggests that these primitive flatfishes may have emerged in the eastern Atlantic Ocean. The currents and salinity levels of both the North and South Atlantic Oceans may have constrained the distribution of the two Psettodidae species, P. belcheri and P. bennettii, to the continental shelves of western Africa. The other congener, P. erumei, likely evolved during the early Miocene and colonized into the Red Sea to the Indo-West Pacific Ocean due to the formation of the Antarctic Circumpolar Current (Figure 7D). Notably, the Agulhas Current may have acted as a barrier to the distribution of P. erumei between the Indian Ocean and the Atlantic Ocean. Despite the differences in hydrography, the high saline outflow from the Red Sea to the Indian Ocean results in similar characteristics of these two marine environments, allowing for similar flatfish communities to thrive. However, the Indian Ocean and Western Pacific Ocean are seismically active due to the presence of tectonic plate boundaries. Ecological speciation scenarios are frequently invoked to explain such patterns, yet distinguishing between ecological adaptation and allopatric speciation remains challenging [95]. The dispersal of P. erumei from the Indian Ocean to the West Pacific Ocean may have been driven by the Equatorial Counter Current of the Indian Ocean gyre. Such ecological features greatly influence the evolution and adaptation of other flatfish species, including Psettodes, and have the potential to increase endemism in certain demersal ecosystems in marine settings. An intriguing case of rapid ecological speciation has been observed in Baltic flounder species, involving the development of a new ecological niche through a demersal spawning behavior, constituting the fastest speciation event documented for a marine vertebrate [32]. As a result, the peculiar spawning behavior attributes of Psettodes flatfishes, as well as ecological variables that may lead to reproductive isolation, suggest a process of ecological speciation.

3.7. Conservation Implication

Marine ecosystems remain relatively unexplored on a global scale, facing substantial gaps and challenges in terms of biodiversity assessment and the generation of genetic data [96,97]. In addition to the overarching influence of climate change, anthropogenic activities consistently pose threats to marine organisms, including flatfishes, across all oceanic regions [98,99,100]. Given the conservation significance of Psettodes flatfishes, the co-occurrence of both East Atlantic species within a portion of their range underscores the necessity for regulated harvesting within the framework of a multispecies fishery strategy. As global climate change progresses, marked alterations in environmental conditions such as elevated water temperatures, decreased oxygen levels, and modified wind patterns impact fish reproduction and recruitment on a global scale [101]. Consequently, increasing environmental variability is poised to exert negative repercussions on fish stock dynamics. Adaptations in fisheries and fishery management will likely encompass adjustments in fishing locales, target species, and the establishment of Marine Protected Areas (MPAs), highlighting the need for flexibility in both exploitation practices and management approaches. Nonetheless, predictions indicate that climate change will lead to heightened freshwater runoff in the eastern Atlantic Ocean (including basins of the Senegal, Gambia, Volta, Niger, and Congo Rivers), Indian Ocean (encompassing basins of the Zambezi, Limpopo, Indus, Ganges, Godavari, Brahmaputra, Irrawaddy, and Mekong Rivers), and western Pacific Ocean (such as the Pearl and Yangtze River Basins). This rise in runoff is anticipated to lower salinity levels, thereby constricting the distribution of numerous marine species. The reduction in salinity, driven by climate change, may exert severe selective pressure on pelagic-spawning species, potentially prompting a shift in reproductive behavior towards demersal spawning and even leading to local extinctions. Concurrently, the combined impact of eutrophication and climate change has accelerated the occurrence of hypoxia and anoxia in bottom waters where salinity conditions are conducive to pelagic spawning [102,103]. Consequently, the spawning habitat of pelagic flatfishes, currently delimited by geographic constraints, is likely to diminish in the future. This evolving scenario raises concerns about the potential local extinction of these species, underscoring the urgent need for comprehensive conservation strategies.

4. Conclusions

In conclusion, this study investigated the detailed analysis of the mitogenome of P. belcheri, shedding light on its genetic composition, structural organization, and evolutionary history. Furthermore, the genetic distances and phylogenetic relationships were explored, unveiling the evolutionary relationships among Psettodes species and their broader placement within the Pleuronectiformes order. Notably, the study identified significant genetic divergence between P. belcheri and P. bennettii in the mitochondrial COI gene, suggesting reproductive isolation despite their shared habitat. The phylogenetic relationship, divergence times, and diversification patterns were also estimated, providing insights into the emergence and distribution of Psettodes species in various oceanic regions. The interplay of hydrographic conditions, ocean currents, and ecological factors played crucial roles in shaping the evolutionary landscape of these flatfishes. Given the potential conservation implications, this study highlighted the need for a comprehensive understanding of marine ecosystems and the effects of climate change and anthropogenic activities on flatfish species. Conservation strategies and the establishment of MPAs were emphasized as essential components in safeguarding the diversity and sustainability of marine life, particularly species such as Psettodes flatfishes. In summary, the present analysis of the mitogenome and evolutionary history of Psettodes flatfishes offers valuable insights into the genetic attributes and possible ecological adaptations in East Atlantic and Indo-West Pacific Oceans.

Supplementary Materials

The following supporting information can be downloaded at: https://www.mdpi.com/article/10.3390/biology12101317/s1, Table S1. Dataset of Pleuronectiformes flatfishes for present phylogenetic analyses (GenBank Accessed on 15 August 2023); Table S2. Comparison of the intergenic nucleotides of two Psettodes species mitogenomes.; Table S3. Start and stop codons of all 13 PCGS in two Psettodes species mitogenomes; Figure S1. Mitochondrial COI-based Bayesian phylogeny clearly discriminate three Psettodes species with high posterior probabilities branch supports. The K2P genetic distances of three Psettodes species were overlaid on the topology.

Author Contributions

Conceptualization: S.K. and H.-W.K.; methodology: F.S.P., A.R.K. and S.R.L.; software: S.K., H.-E.K., A.R.K. and S.R.L.; validation: S.K. and H.-E.K.; formal analysis: S.K., H.-E.K. and A.R.K.; investigation: S.K., F.S.P. and F.Z.G.; resources: S.H.S. and H.-W.K.; data curation: F.S.P., S.R.L. and F.Z.G.; writing—original draft: S.K., F.S.P. and H.-E.K.; writing—review and editing: S.K., S.H.S. and H.-W.K.; visualization: S.K. and H.-W.K.; supervision: S.K. and H.-W.K.; project administration: H.-W.K.; funding acquisition: S.H.S. and H.-W.K. All authors have read and agreed to the published version of the manuscript.

Funding

This research was supported by a grant from the National Institute of Fisheries Science, Korea (Grant No. R2023002).

Institutional Review Board Statement

Not applicable.

Informed Consent Statement

Not applicable.

Data Availability Statement

The genome sequence data that support the findings of this study are openly available in GenBank of NCBI at https://www.ncbi.nlm.nih.gov, accessed on 15 August 2023, under the accession no. OR231239.

Acknowledgments

The first author (S.K.) acknowledges the Global Postdoc Program of the Pukyong National University (PKNU), Republic of Korea. The second author (F.S.P.) acknowledges the Korea International Cooperation Agency (KOICA)-PKNU scholarship for his master’s program.

Conflicts of Interest

The authors declare no conflict of interest.

References

  1. Fricke, R.; Eschmeyer, W.N.; Van der Laan, R. (Eds.) Eschmeyer’s Catalog of Fishes: Genera, Species. Electronic Version. 2022. Available online: http://researcharchive.calacademy.org/research/ichthyology/catalog/fishcatmain.asp (accessed on 15 August 2023).
  2. Nelson, J.S.; Grande, T.C.; Wilson, M.V.H. Fishes of the World, 5th ed.; John Wiley and Sons: Hoboken, NJ, USA, 2016; 752p. [Google Scholar]
  3. Friedman, M. The evolutionary origin of flatfish asymmetry. Nature 2008, 454, 209–212. [Google Scholar] [CrossRef] [PubMed]
  4. Spinner, M.; Kortmann, M.; Traini, C.; Gorb, S.N. Key role of scale morphology in flatfishes (Pleuronectiformes) in the ability to keep sand. Sci. Rep. 2016, 20, 26308. [Google Scholar] [CrossRef] [PubMed]
  5. Evans, K.M.; Larouche, O.; Watson, S.J.; Farina, S.; Habegger, M.L.; Friedman, M. Integration drives rapid phenotypic evolution in flatfishes. Proc. Natl. Acad. Sci. USA 2021, 118, e2101330118. [Google Scholar] [CrossRef] [PubMed]
  6. Cooper, J.A.; Chapleau, F. Monophyly and intrarelationships of the family Pleuronectidae (Pleuronectiformes), with a revised classification. Fish. Bull. 1998, 96, 686–726. [Google Scholar]
  7. Eighani, M.; Paighambari, S.Y. Shrimp, bycatch and discard composition of fish caught by small-scale shrimp trawlers in the Hormuzgan coast of Iran in the Persian Gulf. Philipp. Agric. Sci. 2013, 96, 314–319. [Google Scholar]
  8. Gibson, R.N.; Nash, R.D.M.; Geffen, A.J.; Van der Veer, H.W. Flatfishes: Biology and Exploitation, 2nd ed.; Wiley-Blackwell: West Sussex, UK, 2015; 576p. [Google Scholar]
  9. IUCN. The IUCN Red List of Threatened Species; Version 2022-2; IUCN: Gland, Switzerland, 2022; Available online: www.iucnredlist.org (accessed on 15 August 2023).
  10. Coulson, P.G.; Poad, J.A. Biological characteristics of the primitive flatfish Indian halibut (Psettodes erumei) from the tropical northeastern Indian Ocean, including implications of the use of incorrect aging methods on mortality estimates. Fish. Bull. 2021, 119, 168–183. [Google Scholar] [CrossRef]
  11. Bergstrom, C.A.; Alba, J.; Pacheco, J.; Fritz, T.; Tamone, S.L. Polymorphism and multiple correlated characters: Do flatfish asymmetry morphs also differ in swimming performance and metabolic rate? Ecol. Evol. 2019, 9, 4772–4782. [Google Scholar] [CrossRef]
  12. Tomiyama, T. Sexual dimorphism in scales of marbled flounder Pseudopleuronectes yokohamae (Pleuronectiformes: Pleuronectidae), with comments on the relevance to their spawning behaviour. J. Fish. Biol. 2013, 83, 1334–1343. [Google Scholar] [CrossRef]
  13. Lee, M.Y.; Munroe, T.A. Unraveling cryptic diversity among shallow-water tonguefishes (Pleuronectiformes: Cynoglossidae: Symphurus) from the Indo-West Pacific region, with descriptions of five new species. Zootaxa 2021, 5039, 1–55. [Google Scholar] [CrossRef]
  14. Betancur, R.R.; Li, C.; Munroe, T.A.; Ballesteros, J.A.; Ortí, G. Addressing gene tree discordance and non-stationarity to resolve a multi-locus phylogeny of the flatfishes (Teleostei: Pleuronectiformes). Syst. Biol. 2013, 62, 763–785. [Google Scholar] [CrossRef]
  15. Bitencourt, J.A.; Affonso, P.R.A.M.; Ramos, R.T.C.; Schneider, H.; Sampaio, I. Phylogenetic relationships and the origin of New World soles (Teleostei: Pleuronectiformes: Achiridae): The role of estuarine habitats. Mol. Phylogenet. Evol. 2023, 178, 107631. [Google Scholar] [CrossRef] [PubMed]
  16. Xiao, Y.; Gao, T.; Zhang, Y.; Yanagimoto, T. Demographic History and Population Structure of Blackfin Flounder (Glyptocephalus stelleri) in Japan Revealed by Mitochondrial Control Region Sequences. Biochem. Genet. 2010, 48, 402–417. [Google Scholar] [CrossRef] [PubMed]
  17. Robledo, D.; Hermida, M.; Rubiolo, J.A.; Fernández, C.; Blanco, A.; Bouza, C.; Martínez, P. Integrating genomic resources of flatfish (Pleuronectiformes) to boost aquaculture production. Comp. Biochem. Physiol. Part D Genom. Proteom. 2017, 21, 41–55. [Google Scholar] [CrossRef] [PubMed]
  18. Liu, K.; Zhao, S.; Yu, Z.; Zhou, Y.; Yang, J.; Zhao, R.; Yang, C.; Ma, W.; Wang, X.; Feng, M.; et al. Application of DNA barcoding in fish identification of supermarkets in Henan province, China: More and longer COI gene sequences were obtained by designing new primers. Food Res. Int. 2020, 136, 109516. [Google Scholar] [CrossRef] [PubMed]
  19. Cerdà, J.; Douglas, S.; Reith, M. Genomic resources for flatfish research and their applications. J. Fish Biol. 2010, 77, 1045–1070. [Google Scholar] [CrossRef] [PubMed]
  20. Chen, W.-J.; Bonillo, C.; Lecointre, G. Repeatability of clades as a criterion of reliability: A case study for molecular phylogeny of Acanthomorpha (Teleostei) with larger number of taxa. Mol. Phylogenetics Evol. 2003, 26, 262–288. [Google Scholar] [CrossRef]
  21. Kawahara, R.; Miya, M.; Mabuchi, K.; Lavoue, S.; Inoue, J.G.; Satoh, T.P.; Kawaguchi, A.; Nishida, M. Interrelationships of the 11 gasterosteiform families (sticklebacks, pipefishes, and their relatives): A new perspective based on whole mitogenome sequences from 75 higher teleosts. Mol. Phylogenetics Evol. 2008, 46, 224–236. [Google Scholar] [CrossRef]
  22. Wainwright, P.C.; Smith, W.L.; Price, S.A.; Tang, K.L.; Sparks, J.S.; Ferry, L.A.; Kuhn, K.L.; Eytan, R.I.; Near, T.J. The Evolution of Pharyngognathy: A Phylogenetic and Functional Appraisal of the Pharyngeal Jaw Key Innovation in Labroid Fishes and Beyond. Syst. Biol. 2012, 61, 1001–1027. [Google Scholar] [CrossRef]
  23. Campbell, M.A.; Chen, W.J.; López, J.A. Are flatfishes (Pleuronectiformes) monophyletic? Mol. Phylogenet. Evol. 2013, 69, 664–673. [Google Scholar] [CrossRef]
  24. Campbell, M.A.; Chen, W.J.; López, J.A. Molecular data do not provide unambiguous support for the monophyly of flatfishes (Pleuronectiformes): A reply to Betancur-R and Ortí. Mol. Phylogenetics Evol. 2014, 75, 149–153. [Google Scholar] [CrossRef]
  25. Betancur, R.R.; Orti, G. Molecular evidence for the monophyly of flatfishes (Carangimorpharia: Pleuronectiformes). Mol. Phylogenetics Evol. 2014, 73, 18–22. [Google Scholar] [CrossRef] [PubMed]
  26. Campbell, M.A.; Chanet, B.; Chen, J.N.; Lee, M.Y.; Chen, W.J. Origins and relationships of the Pleuronectoidei: Molecular and morphological analysis of living and fossil taxa. Zool. Scr. 2019, 48, 640–656. [Google Scholar] [CrossRef]
  27. Harrington, R.C.; Faircloth, B.C.; Eytan, R.I.; Smith, W.L.; Near, T.J.; Alfaro, M.E.; Friedman, M. Phylogenomic analysis of carangimorph fishes reveals flatfish asymmetry arose in a blink of the evolutionary eye. BMC Evol. Biol. 2016, 16, 22. [Google Scholar] [CrossRef] [PubMed]
  28. Campbell, M.A.; López, J.A.; Satoh, T.P.; Chen, W.-J.; Miya, M. Mitochondrial genomic investigation of flatfish monophyly. Gene 2014, 551, 176–182. [Google Scholar] [CrossRef] [PubMed]
  29. Shi, W.; Chen, S.; Kong, X.; Si, L.; Gong, L.; Zhang, Y.; Yu, H. Flatfish monophyly refereed by the relationship of Psettodes in Carangimorphariae. BMC Genom. 2018, 19, 400. [Google Scholar] [CrossRef]
  30. Potkamp, G.; Fransen, C.H.J.M. Speciation with gene flow in marine systems. Contrib. Zool. 2019, 88, 133–172. [Google Scholar] [CrossRef]
  31. Faria, R.; Johannesson, K.; Stankowski, S. Speciation in marine environments: Diving under the surface. J. Evol. Biol. 2021, 34, 4–15. [Google Scholar] [CrossRef]
  32. Momigliano, P.; Jokinen, H.; Fraimout, A.; Florin, A.B.; Norkko, A.; Merilä, J. Extraordinarily rapid speciation in a marine fish. Proc. Natl. Acad. Sci. USA 2017, 114, 6074–6079. [Google Scholar] [CrossRef]
  33. Carpenter, K.E. The Living Marine Resources of the Eastern Central Atlantic. FAO Species Identification Guide for Fishery Purposes 2016; Food and Agriculture Organization of the United Nations: Rome, Italy, 2016. [Google Scholar]
  34. Kumar, S.; Stecher, G.; Li, M.; Knyaz, C.; Tamura, K. MEGA X: Molecular Evolutionary Genetics Analysis across Computing Platforms. Mol. Biol. Evol. 2018, 35, 1547–1549. [Google Scholar] [CrossRef]
  35. Bernt, M.; Donath, A.; Jühling, F.; Externbrink, F.; Florentz, C.; Fritzsch, G.; Pütz, J.; Middendorf, M.; Stadler, P.F. MITOS: Improved de novo metazoan mitochondrial genome annotation. Mol. Phylogenetics Evol. 2013, 69, 313–319. [Google Scholar] [CrossRef]
  36. Iwasaki, W.; Fukunaga, T.; Isagozawa, R.; Yamada, K.; Maeda, Y.; Satoh, T.P.; Sado, T.; Mabuchi, K.; Takeshima, H.; Miya, M. MitoFish and MitoAnnotator: A Mitochondrial Genome Database of Fish with an Accurate and Automatic Annotation Pipeline. Mol. Biol. Evol. 2013, 30, 2531–2540. [Google Scholar] [CrossRef] [PubMed]
  37. Perna, N.T.; Kocher, T.D. Patterns of nucleotide composition at fourfold degenerate sites of animal mitochondrial genomes. J. Mol. Evol. 1995, 41, 353–359. [Google Scholar] [CrossRef] [PubMed]
  38. Chan, P.P.; Lin, B.Y.; Mak, A.J.; Lowe, T.M. tRNAscan-SE 2.0: Improved detection and functional classification of transfer RNA genes. Nucleic Acids Res. 2021, 49, 9077–9096. [Google Scholar] [CrossRef] [PubMed]
  39. Laslett, D.; Canbäck, B. ARWEN: A program to detect tRNA genes in metazoan mitochondrial nucleotide sequences. Bioinformatics 2007, 24, 172–175. [Google Scholar] [CrossRef] [PubMed]
  40. Thompson, J.D.; Gibson, T.J.; Plewniak, F.; Jeanmougin, F.; Higgins, D.G. The CLUSTAL_X windows interface: Flexible strategies for multiple sequence alignment aided by quality analysis tools. Nucleic Acids Res. 1997, 25, 4876–4882. [Google Scholar] [CrossRef]
  41. Benson, G. Tandem repeats finder: A program to analyze DNA sequences. Nucleic Acids Res. 1999, 27, 573–580. [Google Scholar] [CrossRef]
  42. Lin, G.; Lo, L.C.; Zhu, Z.Y.; Feng, F.; Chou, R.; Yue, G.H. The Complete Mitochondrial Genome Sequence and Characterization of Single-Nucleotide Polymorphisms in the Control Region of the Asian Seabass (Lates calcarifer). Mar. Biotechnol. 2006, 8, 71–79. [Google Scholar] [CrossRef]
  43. He, C.; Han, J.; Ge, L.; Zhou, Z.; Gao, X.; Mu, Y.; Liu, W.; Cao, J.; Liu, Z. Sequence and organization of the complete mitochondrial genomes of spotted halibut (Verasper variegatus) and barfin flounder (Verasper moseri). DNA Seq. 2008, 19, 246–255. [Google Scholar] [CrossRef]
  44. Shi, W.; Miao, X.-G.; Kong, X.-Y. A novel model of double replications and random loss accounts for rearrangements in the Mitogenome of Samariscus latus (Teleostei: Pleuronectiformes). BMC Genom. 2014, 15, 352. [Google Scholar] [CrossRef]
  45. Shi, W.; Gong, L.; Wang, S.-Y.; Miao, X.-G.; Kong, X.-Y. Tandem Duplication and Random Loss for mitogenome rearrangement in Symphurus (Teleost: Pleuronectiformes). BMC Genom. 2015, 16, 355. [Google Scholar] [CrossRef]
  46. Gong, L.; Si, L.-Z.; Shi, W.; Kong, X.-Y. The complete mitochondrial genome of Zebrias crossolepis (Pleuronectiformes: Soleidae). Mitochondrial DNA A DNA Mapp. Seq. Anal. 2016, 27, 1235–1236. [Google Scholar] [CrossRef] [PubMed]
  47. Gong, L.; Shi, W.; Yang, M.; Li, D.; Kong, X. Novel gene arrangement in the mitochondrial genome of Bothus myriaster (Pleuronectiformes: Bothidae): Evidence for the Dimer-Mitogenome and Non-random Loss model. Mitochondrial DNA A DNA Mapp. Seq. Anal. 2016, 27, 3089–3092. [Google Scholar] [CrossRef] [PubMed]
  48. Wei, M.; Liu, Y.; Guo, H.; Zhao, F.; Chen, S. Characterization of the complete mitochondrial genome of Cynoglossus gracilis and a comparative analysis with other Cynoglossinae fishes. Gene 2016, 591, 369–375. [Google Scholar] [CrossRef] [PubMed]
  49. Si, L.-Z.; Gong, L.; Shi, W.; Yang, M.; Kong, X.-Y. The complete mitochondrial genome of Pseudorhombus dupliocellatus (Pleuronectiformes: Paralichthyidae). Mitochondrial DNA A DNA Mapp. Seq. Anal. 2017, 28, 58–59. [Google Scholar] [CrossRef] [PubMed]
  50. Redin, A.D.; Kartavtsev, Y.P. The Mitogenome Structure of Righteye Flounders (Pleuronectidae): Molecular Phylogeny and Systematics of the Family in East Asia. Diversity 2022, 14, 805. [Google Scholar] [CrossRef]
  51. Vences, M.; Miralles, A.; Brouillet, S.; Ducasse, J.; Fedosov, A.; Kharchev, V.; Kostadinov, I.; Kumari, S.; Patmanidis, S.; Scherz, M.D. iTaxoTools 0.1: Kickstarting a specimen-based software toolkit for taxonomists. Megataxa 2021, 6, 77–92. [Google Scholar] [CrossRef]
  52. Lanfear, R.; Frandsen, P.B.; Wright, A.M.; Senfeld, T.; Calcott, B. PartitionFinder 2: New Methods for Selecting Partitioned Models of Evolution for Molecular and Morphological Phylogenetic Analyses. Mol. Biol. Evol. 2016, 34, 772–773. [Google Scholar] [CrossRef]
  53. Miller, M.A.; Schwartz, T.; Pickett, B.E.; He, S.; Klem, E.B.; Scheuermann, R.H.; Passarotti, M.; Kaufman, S.; O’Leary, M.A. A RESTful API for Access to Phylogenetic Tools via the CIPRES Science Gateway. Evol. Bioinform. 2015, 11, 43–48. [Google Scholar] [CrossRef]
  54. Darriba, D.; Taboada, G.L.; Doallo, R.; Posada, D. JModelTest 2: More models, new heuristics and parallel computing. Nat. Methods 2012, 9, 772. [Google Scholar] [CrossRef]
  55. Ronquist, F.; Huelsenbeck, J.P. MrBayes 3: Bayesian phylogenetic inference under mixed models. Bioinformatics 2003, 19, 1572–1574. [Google Scholar] [CrossRef]
  56. Letunic, I.; Bork, P. Interactive Tree Of Life (iTOL): An online tool for phylogenetic tree display and annotation. Bioinformatics 2007, 23, 127–128. [Google Scholar] [CrossRef]
  57. Mello, B. Estimating TimeTrees with MEGA and the TimeTree Resource. Mol. Biol. Evol. 2018, 35, 2334–2342. [Google Scholar] [CrossRef] [PubMed]
  58. Tamura, K.; Battistuzzi, F.U.; Billing-Ross, P.; Murillo, O.; Filipski, A.; Kumar, S. Estimating divergence times in large molecular phylogenies. Proc. Natl. Acad. Sci. USA 2012, 109, 19333–19338. [Google Scholar] [CrossRef] [PubMed]
  59. Mello, B.; Tao, Q.; Tamura, K.; Kumar, S. Fast and Accurate Estimates of Divergence Times from Big Data. Mol. Biol. Evol. 2017, 34, 45–50. [Google Scholar] [CrossRef] [PubMed]
  60. Kundu, S.; Binarao, J.D.; De Alwis, P.S.; Kim, A.R.; Lee, S.R.; Andriyono, S.; Gietbong, F.Z.; Kim, H.W. First Mitogenome of Endangered Enteromius thysi (Actinopterygii: Cypriniformes: Cyprinidae) from Africa: Characterization and Phylogeny. Fishes 2023, 8, 25. [Google Scholar] [CrossRef]
  61. De Alwis, P.S.; Kundu, S.; Gietbong, F.Z.; Amin, M.H.F.; Lee, S.R.; Kim, H.W.; Kim, A.R. Mitochondriomics of Clarias Fishes (Siluriformes: Clariidae) with a New Assembly of Clarias camerunensis: Insights into the Genetic Characterization and Diversification. Life 2023, 13, 482. [Google Scholar] [CrossRef]
  62. Wang, X.; Wang, Y.; Zhang, Y.; Yu, H.; Tong, J. Evolutionary analysis of cyprinid mitochondrial genomes: Remarkable variation and strong adaptive evolution. Front. Genet. 2016, 7, 156. [Google Scholar]
  63. Ojala, D.; Montoya, J.; Attardi, G. tRNA punctuation model of RNA processing in human mitochondria. Nature 1981, 290, 470–474. [Google Scholar] [CrossRef]
  64. Molina-Quirós, J.L.; Hernández-Muñoz, S.; Baeza, J.A. The complete mitochondrial genome of the roosterfish Nematistius pectoralis Gill 1862: Purifying selection in protein coding genes, organization of the control region, and insights into family-level phylogenomic relationships in the recently erected order Carangiformes. Gene 2022, 845, 146847. [Google Scholar]
  65. Sato, N.S.; Hirabayashi, N.; Agmon, I.; Yonath, A.; Suzuki, T. Comprehensive genetic selection revealed essential bases in the peptidyl-transferase center. Proc. Natl. Acad. Sci. USA 2006, 103, 15386–15391. [Google Scholar] [CrossRef]
  66. Satoh, T.P.; Miya, M.; Mabuchi, K.; Nishida, M. Structure and variation of the mitochondrial genome of fishes. BMC Genom. 2016, 17, 719. [Google Scholar] [CrossRef] [PubMed]
  67. Shi, W.; Kong, X.Y.; Wang, Z.M.; Jiang, J.X. Utility of tRNA genes from the complete mitochondrial genome of Psetta maxima for implying a possible sister-group relationship to the Pleuronectiformes. Zool. Stud. 2011, 50, 665–681. [Google Scholar]
  68. Varani, G.; McClain, W.H. The G-U wobble base pair: A fundamental building block of RNA structure crucial to RNA function in diverse biological systems. EMBO Rep. 2000, 1, 18–23. [Google Scholar] [CrossRef] [PubMed]
  69. Kundu, S.; De Alwis, P.S.; Kim, A.R.; Lee, S.R.; Kang, H.-E.; Go, Y.; Gietbong, F.Z.; Wibowo, A.; Kim, H.-W. Mitogenomic Characterization of Cameroonian Endemic Coptodon camerunensis (Cichliformes: Cichlidae) and Matrilineal Phylogeny of Old-World Cichlids. Genes 2023, 14, 1591. [Google Scholar] [CrossRef] [PubMed]
  70. Clayton, D.A. Replication of animal mitochondrial DNA. Cell 1982, 28, 693–705. [Google Scholar] [CrossRef]
  71. Boore, J. Animal mitochondrial genomes. Nucleic Acids Res. 1999, 27, 1767–1780. [Google Scholar] [CrossRef]
  72. Kong, X.; Dong, X.; Zhang, Y.; Shi, W.; Wang, Z.; Yu, Z. A novel rearrangement in the mitochondrial genome of tongue sole, Cynoglossus semilaevis: Control region translocation and a tRNA gene inversion. Genome 2009, 52, 975–984. [Google Scholar] [CrossRef]
  73. Shi, W.; Dong, X.L.; Wang, Z.M.; Miao, X.G.; Wang, S.Y.; Kong, X.Y. Complete mitogenome sequences of four flatfishes (Pleuronectiformes) reveal a novel gene arrangement of L-strand coding genes. BMC Evol. Biol. 2013, 13, 173. [Google Scholar] [CrossRef]
  74. Shi, W.; Gong, L.; Yu, H. Double control regions of some flatfish mitogenomes evolve in a concerted manner. Int. J. Biol. Macromol. 2020, 142, 11–17. [Google Scholar] [CrossRef]
  75. Gong, L.; Lu, X.; Luo, H.; Zhang, Y.; Shi, W.; Liu, L.; Lü, Z.; Liu, B.; Jiang, L. Novel gene rearrangement pattern in Cynoglossus melampetalus mitochondrial genome: New gene order in genus Cynoglossus (Pleuronectiformes: Cynoglossidae). Int. J. Biol. Macromol. 2020, 149, 1232–1240. [Google Scholar] [CrossRef]
  76. Wang, C.; Chen, H.; Tian, S.; Yang, C.; Chen, X. Novel Gene Rearrangement and the Complete Mitochondrial Genome of Cynoglossus monopus: Insights into the Envolution of the Family Cynoglossidae (Pleuronectiformes). Int. J. Mol. Sci. 2020, 21, 6895. [Google Scholar] [CrossRef] [PubMed]
  77. Tinti, F.; Piccinetti, C.; Tommasini, S.; Vallisneri, M. Mitochondrial DNA Variation, Phylogenetic Relationships, and Evolution of Four Mediterranean Genera of Soles (Soleidae, Pleuronectiformes). Mar. Biotechnol. 2000, 2, 274–284. [Google Scholar] [CrossRef] [PubMed]
  78. Saitoh, K.; Hayashizaki, K.; Yokoyama, Y.; Asahida, T.; Toyohara, H.; Yamashita, Y. Complete nucleotide sequence of Japanese flounder (Paralichthys olivaceus) mitochondrial genome: Structural properties and cue for resolving teleostean relationships. J. Hered. 2000, 91, 271–278. [Google Scholar] [CrossRef] [PubMed]
  79. Miya, M.; Takeshima, H.; Endo, H.; Ishiguro, N.B.; Inoue, J.G.; Mukai, T.; Satoh, T.P.; Yamaguchi, M.; Kawaguchi, A.; Mabuchi, K. Major patterns of higher teleostean phylogenies: A new perspective based on 100 complete mitochondrial DNA sequences. Mol. Phylogenet. Evol. 2003, 26, 121–138. [Google Scholar] [CrossRef] [PubMed]
  80. Chen, S.; Zhang, G.; Shao, C.; Huang, Q.; Liu, G.; Zhang, P.; Song, W.; An, N.; Chalopin, D.; Volff, J.N.; et al. Whole-genome sequence of a flatfish provides insights into ZW sex chromosome evolution and adaptation to a benthic lifestyle. Nat. Genet. 2014, 46, 253–260. [Google Scholar] [CrossRef]
  81. Figueras, A.; Robledo, D.; Corvelo, A.; Hermida, M.; Pereiro, P.; Rubiolo, J.A.; Gómez-Garrido, J.; Carreté, L.; Bello, X.; Gut, M.; et al. Whole genome sequencing of turbot (Scophthalmus maximus; Pleuronectiformes): A fish adapted to demersal life. DNA Res. 2016, 23, 181–192. [Google Scholar] [CrossRef]
  82. Shao, C.; Bao, B.; Xie, Z.; Chen, X.; Li, B.; Jia, X.; Yao, Q.; Ortí, G.; Li, W.; Li, X.; et al. The genome and transcriptome of Japanese flounder provide insights into flatfish asymmetry. Nat. Genet. 2017, 49, 119–124. [Google Scholar] [CrossRef]
  83. Zhao, N.; Guo, H.; Jia, L.; Guo, B.; Zheng, D.; Liu, S.; Zhang, B. Genome assembly and annotation at the chromosomal level of first Pleuronectidae: Verasper variegatus provides a basis for phylogenetic study of Pleuronectiformes. Genomics 2021, 113, 717–726. [Google Scholar] [CrossRef]
  84. Lü, Z.; Gong, L.; Ren, Y.; Chen, Y.; Wang, Z.; Liu, L.; Li, H.; Chen, X.; Li, Z.; Luo, H.; et al. Large-scale sequencing of flatfish genomes provides insights into the polyphyletic origin of their specialized body plan. Nat. Genet. 2021, 53, 742–751. [Google Scholar] [CrossRef]
  85. Atta, C.J.; Yuan, H.; Li, C.; Arcila, D.; Betancur, R.R.; Hughes, L.C.; Ortí, G.; Tornabene, L. Exon-capture data and locus screening provide new insights into the phylogeny of flatfishes (Pleuronectoidei). Mol. Phylogenet. Evol. 2022, 166, 107315. [Google Scholar] [CrossRef]
  86. Lacroix, G.; Barbut, L.; Volckaert, F.A.M. Complex effect of projected sea temperature and wind change on flatfish dispersal. Glob. Chang. Biol. 2018, 24, 85–100. [Google Scholar] [CrossRef]
  87. Vaz, A.; Primo, A.L.; Crespo, D.; Pardal, M.; Martinho, F. Interannual variability in early life phenology is driven by climate and oceanic processes in two NE Atlantic flatfishes. Sci. Rep. 2023, 13, 4057. [Google Scholar] [CrossRef]
  88. Reis-Santos, P.; Tanner, S.E.; Aboim, M.A.; Vasconcelos, R.P.; Laroche, J.; Charrier, G.; Pérez, M.; Presa, P.; Gillanders, B.M.; Cabral, H.N. Reconciling differences in natural tags to infer demographic and genetic connectivity in marine fish populations. Sci. Rep. 2018, 8, 10343. [Google Scholar] [CrossRef] [PubMed]
  89. Ao, H.; Rohling, E.J.; Zhang, R.; Roberts, A.P.; Holbourn, A.E.; Ladant, J.B.; Dupont-Nivet, G.; Kuhnt, W.; Zhang, P.; Wu, F.; et al. Global warming-induced Asian hydrological climate transition across the Miocene–Pliocene boundary. Nat. Commun. 2021, 12, 6935. [Google Scholar] [CrossRef] [PubMed]
  90. Shevenell, A.E.; Kennett, J.P.; Lea, D.W. Middle Miocene Southern Ocean Cooling and Antarctic Cryosphere Expansion. Science 2004, 305, 1766–1770. [Google Scholar] [CrossRef] [PubMed]
  91. Methner, K.; Campani, M.; Fiebig, J.; Löffler, N.; Kempf, O.; Mulch, A. Middle Miocene long-term continental temperature change in and out of pace with marine climate records. Sci. Rep. 2020, 10, 7989. [Google Scholar] [CrossRef] [PubMed]
  92. Herbert, T.D.; Lawrence, K.T.; Tzanova, A.; Peterson, L.C.; Caballero-Gill, R.; Kelly, C.S. Late Miocene global cooling and the rise of modern ecosystems. Nat. Geosci. 2016, 9, 843–847. [Google Scholar] [CrossRef]
  93. Fenton, I.S.; Aze, T.; Farnsworth, A.; Valdes, P.; Saupe, E.E. Origination of the modern-style diversity gradient 15 million years ago. Nature 2023, 614, 708–712. [Google Scholar] [CrossRef]
  94. O’Brien, T.D.; Lorenzoni, L.; Isensee, K.; Valdés, L. What are Marine Ecological Time Series telling us about the ocean. In A Status Report IOC-UNESCO 2017; IOC Technical Series, No. 129; IOC-UNESCO: Paris, France, 2017; 297p. [Google Scholar]
  95. Teske, P.R.; Sandoval-Castillo, J.; Golla, T.R.; Emami-Khoyi, A.; Tine, M.; von der Heyden, S.; Beheregaray, L.B. Thermal selection as a driver of marine ecological speciation. Proc. Biol. Sci. 2019, 286, 20182023. [Google Scholar] [CrossRef]
  96. Costello, M.J.; Coll, M.; Danovaro, R.; Halpin, P.; Ojaveer, H.; Miloslavich, P. A Census of Marine Biodiversity Knowledge, Resources, and Future Challenges. PLoS ONE 2010, 5, e12110. [Google Scholar] [CrossRef]
  97. Hutchings, J.A. Collapse and recovery of marine fishes. Nature 2000, 406, 882–885. [Google Scholar] [CrossRef] [PubMed]
  98. Law, K.L.; Morét-Ferguson, S.; Maximenko, N.A.; Proskurowski, G.; Peacock, E.E.; Hafner, J.; Reddy, C.M. Plastic Accumulation in the North Atlantic Subtropical Gyre. Science 2010, 329, 1185–1188. [Google Scholar] [CrossRef] [PubMed]
  99. Crego-Prieto, V.; Martinez, J.L.; Roca, A.; Garcia-Vazquez, E. Interspecific Hybridization Increased in Congeneric Flatfishes after the Prestige Oil Spill. PLoS ONE 2012, 7, e34485. [Google Scholar] [CrossRef]
  100. Feekings, J.; Bartolino, V.; Madsen, N.; Catchpole, T. Fishery Discards: Factors Affecting Their Variability within a Demersal Trawl Fishery. PLoS ONE 2012, 7, e36409. [Google Scholar] [CrossRef] [PubMed]
  101. Pörtner, H.O.; Roberts, D.C.; Poloczanska, E.S.; Mintenbeck, K.; Tignor, M.; Alegría, A.; Craig, M.; Langsdorf, S.; Löschke, S.; Möller, V.; et al. Climate Change 2022: Impacts, Adaptation and Vulnerability. Contribution of Working Group II to the Sixth Assessment Report of the Intergovernmental Panel on Climate Change; Cambridge University Press: Cambridge, UK; New York, NY, USA, 2022; pp. 3–33. [Google Scholar]
  102. Carstensen, J.; Andersen, J.H.; Gustafsson, B.G.; Conley, D.J. Deoxygenation of the Baltic Sea during the last century. Proc. Natl. Acad. Sci. USA 2014, 111, 5628–5633. [Google Scholar] [CrossRef] [PubMed]
  103. Nissling, A.; Wallin, I. Recruitment variability in Baltic flounder (Platichthys solemdali)—Effects of salinity with implications for stock development facing climate change. J. Sea Res. 2020, 162, 10191. [Google Scholar] [CrossRef]
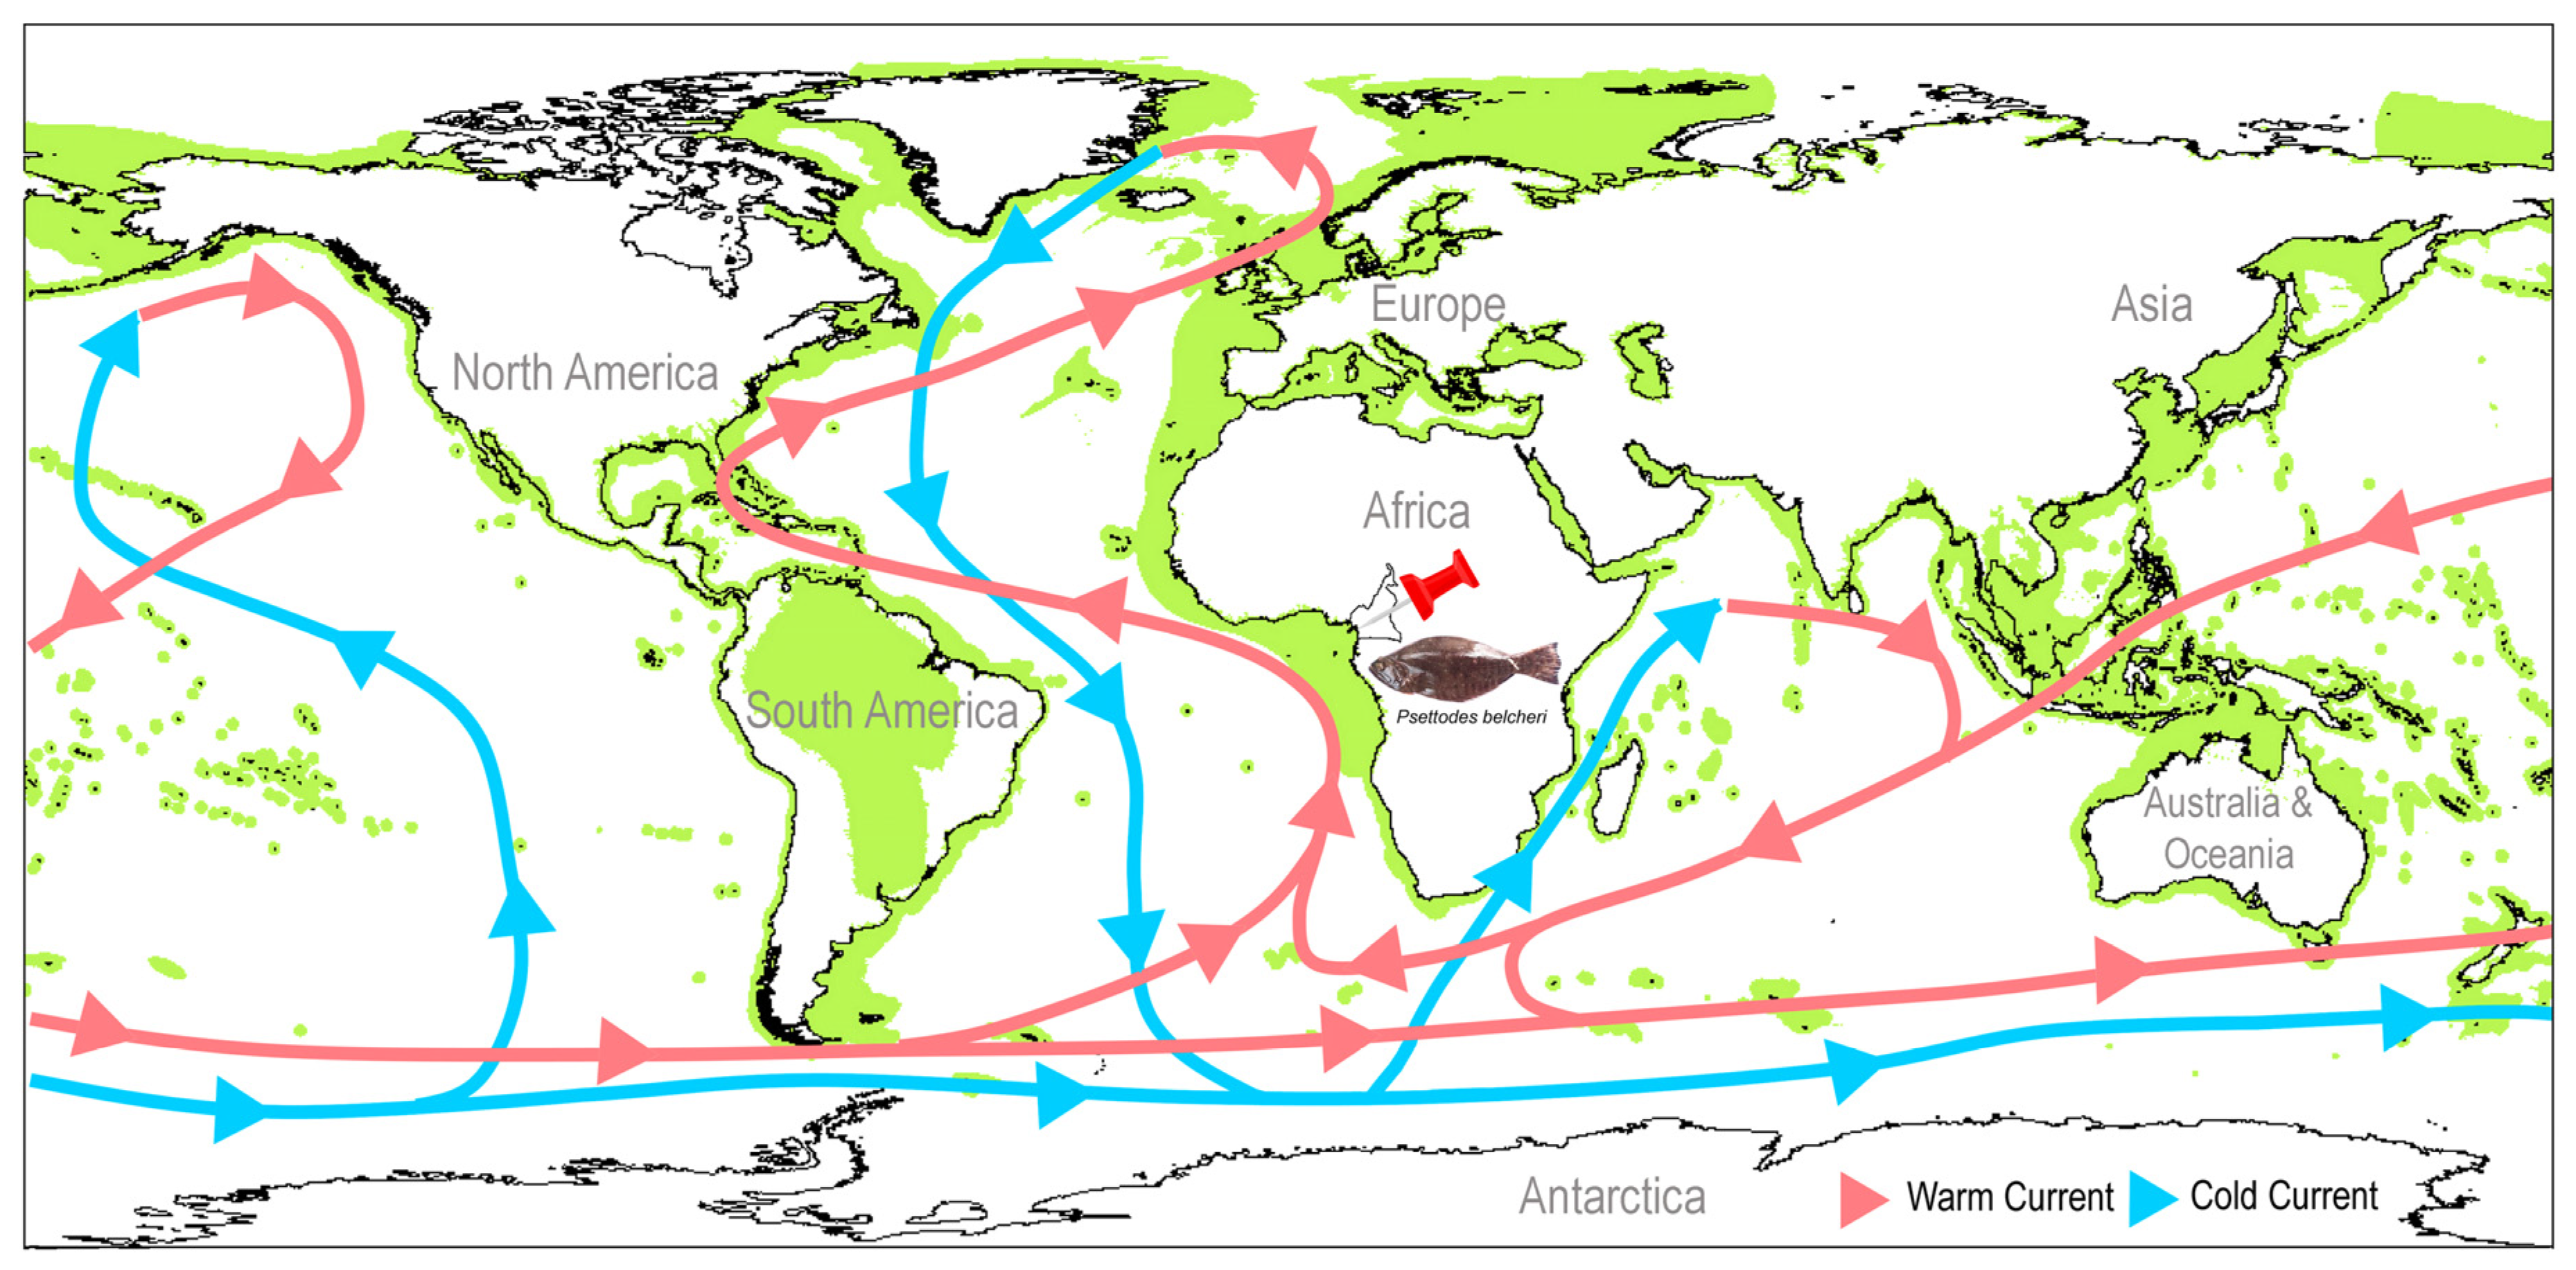
Figure 1. Global distribution of Pleuronectiformes along with the ocean surface currents (warm and cold currents are marked by the red and blue arrow, respectively). Collection locality of Psettodes belcheri is marked by a red pin from Cameroon, Africa. The .shp files were acquired from the IUCN database (accessed on 15 August 2023). The species photographs were taken by the sixth author (F.Z.G) and edited manually in Adobe Photoshop CS 8.0.
Biology 12 01317 g001
Figure 2. The mitochondrial genome of Psettodes belcheri drawn by the MitoAnnotator online server. PCGs, rRNAs, tRNAs, and CR are indicated by different color arcs. The species photographs were taken by the sixth author (F.Z.G) and edited manually in Adobe Photoshop CS 8.0.
Biology 12 01317 g002
Figure 3. Secondary structures of 22 transfer RNAs (tRNAs) of P. belcheri display the structural variation. The tRNAs are denoted by full names and IUPAC-IUB single-letter amino acid codes. The first structure shows the nucleotide positions and details of the stem–loop of tRNAs. Watson–Crick and wobble base pairing are marked by black and red color bars, respectively.
Biology 12 01317 g003
Figure 4. (A) Comparison of length and nucleotide composition of four conserved domains of two Psettodes species control regions. The variable nucleotides are marked in stars; (B) The gene arrangements of two Psettodes species mitogenomes.
Biology 12 01317 g004
Figure 5. The Bayesian matrilineal phylogeny based on the concatenated sequences of 13 PCGs exhibits the evolutionary relationship of Psettodes species with other Pleuronectiformes. The Bayesian posterior probability values are displayed with each node.
Biology 12 01317 g005
Figure 6. The maximum-likelihood-based TimeTree elucidates the approximate divergence time of the Psettodes species along with other Pleuronectiformes species. The approximate divergence times are marked displayed with each node. The red squares represent the calibration points obtained from the prior work [26].
Biology 12 01317 g006
Figure 7. (A) Maps displaying the maritime environments during the Eocene and Miocene periods (source: Encyclopædia Britannica, Inc.). Schematic representation of the major current systems, as defined by the International Group for Marine Ecological Time Series, in the North Atlantic, South Atlantic, and Indo-West Pacific regions. This section also explores the potential diversification and colonization of primitive flatfishes: (B) P. bennettii, (C) P. belcheri, and (D) P. erumei. The illustration of the Psettodes species was sourced from the free media repository (Wikimedia Commons), as well as a previous study [33]. The maps were generated using the DIVA-GIS platform, utilizing IUCN range distribution data (.shp files). Additionally, the illustration of ocean currents is based on insights from a previous study [94]. Violet arrows indicate the warmer currents, while the blue arrows signify the cooler currents.
Biology 12 01317 g007
Table 1. List of annotated mitochondrial genes of Psettodes belcheri.
GenesStartEndStrandSize (bp)Intergenic NucleotideAnti-CodonStart CodonStop Codon
tRNA-Phe 169H690TTC..
12S rRNA701030H9610...
tRNA-Val10311102H7226GTA..
16S rRNA11292830H17020...
tRNA-Leu 28312903H730TTA..
ND129043878H9754.ATGAGG
tRNA-Ile 38833952H701ATC..
tRNA-Gln 39544024L71−1CAA..
tRNA-Met40244093H700ATG..
ND240945138H10450.ATGT--
tRNA-Trp51395211H732TGA..
tRNA-Ala52145282L691GCA..
tRNA-Asn52845356L7338AAC..
tRNA-Cys53955460L660TGC..
tRNA-Tyr54615530L701TAC..
COI55327082H15510.GTGTAA
tRNA-Ser 70837153L718TCA..
tRNA-Asp71627230H698GAC..
COII72397929H6910.ATGT--
tRNA-Lys79308004H751AAA..
ATP880068170H165−7.ATGTAA
ATP681648844H6812.ATGTA-
COIII88479629H7832.ATGTA-
tRNA-Gly96329702H710GGA..
ND3970310,050H3481.ATGT--
tRNA-Arg10,05210,120H690CGA..
ND4L10,12110,414H294−4.ATGTAA
ND410,41111,791H13810.ATGT--
tRNA-His11,79211,859H680CAC..
tRNA-Ser 11,86011,927H686AGC..
tRNA-Leu11,93412,006H730CTA..
ND512,00713,845H1839−1.ATGTAA
ND613,84514,363L5190.ATGTAG
tRNA-Glu14,36414,432L695GAA .
Cytb14,43815,578H11410.ATGT--
tRNA-Thr15,57915,652H74−1ACA..
tRNA-Pro 15,65215,724L730CCA..
Control region 15,72516,747H1023....
Table 2. Nucleotide composition of the mitochondrial genomes of two Psettodes species.
Species NameSize (bp)A%T%G%C%A + T%AT-SkewGC-Skew
Complete mitogenome
P. belcheri (OR231239)16,74728.0926.0616.2429.5654.150.037−0.291
P. erumei (FJ606835)17,31528.8324.7815.7130.6853.610.076−0.323
P. erumei (AP006835)16,68328.5724.5015.7831.1553.070.077−0.328
PCGs
P. belcheri (OR231239)11,42725.0027.7316.0031.2752.74−0.052−0.323
P. erumei (FJ606835)11,42725.3725.7515.6233.2551.13−0.008−0.361
P. erumei (AP006835)11,42625.3325.6215.6233.4350.95−0.006−0.363
rRNAs
P. belcheri (OR231239)268931.4221.3821.8725.3352.810.190−0.073
P. erumei (FJ606835)268032.4320.5620.8626.1652.990.224−0.113
P. erumei (AP006835)268032.4320.4520.9026.2352.870.227−0.113
tRNAs
P. belcheri (OR231239)155627.8327.3123.1421.7255.140.0090.032
P. erumei (FJ606835)155327.1726.8523.8222.1554.020.0060.036
P. erumei (AP006835)155427.2826.8323.6822.2054.120.0080.032
CRs
P. belcheri (OR231239)101530.2533.4012.5123.8463.65−0.050−0.312
P. erumei (FJ606835)160138.9133.9210.3116.8672.830.069−0.241
P. erumei (AP006835)96842.1536.367.1314.3678.510.074−0.337
Disclaimer/Publisher’s Note: The statements, opinions and data contained in all publications are solely those of the individual author(s) and contributor(s) and not of MDPI and/or the editor(s). MDPI and/or the editor(s) disclaim responsibility for any injury to people or property resulting from any ideas, methods, instructions or products referred to in the content.