
An Integrated Monitoring Approach to the Evaluation of the Environmental Impact of an Inshore Mariculture Plant (Mar Grande of Taranto, Ionian Sea)

 , ,
, ,  ,
,  ,
,  ,
,  ,
, 
Abstract
:Simple Summary
Abstract

1. Introduction
2. Materials and Methods
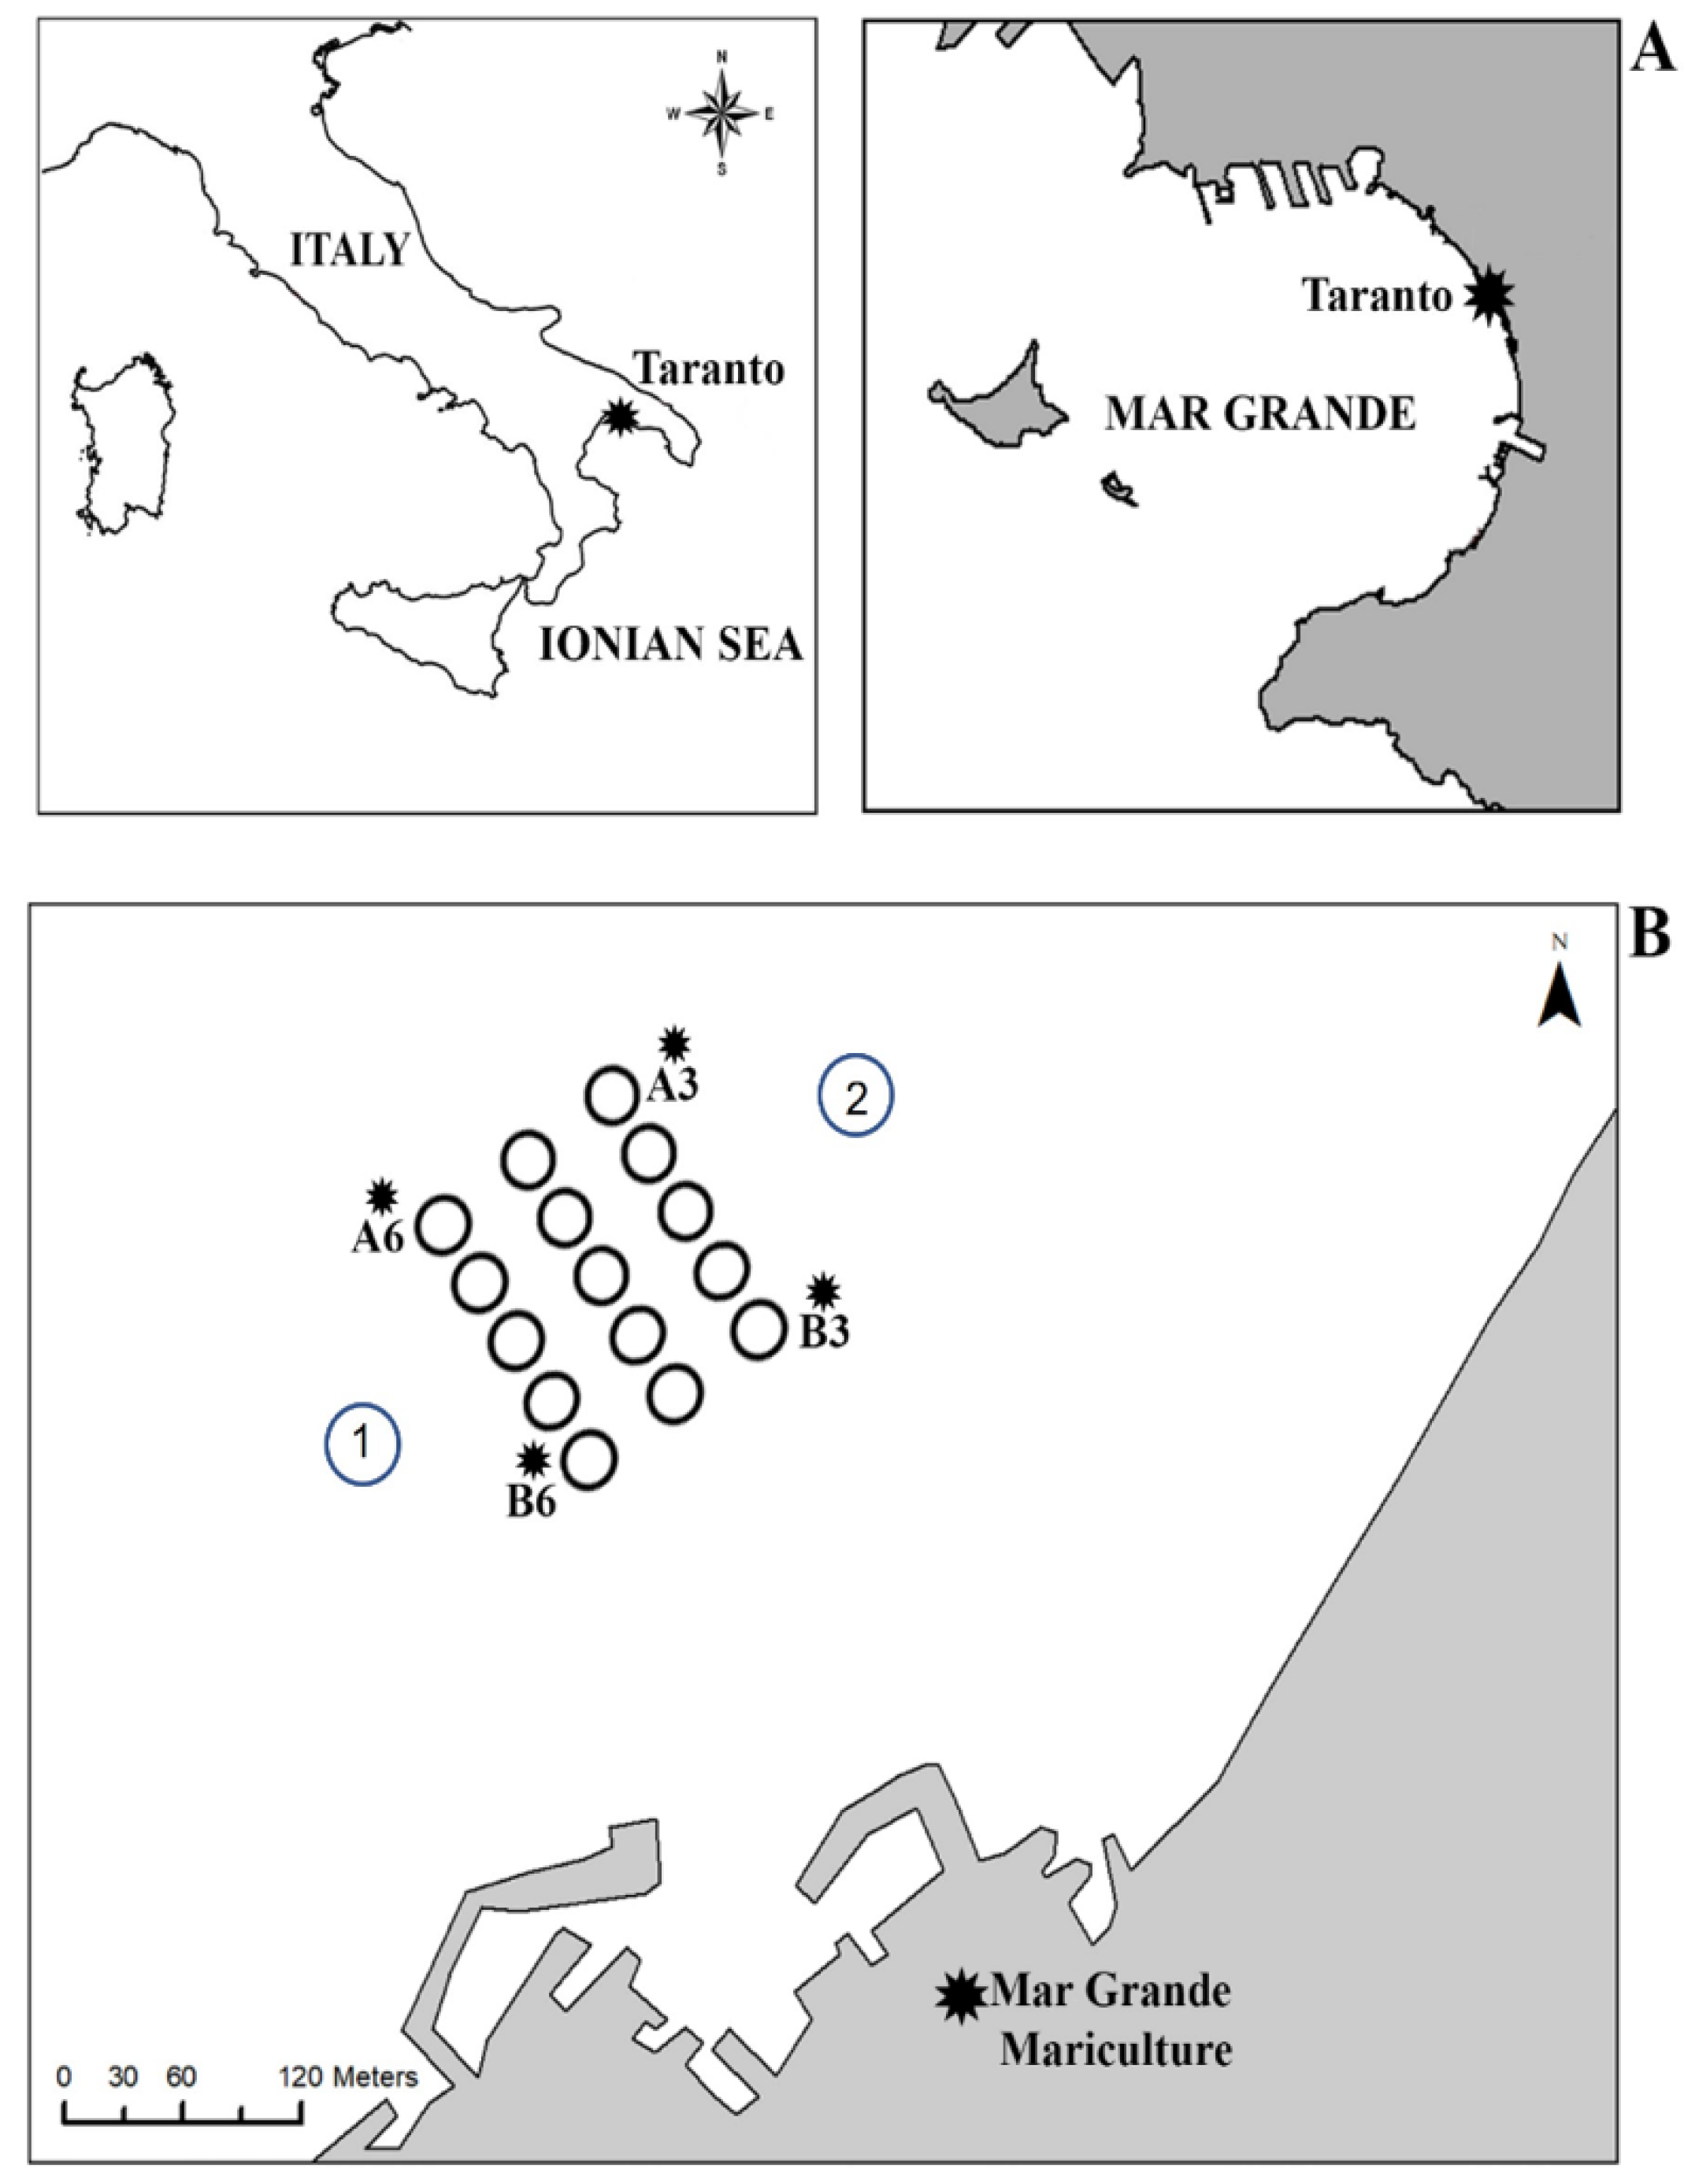
2.1. Study Area
2.2. Sampling
2.3. Physicochemical Measurements
2.4. Biological Features
2.4.1. Microbiology
2.4.2. Macrozoobenthos
2.5. Multivariate Analysis
3. Results
3.1. Physicochemical Features
3.2. Biological Features
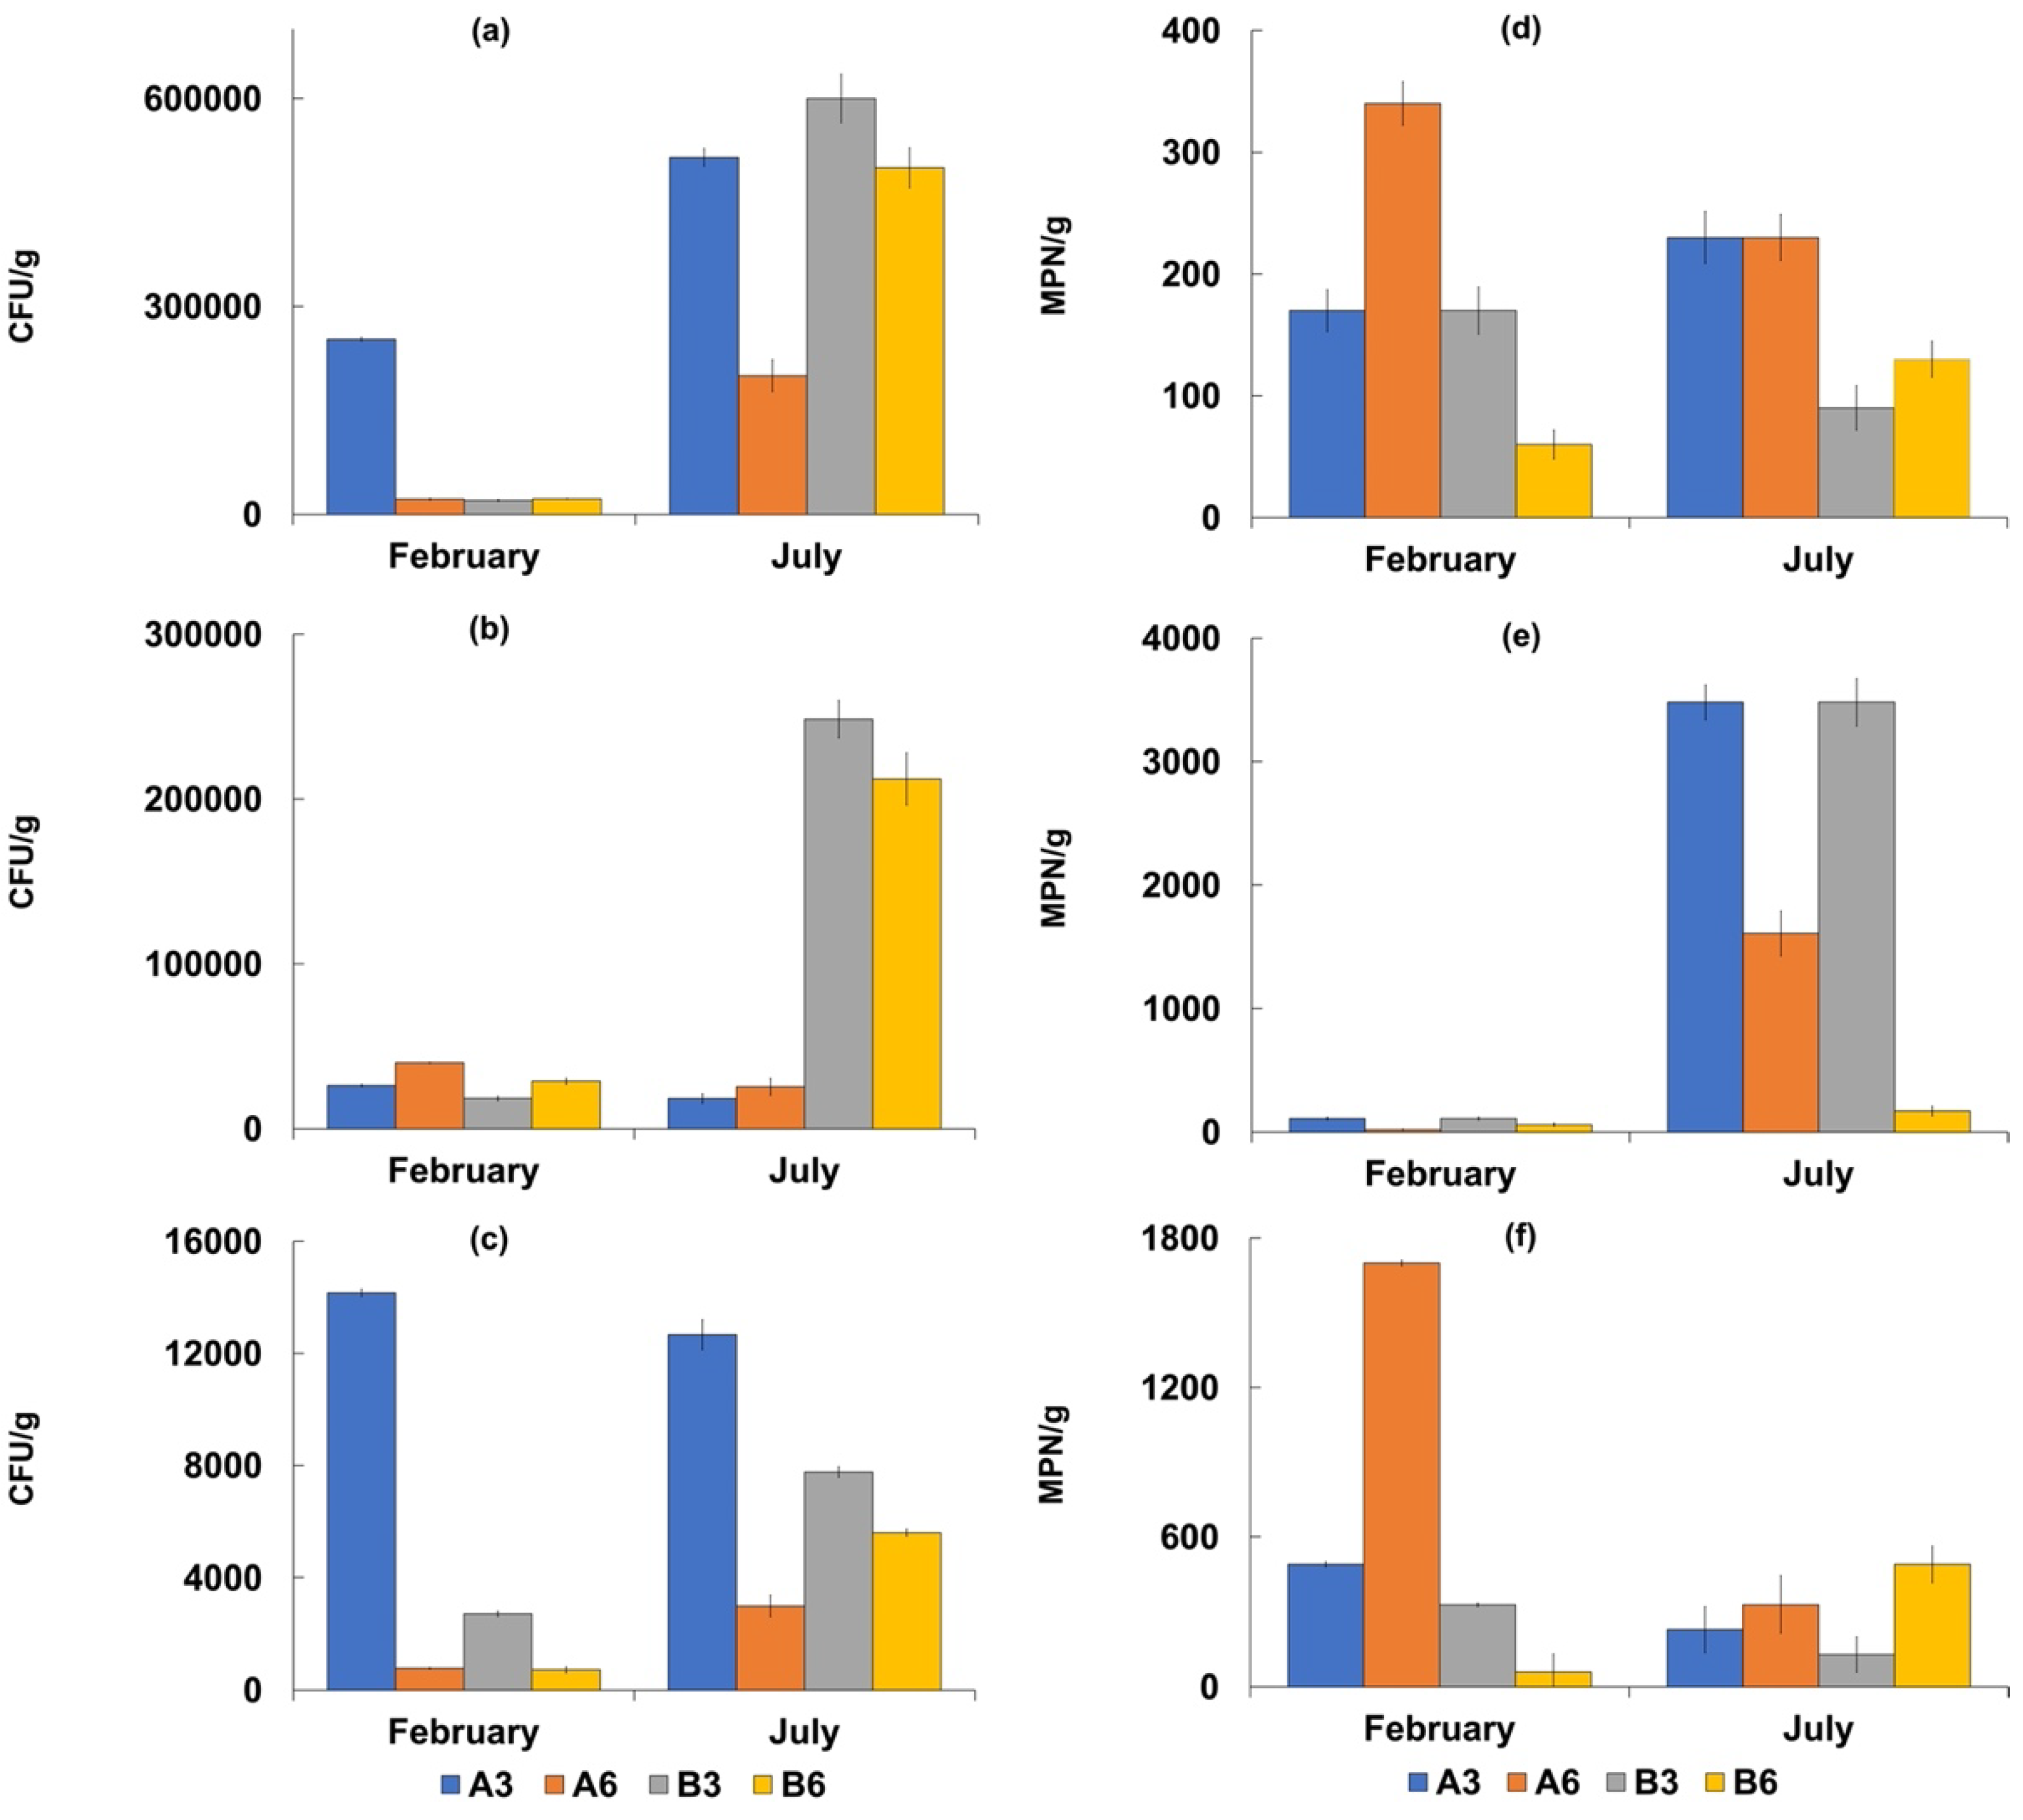
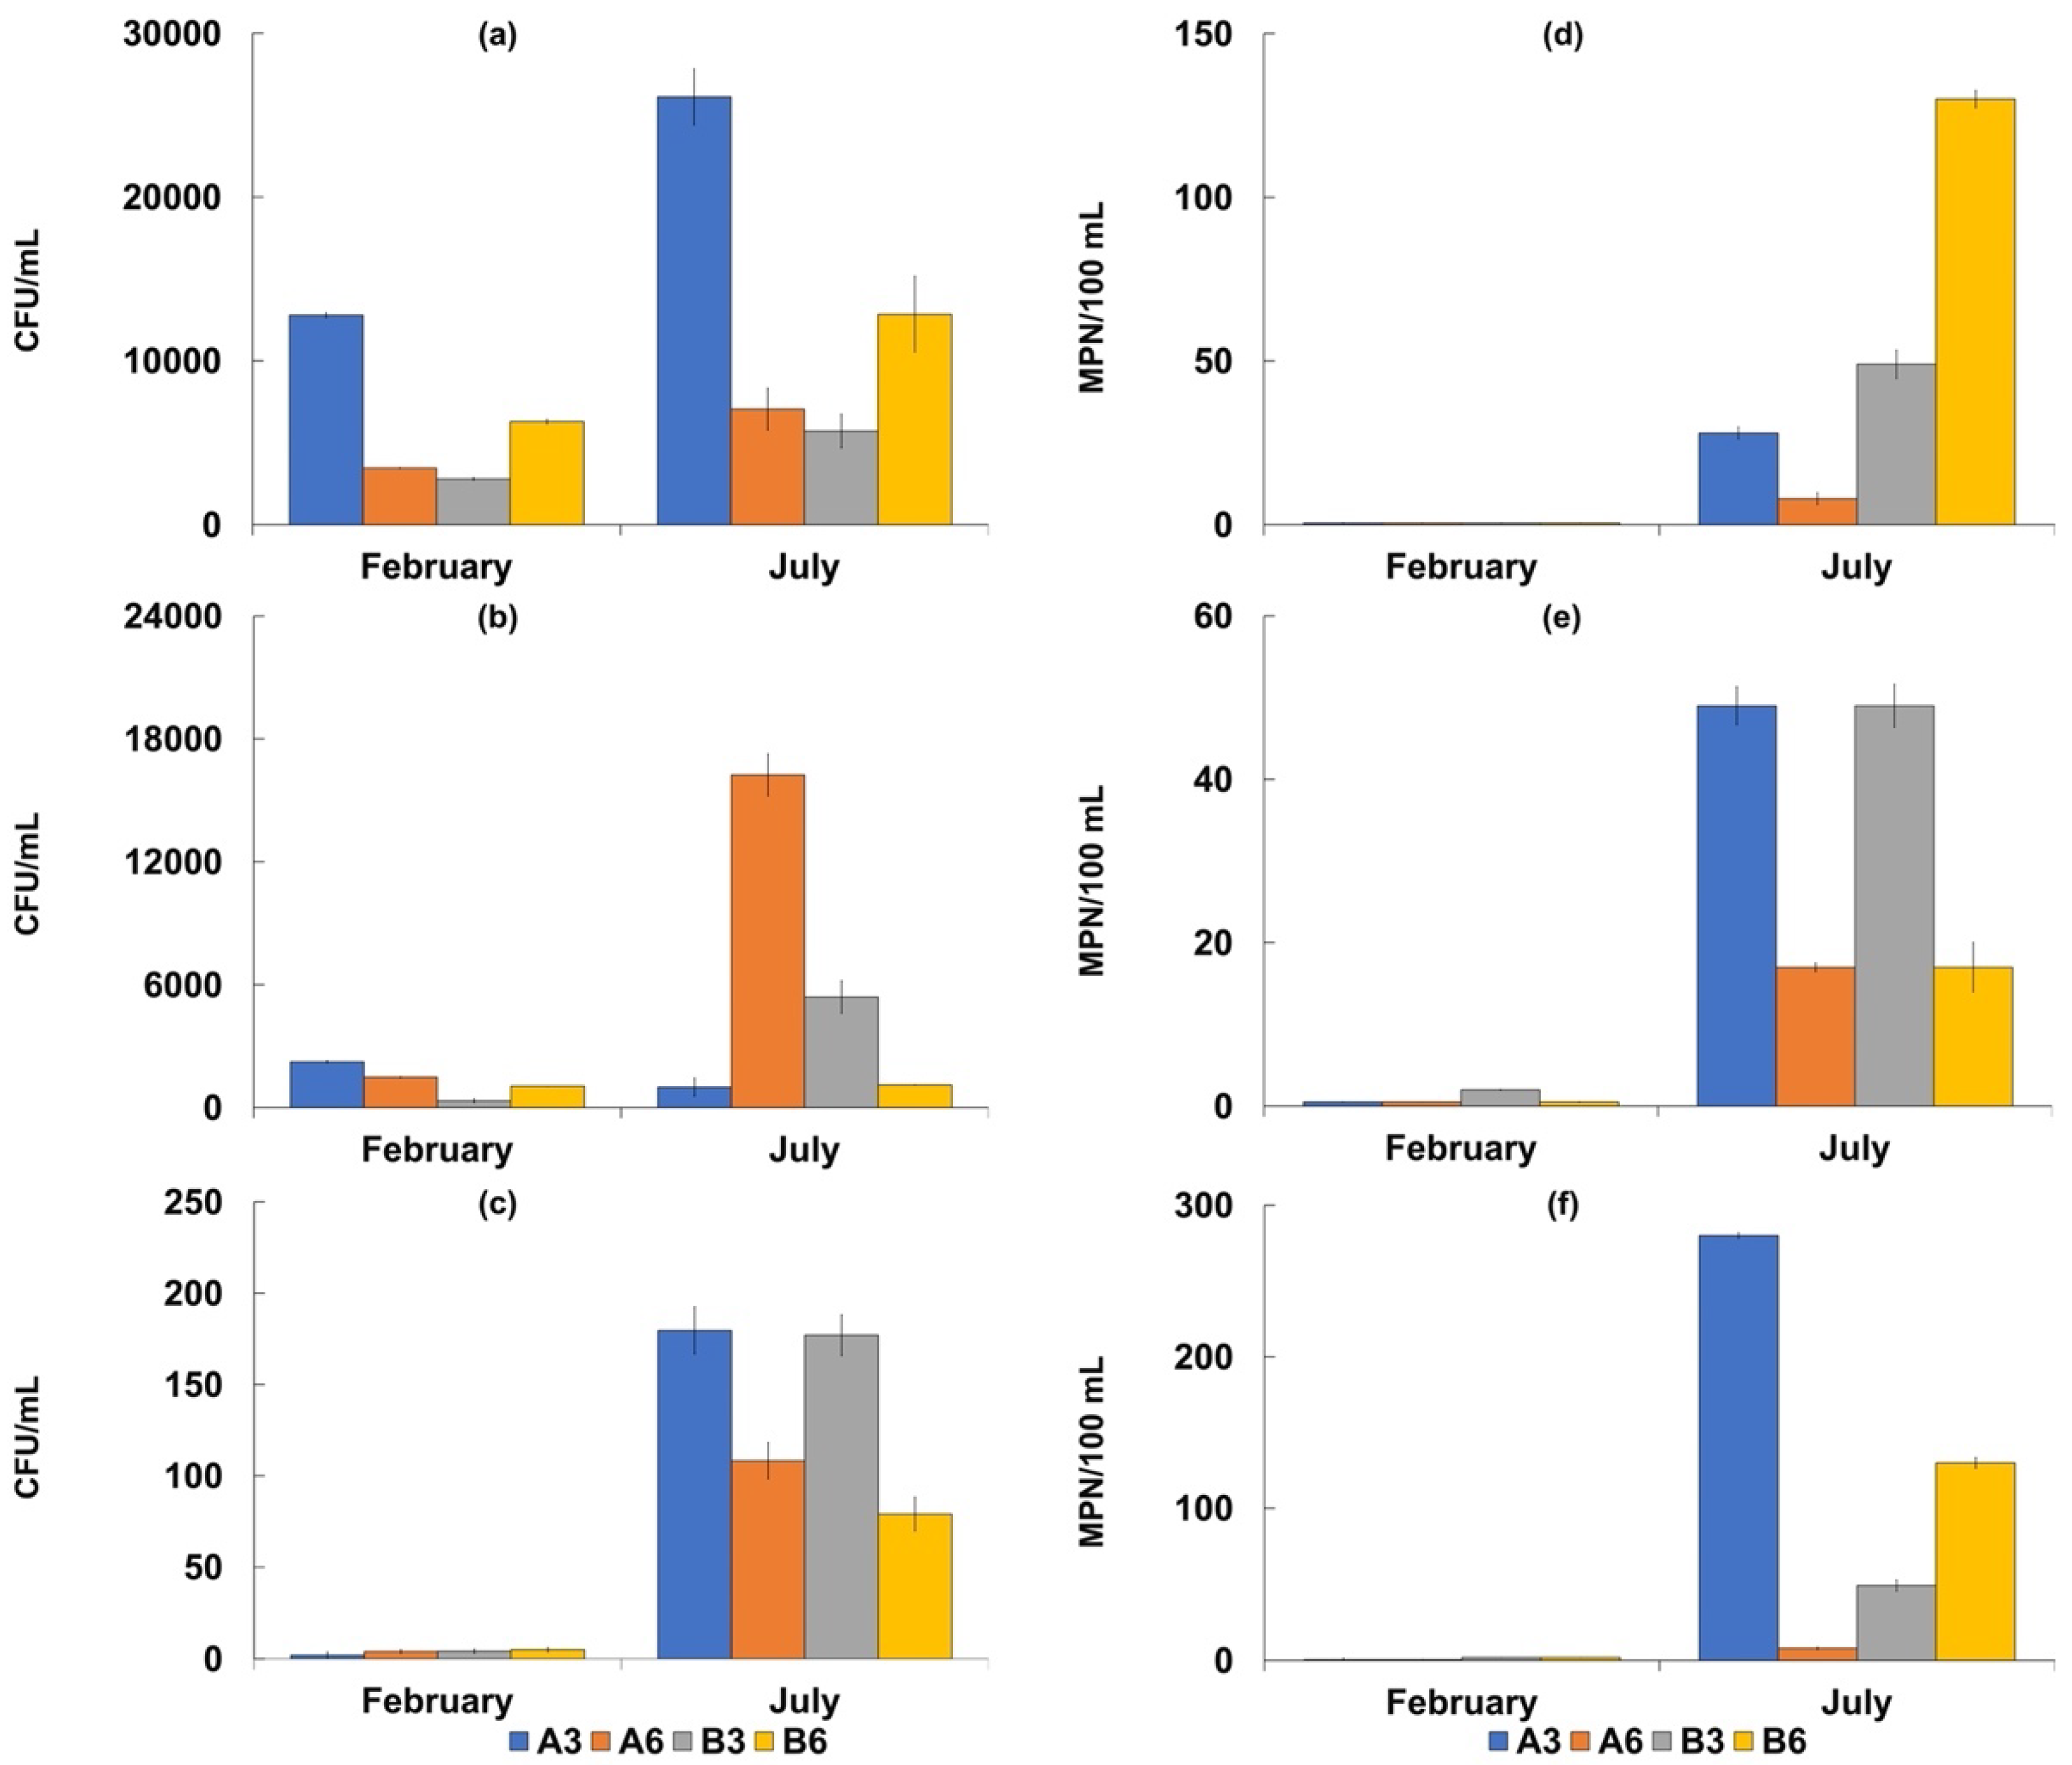
3.2.1. Microbiology
3.2.2. Macrozoobenthos
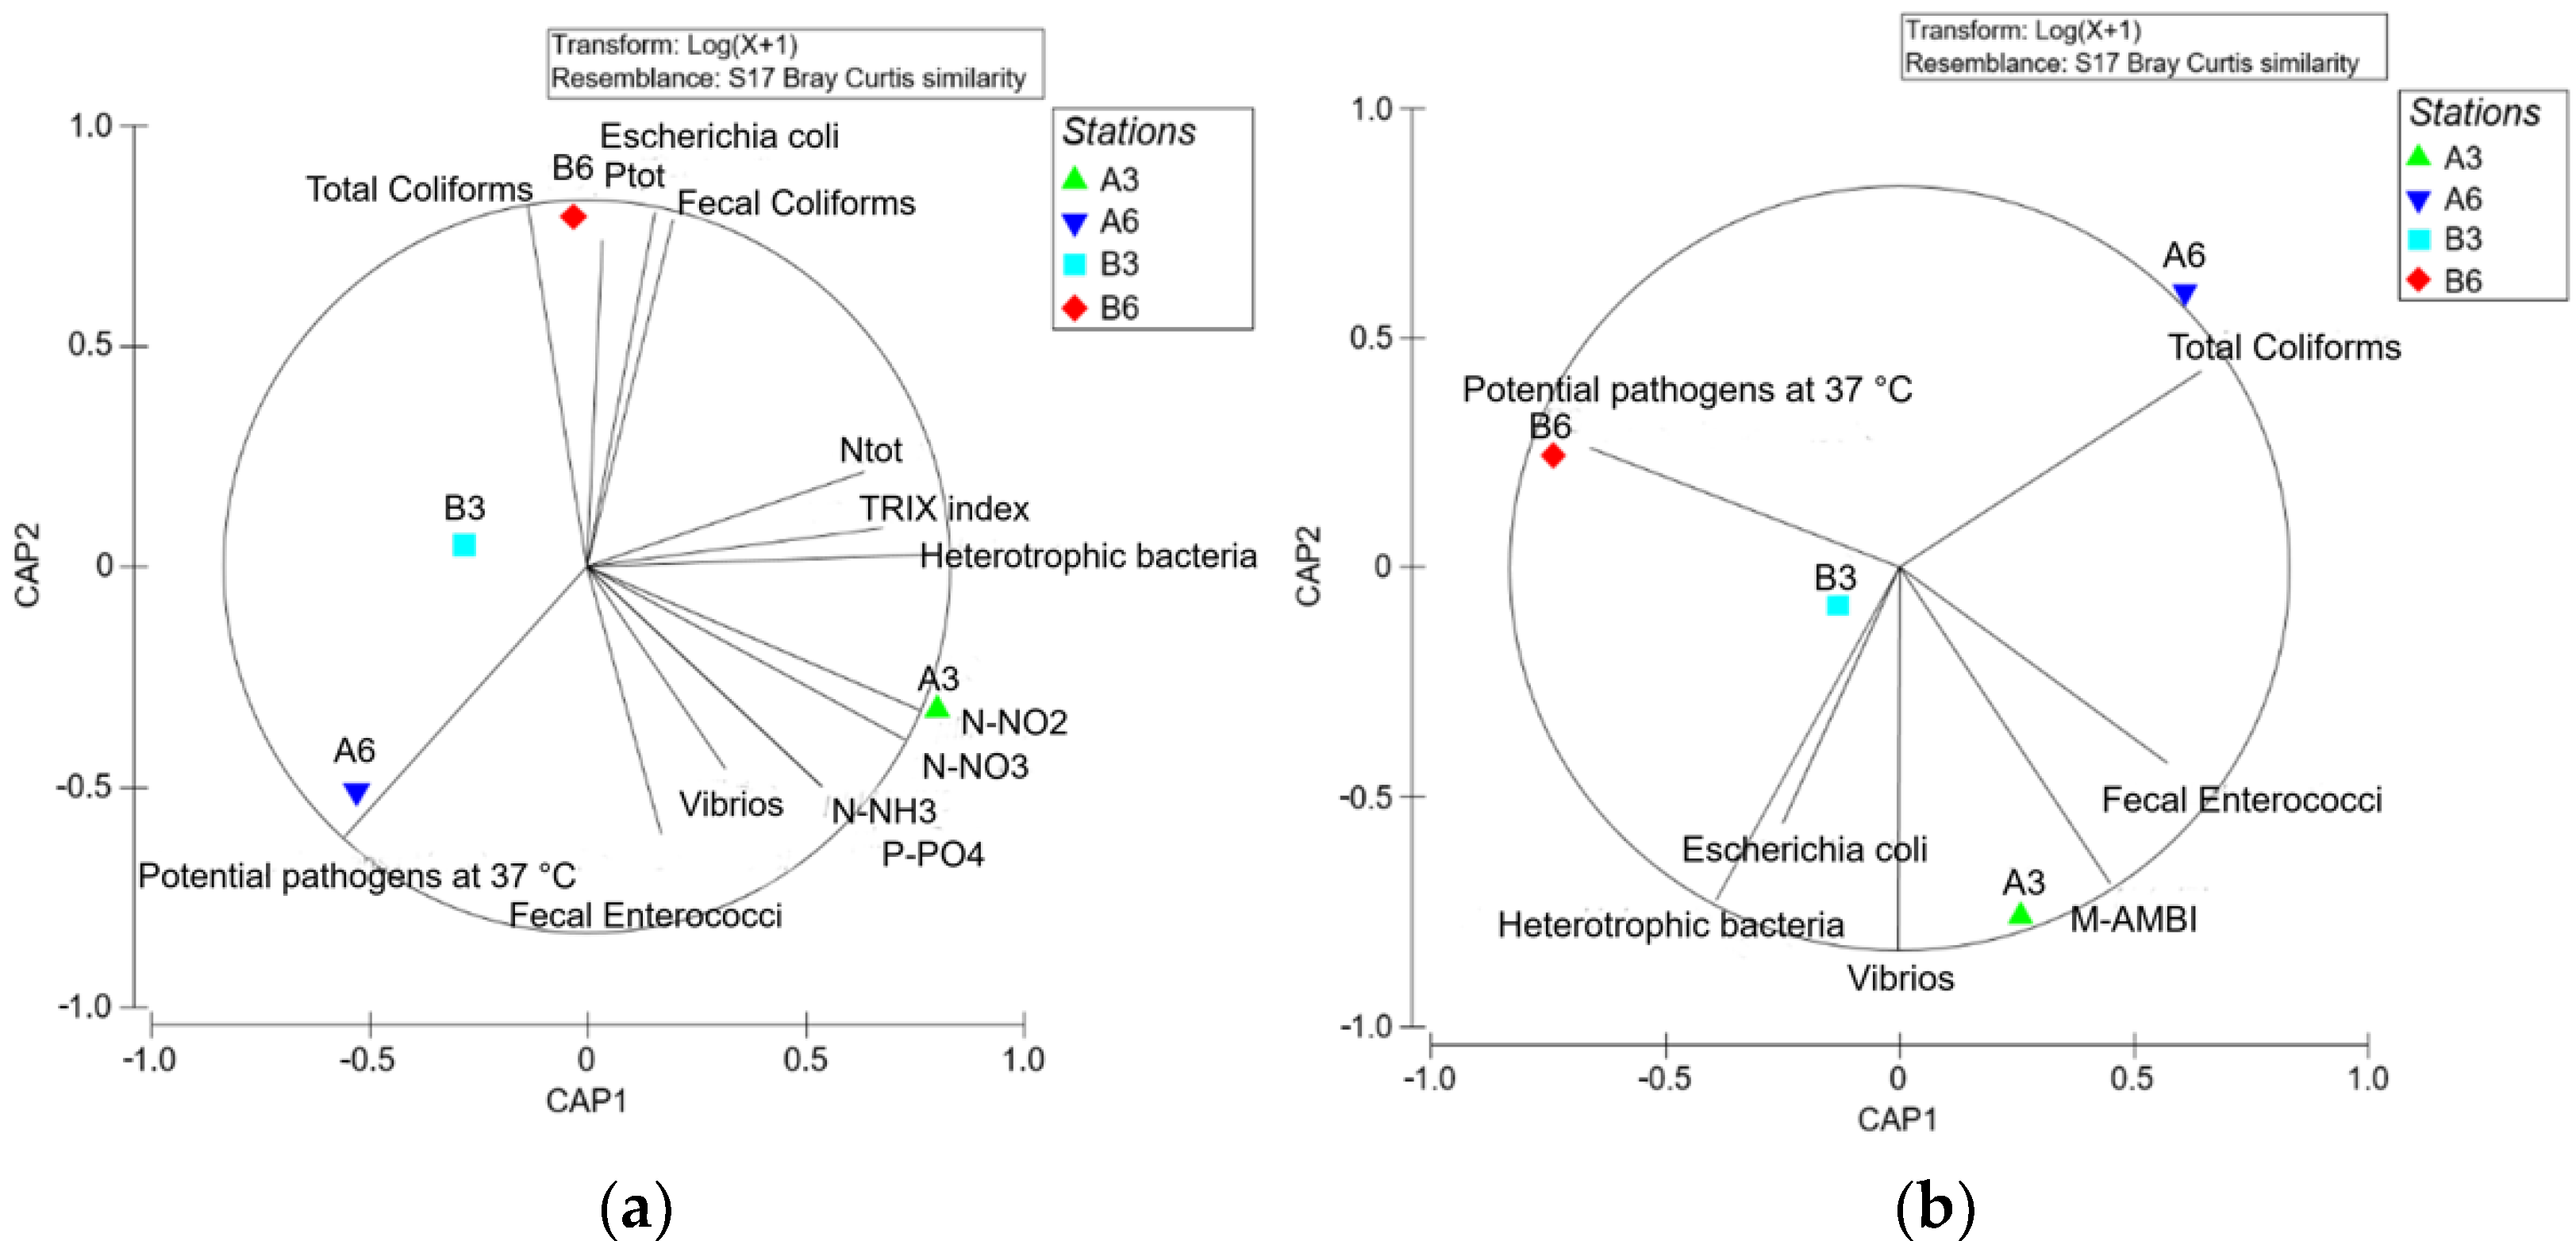
3.3. Multivariate Analysis
4. Discussion
5. Conclusions
Author Contributions
Funding
Institutional Review Board Statement
Informed Consent Statement
Data Availability Statement
Conflicts of Interest
References
- Gentry, R.R.; Lester, S.E.; Kappel, C.V.; White, C.; Bell, T.W.; Stevens, J.; Gaines, S.D. Offshore aquaculture: Spatial planning principles for sustainable development. Ecol. Evol. 2017, 7, 733–743. [Google Scholar] [CrossRef] [PubMed]
- Wang, X.; Cuthbertson, A.; Gualtieri, C.; Shao, D. A review on mariculture effluent: Characterization and management tools. Water 2020, 12, 2991. [Google Scholar] [CrossRef]
- Granada, L.; Sousa, N.; Lopes, S.; Lemos, M.F.L. Is integrated multitrophic aquaculture the solution to the sectors’ major challenges? A review. Rev. Aquac. 2016, 8, 283–300. [Google Scholar] [CrossRef]
- James, M.; Hartstein, N.; Giles, H. Assessment of Ecological Effects of Expanding Salmon Farming in Big Glory Bay, Stewart Island; Part 2 Assessment of Effects; Aquatic Environmental Sciences Ltd.: Whangamata, New Zealand, 2018; pp. 3–45. [Google Scholar]
- Karakassis, I.; Tsapakis, M.; Hatziyanni, E.; Papadopoulou, K.-N.; Plaiti, W. Impact of cage farming of fish on the seabed in three Mediterranean coastal areas. ICES J. Mar. Sci. 2000, 57, 1462–1471. [Google Scholar] [CrossRef] [Green Version]
- Papageorgiou, N.; Dimitriou, P.D.; Moraitis, M.L.; Massa, F.; Fezzardi, D.; Karakassis, I. Changes of the Mediterranean fish farm sector towards a more sustainable approach: A closer look at temporal, spatial and technical shifts. Ocean Coast. Manag. 2021, 214, 105903. [Google Scholar] [CrossRef]
- Vezzulli, L.; Moreno, M.; Marin, V.; Pezzati, E.; Bartoli, M.; Fabiano, M. Organic waste impact of capture-based Atlantic bluefin tuna aquaculture at an exposed site in the Mediterranean Sea. Estuar. Coast. Shelf Sci. 2008, 78, 369–384. [Google Scholar] [CrossRef]
- D’Alessandro, M.; Esposito, V.; Giacobbe, S.; Renzi, M.; Mangano, M.C.; Vivona, P.; Consoli, P.; Scotti, G.; Andaloro, F.; Romeo, T. Ecological assessment of a heavily human-stressed area in the Gulf of Milazzo, Central Mediterranean Sea: An integrated study of biological, physical and chemical indicators. Mar. Pollut. Bull. 2016, 106, 260–273. [Google Scholar] [CrossRef]
- Vollenweider, R.A.; Giovanardi, F.; Montanari, G.; Rinaldi, A. Characterization of the trophic conditions of marine coastal waters with special reference to the NW Adriatic Sea: Proposal for a trophic scale, turbidity and generalized water quality index. Environmetrics Off. J. Int. Environmetrics Soc. 1998, 9, 329–357. [Google Scholar] [CrossRef]
- Pettine, M.; Casentini, B.; Fazi, S.; Giovanardi, F.; Pagnotta, R. A revisitation of TRIX for trophic status assessment in the light of the European Water Framework Directive: Application to Italian coastal waters. Mar. Pollut. Bull. 2007, 54, 1413–1426. [Google Scholar] [CrossRef]
- Borja, Á.; Franco, J.; Valencia, V.; Bald, J.; Muxika, I.; Belzunce, M.J.; Solaun, O. Implementation of the European water framework directive from the Basque country (northern Spain): A methodological approach. Mar. Pollut. Bull. 2004, 48, 209–218. [Google Scholar] [CrossRef]
- Borja, A.; Franco, J.; Pérez, V. A marine biotic index to establish the ecological quality of soft-bottom benthos within European estuarine and coastal environments. Mar. Pollut. Bull. 2000, 40, 1100–1114. [Google Scholar] [CrossRef]
- Muxika, I.; Borja, A.; Bald, J. Using historical data, expert judgement and multivariate analysis in assessing reference conditions and benthic ecological status, according to the European Water Framework Directive. Mar. Pollut. Bull. 2007, 55, 16–29. [Google Scholar] [CrossRef] [PubMed]
- Borja, A.; Ranasinghe, A.; Weisberg, S.B. Assessing ecological integrity in marine waters, using multiple indices and ecosystem components: Challenges for the future. Mar. Pollut. Bull. 2009, 59, 1–4. [Google Scholar] [CrossRef] [PubMed]
- Wang, L.; Fan, Y.; Yan, C.; Gao, C.; Xu, Z.; Liu, X. Assessing benthic ecological impacts of bottom aquaculture using macrofaunal assemblages. Mar. Pollut. Bull. 2017, 114, 258–268. [Google Scholar] [CrossRef]
- Forchino, A.; Borja, A.; Brambilla, F.; Rodríguez, J.G.; Muxika, I.; Terova, G.; Saroglia, M. Evaluating the influence of off-shore cage aquaculture on the benthic ecosystem in Alghero Bay (Sardinia, Italy) using AMBI and M-AMBI. Ecol. Indic. 2011, 11, 1112–1122. [Google Scholar] [CrossRef]
- Karakassis, I.; Dimitriou, P.D.; Papageorgiou, N.; Apostolaki, E.T.; Lampadariou, N.; Black, K.D. Methodological considerations on the coastal and transitional benthic indicators proposed for the Water Framework Directive. Ecol. Indic. 2013, 29, 26–33. [Google Scholar] [CrossRef]
- Umehara, A.; Borja, Á.; Ishida, A.; Nakai, S.; Nishijima, W. Responses of the benthic environment to reduction in anthropogenic nutrient loading in the Seto Inland Sea (Japan), based on M-AMBI assessment. Mar. Environ. Res. 2022, 173, 105509. [Google Scholar] [CrossRef]
- Mazzola, A.; Mirto, S.; La Rosa, T.; Fabiano, M.; Danovaro, R. Fish-farming effects on benthic community structure in coastal sediments: Analysis of meiofaunal recovery. ICES J. Mar. Sci. 2000, 57, 1454–1461. [Google Scholar] [CrossRef] [Green Version]
- Vezzulli, L.; Chelossi, E.; Riccardi, G.; Fabiano, M. Bacterial community structure and activity in fish farm sediments of the Ligurian sea (Western Mediterranean). Aquac. Int. 2002, 10, 123–141. [Google Scholar] [CrossRef]
- Bedwell, M.S.; Goulder, R. Bacterial outputs from ponds and tanks used in intensive fish farming. Lett. Appl. Microbiol. 1996, 23, 412–416. [Google Scholar] [CrossRef]
- La Rosa, T.; Mirto, S.; Marino, A.; Alonzo, V.; Maugeri, T.L.; Mazzola, A. Heterotrophic bacteria community and pollution indicators of mussel—farm impact in the Gulf of Gaeta (Tyrrhenian Sea). Mar. Environ. Res. 2001, 52, 301–321. [Google Scholar] [CrossRef]
- Caruso, G.; Caruso, R.; Sarà, G. Microbiological controls in polyculture farming: A pilot case study in the Castellammare Gulf (Sicily). J. Clin. Microbiol. Biochem. Technol. 2020, 6, 14–28. [Google Scholar] [CrossRef]
- De Souza, J.P.; Sposito, J.C.V.; Crispin, B.d.A.; da Silva, F.G.; de Oliveira, K.M.P.; Kummrov, F.; do Nascimento, V.A.; Montagner, C.C.; Viana, L.F.; Solórzano, J.C.J.; et al. From collection to discharge: Physical, chemical, and biological analyses for fish farm water quality monitoring. Ecotoxicology 2019, 28, 13–25. [Google Scholar] [CrossRef] [PubMed]
- Knowler, D.; Chopin, T.; Martínez-Espiñeira, R.; Neori, A.; Nobre, A.; Noce, A.; Reid, G. The economics of Integrated Multi-Trophic Aquaculture: Where are we now and where do we need to go? Rev. Aquac. 2020, 12, 1579–1594. [Google Scholar] [CrossRef]
- Thomas, M.; Pasquet, A.; Aubin, J.; Nahon, S.; Lecocq, T. When more is more: Taking advantage of species diversity to move towards sustainable aquaculture. Biol. Rev. 2021, 96, 767–784. [Google Scholar] [CrossRef]
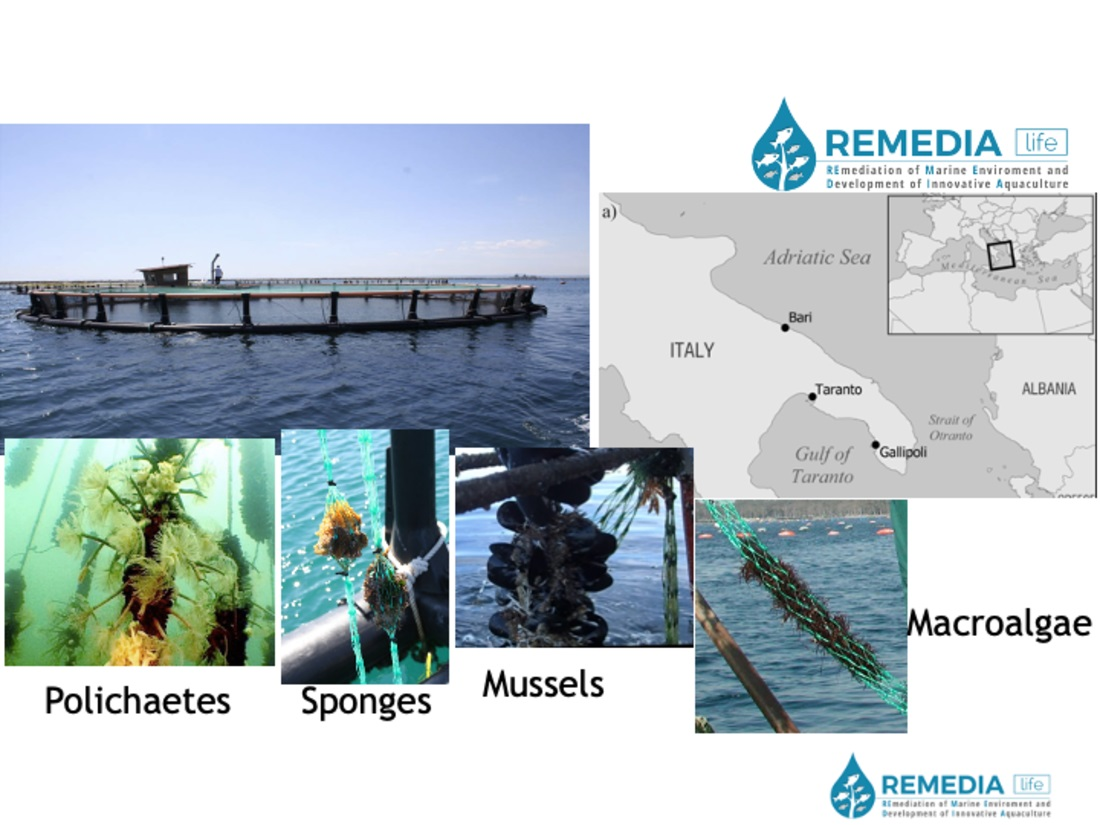
- Giangrande, A.; Pierri, C.; Arduini, D.; Borghese, J.; Licciano, M.; Trani, R.; Corriero, G.; Basile, G.; Cecere, E.; Petrocelli, A.; et al. An innovative IMTA system: Polychaetes, sponges and macroalgae co-cultured in a Southern Italian in-shore mariculture plant (Ionian Sea). J. Mar. Sci. Eng. 2020, 8, 733. [Google Scholar] [CrossRef]
- Giangrande, A.; Licciano, M.; Arduini, D.; Borghese, J.; Pierri, C.; Trani, R.; Longo, C.; Petrocelli, A.; Ricci, P.; Alabiso, G.; et al. Integrated study for the assessment of an inshore mariculture plant impact on the surrounding environment (Ionian Sea). In Proceedings of the International Workshop on Metrology for the Sea (MetroSea), Virtual Conference, 4–6 October 2021. [Google Scholar]
- International Organization for Standardization. Water Quality—Enumeration of Culturable Microorganisms—Colony Count by Inoculation in a Nutrient Agar Culture Medium; ISO 6222:2010; International Organization for Standardization: Geneva, Switzerland, 2010. [Google Scholar]
- Stabili, L.; Gravili, C.; Tredici, S.M.; Piraino, S.; Talà, A.; Boero, F.; Alifano, P. Epibiotic Vibrio luminous bacteria isolated from some hydrozoa and bryozoa species. Microb. Ecol. 2008, 56, 625–636. [Google Scholar] [CrossRef]
- American Public Health Association. Standard Methods for the Examination of Water and Wastewater, 21st ed; American Public Health Association/American Water Works Association/Water Environment Federation: Washington, DC, USA, 2005. [Google Scholar]
- International Organization for Standardization. Water Quality—Detection and Enumeration of Escherichia coli and Coliform Bacteria—Part 3: Miniaturized Method (Most Probable Number) for the Detection and Enumeration of E. coli in Surface and Wastewater; ISO 9308-3; International Organization for Standardization: Geneva, Switzerland, 1998. [Google Scholar]
- International Organization for Standardization. Water Quality—Detection and Enumeration of Intestinal Enterococci in Surface and Wastewater—Part 1: Miniaturized Method (Most Probable Number) by Inoculation in Liquid Medium; ISO 7899-1:1998; International Organization for Standardization: Geneva, Switzerland, 1998. [Google Scholar]
- Stabili, L.; Licciano, M.; Giangrande, A.; Fanelli, G.; Cavallo, R.A. Sabella spallanzanii filter-feeding on bacterial community: Ecological implications and applications. Mar. Environ. Res. 2006, 61, 74–92. [Google Scholar] [CrossRef]
- Planas, M.; Pérez-Lorenzo, M.; Hjelm, M.; Gram, L.; Fiksdal, I.U.; Bergh, Ø.; Pintado, J. Probiotic effect in vivo of Roseobacter strain 27-4 against Vibrio (Listonella) anguillarum infections in turbot (Scophthalmus maximus L.) larvae. Aquaculture 2006, 255, 323–333. [Google Scholar] [CrossRef] [Green Version]
- APAT, CNR IRSA. 7000-Metodi per la Determinazione di Microorganismi Indicatori di Inquinamento e di Patogeni—7080 Salmonella spp. in Manuali e Linee Guida 29/2003 Metodi Analitici per le Acque; IRSA: Roma, Italy, 2003; Volume 3. [Google Scholar]
- APAT, CNR IRSA. 7000-Metodi per la Determinazione di Microorganismi Indicatori di Inquinamento e di Patogeni—7030 Escherichia coli in Manuali e Linee Guida 29/2003 Metodi Analitici per le Acque; IRSA: Roma, Italy, 2003; Volume 3. [Google Scholar]
- Microbics Corporation. Microtox® M500 Manual (A Toxicity Testing Handbook), 3rd ed.; Microbics Corporation: Carlsbad, CA, USA, 1994. [Google Scholar]
- Narracci, M.; Acquaviva, M.I.; Cavallo, R.A. Mar Piccolo of Taranto: Vibrio biodiversity in ecotoxicology approach. Environ. Sci. Pollut. Res. 2014, 21, 2378–2385. [Google Scholar] [CrossRef]
- Onorati, F.; Pellegrini, D.; Ausili, A. Evaluation of natural toxicity on MICROTOX solid-phase test. The pelitic normalization; Valutazione della tossicita’naturale nel saggio di MICROTOX in fase solida: La normalizzazione pelitica. Acqua Aria 1999, 6, 83–91. [Google Scholar]
- Clarke, K.R.; Gorley, R.N. Primer v6. User Manual/Tutorial. Plymouth Routine in Multivariate Ecological Research. Plymouth Marine Laboratory. 2006. Available online: https://www.scienceopen.com/document?vid=2cd68314-640b-4288-8316-532e8932d7a1 (accessed on 1 February 2022).
- FAO. The State of World Fisheries and Aquaculture 2020; Sustainability in Action; FAO: Rome, Italy, 2020; ISBN 9789251326923. [Google Scholar]
- Carvalho, S.; Barata, M.; Pereira, F.; Gaspar, M.B.; da Fonseca, L.C.; Pousao-Ferreira, P. Distribution patterns of macrobenthic species in relation to organic enrichment within aquaculture earthen ponds. Mar. Pollut. Bull. 2006, 52, 1573–1584. [Google Scholar] [CrossRef] [PubMed]
- Diaz, R.J.; Rosenberg, R. Spreading dead zones and consequences for marine ecosystems. Science 2008, 321, 926–929. [Google Scholar] [CrossRef] [PubMed]
- Boyd, C.E.; D’Abramo, L.R.; Glencross, B.D.; Huyben, D.C.; Juarez, L.M.; Lockwood, G.S.; McNevin, A.A.; Tacon, A.G.J.; Teletchea, F.; Tomasso, J.R., Jr.; et al. Achieving sustainable aquaculture: Historical and current perspectives and future needs and challenges. J. World Aquac. Soc. 2020, 51, 578–633. [Google Scholar] [CrossRef]
- Chopin, T. Global Aquaculture Advocate; GAA: Portsmouth, NH, USA, 2012. [Google Scholar]
- Chopin, T. Integrated multi-trophic aquaculture–ancient, adaptable concept focuses on ecological integration. Glob. Aquac. Advocate 2013, 16, 16–19. [Google Scholar]
- Flander-Putrle, V.; Malej, A. The trophic state of coastal waters under the influence of anthropogenic sources of nutrients (fish farm, sewage outfalls). Period. Biol. 2003, 105, 359–366. [Google Scholar]
- Yucel-Gier, G.; İdil, P.; Kucuksezgin, F. Spatial analysis of fish farming in the Gulluk Bay (Eastern Aegean). Turkish J. Fish. Aquat. Sci. 2013, 13, 7337–7344. [Google Scholar]
- Yucel-Gier, G.; Arisoy, Y.; Pazi, I. A spatial analysis of fish farming in the context of ICZM in the Bay of Izmir-Turkey. Coast. Manag. 2010, 38, 399–411. [Google Scholar] [CrossRef]
- Noble, R.T.; Lee, I.M.; Schiff, K.C. Inactivation of indicator micro-organisms from various sources of faecal contamination in seawater and freshwater. J. Appl. Microbiol. 2004, 96, 464–472. [Google Scholar] [CrossRef] [Green Version]
- Caruso, G.; Genovese, L.; Mancuso, M.; Modica, A. Effects of fish farming on microbial enzyme activities and densities: Comparison between three Mediterranean sites. Lett. Appl. Microbiol. 2003, 37, 324–328. [Google Scholar] [CrossRef] [Green Version]
- Colwell, R.R. Vibrios in the Environment; Wiley: New York, NY, USA, 1984. [Google Scholar]
- Pascual, J.; Macián, M.C.; Arahal, D.R.; Garay, E.; Pujalte, M.J. Multilocus sequence analysis of the central clade of the genus Vibrio by using the 16S rRNA, recA, pyrH, rpoD, gyrB, rctB and toxR genes. Int. J. Syst. Evol. Microbiol. 2010, 60, 154–165. [Google Scholar] [CrossRef] [PubMed] [Green Version]
- Tang, Y.; Tao, P.; Tan, J.; Mu, H.; Peng, L.; Yang, D.; Tong, S.; Chen, L. Identification of bacterial community composition in freshwater aquaculture system farming of Litopenaeus vannamei reveals distinct temperature-driven patterns. Int. J. Mol. Sci. 2014, 15, 13663–13680. [Google Scholar] [CrossRef] [PubMed]
- Zhang, H.; Sun, Z.; Liu, B.; Xuan, Y.; Jiang, M.; Pan, Y.; Zhang, Y.; Gong, Y.; Lu, X.; Yu, D. Dynamic changes of microbial communities in Litopenaeus vannamei cultures and the effects of environmental factors. Aquaculture 2016, 455, 97–108. [Google Scholar] [CrossRef]
- Silva, C.; Yanez, E.; Martin-Diaz, M.L.; Riba, I.; DelValls, T.A. Integrated ecotoxicological assessment of marine sediments affected by land-based marine fish farm effluents: Physicochemical, acute toxicity and benthic community analyses. Ecotoxicology 2013, 22, 996–1011. [Google Scholar] [CrossRef]
- Lampadariou, N.; Karakassis, I.; Pearson, T.H. Cost/benefit analysis of a benthic monitoring programme of organic benthic enrichment using different sampling and analysis methods. Mar. Pollut. Bull. 2005, 50, 1606–1618. [Google Scholar] [CrossRef]


| AMBI Values | Water Body Classification |
|---|---|
| 0 < AMBI ≤ 1.2 | High |
| 1.2 < AMBI ≤ 3.3 | Good |
| 3.3 < AMBI ≤ 4.3 | Moderate |
| 4.3 < AMBI ≤ 5.5 | Poor |
| 5.5 < AMBI ≤ 7 | Bad |
| Reference Conditions | EQR | |||
|---|---|---|---|---|
| AMBI | H’ | S | High/Good | Good/Moderate |
| 0.5 | 4.8 | 50 | 0.81 | 0.61 |
| FEBRUARY 2018 | ||||
|---|---|---|---|---|
| Stations | ||||
| Parameters | A3 | A6 | B3 | B6 |
| Temperature C° | 17.22 ± 0.93 | 17.44 ± 1.00 | 17.26 ± 0.80 | 17.50 ± 0.92 |
| pH | 7.08 ± 0.07 | 7.05 ± 0.05 | 7.11 ± 0.04 | 6.97 ± 0.08 |
| Turbidity FTU | 12.66 ± 0.01 | 12.66 ± 0.02 | 12.65 ± 0.03 | 12.66 ± 0.01 |
| Salinity PSU | 38.75 ± 0.23 | 38.76 ± 0.24 | 38.78 ± 0.22 | 38.66 ± 0.22 |
| JULY 2018 | ||||
| Stations | ||||
| Parameters | A3 | A6 | B3 | B6 |
| Temperature C° | 26.00 ± 0.67 | 25.88 ± 0.32 | 25.84 ± 0.39 | 25.89 ± 0.35 |
| pH | 7.65 ± 0.05 | 7.65 ± 0.02 | 7.65 ± 0.02 | 7.64 ± 0.03 |
| Turbidity FTU | 12.62 ± 0.02 | 12.63 ± 0.03 | 12.61 ± 0.01 | 12.60 ± 0.01 |
| Salinity PSU | 38.01 ± 2.93 | 38.32 ± 0.02 | 38.35 ± 0.35 | 38.34 ± 0.02 |
| TRIX Index | ||
|---|---|---|
| Station | February 2018 | July 2018 |
| A3 | 4.49 | 5.36 |
| A6 | 3.02 | 3.53 |
| B3 | 2.01 | 2.91 |
| B6 | 2.84 | 4.31 |
| FEBRUARY 2018 | ||||||
|---|---|---|---|---|---|---|
| Water | Sediment | |||||
| Escherichia coli | Salmonella spp. | Escherichia coli | Salmonella spp. | |||
| Samples | MPN/100 mL | 95% Confidence Interval | +/− | MPN/g | 95% Confidence Interval | +/− |
| A3 | 2 | - | - | 270 | 90–800 | - |
| A6 | 4 | <0.5–13 | - | 70 | 10–170 | - |
| B3 | 2 | <0.5–7 | - | 7 | 1–17 | - |
| B6 | 2 | <0.5–7 | - | 170 | <50–460 | - |
| JULY 2018 | ||||||
| Water | Sediment | |||||
| Escherichia coli | Salmonellaspp. | Escherichia coli | Salmonellaspp. | |||
| Samples | MPN/100 mL | 95% Confidence Interval | +/− | MPN/g | 95% Confidence Interval | +/− |
| A3 | 33 | 11–93 | - | 40 | <5–130 | - |
| A6 | 7 | 1–17 | - | 40 | <5–130 | - |
| B3 | 27 | 9–80 | - | 40 | <5–130 | - |
| B6 | 130 | 35–300 | - | 20 | <5–70 | - |
| FEBRUARY 2018 | JULY 2018 | |||
|---|---|---|---|---|
| Sediment | Interstitial Water | Sediment | Interstitial Water | |
| Samples | STI | % Bioluminescence Inhibition | STI | % Bioluminescence Inhibition |
| A3 | 0.07 | Hormesis | 0.33 | Hormesis |
| A6 | 0.01 | Hormesis | 0.01 | Hormesis |
| B3 | 0.02 | Hormesis | 0.13 | Hormesis |
| B6 | 0.02 | Hormesis | 0.04 | Hormesis |
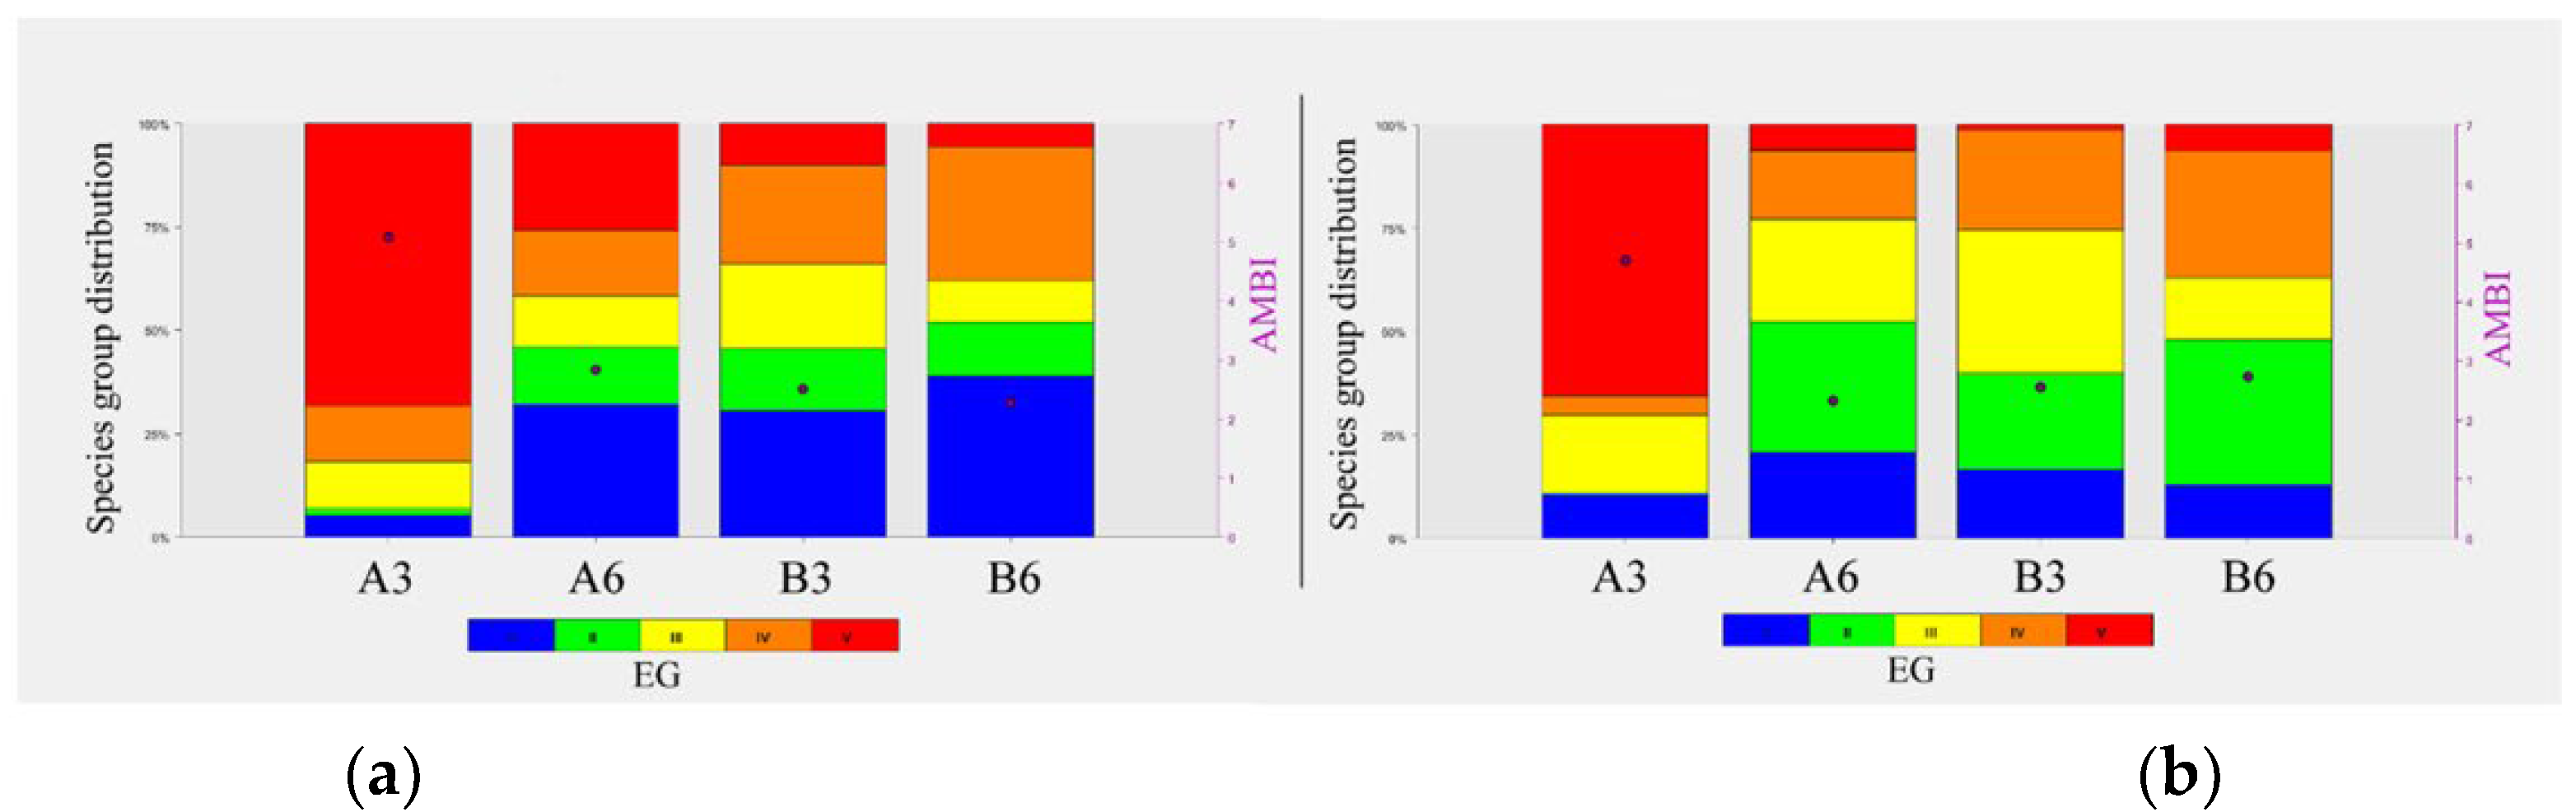
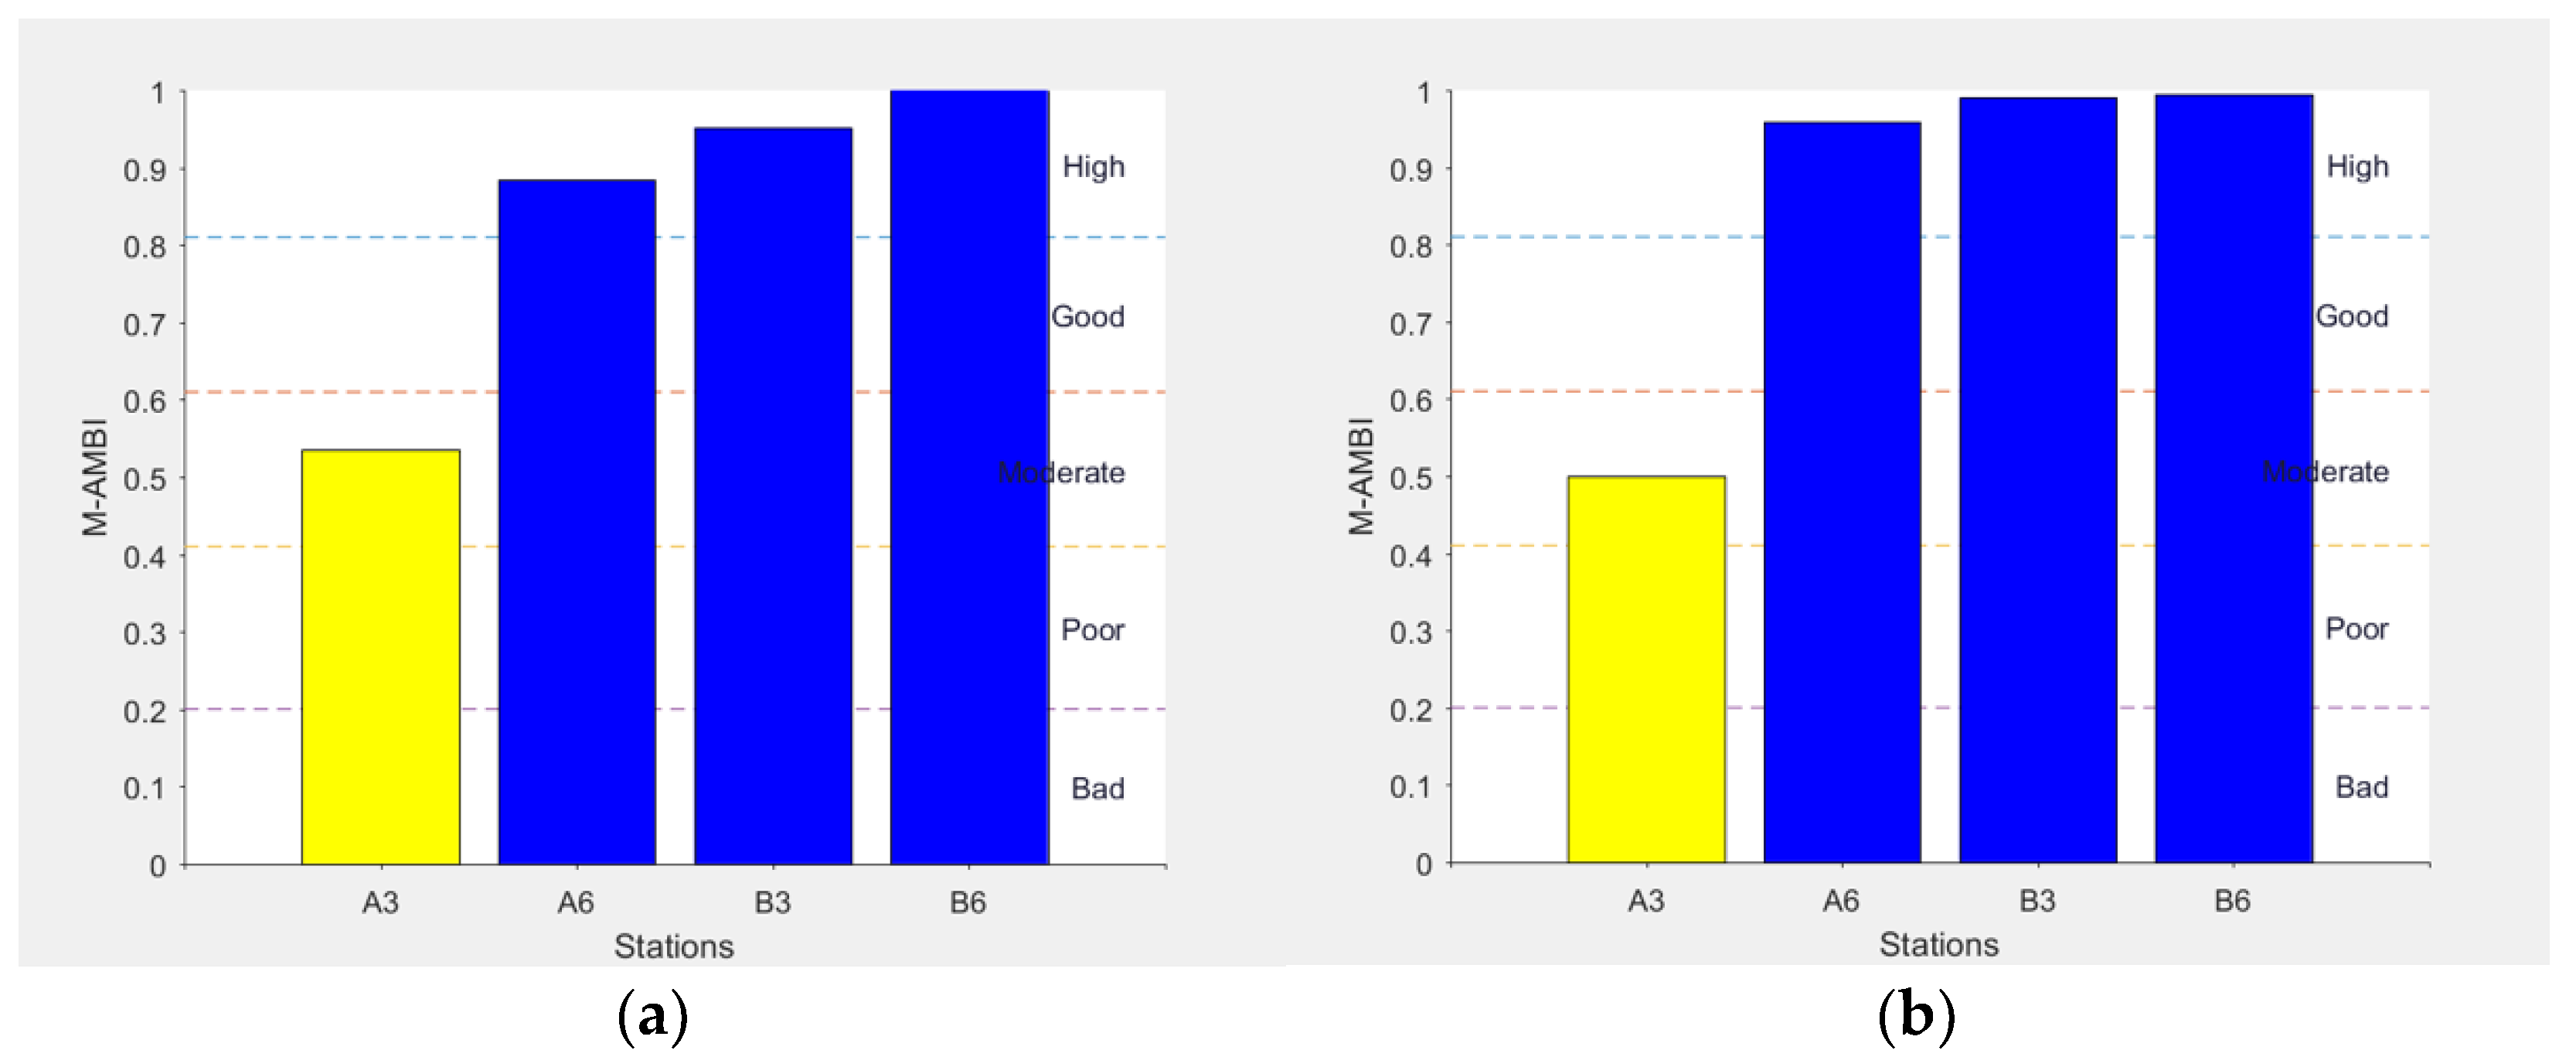
| FEBRUARY 2018 | |||||||||||
|---|---|---|---|---|---|---|---|---|---|---|---|
| St. | I(%) | II(%) | III(%) | IV(%) | V(%) | Richness | Diversity | Mean AMBI | Disturbance | M-AMBI | EQS |
| A3 | 5.2 | 1.7 | 11.3 | 13.5 | 68.2 | 43 | 2.44 | 5.06 | Heavily disturbed | 0.52 | Moderate |
| A6 | 32.1 | 13.9 | 12.3 | 15.7 | 26 | 57 | 4.28 | 2.84 | Slightly disturbed | 0.86 | High |
| B3 | 30.5 | 15.1 | 20.5 | 23.8 | 10.1 | 60 | 4.91 | 2.51 | Slightly disturbed | 0.94 | High |
| B6 | 39 | 13 | 10.1 | 32.5 | 5.5 | 67 | 4.89 | 2.28 | Slightly disturbed | 0.99 | High |
| JULY 2018 | |||||||||||
| St. | I(%) | II(%) | III(%) | IV(%) | V(%) | Richness | Diversity | Mean AMBI | Disturbance | M-AMBI | EQS |
| A3 | 8.3 | 1.7 | 19.2 | 4.2 | 66.7 | 30 | 2.31 | 4.78 | Moderately disturbed | 0.46 | Moderate |
| A6 | 20.5 | 28.3 | 25.4 | 19.7 | 6.1 | 53 | 5.09 | 2.44 | Slightly disturbed | 0.91 | High |
| B3 | 14.3 | 29.6 | 33 | 21.7 | 1.3 | 56 | 5.05 | 2.49 | Slightly disturbed | 0.93 | High |
| B6 | 12.9 | 38.7 | 14.9 | 27.2 | 6.3 | 66 | 5.17 | 2.63 | Slightly disturbed | 0.98 | High |
Publisher’s Note: MDPI stays neutral with regard to jurisdictional claims in published maps and institutional affiliations. |
© 2022 by the authors. Licensee MDPI, Basel, Switzerland. This article is an open access article distributed under the terms and conditions of the Creative Commons Attribution (CC BY) license (https://creativecommons.org/licenses/by/4.0/).
Share and Cite
Giangrande, A.; Licciano, M.; Arduini, D.; Borghese, J.; Pierri, C.; Trani, R.; Longo, C.; Petrocelli, A.; Ricci, P.; Alabiso, G.; et al. An Integrated Monitoring Approach to the Evaluation of the Environmental Impact of an Inshore Mariculture Plant (Mar Grande of Taranto, Ionian Sea). Biology 2022, 11, 617. https://doi.org/10.3390/biology11040617
Giangrande A, Licciano M, Arduini D, Borghese J, Pierri C, Trani R, Longo C, Petrocelli A, Ricci P, Alabiso G, et al. An Integrated Monitoring Approach to the Evaluation of the Environmental Impact of an Inshore Mariculture Plant (Mar Grande of Taranto, Ionian Sea). Biology. 2022; 11(4):617. https://doi.org/10.3390/biology11040617
Chicago/Turabian StyleGiangrande, Adriana, Margherita Licciano, Daniele Arduini, Jacopo Borghese, Cataldo Pierri, Roberta Trani, Caterina Longo, Antonella Petrocelli, Patrizia Ricci, Giorgio Alabiso, and et al. 2022. "An Integrated Monitoring Approach to the Evaluation of the Environmental Impact of an Inshore Mariculture Plant (Mar Grande of Taranto, Ionian Sea)" Biology 11, no. 4: 617. https://doi.org/10.3390/biology11040617
APA StyleGiangrande, A., Licciano, M., Arduini, D., Borghese, J., Pierri, C., Trani, R., Longo, C., Petrocelli, A., Ricci, P., Alabiso, G., Cavallo, R. A., Acquaviva, M. I., Narracci, M., & Stabili, L. (2022). An Integrated Monitoring Approach to the Evaluation of the Environmental Impact of an Inshore Mariculture Plant (Mar Grande of Taranto, Ionian Sea). Biology, 11(4), 617. https://doi.org/10.3390/biology11040617