Article

Deep-Dwelling Populations of Mediterranean Corallium rubrum and Eunicella cavolini: Distribution, Demography, and Co-Occurrence

1
Department of Life and Environmental Sciences, University of Cagliari, Via T. Fiorelli 1, 09126 Cagliari, Italy
2
Laboratoire d’Ecogeochimie des Environnements Benthiques (LECOB), Sorbonne Universites, Université Pierre-et-Marie-Curie, Centre National de la Recherche Scientifique (CNRS), Observatoire Oceanologique, F-66650 Banyuls sur Mer, France
*
Author to whom correspondence should be addressed.
Biology 2022, 11(2), 333; https://doi.org/10.3390/biology11020333
Submission received: 4 January 2022 / Revised: 8 February 2022 / Accepted: 15 February 2022 / Published: 20 February 2022
(This article belongs to the Special Issue Conservation of Marine Ecosystems: Selected Papers from MetroSea 2021)

Abstract

:

Simple Summary

Octocorals are marine ecosystem engineers that can form dense patches on rocky substrates. These organisms enhance the three-dimensional complexity of the habitat and provide several ecological services within and around their canopy. Mapping their distribution and understanding the intra- and inter-specific processes that drive population dynamics is of crucial importance. In this study, we investigated via Remotely Operated Vehicle the distribution and demography of two hard-bottom octocorals that share similar habitat preferences within the Western Mediterranean: the yellow gorgonian Eunicella cavolini and the precious red coral Corallium rubrum. We tested for possible mutual influences of the two species when co-occurring. Here, we show that for both species, populations dwelling in deeper habitats show demographic features of immature or disturbed populations, possibly due to environmental and/or anthropogenic disturbances that occur locally. Moreover, the density of one species is significantly positively correlated to that of the other, but not influenced by the colony morphology (e.g., height) of the other species. We encourage further studies that might contribute to shedding light on inter-specific relations occurring in these vulnerable ecosystems.

Abstract

Corallium rubrum and Eunicella cavolini are two octocorals, reported as co-occurring species in the deep rocky habitats of the Mediterranean Sea with a high hydrodynamic and moderate eutrophication. Their spatial distribution and demography in the deep sea are mainly affected by temperature and direct and indirect anthropogenic activities; however, knowledge of the factors that potentially influence their co-existence is scarce. This paper provides novel data on the distribution and demography of these two species, at depths between 50 and 290 m in the Western Mediterranean Sea, providing insights on their co-occurrence. Both species exhibited the highest population density at deeper sites (>150 m), showing an inverse size–density relation. Density values ranged from 0.03 colonies m−2 to 32 and 80 col. m−2 for yellow gorgonian and red coral, respectively. The two species co-occurred in 13% of the total frames examined, mostly dwelling between 120 and 160 m depth. Distance-based linear modeling (DistLM) emphasized that when co-occurring the variability of the two species’ densities were significantly driven by the density—rather than the morphology (i.e., height)—of the other species. We stress the need for further studies to elucidate the possible mutual effects of suspension feeders and to test the role of different environmental factors potentially influencing inter-specific relationships.

1. Introduction

Deep-dwelling octocorals often dominate hard-bottom benthic ecosystems, where they act as ecosystem engineers and foundation species, providing three-dimensional habitats for fish and invertebrates, and also contributing to the maintenance of ecosystem functioning [1,2]. They facilitate the presence of associated fauna [3] by being a suitable habitat and refuge for numerous species [4], thus increasing biodiversity. They also enhance the pelagic–benthic transfer of matter and energy by capturing suspended particulate organic matter and plankton [5,6].
The spatial distribution of benthic suspension feeders depends on settlement processes, which can influence feeding success and thus the competition with other corals dwelling within the same community [7]. In general, the over-specialization of food sources at small spatial scale, especially in highly selective environments, could increase the risk of a species being replaced by a more efficient one that targets the same resource, and could also favor the formation of monospecific patches, as in the case of red coral [8].
The highly valuable red coral Corallium rubrum (Linnaeus, 1758) is endemic to the Mediterranean Sea and the adjacent Eastern Atlantic Ocean [9], dwelling from 10 to 1000 m depth [10]. Red coral forms arborescent colonies with a lifespan that can exceed 100 years and can reach more than 50 cm in height [11,12]. This species is one of the most precious marine resources and its harvesting dates back to ancient Roman times; indeed, its red calcium carbonate skeleton can be used to produce jewelry and artistic objects. From a management perspective, red coral populations can be distinguished based on their demography and distributions along the bathymetric gradient: (i) shallow-water populations dwelling above 50 m depth, characterized by small-sized and highly dense colonies [13] due to intense harvesting in the last few decades; (ii) deep populations, dwelling between 50 and 130 m depth, composed of large and sparse colonies that are currently the main target of professional harvesting [14,15,16,17]; and (iii) the deepest populations (up to 1000 m), represented by relatively small and sparse colonies [10,18].
Intensive harvesting, along with red coral’s slow growth rate (0.26 mm yr−1 for deep-dwelling populations) [19] and sensitivity to environmental stressors, such as positive thermal anomalies [20,21], has increased concerns regarding its fate. Due to commercial and ecological relevance of this species, knowledge on its biological, demographic, and genetic aspects has consistently increased during the last two decades, especially for shallow-water populations [13,16,20,22]. Professional red coral harvesting is performed by scuba divers, who selectively harvest colonies with a basal diameter larger than 7 mm, according to regulations in force in the GFCM competence area. Recent studies have documented how fishing efforts currently reach depths >100 m and shift towards deep-sea populations, which are the least known ones [23]. Thus, there is an urgent need to improve our knowledge on deep-dwelling red coral populations, which differ in terms of density, morphology, reproductive patterns, and genetic structure from their shallower counterparts [14,16,24,25,26].
Despite the frequent reports of monospecific patches of red coral in shallow-water ecosystems, recent studies reported its consistent co-occurrence with the yellow gorgonian Eunicella cavolini (Koch, 1887), highlighting a partially overlapping habitat [17,27]. Indeed, both species show an extensive geographic distribution within the Mediterranean basin, a wide bathymetric range, and a preference for rocky bottoms with high hydrodynamic and moderate eutrophication levels [28,29,30]. These features render E. cavolini a potential red coral competitor for space and resources [31]. However, to date, no study has provided information on the effects of this potential competition on the distribution and population structures of both species.
E. cavolini is a common gorgonian in the Mediterranean Sea, forming distinct facies within coralligenous assemblages [28]. Its distribution area spans from the Western Mediterranean to the Aegean Sea and the Sea of Marmara [28,32], over a wide bathymetric range [28,29]; however, our knowledge regarding its demography is mainly restricted to depths above 50 m [28].
The lack of studies on deeper red coral and yellow gorgonian populations limits our understanding of their ecology and the possibility of developing an effective management plan for their conservation. These species are sensitive to environmental changes [21], and also to the impact of direct (i.e., fishing, contamination) and indirect anthropogenic disturbances (e.g., ocean acidification), which may provoke population fragmentation [17,28,33]. Considering also the genetic separation of deep-dwelling populations from the shallow-water ones, specific measures are urgently needed to guarantee their protection [11]. Effective management actions such as the inclusion of deep-sea banks in marine protected areas (MPAs) may enhance the conservation and recovery of these species, which are crucially important for deep-sea benthic ecosystem functioning.
Remotely Operated Vehicles (ROVs) represent an effective and non-invasive tool, typically used to evaluate the state of the conservation of coral populations dwelling in the bathymetric range of SCUBA-diving operative limits and beyond [17,34].
In this study, we carried out ROV surveys from the northeastern to the southwestern coast of Sardinia (Western Mediterranean Sea) between 50 and 290 m depth in order to: (i) provide additional data on the distribution and population structures of the deep-dwelling populations of C. rubrum; (ii) describe the population structures of E. cavolini below 50 m depth; and (iii) investigate the patterns of co-occurrence between the two species. All the collected data also constitute a baseline to evaluate the potential impacts of fishing activities and eventual populations recovery.

2. Materials and Methods
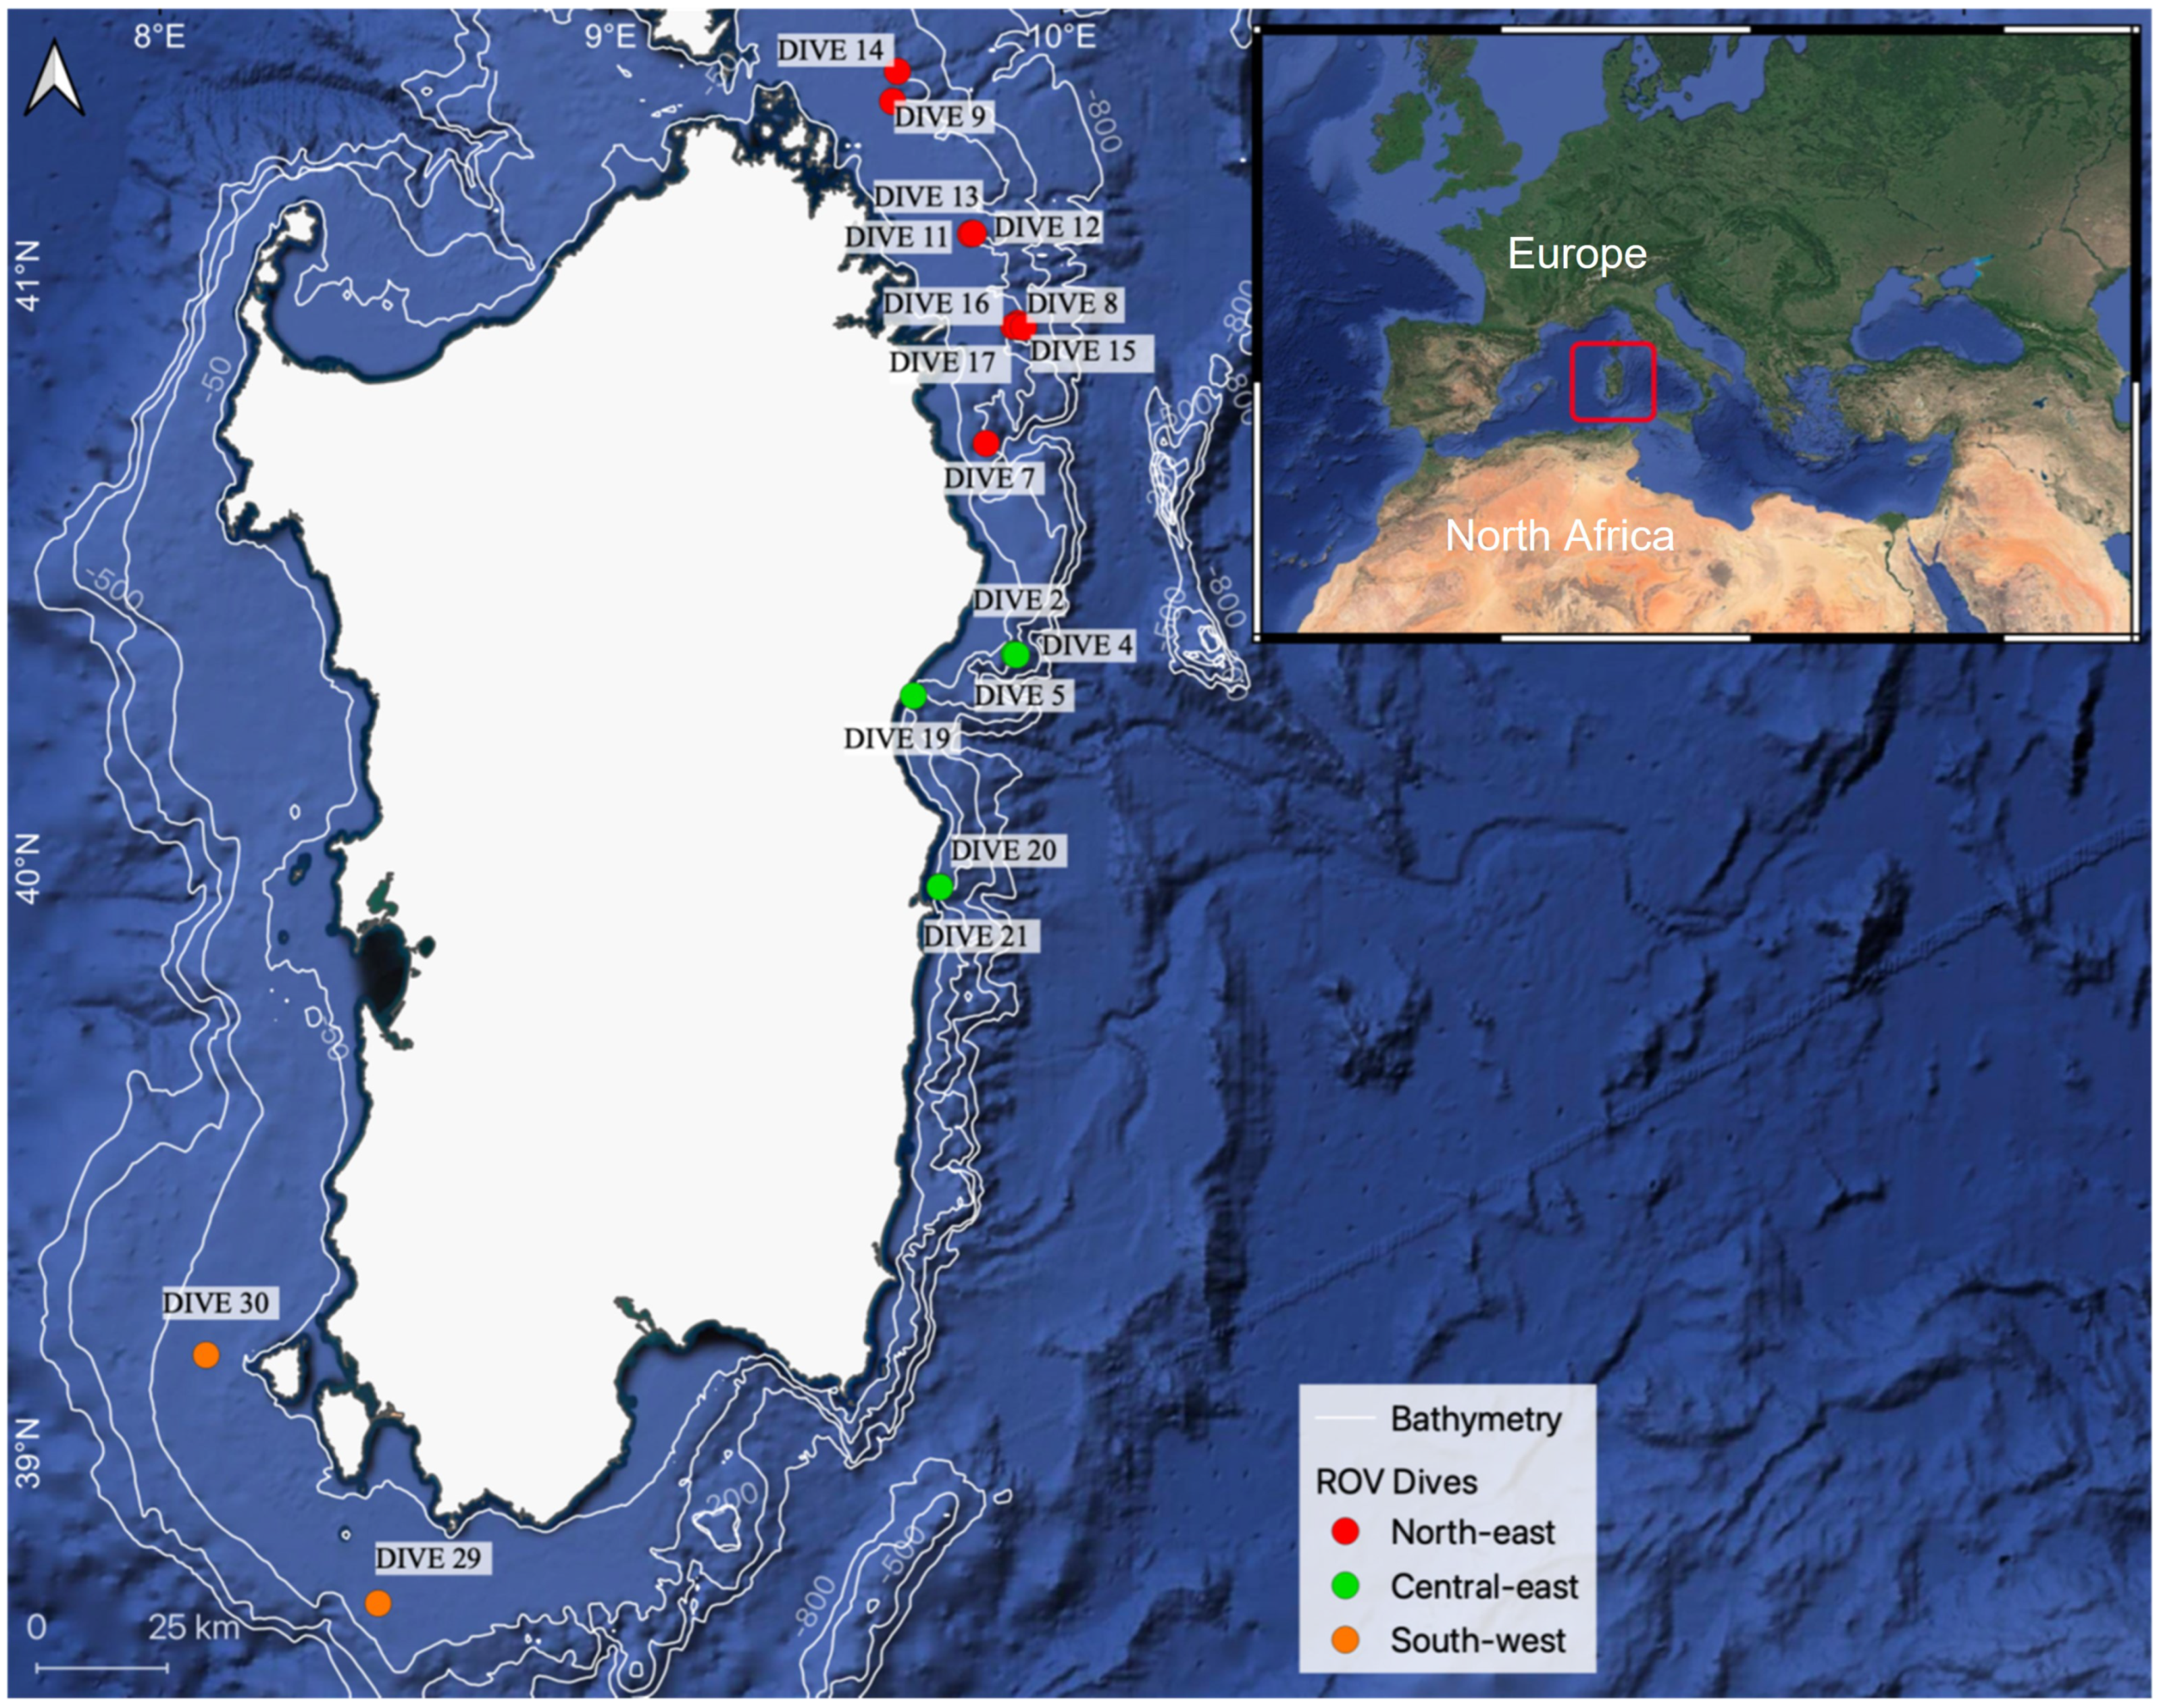
2.1. Study Area

The study area is located around the island of Sardinia (Italy), which is in the central-western region of the Mediterranean Sea. The survey was conducted mostly over the shelf break of the eastern Sardinian continental margin, a passive margin of the Tyrrhenian Basin that is delimited to the north by the “Etruschi” seamount and to the south by the “Ichnusa” seamount. The narrow continental shelf that characterizes the eastern area of the island terminates at about 60–100 m depth in the southern and central areas and at around 200 m depth in the northern area. Along the entire eastern side of the island, the continental shelf and slope are both incised by profound submarine canyons and connected to inland orographic structures and river basins [35,36,37]. Contrarily, western Sardinia is characterized by a wide continental shelf that can extend up to hundreds of kilometers, particularly in the southwestern part of the island. Hydrologically, the whole eastern coast of Sardinia is characterized by the flow of the Levantine Intermediate Water (LIW) throughout its whole extension [38], with a part of the LIW circulating cyclonically in the southern part of the Tyrrhenian Basin and flowing along the northern slope of the Sardinia Channel (SC). The SC is considered one of the crucial areas in the Mediterranean Sea, controlling the exchange of water mass between the eastern and the western basins of the Mediterranean [39].
Overall, nine sites were investigated, which were a priori allocated to three geographical areas, namely: (i) North-east (NE), including Pietrame and the Canyons of Caprera, Mortorio, and Tavolara, with sites located at a greater distance from the nearest coastline (up to 12 Nm from the coast) compared to sites located along the Central-east and South-west coasts (up to 6 and 9 Nm from the coast, respectively); (ii) Central-east (CE), including the Cala Gonone Shoal and the Canyons of Orosei and Arbatax; and (iii) the South-West (SW) area, including Bancotto and Secchitella, which are located over rocky outcrops rising from the wide continental shelf that characterizes the western coast of Sardinia (Figure 1; Table 1).

2.2. ROV Surveys—Data Acquisition

ROV surveys were conducted over a depth range between 50 and 290 m depth (Figure 1; Table 1). This study did not involve the sampling or damage of any endangered or protected species and is based on direct observations with ROV footage and image analysis, a non-invasive tool that is particularly suited for high-conservation-interest habitats, such as those under investigation.
The dataset used in this study includes video and photographs collected during a ROV survey carried out in August 2013 onboard the r/v “Astrea”. Each site was explored through a variable number of ROV dives (from a min. of one up to four), to collect video material suitable to perform image analysis.
The ROV “Pollux III” was equipped with a digital camera (Nikon D80, 10 megapixels), a strobe (Nikon SB 400), a high-definition video camera (Sony HDR-HC7), track-link system, depth sensor, compass, and two parallel laser beams providing a constant 10 cm reference scale.
More than 70 h of ROV footage was obtained through 19 dives; footage was recorded moving the ROV at an average speed of ~0.35 knots at ~0.5 meters from the seabed, covering a total investigated surface of more than >4000 m2 (Table 1). Transects could not be linear since the survey focused on the target species C. rubrum, which shows a patchy distribution over several typologies of hard bottoms, including steep walls, caves, and boulders.

2.3. Image Analysis

Frames were randomly extracted from the high-resolution ROV footage using the software “DVDVideosSoft” (www.DVDVideoSoft.com; accessed on 1 December 2021). Overlaying, low-visible, poor-focus, and unsuitable frames (i.e., frames with 100% soft bottom were excluded) were discarded, while keeping only the usable ones for the analysis (see Figure S1 as an example). The analysis of colony density and morphology was performed with CPCe software (Coral Point Count with Excel extensions) [40], using a randomly positioned square of 0.25 m2 (i.e., 0.5 × 0.5 m) as a sampling unit in each frame, hereafter referred to as frame [17]. Different patches in the investigated sites were identified. A patch is defined as a group of more than two colonies [41], and a minimum of 10 m in distance was used as a reference to define two distinct patches, with no isolated colonies in between [14].
The substrate composition was estimated using suitable frames and was expressed as the proportion of “hard” (i.e., 100% rocky substrate) and “mixed” bottoms (i.e., hard bottoms with the presence of deposited sand or silt, in variable percentages). We also evaluated the local slope of the substrate (expressed as vertical or horizontal wall) and the presence or absence of deposited sand or silt. Then, we calculated red coral occupancy as the percentage of frames in which red coral was present over the total number of suitable frames in each site. Moreover, the following parameters for C. rubrum were retrieved per each frame: (1) density, based on the number of colonies within each frame and expressed as number of colonies m−2 [17]; (2) morphological parameters of colonies, such as basal diameter (measured in mm at the inflection point) [19], colony height (measured in cm from the basis to the farthest tips) [42], and the proportion of colonies with a basal diameter larger than 10 mm (Sardinian legal harvesting limit size), and taller than 10 cm [17]; (3) population structure through the analyses of the size-frequency distributions of height and basal diameter, grouping colonies in classes of 2 cm and 2 mm, respectively; (4) orientation of colonies with respect to the substrate, starting from 0° (vertically oriented colonies), 45°, 90°, 135°, up to 180° (colonies in overhanging position) [14]; (5) branching pattern [43], which is a useful ecophenotypic factor and also represents a proxy of the age [44]; and (6) percentage of dead and alive colonies. Similarly, we reported density, colony height, orientation, and the height-frequency distribution for E. cavolini (grouping colonies into five classes: 1–10, 11–20, 21–30, 31–40, and >41 cm). In addition, the co-occurrence of red coral colonies with E. cavolini in the same frame was also recorded. In particular, we calculated: (i) the proportion of the two species when co-occurring; (ii) demographic (i.e., colony density) and morphological features (i.e., height for both species and diameter only for red coral) when co-occurring and not. Fishing impact was evaluated as the percentage of frames showing the presence of derelict fishing gears, which are fishing devices that are known to cause severe accidental damage to arborescent benthic fauna, such as the species under scrutiny in the present study [45,46]. This indicator was used as a proxy to infer about general fishing activities conducted in the survey area.

2.4. Data Analysis

The descriptive distribution parameters of skewness (g1) and kurtosis (g2) were estimated for the size-frequency distribution per each investigated site. Coefficients of g1 and g2 were considered significant if the ratio to their standard error was >2 [47]. To assess the differences in red coral density, colony height, diameter, maximum order of branches and orientation among areas, between sites within each area, and between colonies co-occurring or not with E. cavolini, we used the Permutational Analysis of Variance (PERMANOVA) [48]. The sampling design included three factors as main sources of variance: “area” (fixed; 3 levels), “site” (random, nested in area; 4, 3, and 2 levels for NE, CE, and SW areas, respectively), “co-occurrence” (random, nested in site; 2 levels expressed as presence/absence), using red coral density, colony height, diameter, maximum branching level and orientation separately as response variables. As replicates for the statical analyses, we used density values calculated for each “frame” and each measured value of colony height, basal diameter, maximum branching level, and orientation. The analyses were based on Euclidean distances matrix of no previously transformed data, using 999 permutations of the residuals under a reduced model [49]. For all the analyses, when significant effects of the considered factors were observed, pairwise tests were also carried out. Because of the restricted number of unique permutations, p values in the PERMANOVA and pairwise tests were obtained from Monte Carlo samplings [50]. The PERMANOVA analyses were performed using the software PRIMER 7+ [51].
We also aimed to test differences in red coral variables according to water depth, which was pooled in 4 depth categories: 90–110 m, 111–130 m, 131–150 m, and >150 m. Differences in red coral density, height, basal diameter, maximum branching level, and colonies orientation were tested through a Kruskal–Wallis routine, coupled with Mann–Whitney pairwise comparison, using the abovementioned depth categories. The same approach described above was carried out also for E. cavolini density, height, and colony orientation.
To identify the potential drivers of the variability of E. cavolini and C. rubrum density when co-occurred, non-parametric multivariate multiple regression analyses based on Euclidean distances were carried out using the routine DistLM, the forward selection procedure, and adjusted R2 and AIC as selection criteria [52]. The forward selection of the predictor variables was carried out with tests by permutation. p values were obtained using 999 permutations of the raw data for the marginal tests (test of individual variables), whereas, for all sequential tests, the routine used 999 permutations of residuals. The test was performed on the subset of frames where both species were present (i.e., n = 105; 13% of the analyzed frames). In detail, fourth-root-transformed density values of both E. cavolini and C. rubrum were used, separately, as response variables. For each of the two response variables, the other species’ density, colony height, and depth were used as potential explanatory covariates.

3. Results

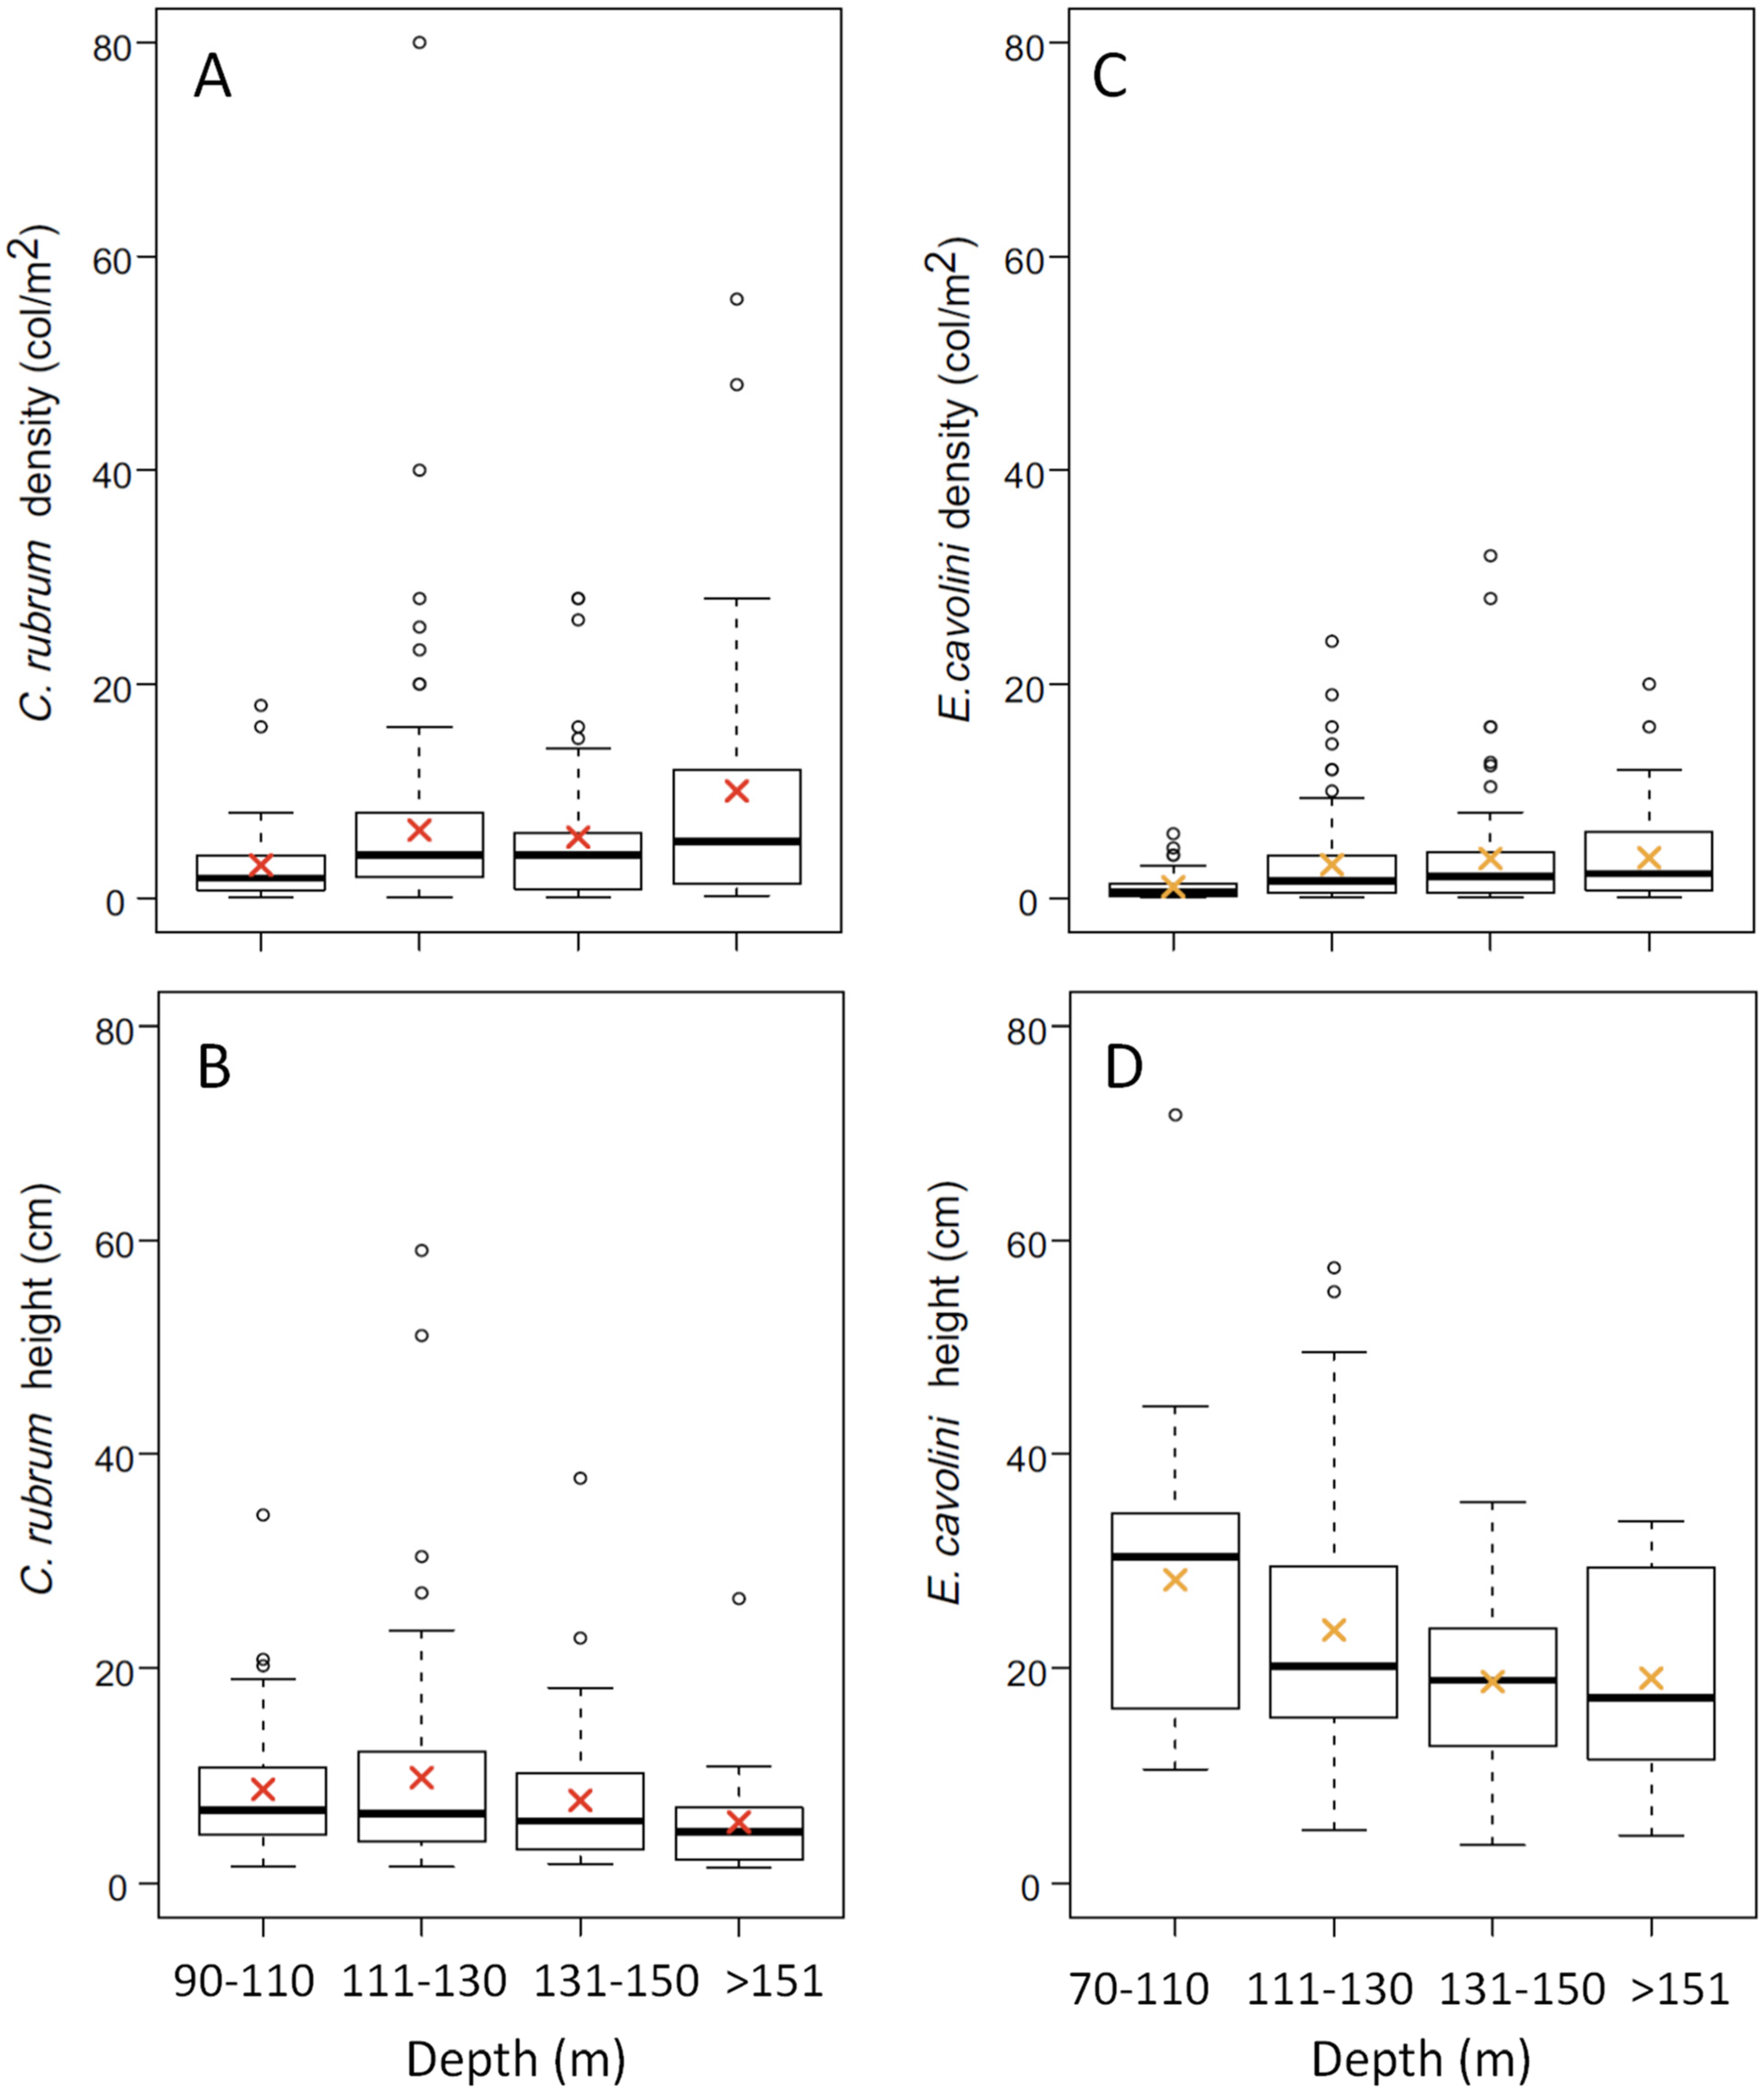
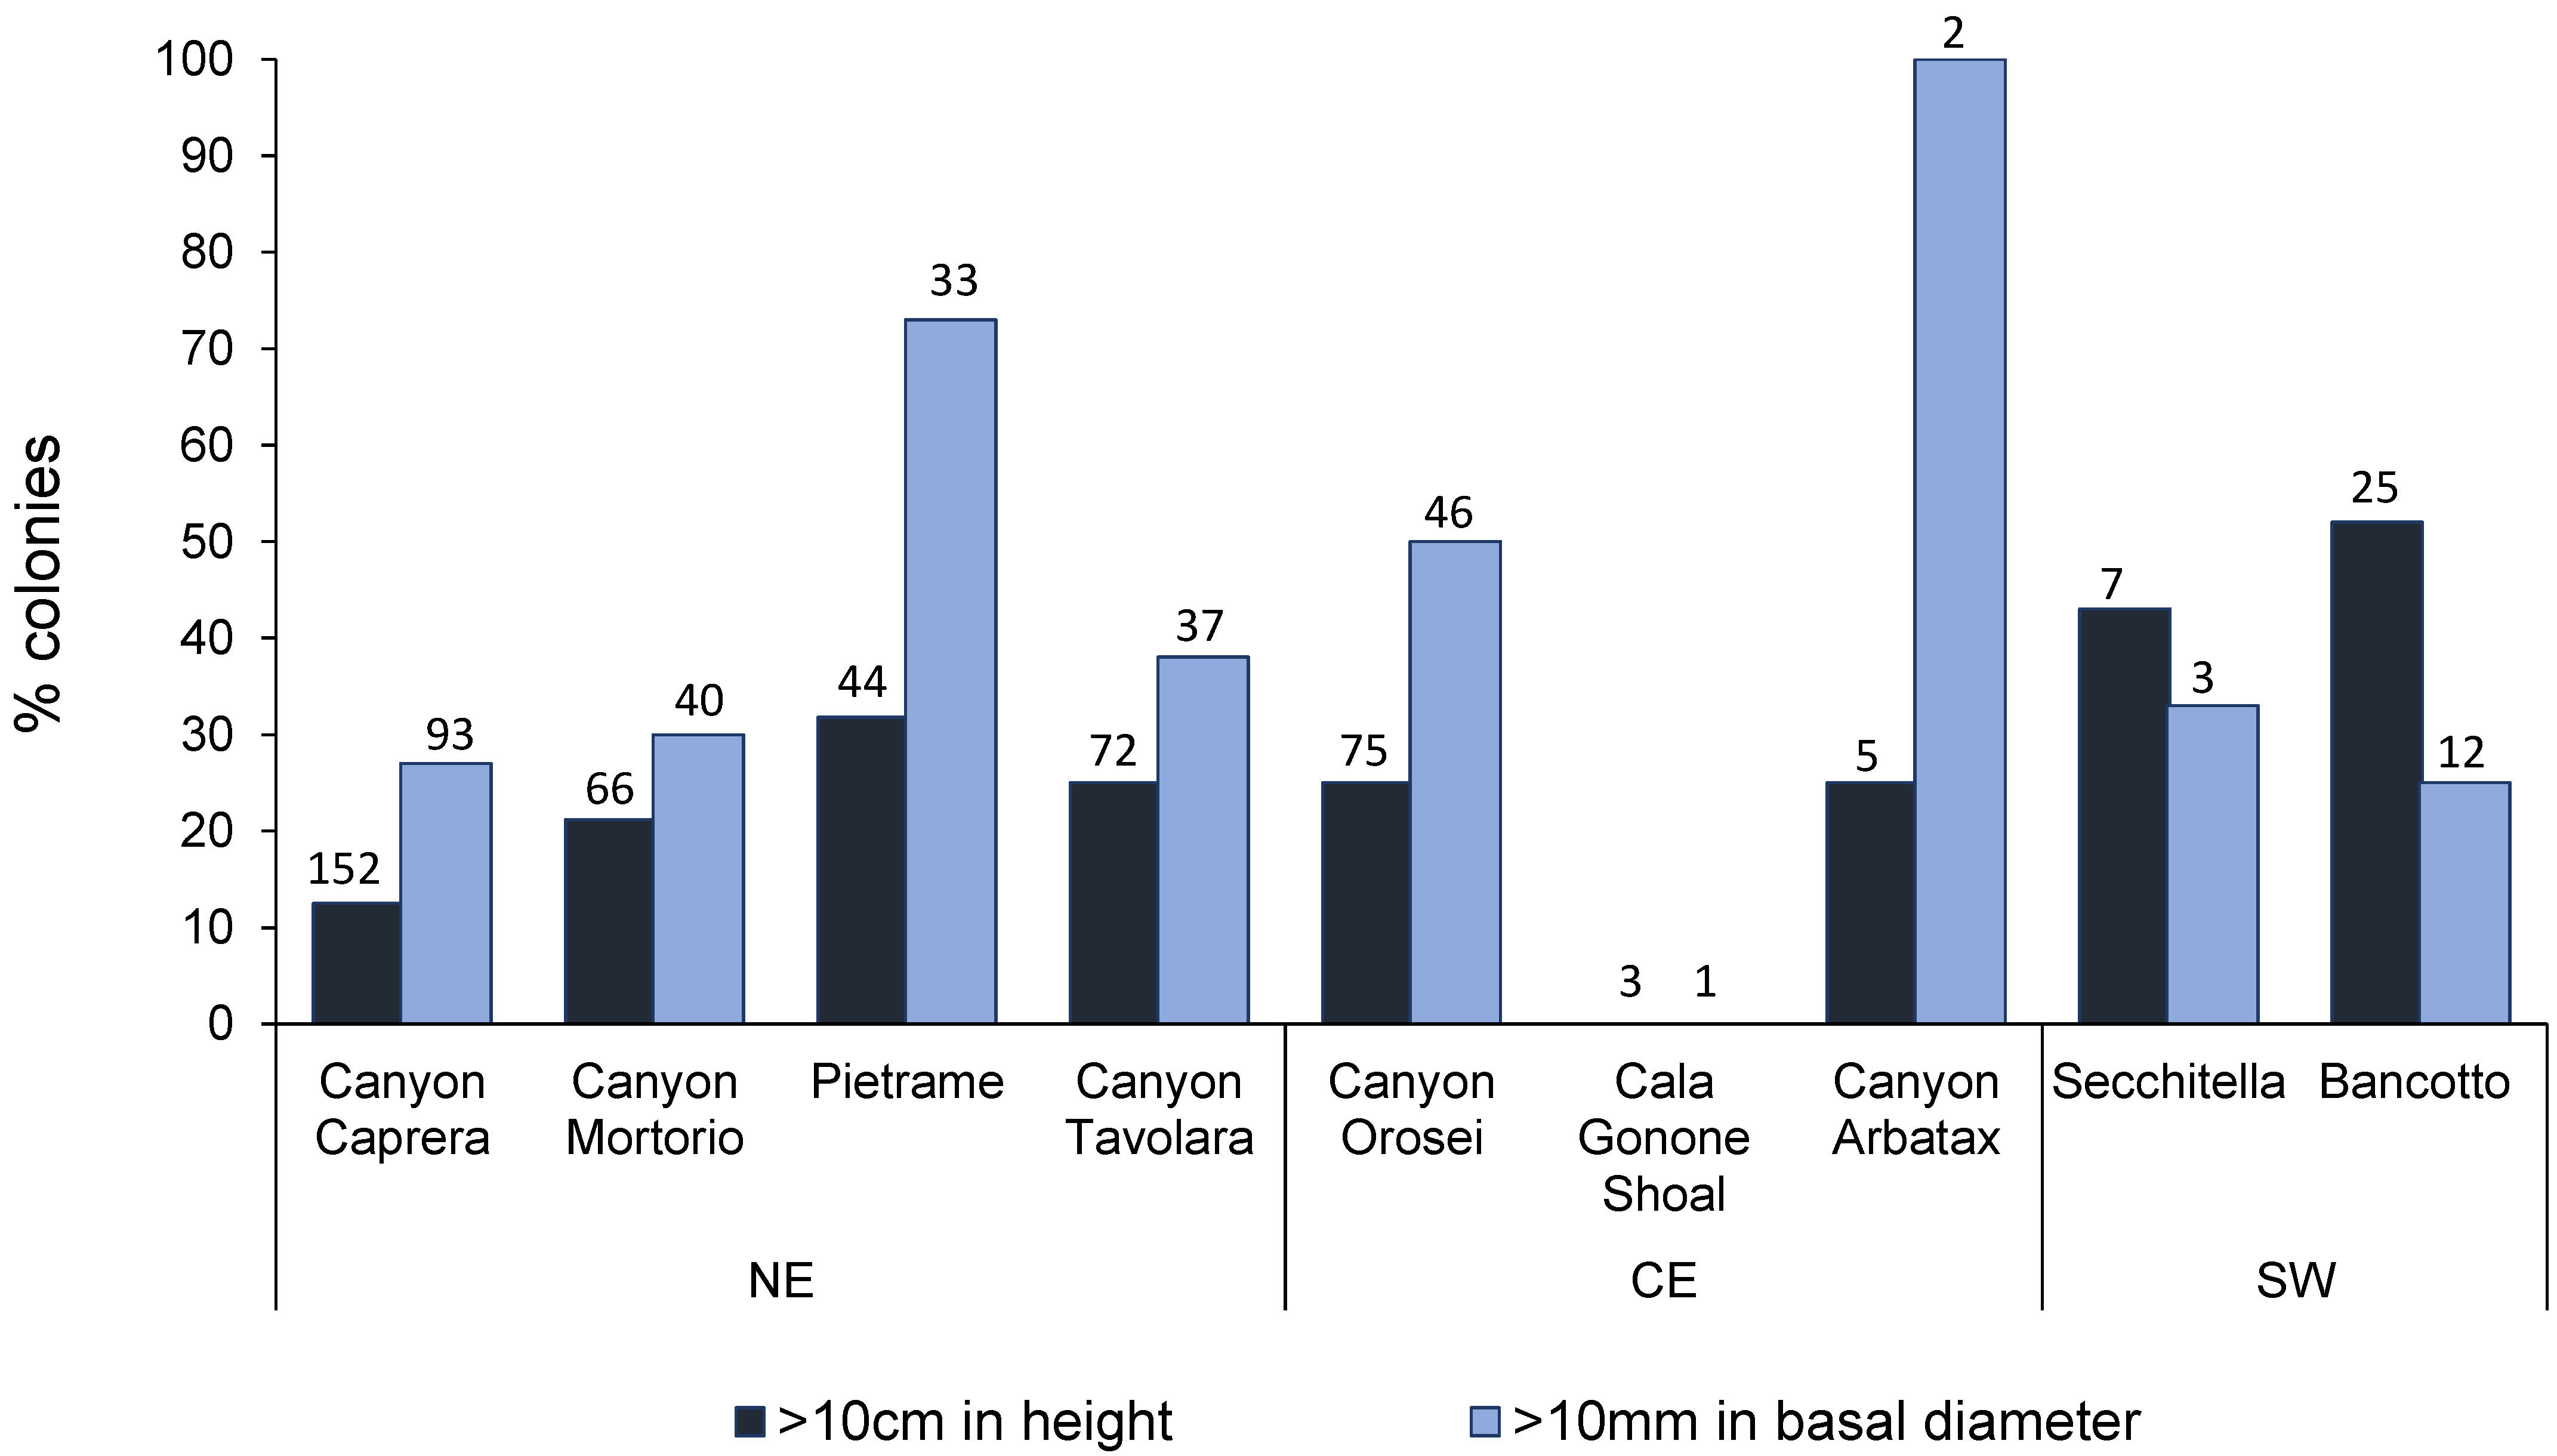
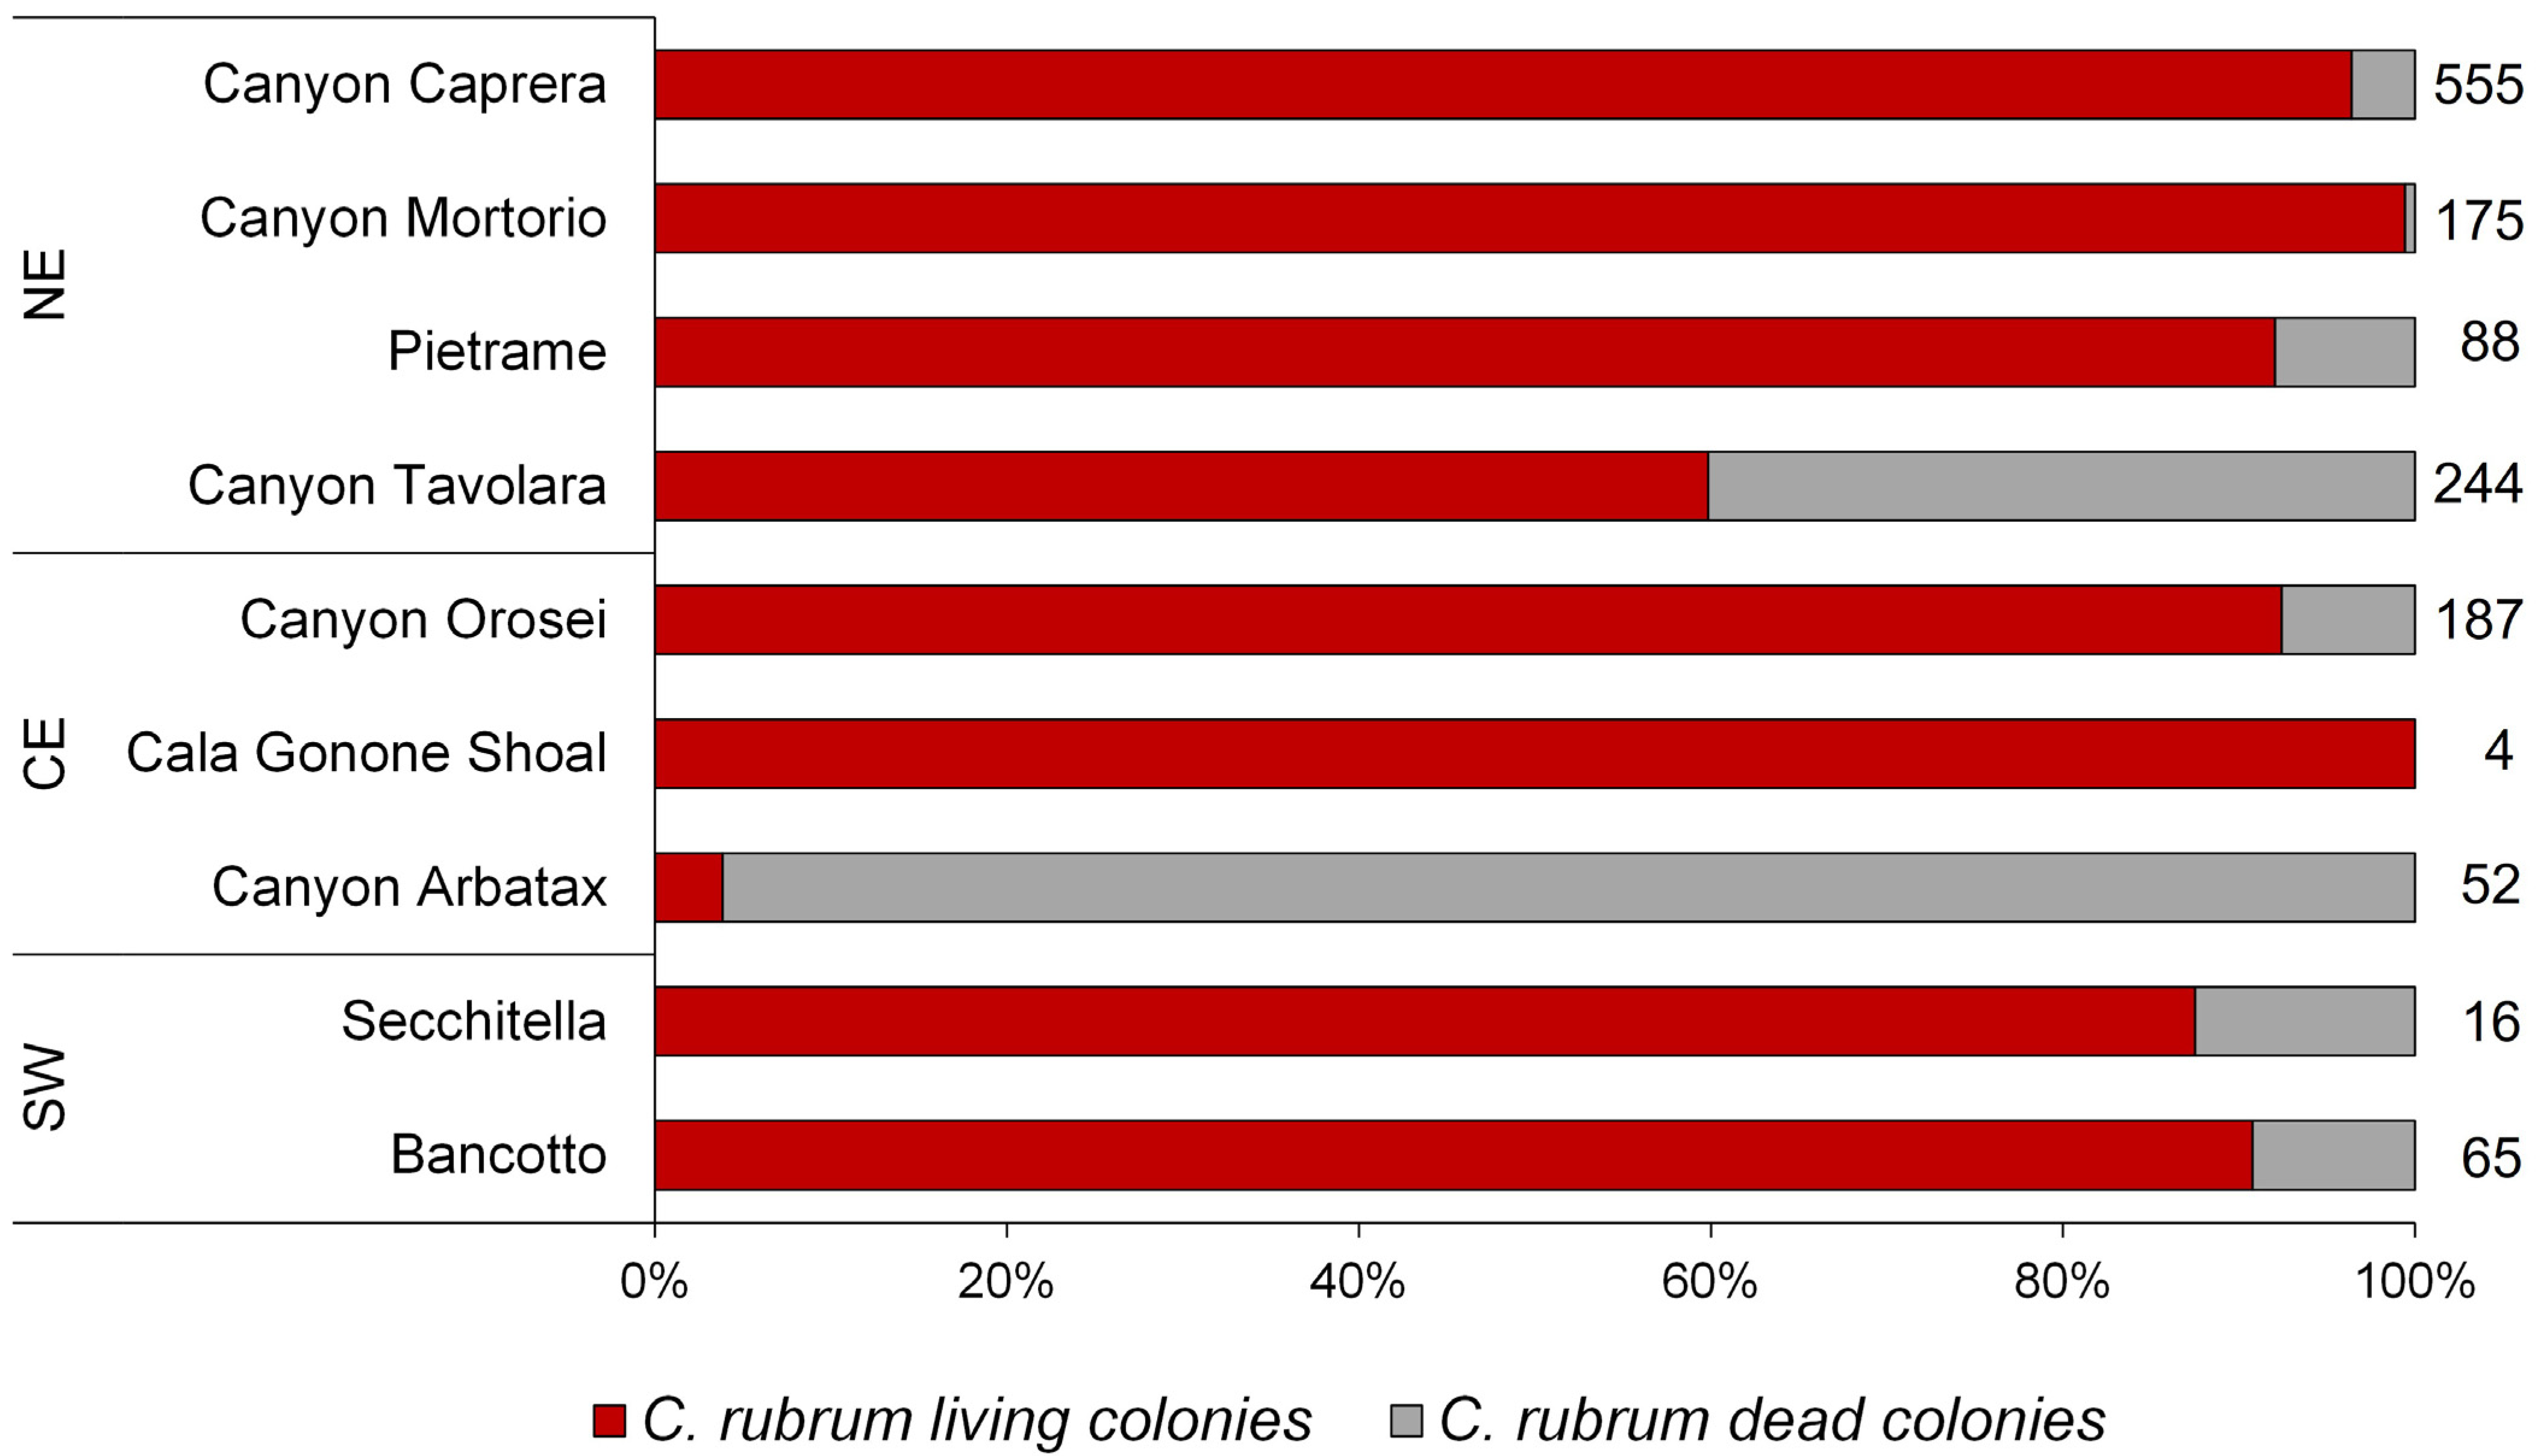
3.1. Corallium Rubrum: Occupancy, Density, and Population Size Structure

Over a total of 937 frames, 835 were used for the image analysis. Most of the substrate in the total surveyed area (more than 4000 m2) consisted of hard bottoms, except for the “Secchitella” site where the substrate was mostly (72%) formed by mixed bottom (hard bottom + sand or mud). In all investigated areas, all patches were settled on vertical and partially silted substrates, with the only exception of six and twelve colonies settled on horizontal substrates in the Mortorio Canyon and Bancotto, respectively. Red coral was found in 249 out of the 835 analyzed frames (30%). A total of 1384 colonies of C. rubrum forming 53 red coral patches were counted. Along the NE coast (n = 534 frames), red coral was recorded from a minimum of 22% to a maximum of 44% of frames, with a mean density within patches of 4.5 ± 2.4 colonies m−2. In the CE areas (n = 228), the presence of red coral dropped down to 3–33% of frames, with a mean density of 6.3 ± 3.1 colonies m−2. Finally, along the SW coast of the island (n = 73), red coral was recorded in 25–37% of the analyzed frames, with the lowest mean density recorded of 2.8 ± 1.4 colonies m−2 (Table 2). Red coral density did not significantly change among areas nor among sites within the same area (Table 3). However, it changed significantly along the bathymetric range considered, with higher values of density registered below 110 m depth (Figure 2A; K-W, p < 0.01; Supplementary Table S1).
Overall, 449 and 267 colonies in the three studied areas were suitable to be measured for height (NE, n = 334; CE, n = 83; SW, n = 32) and diameter (NE, n = 203; CE, n = 49; SW, n = 15), respectively.
Colony height was significantly higher in the SW area (12.6 ± 3.4 cm) than in the CE (7.8 ± 2.5 cm) and NE (6.3 ± 2.3 cm) areas (Table 3; PERMANOVA, p < 0.05). The maximum colony height (59 cm) was recorded in the SW area (Bancotto), while the minimum (0.8 cm) was recorded in the NE area (Tavolara Canyon). Overall, colony height did not show significant differences across the bathymetric range investigated (Figure 2B; K-W; p = ns); however, the Mann–Whitney pairwise comparison emphasized significant differences between the shallower colonies and the deepest ones (Supplementary Table S2). In addition, in the SW and CE areas, 50% and 27% of the colonies, respectively, were taller than 10 cm in height, whereas, at NE, only 20% of the population exceeded this size (Figure 3).
The average basal diameter ranged from 8.4 ± 0.3 mm in the SW area to 13.5 ± 8.8 in the CE area (Table 2). The maximum basal diameter (39.7 mm) was found in the CE area (Orosei Canyon), whereas the lowest one (2.1 mm) was found in the NE area (Caprera Canyon). The colony diameter did not change significantly with water depth (K-W; p = ns; Supplementary Table S3). The percentage of colonies with diameters larger than 10 mm, which is the minimum legal harvestable size in Sardinia (General Fisheries Commission for the Mediterranean, GFCM, 2011) was 51% in the CE area, 37% in the NE area, and 27% in the SW area (Figure 3).
In all the investigated areas, both height and basal diameter showed asymmetrical, non-normal distributions, with a higher percentage of colonies in the smaller-size classes (<4 cm and <8 mm for height and basal diameter, respectively; Figure 4). For both height and basal diameter, the frequency distributions appeared scattered, with some missing size classes. In all the areas, the size-frequency distribution of the height was unimodal, with the mode in the size class of 4 cm. The NE area displayed significant positive kurtosis (leptokurtic), indicating that distribution was slightly more peaked or overcentralized than the normal distribution. For the basal diameter, in the NE and CE areas, the distribution was unimodal, with a modal class of 8 and 10 mm, respectively, whereas in the SW zone, the distribution was polymodal (6 and 10 mm). In the NE area, the diameter distribution showed significant positive kurtosis and skewness, emphasizing a higher frequency of smaller-sized colonies.
In all the investigated areas, most of the colonies showed a simple branching pattern: in the NE and SW areas, 51% and 43% of the colonies, respectively, had first-order branches, whereas, in the CE area, 56% had second-order branches. Overall, the fifth-order branches were reached by only 2% of the colonies, with the highest percentage observed in the SW area (6%), and only when co-occurring with E. cavolini. There was a significant difference in the maximum level of branching among colonies dwelling in different depth categories (K-W; p = <0.001; ; Supplementary Table S4; Figure S2), with a higher proportion of colonies reaching the third-, fourth-, and fifth-order branches above 130 m depth rather than below.
Colony orientation did not significantly change between the sampling areas: ~50% of the colonies were oriented at 135° with respect to the hard bottom surface, while only 30% were perpendicular to the walls (oriented 0°; Table 2). The orientation of colonies (Figure S3) did significantly differ among the depth categories considered (K-W; p = <0.001; Supplementary Table S5).
Overall, an average of 80% of red coral colonies were alive at the moment of footage acquisition, with the highest percentage of living colonies (99%) observed in the site Pietrame and the lowest (4%) in the Arbatax Canyon, where, consequently, the highest percentage of dead colonies was registered (96%; Figure 5).
The frequency of frames in which fishing gears and/or nets were present was 1.3% in the NE area, 12.5% in the CE area, and 1% in the SW area. The highest fishing impact was recorded in the Cala Gonone Shoal and Arbatax Canyon, where lost fishing gears or nets were present in 16% and 18% of the frames, respectively. Overall, a negative correlation between the presence of fishing gear and the presence of red coral was found (Figure S4).

3.2. Eunicella cavolini: Occupancy, Density, and Population Size Structure

Overall, a total of 1481 yellow gorgonian colonies were found in 292 frames out of the 835 analyzed (35%) between 76 and 199 m depth. The average density ranged from 2.6 ± 3.7 to 3.3 ± 4.9 colonies m−2 in the CE and NE areas, respectively (Table 4). The maximum colony density (32 colonies m−2) was recorded in the Tavolara Canyon at 143 m depth and the lowest one (0.03 colonies m−2) in the Orosei Canyon at 92 m depth. Colony density was significantly lower above 111 m depth than below (Figure 2C; K-W, p < 0.001; Supplementary Table S6).
Colony height was higher in the SW (25.9 ± 10.3 cm) and CE (24.8 ± 14.6 cm) areas and lower in the NE area (20.1 ± 9.4 cm; Table 4). The maximum (71 cm) and minimum (3.4 cm) colony heights were recorded in the Orosei Canyon at 107 and 173 m depth, respectively. Colony height did not significantly vary with depth (Figure 2D; K-W, p = ns) despite the significant differences found through the pairwise comparison between shallower colonies (90–110) and those dwelling at greater depths (Supplementary Table S7).
The height-frequency distribution of E. cavolini populations appeared to be positively skewed, indicating the prevalence of the smaller height classes in the populations of all sampling areas (Figure S5). Populations from the NE and CE areas displayed a positive kurtosis value, suggesting a dominance of one of the smaller height classes (10–20 cm). The number of colonies with a height >30 cm was generally low (on average 23%), with the highest value observed in the CE area (32%), even if an important proportion of large colonies (20–30 and 30–40 cm) were found in most of the sites.
Colony orientation changed among areas: in the NE and CE zones, most colonies were oriented 90° with respect to the rocky walls (44% and 63% respectively), whereas in the SW area, 37% of them were 0°, and 37% were oriented 135° (Table 4). Furthermore, orientation varied significantly among the depth categories considered (K-W; p < 0.001; Supplementary Table S8).

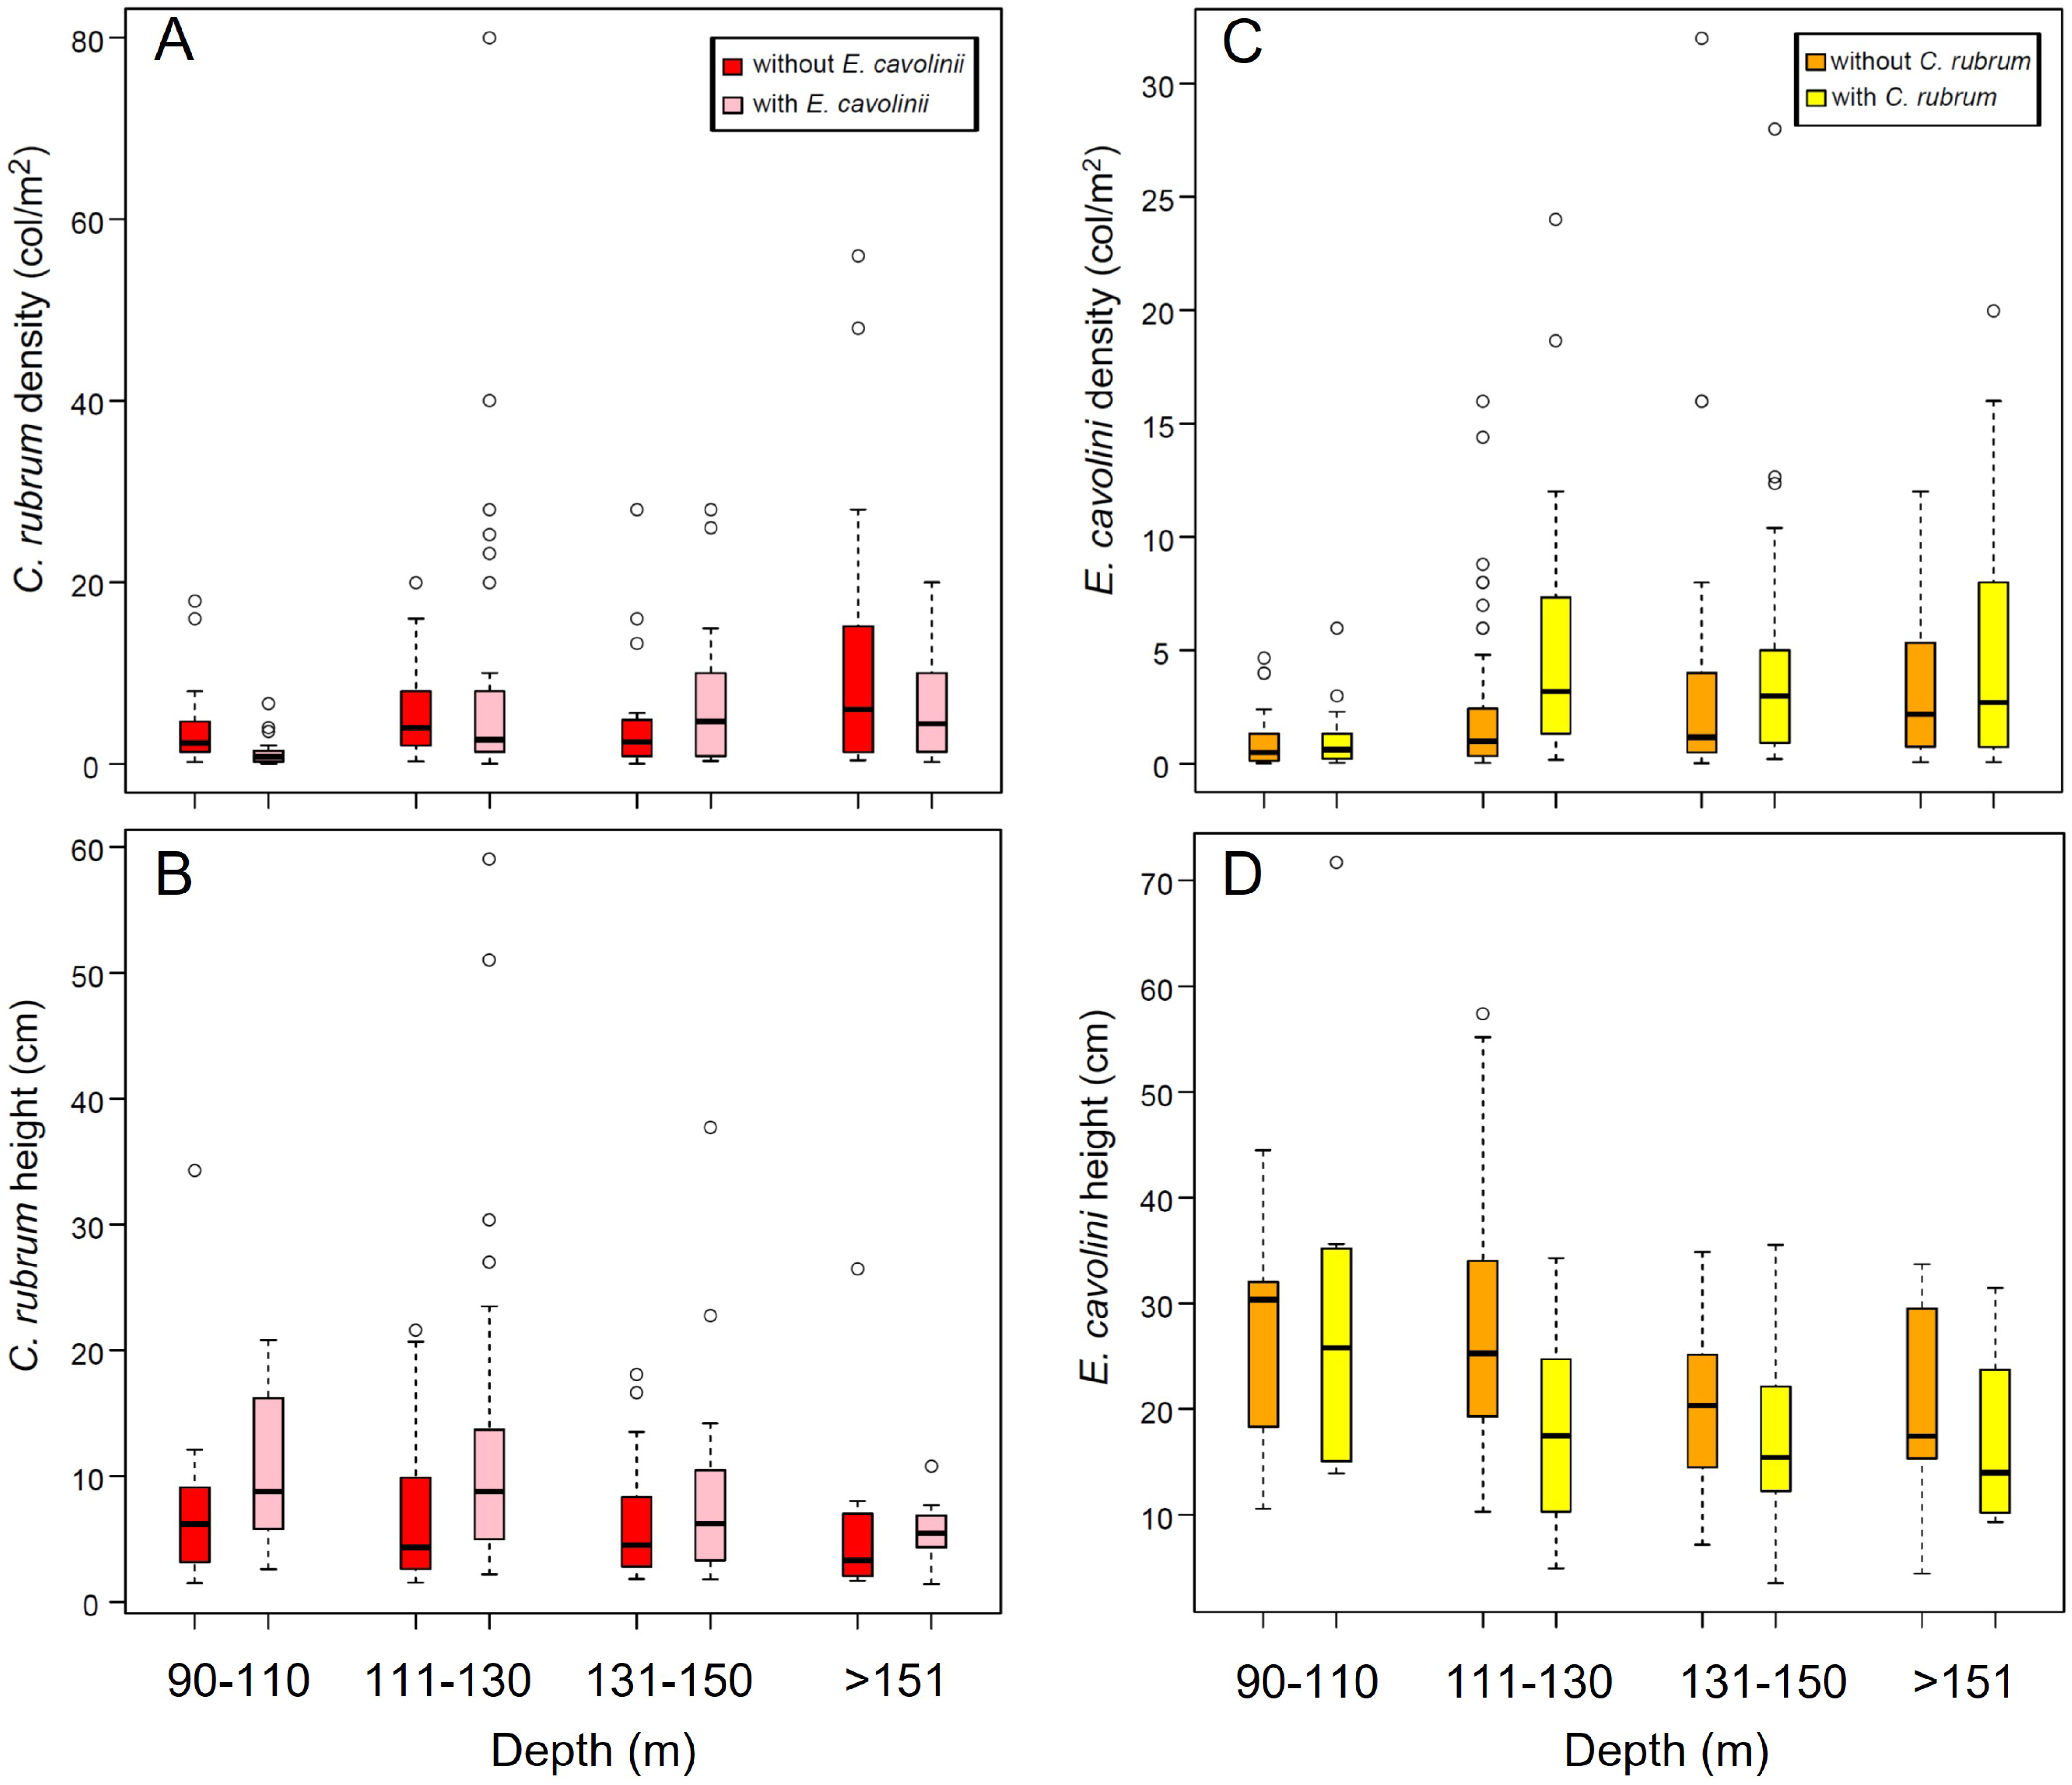
3.3. Co-Occurrence of C. rubrum with E. cavolini

Overall, the co-occurrence of C. rubrum and E. cavolini was observed in 105 frames out of the total 835 analyzed frames (13%). Co-occurrence was observed throughout a wide bathymetric range (i.e., 91–199 m depth) but mostly in the deepest sites (120–160 m depth), where > 80% of frames showed the co-occurrence of the two species. We here found that 42% of the frames where red coral was present, also showed the presence of the yellow gorgonian, with the highest co-occurrence rate (93%) found in the Pietrame Canyon.
The density and height of the two species varied along the bathymetric range investigated, both in the presence and absence of the other species (Figure 6). Overall, both red coral density and height were higher in presence of E. cavolini (Figure 6A,B), with significantly higher values of height when yellow gorgonian was present (Table 3; PERMANOVA, p < 0.001). The basal diameter of red coral showed similar values with or without E. cavolini, except for the Mortorio Canyon, where it was significantly lower in the presence of the yellow gorgonian (Table 3; PERMANOVA, p < 0.05). In addition, the maximum branching level significantly changed with the presence of E. cavolini (Table 3; PERMANOVA, p < 0.001): red coral presented a higher proportion of colonies with the second-order branches (39% vs. 29%) and with the fifth-order branches when it co-occurred with E. cavolini.
For E. cavolini, density was significantly higher (Figure 6C; Table 3; PERMANOVA, p < 0.01), whereas height was lower when it co-occurred with the red coral (Figure 6D).
The results of the DistLM analysis, performed separately on both E. cavolini and C. rubrum density data, revealed that when the two species co-occurred, the density of one species was significantly correlated with the density of the other one (p < 0.001; explained variance: ~20–26%), and to a much less extent with water depth (p < 0.05: ~3%; Table 5). The effect of colony height on density was not significant (Table 5; Supplementary Table S9).

4. Discussion

4.1. Distribution and Population Structure of Deep-Dwelling C. rubrum

This study provides new data regarding the distributions of deep-dwelling C. rubrum and E. cavolini in Sardinia (Figure S6), which is also one of the most important and productive areas of red coral in the Western Mediterranean Sea. C. rubrum typically shows a patchy distribution, and the frequency of patches and density within patches can vary among investigated areas. In our study, density was noticeably lower than in other deep-sea areas [17], except for some sites located in the Southern Tyrrhenian Sea (Gulf of Naples), where similarly low values were recorded [34]. Differences in density and population structure in the deep sea are mainly related to different abiotic factors, such as the low temperature, which can affect the biology of red coral, slowing down the development of male and female gonads and increasing the annual prey capture rates (see reference [14] and references therein). Moreover, red coral population structure can also be driven by “self-thinning” processes: an intra-specific competition process by which space limitations link population density to the mean individual ground cover [53,54]. Thus, immature or disturbed populations should be characterized by high densities, while mature or stable populations should be composed of big and sparse colonies [34,54]. In light of the uncontrolled and destructive harvesting practices that took place over the last two centuries, high-density populations are usually observed in shallow water, whereas low-density and mature populations are found in deeper ones [14]. However, our results indicate an opposite pattern, since we observed higher densities and lower sizes towards deeper sites. This pattern could be explained by considering that besides human impacts, different environmental factors and/or disturbances may drive the population structure. In this perspective, most of our sampling sites were located along submarine canyons, where the frequency of disturbance due to, e.g., dense water cascading and turbidity flow, can be more incisive. These events can negatively affect the stability of larger/older colonies and lead to a shift towards higher densities and smaller sizes, as already documented in sites showing similar ecological features in Sardinia [54]
The demographic analysis revealed that most of the surveyed red coral populations were characterized by height frequency distribution skewed towards smaller-sized colonies, mostly 4 cm in height, which is smaller than the size at which colonies are supposed to reach 100% fertility [42,55,56]. It is noteworthy that some size classes were missing (see Figure 4), which could be an indication of past disturbances [57,58,59]. This hypothesis is also corroborated by the high percentage of dead colonies found along the Arbatax Canyon, where entire patches of dead colonies showed evident branch breakages (Figure 7A,B). Along this canyon, we indeed found a high % of frames (18%) showing the presence of lost fishing gears that document an intense fishing activity within the area (Figure 7C,D). This kind of anthropogenic pressure is very common in the Tyrrhenian Sea [34,60] and could negatively affect benthic communities both directly and indirectly: (i) mechanical friction can directly impact arborescent colonies, eradicating larger and taller ones, provoking branch breakages, and inducing diseases; (ii) generated resuspension may lead to an increase of daily sediment fluxes and sedimentation rates along the canyon, which can negatively affect the settlement, recruitment, and survival of red coral colonies [61,62,63]. Although the present dataset has no evidence of this phenomenon, it is worth noting how such stressors may in turn also trigger infections by pathogens to more sensitive colonies [34].
Overall, the red coral population here investigated showed a basal diameter frequency distribution positively skewed, and an averaged basal diameter of 10 mm, indicating that most of the colonies are young and in the growth phase [19,57]. This is also confirmed by the analysis of the branching pattern showing a low morphological complexity of red coral colonies: most of them, indeed, presented only the first-order branches, which are known to be produced at an average age of about 10 years [44]. On the contrary, the fifth-order branches were observed only in 2% of the total measured colonies.
Overall, 39% of colonies exceeded the minimum size for harvesting (10 mm in basal diameter, as imposed by Sardinian management measures, stricter than those recommended within the GFCM competence area). This is a lower value compared to that found (46%) in a previous paper focused on deep-dwelling red coral colonies in the Tyrrhenian Sea [17]; however, in that paper, the authors referred to the minimum legally harvestable size of basal diameter (7 mm) imposed by the GFCM. The presence of larger colonies is important for population survival, as the reproductive output increases with the size [55,56]. Our data suggest that the stricter management measures imposed by Sardinia since 1979 [64] have guaranteed an overall good conservation status of the resource, but more effective tools, such as the use of onboard scientific observers, should be considered and implemented in the future [23]. In addition, considering that deep-sea banks are now the main target of professional harvesting and that deep red coral populations are genetically different and separated from shallow-water ones by an apparent barrier to gene flow [16,24], it becomes urgent to also develop new management measures to specifically protect deep-sea coral populations.

4.2. Demography of Deep-Dwelling E. cavolini

Our results contribute to advancing knowledge on the distribution and demographic features of populations of E. cavolini dwelling up to 200 m depth. Overall, density values of the yellow gorgonian were lower than those previously found in shallow-water ecosystems [28,65] and mesophotic habitats [66]. However, similar low-density values were reported from other deep-sea sites located at 120 m depth in the Tyrrhenian Sea [29]. We also document an inverse relation between colony density and maximum height (Figure 2C,D), supporting the hypothesis that recruitment can be driven by intra-specific competition mechanisms and can thus increase when large colonies are absent [28]. In addition, we also found that density increased with depth, while height decreased. Like many other octocorals, E. cavolini shows high phenotypic plasticity, modulating the size, shape, and orientation of the colonies in response to water movement [67,68,69]. Thus, the increasing presence of crowded, small colonies (<20 cm) found with the increasing of water depth may be caused by local environmental conditions, such as the higher frequency of disturbance (in terms of dense water cascading and water flow), which is known to characterize deep-sea canyons [70].

4.3. Patterns of Co-Occurrence between Red Coral and Yellow Gorgonian in the Deep Mediterranean Sea

In this study, we found a recurrent association (42% of frames where red coral was present) between red coral and the yellow gorgonian, especially below 120 m depth. These results indicate the two species can partially overlap their distribution in deep sublittoral areas, thus potentially competing for space and resources. Although red coral is known to form monospecific patches, its association with other gorgonians in the deep Mediterranean Sea is not completely unexpected; indeed, in the Tyrrhenian Sea, red coral has been previously found associated with E. cavolini and Paramuricea clavata (60% of ROV frames) [17]. Furthermore, in the Northeast of Spain, in the Medes Islands Marine Protected Area, C. rubrum and the scleractinian cup coral, Leptopsammia pruvoti, usually tend to segregate one from the other at a small spatial scale, but in some cases, the latter wedged within crowded C. rubrum patches, probably due to the aggressive behavior of Leptopsammia pruvoti [8].
We report here that when the two species co-occurred, the density of both red coral and yellow gorgonian were higher and significantly influenced by the density values of the other, while colony size (i.e., the average height of colonies) or depth were less or not significant factors. Our results suggest that competition for space and settlement, likely driven by very similar larval preferences, could be the major constraint for the co-existence of these two suspension feeders. However, the higher density values found when the two species co-occurred, could also open new questions regarding the potential positive effects as foundation species, that are able to modify the peculiar habitat where they live (i.e., reducing water flow velocity, increasing the quantity and quality of organic matter). In addition, we also observed a decrease in the height of E. cavolini, with increasing density when occurring with red coral: this pattern could be likely ascribed to intra-specific self-thinning processes driven by increased density values but also to inter-specific relations, for which we acknowledge the limitation of the present dataset, which misses a temporal replication of observations that would ultimately contribute to understanding such a morphological evolution of colonies. In conclusion, the observed association could be linked to abiotic variables presumably joined with biotic ones [28,71]: different factors not controlled in this study, amongst which similar larval preferences for peculiar features of the rocky bottom, along with inter-specific interactions, may drive the distribution of both species at small spatial scale.

5. Conclusions

The present study advances our knowledge on the distribution and population structures of deep-dwelling C. rubrum and E. cavolini populations (Figure S6). Our data confirm the presence of an inverse size–density relation for both species, with the highest densities found at greater depths. Most of the colonies were alive at the moment of sampling, with the exception of those dwelling along the Arbatax Canyon, which appeared to have suffered from a massive mortality event. Considering that red coral populations are deeply impacted by direct and indirect anthropogenic activities (i.e., fishing, contamination, and harvesting) and that deep-sea banks are now the main target of professional fishermen, there is an urgent need to develop new and effective management measures to guarantee the protection and conservation of such populations and their associated biodiversity.
This paper also reports the co-occurrence of red coral and yellow gorgonian between 90 and 200 m depth, demonstrating a partially overlapping distribution and that the variability of the two species’ densities is significantly driven by the density of the other. However, further studies are needed to better clarify the relative effects on crucial biological features, such as settlement and recruitment, and to analyze the role of different environmental factors potentially influencing these inter-specific relationships.

Supplementary Materials

The following supporting information can be downloaded at: www.mdpi.com/article/10.3390/biology11020333/s1, Figure S1: Example of analyzed frame; Figure S2: Pie chart representing the relative percentages of the highest level of branching in C. rubrum colonies, across the depth-categories investigated; Figure S3: Pie chart representing the orientation of C. rubrum colonies (expressed as relative %), across the depth-categories investigated; Figure S4: Relationship between the presence of red coral vs fishing impact; Figure S5: Size-frequency distribution of E. cavolini colony height in the three investigated areas; Figure S6: distribution map of the two investigated species based on the data obtained during the study. Table S1: Output of the Mann-Whitney pairwise comparison on differences in C. rubrum density among the different depth-categories; Table S2: Output of the Mann-Whitney pairwise comparison on differences in C. rubrum height among the different depth-categories; Table S3: Output of the Mann-Whitney pairwise comparison on differences in C. rubrum basal diameter among the different depth-categories; Table S4: Output of the Mann-Whitney pairwise comparison on differences in C. rubrum maximum branching pattern among the different depth-categories considered in this study; Table S5: Output of the Mann-Whitney pairwise comparison on differences in C. rubrum orientation among the different depth-categories; Table S6: Output of the Mann-Whitney pairwise comparison on differences in E. cavolini density among the different depth-categories; Table S7: Output of the Mann-Whitney pairwise comparison on differences in E. cavolini height among the different depth-categories; Table S8: Output of the Mann-Whitney pairwise comparison on differences in E. cavolini orientation among the different depth-categories; Table S9: Results from the sequential test of the Distance based multivariate analysis for a Linear Model (DistLM) based on AIC criterium.

Author Contributions

Conceptualization, L.C. and A.C.; methodology, L.C., D.M. and A.C.; formal analysis, L.C. and A.C.; data curation, L.C., L.B. and A.C.; writing—original draft preparation, L.C.; writing—review and editing, L.C., D.M., L.B., R.C., M.C.F., S.S. and A.C. All authors have read and agreed to the published version of the manuscript.

Funding

This study was conducted in the framework of two projects focused on the investigation of coralligenous habitats and red coral, financed by the Ministry of Instruction, University and Research (MIUR; grant 2010Z8HJ5M_011 PRIN 2010–2011).

Institutional Review Board Statement

Not applicable.

Informed Consent Statement

Not applicable.

Data Availability Statement

Data are contained within the article or supplementary material.

Acknowledgments

The author L.C. acknowledges the support from PON AIM 1854833—PON Ricerca e Innovazione 2014–2020—Azione I.2—D.D. n. 407, 27/02/2018—Attraction and International Mobility.

Conflicts of Interest

The authors declare no conflict of interest.

References

  1. Jones, C.G.; Lawton, J.H.; Shachak, M. Organisms as ecosystem engineers. In Ecosystem Management; Springer: New York, NY, USA, 1994; pp. 130–147. [Google Scholar]
  2. Verdura, J.; Linares, C.; Ballesteros, E.; Coma, R.; Uriz, M.J.; Bensoussan, N.; Cebrian, E. Biodiversity Loss in a Mediterranean Ecosystem due to an Extreme Warming Event Unveils the Role of an Engineering Gorgonian Species. Sci. Rep. 2019, 9, 5911. [Google Scholar] [CrossRef] [PubMed]
  3. Gili, J.-M.; Coma, R. Benthic Suspension Feeders: Their Paramount Role in Littoral Marine Food Webs. Trends Ecol. Evol. 1998, 13, 316–321. [Google Scholar] [CrossRef]
  4. De Clippele, L.H.; Buhl-Mortensen, P.; Buhl-Mortensen, L. Fauna Associated with Cold Water Gorgonians and Sea Pens. Cont. Shelf Res. 2015, 105, 67–78. [Google Scholar] [CrossRef]
  5. Gili, J.M.; Sardá, R.; Madurell, T.; Rossi, S. Zoobenthos 12. The Mediterranean Sea: Its History and Present Challenges; Springer Science & Business Media: Berlin, Germany, 2013; p. 213. [Google Scholar]
  6. Hill, T.M.; Myrvold, C.R.; Spero, H.J.; Guilderson, T.P. Evidence for Benthic–Pelagic Food Web Coupling and Carbon Export from California Margin Bamboo Coral Archives. Biogeosciences 2014, 11, 3845–3854. [Google Scholar] [CrossRef] [Green Version]
  7. Sebens, K.P.; Koehl, M.A.R. Predation on Zooplankton by the Benthic Anthozoans Alcyonium siderium (Alcyonacea) and Metridium senile (Actiniaria) in the New England Subtidal. Mar. Biol. 1984, 81, 255–271. [Google Scholar] [CrossRef]
  8. Giannini, F.; Gili, J.; Santangelo, G. Relationships between the Spatial Distribution of Red Coral Corallium rubrum and Coexisting Suspension Feeders at Medas Islands Marine Protected Area (Spain). Ital. J. Zool. 2003, 70, 233–239. [Google Scholar] [CrossRef]
  9. Boavida, J.; Paulo, D.; Aurelle, D.; Arnaud-Haond, S.; Marschal, C.; Reed, J.; Gonçalves, J.M.S.; Serrão, E.A. Correction: A Well-Kept Treasure at Depth: Precious Red Coral Rediscovered in Atlantic Deep Coral Gardens (SW Portugal) after 300 Years. PLoS ONE 2016, 11, e0150654. [Google Scholar] [CrossRef] [Green Version]
  10. Knittweis, L.; Aguilar, R.; Alvarez, H.; Borg, J.A.; Evans, J.; Garcia, S.; Schembri, P.J. New depth record of the precious red coral Corallium rubrum for the Mediterranean. Rapp. Comm. Int. Mer. Méditerra. 2016, 41, 463. [Google Scholar]
  11. Garrabou, J.; Harmelin, J.G. A 20-Year Study on Life-History Traits of a Harvested Long-Lived Temperate Coral in the NW Mediterranean: Insights into Conservation and Management Needs. J. Anim. Ecol. 2002, 71, 966–978. [Google Scholar] [CrossRef]
  12. Lartaud, F.; Galli, G.; Raza, A.; Priori, C.; Benedetti, M.C.; Cau, A.; Santangelo, G.; Iannelli, M.; Solidoro, C.; Bramanti, L. Growth patterns in long-lived coral species. In Marine Animal Forests; Rossi, S., Bramanti, L., Gori, A., Orejas, C., Eds.; Springer: Cham, Switzerland, 2017; pp. 595–626. [Google Scholar]
  13. Santangelo, G.; Abbiati, M. Red Coral: Conservation and Management of an Over-Exploited Mediterranean Species. Aquat. Conserv. Mar. Freshw. Ecosyst. 2001, 11, 253–259. [Google Scholar] [CrossRef]
  14. Rossi, S.; Tsounis, G.; Orejas, C.; Padrón, T.; Gili, J.-M.; Bramanti, L.; Teixidó, N.; Gutt, J. Survey of Deep-Dwelling Red Coral (Corallium rubrum) Populations at Cap de Creus (NW Mediterranean). Mar. Biol. 2008, 154, 533–545. [Google Scholar] [CrossRef]
  15. Santangelo, G.; Bramanti, L. Quantifying the Decline in Corallium rubrum Populations. Mar. Ecol. Prog. Ser. 2010, 418, 295–297. [Google Scholar] [CrossRef] [Green Version]
  16. Costantini, F.; Rossi, S.; Pintus, E.; Cerrano, C.; Gili, J.-M.; Abbiati, M. Low Connectivity and Declining Genetic Variability along a Depth Gradient in Corallium rubrum Populations. Coral Reefs 2011, 30, 991–1003. [Google Scholar] [CrossRef]
  17. Angiolillo, M.; Gori, A.; Canese, S.; Bo, M.; Priori, C.; Bavestrello, G.; Salvati, E.; Erra, F.; Greenacre, M.; Santangelo, G. Distribution and Population Structure of Deep-Dwelling Red Coral in the Northwest Mediterranean. Mar. Ecol. 2015, 37, 294–310. [Google Scholar] [CrossRef]
  18. Costantini, F.; Taviani, M.; Remia, A.; Pintus, E.; Schembri, P.J.; Abbiati, M. Deep-Water Corallium rubrum (L., 1758) from the Mediterranean Sea: Preliminary Genetic Characterisation. Mar. Ecol. 2010, 31, 261–269. [Google Scholar] [CrossRef]
  19. Priori, C.; Mastascusa, V.; Erra, F.; Angiolillo, M.; Canese, S.; Santangelo, G. Demography of Deep-Dwelling Red Coral Populations: Age and Reproductive Structure of a Highly Valued Marine Species. Estuar. Coast. Shelf Sci. 2013, 118, 43–49. [Google Scholar] [CrossRef]
  20. Torrents, O.; Tambutté, E.; Caminiti, N.; Garrabou, J. Upper Thermal Thresholds of Shallow vs. Deep Populations of the Precious Mediterranean Red Coral Corallium rubrum (L.): Assessing the Potential Effects of Warming in the NW Mediterranean. J. Exp. Mar. Biol. Ecol. 2008, 357, 7–19. [Google Scholar] [CrossRef]
  21. Garrabou, J.; Coma, R.; Bensoussan, N.; Bally, M.; ChevaldonnÉ, P.; Cigliano, M.; Diaz, D.; Harmelin, J.G.; Gambi, M.C.; Kersting, D.K.; et al. Mass Mortality in Northwestern Mediterranean Rocky Benthic Communities: Effects of the 2003 Heat Wave. Glob. Change Biol. 2009, 15, 1090–1103. [Google Scholar] [CrossRef]
  22. Ledoux, J.-B.; Garrabou, J.; Bianchimani, O.; Drap, P.; Féral, J.-P.; Aurelle, D. Fine-Scale Genetic Structure and Inferences on Population Biology in the Threatened Mediterranean Red Coral, Corallium rubrum. Mol. Ecol. 2010, 19, 4204–4216. [Google Scholar] [CrossRef]
  23. Carugati, L.; Cau, A.; Follesa, M.C.; Melis, R.; Moccia, D.; Porcu, C.; Salvadori, S.; Cannas, R. Onboard Scientific Observers Provide a Realistic Picture of Harvesting and Management Priorities for the Precious Red Coral (Corallium rubrum L.). Front. Mar. Sci. 2020, 7, 482. [Google Scholar] [CrossRef]
  24. Cannas, R.; Sacco, F.; Cau, A.; Coluccia, E.; Follesa, M.C.; Cau, A. New Insights into Connectivity Patterns of Mesophotic Red Coral (Corallium rubrum) Populations. Hydrobiologia 2015, 759, 63–73. [Google Scholar] [CrossRef]
  25. Cannas, R.; Sacco, F.; Cau, A.; Cuccu, D.; Follesa, M.C.; Cau, A. Genetic Monitoring of Deep-Water Exploited Banks of the Precious Sardinia Coral Corallium rubrum (L., 1758): Useful Data for a Sustainable Management. Aquat. Conserv. Mar. Freshw. Ecosyst. 2014, 26, 236–250. [Google Scholar] [CrossRef]
  26. Porcu, C.; Follesa, M.C.; Cannas, R.; Cau, A.; Soldovilla, G.; Pesci, P.; Cau, A. Reproductive Patterns in Deep versus Shallow Populations of the Precious Mediterranean Gorgonian Corallium rubrum (Linnaeus, 1758) (Sardinia, Central-Western Mediterranean). Mediterr. Mar. Sci. 2017, 18, 64. [Google Scholar] [CrossRef] [Green Version]
  27. Moccia, D.; Cau, A.; Bramanti, L.; Carugati, L.; Canese, S.; Follesa, M.C.; Cannas, R. Spatial Distribution and Habitat Characterization of Marine Animal Forest Assemblages along Nine Submarine Canyons of Eastern Sardinia (Central Mediterranean Sea). Deep. Sea Res. Part I Oceanogr. Res. Pap. 2021, 167, 103422. [Google Scholar] [CrossRef]
  28. Sini, M.; Kipson, S.; Linares, C.; Koutsoubas, D.; Garrabou, J. The Yellow Gorgonian Eunicella cavolini: Demography and Disturbance Levels across the Mediterranean Sea. PLoS ONE 2015, 10, e0126253. [Google Scholar] [CrossRef] [Green Version]
  29. Bo, M.; Canese, S.; Spaggiari, C.; Pusceddu, A.; Bertolino, M.; Angiolillo, M.; Giusti, M.; Loreto, M.F.; Salvati, E.; Greco, S.; et al. Deep Coral Oases in the South Tyrrhenian Sea. PLoS ONE 2012, 7, e49870. [Google Scholar] [CrossRef] [Green Version]
  30. Watremez, P. Canyon heads in the French Mediterranean Overview of results from the MEDSEACAN and CORSEACAN campaigns (2008–2010). In Mediterranean Submarine Canyons: Ecology and Governance; Würtz, M., Ed.; IUCN: Gland, Switzerland; Malaga, Spain, 2012; pp. 105–112. [Google Scholar]
  31. Cupido, R.; Cocito, S.; Barsanti, M.; Sgorbini, S.; Peirano, A.; Santangelo, G. Unexpected Long-Term Population Dynamics in a Canopy-Forming Gorgonian Coral Following Mass Mortality. Mar. Ecol. Prog. Ser. 2009, 394, 195–200. [Google Scholar] [CrossRef]
  32. Topçu, E.N.; Öztürk, B. Composition and Abundance of Octocorals in the Sea of Marmara, Where the Mediterranean Meets the Black Sea. Sci. Mar. 2015, 79, 125–135. [Google Scholar] [CrossRef] [Green Version]
  33. Carugati, L.; Bramanti, L.; Giordano, B.; Pittura, L.; Cannas, R.; Follesa, M.C.; Pusceddu, A.; Cau, A. Colonization of Plastic Debris by the Long-Lived Precious Red Coral Corallium rubrum: New Insights on the “Plastic Benefits” Paradox. Mar. Pollut. Bull. 2021, 165, 112104. [Google Scholar] [CrossRef]
  34. Bavestrello, G.; Bo, M.; Canese, S.; Sandulli, R.; Cattaneo-Vietti, R. The Red Coral Populations of the Gulfs of Naples and Salerno: Human Impact and Deep Mass Mortalities. Ital. J. Zool. 2014, 81, 552–563. [Google Scholar] [CrossRef] [Green Version]
  35. Sulli, A. Structural Framework and Crustal Characteristics of the Sardinia Channel Alpine Transect in the Central Mediterranean. Tectonophysics 2000, 324, 321–336. [Google Scholar] [CrossRef]
  36. Mascle, G.H.; Tricart, P.; Torelli, L.; Bouillin, J.-P.; Rolfo, F.; Lapierre, H.; Monié, P.; Depardon, S.; Mascle, J.; Peis, D. Evolution of the Sardinia Channel (Western Mediterranean): New Constraints from a Diving Survey on Cornacya Seamount off SE Sardinia. Mar. Geol. 2001, 179, 179–201. [Google Scholar] [CrossRef]
  37. Harris, P.T.; Whiteway, T. Global Distribution of Large Submarine Canyons: Geomorphic Differences between Active and Passive Continental Margins. Mar. Geol. 2011, 285, 69–86. [Google Scholar] [CrossRef]
  38. Millot, C. Levantine Intermediate Water Characteristics: An Astounding General Misunderstanding! Sci. Mar. 2013, 77, 217–232. [Google Scholar] [CrossRef]
  39. Astraldi, M.; Conversano, F.; Civitarese, G.; Gasparini, G.P.; Ribera d’Alcalà, M.; Vetrano, A. Water Mass Properties and Chemical Signatures in the Central Mediterranean Region. J. Mar. Syst. 2002, 33–34, 155–177. [Google Scholar] [CrossRef]
  40. Kohler, K.E.; Gill, S.M. Coral Point Count with Excel Extensions (CPCe): A Visual Basic Program for the Determination of Coral and Substrate Coverage Using Random Point Count Methodology. Comput. Geosci. 2006, 32, 1259–1269. [Google Scholar] [CrossRef]
  41. Follesa, M.C.; Cannas, R.; Cau, A.; Pedoni, C.; Pesci, P.; Cau, A. Deep-Water Red Coral from the Island of Sardinia (North-Western Mediterranean): A Local Example of Sustainable Management. Mar. Freshw. Res. 2013, 64, 706–715. [Google Scholar] [CrossRef]
  42. Tsounis, G.; Rossi, S.; Aranguren, M.; Gili, J.-M.; Arntz, W. Effects of Spatial Variability and Colony Size on the Reproductive Output and Gonadal Development Cycle of the Mediterranean Red Coral (Corallium rubrum L.). Mar. Biol. 2006, 148, 513–527. [Google Scholar] [CrossRef]
  43. Brazeau, D.A.; Lasker, H.R. Inter- and Intraspecific Variation in Gorgonian Colony Morphology: Quantifying Branching Patterns in Arborescent Animals. Coral Reefs 1988, 7, 139–143. [Google Scholar] [CrossRef]
  44. Benedetti, M.C.; Priori, C.; Erra, F.; Santangelo, G. Growth Patterns in Mesophotic Octocorals: Timing the Branching Process in the Highly-Valuable Mediterranean Corallium rubrum. Estuar. Coast. Shelf Sci. 2016, 171, 106–110. [Google Scholar] [CrossRef]
  45. Angiolillo, M.; Fortibuoni, T. Impacts of Marine Litter on Mediterranean Reef Systems: From Shallow to Deep Waters. Front. Mar. Sci. 2020, 7, 826. [Google Scholar] [CrossRef]
  46. Canals, M.; Pham, C.K.; Bergmann, M.; Gutow, L.; Hanke, G.; van Sebille, E.; Angiolillo, M.; Buhl-Mortensen, L.; Cau, A.; Ioakeimidis, C.; et al. The Quest for Seafloor Macrolitter: A Critical Review of Background Knowledge, Current Methods and Future Prospects. Environ. Res. Lett. 2020, 16, 023001. [Google Scholar] [CrossRef]
  47. Sokal, R.R.; James Rohlf, F. Biometry; W.H. Freeman & Co: New York, NY, USA, 1995. [Google Scholar]
  48. Anderson, M.J.; Gorley, R.N.; Clarke, R.K. Permanova+ for Primer: Guide to Software and Statisticl Methods; Primer-E Ltd.: Plymouth, UK, 2008. [Google Scholar]
  49. Anderson, M.J. A New Method for Non-Parametric Multivariate Analysis of Variance. Austral Ecol. 2001, 26, 32–46. [Google Scholar] [CrossRef]
  50. Anderson, M.J.; Robinson, J. Generalized Discriminant Analysis Based on Distances. Aust. N. Z. J. Stat. 2003, 45, 301–318. [Google Scholar] [CrossRef]
  51. Clarke, K.R.; Gorley, R.N. PRIMER v7: User manual. Tutor. PRIMER-E Plymouth 2015, 1–20. [Google Scholar]
  52. McArdle, B.H.; Anderson, M.J. Fitting multivariate models to community data: A comment on distance-based redundancy analysis. Ecology 2001, 82, 290–297. [Google Scholar] [CrossRef]
  53. Miyanishi, K.; Hoy, A.R.; Cavers, P.B. A Generalized Law of Self-Thinning in Plant Populations (Self-Thinning in Plant Populations). J. Theor. Biol. 1979, 78, 439–442. [Google Scholar] [CrossRef]
  54. Cau, A.; Bramanti, L.; Cannas, R.; Follesa, M.C.; Angiolillo, M.; Canese, S.; Bo, M.; Cuccu, D.; Guizien, K. Habitat Constraints and Self-Thinning Shape Mediterranean Red Coral Deep Population Structure: Implications for Conservation Practice. Sci. Rep. 2016, 6, 23322. [Google Scholar] [CrossRef]
  55. Santangelo, G.; Carletti, E.; Maggi, E.; Bramanti, L. Reproduction and Population Sexual Structure of the Overexploited Mediterranean Red Coral Corallium rubrum. Mar. Ecol. Prog. Ser. 2003, 248, 99–108. [Google Scholar] [CrossRef]
  56. Torrents, O.; Garrabou, J.; Marschal, C.; Harmelin, J.G. Age and Size at First Reproduction in the Commercially Exploited Red Coral Corallium rubrum (L.) in the Marseilles Area (France, NW Mediterranean). Biol. Conserv. 2005, 121, 391–397. [Google Scholar] [CrossRef]
  57. Linares, C.; Bianchimani, O.; Torrents, O.; Marschal, C.; Drap, P.; Garrabou, J. Marine Protected Areas and the Conservation of Long-Lived Marine Invertebrates: The Mediterranean Red Coral. Mar. Ecol. Prog. Ser. 2010, 402, 69–79. [Google Scholar] [CrossRef] [Green Version]
  58. Linares, C.; Coma, R.; Garrabou, J.; Díaz, D.; Zabala, M. Size Distribution, Density and Disturbance in Two Mediterranean Gorgonians:Paramuricea ClavataandEunicella Singularis. J. Appl. Ecol. 2008, 45, 688–699. [Google Scholar] [CrossRef]
  59. Bramanti, L.; Vielmini, I.; Rossi, S.; Tsounis, G.; Iannelli, M.; Cattaneo-Vietti, R.; Priori, C.; Santangelo, G. Demographic Parameters of Two Populations of Red Coral (Corallium rubrum L. 1758) in the North Western Mediterranean. Mar. Biol. 2014, 161, 1015–1026. [Google Scholar] [CrossRef]
  60. Cau, A.; Alvito, A.; Moccia, D.; Canese, S.; Pusceddu, A.; Rita, C.; Angiolillo, M.; Follesa, M.C. Submarine Canyons along the Upper Sardinian Slope (Central Western Mediterranean) as Repositories for Derelict Fishing Gears. Mar. Pollut. Bull. 2017, 123, 357–364. [Google Scholar] [CrossRef]
  61. Bo, M.; Bava, S.; Canese, S.; Angiolillo, M.; Cattaneo-Vietti, R.; Bavestrello, G. Fishing Impact on Deep Mediterranean Rocky Habitats as Revealed by ROV Investigation. Biol. Conserv. 2014, 171, 167–176. [Google Scholar] [CrossRef]
  62. Ferrigno, F.; Appolloni, L.; Rendina, F.; Donnarumma, L.; Russo, G.F.; Sandulli, R. Red Coral (Corallium rubrum) Populations and Coralligenous Characterization within “Regno Di Nettuno MPA” (Tyrrhenian Sea, Italy). Eur. Zool. J. 2020, 87, 203–213. [Google Scholar] [CrossRef] [Green Version]
  63. Ferrigno, F.; Appolloni, L.; Russo, G.F.; Sandulli, R. Impact of Fishing Activities on Different Coralligenous Assemblages of Gulf of Naples (Italy). J. Mar. Biol. Assoc. U. K. 2017, 98, 41–50. [Google Scholar] [CrossRef]
  64. Cannas, R.; Follesa, M.C.; Cau, A.; Cau, A.; Friedman, K. Global Report on the Biology, Fishery and Trade of Precious Corals; FAO: Rome, Italy, 2019; pp. 1–254. [Google Scholar]
  65. Weinbauer, M.G.; Velimirov, B. Population Dynamics and Overgrowth of the Sea Fan Eunicella cavolini (Coelenterata: Octocorallia). Estuar. Coast. Shelf Sci. 1996, 42, 583–595. [Google Scholar] [CrossRef]
  66. Bo, M.; Bertolino, M.; Borghini, M.; Castellano, M.; Covazzi Harriague, A.; Di Camillo, C.G.; Gasparini, G.; Misic, C.; Povero, P.; Pusceddu, A.; et al. Characteristics of the Mesophotic Megabenthic Assemblages of the Vercelli Seamount (North Tyrrhenian Sea). PLoS ONE 2011, 6, e16357. [Google Scholar] [CrossRef] [Green Version]
  67. Velimirov, B. Orientation in the sea fan Eunicella cavolinii related to water movement. Helgoländer Wiss. Meeresunters. 1973, 24, 163–173. [Google Scholar] [CrossRef] [Green Version]
  68. Velimirov, B. Variations in growth forms of Eunicella cavolinh Koch (Octocorallia) related to intensity of water movement. J. Exp. Mar. Biol. Ecol. 1976, 21, 109–117. [Google Scholar] [CrossRef]
  69. Weinbauer, M.G.; Velimirov, B. Morphological variations in the Mediterranean Sea fan Eunicella cavolini (Coelenterata: Gorgonacea) in relation to exposure, colony size and colony region. Bull. Mar. Sci. 1995, 56, 283–295. [Google Scholar]
  70. Canals, M.; Puig, P.; de Madron, X.D.; Heussner, S.; Palanques, A.; Fabres, J. Flushing Submarine Canyons. Nature 2006, 444, 354–357. [Google Scholar] [CrossRef]
  71. Zabala i Limousin, M.; Ballesteros i Sagarra, E. Surface-dependent strategies and energy flux in benthic marine communities or, why corals do not exist in the Mediterranean. Sci. Mar. 1989, 53, 3–17. [Google Scholar]
Figure 1. Map of the study area displaying the location of the 19 ROV surveys carried out from the North-east to the South-west Sardinian continental shelf and shelf break.
Biology 11 00333 g001
Figure 2. Boxplots showing colony density and height at different depth ranges: (A) C. rubrum density and (B) height; (C) E. cavolini density and (D) height. The thick line shows the median of the data, and the cross indicates the mean value in red for C. rubrum and in orange for E. cavolini. The small circles are the outliers.
Biology 11 00333 g002
Figure 3. Percentage of red coral colonies taller than 10 cm (blue) and with basal diameter >10 mm (light blue). Numbers above the bars indicate the sample size. In Cala Gonone Shoal no colonies were >10 cm in height nor >10 mm in basal diameter.
Biology 11 00333 g003
Figure 4. Size-frequency distribution of colony height (left column) and basal diameter (right column) of C. rubrum colonies in the three study areas.
Biology 11 00333 g004
Figure 5. Percentage of living (red) and dead (grey) red coral colonies in each sampling site. Numbers next to the bars indicate the sample size.
Biology 11 00333 g005
Figure 6. Boxplots showing colony density and height of (A,B) C. rubrum and (C,D) E. cavolini with and without the presence of the other species, at different depth ranges. The small circles are the outliers.
Biology 11 00333 g006
Figure 7. Dead colonies of Corallium rubrum (A,B) and lost fishing gears (C,D) found along the Arbatax Canyon (CE area).
Biology 11 00333 g007
Table 1. Details of the investigated sites during ROV survey: geographic area, sites’ names, dive id number, depth range, coordinates, surveyed area, and total number of frames from each dive.
Geographic AreaSiteDive ID NumberDepth Range (m)CoordinatesSurveyed Area (m2)N Frames
Lat (N)Long (E)
North-eastCanyon Caprera9112–22041°17′427″9°37′481″5210
Canyon Caprera10127–19041°18′357″9°38′021″8428
Canyon Caprera14121–16541°20′433″9°38′121″106879
Canyon Mortorio1151–12341°04′217″9°47′899″10787
Canyon Mortorio12110–15241°04′152″9°47′845″140114
Canyon Mortorio13126–16341°04′200″9°48′224″12248
Pietrame7144–15040°43′080″9°49′933″8635
Canyon Tavolara8106–19040°55′169″9°54′140″45669
Canyon Tavolara1590–10340°54′858″9°53′592″9720
Canyon Tavolara16107–17040°54′860″9°54′041″22563
Canyon Tavolara17158–29040°54′768″9°54′908″26470
Central-eastCanyon Orosei276–12040°21′825″9°53′670″66189
Canyon Orosei496–12040°21′767″9°53′657″185
Canyon Orosei5156–18740°21′692″9°53′950″17157
Cala Gonone Shoal1954–21740°17′544″9°40′252″7132
Canyon Arbatax20108–14739°58′136″9°43′734″7314
Canyon Arbatax21121–18139°58′080″9°43′770″21343
South-westSecchitella 33143–15639°10′122″8°06′133″7825
Bancotto 29108–14038°44′425″8°29′025″20849
Table 2. Summary of data on red coral Corallium rubrum in the investigated sites: area, site, and depth range where the colonies were found, average colony densities, mean height, mean basal diameter, maximum order of branches, the orientation of colonies, and the portion of colonies occurring with the yellow gorgonian. * = one measured value (one frame with only one measurable colony for basal diameter); na = not available; information not possible to acquire.
AreaSiteDepth Range (m)Colony Density (col/m2) Height (cm)Basal Diameter (mm)Max Order BranchesOrientation of Colonies (%)Colonies Occurring with E. cavolini (%)
45°90°135°180°
North-EastCanyon Caprera116–1522.1 ± 1.95.3 ± 4.40.84 ± 0.41fifth0030561485
Canyon Mortorio108–1466.9 ± 8.76.14.90.95 ± 0.37fourth665531219
Pietrame145–1493.2 ± 0.49.4 ± 6.81.70 ± 0.90fourth0021483193
Canyon Tavolara108–2573.7 ± 3.66.5 ± 4.61.04 ± 0.56fourth013062729
Central-EastCanyon Orosei91–1766.2 ± 10.88.5 ± 6.91.34 ± 0.90third0113632337
Cala Gonone Shoal1324 *3.5 ± 0.80.75 *third0001000100
Canyon Arbatax131–1488.1 ± 7.510.8 ± 41.91 ± 0.24na04504420
South-westSecchitella 148–1521.6 ± 2.17.9 ± 9.10.76 ± 0.56third01122561119
Bancotto 112–1233.5 ± 1.613.9 ± 14.90.86 ± 0.28fifth9642261734
Table 3. Results of the PERMANOVA analysis testing for differences in: (A) red coral density, height, basal diameter, maximum branching level, and colony orientation, and in (B) yellow gorgonian density, height, and colony orientation, among areas (Ar), between sites (Si)within areas and co-occurrence or not (Pr) within sites for each area. df = degrees of freedom; MS = mean square; Pseudo-F = permutational F; *** = p < 0.001; ** = p < 0.01; * = p < 0.05; ns = not significant.
(A) VariableSourcedfMSPseudo-Fp (MC)
DensityAr269.0101.022ns
Si(Ar)653.3800.443ns
Pr(Si(Ar))7138.1001.799ns
Residual23376.720
Total248
HeightAr2174.1703.362*
Si(Ar)656.6930.351ns
Pr(Si(Ar))7233.4006.345***
Residual43336.785
Total448
Basal diameterAr20.4301.0020ns
Si(Ar)60.5420.859ns
Pr(Si(Ar))70.7862.162*
Residual2510.364
Total266
Maximum branching levelAr23.0271.627ns
Si(Ar)65.7011.795ns
Pr(Si(Ar))73.9885.186***
Residual13520.769
Total1367
Colony orientationAr21899.50.480ns
Si(Ar)6145431.551ns
Pr(Si(Ar))71224313.546***
Residual1352903.82
Total1367
(B) VariableSourcedfMSPseudo-Fp (MC)
DensityAr23.2950.145ns
Si(Ar)730.7410.967ns
Pr(Si(Ar))842.9902.412**
Residual27417.822
Total291
HeightAr2101.4300.812ns
Si(Ar)7130.4501.043ns
Pr(Si(Ar))8128.5501.052ns
Residual246122.250
Total263
Colony orientationAr24606.1000.360ns
Si(Ar)744923.0007.227***
Pr(Si(Ar))816681.0009.614***
Residual14261735.100
Total1443
Table 4. Summary of data on the yellow gorgonian Eunicella cavolini in the investigated sites: area, site, depth range where the colonies were found, average colony densities, mean height, orientation of colonies, and portion of colonies occurring with the red coral.
AreaSiteDepth Range (m)Colony Density (col/m2) Height (cm)Orientation of Colonies (%) Colonies Occurring with C. rubrum (%)
45°90°135°180°
North-EastCanyon Caprera122–1524.5 ± 5.619.1 ± 10.430183220055
Canyon Mortorio109–1511.9 ± 1.424.9 ± 12.33224927018
Pietrame142–1492.1 ± 2.321.2 ± 7.70174141267
Canyon Tavolara109–1992.5 ± 618.5 ± 9.52215549040
Central-EastCanyon Orosei76–1872.5 ± 3.624.1 ± 13.6574839114
Cala Gonone Shoal114–1753.6 ± 4.626.9 ± 12.5011781107
South-westSecchitella149–1523.5 ± 4.310.9 ± 4.8005742142
Bancotto108–1262.6 ± 2.824.8 ± 11.4742330028
Table 5. Results from the sequential test of the distance-based multivariate analysis for a linear model (DistLM). The following abbreviations are used: *** = p < 0.001; * = p < 0.05; ns = not significant; Prop. (%) = percentage of explained variation; Cumul. (%) = cumulative percentage of total variation.
VariablesR2p-ValueProp. (%)Cumul. (%)
(A) C. rubrum density
Density of E. cavolini0.267***26.726.7
Depth0.299*3.229.9
Height of E. cavolini0.299ns0.0429.9
(B) E. cavolini density
Density of C. rubrum0.194***19.419.4
Depth0.227*3.322.7
Height of C. rubrum0.231ns0.423.1
Publisher’s Note: MDPI stays neutral with regard to jurisdictional claims in published maps and institutional affiliations.

