
Bioelectrical Impedance Vector Analysis Discriminates Aerobic Power in Futsal Players: The Role of Body Composition


 ,
,  ,
,  ,
,  ,
,  ,
,  and
and
Abstract
:Simple Summary
Abstract
1. Introduction
2. Materials and Methods
2.1. Study Design and Participants
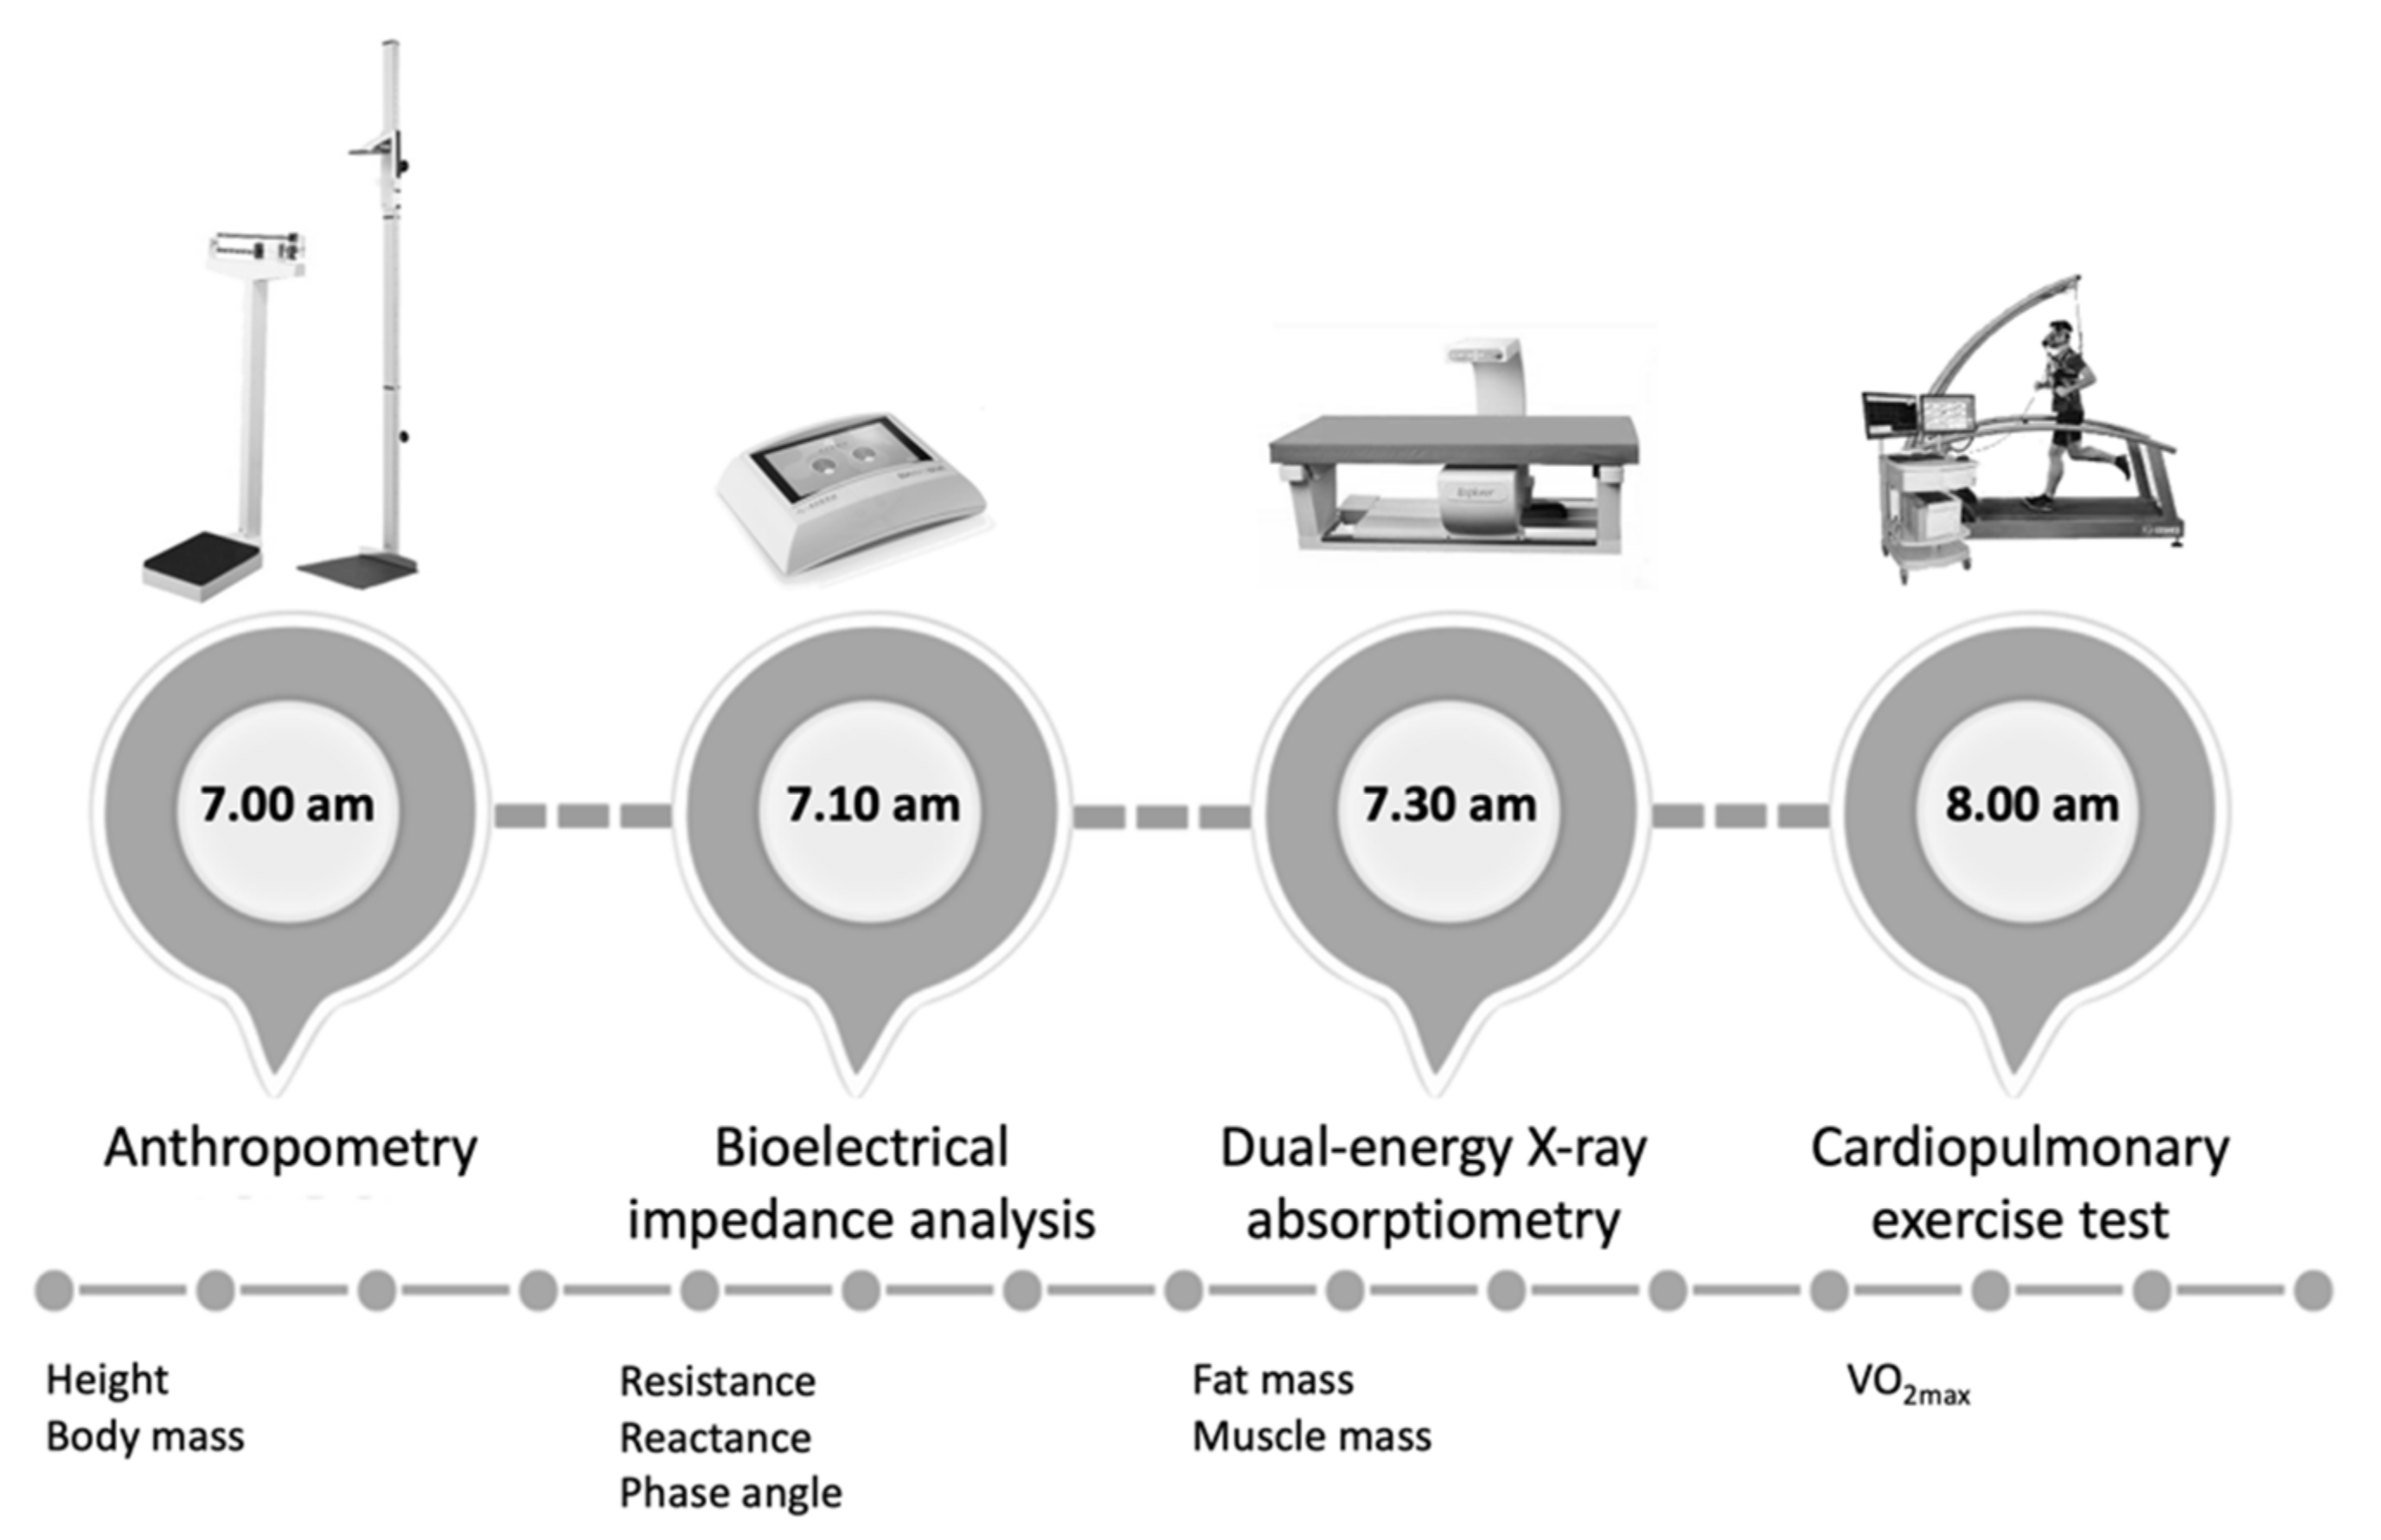
2.2. Procedures
- (a)
- Whole-body DXA scan (Horizon Wi, Waltham, MA, USA) according to the procedures recommended by the manufacturer. The DXA measurements included whole-body estimations of absolute and percentage of fat mass (FM, kg and %) and lean soft tissue, from which muscle mass was calculated using the Kim’s formula [16].
- (b)
- Whole-body BIA using a single frequency of 50 kHz device (BIA 101 BIVA® PRO, Akern Systems, Firenze, Italy). After cleaning the skin with isotropy alcohol, four low intrinsic impedance adhesive electrodes (Biatrodes Akern Srl, Firenze, Italy) were placed on the hands back and other four electrodes on the neck of the corresponding feet, according to the guidelines for athletes [18]. From the raw data R and Xc, PhA was calculated as the arctangent of Xc/R × 180/π. BIVA was applied standardizing R and Xc for the subjects’ stature in meters.
2.3. Statistical Analysis
3. Results
4. Discussion
5. Conclusions
Author Contributions
Funding
Institutional Review Board Statement
Informed Consent Statement
Data Availability Statement
Acknowledgments
Conflicts of Interest
References
- Borges, L.; Dermargos, A.; Gorjão, R.; Cury-Boaventura, M.F.; Hirabara, S.M.; Abad, C.C.; Pithon-Curi, T.C.; Curi, R.; Barros, M.P.; Hatanaka, E. Updating futsal physiology, immune system, and performance. Res. Sports Med. 2021, 1–18. [Google Scholar] [CrossRef] [PubMed]
- Barbero-Alvarez, J.C.; Soto, V.M.; Barbero-Alvarez, V.; Granda-Vera, J. Match analysis and heart rate of futsal players during competition. J. Sports Sci. 2008, 26, 63–73. [Google Scholar] [CrossRef] [PubMed]
- Da Silva, H.S.; Nakamura, F.Y.; Papoti, M.; da Silva, A.S.; Dos-Santos, J.W. Relationship Between Heart Rate, Oxygen Consumption, and Energy Expenditure in Futsal. Front. Psychol. 2021, 12, 2896. [Google Scholar] [CrossRef] [PubMed]
- Lundby, C.; Montero, D.; Joyner, M. Biology of VO2max: Looking under the physiology lamp. Acta Physiol. 2017, 220, 218–228. [Google Scholar] [CrossRef] [PubMed]
- Pedersen, B.K.; Saltin, B. Exercise as medicine—Evidence for prescribing exercise as therapy in 26 different chronic diseases. Scand. J. Med. Sci. Sports 2015, 25, 1–72. [Google Scholar] [CrossRef] [Green Version]
- Bundy, M.; Leaver, A. Training and conditioning. In A Guide to Sports and Injury Management; Elsevier: Amsterdam, The Netherlands, 2010; pp. 1–9. [Google Scholar]
- Greco, D.; Calanni, L.; Cerullo, G.; Negro, M.; D’Antona, G. Comparison of Cardiorespiratory and Metabolic Responses between Kettlebell Half Marathon and Treadmill Running at the Same Average Oxygen Consumption: A Case Study. J. Sci. Sport Exerc. 2021, 3, 379–384. [Google Scholar] [CrossRef]
- Álvarez, J.C.B.; D’ottavio, S.; Vera, J.G.; Castagna, C. Aerobic Fitness in Futsal Players of Different Competitive Level. J. Strength Cond. Res. 2009, 23, 2163–2166. [Google Scholar] [CrossRef]
- Baroni, B.M.; Leal Junior, E.C.P. Aerobic capacity of male professional futsal players. J. Sports Med. Phys. Fit. 2010, 50, 395–399. [Google Scholar]
- Beato, M.; Coratella, G.; Schena, F. Brief review of the state of art in futsal. J. Sports Med. Phys. Fit. 2016, 56, 428–432. [Google Scholar]
- Naser, N.; Ali, A.; Macadam, P. Physical and physiological demands of futsal. J. Exerc. Sci. Fit. 2017, 15, 76–80. [Google Scholar] [CrossRef]
- Spyrou, K.; Freitas, T.T.; Marín-Cascales, E.; Alcaraz, P.E. Physical and Physiological Match-Play Demands and Player Characteristics in Futsal: A Systematic Review. Front. Psychol. 2020, 11, 2870. [Google Scholar] [CrossRef] [PubMed]
- Köhler, A.; King, R.; Bahls, M.; Groß, S.; Steveling, A.; Gärtner, S.; Schipf, S.; Gläser, S.; Völzke, H.; Felix, S.B.; et al. Cardiopulmonary fitness is strongly associated with body cell mass and fat-free mass. Scand. J. Med. Sci. Sports 2018, 28, 1628–1635. [Google Scholar] [CrossRef] [PubMed]
- Mondal, H. Effect of BMI, Body Fat Percentage and Fat Free Mass on Maximal Oxygen Consumption in Healthy Young Adults. J. Clin. Diagn. Res. 2017, 11, CC17. [Google Scholar] [CrossRef] [PubMed]
- Wang, Z.; Pi-Sunyer, F.X.; Kotler, D.P.; Wielopolski, L.; Withers, R.T.; Pierson, R.N.J.; Heymsfield, S.B. Multicomponent methods: Evaluation of new and traditional soft tissue mineral models by in vivo neutron activation analysis. Am. J. Clin. Nutr. 2002, 76, 968–974. [Google Scholar] [CrossRef] [PubMed] [Green Version]
- Kim, J.; Wang, Z.; Heymsfield, S.B.; Baumgartner, R.N.; Gallagher, D. Total-body skeletal muscle mass: Estimation by a new dual-energy X-ray absorptiometry method. Am. J. Clin. Nutr. 2002, 76, 378–383. [Google Scholar] [CrossRef] [Green Version]
- Campa, F.; Gobbo, L.A.; Stagi, S.; Cyrino, L.T.; Toselli, S.; Marini, E.; Coratella, G. Bioelectrical impedance analysis versus reference methods in the assessment of body composition in athletes. Eur. J. Appl. Physiol. 2022, 122, 561–589. [Google Scholar] [CrossRef]
- Campa, F.; Toselli, S.; Mazzilli, M.; Gobbo, L.A.; Coratella, G. Assessment of Body Composition in Athletes: A Narrative Review of Available Methods with Special Reference to Quantitative and Qualitative Bioimpedance Analysis. Nutrients 2021, 13, 1620. [Google Scholar] [CrossRef]
- Lukaski, H.; Raymond-Pope, C.J. New Frontiers of Body Composition in Sport. Int. J. Sports Med. 2021, 42, 588–601. [Google Scholar] [CrossRef]
- Bongiovanni, T.; Mascherini, G.; Genovesi, F.; Pasta, G.; Iaia, F.M.; Trecroci, A.; Ventimiglia, M.; Alberti, G.; Campa, F. Bioimpedance Vector References Need to Be Period-Specific for Assessing Body Composition and Cellular Health in Elite Soccer Players: A Brief Report. J. Funct. Morphol. Kinesiol. 2020, 5, 73. [Google Scholar] [CrossRef]
- Marini, E.; Campa, F.; Buffa, R.; Stagi, S.; Matias, C.N.; Toselli, S.; Sardinha, L.B.; Silva, A.M. Phase angle and bioelectrical impedance vector analysis in the evaluation of body composition in athletes. Clin. Nutr. 2020, 39, 447–454. [Google Scholar] [CrossRef]
- Di Vincenzo, O.; Marra, M.; Scalfi, L. Bioelectrical impedance phase angle in sport: A systematic review. J. Int. Soc. Sports Nutr. 2019, 16, 49. [Google Scholar] [CrossRef] [PubMed] [Green Version]
- Buchfuhrer, M.J.; Hansen, J.E.; Robinson, T.E.; Sue, D.Y.; Wasserman, K.; Whipp, B.J. Optimizing the exercise protocol for cardiopulmonary assessment. J. Appl. Physiol. 1983, 55, 1558–1564. [Google Scholar] [CrossRef] [PubMed]
- Howley, E.T.; Bassett, D.R.J.; Welch, H.G. Criteria for maximal oxygen uptake: Review and commentary. Med. Sci. Sports Exerc. 1995, 27, 1292–1301. [Google Scholar] [CrossRef] [PubMed]
- Stevens, J. Applied Multivariate Statistics for the Social Sciences; Lawrence Erlbaum Associates Inc.: Mahwah, NJ, USA, 2002. [Google Scholar]
- Campa, F.; Matias, C.; Gatterer, H.; Toselli, S.; Koury, J.C.; Andreoli, A.; Melchiorri, G.; Sardinha, L.B.; Silva, A.M. Classic Bioelectrical Impedance Vector Reference Values for Assessing Body Composition in Male and Female Athletes. Int. J. Environ. Res. Public Health 2019, 16, 5066. [Google Scholar] [CrossRef] [Green Version]
- Piccoli, A.; Nigrelli, S.; Caberlotto, A.; Bottazzo, S.; Rossi, B.; Pillon, L.; Maggiore, Q. Bivariate normal values of the bioelectrical impedance vector in adult and elderly populations. Am. J. Clin. Nutr. 1995, 61, 269–270. [Google Scholar] [CrossRef]
- Francisco, R.; Matias, C.N.; Santos, D.A.; Campa, F.; Minderico, C.S.; Rocha, P.; Heymsfield, S.B.; Lukaski, H.; Sardinha, L.B.; Silva, A.M. The Predictive Role of Raw Bioelectrical Impedance Parameters in Water Compartments and Fluid Distribution Assessed by Dilution Techniques in Athletes. Int. J. Environ. Res. Public Health 2020, 17, 759. [Google Scholar] [CrossRef] [Green Version]
- Matias, C.N.; Monteiro, C.P.; Santos, D.A.; Martins, F.; Silva, A.M.; Laires, M.J.; Sardinha, L.B. Magnesium and phase angle: A prognostic tool for monitoring cellular integrity in judo athletes. Magnes. Res. 2015, 28, 92–98. [Google Scholar] [CrossRef]
- Campa, F.; Silva, A.M.; Matias, C.N.; Monteiro, C.P.; Paoli, A.; Nunes, J.P.; Talluri, J.; Lukaski, H.; Toselli, S. Body Water Content and Morphological Characteristics Modify Bioimpedance Vector Patterns in Volleyball, Soccer, and Rugby Players. Int. J. Environ. Res. Public Health 2020, 17, 6604. [Google Scholar] [CrossRef]
- Barrea, L.; Muscogiuri, G.; Pugliese, G.; Laudisio, D.; de Alteriis, G.; Graziadio, C.; Colao, A.; Savastano, S. Phase Angle as an Easy Diagnostic Tool of Meta-Inflammation for the Nutritionist. Nutrients 2021, 13, 1446. [Google Scholar] [CrossRef]
- Barrea, L.; Muscogiuri, G.; Laudisio, D.; Di Somma, C.; Salzano, C.; Pugliese, G.; de Alteriis, G.; Colao, A.; Savastano, S. Phase Angle: A Possible Biomarker to Quantify Inflammation in Subjects with Obesity and 25(OH)D Deficiency. Nutrients 2019, 11, 1747. [Google Scholar] [CrossRef] [Green Version]
- Campa, F.; Semprini, G.; Judice, P.B.; Messina, G.; Toselli, S. Anthropometry, Physical and Movement Features, and Repeated-sprint Ability in Soccer Players. Int. J. Sports Med. 2019, 40, 100–109. [Google Scholar] [CrossRef] [PubMed]
- Durkalec-Michalski, K.; Nowaczyk, P.M.; Podgórski, T.; Kusy, K.; Osiński, W.; Jeszka, J. Relationship between body composition and the level of aerobic and anaerobic capacity in highly trained male rowers. J. Sports Med. Phys. Fit. 2019, 59, 1526–1535. [Google Scholar] [CrossRef] [PubMed]
- Beekley, M.D.; Abe, T.; Kondo, M.; Midorikawa, T.; Yamauchi, T. Comparison of normalized maximum aerobic capacity and body composition of sumo wrestlers to athletes in combat and other sports. J. Sports Sci. Med. 2006, 5, 13–20. [Google Scholar]
- Toselli, S.; Campa, F. Anthropometry and Functional Movement Patterns in Elite Male Volleyball Players of Different Competitive Levels e. J. Strength Cond. Res. 2018, 32, 2601–2611. [Google Scholar] [CrossRef] [PubMed]
- Martins, P.C.; Teixeira, A.S.; Guglielmo, L.G.A.; Francisco, J.S.; Silva, D.A.S.; Nakamura, F.Y.; de Lima, L.R.A. Phase Angle Is Related to 10 m and 30 m Sprint Time and Repeated-Sprint Ability in Young Male Soccer Players. Int. J. Environ. Res. Public Health 2021, 18, 4405. [Google Scholar] [CrossRef] [PubMed]
- Genton, L.; Mareschal, J.; Norman, K.; Karsegard, V.L.; Delsoglio, M.; Pichard, C.; Graf, C.; Herrmann, F.R. Association of phase angle and running performance. Clin. Nutr. ESPEN 2020, 37, 65–68. [Google Scholar] [CrossRef] [PubMed]
- Campa, F.; Matias, C.N.M.; Teixeira, F.J.; Reis, J.F.; Valamatos, M.J.; Toselli, S.; Monteiro, C.P. Leucine metabolites do not induce changes in phase angle, bioimpedance vector analysis patterns, and strength in resistance trained men. Appl. Physiol. Nutr. Metab. 2020, 46, 669–675. [Google Scholar] [CrossRef]
- Reis, J.F.; Matias, C.N.; Campa, F.; Morgado, J.P.; Franco, P.; Quaresma, P.; Almeida, N.; Curto, D.; Toselli, S.; Monteiro, C.P. Bioimpedance Vector Patterns Changes in Response to Swimming Training: An Ecological Approach. Int. J. Environ. Res. Public Health 2020, 17, 4851. [Google Scholar] [CrossRef]
- Campa, F.; Thomas, D.M.; Watts, K.; Clark, N.; Baller, D.; Morin, T.; Toselli, S.; Koury, J.C.; Melchiorri, G.; Andreoli, A.; et al. Reference Percentiles for Bioelectrical Phase Angle in Athletes. Biology 2022, 11, 264. [Google Scholar] [CrossRef]
- Silva, A.M. Structural and functional body components in athletic health and performance phenotypes. Eur. J. Clin. Nutr. 2019, 73, 215–224. [Google Scholar] [CrossRef]
- Dellinger, J.R.; Johnson, B.A.; Benavides, M.L.; Moore, M.L.; Stratton, M.T.; Harty, P.S.; Siedler, M.R.; Tinsley, G.M. Agreement of bioelectrical resistance, reactance, and phase angle values from supine and standing bioimpedance analyzers. Physiol. Meas. 2021, 42, 35003. [Google Scholar] [CrossRef] [PubMed]
- Stratton, M.T.; Smith, R.W.; Harty, P.S.; Rodriguez, C.; Johnson, B.A.; Dellinger, J.R.; Williams, A.D.; White, S.J.; Benavides, M.L.; Tinsley, G.M. Longitudinal agreement of four bioimpedance analyzers for detecting changes in raw bioimpedance during purposeful weight gain with resistance training. Eur. J. Clin. Nutr. 2021, 75, 1060–1068. [Google Scholar] [CrossRef] [PubMed]


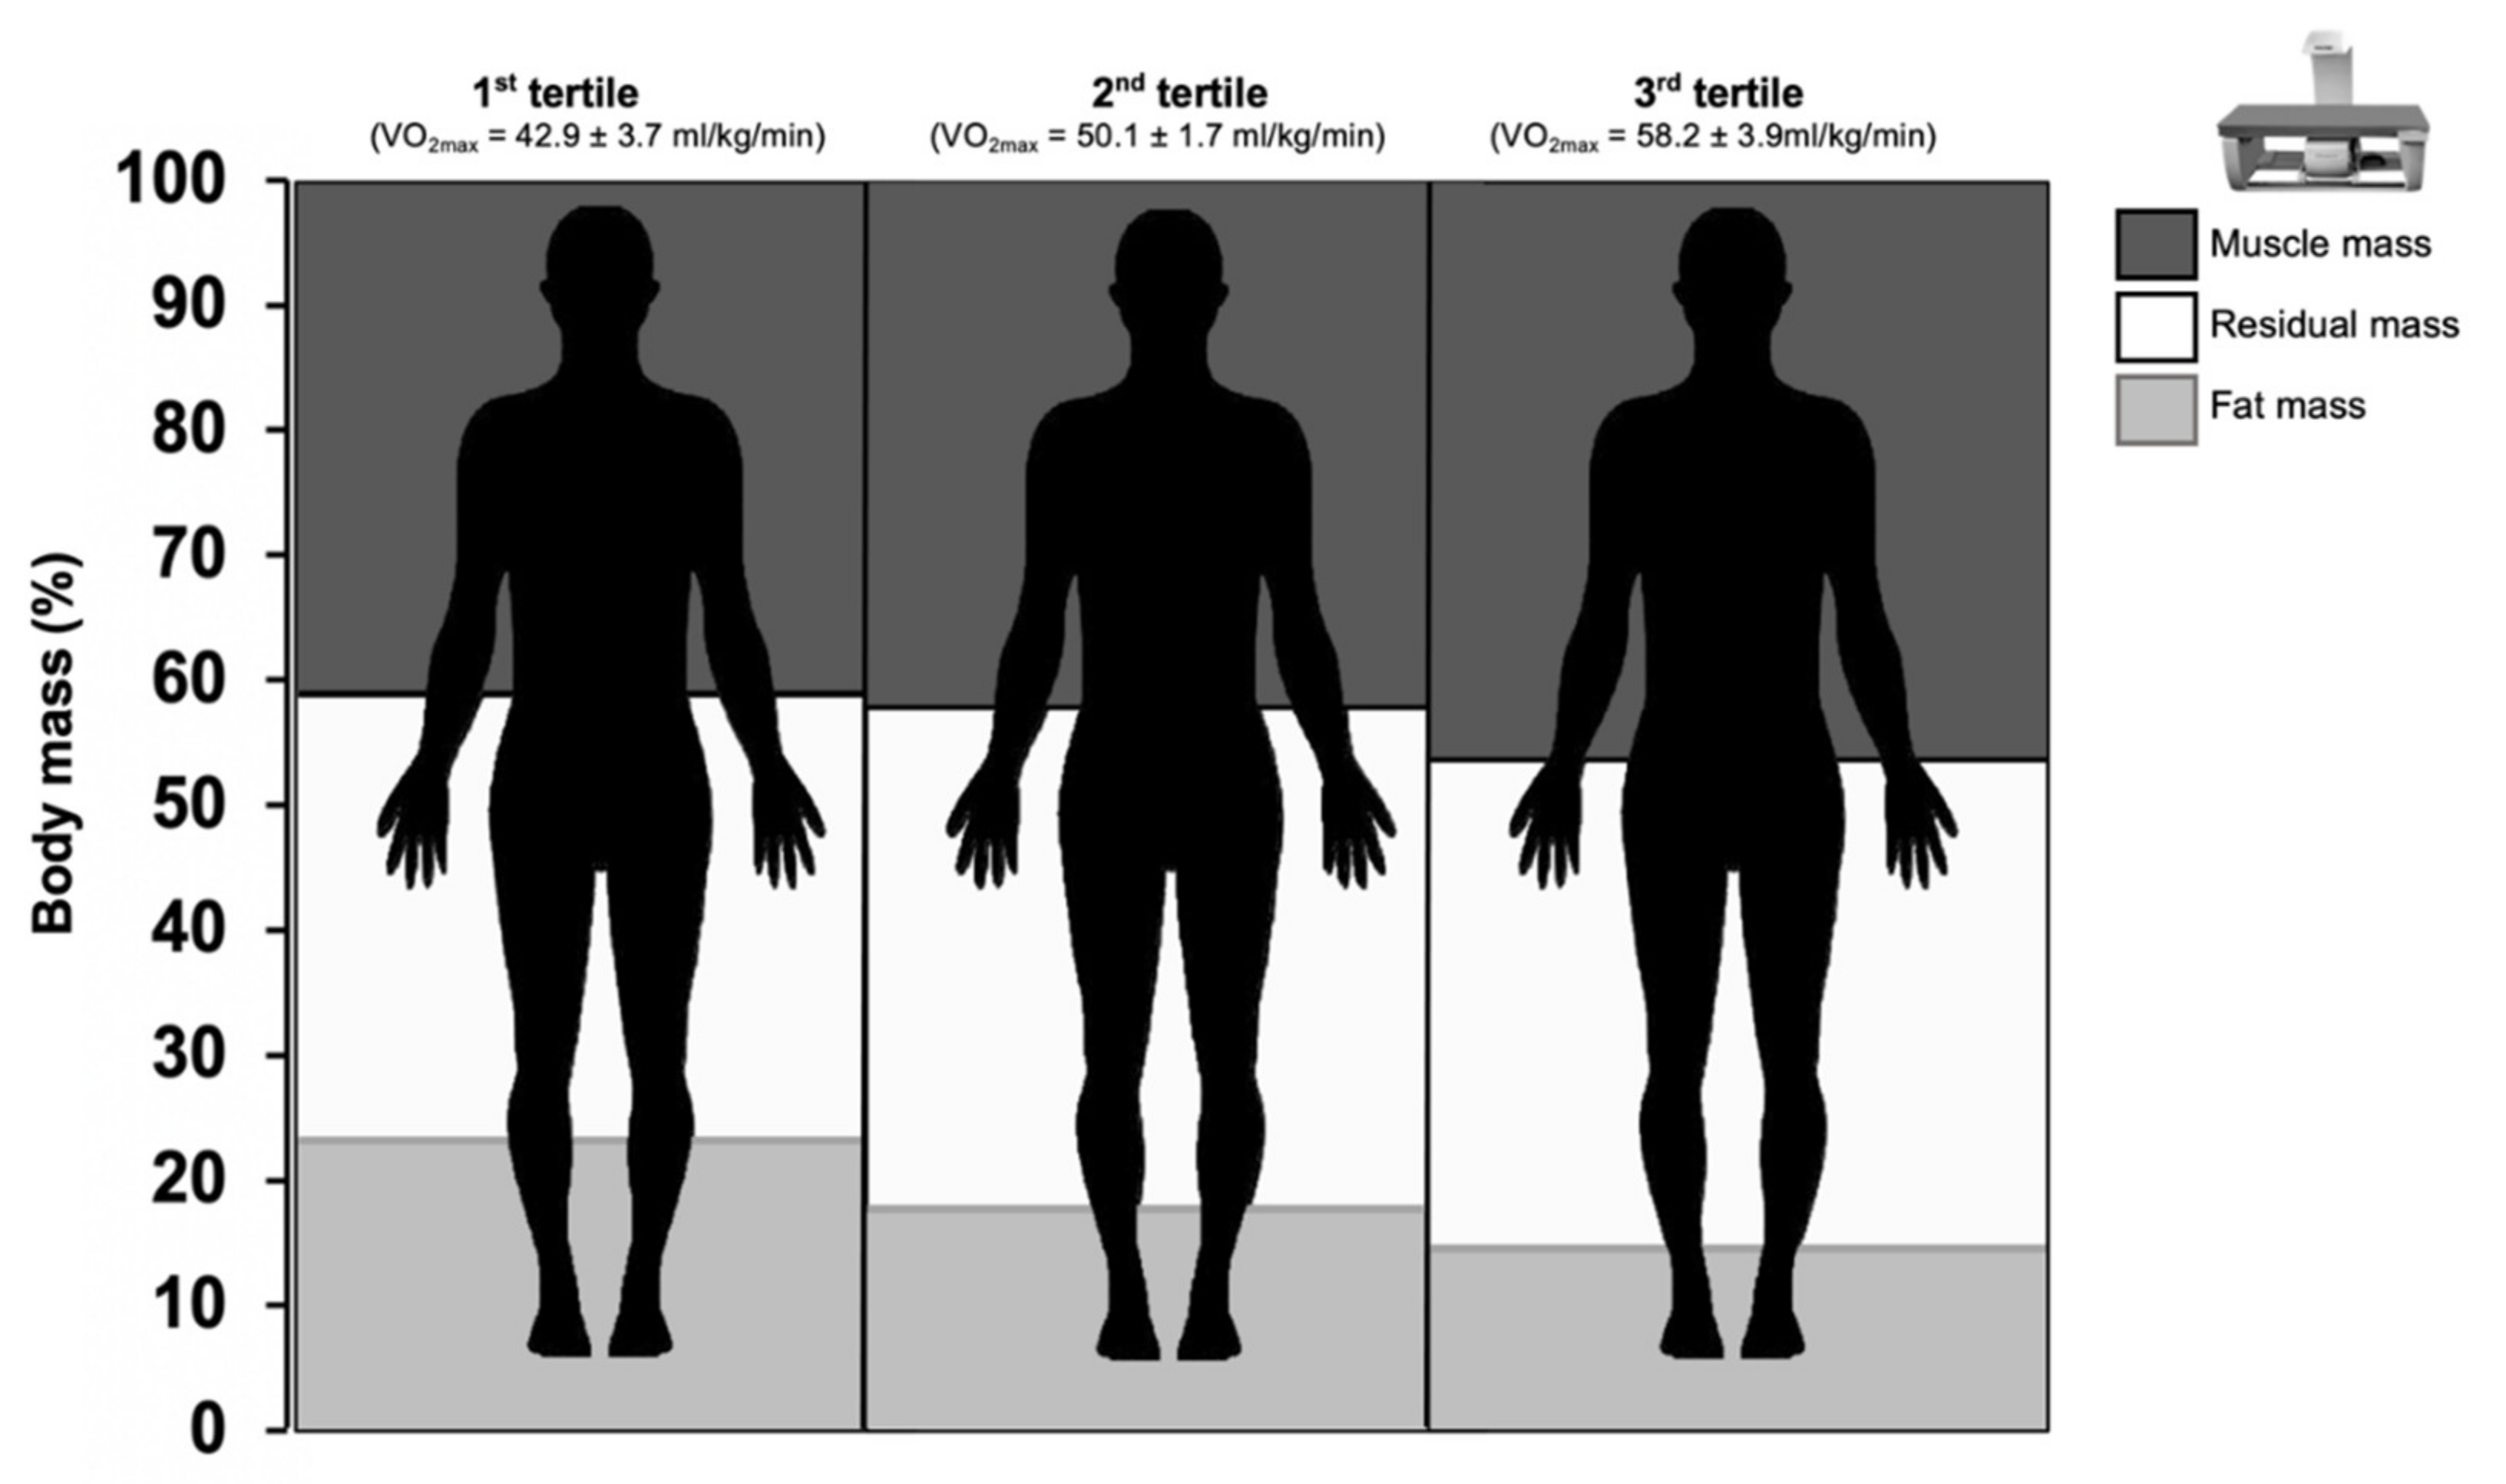
| Variable | T1, n = 16 (V02max = 42.9 ± 3.7 mL/kg/min) | T2, n = 16 (VO2max = 50.1 ± 1.7 mL/kg/min) | T3, n = 16 (VO2max = 58.2 ± 3.9 mL/kg/min) | ANOVA |
|---|---|---|---|---|
| Body mass (kg) | 81.0 ± 0.6 2,3 | 71.5 ± 7.5 1,3 | 66.2 ± 5.4 1,2 | F = 15.5, p < 0.001 |
| BMI (kg/m2) | 24.3 ± 3.1 3 | 23.3 ± 1.5 | 22.0 ± 1.6 1 | F = 4.64, p = 0.015 |
| DXA | ||||
| Muscle mass (kg) | 33.3 ± 3.6 | 31.2 ± 4.2 | 31.8 ± 4.2 | F = 1.1, p = 0.349 |
| Muscle mass (%) | 41.6 ± 6.8 3 | 43.8 ± 3.9 | 48.3 ± 7.5 1 | F = 4.7, p = 0.014 |
| Fat mass (kg) | 17.9 ± 6.0 2,3 | 12.8 ± 3.0 1,3 | 9.8 ± 2.1 1,2 | F = 16.1, p < 0.001 |
| Fat mass (%) | 22.1 ± 5.5 2,3 | 18.2 ± 3.3 1,3 | 15.2 ± 2.5 1,2 | F = 11.8, p < 0.001 |
| BIA | ||||
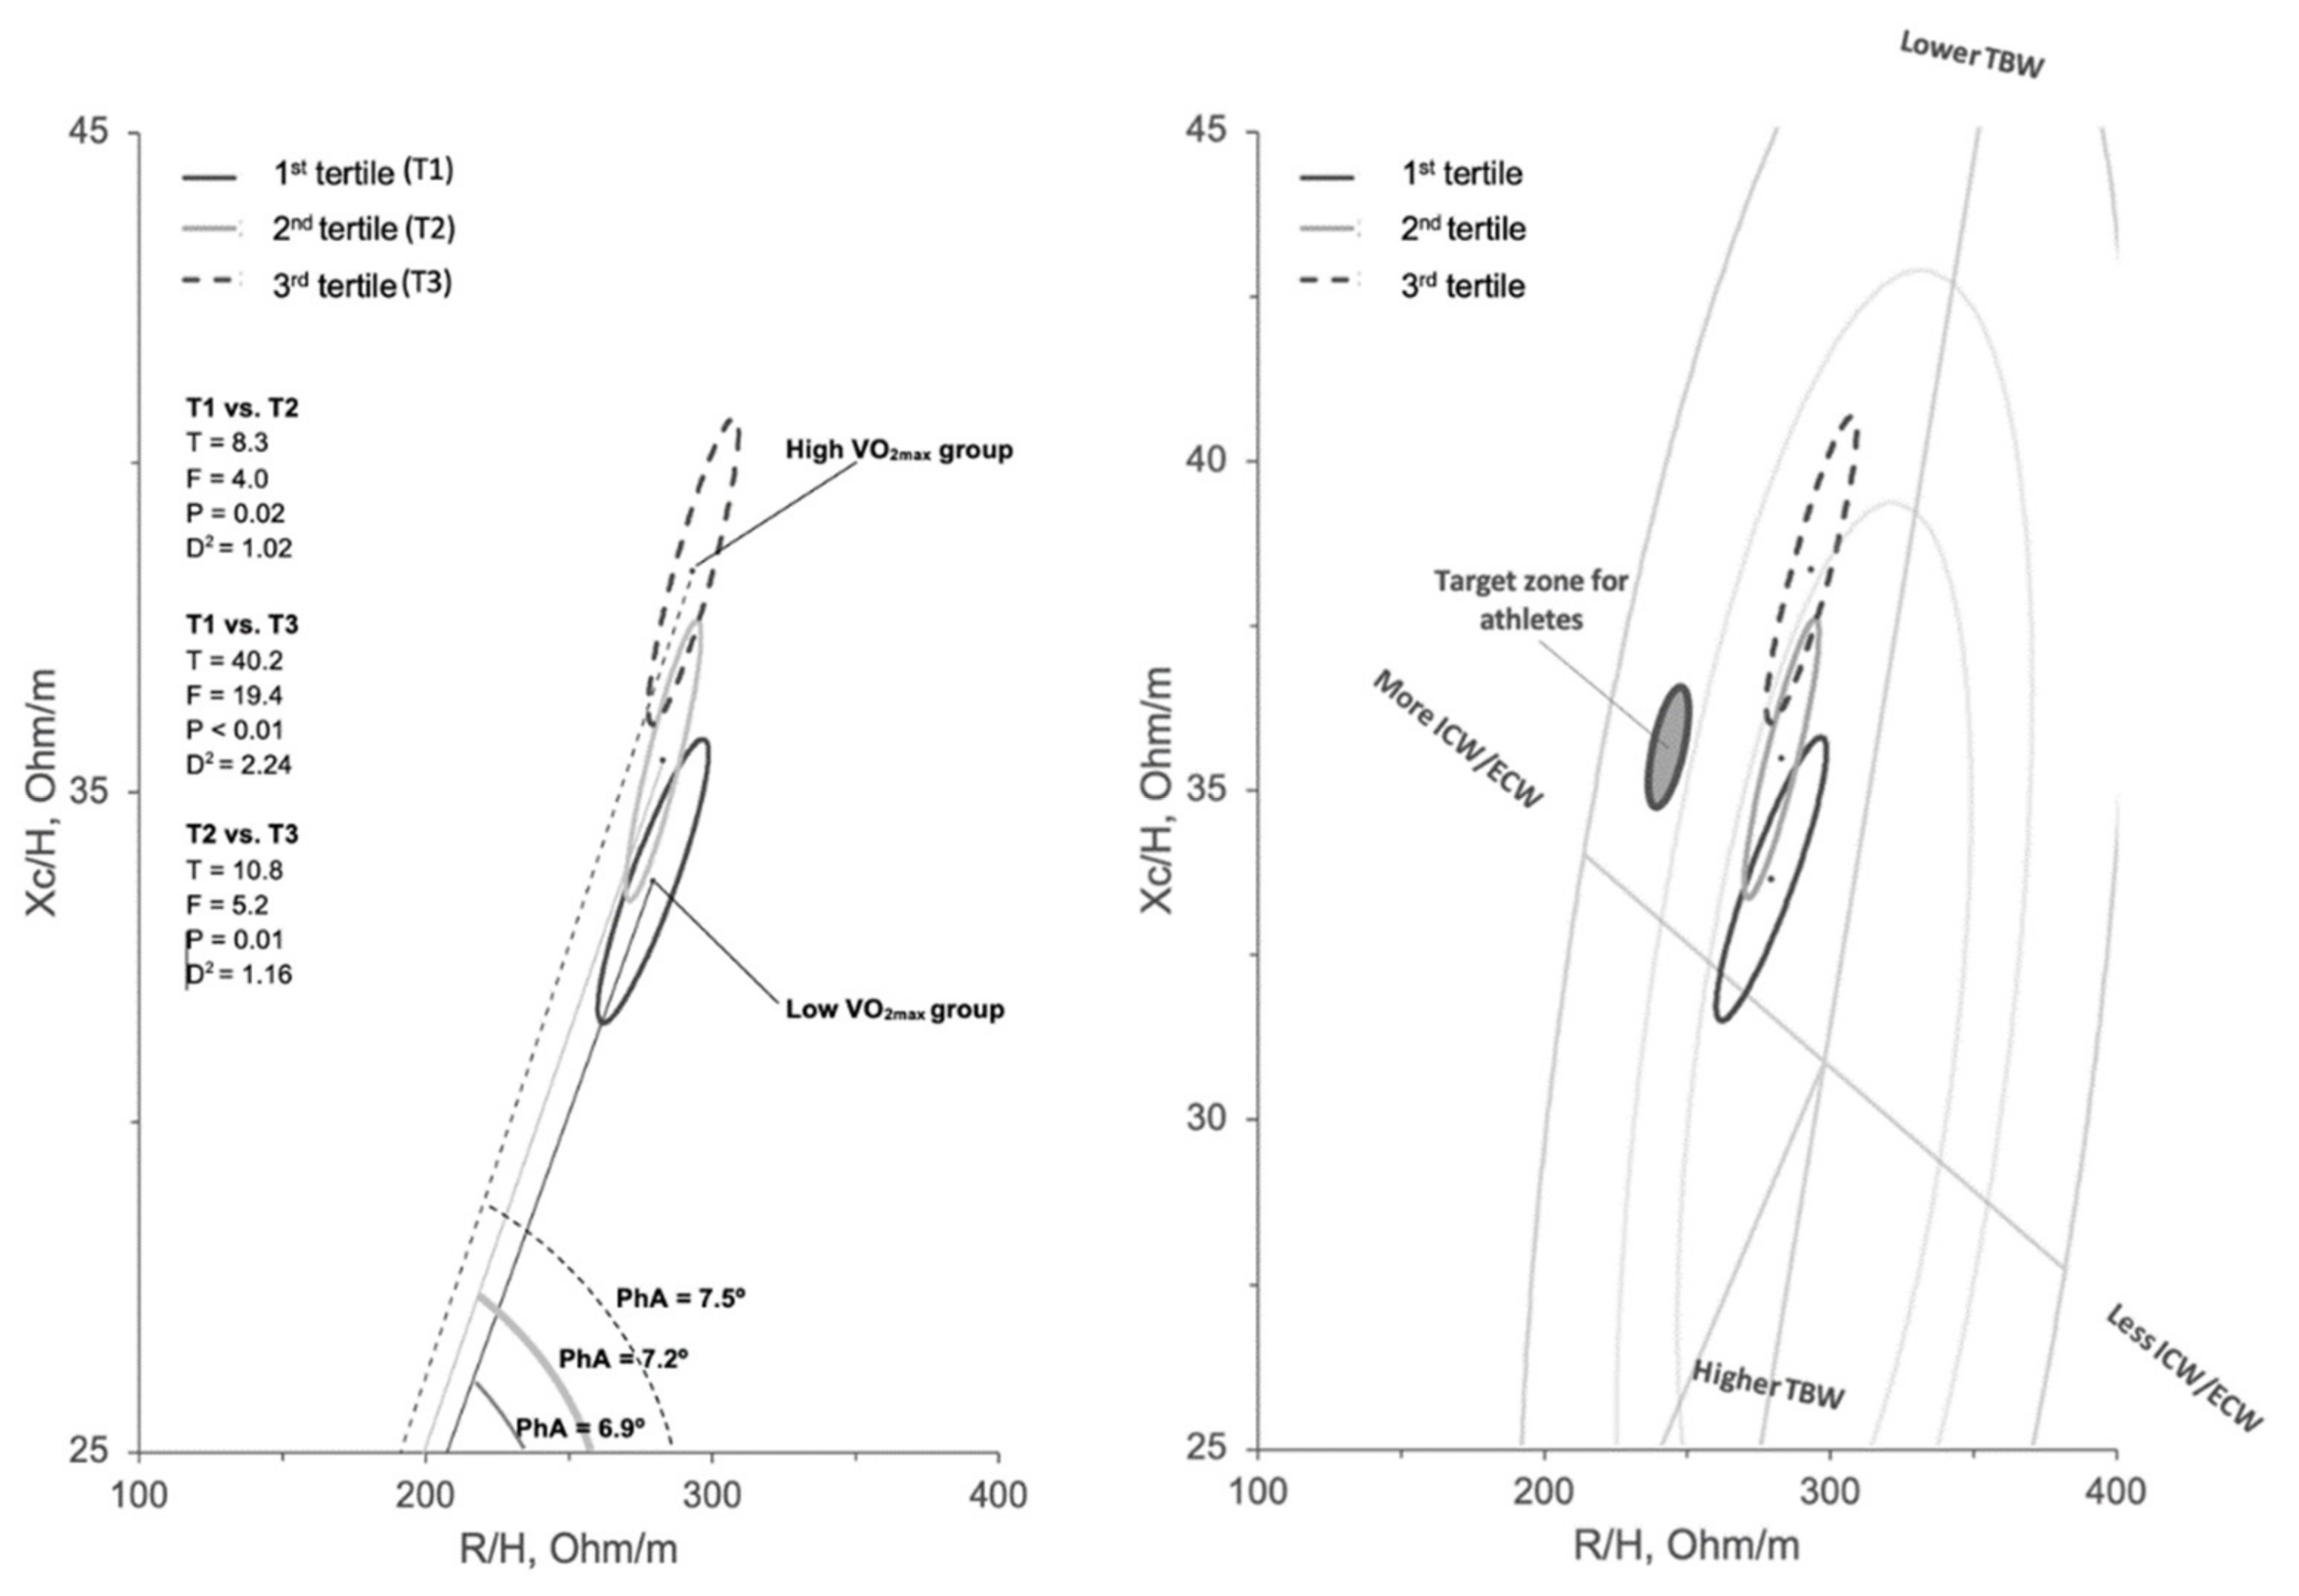
| R/H (ohm/m) | 279.3 ± 27.3 | 282.9 ± 18.5 | 293.4 ± 22.3 | F = 1.6, p = 0.212 |
| Xc/H (ohm/m) | 33.7 ± 3.0 3 | 35.5 ± 3.0 | 38.4 ± 3.3 1 | F = 9.3, p < 0.001 |
| Phase angle (degree) | 6.9 ± 0.4 3 | 7.2 ± 0.4 | 7.5 ± 0.5 1 | F = 7.7, p = 0.001 |
| Model | R2 | Std. Error | β | 95% CI | p-Value |
|---|---|---|---|---|---|
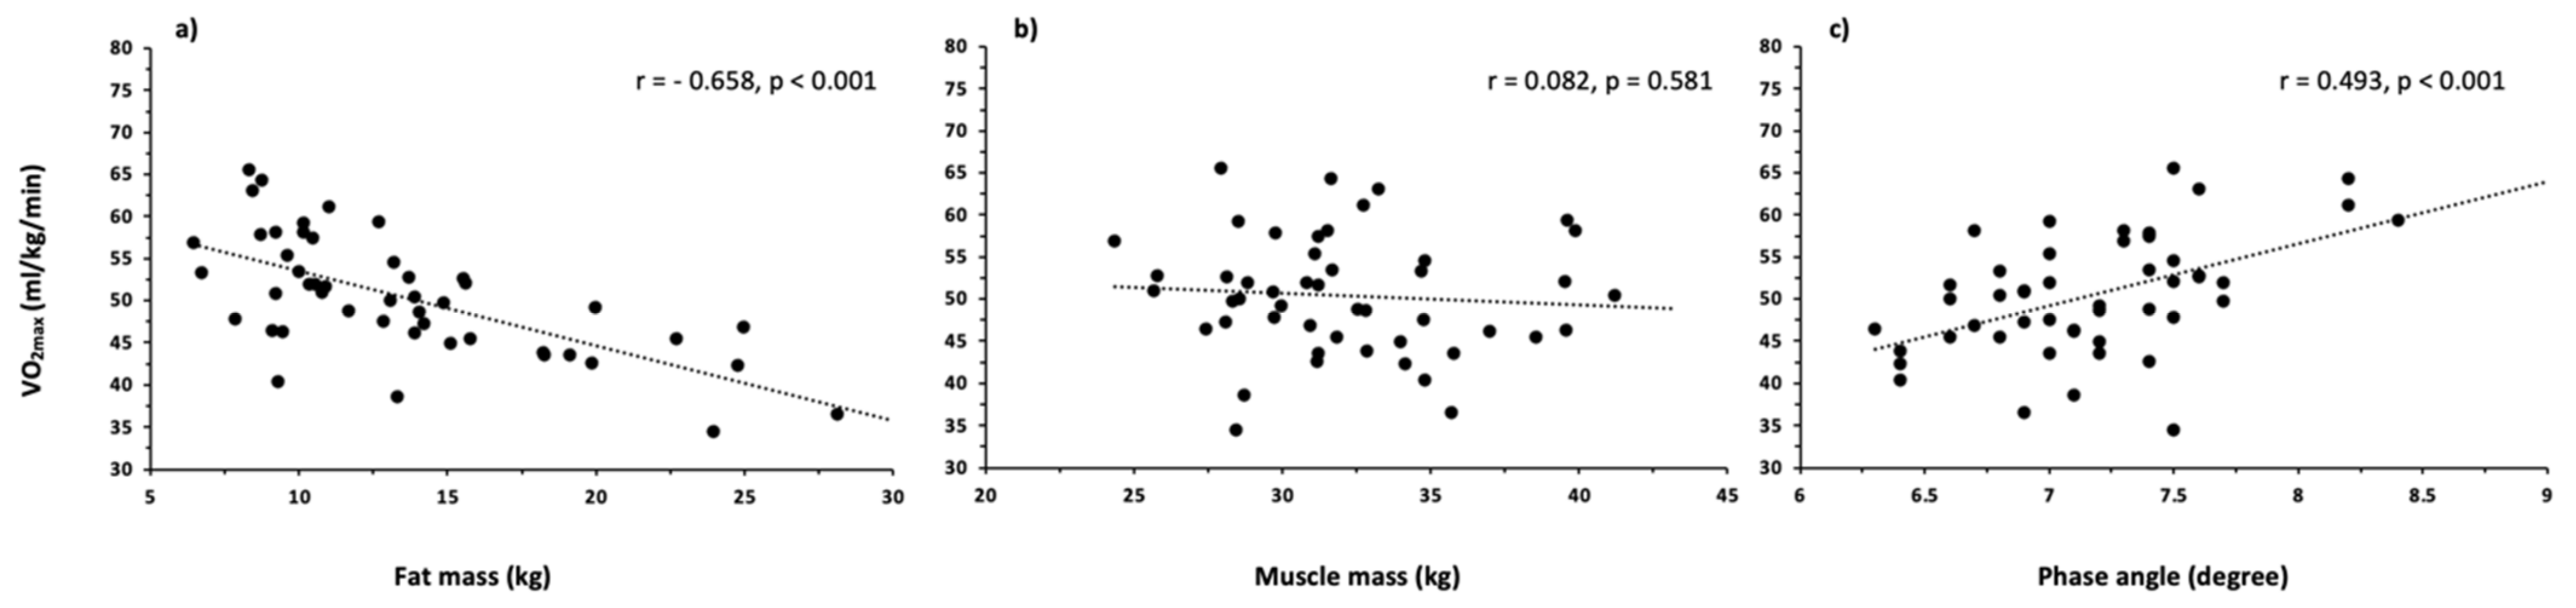
| Fat mass | |||||
| Model a | 0.453 | 0.23 | −0.335 | −0.94, −0.02 | 0.046 |
| Muscle mass | |||||
| Model a | 0.410 | 0.15 | 0.120 | −0.21, 0.64 | 0.371 |
| Phase angle | |||||
| Model a | 0.511 | 1.64 | 0.351 | 1.95, 8.54 | 0.003 |
Publisher’s Note: MDPI stays neutral with regard to jurisdictional claims in published maps and institutional affiliations. |
© 2022 by the authors. Licensee MDPI, Basel, Switzerland. This article is an open access article distributed under the terms and conditions of the Creative Commons Attribution (CC BY) license (https://creativecommons.org/licenses/by/4.0/).
Share and Cite
Matias, C.N.; Campa, F.; Cerullo, G.; D’Antona, G.; Giro, R.; Faleiro, J.; Reis, J.F.; Monteiro, C.P.; Valamatos, M.J.; Teixeira, F.J. Bioelectrical Impedance Vector Analysis Discriminates Aerobic Power in Futsal Players: The Role of Body Composition. Biology 2022, 11, 505. https://doi.org/10.3390/biology11040505
Matias CN, Campa F, Cerullo G, D’Antona G, Giro R, Faleiro J, Reis JF, Monteiro CP, Valamatos MJ, Teixeira FJ. Bioelectrical Impedance Vector Analysis Discriminates Aerobic Power in Futsal Players: The Role of Body Composition. Biology. 2022; 11(4):505. https://doi.org/10.3390/biology11040505
Chicago/Turabian StyleMatias, Catarina N., Francesco Campa, Giuseppe Cerullo, Giuseppe D’Antona, Rita Giro, João Faleiro, Joana F. Reis, Cristina P. Monteiro, Maria J. Valamatos, and Filipe J. Teixeira. 2022. "Bioelectrical Impedance Vector Analysis Discriminates Aerobic Power in Futsal Players: The Role of Body Composition" Biology 11, no. 4: 505. https://doi.org/10.3390/biology11040505
APA StyleMatias, C. N., Campa, F., Cerullo, G., D’Antona, G., Giro, R., Faleiro, J., Reis, J. F., Monteiro, C. P., Valamatos, M. J., & Teixeira, F. J. (2022). Bioelectrical Impedance Vector Analysis Discriminates Aerobic Power in Futsal Players: The Role of Body Composition. Biology, 11(4), 505. https://doi.org/10.3390/biology11040505