
Feeding Habits and the Occurrence of Anthropogenic Debris in the Stomach Content of Marine Fish from Pattani Bay, Gulf of Thailand

 ,
, 
Abstract
:Simple Summary
Abstract
1. Introduction
2. Materials and Methods
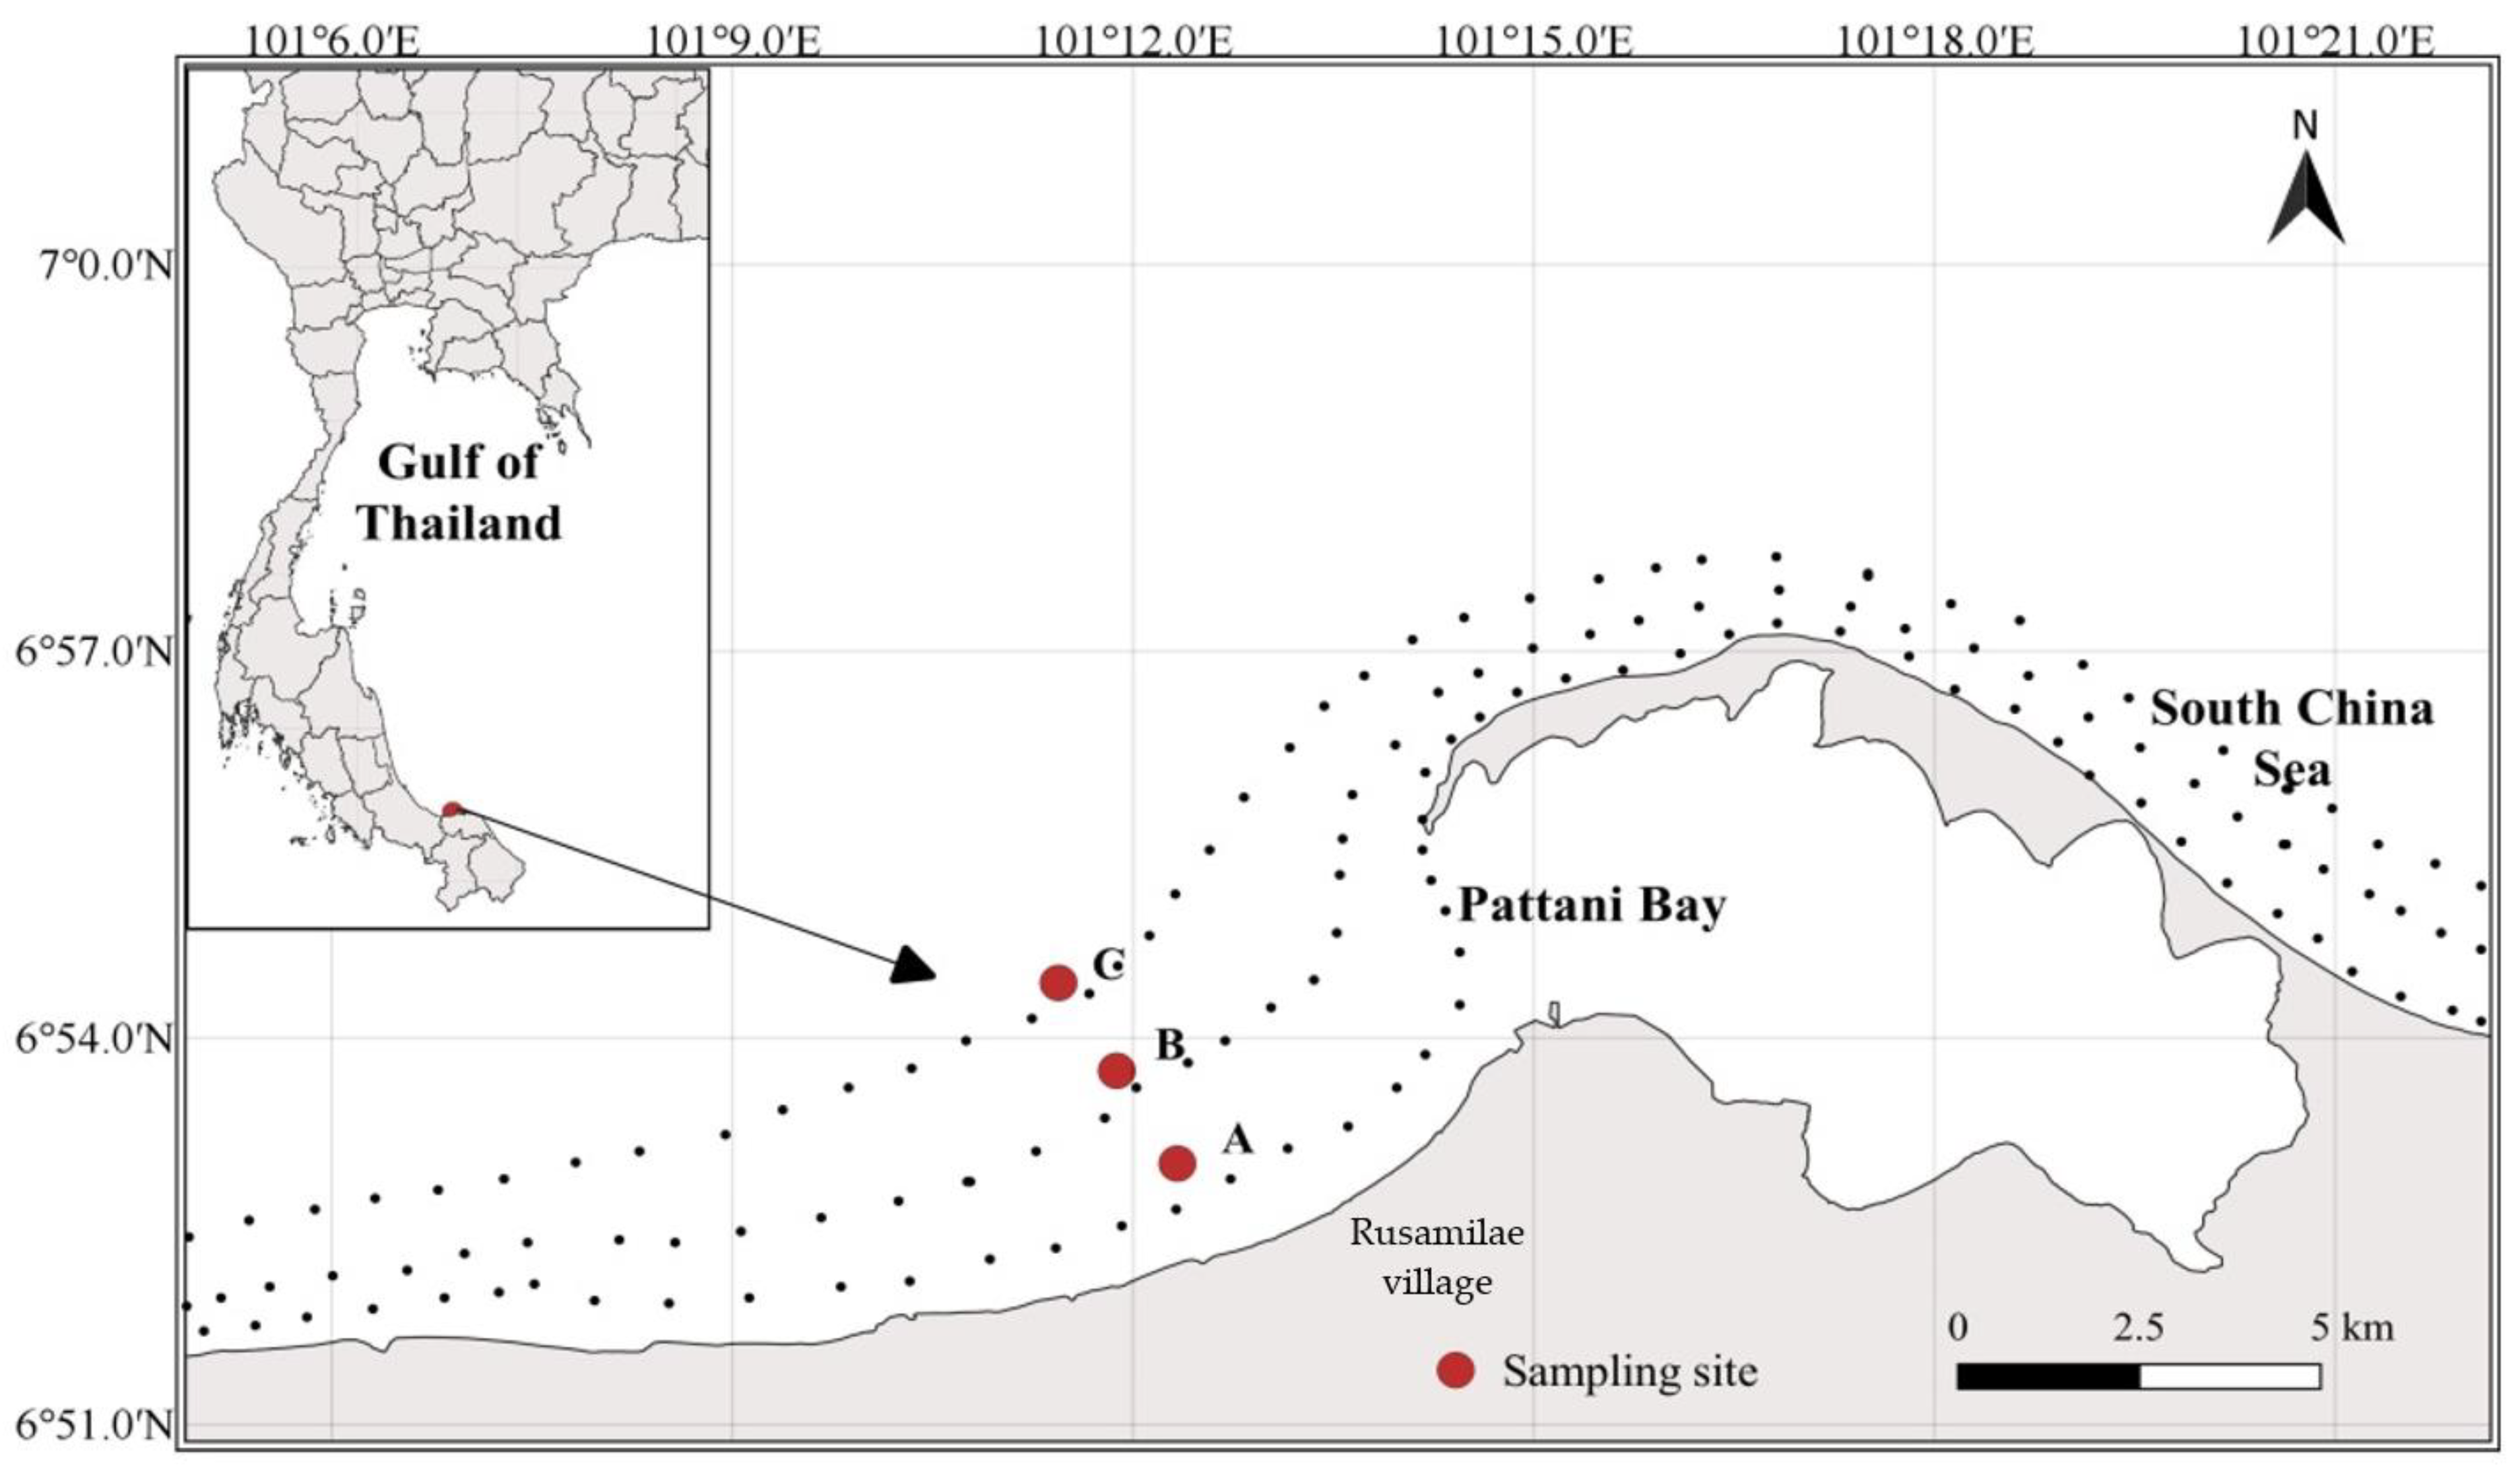
2.1. Study Area
2.2. Sample Collection and Storage
2.3. Diet and Anthropogenic Debris Identification
2.4. Experimental Control
2.5. Data Analysis
2.6. Statistical Analysis
3. Results
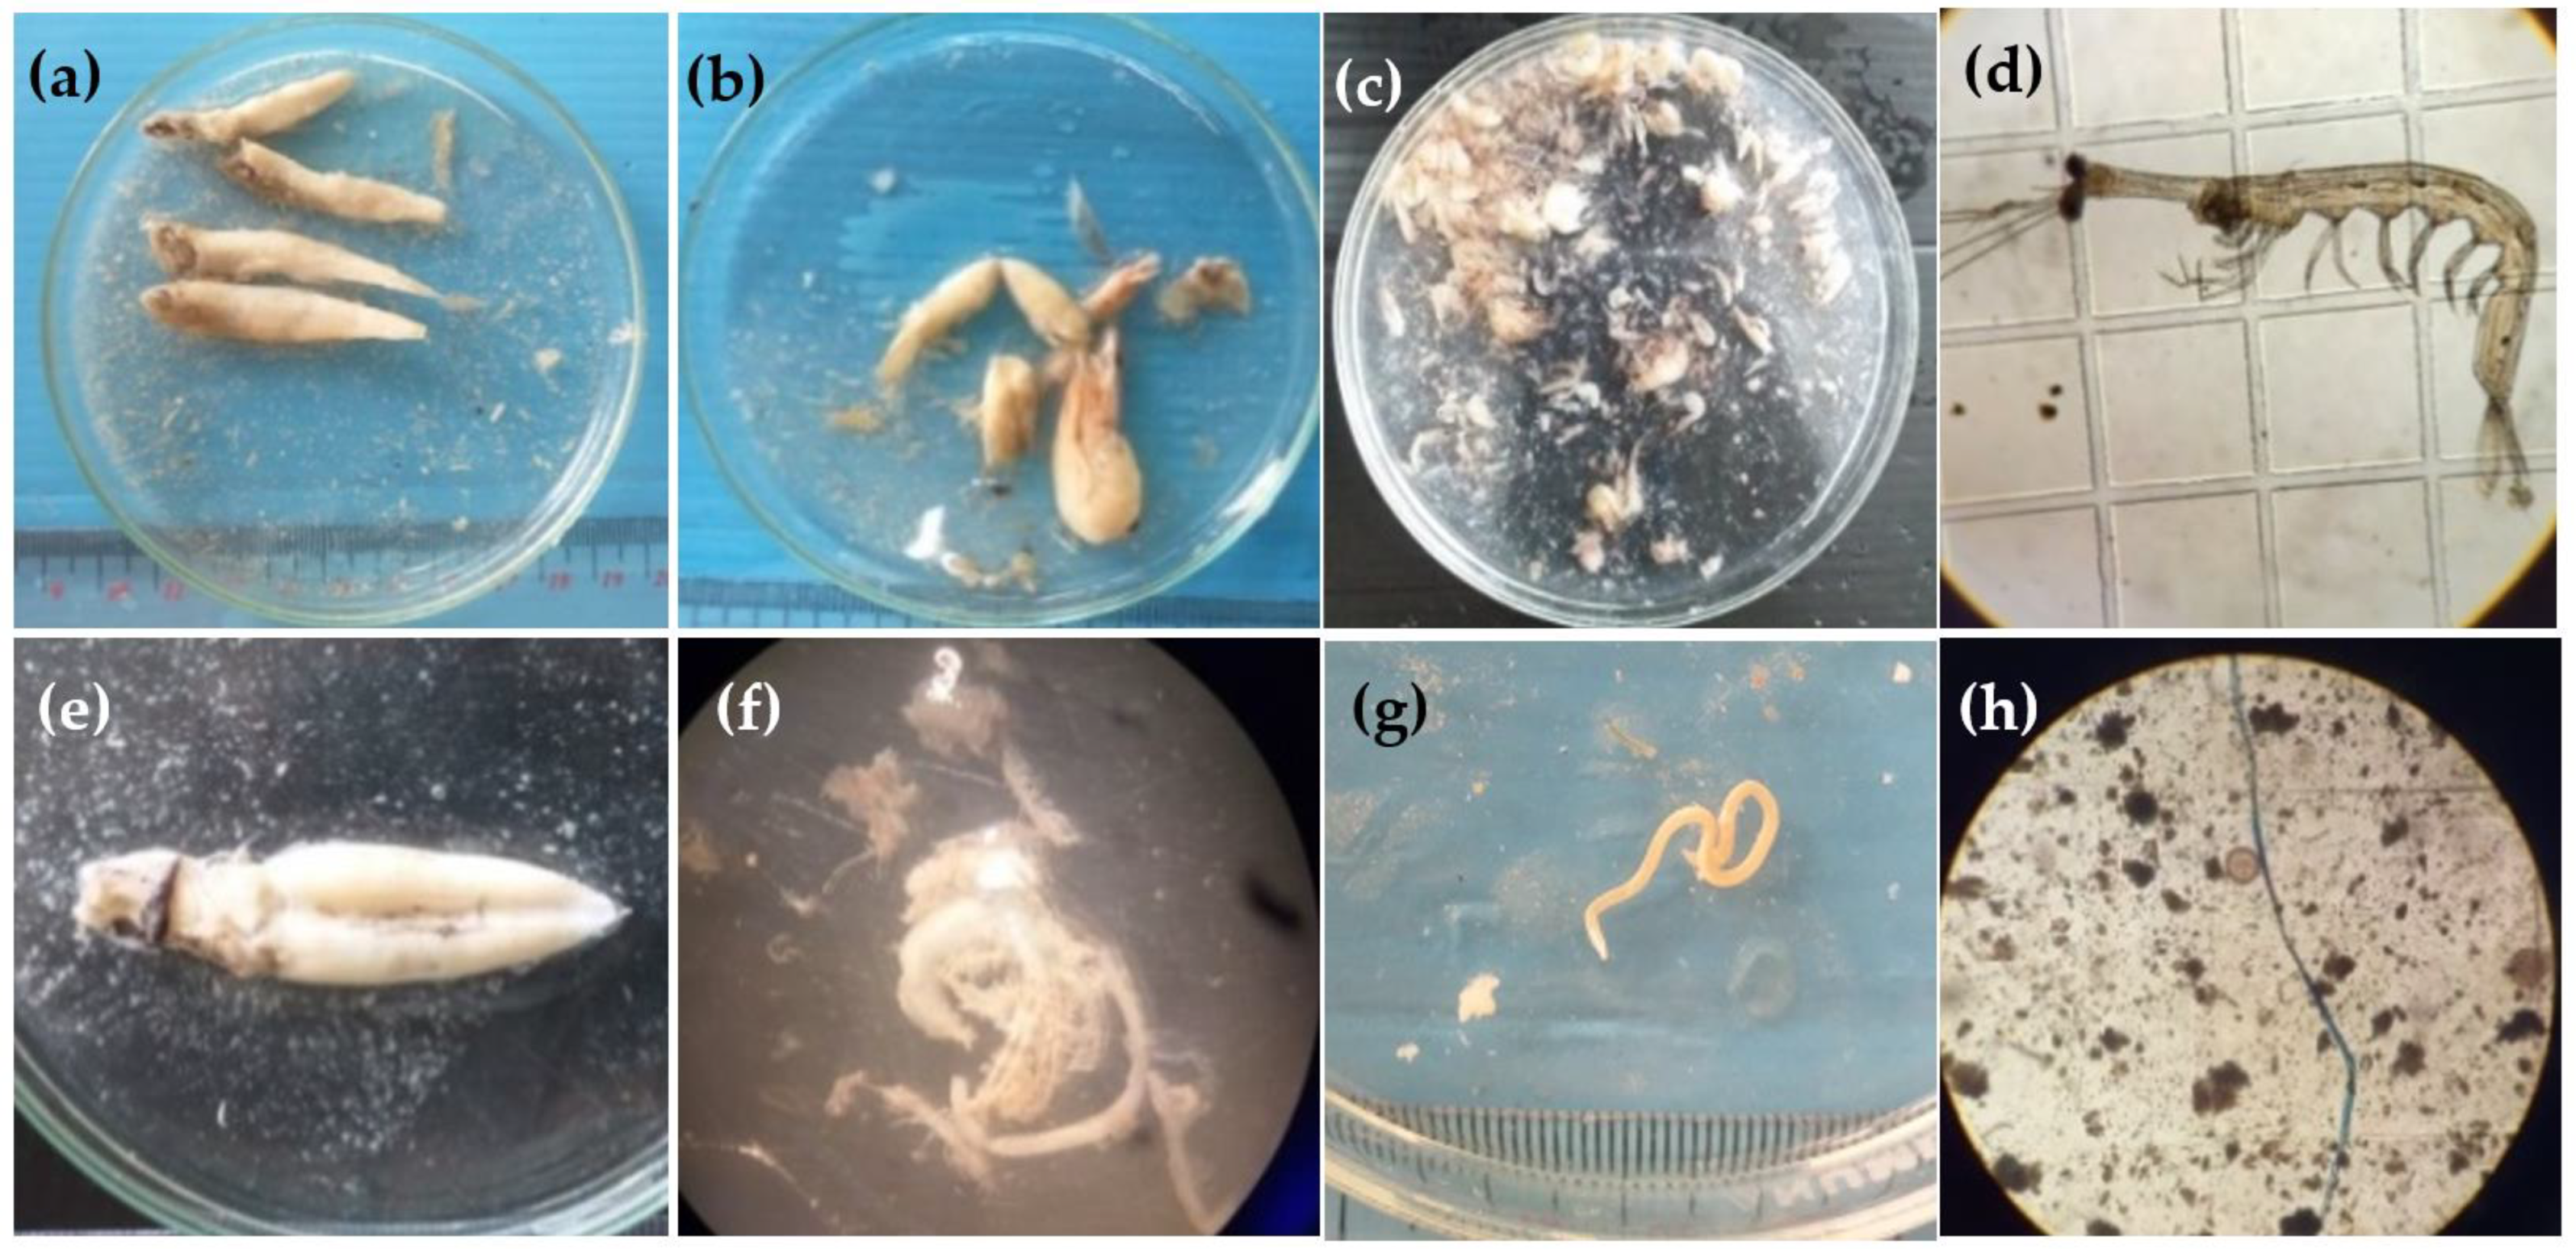
3.1. Food and Dominant Food Items
3.2. Spatial and Temporal Impacts of Depth and Season
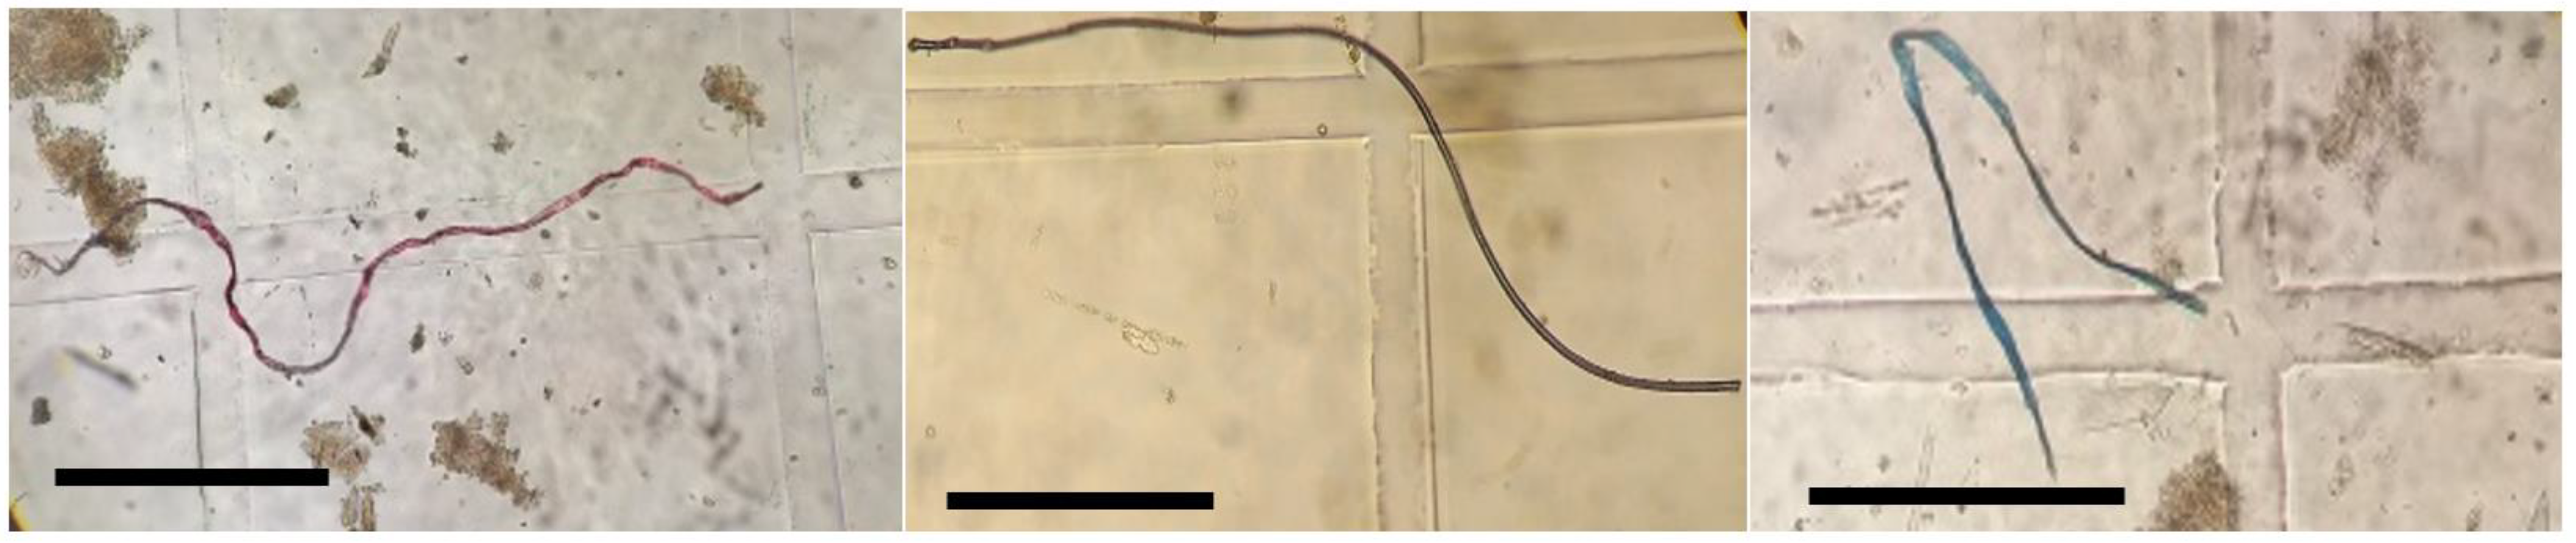
3.3. Ingestion of Anthropogenic Debris in Fish
4. Discussion
5. Conclusions
Author Contributions
Funding
Institutional Review Board Statement
Informed Consent Statement
Data Availability Statement
Acknowledgments
Conflicts of Interest
References
- Saikia, S.K. Food and feeding of fishes. What do we need to know? Transylv. Rev. Syst. Ecol. Res. 2015, 17, 71–84. [Google Scholar] [CrossRef] [Green Version]
- Hajisamae, S.; Chou, L.M.; Ibrahim, S. Feeding habits and trophic organization of the fish community in shallow waters of an impacted tropical habitat. Estuar. Coast. Shelf. Sci. 2003, 58, 89–98. [Google Scholar] [CrossRef]
- Cortés, E. A critical review of methods of studying fish feeding based on analysis of stomach contents: Application to elasmobranch fishes. Can. J. Fish. Aquat. Sci. 1997, 54, 726–738. [Google Scholar] [CrossRef]
- Baker, R.; Buckland, A.; Sheaves, M. 2014 Fish gut content analysis: Robust measure of diet composition. Fish Fish. 2014, 15, 170–177. [Google Scholar] [CrossRef]
- Pinkas, L. Food habits of albacore, bluefin tuna, and bonito in California waters. Fish. Bull. 1971, 152, 1–105. [Google Scholar]
- Blaber, S.J.M. Fish and Fisheries of Tropical Estuaries; Chapman and Hall: London, UK, 1997; pp. 1–388. [Google Scholar]
- Hajisamae, S. Trophic ecology of bottom fishes assemblage along coastal areas of Thailand. Estuar. Coast. Shelf Sci. 2009, 82, 503–514. [Google Scholar] [CrossRef]
- Dantas, D.V.; Barletta, M.; de Assis, A.R.J.; Lima, A.R.A.; da Costa, M.F. Seasonal diet shifts and overlap between two sympatric catfishes in an estuarine nursery. Estuaries Coast 2013, 36, 237–256. [Google Scholar] [CrossRef]
- de Medeiros, A.P.M.; de Amorim Xavier, J.H.; de Lucena Rosa, I.M. Diet and trophic organization of the fish assemblage from the Mamanguape River Estuary, Brazil. Lat. Am. J. Aquat. Res. 2017, 45, 879–890. [Google Scholar]
- Park, J.M.; Kwak, S.N.; Huh, S.H.; Han, I.S. Diets and niche overlap among nine co-occurring demersal fishes in the southern continental shelf of East/Japan Sea, Korea. Deep. Res. Part II Top. Stud. Oceanogr. 2017, 143, 100–109. [Google Scholar] [CrossRef]
- Carrassón, M.; Cartes, J.E. Trophic relationships in a Mediterranean deep-sea fish community: Partition of food resources, dietary overlap and connections within the benthic boundary layer. Mar. Ecol. Prog. Ser. 2002, 241, 41–55. [Google Scholar] [CrossRef] [Green Version]
- D’iglio, C.; Savoca, S.; Rinelli, P.; Spanò, N.; Capillo, G. Diet of the deep-sea shark Galeus melastomus Rafinesque, 1810, in the Mediterranean sea: What we know and what we should know. Sustainability 2021, 13, 3962. [Google Scholar] [CrossRef]
- Purcell, J.E.; Sturdevant, M.V. Prey selection and dietary overlap among zooplanktivorous jellyfish and juvenile fishes in Prince William Sound, Alaska. Mar. Ecol. Prog. Ser. 2001, 210, 67–83. [Google Scholar] [CrossRef] [Green Version]
- Soe, K.K.; Pradit, S.; Hajisamae, S. Feeding habits and seasonal trophic guilds structuring fish community in the bay mouth region of a tropical estuarine habitat. J. Fish. Biol. 2021, 99, 1430–1445. [Google Scholar] [CrossRef] [PubMed]
- Hajisamae, S.; Soe, K.K.; Pradit, S.; Chaiyvareesajja, J.; Fazrul, H. Feeding habits and microplastic ingestion of short mackerel, Rastrelliger brachysoma, in a tropical estuarine environment. Environ. Biol. Fishes 2022. [Google Scholar] [CrossRef]
- Capillo, G.; Savoca, S.; Panarello, G.; Mancuso, M.; Branca, C.; Romano, V.; D’Angelo, G.; Bottari, T.; Spanò, N. Quali-quantitative analysis of plastics and synthetic microfibers found in demersal species from Southern Tyrrhenian Sea (Central Mediterranean). Mar. Pollut. Bull. 2020, 150, 110596. [Google Scholar] [CrossRef]
- D’iglio, C.; Albano, M.; Tiralongo, F.; Famulari, S.; Rinelli, P.; Savoca, S.; Spanò, N.; Capillo, G. Biological and ecological aspects of the blackmouth catshark (Galeus melastomus Rafinesque, 1810) in the southern Tyrrhenian sea. J. Mar. Sci. Eng. 2021, 9, 967. [Google Scholar] [CrossRef]
- Anastasopoulou, A.; Kapiris, K. Feeding ecology of the shortnose greeneye Chlorophthalmus agassizi Bonaparte, 1840 (Pisces: Chlorophthalmidae) in the Eastern Ionian Sea (Eastern Mediterranean). J. Appl. Ichthyol. 2008, 24, 170–179. [Google Scholar] [CrossRef]
- Allan, J.D.; Castillo, M.M. Stream Ecology: Structure and Function of Running Waters, 2nd ed.; Chapman and Hall: New York, NY, USA, 2007; pp. 1–436. [Google Scholar]
- Barletta, M.; Lima, A.R.A.; Costa, M.F. Distribution, sources and consequences of nutrients, persistent organic pollutants, metals and microplastics in South American estuaries. Sci. Total Environ. 2019, 651, 1199–1218. [Google Scholar] [CrossRef]
- Santana, M.F.M.; Moreira, F.T.; Turra, A. Trophic transference of microplastics under a low exposure scenario: Insights on the likelihood of particle cascading along marine food-webs. Mar. Pollut. Bull. 2017, 121, 154–159. [Google Scholar] [CrossRef]
- Borges-Ramírez, M.M.; Mendoza-Franco, E.F.; Escalona-Segura, G.; Osten, J.R. Plastic density as a key factor in the presence of microplastic in the gastrointestinal tract of commercial fishes from Campeche Bay, Mexico. Environ. Pollut. 2020, 267, 115659. [Google Scholar] [CrossRef]
- Foley, C.J.; Feiner, Z.S.; Malinich, T.D.; Höök, T.O. A meta-analysis of the effects of exposure to microplastics on fish and aquatic invertebrates. Sci. Total Environ. 2018, 631–632, 550–559. [Google Scholar] [CrossRef] [PubMed] [Green Version]
- Lee, D.H.; Lee, S.; Rhee, J.S. Consistent exposure to microplastics induces age-specific physiological and biochemical changes in a marine mysid. Mar. Pollut. Bull. 2020, 162, 111850. [Google Scholar] [CrossRef] [PubMed]
- Pradit, S.; Nitiratsuwan, T.; Towatana, P.; Jualaong, S.; Sornplang, K.; Noppradit, P.; Jirajarus, M.; Darakai, Y.; Weerawong, C. Marine Debris Accumulation on the beach in Libong, a small island in Andaman Sea, Thailand. Appl. Ecol. Env. Res. 2020, 18, 5461–5474. [Google Scholar] [CrossRef]
- Ferreira, G.V.B.; Barletta, M.; Lima, A.R.A.; Dantas, D.V.; Justino, A.K.S.; Costa, M.F. Plastic debris contamination in the life cycle of Acoupa weakfish (Cynoscion acoupa) in a tropical estuary. ICES J. Mar. Sci. 2016, 73, 2695–2707. [Google Scholar] [CrossRef] [Green Version]
- Arthur, C.; Baker, J.; Bamford, H. (Eds.) The occurrence, effects and fate of small plastic debris in the oceans. In Proceedings of the International Research Workshop on the Occurrence, Effects and Fate of Microplastic Marine Debris, Tacoma, WA, USA, 9–11 September 2008; NOAA Technical Memorandum NOS-OR&R-30. University of Washington Tacoma: Tacoma, WA, USA, 2009. [Google Scholar]
- Wright, S.L.; Thompson, R.C.; Galloway, T.S. The physical impacts of microplastics on marine organisms: A review. Environ. Pollut. 2013, 178, 483–492. [Google Scholar] [CrossRef] [PubMed]
- Bessa, F.; Barría, P.; Neto, J.M.; Frias, J.P.G.L.; Otero, V.; Sobral, P.; Marques, J.C. Occurrence of Microplastics in Commercial Fish from a Natural Estuarine Environment. Mar. Pollut. Bull. 2018, 128, 575–584. [Google Scholar] [CrossRef]
- Kibria, G.; Nugegoda, D.; Haroon, A.K.Y. Microplastic pollution and contamination of seafood (including fish, sharks, mussels, oysters, shrimps and seaweeds): A Global overview. In Microplastic Pollution Emerging Contaminants and Associated Treatment Technologies; Hashmi, M.Z., Ed.; Springer Nature: Cham, Switzerland, 2022; pp. 277–322. [Google Scholar]
- Botterell, Z.L.R.; Beaumont, N.; Dorrington, T.; Steinke, M.; Thompson, R.C.; Lindeque, P.K. Bioavailability and effects of microplastics on marine zooplankton. Environ. Pollut. 2020, 245, 98–110. [Google Scholar] [CrossRef]
- Mizraji, R.; Ahrendt, C.; Perez-Venegas, D.; Vargas, J.; Pulgar, J.; Aldana, M.; Ojeda, F.P.; Duarte, C.; Galbán-Malagón, C. Is the feeding type related with the content of microplastics in intertidal fish gut? Mar. Pollut. Bull. 2017, 116, 489–500. [Google Scholar] [CrossRef]
- Chen, C.Y.; Lu, T.H.; Yang, Y.F.; Liao, C.M. Marine mussel-based biomarkers as risk indicators to assess oceanic region-specific microplastics impact potential. Ecol. Indic. 2021, 120, 106915. [Google Scholar] [CrossRef]
- Chinfak, N.; Sompongchaiyakul, P.; Charoenpong, C.; Shi, H.; Yeemin, T.; Zhang, J. Abundance, composition, and fate of microplastics in water, sediment, and shell fish in the Tapi-Phumduang River system and Bandon. Sci. Total Environ. 2021, 781, 146700. [Google Scholar] [CrossRef]
- Azad, S.M.O.; Towatana, P.; Pradit, S.; Patricia, B.G. Ingestion of microplastics by some commercial fishes in the lower Gulf of Thailand: A preliminary approach to ocean conservation. Int. J. Agric. Sci. Technol. 2018, 14, 1017–1032. [Google Scholar]
- Azad, S.M.O.; Towatana, P.; Pradit, S.; Patricia, B.G.; Hue, H.T.T.; Jualaong, S. First evidence of existence of microplastics in stomach of some commercial fishes in the lower Gulf of Thailand. Appl. Ecol. Environ. Res. 2018, 16, 7345–7360. [Google Scholar] [CrossRef]
- McGregor, S.; Strydom, N.A. Feeding ecology and microplastic ingestion in Chelon richardsonii (Mugilidae) associated with surf diatom Anaulus australis accumulations in a warm temperate South African surf zone. Mar. Pollut. Bull. 2020, 158, 111430. [Google Scholar] [CrossRef] [PubMed]
- Pedà, C.; Caccamo, L.; Fossi, M.C.; Gai, F.; Andaloro, F.; Genovese, L.; Perdichizzi, A.; Romeo, T.; Maricchiolo, G. Intestinal alterations in European sea bass Dicentrarchus labrax (Linnaeus, 1758) exposed to microplastics: Preliminary results. Environ. Pollut. 2016, 212, 251–256. [Google Scholar] [CrossRef] [PubMed]
- Pradit, S.; Noppradit, P.; Goh, B.P.; Sornplang, K.; Ong, M.C.; Towatana, P. Occurrence of microplastics and trace metals in fish and shrimp from Songkhla Lake, Thailand during the COVID-19 pandemic. J. Appl. Ecol. 2021, 19, 1085–1106. [Google Scholar] [CrossRef]
- Ramos, J.A.A.; Barletta, M.; Costa, M.F. Ingestion of nylon threads by Gerreidae while using a tropical estuary as foraging grounds. Aquat. Biol. 2012, 17, 29–34. [Google Scholar] [CrossRef] [Green Version]
- de Moura, M.S.; Vianna, M. A new threat: Assessing the main interactions between marine fish and plastic debris from a scientometric perspective. Rev. Fish Biol. Fish. 2020, 30, 623–636. [Google Scholar] [CrossRef]
- Lusher, A.; Hollman, P.; Mandoza-Hill, J. Microplastics in fisheries and aquaculture: Status of knowledge on their occurrence and implications for aquatic organisms and food safety. FAO Fish. Aquac. Tech. Pap. 2017, 615, 1–147. [Google Scholar]
- Carpenter, E.J.; Anderson, S.J.; Harvey, G.R.; Miklas, H.P.; Peck, B.B. Polystyrene spherules in coastal water. Science 1972, 178, 749–750. [Google Scholar] [CrossRef]
- Masura, J.; Baker, J.; Foster, G.; Arthur, C. Laboratory Methods for the Analysis of Microplastics in the Marine Environment: Recommendations for Quantifying Snythetic Particles in Waters and Sediment; NOAA Technical Memorandum NOS-OR&R-48; NOAA: Washington, DC, USA, 2015. [Google Scholar]
- Md Amin, R.; Sohaimi, E.S.; Anuar, S.T.; Bachok, Z. Microplastic ingestion by zooplankton in Terengganu coastal waters, southern South China Sea. Mar. Pollut. Bull. 2020, 150, 110616. [Google Scholar] [CrossRef]
- Chen, J.Y.S.; Lee, Y.C.; Walther, B.A. Microplastic contamination of three commonly consumed seafood species from Taiwan: A pilot study. Sustainability 2020, 12, 9543. [Google Scholar] [CrossRef]
- Brilliant, M.G.S.; MacDonald, B.A. Postingestive selection in the sea scallop, Placopecten magellanicus (Gmelin): The role of particle size and density. J. Exp. Mar. Biol. Ecol. 2000, 253, 211–227. [Google Scholar] [CrossRef]
- Chaiwanawut, C.; Hattha, K.; Duangmala, P. Patterns of rainfall in Pattani Province from 1982 to 2001. Songklanakarin. J. Sci. Technol. 2005, 27, 116–176. [Google Scholar]
- Soe, K.K.; Pradit, S.; Jaafar, Z.; Hajisamae, S. Effects of mesh size, fishing depth and season on the catch and discards of short mackerel Rastrelliger brachysoma gillnet fishery at the mouth of Pattani Bay, Thailand. Fish. Sci. 2021, 88, 15–27. [Google Scholar] [CrossRef]
- Santhanam, R.; Srinivasan, A. A Manual of Marine Zooplankton; Oxford & IBH Publishing: New Delhi, India, 1994; pp. 1–172. [Google Scholar]
- Steidinger, K.A.; Tangen, K. Dinoflagellates. In Identifying Marine Phytoplankton; Tomas, C.R., Ed.; Academic Press: London, UK, 1997; pp. 387–584. [Google Scholar]
- Brusca, R.C.; Brusca, G.J. Invertebrates, 2nd ed.; Sinauer Associates, Inc.: Sunderland, MA, USA, 2002; pp. 1–903. [Google Scholar]
- Ruppert, E.E.; Fox, R.S.; Barnes, R.D. Invertebrate Zoology, a Functional Evolutionary Approach, 7th ed.; Brooks/Cole-Thomson Learn: Belmont, CA, USA, 2004; pp. 11–126. [Google Scholar]
- Elliott, M.; Whitfield, A.K.; Potter, I.C.; Blaber, S.J.M.; Cyrus, D.P.; Nordlie, F.G.; Harrison, T.D. The guild approach to categorizing estuarine fish assemblages: A global review. Fish. Fish. 2007, 8, 241–268. [Google Scholar] [CrossRef]
- Ferreira, G.V.B.; Barletta, M.; Lima, A.R.A.; Morley, S.A.; Justino, A.K.S.; Costa, M.F. High intake rates of microplastics in a Western Atlantic predatory fish, and insights of a direct fishery effect. Environ. Pollut. 2018, 236, 706–717. [Google Scholar] [CrossRef]
- Hidalgo-Ruz, V.; Gutow, L.; Thompson, R.C.; Thiel, M. Microplastics in the marine environment: A review of the methods used for identification and quantification. Environ. Sci. Technol. 2012, 46, 3060–3075. [Google Scholar] [CrossRef]
- de Witte, B.; Devriese, L.; Bekaert, K.; Hoffman, S.; Vandermeersch, G.; Cooreman, K.; Robbens, K. Quality assessment of the blue mussel (Mytilus edulis): Comparison between commercial and wild types. Mar. Pollut. Bull. 2014, 85, 146–155. [Google Scholar] [CrossRef]
- Andrady, A.L. Microplastics in the marine environment. Mar. Pollut. Bull. 2011, 62, 1596–1605. [Google Scholar] [CrossRef]
- Hyslop, E.J. Stomach contents analysis—A review of methods and their application. J. Fish Biol. 1980, 1741, 411–429. [Google Scholar] [CrossRef] [Green Version]
- R Core Team. R: A Language and Environment for Statistical Computing; Version 3.6.2.; R Foundation for Statistical Computing: Vienna, Austria, 2020; Available online: https://www.R-project.org/ (accessed on 15 July 2020).
- Blaber, S.J.M. Tropical Estuarine Fishes: Ecology, Exploitation and Conservation; Blackwell Science: Oxford, UK, 2000; pp. 1–372. [Google Scholar]
- Unsworth, R.K.F.; Garrard, S.L.; de León, P.S.; Cullen, L.C.; Smith, D.J.; Sloman, K.A.; James, J.; Bell, J.J. Structuring of Indo-Pacific fish assemblages along the mangrove-seagrass continuum. Aquat. Biol. 2009, 5, 85–95. [Google Scholar] [CrossRef] [Green Version]
- Hajisamae, S.; Ibrahim, S. Seasonal and spatial variations of fish trophic guilds in a shallow, semi-enclosed tropical estuarine bay. Environ. Biol Fishes 2008, 82, 251–264. [Google Scholar] [CrossRef]
- Hajisamae, S.; Yeesin, P. Do habitat, month and environmental parameters affect shrimp assemblage in a shallow semi-enclosed tropical bay, Thailand? Raffles Bull. Zool. 2014, 62, 107–114. [Google Scholar]
- Hisam, F.; Hajisamae, S.; Ikhwanuddin, M.; Pradit, S. Distribution pattern and habitat shifts during ontogeny of the blue swimming crab, Portunus pelagicus (Linnaeus, 1758) (Brachyura, Portunidae). Crustaceana 2020, 93, 17–32. [Google Scholar] [CrossRef]
- Pusey, B.J.; Bradshaw, S.D. Diet and dietary overlap in fishes of temporary waters of southwestern Australia. Ecol. Freshw. Fish. 1996, 5, 183–194. [Google Scholar] [CrossRef]
- Paul, M.; Hajisamae, S.; Pradit, S.; Perngmark, P.; Islam, R. Trophic ecology of eight sympatric nemipterid fishes (Nemipteridae) in the lower part of the South China Sea. Turk. J. Fish. Aquat. Sc. 2017, 18, 277–287. [Google Scholar]
- Bakun, A. Active opportunist species as potential diagnostic markers for comparative tracking of complex marine ecosystem responses to global trends. ICES J. Mar. Sci. 2014, 71, 2281–2292. [Google Scholar] [CrossRef] [Green Version]
- Collard, F.; Gilbert, B.; Eppe, G.; Roos, L.; Compère, P.; Das, K.; Parmentier, E. Morphology of the filtration apparatus of three planktivorous fishes and relation with ingested anthropogenic particles. Mar. Pollut. Bull. 2017, 116, 182–191. [Google Scholar] [CrossRef]
- Pennino, M.G.; Bachiller, E.; Lloret-lloret, E.; Albo, M.; Esteban, A.; Jadaud, A.; Bellido, J.M.; Coll, M. Ingestion of microplastics and occurrence of parasite association in Mediterranean anchovy and sardine. Mar. Pollut. Bull. 2020, 158, 111399. [Google Scholar] [CrossRef]
- Pradit, S.; Towatana, P.; Nitiratsuwan, T.; Jualaong, S. Occurrence of microplastics on beach sediment at Libong, a Pristine Island in Andaman Sea, Thailand. Sci. Asia 2020, 46, 336–343. [Google Scholar] [CrossRef]
- Lima, A.R.A.; Costa, M.F.; Barletta, M. Distribution patterns of microplastics within the plankton of a tropical estuary. Environ. Res. 2014, 132, 146–155. [Google Scholar] [CrossRef] [PubMed]
- Klangnurak, W.; Chunniyom, S. Screening for microplastics in marine fish of Thailand: The accumulation of microplastics in the gastrointestinal tract of different foraging preferences. Sci. Total Environ. 2020, 781, 146700. [Google Scholar] [CrossRef] [PubMed]
- Jabeen, K.; Su, L.; Li, J.; Yang, D.; Tong, C.; Mu, J.; Shi, H. Microplastics and mesoplastics in fish from coastal and fresh waters of China. Environ. Pollut. 2017, 221, 141–149. [Google Scholar] [CrossRef]
- Sun, X.; Liang, J.; Zhu, M.; Zhao, Y.; Zhang, B. Microplastics in seawater and zooplankton from the Yellow Sea. Environ. Pollut. 2018, 242, 585–595. [Google Scholar] [CrossRef] [PubMed]
- Núñez, A.A.; Astorga, D.; Farías, L.C.; Bastidas, L. Microplastic pollution in seawater and marine organisms across the Tropical Eastern Pacific and Galápagos. Sci. Rep. 2021, 11, 6424. [Google Scholar] [CrossRef] [PubMed]
- de Sá, L.C.; Luís, L.G.; Guilhermino, L. Effects of microplastics on juveniles of the common goby (Pomatoschistus microps): Confusion with prey, reduction of the predatory performance and efficiency, and possible influence of developmental conditions. Environ. Pollut. 2015, 196, 359–362. [Google Scholar] [CrossRef] [PubMed]
- Shaw, D.G.; Day, R.H. Colour- and form-dependent loss of plastic micro-debris from the North Pacific Ocean. Mar. Pollut. Bull. 1994, 28, 39–43. [Google Scholar] [CrossRef]


| Family | Species | Sample (N) | Nonempty Stomach | Total Length (Mean ± SD) | AF (Mean ± SD) | Depth | Season | Feeding Features |
|---|---|---|---|---|---|---|---|---|
| p Value | ||||||||
| Clupeidae | Anodontostoma chacunda | 625 (48.1) | 193 | 12.9 ± 1.3 | 13 (1.7 ± 1.3) | 0.779 | 0.611 | Planktivore ** |
| Hilsa kelee | 136 (22.7) | 110 | 15.3 ± 1.7 | 13 (3.3 ± 1.3) | 0.0001 | <0.0001 | Planktivore ** | |
| Sardinella fimbriata | 211 (30.1) | 181 | 13.7 ± 0.8 | 14 (2.3 ± 1.2) | 0.036 | 0.071 | Planktivore ** | |
| S. gibbosa | 231 (30.4) | 218 | 13.5 ± 1.6 | 13 (1.7 ± 1.5) | 0.007 | <0.0001 | Lucifer feeder ** | |
| Engraulidae | Setipinna taty | 185 (20.6) | 49 | 13.9 ± 1.5 | 10 (1 ± 0.8) | 0.0008 | 0.032 | Lucifer feeder |
| Stolephorus commersonnii * | 18 (4.5) | 8 | 9.6 ± 1.9 | 5 (0.9 ± 0.4) | <0.0001 | 0.588 | Fish feeder | |
| S. waitei | 19 (4.8) | 6 | 8.5 ± 2.0 | 7 (1.5 ± 1.9) | 0.586 | 0.358 | Acetes feeder | |
| Thryssa hamiltonii | 325 (25) | 168 | 17.9 ± 1.8 | 9 (1.0 ± 0.4) | 0.791 | 0.075 | Shrimp feeder | |
| T. kammalensis | 148 (21.1) | 43 | 9.9 ± 0.9 | 10 (0.9 ± 0.7) | 0.036 | 0.059 | Acetes feeder ** | |
| T. setirostris | 59 (14.7) | 10 | 14.6 ± 0.9 | 4 (0.9 ± 0.3) | <0.0001 | <0.0001 | Shrimp feeder | |
| Chirocentridae | Chirocentrus nudus | 29 (5.8) | 27 | 29.9 ± 4.2 | 6 (1.0 ± 0.3) | 0.019 | 0.0001 | Piscivore |
| Pristigasteridae | Opisthopterus tardoore | 293 (22.5) | 100 | 14.8 ± 1.6 | 8 (0.8 ± 0.4) | 0.002 | 0.046 | Lucifer feeder |
| Synodontidae | Harpadon nehereus * | 116 (38.7) | 22 | 21.1 ± 1.6 | 3 (0.9 ± 0.4) | 0.755 | 0.763 | Piscivore |
| Carangidae | Alepes kleinii | 243 (20.3) | 121 | 12.0 ± 1.9 | 8 (0.7 ± 0.5) | 0.295 | 0.239 | Lucifer feeder |
| A. vari | 14 (2.3) | 10 | 13.1 ± 1.6 | 3 (0.8 ± 0.4) | 0.072 | 1.000 | Lucifer feeder | |
| Megalaspis cordyla | 184 (15.3) | 159 | 15.6 ± 2.3 | 7 (0.9 ± 0.5) | 0.559 | 0.113 | Piscivore ** | |
| Scomberoides tol | 23 (3.8) | 18 | 15.4 ± 2.4 | 5 (0.9 ± 0.4) | 0.664 | 0.891 | Piscivore | |
| Leiognathidae | Deveximentum insidiator | 102 (7.8) | 71 | 9.8 ± 2.5 | 10 (1.0 ± 1.2) | 0.312 | <0.001 | Lucifer feeder ** |
| Eubleekeria jonesi * | 40 (20) | 34 | 7.3 ± 0.8 | 9 (1.0 ± 1.7) | <0.001 | <0.001 | Planktivore | |
| E. splendens | 272 (20.9) | 146 | 7.5 ± 1.0 | 16 (1.7 ± 1.4) | 0.003 | 0.023 | Planktivore ** | |
| Leiognathus equula | 76 (5.8) | 61 | 9.2 ± 0.8 | 11 (0.6 ± 1.0) | 0.002 | 0.098 | Planktivore ** | |
| Nuchequula gerreoides | 41 (20.5) | 31 | 8.9 ± 1.2 | 6 (0.7 ± 0.9) | 0.002 | 0.098 | Zoobenthivore | |
| Photopectoralis bindus | 319 (26.6) | 191 | 9.4 ± 1.1 | 12 (0.5 ± 0.9) | 0.100 | 0.009 | Planktivore ** | |
| Sciaenidae | Dendrophysa russelii | 65 (6.5) | 32 | 12.3 ± 1.6 | 8 (0.7 ± 0.6) | 0.048 | 0.371 | Shrimp feeder |
| Johnius belangerii | 68 (13.6) | 35 | 14.7 ± 1.1 | 6 (0.7 ± 0.6) | 0.335 | 0.076 | Zoobenthivore | |
| J. borneensis | 167 (18.6) | 89 | 15.1 ± 1.3 | 9 (0.7 ± 0.6) | 0.011 | 0.001 | Zoobenthivore | |
| Otolithes ruber | 131 (13.1) | 36 | 18.3 ± 2.1 | 6 (0.9 ± 0.5) | 0.064 | 0.284 | Piscivore | |
| Panna microdon | 62 (8.9) | 39 | 20.6 ± 3.3 | 5 (0.8 ± 0.5) | 0.926 | 0.299 | Shrimp feeder | |
| Pennahia anea | 76 (15.2) | 12 | 14.0 ± 1.6 | 3 (0.9 ± 0.5) | 0.611 | 0.426 | Piscivore | |
| Polynemidae | Eleutheronema tetradactylum | 72 (6) | 53 | 21.9 ± 2.6 | 5 (1.1 ± 0.4) | 0.997 | 0.433 | Shrimp feeder |
| Mugilidae | Planiliza subviridis | 132 (14.7) | 39 | 17.7 ± 2.0 | 10 (0.8 ± 1.2) | 0.542 | 0.096 | Planktivore ** |
| Trichiuridae | Trichiurus lepturus | 62 (8.9) | 28 | 44.1 ± 5.3 | 2 (1.0 ± 0.0) | 0.427 | 0.431 | Piscivore |
| Scombridae | Rastrelliger brachysoma | 554 (42.6) | 552 | 16.4 ± 1.9 | 15 (3.8 ± 1.2) | 0.031 | 0.003 | Planktivore ** |
| Scomberomorus commerson | 380 (29.2) | 344 | 21.1 ± 4.3 | 7 (1.0 ± 0.2) | 0.033 | 0.799 | Piscivore | |
| Species | Deb | Fish | Luc | Shri | Acet | Cop | other | Poly | Nem | Cosc | Diat | Dino | Stom | Squid | Crus | Crab | Sagi | Bri | Sea | Moll | Amp | Mis |
|---|---|---|---|---|---|---|---|---|---|---|---|---|---|---|---|---|---|---|---|---|---|---|
| A. chacunda | 1.7 | 0.0 | 0.0 | 0.0 | 0.0 | 8.3 | 38.0 | 1.2 | 7.5 | 25.5 | 11.9 | 3.4 | 0.0 | 0.0 | 0.4 | 0.0 | 0.0 | 0.0 | 0.0 | 1.4 | 0.0 | 0.6 |
| H. kelee | 0.1 | 0.0 | 0.0 | 1.0 | 0.0 | 22.7 | 2.1 | 0.3 | 0.1 | 37.0 | 23.3 | 12.6 | 0.0 | 0.0 | 0.3 | 0.0 | 0.0 | 0.0 | 0.0 | 0.4 | 0.0 | 0.1 |
| S. fimbriata | 2.5 | 0.0 | 11.6 | 2.4 | 0.0 | 45.5 | 0.1 | 1.4 | 0.7 | 16.8 | 15.8 | 1.1 | 0.0 | 0.0 | 0.0 | 0.5 | 0.0 | 0.0 | 0.0 | 1.4 | 0.0 | 0.1 |
| S. gibbosa | 0.0 | 0.0 | 35.5 | 0.3 | 0.0 | 16.8 | 1.1 | 3.4 | 0.0 | 23.3 | 15.2 | 3.4 | 0.0 | 0.0 | 0.1 | 0.2 | 0.0 | 0.0 | 0.0 | 0.6 | 0.0 | 0.1 |
| S. taty | 0.0 | 0.0 | 61.4 | 21.9 | 7.1 | 0.0 | 0.0 | 3.6 | 0.0 | 1.7 | 0.0 | 0.0 | 0.0 | 0.0 | 3.4 | 0.0 | 0.0 | 0.0 | 0.0 | 0.9 | 0.0 | 0.0 |
| S. commersonnii | 0.0 | 57.1 | 14.3 | 0.0 | 0.0 | 14.3 | 0.0 | 0.0 | 0.0 | 14.3 | 0.0 | 0.0 | 0.0 | 0.0 | 0.0 | 0.0 | 0.0 | 0.0 | 0.0 | 0.0 | 0.0 | 0.0 |
| S. waitei | 0.0 | 0.0 | 17.5 | 0.0 | 36.8 | 20.2 | 0.0 | 0.0 | 0.0 | 18.4 | 7.0 | 0.0 | 0.0 | 0.0 | 0.0 | 0.0 | 0.0 | 0.0 | 0.0 | 0.0 | 0.0 | 0.0 |
| T. hamiltonii | 0.0 | 33.2 | 2.0 | 33.5 | 18.1 | 0.0 | 8.6 | 0.7 | 0.0 | 0.0 | 0.0 | 0.0 | 2.8 | 0.0 | 0.0 | 0.0 | 0.0 | 0.0 | 0.0 | 1.2 | 0.0 | 0.0 |
| T. kammalensis | 3.8 | 0.0 | 0.0 | 30.8 | 50.0 | 0.0 | 0.0 | 0.0 | 0.0 | 3.8 | 0.0 | 0.0 | 0.0 | 0.0 | 0.0 | 0.0 | 0.0 | 0.0 | 0.0 | 0.0 | 11.5 | 0.0 |
| T. setirostris | 0.0 | 0.0 | 22.2 | 44.4 | 0.0 | 0.0 | 0.0 | 0.0 | 0.0 | 0.0 | 0.0 | 0.0 | 33.3 | 0.0 | 0.0 | 0.0 | 0.0 | 0.0 | 0.0 | 0.0 | 0.0 | 0.0 |
| C. nudus | 0.0 | 79.4 | 0.0 | 15 | 1.8 | 0.0 | 0.0 | 0.0 | 0.0 | 0.0 | 0.0 | 0.0 | 0.0 | 3.8 | 0.0 | 0.0 | 0.0 | 0.0 | 0.0 | 0.0 | 0.0 | 0.0 |
| O. tardoore | 0.0 | 2.8 | 47.2 | 25.5 | 22.4 | 0.2 | 0.0 | 0.0 | 0.0 | 0.1 | 0.0 | 0.0 | 0.0 | 0.0 | 0.0 | 0.0 | 0.0 | 0.0 | 1.7 | 0.0 | 0.0 | 0.0 |
| H. nehereus | 0.0 | 89.5 | 0.0 | 10.5 | 0.0 | 0.0 | 0.0 | 0.0 | 0.0 | 0.0 | 0.0 | 0.0 | 0.0 | 0.0 | 0.0 | 0.0 | 0.0 | 0.0 | 0.0 | 0.0 | 0.0 | 0.0 |
| A. kleinii | 0.0 | 0.0 | 87.0 | 0.8 | 6.8 | 0.0 | 0.0 | 2.3 | 0.0 | 0.0 | 0.0 | 0.0 | 0.0 | 0.0 | 1.7 | 0.0 | 0.0 | 0.0 | 1.4 | 0.0 | 0.0 | 0.0 |
| A. vari | 0.0 | 0.0 | 100.0 | 0.0 | 0.0 | 0.0 | 0.0 | 0.0 | 0.0 | 0.0 | 0.0 | 0.0 | 0.0 | 0.0 | 0.0 | 0.0 | 0.0 | 0.0 | 0.0 | 0.0 | 0.0 | 0.0 |
| M. cordyla | 1.2 | 80.9 | 1.5 | 0.8 | 10.3 | 0.0 | 4.6 | 0.0 | 0.0 | 0.0 | 0.0 | 0.0 | 0.0 | 0.0 | 0.4 | 0.0 | 0.0 | 0.0 | 0.0 | 0.4 | 0.0 | 0.0 |
| S. tol | 0.0 | 57.7 | 20.0 | 2.3 | 20.0 | 0.0 | 0.0 | 0.0 | 0.0 | 0.0 | 0.0 | 0.0 | 0.0 | 0.0 | 0.0 | 0.0 | 0.0 | 0.0 | 0.0 | 0.0 | 0.0 | 0.0 |
| D. insidiator | 3.0 | 0.0 | 53.0 | 0.0 | 2.8 | 12.6 | 0.0 | 2.8 | 0.0 | 7.4 | 13.7 | 1.4 | 0.0 | 0.0 | 0.0 | 3.5 | 0.0 | 0.0 | 0.0 | 0.0 | 0.0 | 0.0 |
| E. jonesi | 0.0 | 0.0 | 3.5 | 0.0 | 0.0 | 36.1 | 4.6 | 0.0 | 2.6 | 36.9 | 4.7 | 0.0 | 0.0 | 0.0 | 1.3 | 0.0 | 0.0 | 0.0 | 0.0 | 10.3 | 0.0 | 0.0 |
| E. splendens | 2.6 | 0.0 | 1.6 | 0.0 | 0.0 | 11.2 | 7.2 | 1.3 | 0.7 | 8.3 | 60.0 | 2.7 | 0.0 | 0.0 | 0.1 | 0.2 | 1.0 | 0.0 | 0.8 | 0.4 | 0.0 | 1.8 |
| L. equula | 7.9 | 0.0 | 11.4 | 0.0 | 0.0 | 22.5 | 1.8 | 16.4 | 0.3 | 4.9 | 24.1 | 4.3 | 0.0 | 0.0 | 1.3 | 0.0 | 0.0 | 0.0 | 0.0 | 0.0 | 0.0 | 5.2 |
| N. gerreoides | 0.0 | 0.0 | 0.0 | 0.0 | 0.0 | 2.6 | 2.8 | 33.8 | 0.0 | 28.4 | 0.0 | 0.0 | 0.0 | 0.0 | 0.8 | 0.0 | 0.0 | 0.0 | 0.0 | 9.9 | 21.5 | 0.0 |
| P. bindus | 10.1 | 0.0 | 8.5 | 0.0 | 0.0 | 10.8 | 0.9 | 7.4 | 0.3 | 1.9 | 48.1 | 0.6 | 0.0 | 0.0 | 0.3 | 0.0 | 1.7 | 0.6 | 0.0 | 0.4 | 0.8 | 7.7 |
| D. russelii | 0.0 | 20.3 | 0.0 | 50.3 | 5.9 | 0.0 | 0.0 | 5.9 | 0.6 | 0.0 | 0.0 | 0.0 | 0.0 | 5.9 | 0.0 | 8.2 | 0.0 | 0.0 | 0.0 | 0.0 | 0.0 | 2.9 |
| J. belangerii | 0.0 | 7.1 | 0.0 | 30.2 | 0.0 | 0.0 | 0.0 | 37.7 | 0.0 | 0.0 | 0.0 | 0.0 | 0.0 | 0.0 | 17.9 | 7.1 | 0.0 | 0.0 | 0.0 | 0.0 | 0.0 | 0.0 |
| J. borneensis | 0.0 | 15.7 | 0.0 | 15.0 | 0.0 | 0.0 | 0.0 | 50.8 | 1.4 | 0.0 | 0.0 | 0.0 | 0.0 | 0.0 | 3.5 | 7.9 | 0.0 | 0.5 | 0.0 | 3.9 | 0.0 | 1.4 |
| O. ruber | 0.0 | 50.0 | 0.0 | 32.1 | 5.3 | 0.0 | 0.0 | 0.0 | 0.0 | 0.0 | 0.0 | 0.0 | 3.6 | 3.6 | 0.0 | 0.0 | 0.0 | 0.0 | 0.0 | 0.0 | 0.0 | 5.4 |
| P. microdon | 0.0 | 13.5 | 0.0 | 63.6 | 0.0 | 0.0 | 0.0 | 2.1 | 0.0 | 0.0 | 0.0 | 0.0 | 0.0 | 0.0 | 0.0 | 2.1 | 0.0 | 0.0 | 0.0 | 0.0 | 0.0 | 18.6 |
| P. anea | 0.0 | 87.3 | 0.0 | 12.7 | 0.0 | 0.0 | 0.0 | 0.0 | 0.0 | 0.0 | 0.0 | 0.0 | 0.0 | 0.0 | 0.0 | 0.0 | 0.0 | 0.0 | 0.0 | 0.0 | 0.0 | 0.0 |
| E. tetradactylum | 0.0 | 25.3 | 0.0 | 71.6 | 1.4 | 0.0 | 0.0 | 0.0 | 0.0 | 0.0 | 0.0 | 0.0 | 1.7 | 0.0 | 0.0 | 0.0 | 0.0 | 0.0 | 0.0 | 0.0 | 0.0 | 0.0 |
| P. subviridis | 5.0 | 0.0 | 0.0 | 0.0 | 0.0 | 10.6 | 13.8 | 1.8 | 1.2 | 35.5 | 16.2 | 4.9 | 0.0 | 0.0 | 0.5 | 0.0 | 0.0 | 0.0 | 0.0 | 1.5 | 0.0 | 8.9 |
| T. lepturus | 0.0 | 100.0 | 0.0 | 0.0 | 0.0 | 0.0 | 0.0 | 0.0 | 0.0 | 0.0 | 0.0 | 0.0 | 0.0 | 0.0 | 0.0 | 0.0 | 0.0 | 0.0 | 0.0 | 0.0 | 0.0 | 0.0 |
| R. brachysoma | 0.4 | 0.0 | 1.3 | 0.1 | 0.0 | 47.3 | 0.9 | 0.3 | 0.1 | 20.9 | 17.0 | 8.0 | 0.0 | 0.0 | 0.3 | 0.2 | 0.0 | 0.0 | 0.0 | 2.9 | 0.0 | 0.3 |
| S. commerson | 0.0 | 99.4 | 0.0 | 0.5 | 0.0 | 0.0 | 0.0 | 0.0 | 0.0 | 0.0 | 0.0 | 0.0 | 0.0 | 0.0 | 0.0 | 0.0 | 0.0 | 0.0 | 0.0 | 0.0 | 0.0 | 0.0 |
| Average | 1.1 | 24.1 | 14.7 | 13.4 | 5.6 | 8.3 | 2.5 | 5.1 | 0.5 | 8.4 | 7.6 | 1.2 | 1.2 | 0.4 | 1.0 | 0.9 | 0.1 | 0.03 | 0.1 | 1.0 | 1.0 | 1.6 |
| Factor | df | MS | F Value | p Value | |
|---|---|---|---|---|---|
| Ingestion of anthropogenic debris in fish | Depth (d) | 2 | 0.02 | 0.17 | 0.840 |
| Season (s) | 2 | 1.25 | 12.97 | <0.0001 | |
| d × s | 4 | 0.17 | 1.76 | 0.135 | |
| Ingestion of anthropogenic debris in four feeding features | Feeder (f) | 3 | 1.21 | 3.23 | <0.022 |
| Colour of anthropogenic debris in fish stomach | Debris colour (c) | 4 | 4.05 | 5.38 | <0.001 |
| Food items (AF) | Depth (d) | 2 | 1.13 | 3.98 | 0.019 |
| Season (m) | 2 | 10.99 | 38.67 | <0.0001 | |
| d × s | 4 | 1.49 | 5.23 | <0.001 |
| Species | Examined Fish | % of Debris in Fish | No. of Items | Items/Fish | Length of Debris (mm) | Blue | Green | Red | Black | White |
|---|---|---|---|---|---|---|---|---|---|---|
| A. chacunda | 193 (9) | 4.7 | 195 | 1.00 ± 4.9 | 1–3 | 0 | 170 | 25 | 0 | 0 |
| H. kelee | 110 (3) | 2.7 | 60 | 0.50 ± 3.5 | <1.0 | 10 | 20 | 30 | 0 | 0 |
| S. fimbriata | 181 (4) | 2.2 | 120 | 0.70 ± 5.9 | 1–3 | 0 | 120 | 0 | 0 | 0 |
| S. gibbosa | 218 (4) | 1.8 | 135 | 0.60 ± 5.6 | 1–3 | 75 | 0 | 60 | 0 | 0 |
| T. kammalensis | 43 (1) | 2.3 | 1 | 0.02 ± 0.2 | 1–2 | 1 | 0 | 0 | 0 | 0 |
| M. cordyla | 159 (1) | 0.6 | 1 | 0.01 ± 0.1 | 3 cm | 0 | 0 | 0 | 0 | 1 |
| D. insidiator | 71 (2) | 2.8 | 30 | 0.40 ± 2.5 | 1–2 | 20 | 10 | 0 | 0 | 0 |
| E. splendens | 146 (12) | 8.2 | 210 | 1.40 ± 5.1 | <1.0–2.0 | 80 | 35 | 25 | 70 | 0 |
| L. equula | 61 (3) | 4.9 | 45 | 0.70 ± 3.3 | 1–2 | 10 | 0 | 15 | 20 | 0 |
| P. bindus | 191 (9) | 4.7 | 180 | 0.90 ± 4.5 | <1.0–2.0 | 120 | 0 | 60 | 0 | 0 |
| P. subviridis | 39 (2) | 5.1 | 45 | 1.20 ± 5.3 | <1.0 | 45 | 0 | 0 | 0 | 0 |
| R. brachysoma | 552 (17) | 3.1 | 1455 | 2.60 ± 16.4 | 0.5–3 | 955 | 260 | 240 | 0 | 0 |
| Total | 1964 (67) | 3.4 | 2477 | 1.30 ± 9.5 | - | 1316 | 615 | 455 | 90 | 1 |
Publisher’s Note: MDPI stays neutral with regard to jurisdictional claims in published maps and institutional affiliations. |
© 2022 by the authors. Licensee MDPI, Basel, Switzerland. This article is an open access article distributed under the terms and conditions of the Creative Commons Attribution (CC BY) license (https://creativecommons.org/licenses/by/4.0/).
Share and Cite
Soe, K.K.; Hajisamae, S.; Sompongchaiyakul, P.; Towatana, P.; Pradit, S. Feeding Habits and the Occurrence of Anthropogenic Debris in the Stomach Content of Marine Fish from Pattani Bay, Gulf of Thailand. Biology 2022, 11, 331. https://doi.org/10.3390/biology11020331
Soe KK, Hajisamae S, Sompongchaiyakul P, Towatana P, Pradit S. Feeding Habits and the Occurrence of Anthropogenic Debris in the Stomach Content of Marine Fish from Pattani Bay, Gulf of Thailand. Biology. 2022; 11(2):331. https://doi.org/10.3390/biology11020331
Chicago/Turabian StyleSoe, Kay Khine, Sukree Hajisamae, Penjai Sompongchaiyakul, Prawit Towatana, and Siriporn Pradit. 2022. "Feeding Habits and the Occurrence of Anthropogenic Debris in the Stomach Content of Marine Fish from Pattani Bay, Gulf of Thailand" Biology 11, no. 2: 331. https://doi.org/10.3390/biology11020331
APA StyleSoe, K. K., Hajisamae, S., Sompongchaiyakul, P., Towatana, P., & Pradit, S. (2022). Feeding Habits and the Occurrence of Anthropogenic Debris in the Stomach Content of Marine Fish from Pattani Bay, Gulf of Thailand. Biology, 11(2), 331. https://doi.org/10.3390/biology11020331