
Agent-Based Modeling of Autosomal Recessive Deafness 1A (DFNB1A) Prevalence with Regard to Intensity of Selection Pressure in Isolated Human Population

 , , , , ,
  and
and 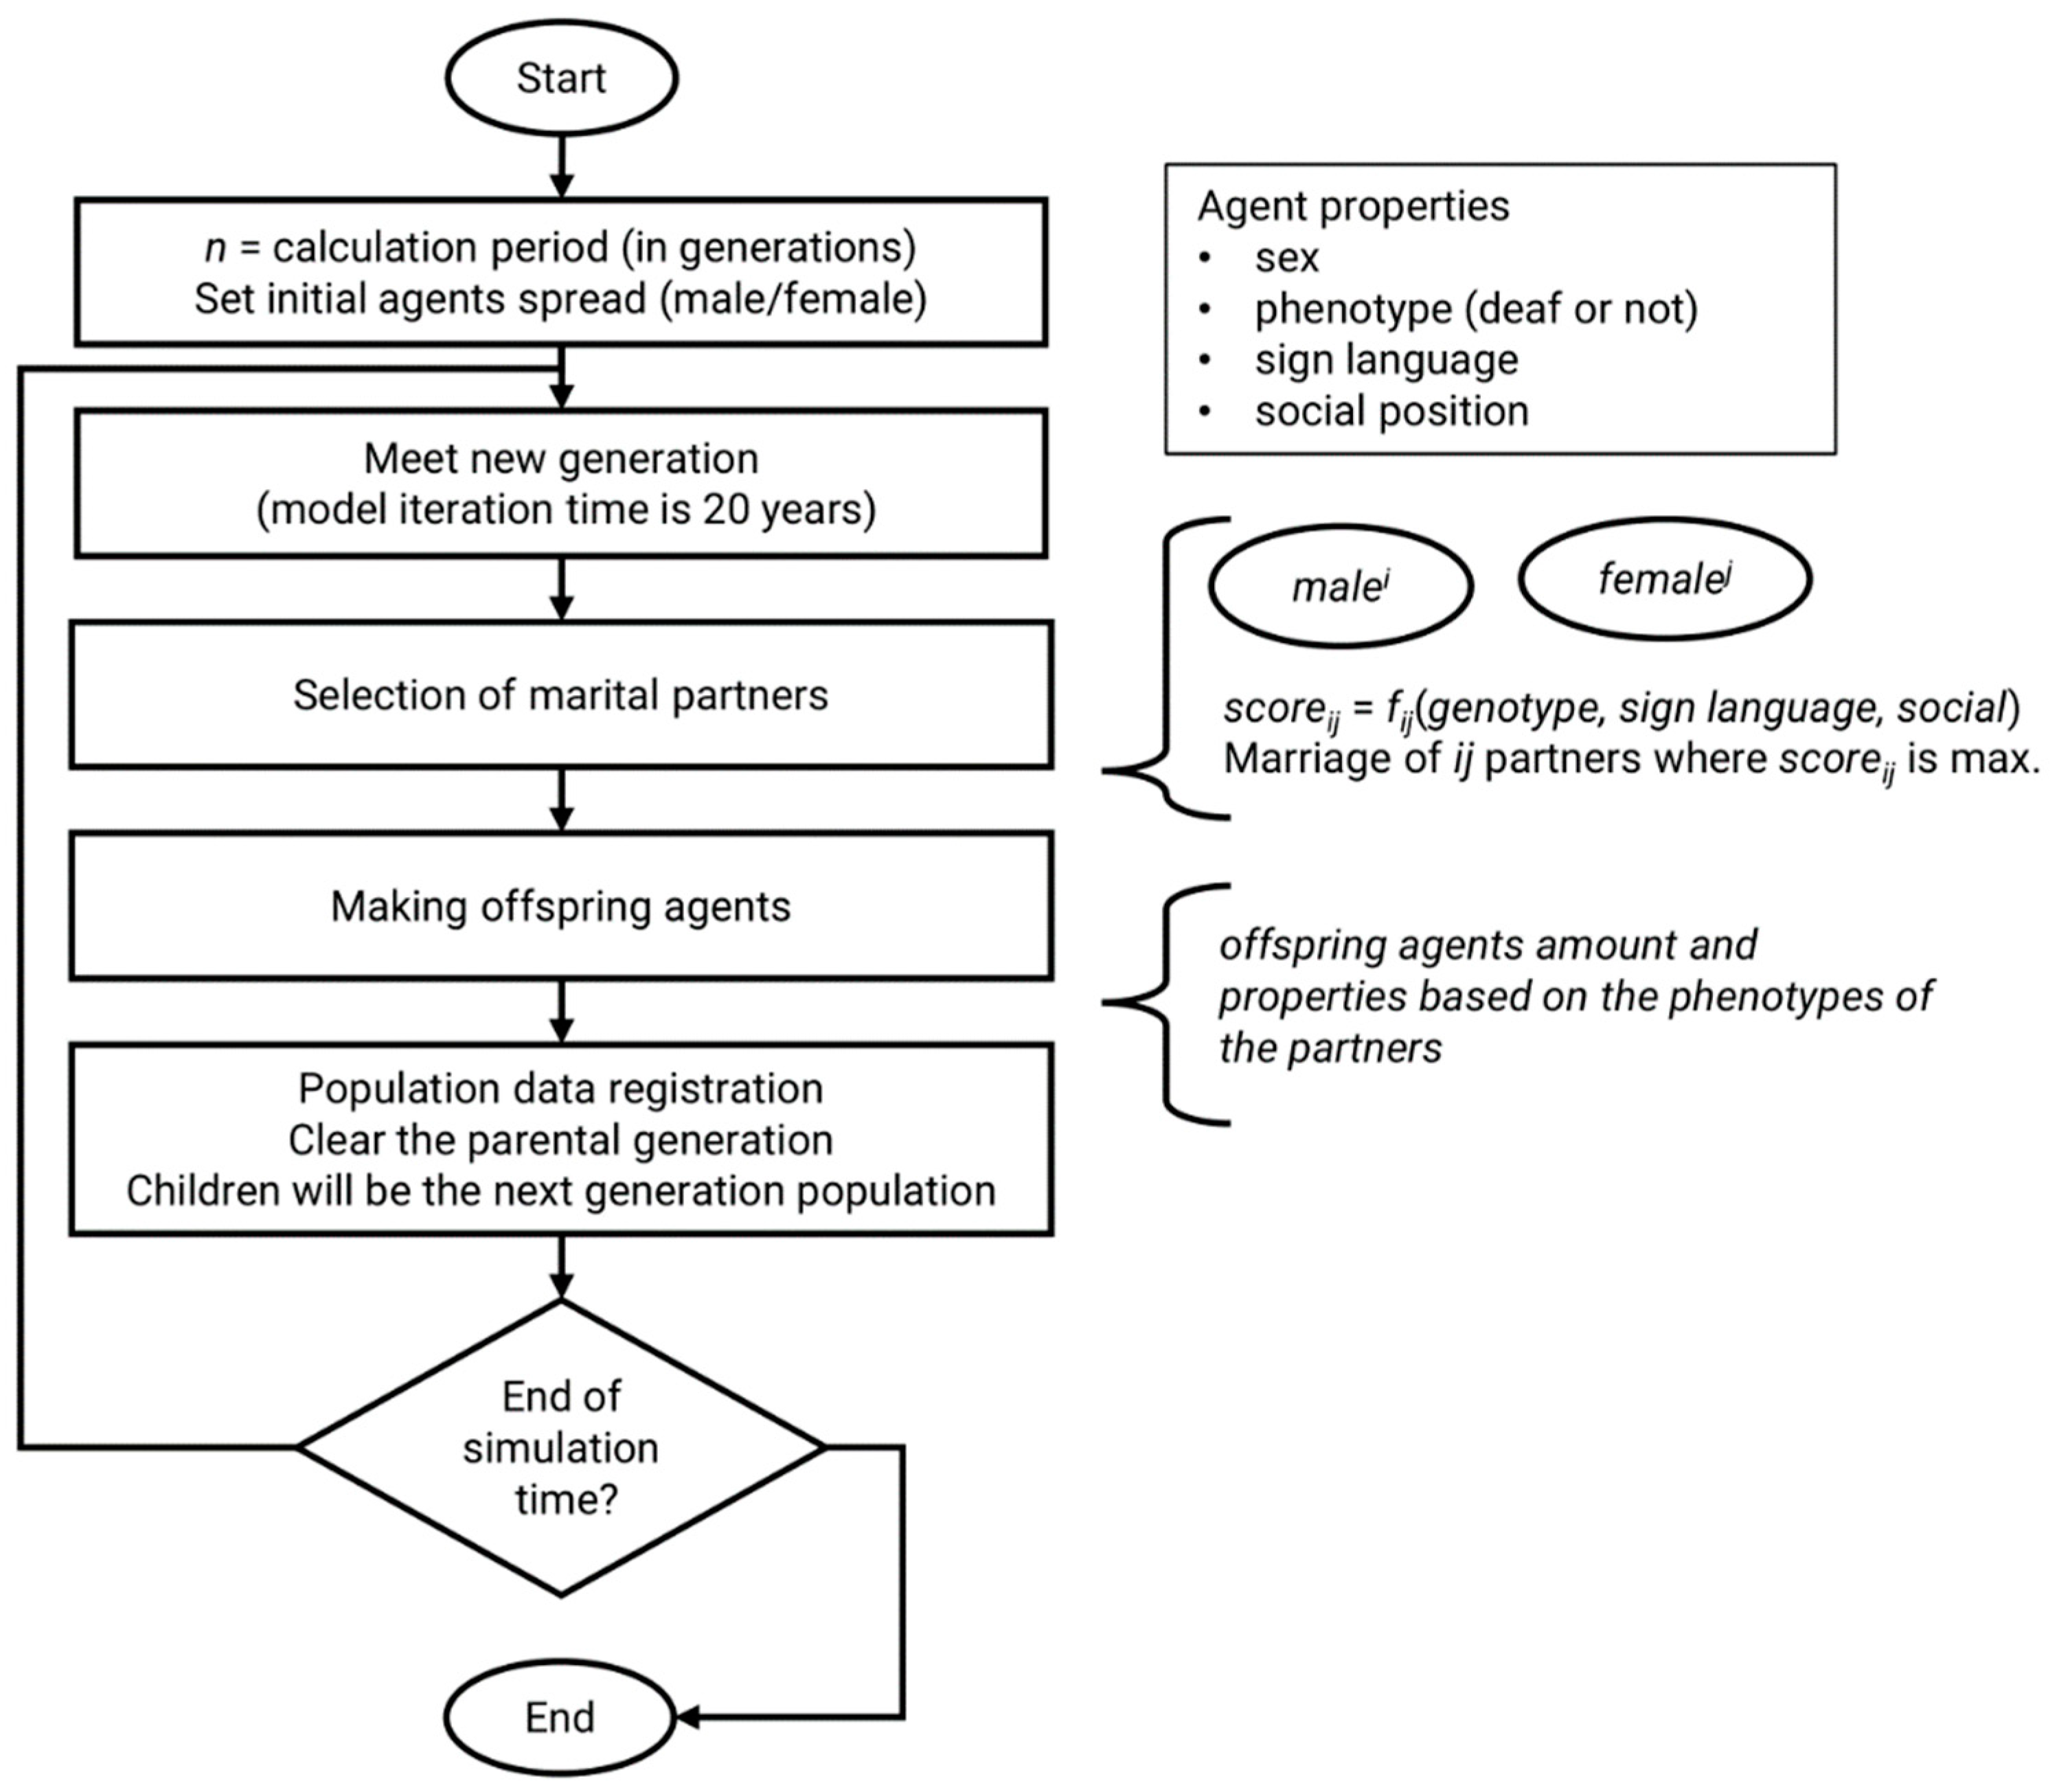
Simple Summary
Abstract
1. Introduction
2. Materials and Methods
2.1. Reference Population
2.2. The Model
- -
- sex—male or female; main criterion in marriage step of model algorithm;
- -
- genotype with two alleles—each allele can be mutant or normal;
- -
- phenotype—true if agent is deaf, false if agent is hearing;
- -
- sign language—knowledge of sign language (true/false).
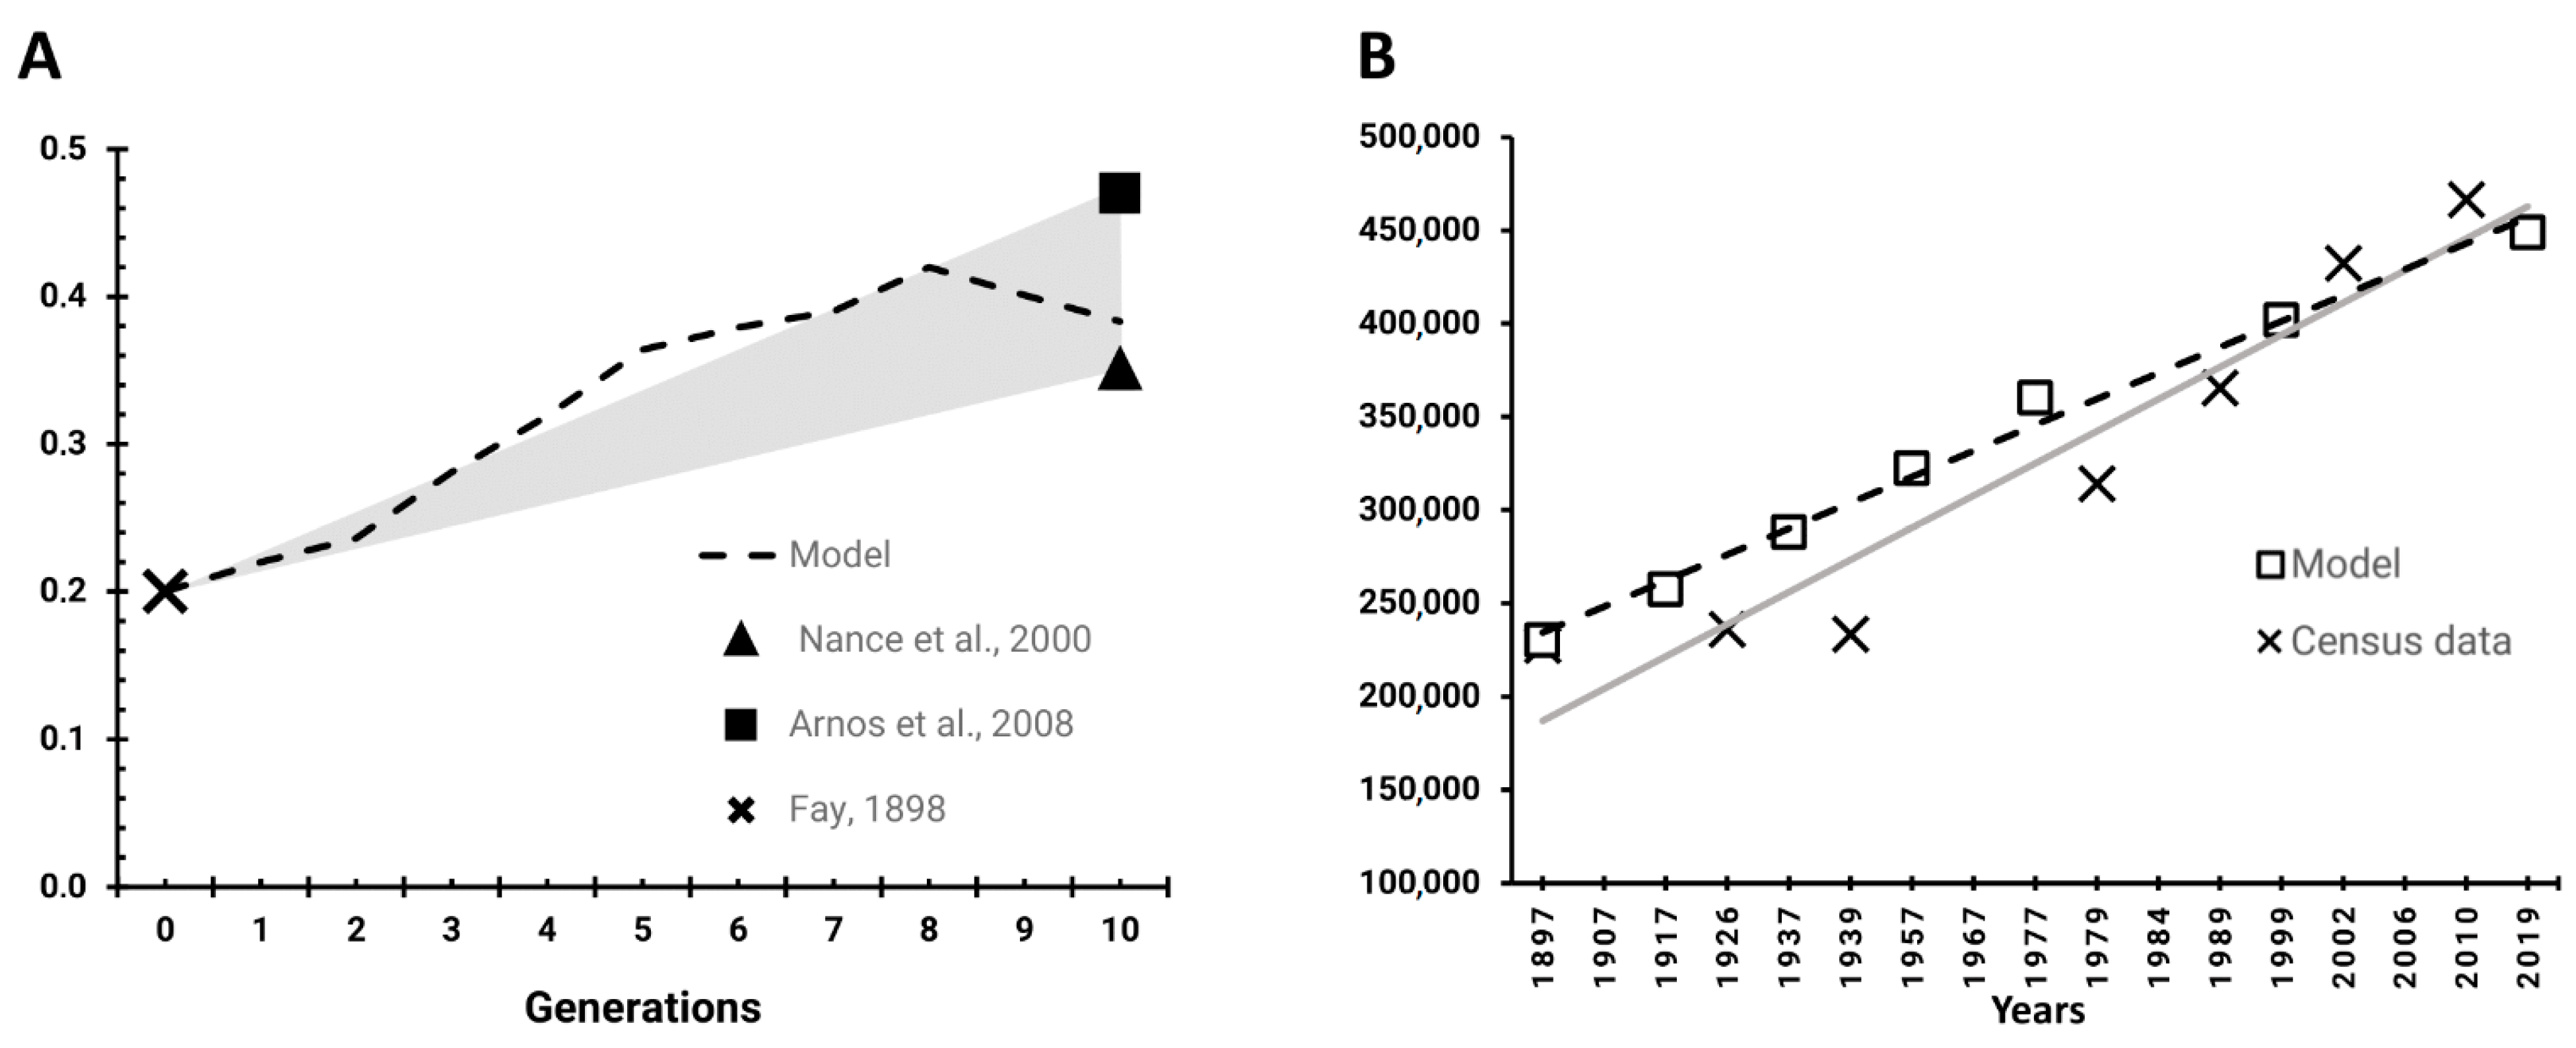
2.3. Verification and Validation of the Model
2.4. Simulation Scenarios
3. Results
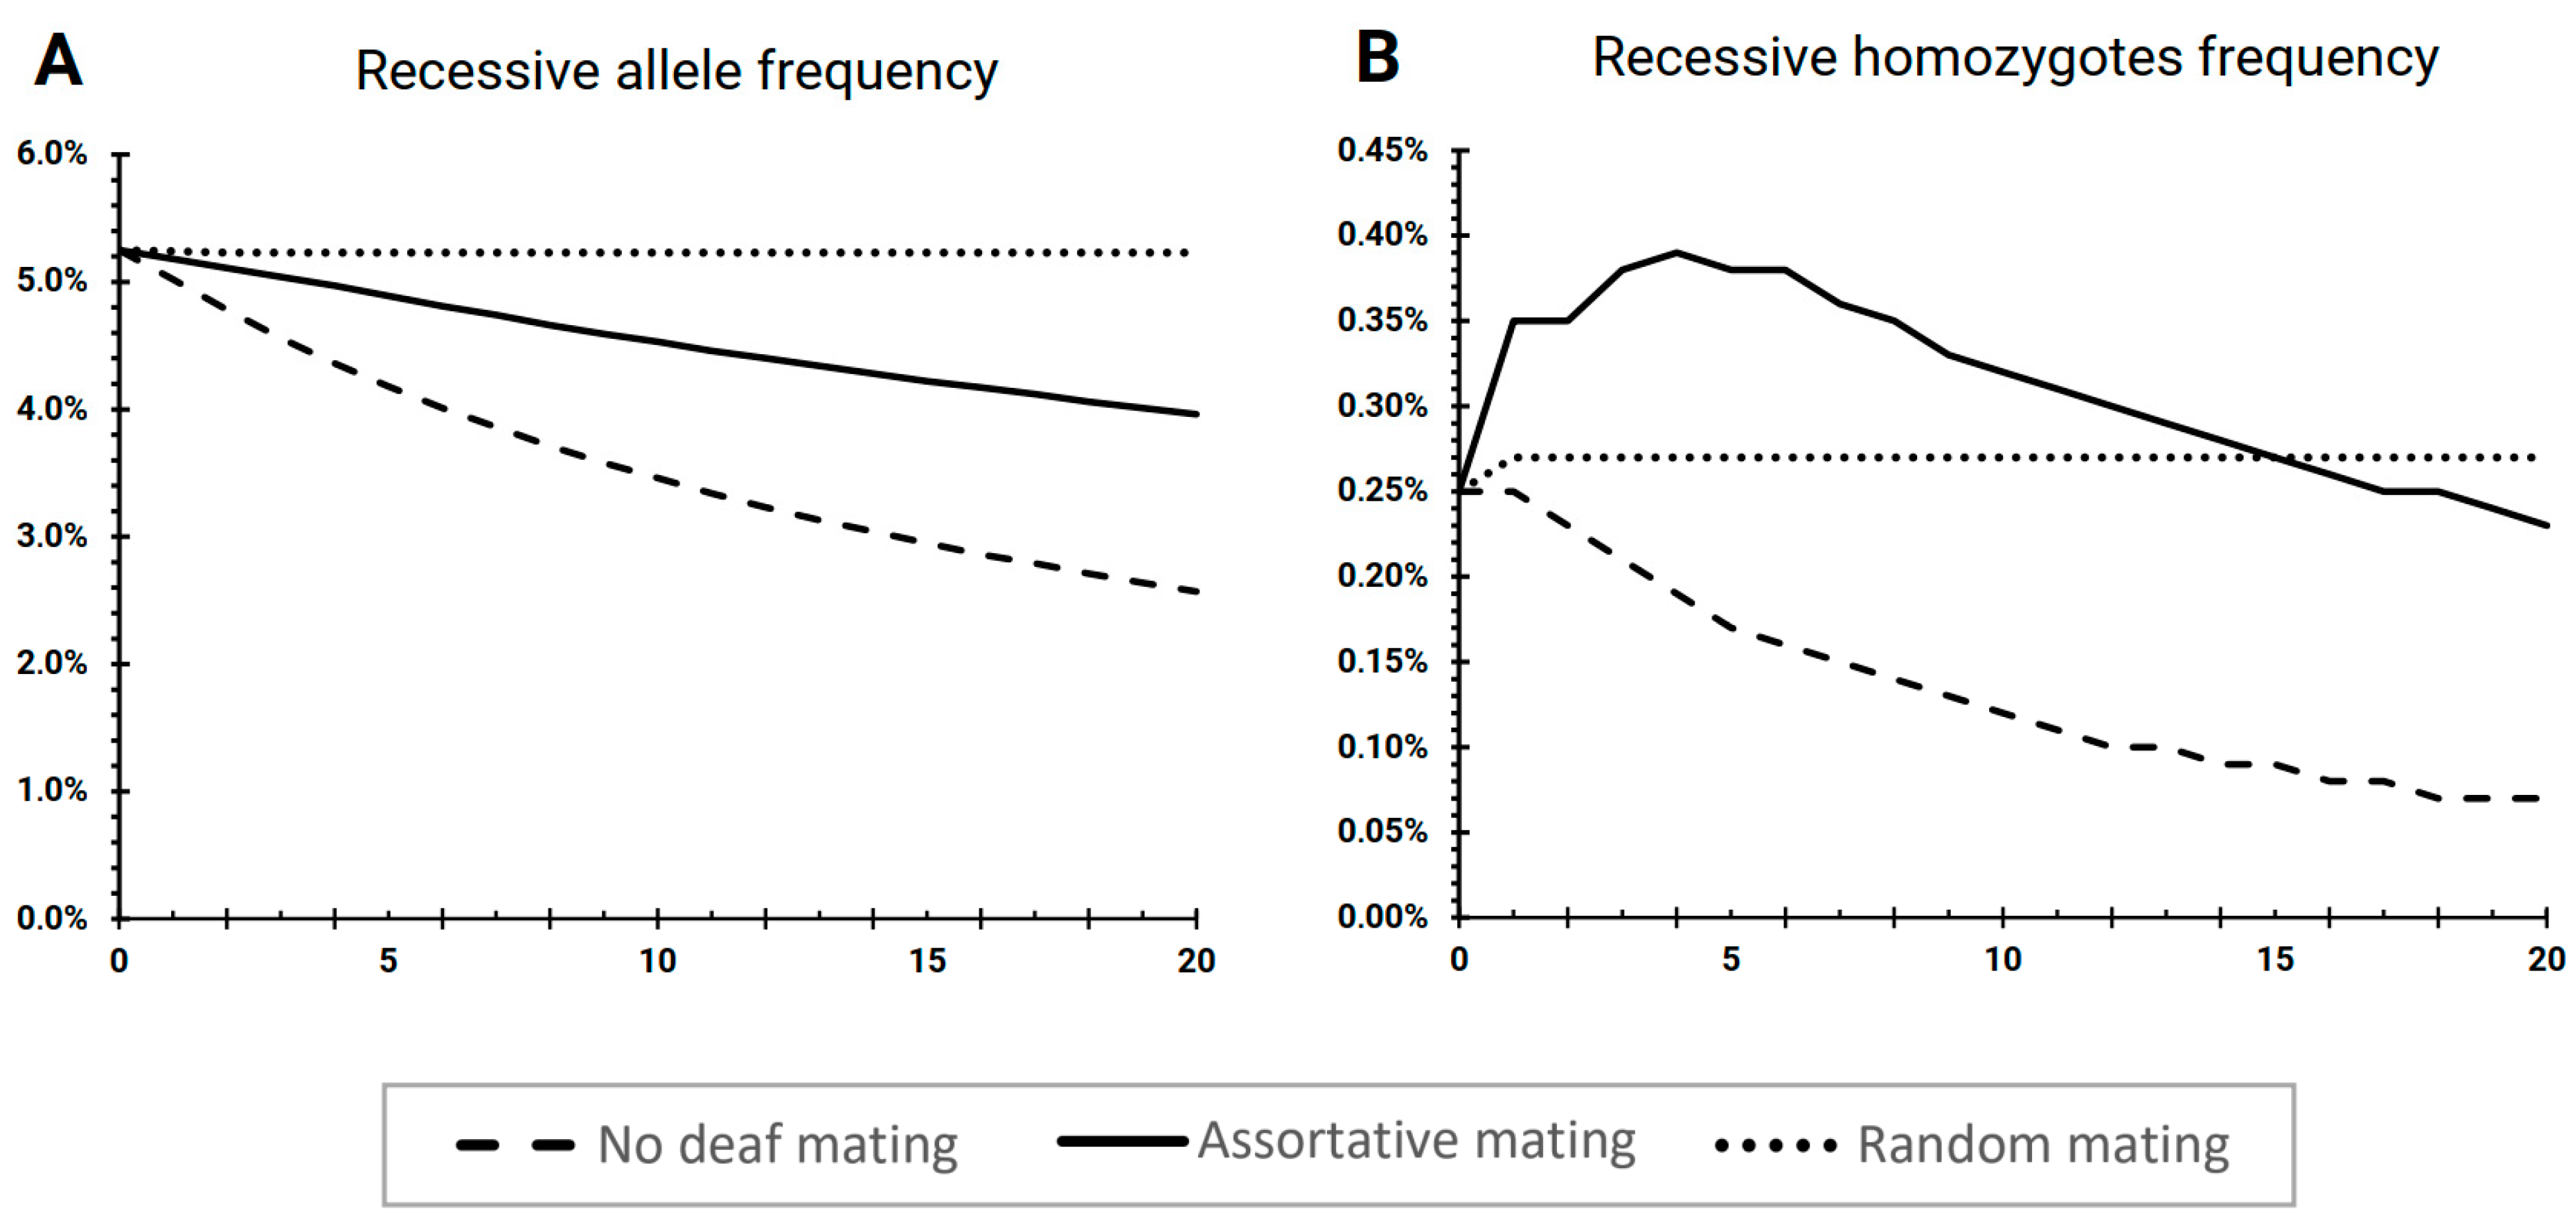
3.1. The Scenario “No Deaf Mating”
3.2. The Scenario “Assortative Mating”
3.3. The Scenario “Random Mating”
4. Discussion
5. Conclusions
Supplementary Materials
Author Contributions
Funding
Institutional Review Board Statement
Informed Consent Statement
Data Availability Statement
Acknowledgments
Conflicts of Interest
References
- Korver, A.M.H.; Smith, R.J.H.; Van Camp, G.; Schleiss, M.R.; Bitner-Glindzicz, M.A.K.; Lustig, L.R.; Usami, S.-I.; Boudewyns, A.N. Congenital hearing loss. Nat. Rev. Dis. Primers 2017, 3, 16094. [Google Scholar] [CrossRef] [PubMed]
- Morton, C.C.; Nance, W.E. Newborn Hearing Screening—A Silent Revolution. N. Engl. J. Med. 2006, 354, 2151–2164. [Google Scholar] [CrossRef] [PubMed]
- Toriello, H.; Smith, S. Hereditary Hearing Loss and Its Syndromes, 3rd ed.; Oxford University Press: Oxford, UK, 2013. [Google Scholar]
- Van Camp, G.; Smith, R.J.H. Hereditary Hearing Loss Homepage. Available online: https://hereditaryhearingloss.org (accessed on 17 December 2021).
- Chan, D.K.; Chang, K.W. GJB2-associated hearing loss: Systematic review of worldwide prevalence, genotype, and auditory phenotype. Laryngoscope 2014, 124, E34–E53. [Google Scholar] [CrossRef] [PubMed]
- Stenson, P.D.; Mort, M.; Ball, E.V.; Evans, K.; Hayden, M.; Heywood, S.; Hussain, M.; Phillips, A.D.; Cooper, D.N. The Human Gene Mutation Database: Towards a comprehensive repository of inherited mutation data for medical research, genetic diagnosis and next-generation sequencing studies. Hum. Genet. 2017, 136, 665–677. [Google Scholar] [CrossRef]
- Brobby, G.W.; Müller-Myhsok, B.; Horstmann, R.D. Connexin 26 R143W Mutation Associated with Recessive Nonsyndromic Sensorineural Deafness in Africa. N. Engl. J. Med. 1998, 338, 548–550. [Google Scholar] [CrossRef]
- Van Laer, L. A common founder for the 35delG GJB2 gene mutation in connexin 26 hearing impairment. J. Med. Genet. 2001, 38, 515–518. [Google Scholar] [CrossRef]
- Shahin, H.; Walsh, T.; Sobe, T.; Lynch, E.; King, M.-C.; Avraham, K.B.; Kanaan, M. Genetics of congenital deafness in the Palestinian population: Multiple connexin 26 alleles with shared origins in the Middle East. Hum. Genet. 2002, 110, 284–289. [Google Scholar] [CrossRef]
- RamShankar, M. Contribution of connexin26 (GJB2) mutations and founder effect to non-syndromic hearing loss in India. J. Med. Genet. 2003, 40, e68. [Google Scholar] [CrossRef]
- Yan, D.; Park, H.-J.; Ouyang, X.M.; Pandya, A.; Doi, K.; Erdenetungalag, R.; Du, L.L.; Matsushiro, N.; Nance, W.E.; Griffith, A.J.; et al. Evidence of a founder effect for the 235delC mutation of GJB2 (connexin-26) in east Asians. Hum. Genet. 2003, 114, 44–50. [Google Scholar] [CrossRef]
- Tsukada, K.; Nishio, S.-Y.; Hattori, M.; Usami, S.-I. Ethnic-Specific Spectrum of GJB2 and SLC26A4 Mutations. Ann. Otol. Rhinol. Laryngol. 2015, 124, 61S–76S. [Google Scholar] [CrossRef]
- Shinagawa, J.; Moteki, H.; Nishio, S.-Y.; Noguchi, Y.; Usami, S.-I. Haplotype Analysis of GJB2 Mutations: Founder Effect or Mutational Hot Spot? Genes 2020, 11, 250. [Google Scholar] [CrossRef] [PubMed]
- Wattanasirichaigoon, D.; Limwongse, C.; Jariengprasert, C.; Yenchitsomanus, P.T.; Tocharoenthanaphol, C.; Thongnoppakhun, W.; Thawil, C.; Charoenpipop, D.; Pho-Iam, T.; Thongpradit, S.; et al. High prevalence of V37I genetic variant in the connexin-26 (GJB2) gene among non-syndromic hearing-impaired and control Thai individuals. Clin. Genet. 2004, 66, 452–460. [Google Scholar] [CrossRef] [PubMed]
- Hamelmann, C.; Amedofu, G.K.; Albrecht, K.; Muntau, B.; Gelhaus, A.; Brobby, G.W.; Horstmann, R.D. Pattern of connexin 26 (GJB2) mutations causing sensorineural hearing impairment in Ghana. Hum. Mutat. 2001, 18, 84–85. [Google Scholar] [CrossRef] [PubMed]
- Morell, R.J.; Kim, H.J.; Hood, L.J.; Goforth, L.; Friderici, K.; Fisher, R.; Van Camp, G.; Berlin, C.I.; Oddoux, C.; Ostrer, H.; et al. Mutations in the connexin 26 gene (GJB2) among Ashkenazi Jews with nonsyndromic recessive deafness. N. Engl. J. Med. 1998, 339, 1500–1505. [Google Scholar] [CrossRef]
- Barashkov, N.A.; Dzhemileva, L.U.; Fedorova, S.A.; Teryutin, F.M.; Posukh, O.L.; Fedotova, E.E.; Lobov, S.L.; Khusnutdinova, E.K. Autosomal recessive deafness 1A (DFNB1A) in Yakut population isolate in Eastern Siberia: Extensive accumulation of the splice site mutation IVS1 + 1G > A in GJB2 gene as a result of founder effect. J. Hum. Genet. 2011, 56, 631–639. [Google Scholar] [CrossRef]
- Carranza, C.; Menendez, I.; Herrera, M.; Castellanos, P.; Amado, C.; Maldonado, F.; Rosales, L.; Escobar, N.; Guerra, M.; Alvarez, D.; et al. A Mayan founder mutation is a common cause of deafness in Guatemala. Clin. Genet. 2016, 89, 461–465. [Google Scholar] [CrossRef]
- Bliznetz, E.A.; Lalayants, M.R.; Markova, T.G.; Balanovsky, O.P.; Balanovska, E.V.; Skhalyakho, R.A.; Pocheshkhova, E.A.; Nikitina, N.V.; Voronin, S.V.; Kudryashova, E.K.; et al. Update of the GJB2/DFNB1 mutation spectrum in Russia: A founder Ingush mutation del(GJB2-D13S175) is the most frequent among other large deletions. J. Hum. Genet. 2017, 62, 789–795. [Google Scholar] [CrossRef][Green Version]
- Zytsar, M.V.; Barashkov, N.A.; Bady-Khoo, M.S.; Shubina-Olejnik, O.A.; Danilenko, N.G.; Bondar, A.A.; Morozov, I.V.; Solovyev, A.V.; Danilchenko, V.Y.; Maximov, V.N.; et al. Updated carrier rates for c.35delG (GJB2) associated with hearing loss in Russia and common c.35delG haplotypes in Siberia. BMC Med. Genet. 2018, 19, 138. [Google Scholar] [CrossRef]
- Posukh, O.L.; Zytsar, M.V.; Bady-Khoo, M.S.; Danilchenko, V.Y.; Maslova, E.A.; Barashkov, N.A.; Bondar, A.A.; Morozov, I.V.; Maximov, V.N.; Voevoda, M.I. Unique Mutational Spectrum of the GJB2 Gene and Its Pathogenic Contribution to Deafness in Tuvinians (Southern Siberia, Russia): A High Prevalence of Rare Variant c.516G > C (p.Trp172Cys). Genes 2019, 10, 429. [Google Scholar] [CrossRef]
- Zytsar, M.V.; Bady-Khoo, M.S.; Danilchenko, V.Y.; Maslova, E.A.; Barashkov, N.A.; Morozov, I.V.; Bondar, A.A.; Posukh, O.L. High Rates of Three Common GJB2 Mutations c.516G > C, c.-23 + 1G > A, c.235delC in Deaf Patients from Southern Siberia Are Due to the Founder Effect. Genes 2020, 11, 833. [Google Scholar] [CrossRef]
- Nance, W.E.; Liu, X.-Z.; Pandya, A. Relation between choice of partner and high frequency of connexin-26 deafness. Lancet 2000, 356, 500–501. [Google Scholar] [CrossRef]
- Nance, W.E.; Kearsey, M.J. Relevance of Connexin Deafness (DFNB1) to Human Evolution. Am. J. Hum. Genet. 2004, 74, 1081–1087. [Google Scholar] [CrossRef] [PubMed]
- Arnos, K.S.; Welch, K.O.; Tekin, M.; Norris, V.W.; Blanton, S.H.; Pandya, A.; Nance, W.E. A comparative analysis of the genetic epidemiology of deafness in the United States in two sets of pedigrees collected more than a century apart. Am. J. Hum. Genet. 2008, 83, 200–207. [Google Scholar] [CrossRef]
- Blanton, S.H.; Nance, W.E.; Norris, V.W.; Welch, K.O.; Burt, A.; Pandya, A.; Arnos, K.S. Fitness Among Individuals with Early Childhood Deafness: Studies in Alumni Families from Gallaudet University. Ann. Hum. Genet. 2010, 74, 27–33. [Google Scholar] [CrossRef] [PubMed]
- Braun, D.C.; Jain, S.; Epstein, E.; Greenwald, B.H.; Herold, B.; Gray, M. Deaf intermarriage has limited effect on the prevalence of recessive deafness and no effect on underlying allelic frequency. PLoS ONE 2020, 15, e90972. [Google Scholar] [CrossRef] [PubMed]
- Fisher, R.A. The correlation between relatives on the supposition of Mendelian inheritance. Earth Environ. Sci. Trans. R. Soc. Edinb. 1918, 52, 399–433. [Google Scholar] [CrossRef]
- Wright, S. Systems of Mating. III. Assortative Mating Based on Somatic Resemblance. Genetics 1921, 6, 144–161. [Google Scholar] [CrossRef]
- Crow, J.F.; Felsenstein, J. The effect of assortative mating on the genetic composition of a population. Eugen. Q. 1968, 15, 85–97. [Google Scholar] [CrossRef]
- Li, Y.; Lawley, M.A.; Siscovick, D.S.; Zhang, D.; Pagán, J.A. Agent-Based Modeling of Chronic Diseases: A Narrative Review and Future Research Directions. Prev. Chronic Dis. 2016, 13, 150561. [Google Scholar] [CrossRef]
- DeAngelis, D.L.; Diaz, S.G. Decision-Making in Agent-Based Modeling: A Current Review and Future Prospectus. Front. Ecol. Evol. 2019, 6, 237. [Google Scholar] [CrossRef]
- Cimler, R.; Tomaskova, H.; Kuhnova, J.; Dolezal, O.; Pscheidl, P.; Kuca, K. Numeric, Agent-based or System Dynamics Model? Which Modeling Approach is the Best for Vast Population Simulation? Curr. Alzheimer Res. 2018, 15, 789–797. [Google Scholar] [CrossRef] [PubMed]
- Selvaraj, P.; Wenger, E.A.; Bridenbecker, D.; Windbichler, N.; Russell, J.R.; Gerardin, J.; Bever, C.A.; Nikolov, M. Vector genetics, insecticide resistance and gene drives: An agent-based modeling approach to evaluate malaria transmission and elimination. PLoS Comput. Biol. 2020, 16, e1008121. [Google Scholar] [CrossRef] [PubMed]
- Zohdi, T.I. An agent-based computational framework for simulation of global pandemic and social response on planet X. Comput. Mech. 2020, 66, 1195–1209. [Google Scholar] [CrossRef] [PubMed]
- Niazi, M.; Hussain, A. Agent-based computing from multi-agent systems to agent-based models: A visual survey. Scientometrics 2011, 89, 479–499. [Google Scholar] [CrossRef]
- Luo, W.; Katz, D.A.; Hamilton, D.T.; McKenney, J.; Jenness, S.M.; Goodreau, S.M.; Stekler, J.D.; Rosenberg, E.S.; Sullivan, P.S.; Cassels, S. Development of an Agent-Based Model to Investigate the Impact of HIV Self-Testing Programs on Men Who Have Sex with Men in Atlanta and Seattle. JMIR Public Health Surveill. 2018, 4, e58. [Google Scholar] [CrossRef]
- Adams, J.W.; Lurie, M.N.; King, M.R.F.; Brady, K.A.; Galea, S.; Friedman, S.R.; Khan, M.R.; Marshall, B.D.L. Potential drivers of HIV acquisition in African-American women related to mass incarceration: An agent-based modelling study. BMC Public Health 2018, 18, 1387. [Google Scholar] [CrossRef]
- Vermeer, W.; Hjorth, A.; Jenness, S.M.; Brown, C.H.; Wilensky, U. Leveraging Modularity During Replication of High-Fidelity Models: Lessons from Replicating an Agent-Based Model for HIV Prevention. J. Artif. Soc. Soc. Simul. 2020, 23, 7. [Google Scholar] [CrossRef]
- Hoertel, N.; Blachier, M.; Blanco, C.; Olfson, M.; Massetti, M.; Rico, M.S.; Limosin, F.; Leleu, H. A stochastic agent-based model of the SARS-CoV-2 epidemic in France. Nat. Med. 2020, 26, 1417–1421. [Google Scholar] [CrossRef]
- Hunter, E.; Mac Namee, B.; Kelleher, J.D. A Taxonomy for Agent-Based Models in Human Infectious Disease Epidemiology. J. Artif. Soc. Soc. Simul. 2017, 20, 2. [Google Scholar] [CrossRef]
- Smith, N.R.; Trauer, J.M.; Gambhir, M.; Richards, J.S.; Maude, R.J.; Keith, J.M.; Flegg, J.A. Agent-based models of malaria transmission: A systematic review. Malar. J. 2018, 17, 299. [Google Scholar] [CrossRef]
- Xie, X.; Pang, B.; Li, Y.A.N. Comparing Diabetes Screening Strategies in China—An Agent-Based Modeling Approach. Diabetes 2018, 67, 1283-P. [Google Scholar] [CrossRef]
- Gao, A.; Osgood, N.D.; Jiang, Y.; Dyck, R.F. Projecting prevalence, costs and evaluating simulated interventions for diabetic end stage renal disease in a Canadian population of aboriginal and non-aboriginal people: An agent based approach. BMC Nephrol. 2017, 18, 283. [Google Scholar] [CrossRef] [PubMed]
- Morshed, A.B.; Kasman, M.; Heuberger, B.; Hammond, R.A.; Hovmand, P.S. A systematic review of system dynamics and agent-based obesity models: Evaluating obesity as part of the global syndemic. Obes. Rev. 2019, 20, 161–178. [Google Scholar] [CrossRef] [PubMed]
- Fedorova, S.A.; Reidla, M.; Metspalu, E.; Metspalu, M.; Rootsi, S.; Tambets, K.; Trofimova, N.; Zhadanov, S.I.; Hooshiar Kashani, B.; Olivieri, A.; et al. Autosomal and uniparental portraits of the native populations of Sakha (Yakutia): Implications for the peopling of Northeast Eurasia. BMC Evol. Biol. 2013, 13, 127. [Google Scholar] [CrossRef] [PubMed]
- Barashkov, N.A.; Pshennikova, V.G.; Posukh, O.L.; Teryutin, F.M.; Solovyev, A.V.; Klarov, L.A.; Romanov, G.P.; Gotovtsev, N.N.; Kozhevnikov, A.A.; Kirillina, E.V.; et al. Spectrum and Frequency of the GJB2 Gene Pathogenic Variants in a Large Cohort of Patients with Hearing Impairment Living in a Subarctic Region of Russia (the Sakha Republic). PLoS ONE 2016, 11, e0156300. [Google Scholar] [CrossRef] [PubMed]
- Romanov, G.P.; Barashkov, N.A.; Teryutin, F.M.; Lashin, S.A.; Solovyev, A.V.; Pshennikova, V.G.; Bondar, A.A.; Morozov, I.V.; Sazonov, N.N.; Tomsky, M.I.; et al. Marital Structure, Genetic Fitness, and the GJB2 Gene Mutations among Deaf People in Yakutia (Eastern Siberia, Russia). Rus. J. Genet. 2018, 54, 554–561. [Google Scholar] [CrossRef]
- Fay, E.A. Marriages of the Deaf in America: An Inquiry Concerning the Results of Marriages of the Deaf in America; Gibson Bros., Printers and Bookbinders: Washington, DC, USA, 1898. [Google Scholar]


Publisher’s Note: MDPI stays neutral with regard to jurisdictional claims in published maps and institutional affiliations. |
© 2022 by the authors. Licensee MDPI, Basel, Switzerland. This article is an open access article distributed under the terms and conditions of the Creative Commons Attribution (CC BY) license (https://creativecommons.org/licenses/by/4.0/).
Share and Cite
Romanov, G.P.; Smirnova, A.A.; Zamyatin, V.I.; Mukhin, A.M.; Kazantsev, F.V.; Pshennikova, V.G.; Teryutin, F.M.; Solovyev, A.V.; Fedorova, S.A.; Posukh, O.L.; et al. Agent-Based Modeling of Autosomal Recessive Deafness 1A (DFNB1A) Prevalence with Regard to Intensity of Selection Pressure in Isolated Human Population. Biology 2022, 11, 257. https://doi.org/10.3390/biology11020257
Romanov GP, Smirnova AA, Zamyatin VI, Mukhin AM, Kazantsev FV, Pshennikova VG, Teryutin FM, Solovyev AV, Fedorova SA, Posukh OL, et al. Agent-Based Modeling of Autosomal Recessive Deafness 1A (DFNB1A) Prevalence with Regard to Intensity of Selection Pressure in Isolated Human Population. Biology. 2022; 11(2):257. https://doi.org/10.3390/biology11020257
Chicago/Turabian StyleRomanov, Georgii P., Anna A. Smirnova, Vladimir I. Zamyatin, Aleksey M. Mukhin, Fedor V. Kazantsev, Vera G. Pshennikova, Fedor M. Teryutin, Aisen V. Solovyev, Sardana A. Fedorova, Olga L. Posukh, and et al. 2022. "Agent-Based Modeling of Autosomal Recessive Deafness 1A (DFNB1A) Prevalence with Regard to Intensity of Selection Pressure in Isolated Human Population" Biology 11, no. 2: 257. https://doi.org/10.3390/biology11020257
APA StyleRomanov, G. P., Smirnova, A. A., Zamyatin, V. I., Mukhin, A. M., Kazantsev, F. V., Pshennikova, V. G., Teryutin, F. M., Solovyev, A. V., Fedorova, S. A., Posukh, O. L., Lashin, S. A., & Barashkov, N. A. (2022). Agent-Based Modeling of Autosomal Recessive Deafness 1A (DFNB1A) Prevalence with Regard to Intensity of Selection Pressure in Isolated Human Population. Biology, 11(2), 257. https://doi.org/10.3390/biology11020257