
Effects of A6E Mutation on Protein Expression and Supramolecular Assembly of Yeast Asparagine Synthetase


Abstract
Simple Summary
Abstract
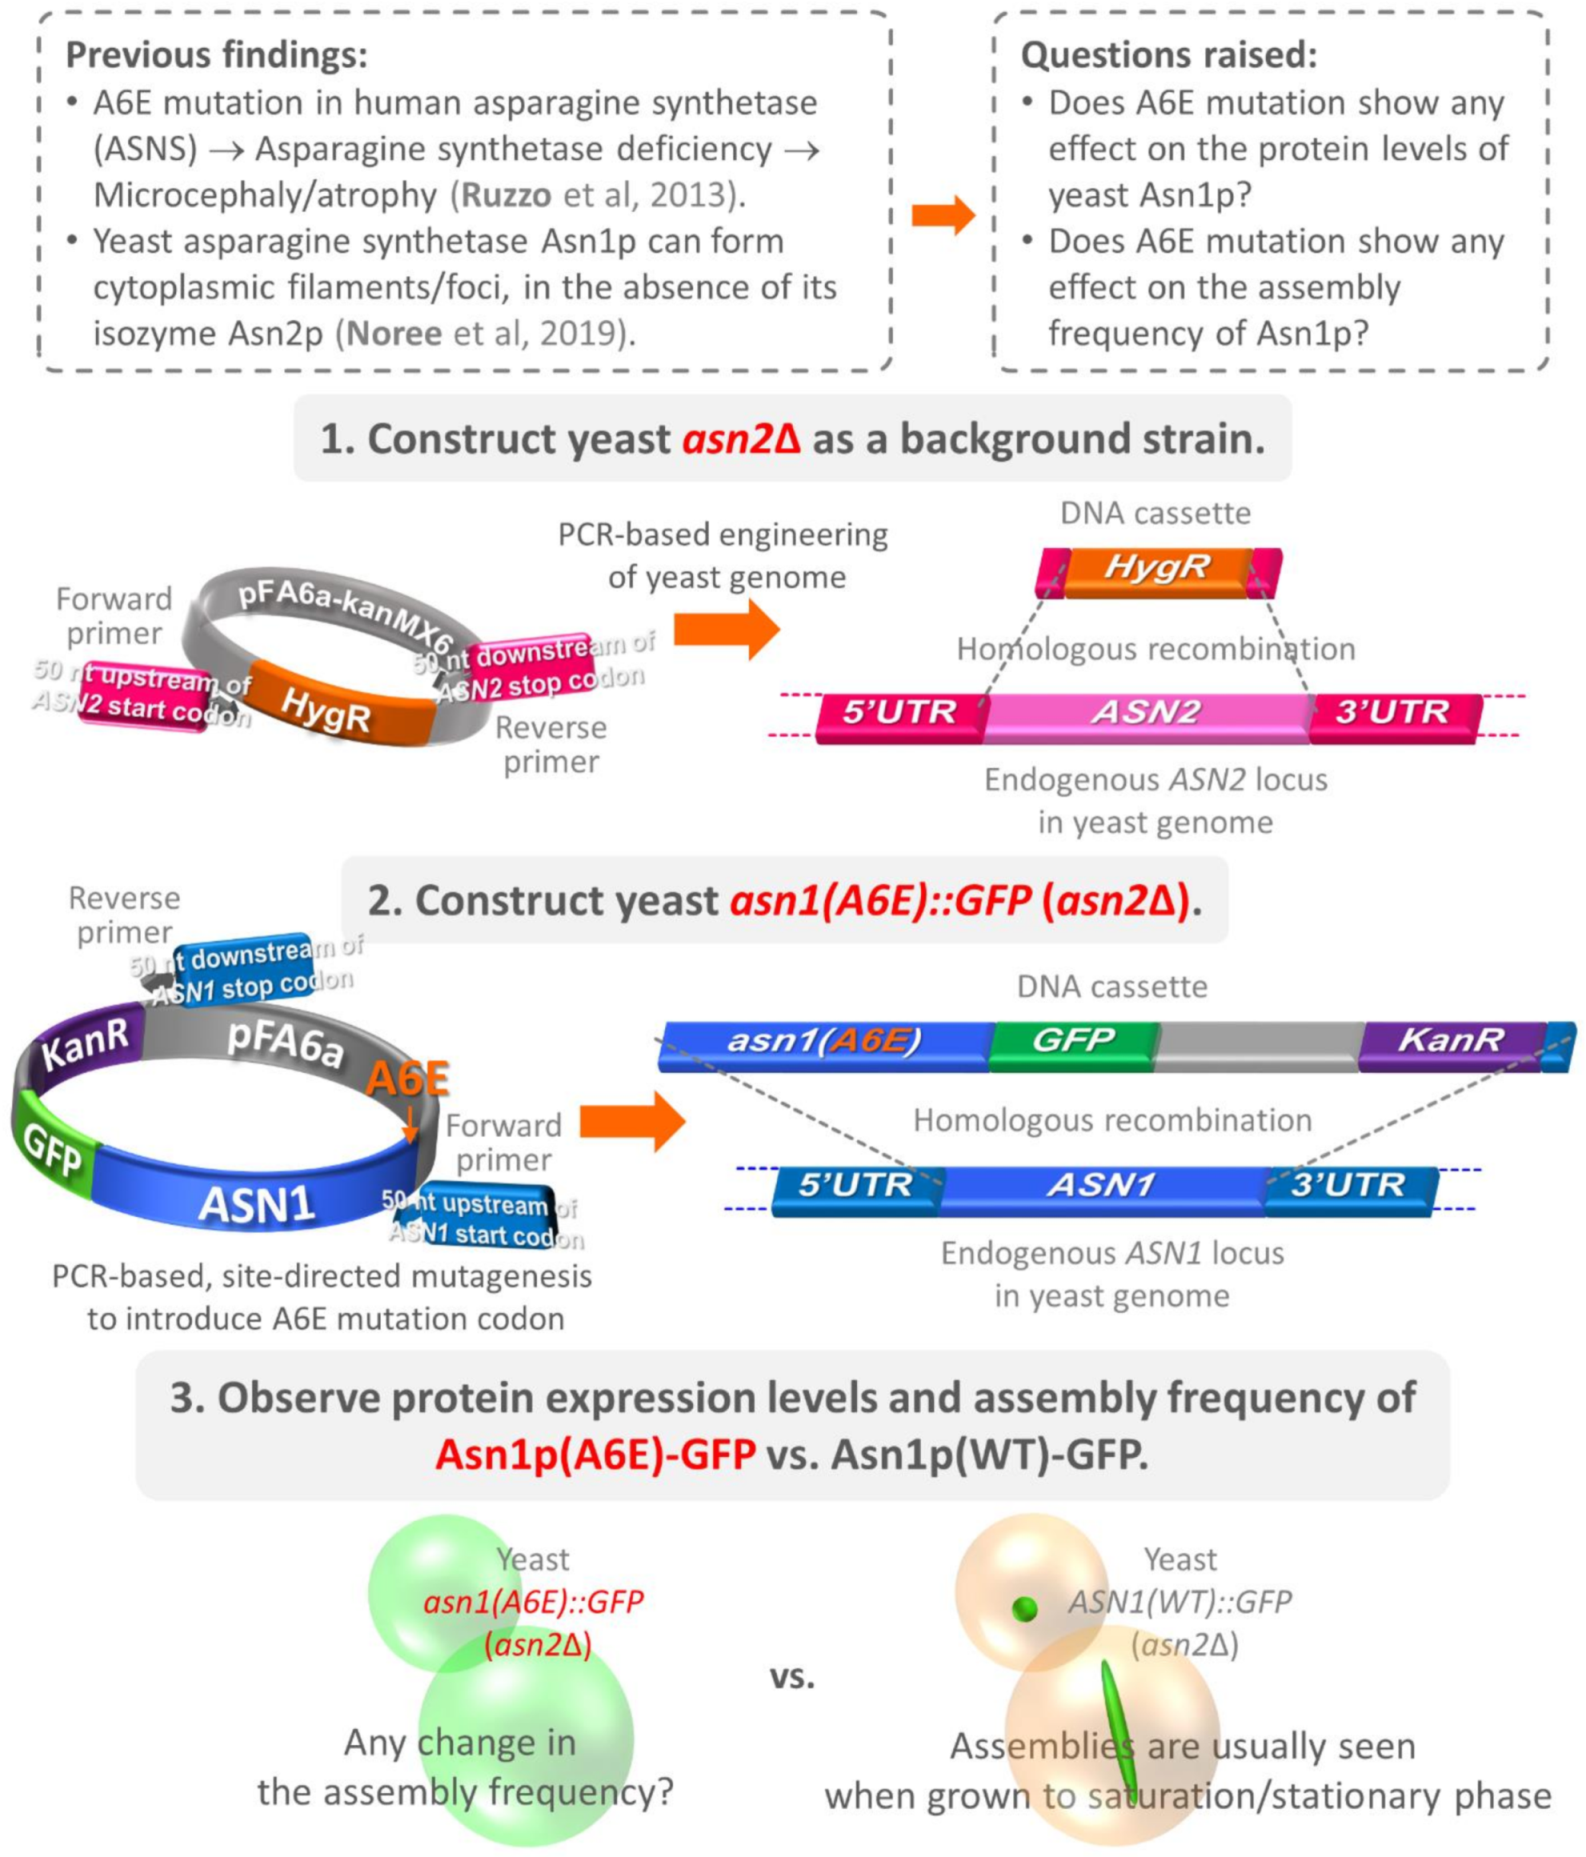
1. Introduction
2. Materials and Methods
2.1. Bacteria, Yeast, Growth and Selection Media, and Oligonucleotides
2.2. Construction of Yeast asn2Δ
2.3. Construction of Plasmid pFA6a-asn1(A6E)-GFP-kanMX6
2.4. Construction of Yeast asn1(A6E)::GFP (asn2Δ)
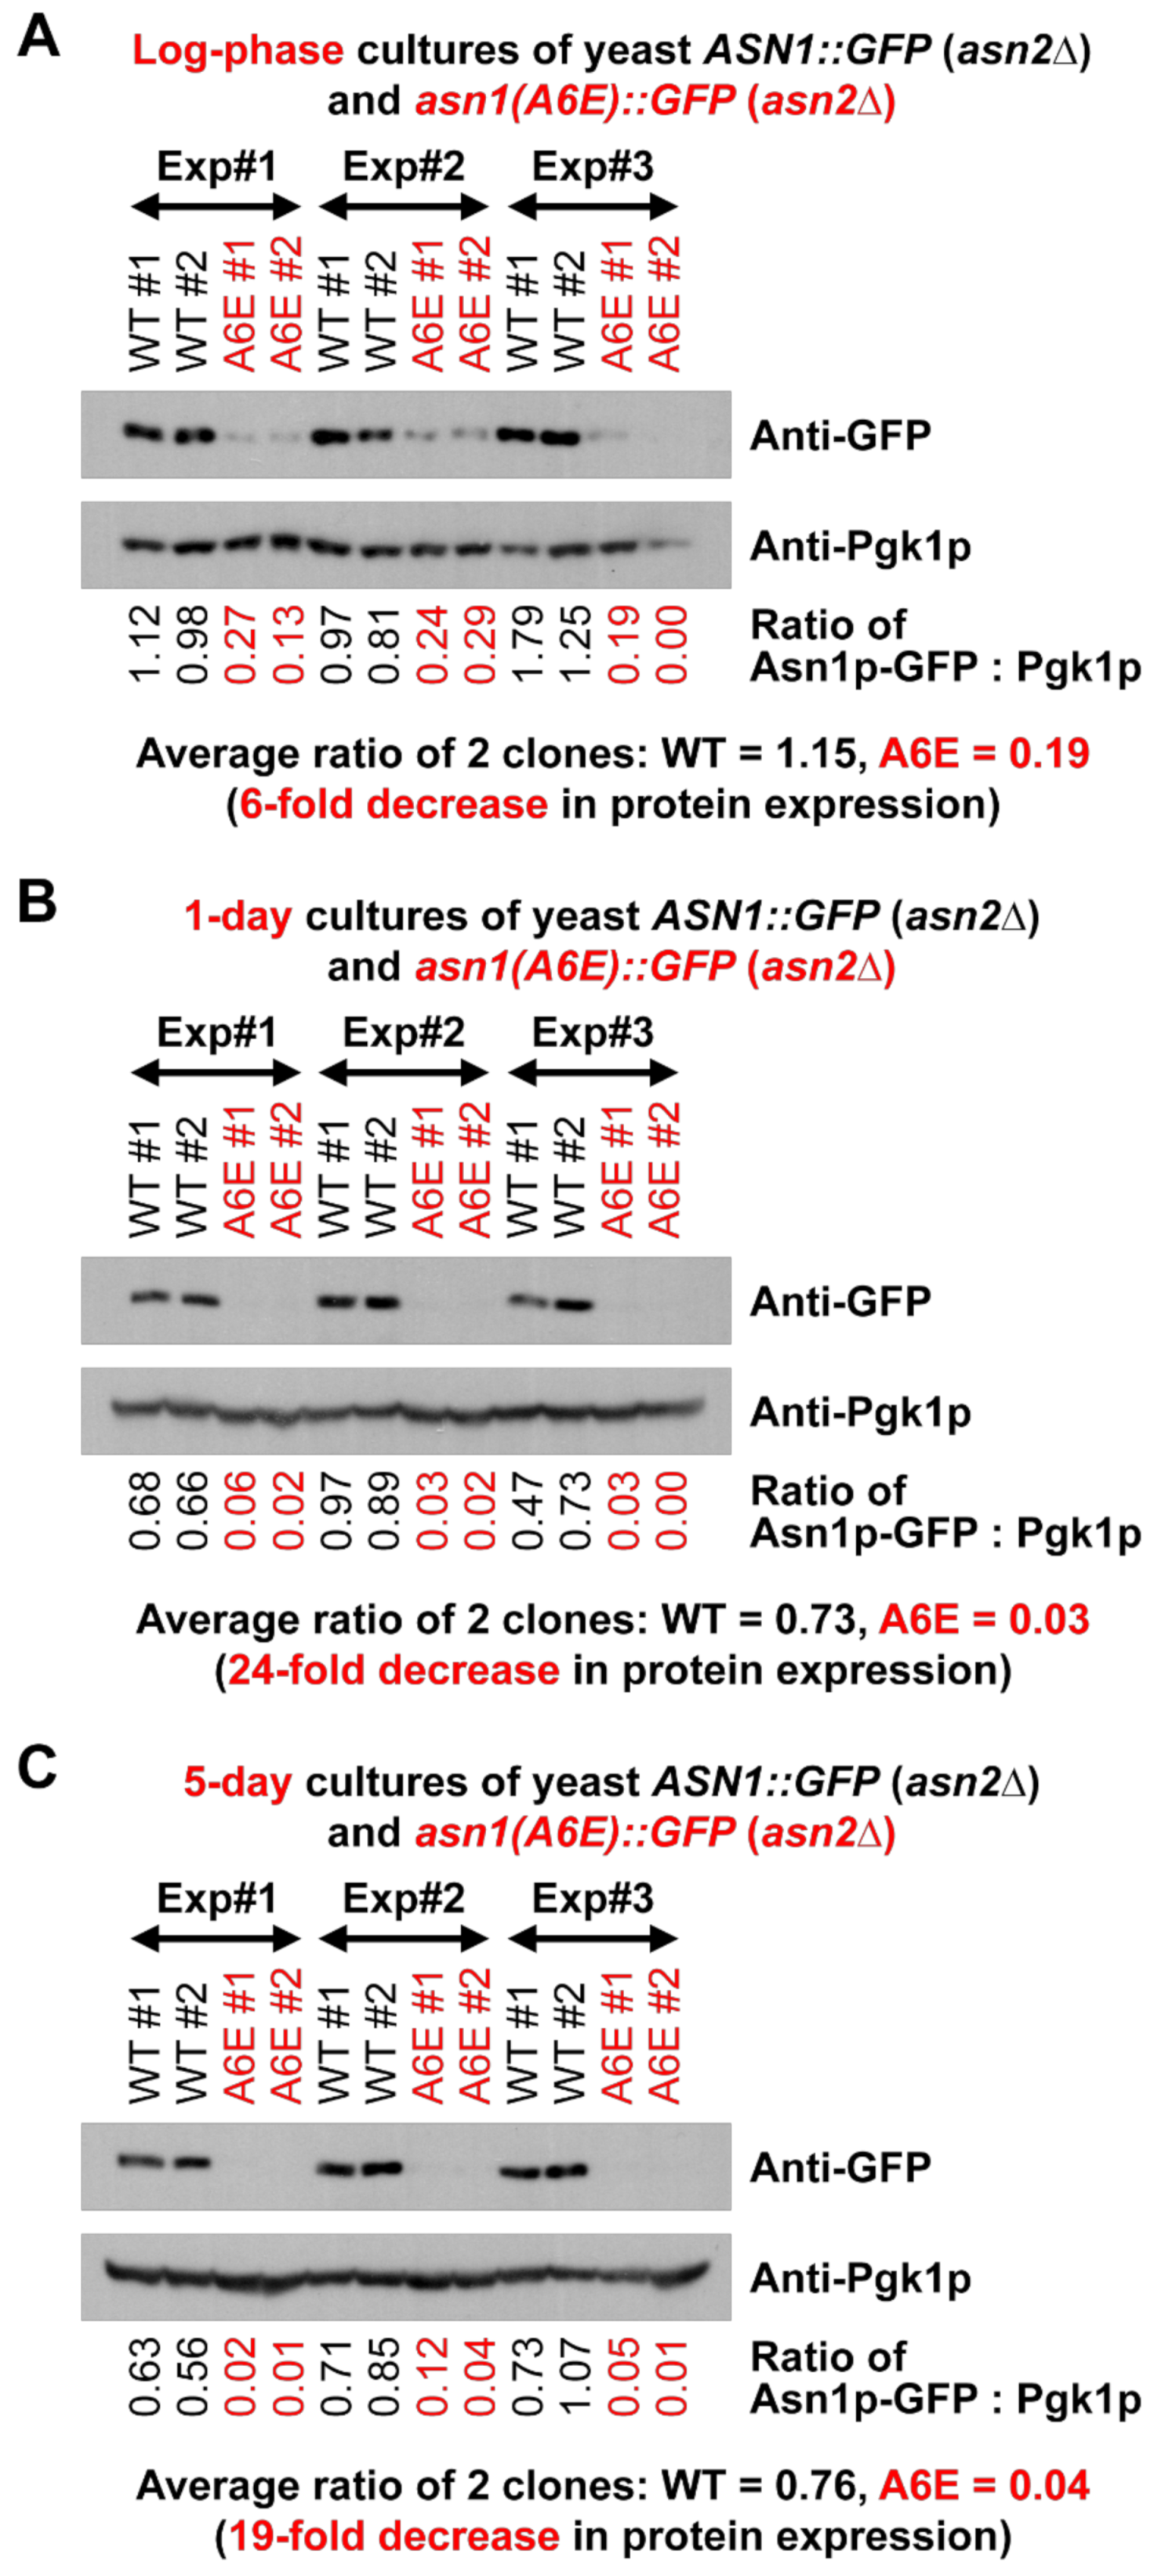
2.5. Western Blot Analysis
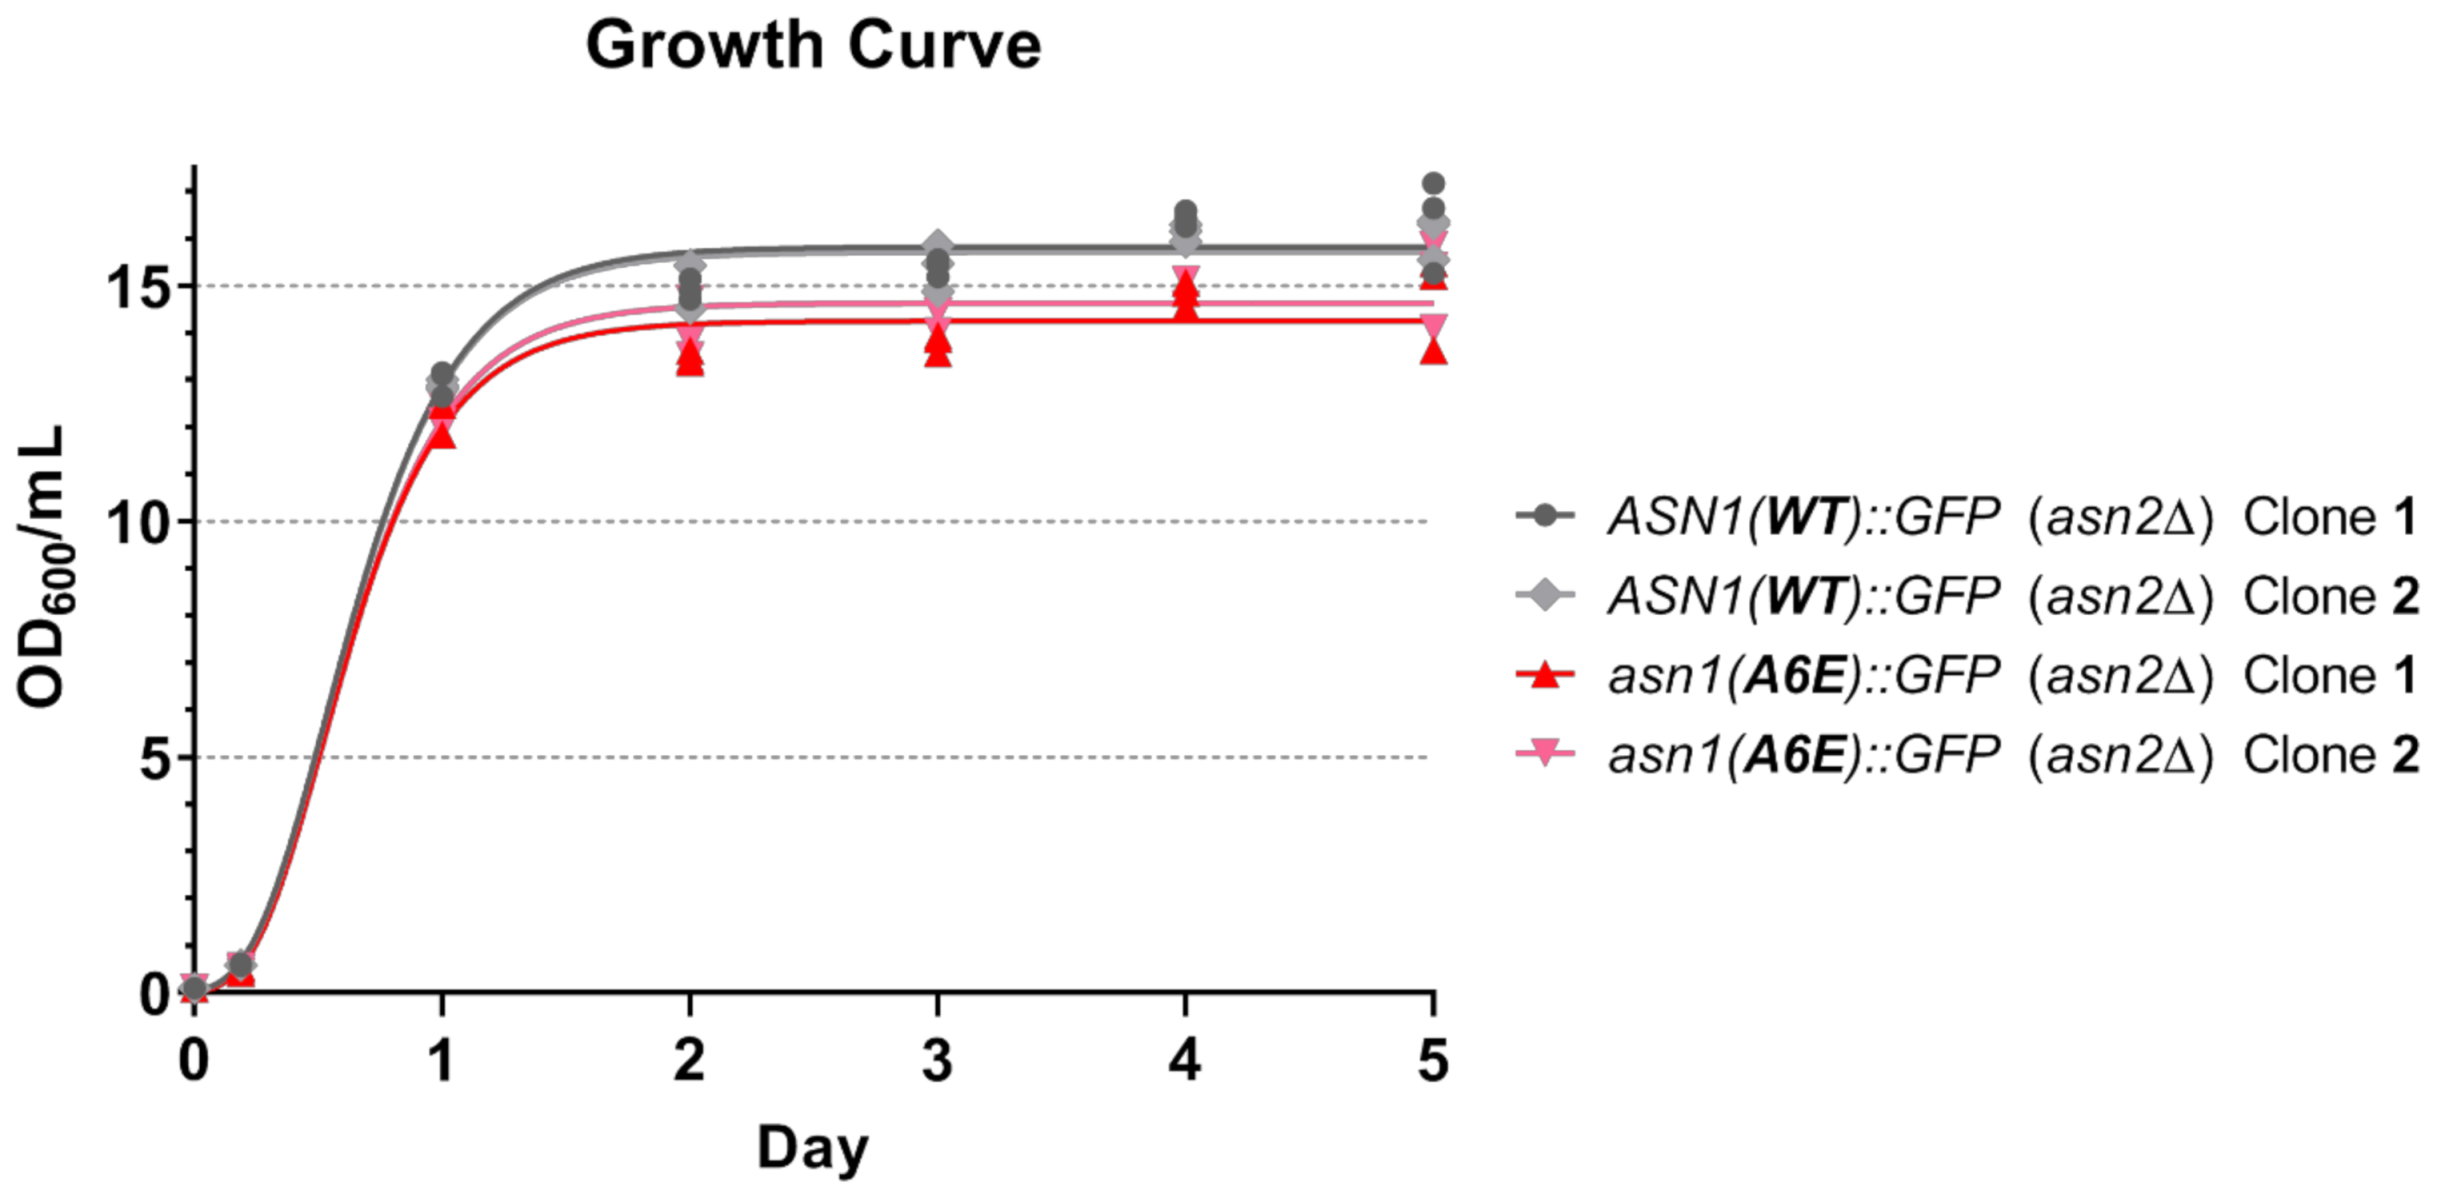
2.6. Growth Curve Analysis
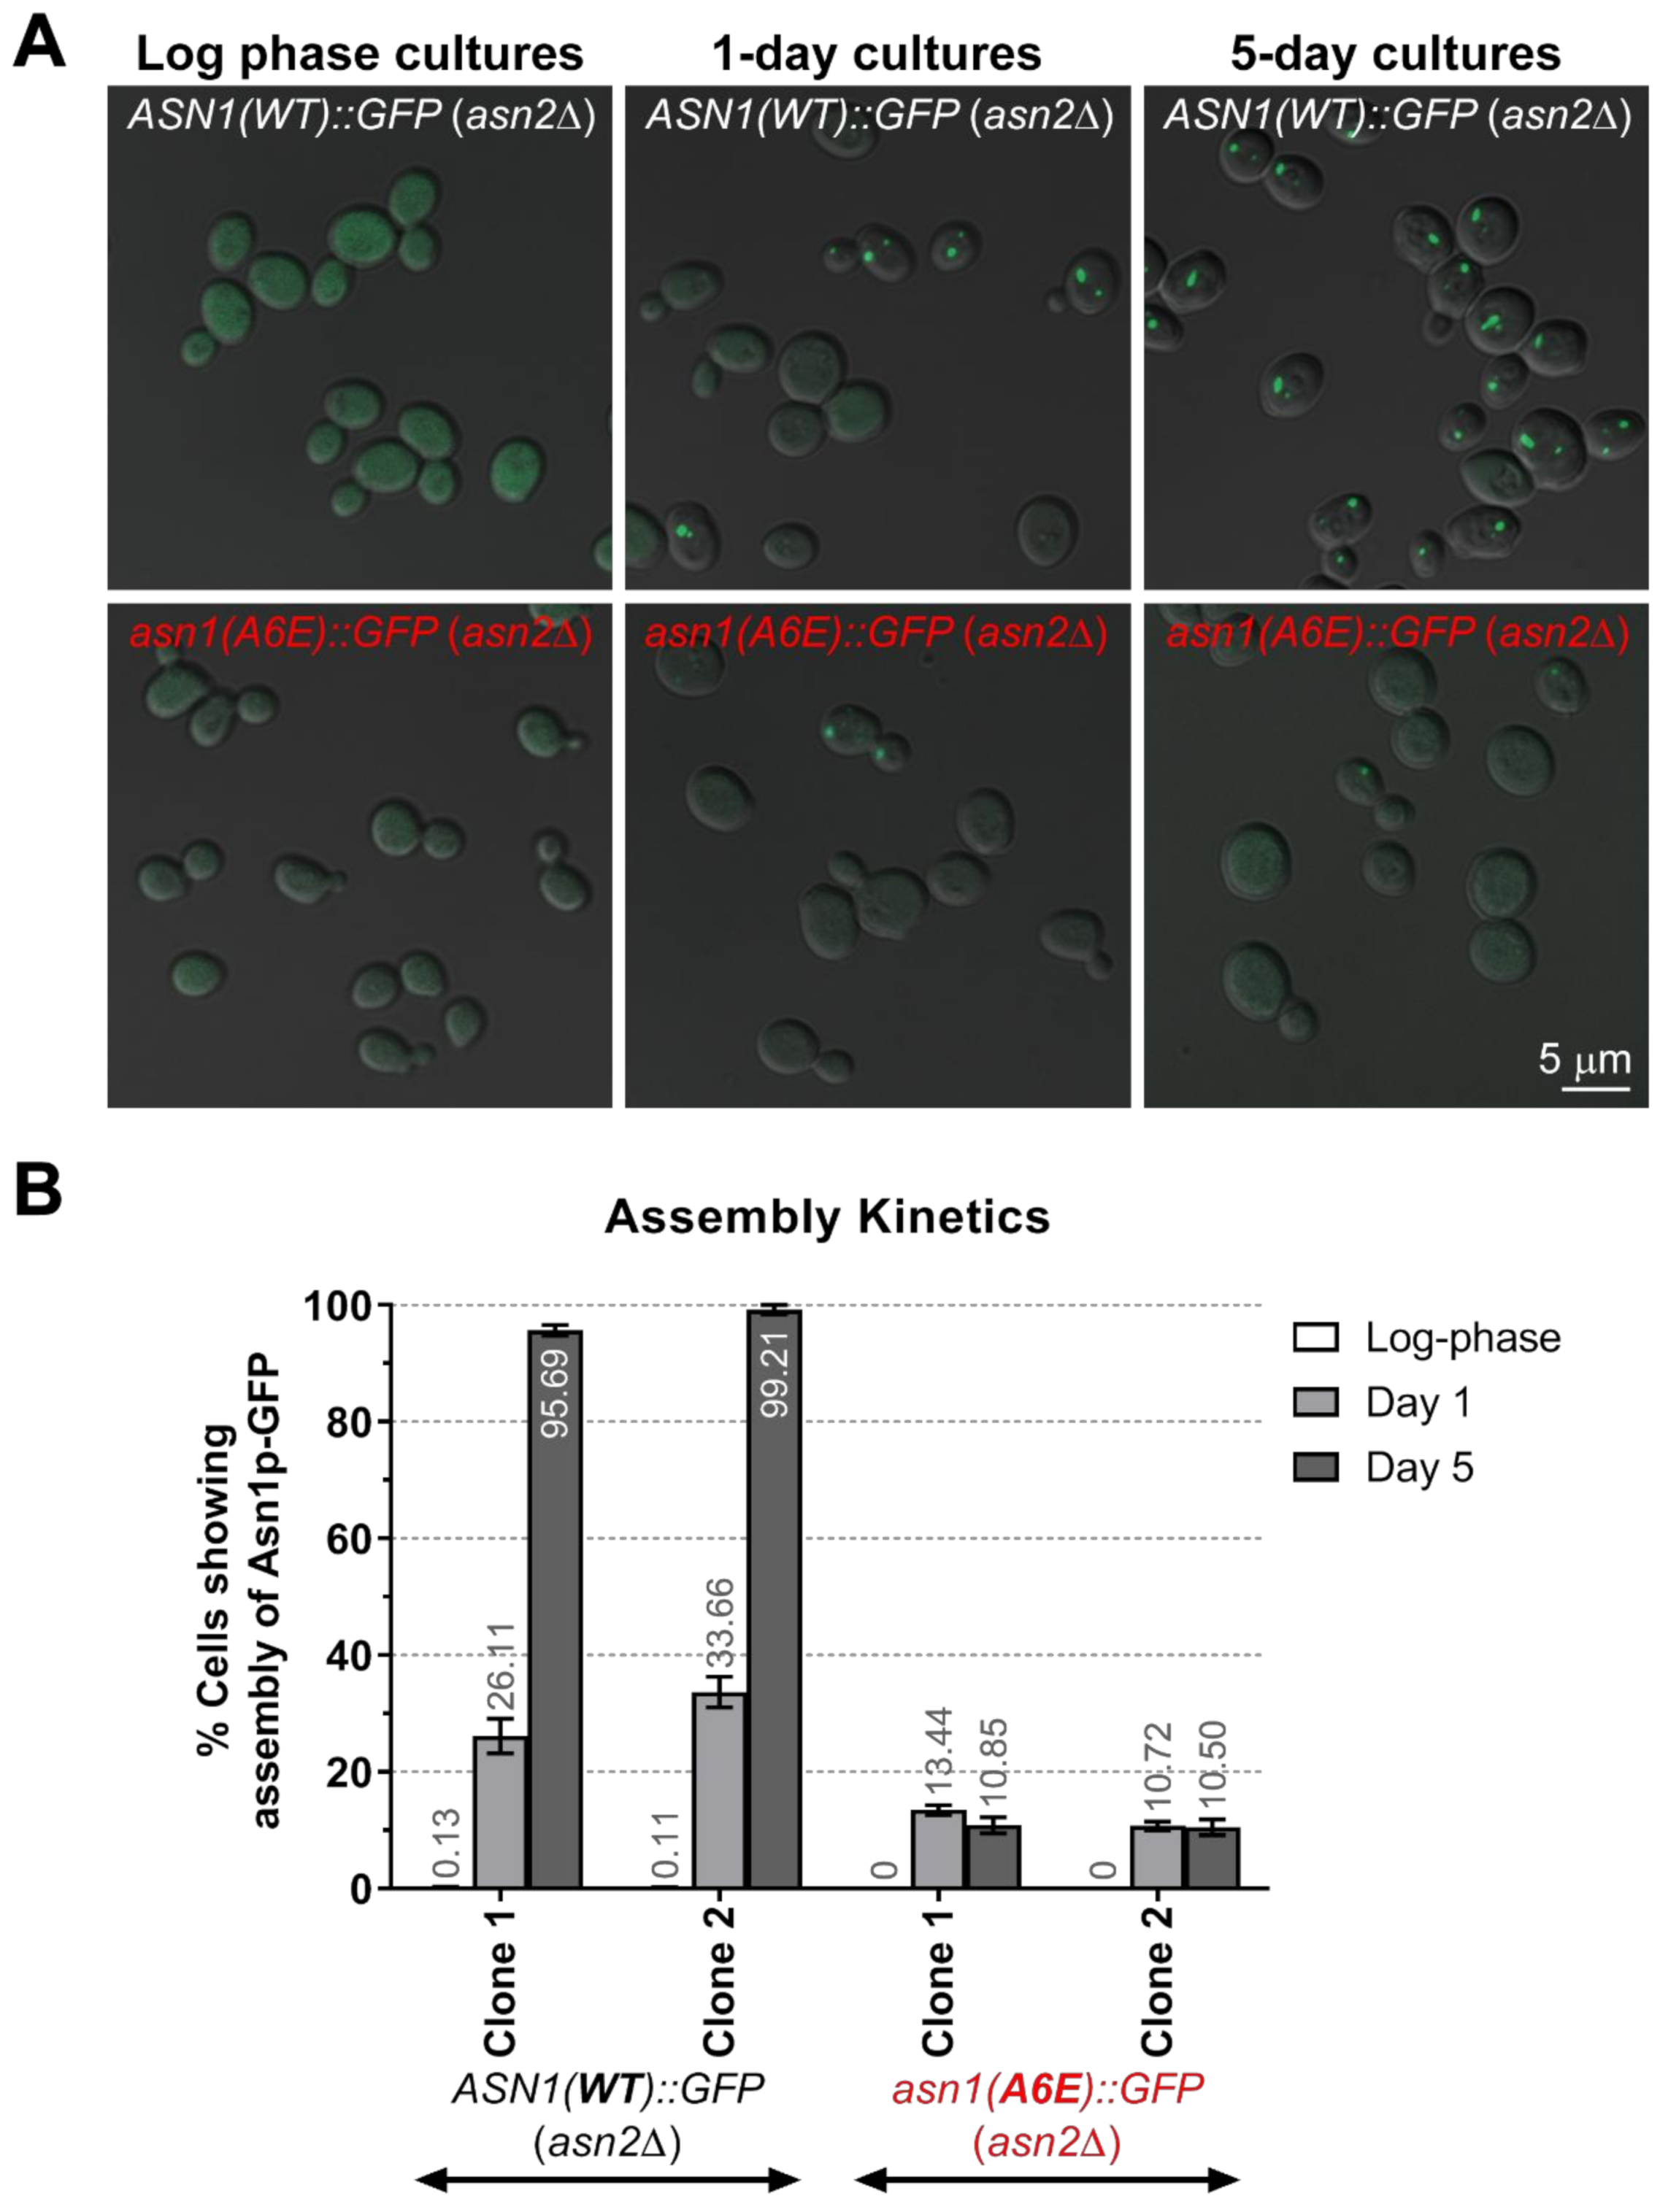
2.7. In Vivo Assembly Frequency Assay of Asn1p(A6E)-GFP vs. Asn1p(WT)-GFP
2.8. Sodium Azide Treatment of Log-Phase Yeast Cultures
2.9. Glucose Addition to 5-Day Yeast Cultures
2.10. Cell Imaging
3. Results and Discussion
3.1. A6E Mutation Causes a Lowering in the Protein Expression Levels of Asparagine Synthetase
3.2. Asparagine Synthetase with A6E Mutation Also Affects the Growth of Yeast
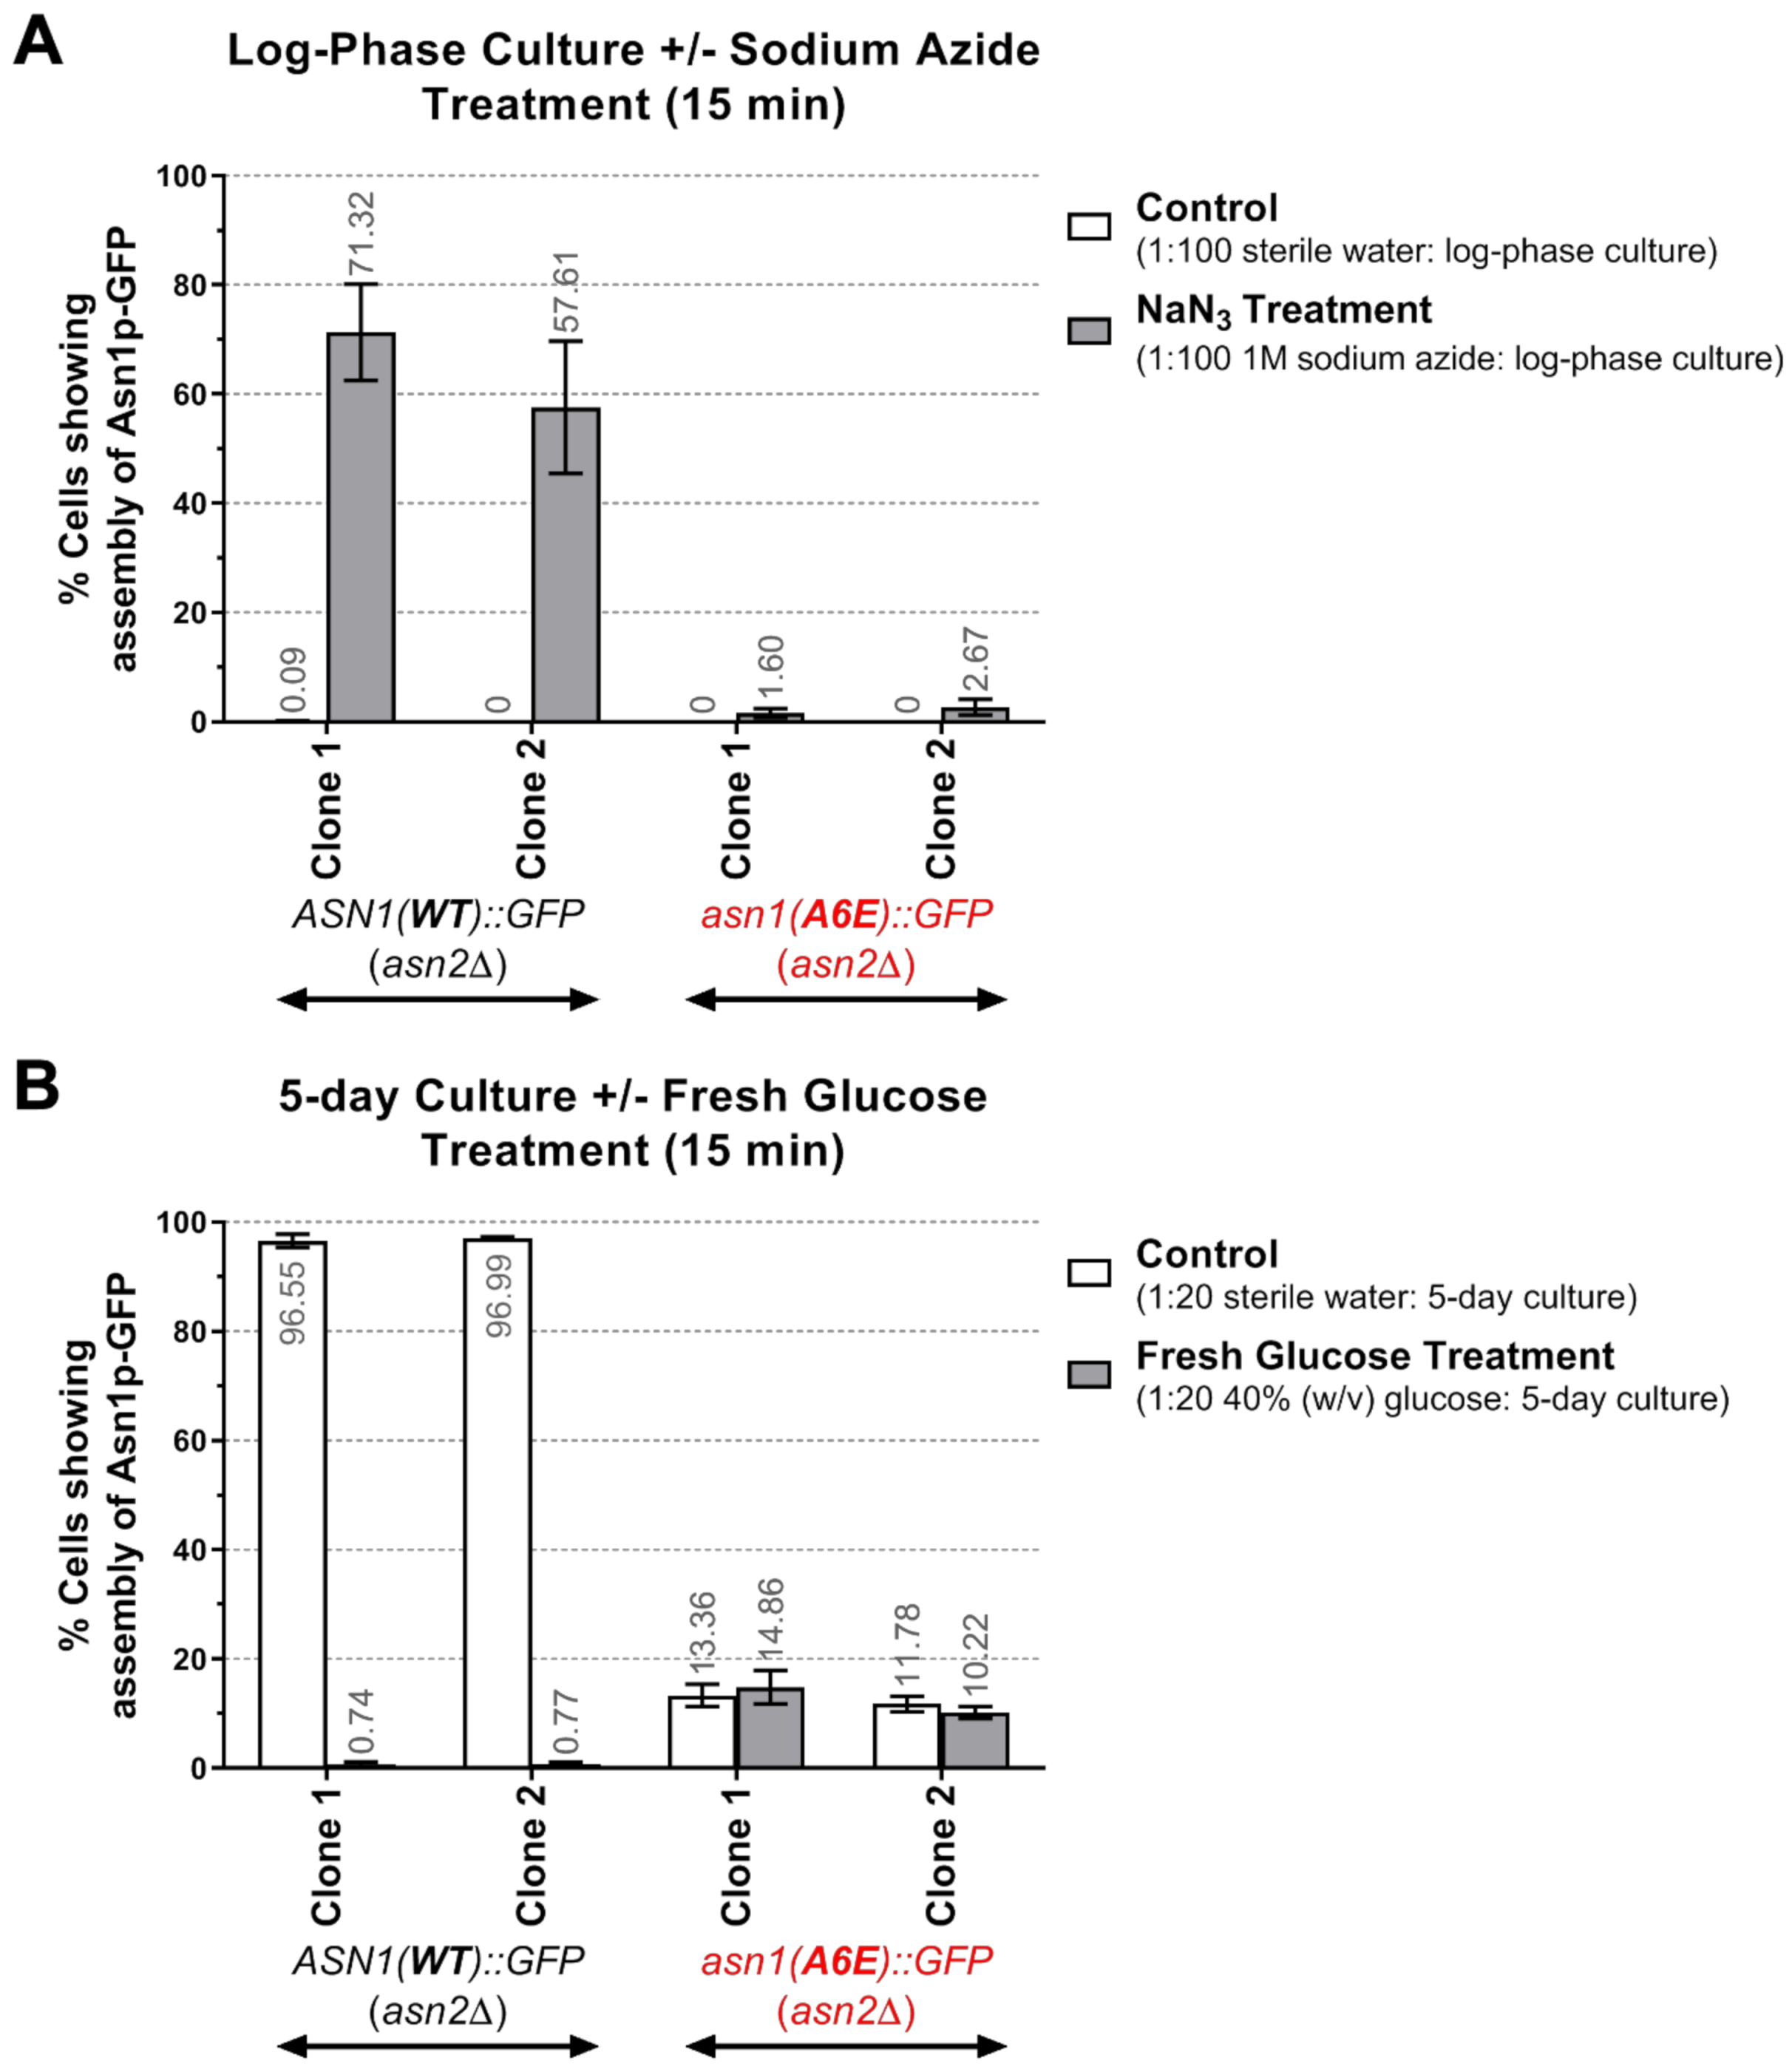
3.3. The Assembly Frequency of Asn1p(A6E)-GFP Is Significantly Lower Than That of Asn1p(WT)-GFP and the Mutant Enzyme Does Not Show Rapid Response to Changes in the Intracullar Energy Levels
4. Conclusions
Supplementary Materials
Author Contributions
Funding
Institutional Review Board Statement
Informed Consent Statement
Data Availability Statement
Acknowledgments
Conflicts of Interest
References
- Desvergne, B.; Michalik, L.; Wahli, W. Transcriptional regulation of metabolism. Physiol. Rev. 2006, 86, 465–514. [Google Scholar] [CrossRef]
- Goncalves, E.; Raguz Nakic, Z.; Zampieri, M.; Wagih, O.; Ochoa, D.; Sauer, U.; Beltrao, P.; Saez-Rodriguez, J. Systematic Analysis of Transcriptional and Post-transcriptional Regulation of Metabolism in Yeast. PLoS Comput. Biol. 2017, 13, e1005297. [Google Scholar] [CrossRef] [PubMed]
- Ryu, K.W.; Nandu, T.; Kim, J.; Challa, S.; DeBerardinis, R.J.; Kraus, W.L. Metabolic regulation of transcription through compartmentalized NAD(+) biosynthesis. Science 2018, 360, 6389. [Google Scholar] [CrossRef] [PubMed]
- Mizushima, N.; Klionsky, D.J. Protein turnover via autophagy: Implications for metabolism. Annu. Rev. Nutr. 2007, 27, 19–40. [Google Scholar] [CrossRef]
- Christiano, R.; Arlt, H.; Kabatnik, S.; Mejhert, N.; Lai, Z.W.; Farese, R.V., Jr.; Walther, T.C. A Systematic Protein Turnover Map for Decoding Protein Degradation. Cell Rep. 2020, 33, 108378. [Google Scholar] [CrossRef]
- Humphrey, S.J.; James, D.E.; Mann, M. Protein Phosphorylation: A Major Switch Mechanism for Metabolic Regulation. Trends Endocrinol. Metab. 2015, 26, 676–687. [Google Scholar] [CrossRef]
- Jurczak, M.J.; Danos, A.M.; Rehrmann, V.R.; Brady, M.J. The role of protein translocation in the regulation of glycogen metabolism. J. Cell Biochem. 2008, 104, 435–443. [Google Scholar] [CrossRef] [PubMed]
- Boukouris, A.E.; Zervopoulos, S.D.; Michelakis, E.D. Metabolic Enzymes Moonlighting in the Nucleus: Metabolic Regulation of Gene Transcription. Trends Biochem. Sci. 2016, 41, 712–730. [Google Scholar] [CrossRef]
- Hinzpeter, F.; Tostevin, F.; Gerland, U. Regulation of reaction fluxes via enzyme sequestration and co-clustering. J. R. Soc. Interface 2019, 16, 20190444. [Google Scholar] [CrossRef]
- An, S.; Kumar, R.; Sheets, E.D.; Benkovic, S.J. Reversible compartmentalization of de novo purine biosynthetic complexes in living cells. Science 2008, 320, 103–106. [Google Scholar] [CrossRef] [PubMed]
- Narayanaswamy, R.; Levy, M.; Tsechansky, M.; Stovall, G.M.; O’Connell, J.D.; Mirrielees, J.; Ellington, A.D.; Marcotte, E.M. Widespread reorganization of metabolic enzymes into reversible assemblies upon nutrient starvation. Proc. Natl. Acad. Sci. USA 2009, 106, 10147–10152. [Google Scholar] [CrossRef]
- Ingerson-Mahar, M.; Briegel, A.; Werner, J.N.; Jensen, G.J.; Gitai, Z. The metabolic enzyme CTP synthase forms cytoskeletal filaments. Nat. Cell Biol. 2010, 12, 739–746. [Google Scholar] [CrossRef] [PubMed]
- Liu, J.L. Intracellular compartmentation of CTP synthase in Drosophila. J. Genet. Genom. Yi Chuan Xue Bao 2010, 37, 281–296. [Google Scholar] [CrossRef]
- Noree, C.; Sato, B.K.; Broyer, R.M.; Wilhelm, J.E. Identification of novel filament-forming proteins in Saccharomyces cerevisiae and Drosophila melanogaster. J. Cell Biol. 2010, 190, 541–551. [Google Scholar] [CrossRef] [PubMed]
- Carcamo, W.C.; Satoh, M.; Kasahara, H.; Terada, N.; Hamazaki, T.; Chan, J.Y.; Yao, B.; Tamayo, S.; Covini, G.; von Muhlen, C.A.; et al. Induction of cytoplasmic rods and rings structures by inhibition of the CTP and GTP synthetic pathway in mammalian cells. PLoS ONE 2011, 6, e29690. [Google Scholar] [CrossRef] [PubMed]
- Webb, B.A.; Dosey, A.M.; Wittmann, T.; Kollman, J.M.; Barber, D.L. The glycolytic enzyme phosphofructokinase-1 assembles into filaments. J. Cell Biol. 2017, 216, 2305–2313. [Google Scholar] [CrossRef]
- Zhang, S.; Ding, K.; Shen, Q.J.; Zhao, S.; Liu, J.L. Filamentation of asparagine synthetase in Saccharomyces cerevisiae. PLoS Genet. 2018, 14, e1007737. [Google Scholar] [CrossRef]
- Noree, C.; Begovich, K.; Samilo, D.; Broyer, R.; Monfort, E.; Wilhelm, J.E. A quantitative screen for metabolic enzyme structures reveals patterns of assembly across the yeast metabolic network. Mol. Biol. Cell 2019, 30, 2721–2736. [Google Scholar] [CrossRef]
- Wilson, M.Z.; Gitai, Z. Beyond the cytoskeleton: Mesoscale assemblies and their function in spatial organization. Curr. Opin. Microbiol. 2013, 16, 177–183. [Google Scholar] [CrossRef]
- Barry, R.M.; Bitbol, A.F.; Lorestani, A.; Charles, E.J.; Habrian, C.H.; Hansen, J.M.; Li, H.J.; Baldwin, E.P.; Wingreen, N.S.; Kollman, J.M.; et al. Large-scale filament formation inhibits the activity of CTP synthetase. eLife 2014, 3, e03638. [Google Scholar] [CrossRef]
- Noree, C.; Monfort, E.; Shiau, A.K.; Wilhelm, J.E. Common regulatory control of CTP synthase enzyme activity and filament formation. Mol. Biol. Cell 2014, 25, 2282–2290. [Google Scholar] [CrossRef] [PubMed]
- Petrovska, I.; Nuske, E.; Munder, M.C.; Kulasegaran, G.; Malinovska, L.; Kroschwald, S.; Richter, D.; Fahmy, K.; Gibson, K.; Verbavatz, J.M.; et al. Filament formation by metabolic enzymes is a specific adaptation to an advanced state of cellular starvation. eLife 2014. [Google Scholar] [CrossRef] [PubMed]
- Aughey, G.N.; Liu, J.L. Metabolic regulation via enzyme filamentation. Crit. Rev. Biochem. Mol. Biol. 2015, 51, 282–293. [Google Scholar] [CrossRef]
- Lv, X.; Cui, S.; Gu, Y.; Li, J.; Du, G.; Liu, L. Enzyme Assembly for Compartmentalized Metabolic Flux Control. Metabolites 2020, 10, 125. [Google Scholar] [CrossRef] [PubMed]
- Lynch, E.M.; Kollman, J.M.; Webb, B.A. Filament formation by metabolic enzymes-A new twist on regulation. Curr. Opin. Cell Biol. 2020, 66, 28–33. [Google Scholar] [CrossRef]
- Shen, Q.J.; Kassim, H.; Huang, Y.; Li, H.; Zhang, J.; Li, G.; Wang, P.Y.; Yan, J.; Ye, F.; Liu, J.L. Filamentation of Metabolic Enzymes in Saccharomyces cerevisiae. J. Genet. Genom. Yi Chuan Xue Bao 2016, 43, 393–404. [Google Scholar] [CrossRef]
- Noree, C.; Monfort, E.; Shotelersuk, V. Human asparagine synthetase associates with the mitotic spindle. Biol. Open 2018, 7. [Google Scholar] [CrossRef]
- Noree, C.; Sirinonthanawech, N.; Wilhelm, J.E. Saccharomyces cerevisiae ASN1 and ASN2 are asparagine synthetase paralogs that have diverged in their ability to polymerize in response to nutrient stress. Sci. Rep. 2019, 9, 278. [Google Scholar] [CrossRef]
- Boehlein, S.K.; Richards, N.G.; Schuster, S.M. Glutamine-dependent nitrogen transfer in Escherichia coli asparagine synthetase B. Searching for the catalytic triad. J. Biol. Chem. 1994, 269, 7450–7457. [Google Scholar] [CrossRef]
- Noree, C.; Sirinonthanawech, N. Nuclear targeted Saccharomyces cerevisiae asparagine synthetases associate with the mitotic spindle regardless of their enzymatic activity. PLoS ONE 2020, 15, e0243742. [Google Scholar] [CrossRef] [PubMed]
- Ruzzo, E.K.; Capo-Chichi, J.M.; Ben-Zeev, B.; Chitayat, D.; Mao, H.; Pappas, A.L.; Hitomi, Y.; Lu, Y.F.; Yao, X.; Hamdan, F.F.; et al. Deficiency of asparagine synthetase causes congenital microcephaly and a progressive form of encephalopathy. Neuron 2013, 80, 429–441. [Google Scholar] [CrossRef] [PubMed]
- Alfadhel, M.; Alrifai, M.T.; Trujillano, D.; Alshaalan, H.; Al Othaim, A.; Al Rasheed, S.; Assiri, H.; Alqahtani, A.A.; Alaamery, M.; Rolfs, A.; et al. Asparagine Synthetase Deficiency: New Inborn Errors of Metabolism. JIMD Rep. 2015, 22, 11–16. [Google Scholar] [CrossRef] [PubMed]
- Ben-Salem, S.; Gleeson, J.G.; Al-Shamsi, A.M.; Islam, B.; Hertecant, J.; Ali, B.R.; Al-Gazali, L. Asparagine synthetase deficiency detected by whole exome sequencing causes congenital microcephaly, epileptic encephalopathy and psychomotor delay. Metab. Brain Dis. 2015, 30, 687–694. [Google Scholar] [CrossRef]
- Palmer, E.E.; Hayner, J.; Sachdev, R.; Cardamone, M.; Kandula, T.; Morris, P.; Dias, K.R.; Tao, J.; Miller, D.; Zhu, Y.; et al. Asparagine Synthetase Deficiency causes reduced proliferation of cells under conditions of limited asparagine. Mol. Genet. Metab. 2015, 116, 178–186. [Google Scholar] [CrossRef]
- Gataullina, S.; Lauer-Zillhardt, J.; Kaminska, A.; Galmiche-Rolland, L.; Bahi-Buisson, N.; Pontoizeau, C.; Ottolenghi, C.; Dulac, O.; Fallet-Bianco, C. Epileptic Phenotype of Two Siblings with Asparagine Synthesis Deficiency Mimics Neonatal Pyridoxine-Dependent Epilepsy. Neuropediatrics 2016, 47, 399–403. [Google Scholar] [CrossRef]
- Seidahmed, M.Z.; Salih, M.A.; Abdulbasit, O.B.; Samadi, A.; Al Hussien, K.; Miqdad, A.M.; Biary, M.S.; Alazami, A.M.; Alorainy, I.A.; Kabiraj, M.M.; et al. Hyperekplexia, microcephaly and simplified gyral pattern caused by novel ASNS mutations, case report. BMC Neurol. 2016, 16, 105. [Google Scholar] [CrossRef]
- Gupta, N.; Tewari, V.V.; Kumar, M.; Langeh, N.; Gupta, A.; Mishra, P.; Kaur, P.; Ramprasad, V.; Murugan, S.; Kumar, R.; et al. Asparagine Synthetase deficiency-report of a novel mutation and review of literature. Metab. Brain Dis. 2017, 32, 1889–1900. [Google Scholar] [CrossRef]
- Sun, J.; McGillivray, A.J.; Pinner, J.; Yan, Z.; Liu, F.; Bratkovic, D.; Thompson, E.; Wei, X.; Jiang, H.; Asan; et al. Diaphragmatic Eventration in Sisters with Asparagine Synthetase Deficiency: A Novel Homozygous ASNS Mutation and Expanded Phenotype. JIMD Rep. 2017, 34, 1–9. [Google Scholar] [CrossRef] [PubMed]
- Sacharow, S.J.; Dudenhausen, E.E.; Lomelino, C.L.; Rodan, L.; El Achkar, C.M.; Olson, H.E.; Genetti, C.A.; Agrawal, P.B.; McKenna, R.; Kilberg, M.S. Characterization of a novel variant in siblings with Asparagine Synthetase Deficiency. Mol. Genet. Metab. 2017, 123, 317–325. [Google Scholar] [CrossRef] [PubMed]
- Yamamoto, T.; Endo, W.; Ohnishi, H.; Kubota, K.; Kawamoto, N.; Inui, T.; Imamura, A.; Takanashi, J.I.; Shiina, M.; Saitsu, H.; et al. The first report of Japanese patients with asparagine synthetase deficiency. Brain Dev. 2017, 39, 236–242. [Google Scholar] [CrossRef]
- Abhyankar, A.; Lamendola-Essel, M.; Brennan, K.; Giordano, J.L.; Esteves, C.; Felice, V.; Wapner, R.; Jobanputra, V. Clinical whole exome sequencing from dried blood spot identifies novel genetic defect underlying asparagine synthetase deficiency. Clin. Case Rep. 2018, 6, 200–205. [Google Scholar] [CrossRef]
- Galada, C.; Hebbar, M.; Lewis, L.; Soans, S.; Kadavigere, R.; Srivastava, A.; Bielas, S.; Girisha, K.M.; Shukla, A. Report of four novel variants in ASNS causing asparagine synthetase deficiency and review of literature. Congenit. Anom. 2018, 58, 181–182. [Google Scholar] [CrossRef]
- Schleinitz, D.; Seidel, A.; Stassart, R.; Klammt, J.; Hirrlinger, P.G.; Winkler, U.; Kohler, S.; Heiker, J.T.; Schonauer, R.; Bialek, J.; et al. Novel Mutations in the Asparagine Synthetase Gene (ASNS) Associated With Microcephaly. Front. Genet. 2018, 9, 245. [Google Scholar] [CrossRef] [PubMed]
- Chen, B.; Li, W.; Wang, X.; Chen, K.; Hong, X. Cyst-Peritoneal Shunt for the Treatment of a Progressive Intracerebral Cyst Associated with ASNS Mutation: Case Report and Literature Review. World Neurosurg. 2019, 127, 1–7. [Google Scholar] [CrossRef]
- Radha Rama Devi, A.; Naushad, S.M. Molecular diagnosis of asparagine synthetase (ASNS) deficiency in two Indian families and literature review of 29 ASNS deficient cases. Gene 2019, 704, 97–102. [Google Scholar] [CrossRef]
- Sprute, R.; Ardicli, D.; Oguz, K.K.; Malenica-Mandel, A.; Daimagüler, H.-S.; Koy, A.; Coskun, T.; Wang, H.; Topcu, M.; Cirak, S. Clinical outcomes of two patients with a novel pathogenic variant in ASNS: Response to asparagine supplementation and review of the literature. Hum. Genome Var. 2019, 6, 24. [Google Scholar] [CrossRef] [PubMed]
- Wang, C.; He, G.; Ge, Y.; Li, R.; Li, Z.; Lin, Y. A novel compound heterozygous missense mutation in ASNS broadens the spectrum of asparagine synthetase deficiency. Mol. Genet. Genom. Med. 2020, 8, e1235. [Google Scholar] [CrossRef]
- Petracek, M.E.; Longtine, M.S. PCR-based engineering of yeast genome. Methods Enzymol. 2002, 350, 445–469. [Google Scholar]
- Outeiro, T.F.; Lindquist, S. Yeast cells provide insight into alpha-synuclein biology and pathobiology. Science 2003, 302, 1772–1775. [Google Scholar] [CrossRef] [PubMed]
- Giorgini, F.; Guidetti, P.; Nguyen, Q.; Bennett, S.C.; Muchowski, P.J. A genomic screen in yeast implicates kynurenine 3-monooxygenase as a therapeutic target for Huntington disease. Nat. Genet. 2005, 37, 526–531. [Google Scholar] [CrossRef]
- Cooper, A.A.; Gitler, A.D.; Cashikar, A.; Haynes, C.M.; Hill, K.J.; Bhullar, B.; Liu, K.; Xu, K.; Strathearn, K.E.; Liu, F.; et al. Alpha-synuclein blocks ER-Golgi traffic and Rab1 rescues neuron loss in Parkinson’s models. Science 2006, 313, 324–328. [Google Scholar] [CrossRef]
- Duennwald, M.L.; Lindquist, S. Impaired ERAD and ER stress are early and specific events in polyglutamine toxicity. Genes Dev. 2008, 22, 3308–3319. [Google Scholar] [CrossRef]
- Johnson, B.S.; McCaffery, J.M.; Lindquist, S.; Gitler, A.D. A yeast TDP-43 proteinopathy model: Exploring the molecular determinants of TDP-43 aggregation and cellular toxicity. Proc. Natl. Acad. Sci. USA 2008, 105, 6439–6444. [Google Scholar] [CrossRef]
- Treusch, S.; Hamamichi, S.; Goodman, J.L.; Matlack, K.E.; Chung, C.Y.; Baru, V.; Shulman, J.M.; Parrado, A.; Bevis, B.J.; Valastyan, J.S.; et al. Functional links between Abeta toxicity, endocytic trafficking, and Alzheimer’s disease risk factors in yeast. Science 2011, 334, 1241–1245. [Google Scholar] [CrossRef]
- Bharadwaj, P.R.; Verdile, G.; Barr, R.K.; Gupta, V.; Steele, J.W.; Lachenmayer, M.L.; Yue, Z.; Ehrlich, M.E.; Petsko, G.; Ju, S.; et al. Latrepirdine (dimebon) enhances autophagy and reduces intracellular GFP-Abeta42 levels in yeast. J. Alzheimers Dis. 2012, 32, 949–967. [Google Scholar] [CrossRef]
- Tardiff, D.F.; Jui, N.T.; Khurana, V.; Tambe, M.A.; Thompson, M.L.; Chung, C.Y.; Kamadurai, H.B.; Kim, H.T.; Lancaster, A.K.; Caldwell, K.A.; et al. Yeast reveal a “druggable” Rsp5/Nedd4 network that ameliorates alpha-synuclein toxicity in neurons. Science 2013, 342, 979–983. [Google Scholar] [CrossRef] [PubMed]
- Bastow, E.L.; Peswani, A.R.; Tarrant, D.S.; Pentland, D.R.; Chen, X.; Morgan, A.; Staniforth, G.L.; Tullet, J.M.; Rowe, M.L.; Howard, M.J.; et al. New links between SOD1 and metabolic dysfunction from a yeast model of amyotrophic lateral sclerosis. J. Cell Sci. 2016, 129, 4118–4129. [Google Scholar] [CrossRef]
- Monahan, Z.T.; Rhoads, S.N.; Yee, D.S.; Shewmaker, F.P. Yeast Models of Prion-Like Proteins That Cause Amyotrophic Lateral Sclerosis Reveal Pathogenic Mechanisms. Front. Mol. Neurosci. 2018, 11, 453. [Google Scholar] [CrossRef] [PubMed]
- Lomelino, C.L.; Andring, J.T.; McKenna, R.; Kilberg, M.S. Asparagine synthetase: Function, structure, and role in disease. J. Biol. Chem. 2017, 292, 19952–19958. [Google Scholar] [CrossRef]
- Chiu, M.; Taurino, G.; Bianchi, M.G.; Kilberg, M.S.; Bussolati, O. Asparagine Synthetase in Cancer: Beyond Acute Lymphoblastic Leukemia. Front. Oncol. 2019, 9, 1480. [Google Scholar] [CrossRef] [PubMed]


| Yeast Strain | Clone # | OD600/mL (Average ± SEM) | |||||
|---|---|---|---|---|---|---|---|
| Log phase | Day 1 | Day 2 | Day 3 | Day 4 | Day 5 | ||
| ASN1(WT)::GFP (asn2Δ) | 1 | 0.60 ± 0.01 | 12.97 ± 0.16 | 14.91 ± 0.13 | 15.39 ± 0.11 | 16.42 ± 0.10 | 16.35 ± 0.57 |
| 2 | 0.60 ± 0.01 | 12.89 ± 0.06 | 15.12 ± 0.31 | 15.40 ± 0.29 | 16.12 ± 0.11 | 16.07 ± 0.26 | |
| asn1(A6E)::GFP (asn2Δ) | 1 | 0.50 ± 0.04 | 12.03 ± 0.22 | 13.48 ± 0.08 | 13.79 ± 0.11 | 14.82 ± 0.15 | 14.78 ± 0.57 |
| 2 | 0.51 ± 0.03 | 12.18 ± 0.14 | 14.01 ± 0.36 | 14.30 ± 0.13 | 14.95 ± 0.18 | 15.12 ± 0.53 | |
| Paired t-Test (99% confidence level, two-tailed) | p-value | p-value Summary | Significant different? (p < 0.01) | ||||
| ASN1(WT)::GFP (asn2Δ) Clone 1 vs. ASN1(WT)::GFP (asn2Δ) Clone 2 | 0.3897 | ns | No | ||||
| ASN1(WT)::GFP (asn2Δ) Clone 1 vs. asn1(A6E)::GFP (asn2Δ) Clone 1 | 0.0043 | ** | Yes | ||||
| ASN1(WT)::GFP (asn2Δ) Clone 1 vs. asn1(A6E)::GFP (asn2Δ) Clone 2 | 0.0050 | ** | Yes | ||||
| ASN1(WT)::GFP (asn2Δ) Clone 2 vs. asn1(A6E)::GFP (asn2Δ) Clone 1 | 0.0049 | ** | Yes | ||||
| ASN1(WT)::GFP (asn2Δ) Clone 2 vs. asn1(A6E)::GFP (asn2Δ) Clone 2 | 0.0038 | ** | Yes | ||||
| asn1(A6E)::GFP (asn2Δ) Clone 1 vs. asn1(A6E)::GFP (asn2Δ) Clone 2 | 0.0237 | * | No | ||||
Publisher’s Note: MDPI stays neutral with regard to jurisdictional claims in published maps and institutional affiliations. |
© 2021 by the authors. Licensee MDPI, Basel, Switzerland. This article is an open access article distributed under the terms and conditions of the Creative Commons Attribution (CC BY) license (https://creativecommons.org/licenses/by/4.0/).
Share and Cite
Surasiang, T.; Noree, C. Effects of A6E Mutation on Protein Expression and Supramolecular Assembly of Yeast Asparagine Synthetase. Biology 2021, 10, 294. https://doi.org/10.3390/biology10040294
Surasiang T, Noree C. Effects of A6E Mutation on Protein Expression and Supramolecular Assembly of Yeast Asparagine Synthetase. Biology. 2021; 10(4):294. https://doi.org/10.3390/biology10040294
Chicago/Turabian StyleSurasiang, Thunyarat, and Chalongrat Noree. 2021. "Effects of A6E Mutation on Protein Expression and Supramolecular Assembly of Yeast Asparagine Synthetase" Biology 10, no. 4: 294. https://doi.org/10.3390/biology10040294
APA StyleSurasiang, T., & Noree, C. (2021). Effects of A6E Mutation on Protein Expression and Supramolecular Assembly of Yeast Asparagine Synthetase. Biology, 10(4), 294. https://doi.org/10.3390/biology10040294