Plant Endemism Centres and Biodiversity Hotspots in Greece
Simple Summary
Abstract
1. Introduction
2. Materials and Methods
2.1. Environmental Data
2.2. Species Occurrence Data
2.3. Phylogenetic Tree
2.4. Biodiversity Analyses
2.5. Spatial Autoregressive Models
2.6. SACs Overlap
3. Results
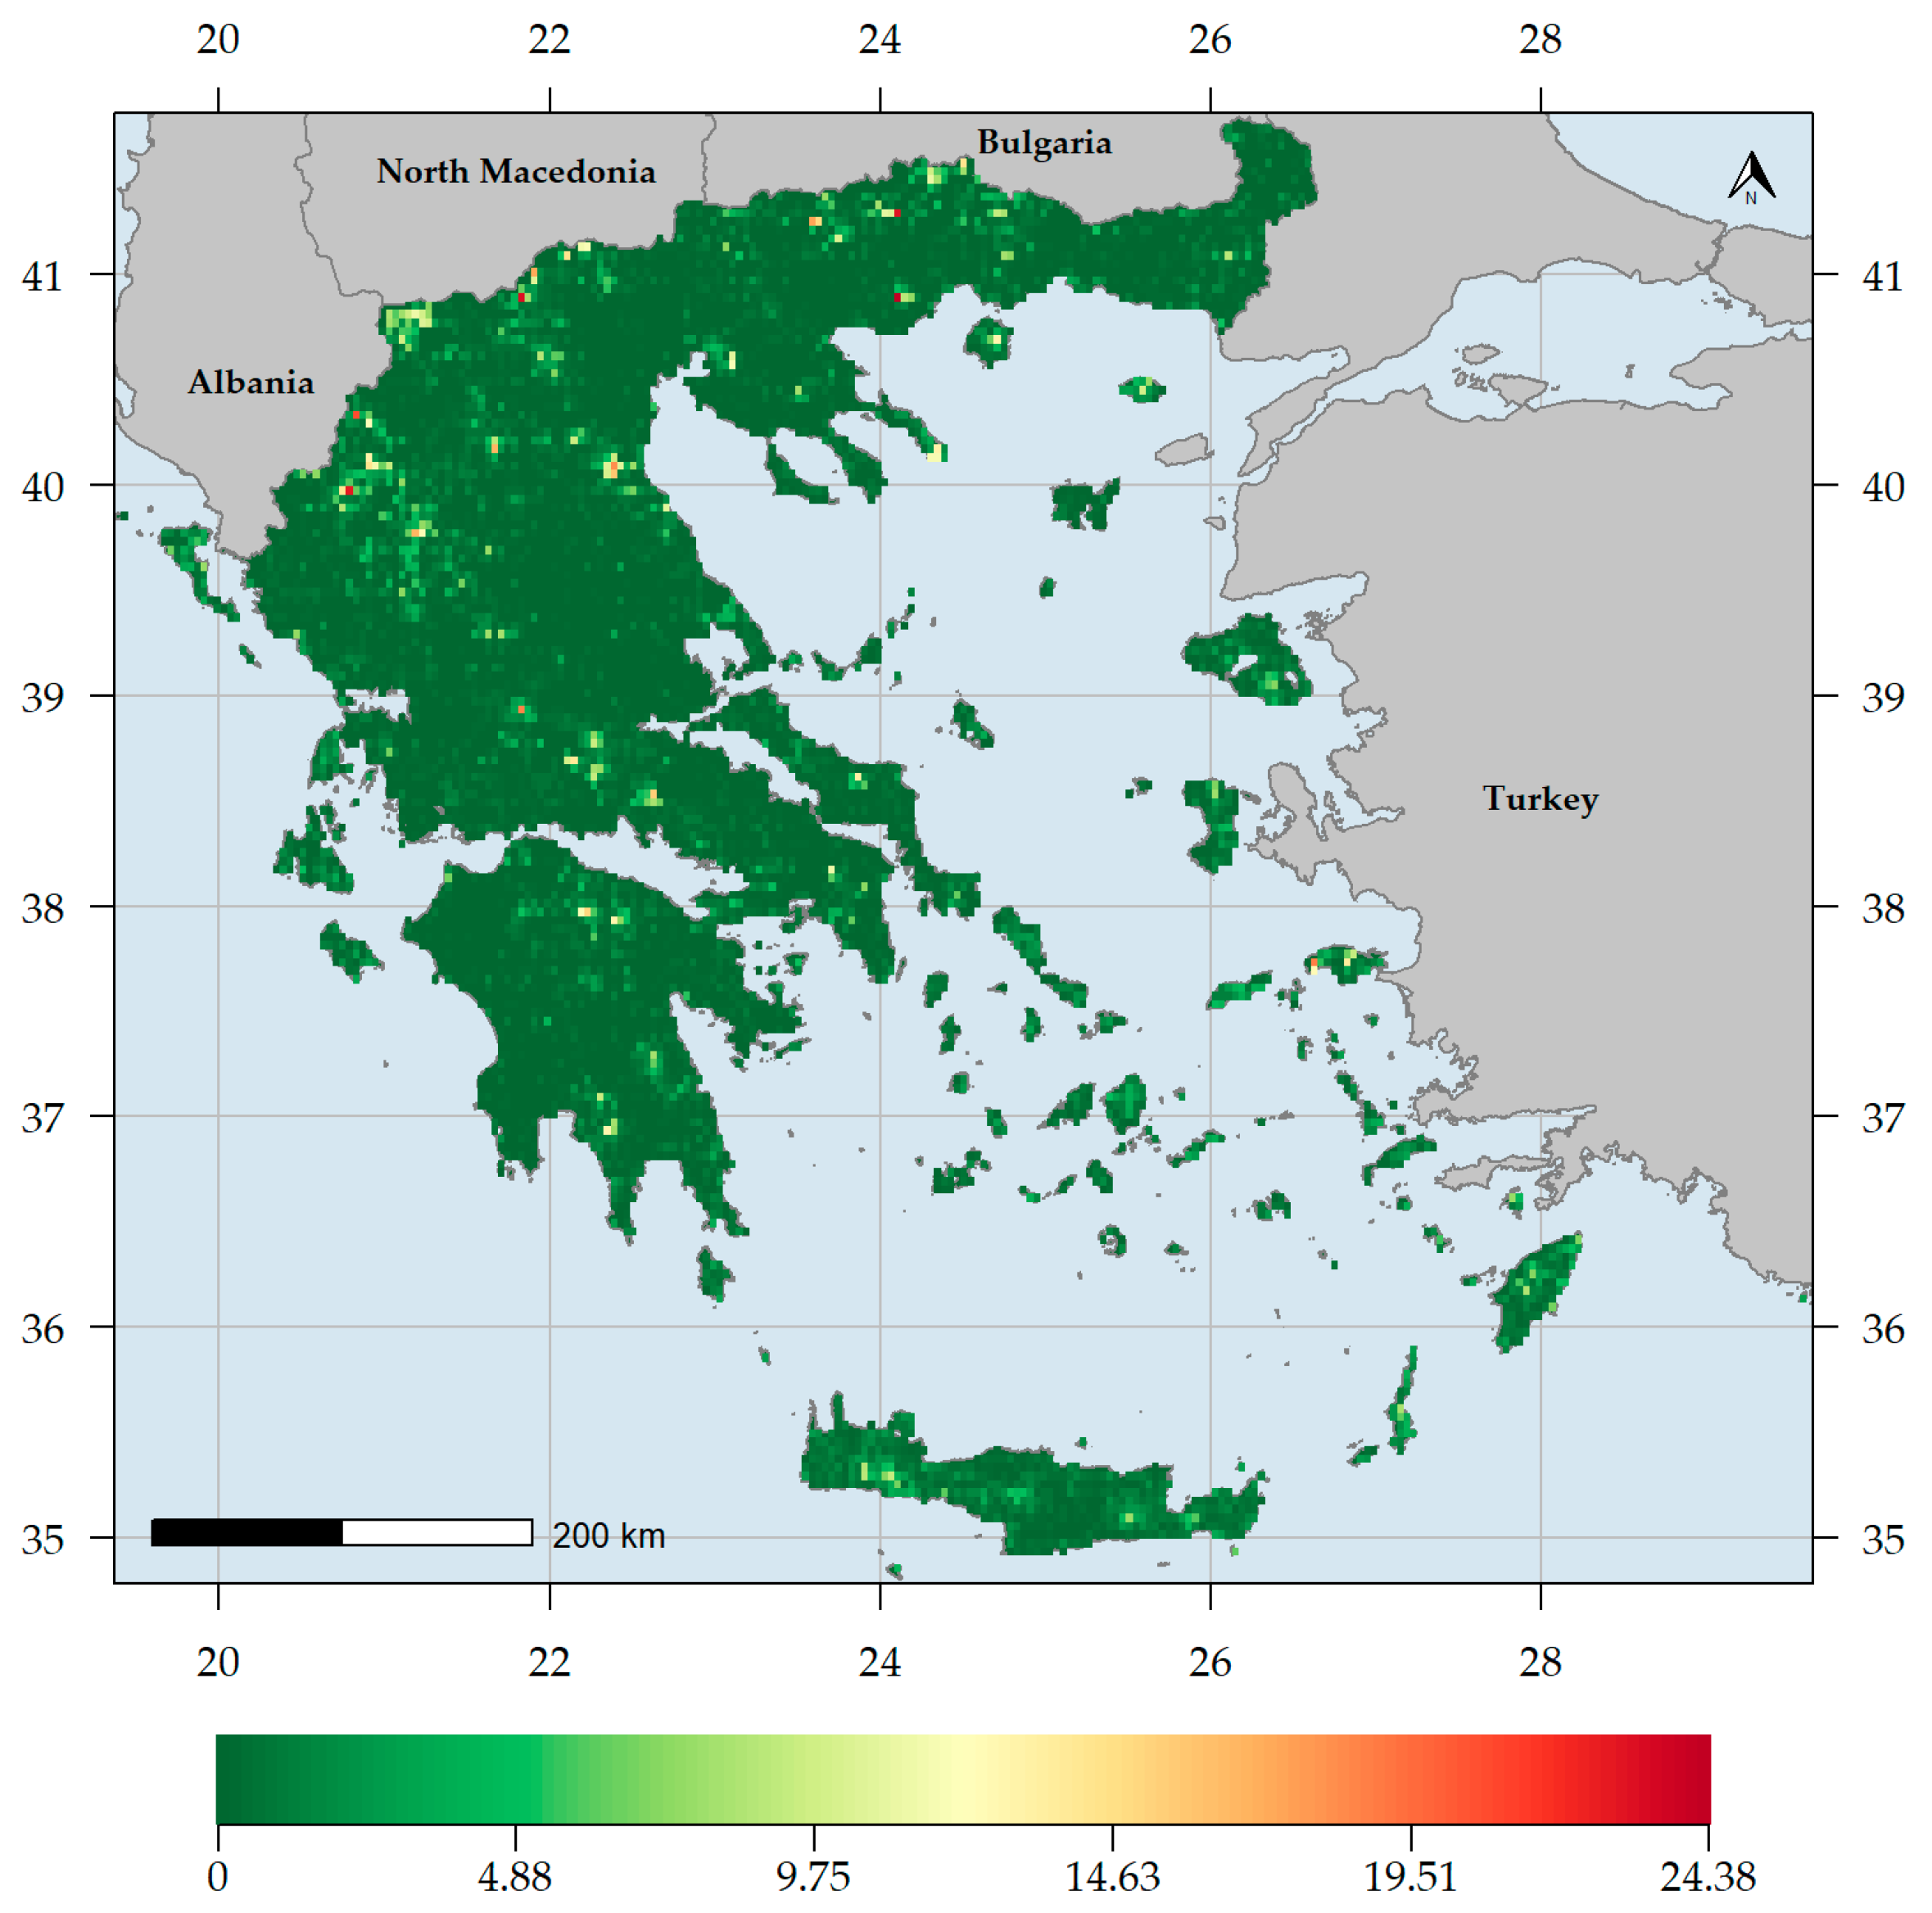
3.1. Biodiversity Hotspots and Centres of Endemism in Greece
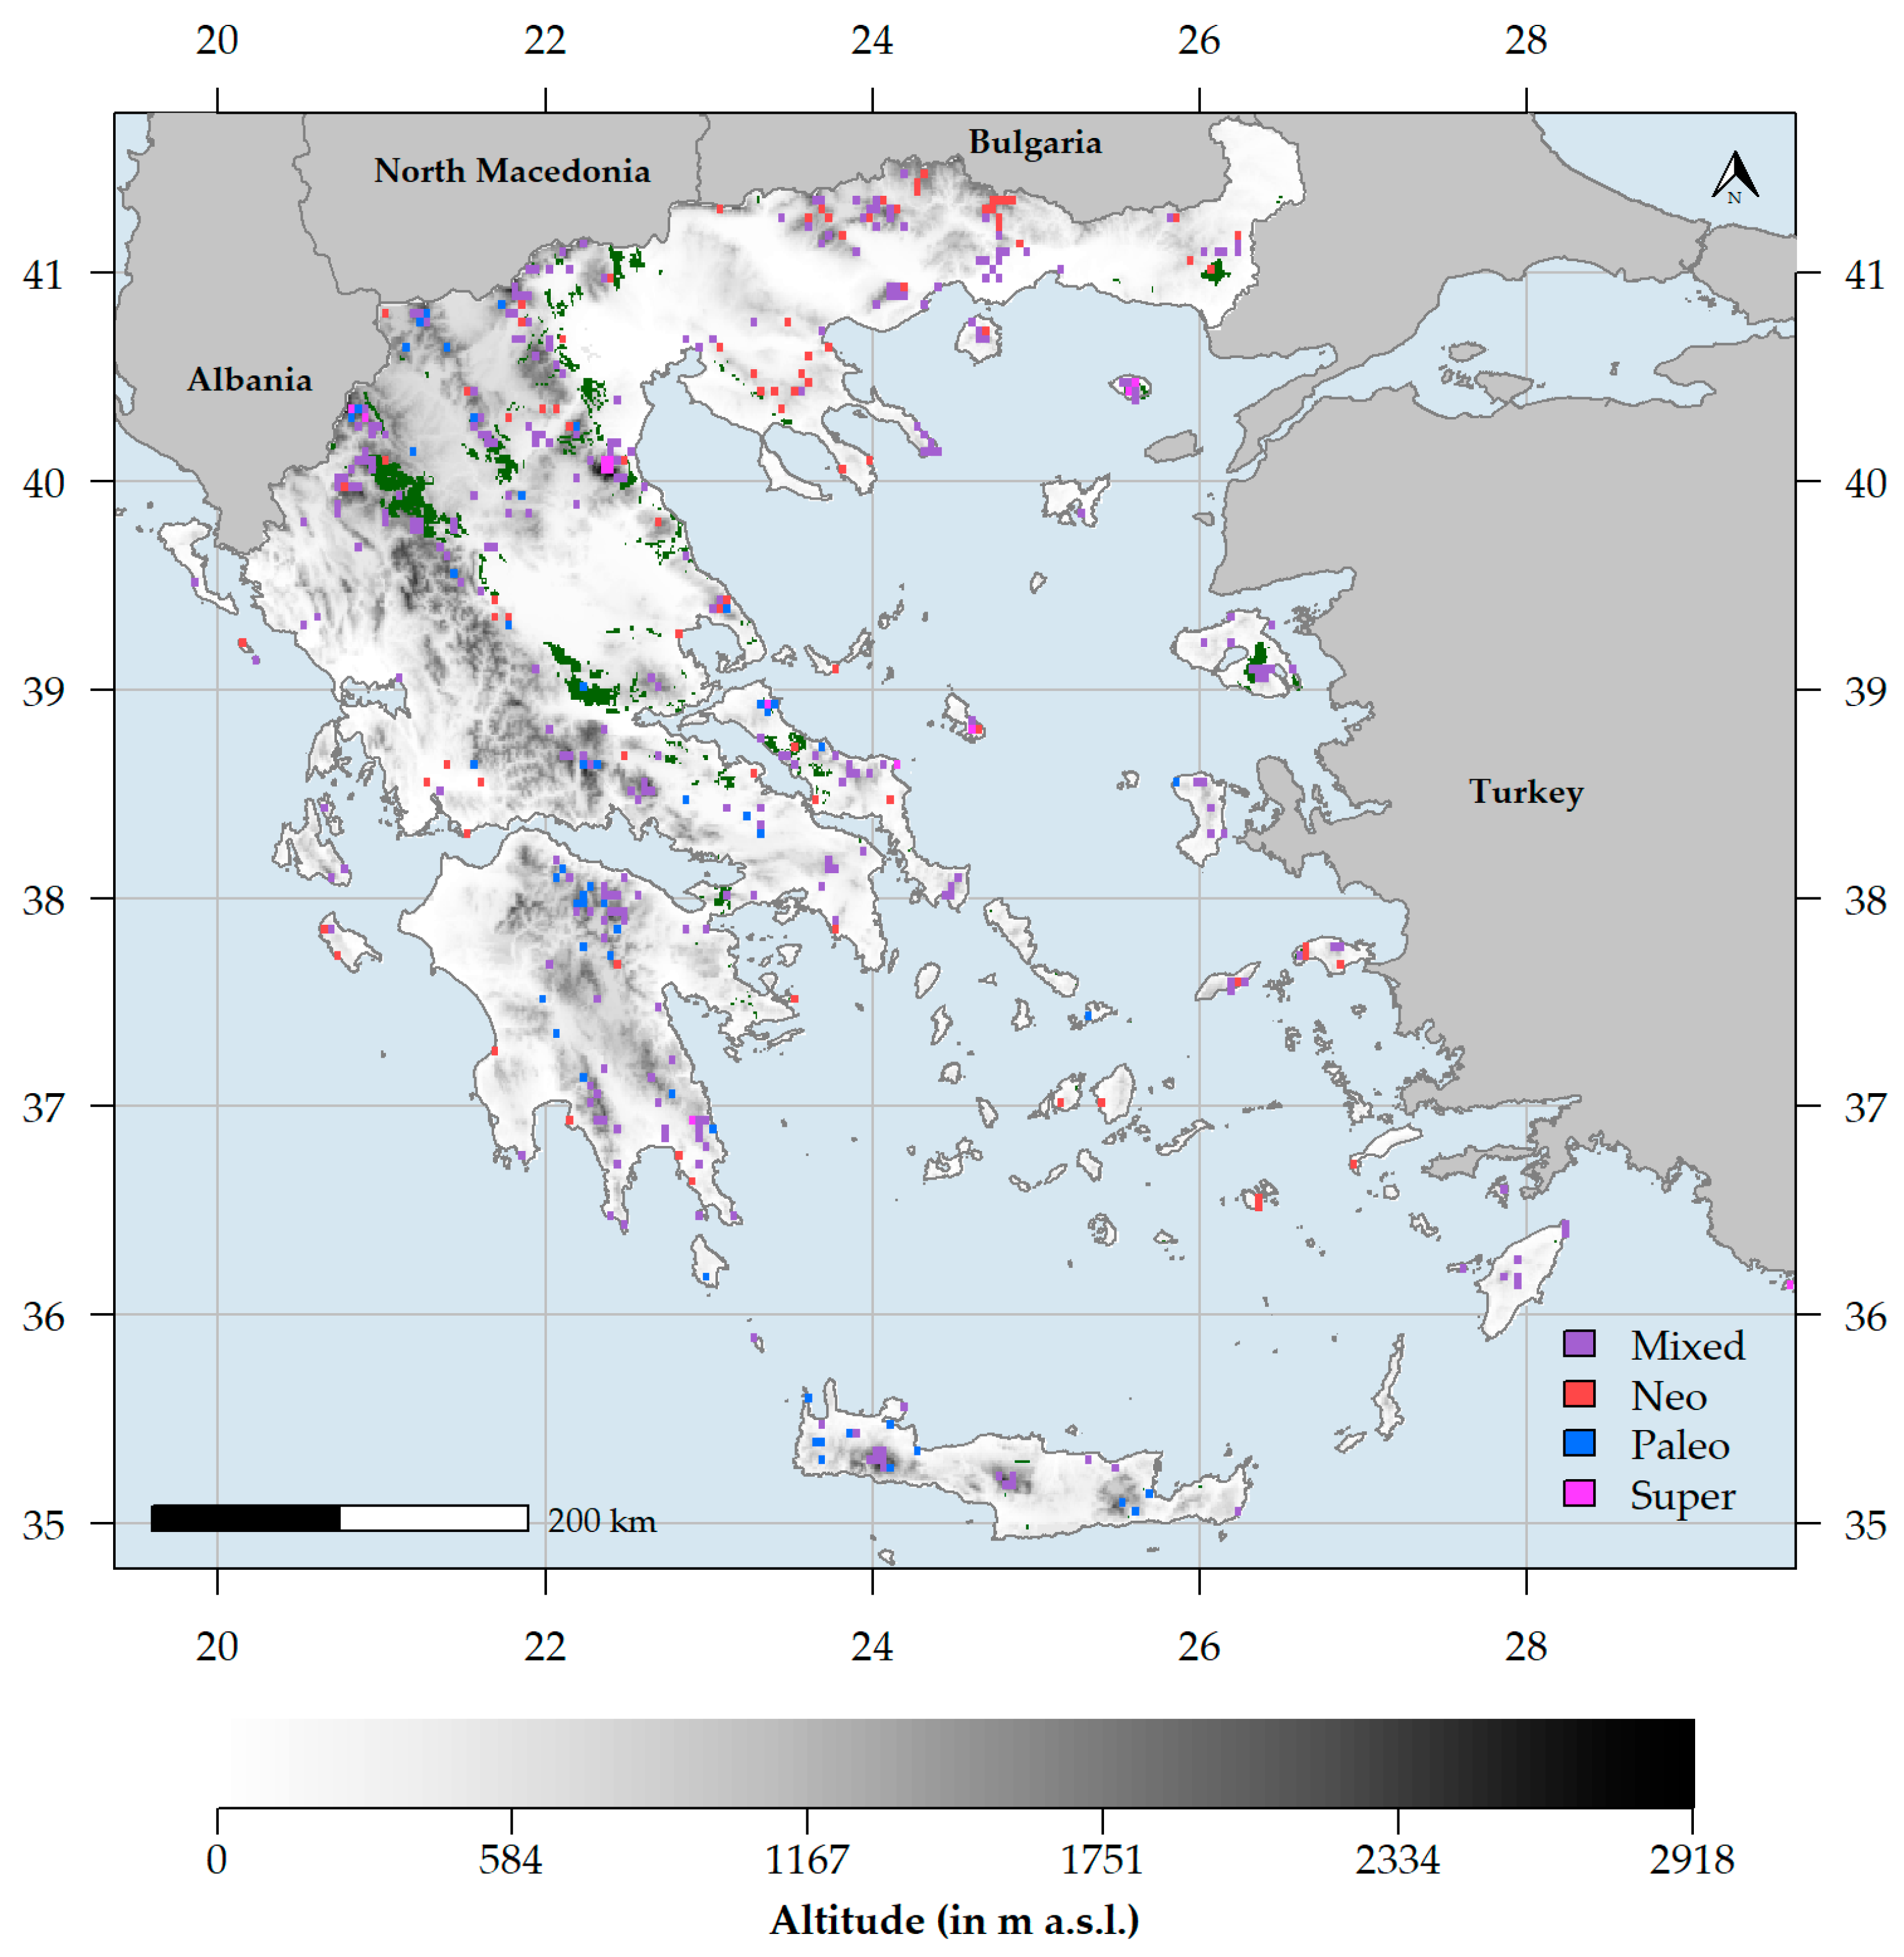
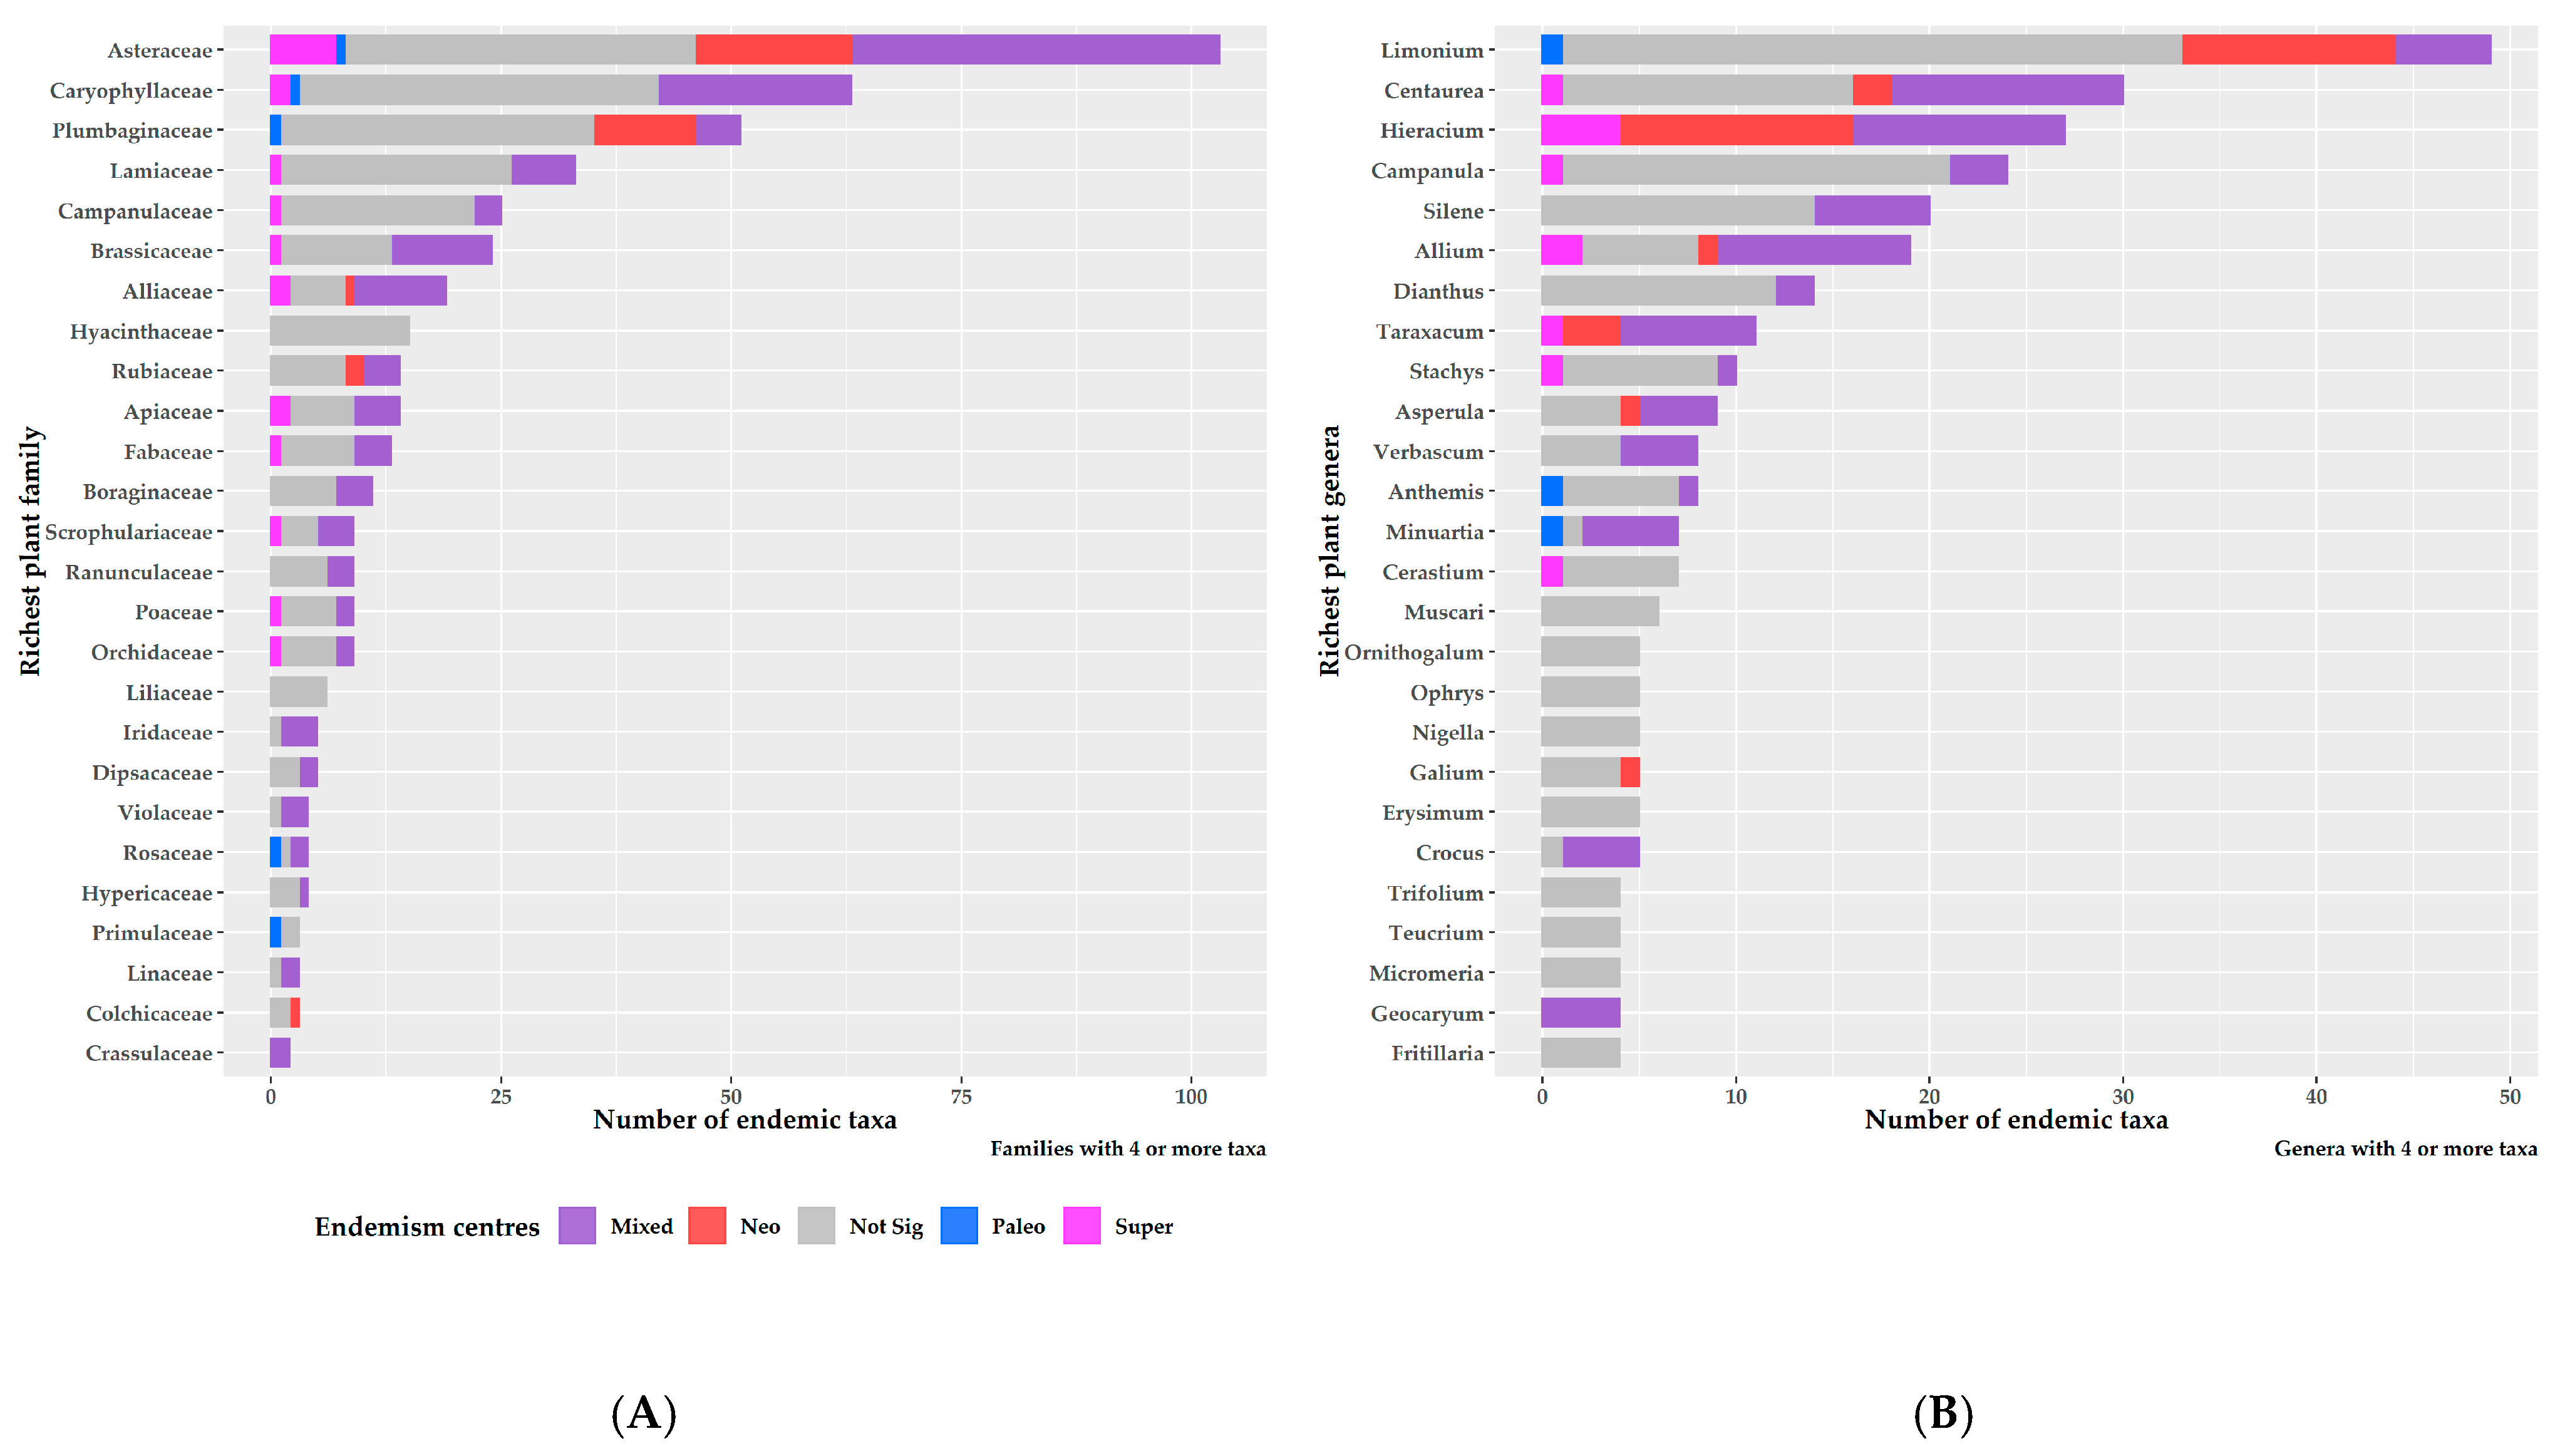
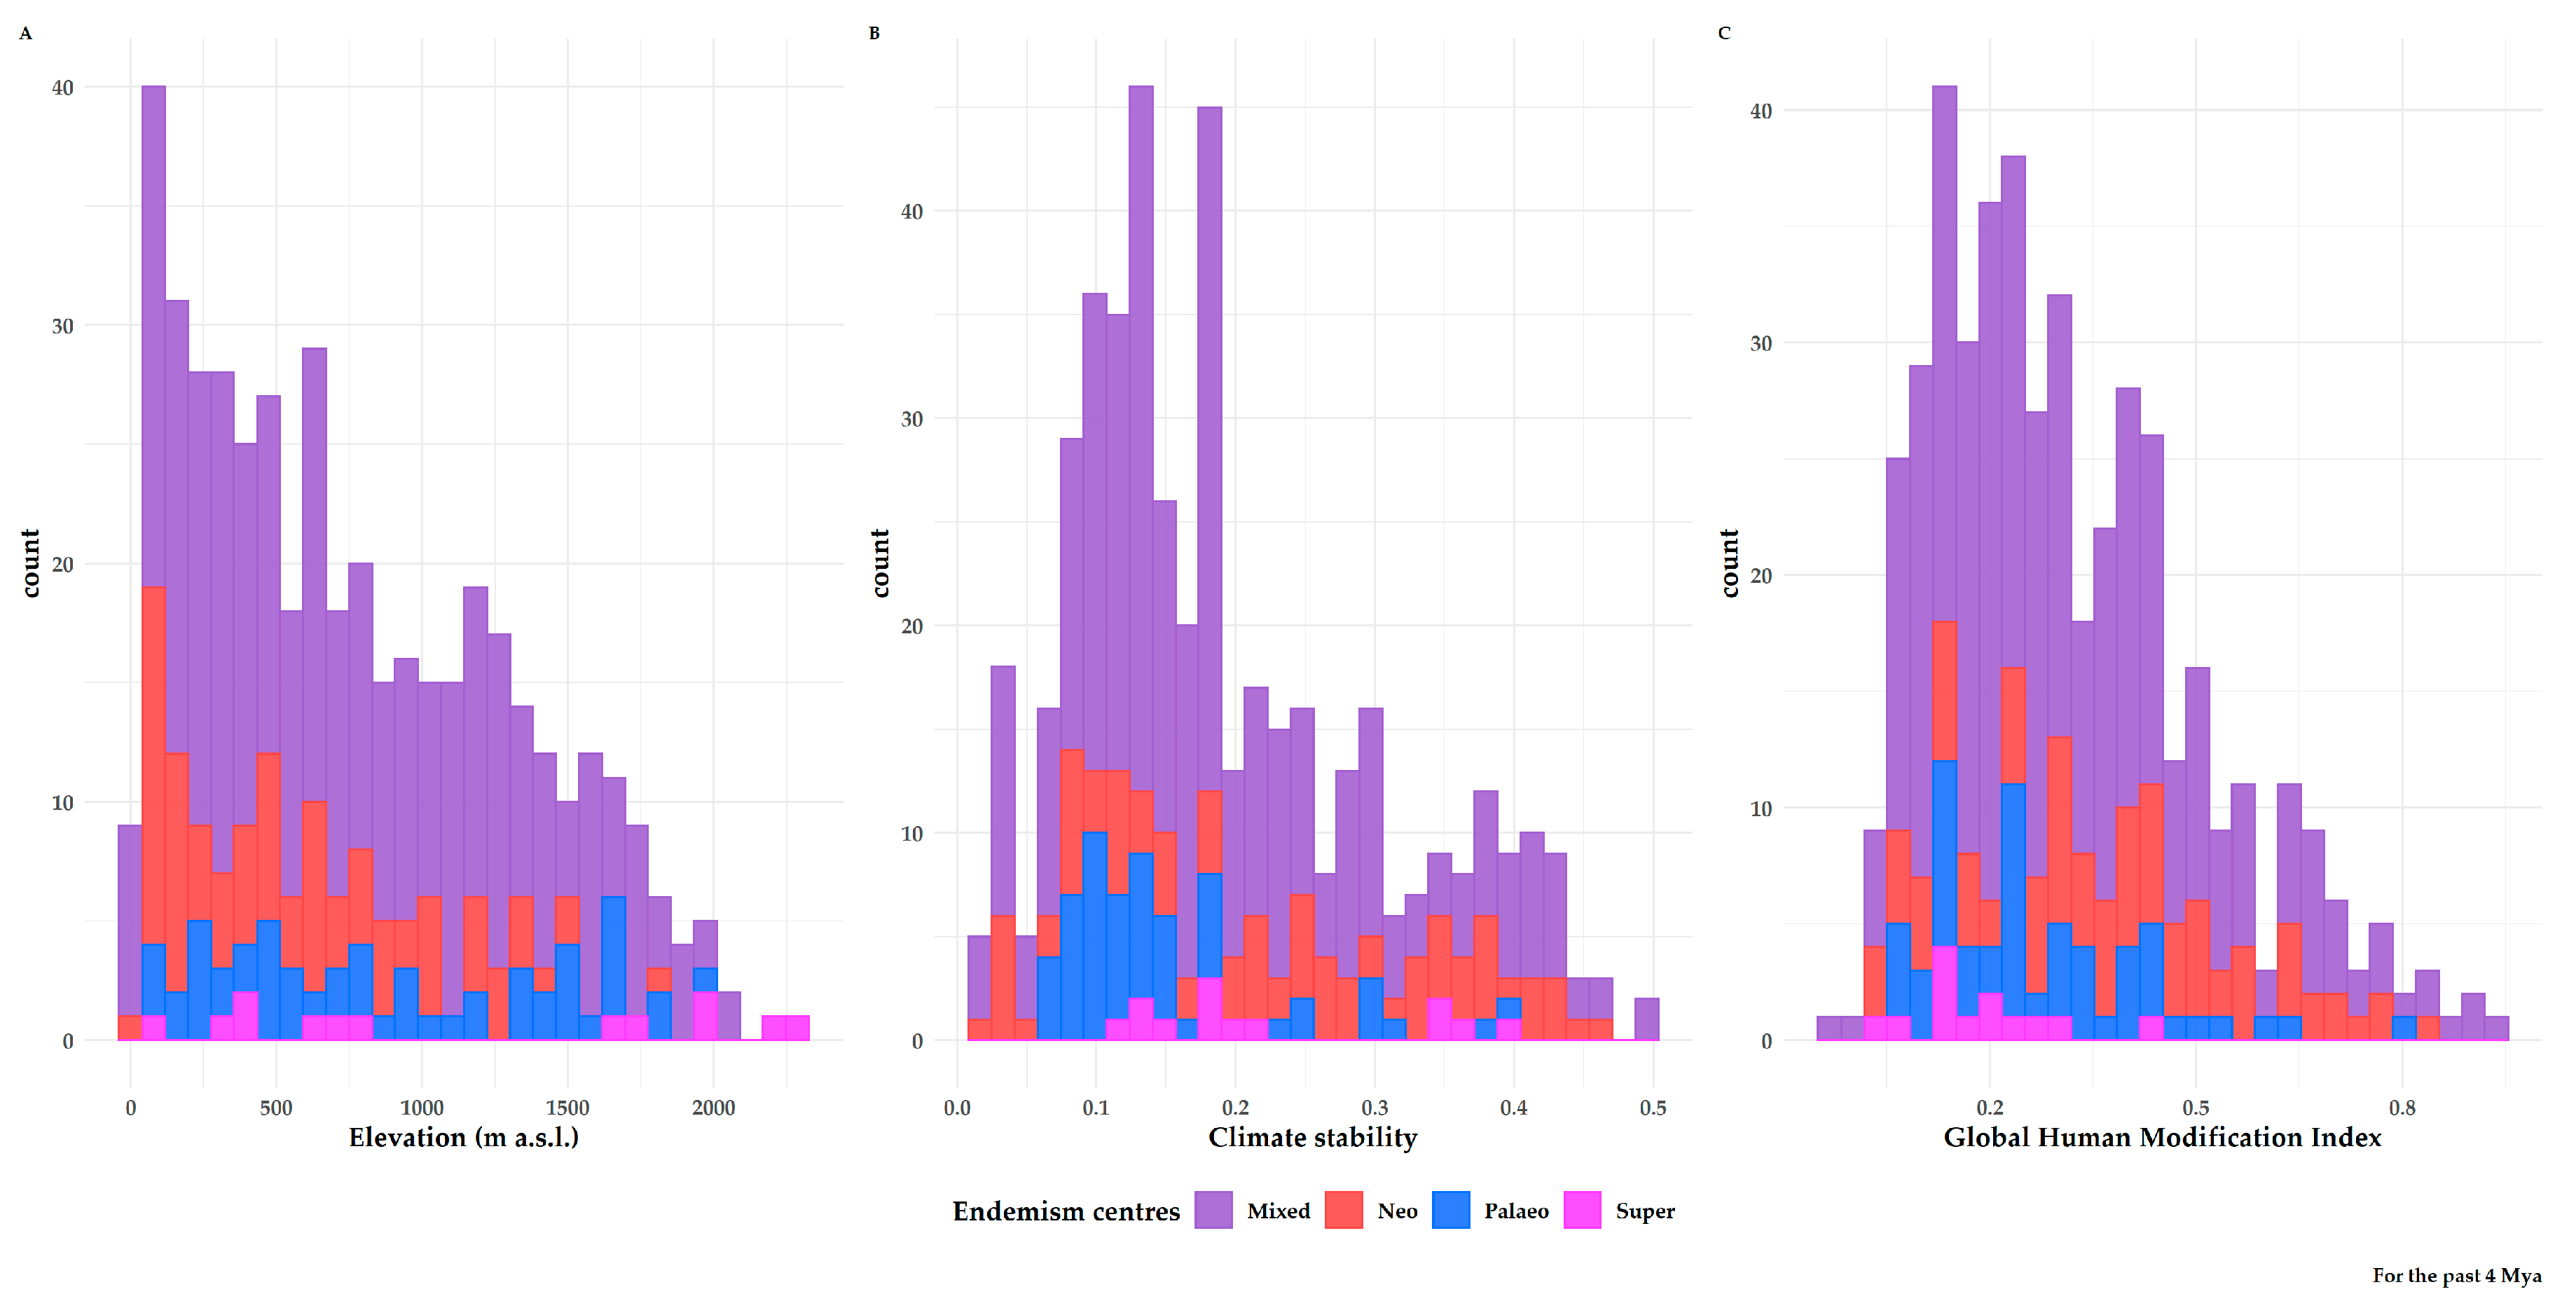
3.2. Characteristics of Endemism Centres
3.3. Factors Shaping Biodiversity Hotspots and Endemism Centres
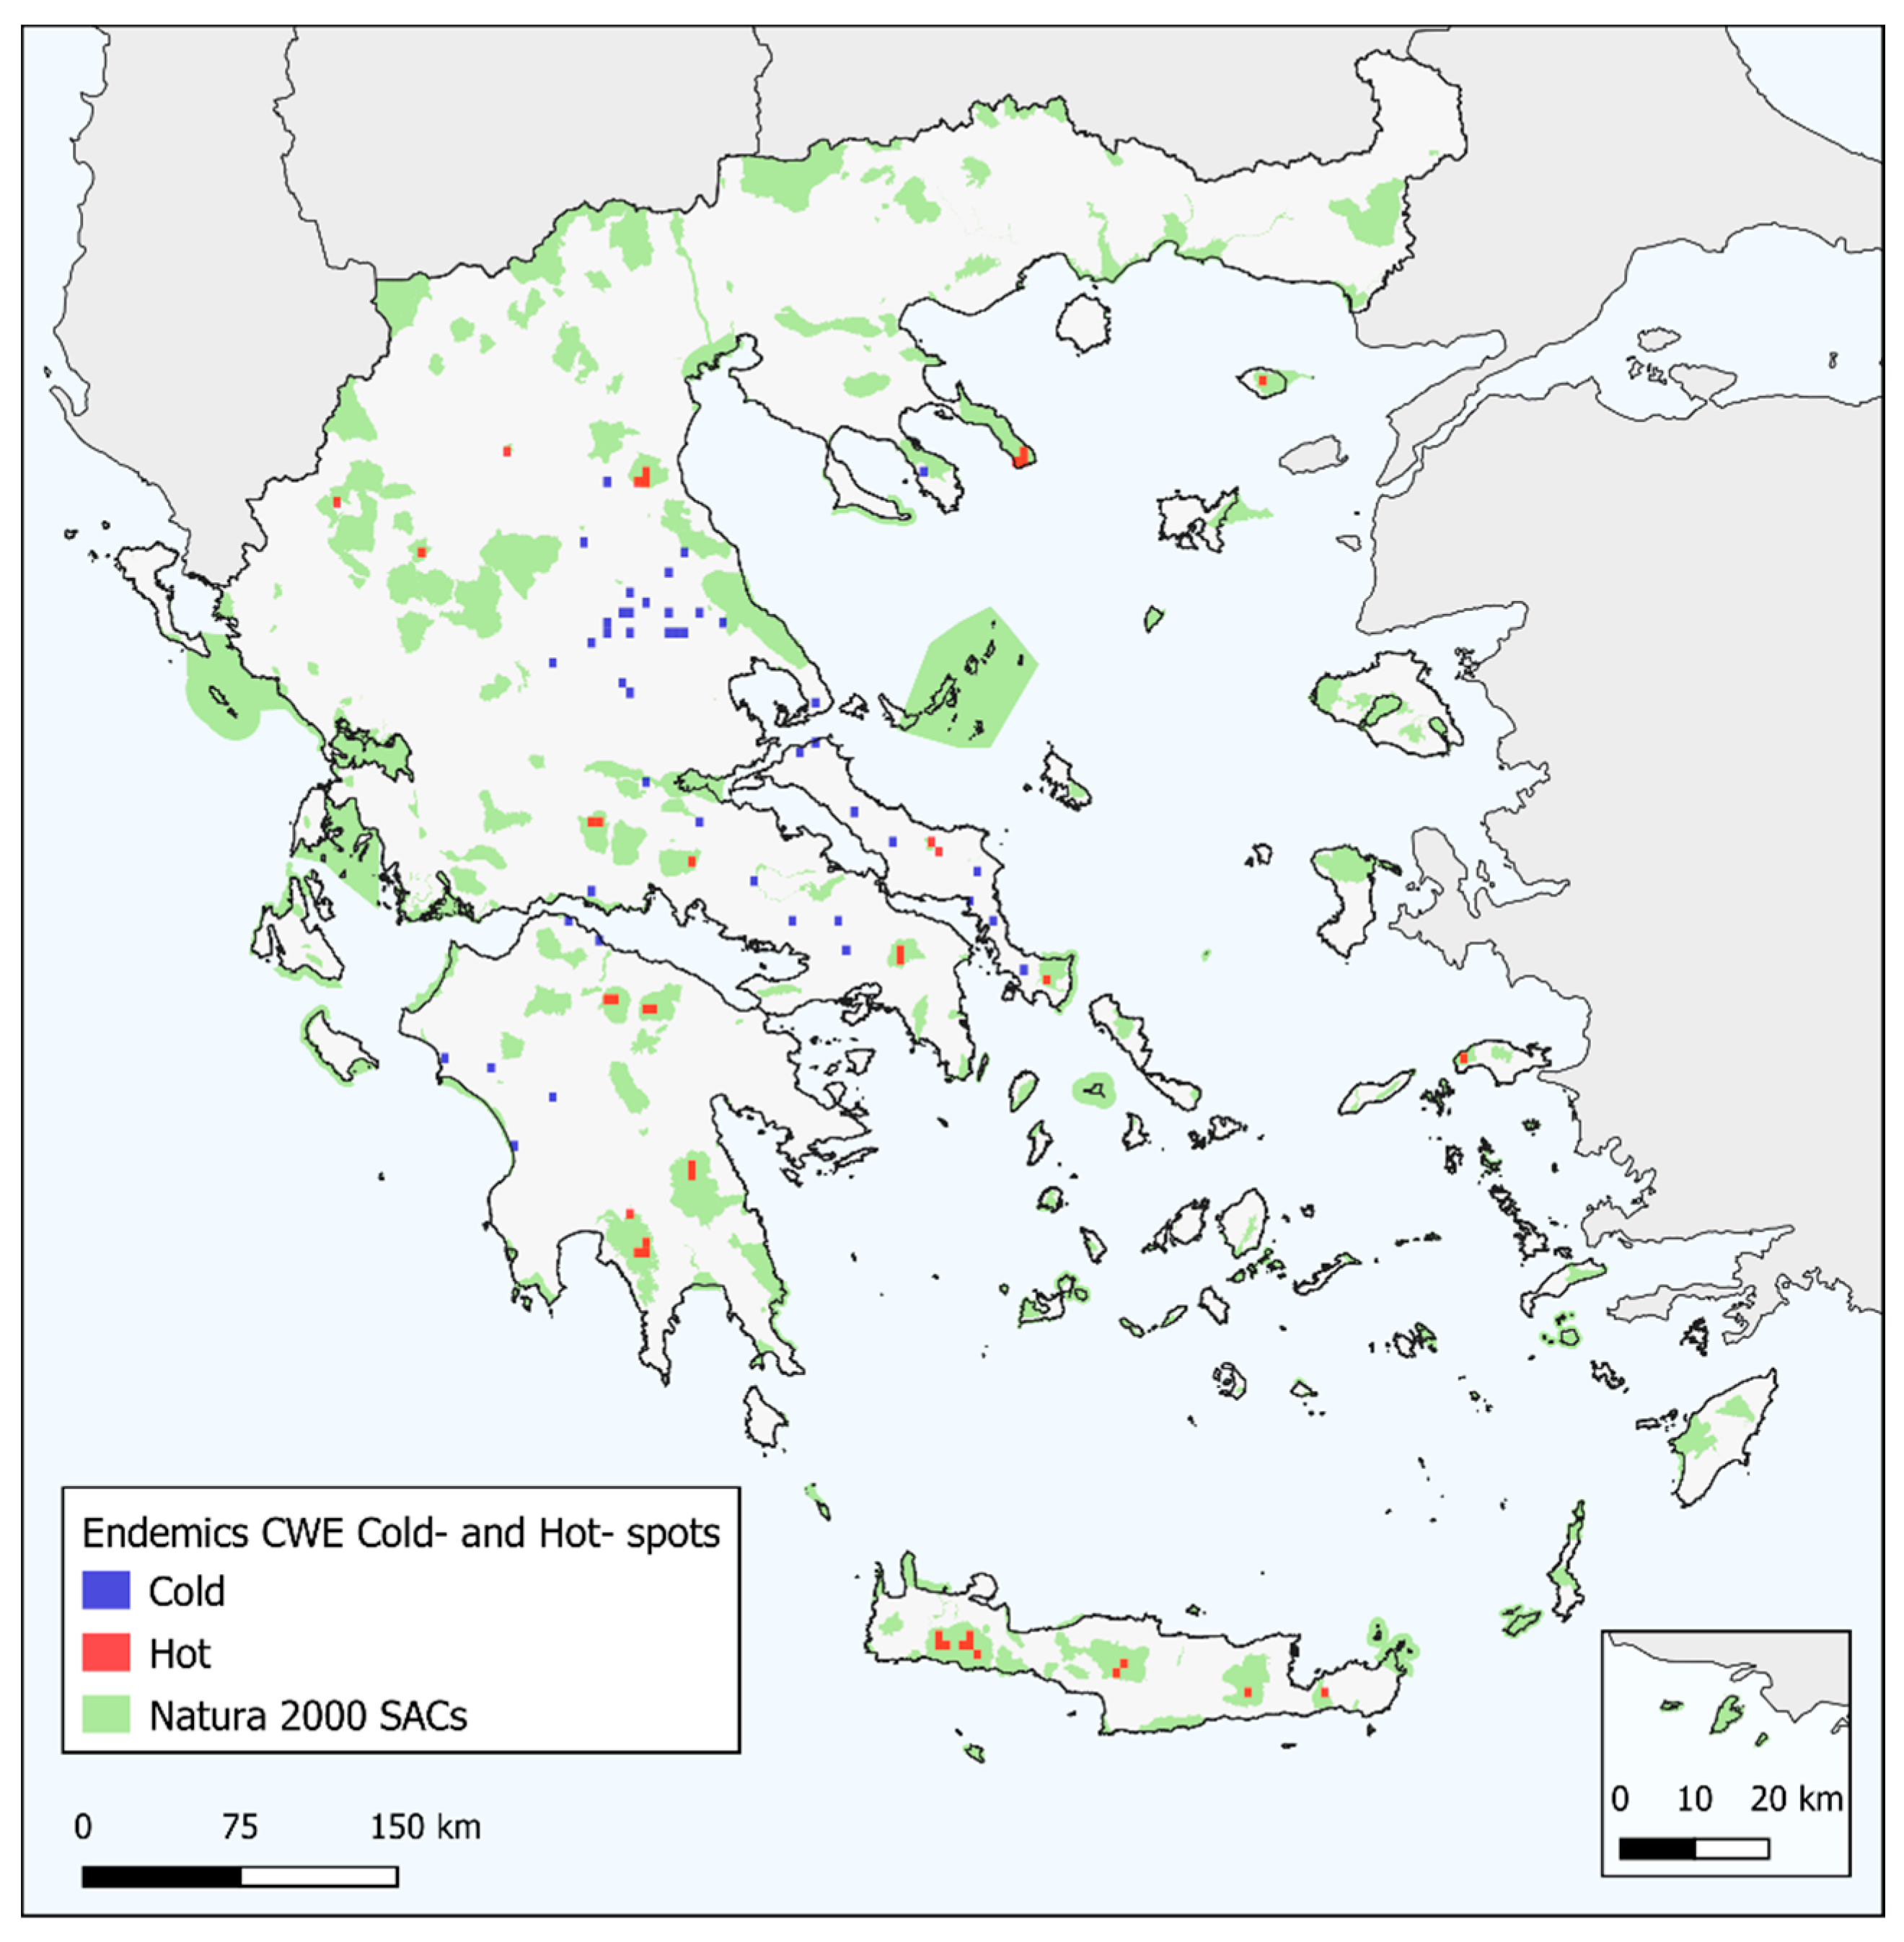
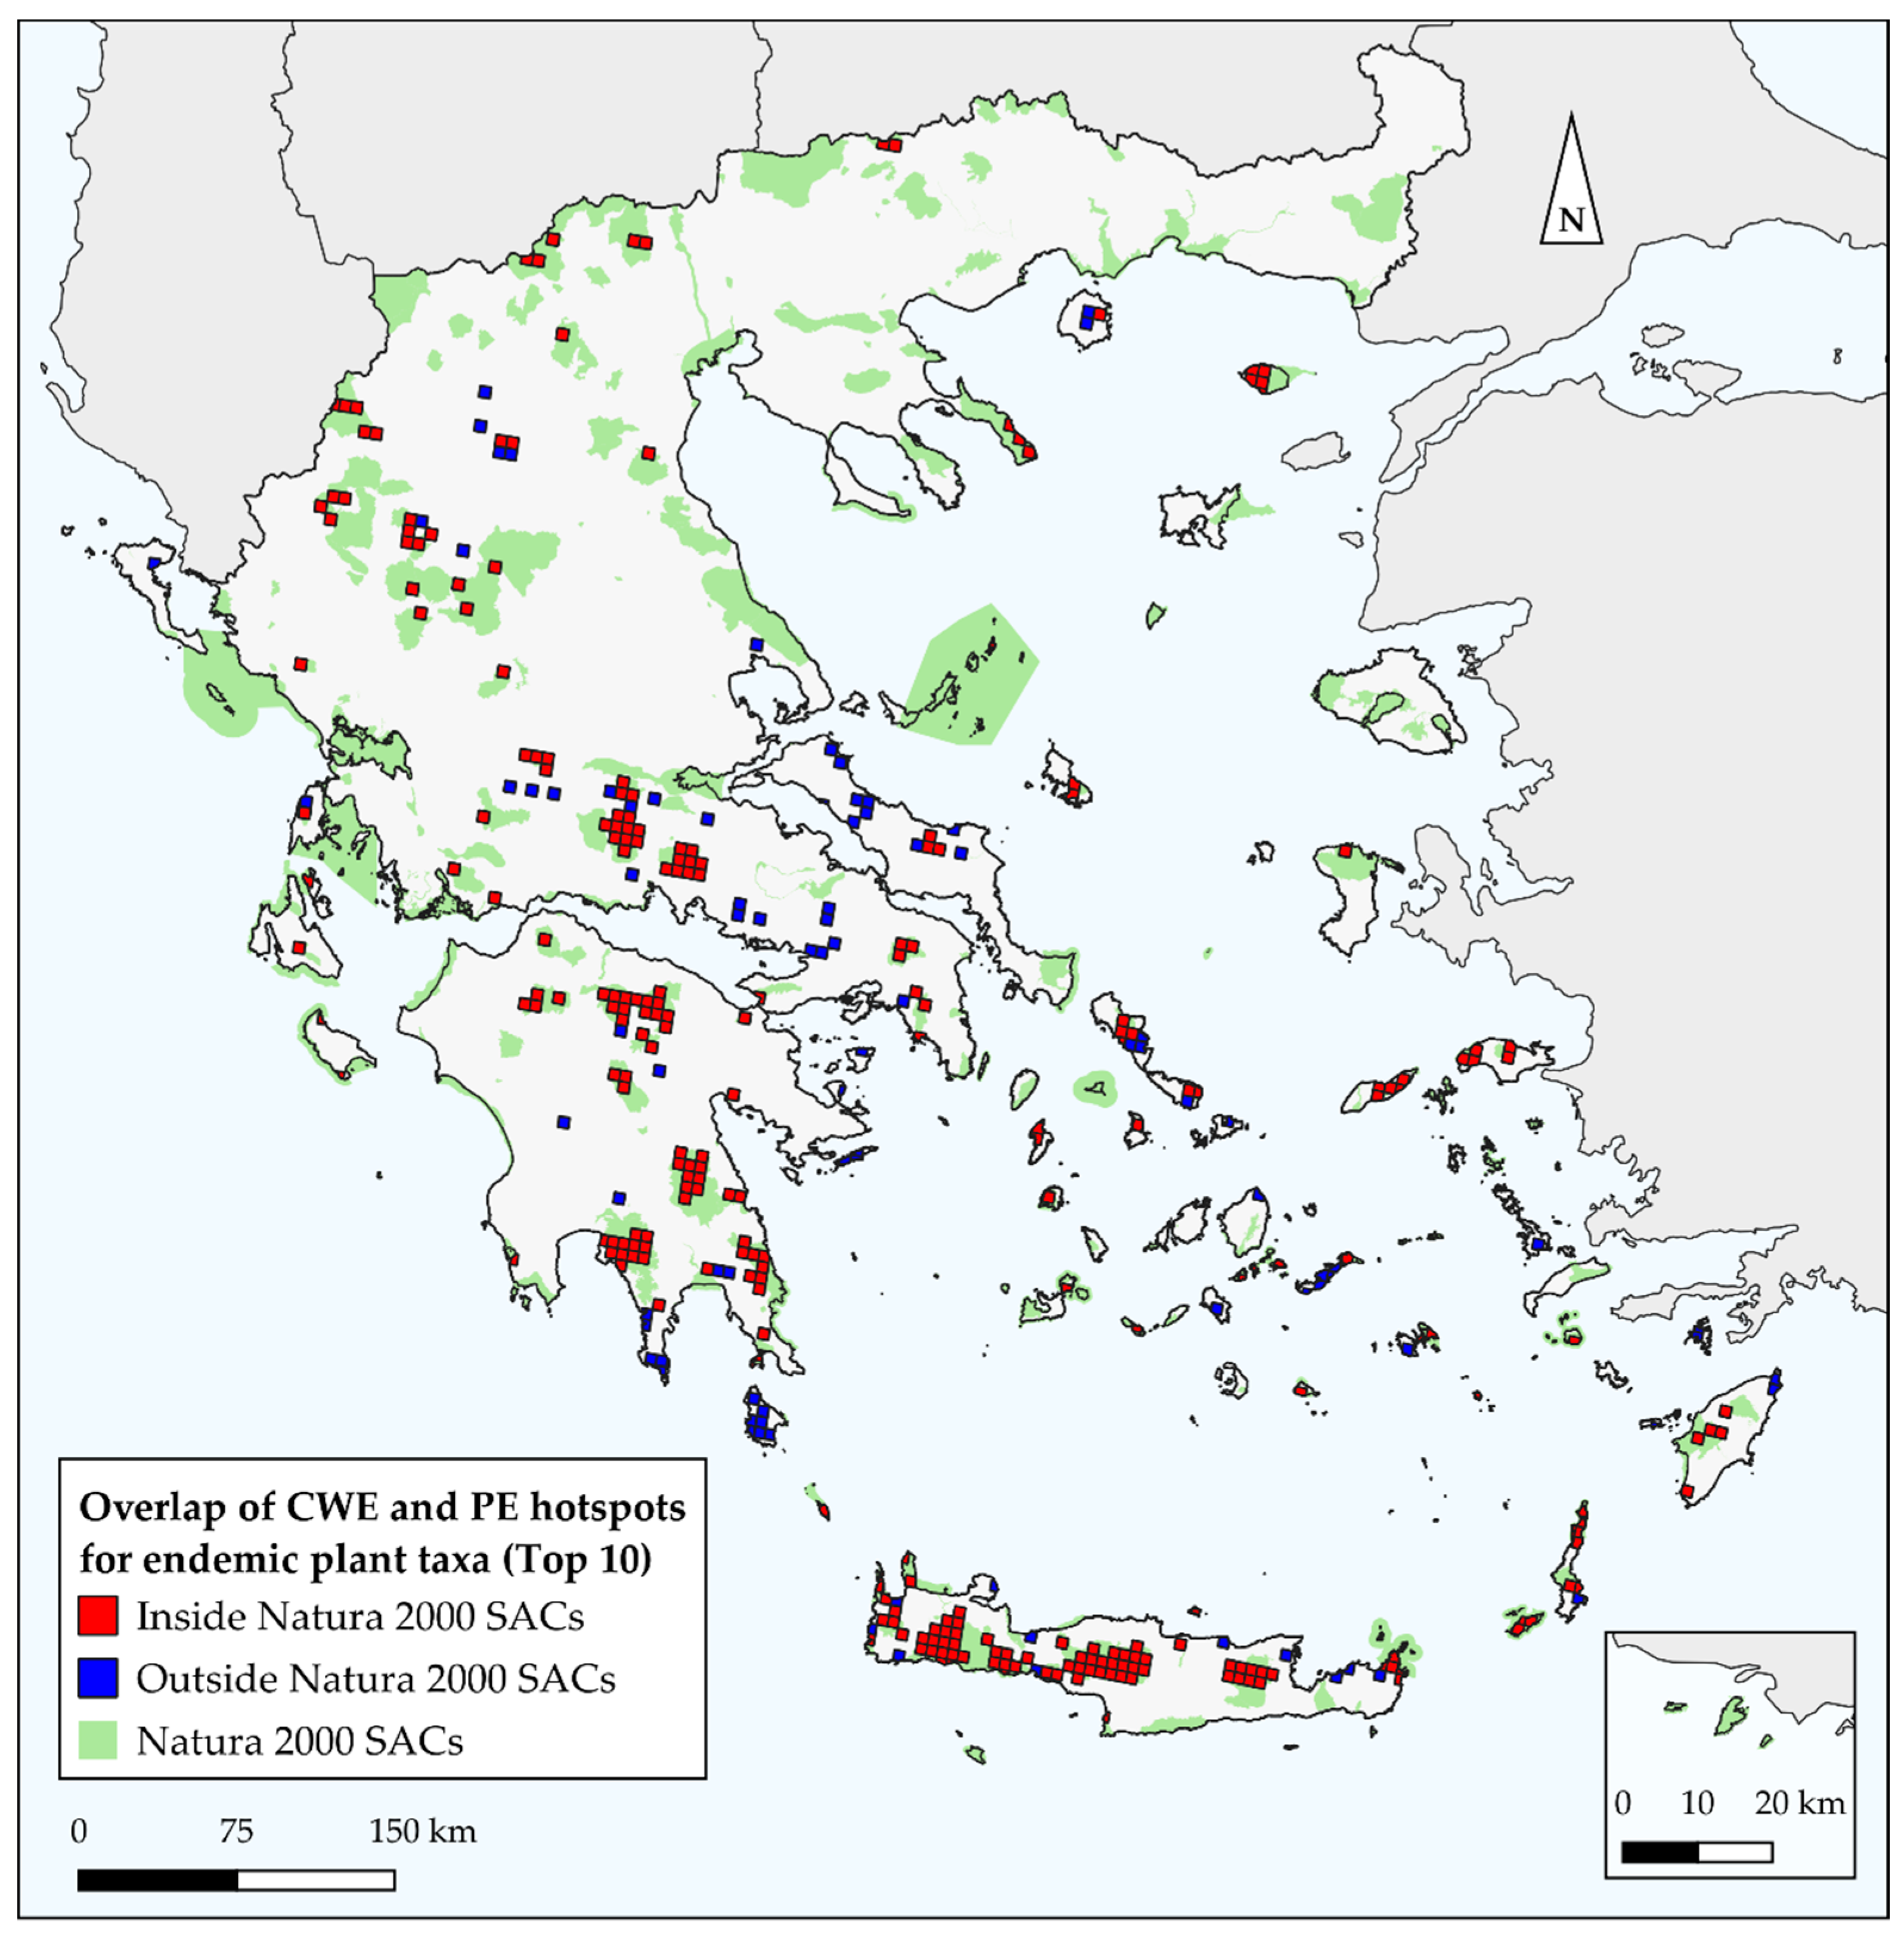
3.4. Overlap with SACs
4. Discussion
4.1. Biodiversity Hotspots in Greece
4.2. Endemism Centres in Greece
4.3. Conservation Prioritization–Management Implications
5. Conclusions
Supplementary Materials
Author Contributions
Funding
Institutional Review Board Statement
Informed Consent Statement
Data Availability Statement
Acknowledgments
Conflicts of Interest
References
- Lughadha, E.N.; Govaerts, R.; Belyaeva, I.; Black, N.; Lindon, H.; Allkin, R.; Magill, R.E.; Nicolson, N. Counting counts: Revised estimates of numbers of accepted species of flowering plants, seed plants, vascular plants and land plants with a review of other recent estimates. Phytotaxa 2016, 272, 82–88. [Google Scholar] [CrossRef]
- Kier, G.; Kreft, H.; Lee, T.M.; Jetz, W.; Ibisch, P.L.; Nowicki, C.; Mutke, J.; Barthlott, W. A global assessment of endemism and species richness across island and mainland regions. Proc. Natl. Acad. Sci. USA 2009, 106, 9322–9327. [Google Scholar] [CrossRef] [PubMed]
- Fine, P.V.A. Ecological and Evolutionary Drivers of Geographic Variation in Species Diversity. Annu. Rev. Ecol. Evol. Syst. 2015. [Google Scholar] [CrossRef]
- Gallagher, R.V.; Allen, S.; Rivers, M.C.; Allen, A.P.; Butt, N.; Keith, D.; Auld, T.D.; Enquist, B.J.; Wright, I.J.; Possingham, H.P.; et al. Global shortfalls in extinction risk assessments for endemic flora. bioRxiv 2020. [Google Scholar] [CrossRef]
- Le Roux, J.J.; Hui, C.; Castillo, M.L.; Iriondo, J.M.; Keet, J.H.; Khapugin, A.A.; Médail, F.; Rejmánek, M.; Theron, G.; Yannelli, F.A.; et al. Recent Anthropogenic Plant Extinctions Differ in Biodiversity Hotspots and Coldspots. Curr. Biol. 2019, 29, 2912–2918. [Google Scholar] [CrossRef] [PubMed]
- Barthlott, W.; Mutke, J.; Rafiqpoor, D.; Kier, G.; Kreft, H. Global Centers of Vascular Plant Diversity. Nov. Acta Leopoldina 2005, 92, 61–83. [Google Scholar]
- Myers, N.; Mittermeier, R.A.; Mittermeier, C.G.; Da Fonseca, G.A.B.; Kent, J. Biodiversity hotspots for conservation priorities. Nature 2000, 403, 853–858. [Google Scholar] [CrossRef]
- Keppel, G.; Ottaviani, G.; Harrison, S.; Wardell-Johnson, G.W.; Marcantonio, M.; Mucina, L. Towards an eco-evolutionary understanding of endemism hotspots and refugia. Ann. Bot. 2018, 122, 927–934. [Google Scholar] [CrossRef]
- Ashcroft, M.B. Identifying refugia from climate change. J. Biogeogr. 2010, 37, 1407–1413. [Google Scholar] [CrossRef]
- Hoffmann, S.; Irl, S.D.H.; Beierkuhnlein, C. Predicted climate shifts within terrestrial protected areas worldwide. Nat. Commun. 2019, 10, 1–10. [Google Scholar] [CrossRef]
- Le Saout, S.; Hoffmann, M.; Shi, Y.; Hughes, A.; Bernard, C.; Brooks, T.M.; Bertzky, B.; Butchart, S.H.M.; Stuart, S.N.; Badman, T.; et al. Protected Areas and Effective Biodiversity Conservation. Science 2013, 342, 803–805. [Google Scholar] [CrossRef] [PubMed]
- Zalasiewicz, J.; Waters, C.N.; Williams, M.; Barnosky, A.D.; Cearreta, A.; Crutzen, P.; Ellis, E.; Ellis, M.A.; Fairchild, I.J.; Grinevald, J.; et al. When did the Anthropocene begin? A mid-twentieth century boundary level is stratigraphically optimal. Quat. Int. 2015, 383, 196–203. [Google Scholar] [CrossRef]
- Urban, M.C. Accelerating extinction risk from climate change. Science 2015, 348, 571–573. [Google Scholar] [CrossRef] [PubMed]
- Gray, A. The ecology of plant extinction: Rates, traits and island comparisons. Oryx 2019, 53, 424–428. [Google Scholar] [CrossRef]
- Vellend, M.; Baeten, L.; Becker-Scarpitta, A.; Boucher-Lalonde, V.; McCune, J.L.; Messier, J.; Myers-Smith, I.H.; Sax, D.F. Plant Biodiversity Change Across Scales During the Anthropocene. Annu. Rev. Plant Biol. 2017, 68, 563–586. [Google Scholar] [CrossRef]
- Enquist, B.J.; Feng, X.; Boyle, B.; Maitner, B.; Newman, E.A.; Jørgensen, P.M.; Roehrdanz, P.R.; Thiers, B.M.; Burger, J.R.; Corlett, R.T.; et al. The commonness of rarity: Global and future distribution of rarity across land plants. Sci. Adv. 2019, 5, eaaz0414. [Google Scholar] [CrossRef]
- Newbold, T. Future effects of climate and land-use change on terrestrial vertebrate community diversity under different scenarios. Proc. R. Soc. B Biol. Sci. 2018, 285, 6229. [Google Scholar] [CrossRef]
- Newbold, T.; Hudson, L.N.; Contu, S.; Hill, S.L.L.; Beck, J.; Liu, Y.; Meyer, C.; Phillips, H.R.P.; Scharlemann, J.P.W.; Purvis, A. Widespread winners and narrow-ranged losers: Land use homogenizes biodiversity in local assemblages worldwide. PLOS Biol. 2018, 16, e2006841. [Google Scholar] [CrossRef]
- Powers, R.P.; Jetz, W. Global habitat loss and extinction risk of terrestrial vertebrates under future land-use-change scenarios. Nat. Clim. Chang. 2019, 9, 323–329. [Google Scholar] [CrossRef]
- Li, D.; Olden, J.D.; Lockwood, J.L.; Record, S.; McKinney, M.L.; Baiser, B. Changes in taxonomic and phylogenetic diversity in the Anthropocene. Proc. R. Soc. B Biol. Sci. 2020, 287, 20200777. [Google Scholar] [CrossRef]
- Menéndez-Guerrero, P.A.; Green, D.M.; Davies, T.J. Climate change and the future restructuring of Neotropical anuran biodiversity. Ecography 2020, 43, 222–235. [Google Scholar] [CrossRef]
- Kougioumoutzis, K.; Kokkoris, I.P.; Panitsa, M.; Trigas, P.; Strid, A.; Dimopoulos, P. Spatial Phylogenetics, Biogeographical Patterns and Conservation Implications of the Endemic Flora of Crete (Aegean, Greece) under Climate Change Scenarios. Biology 2020, 9, 199. [Google Scholar] [CrossRef] [PubMed]
- Olden, J.D.; Comte, L.; Giam, X. The Homogocene: A research prospectus for the study of biotic homogenisation. NeoBiota 2018, 37, 23–36. [Google Scholar] [CrossRef]
- Thuiller, W.; Lavergne, S.; Roquet, C.; Boulangeat, I.; Lafourcade, B.; Araujo, M.B. Consequences of climate change on the tree of life in Europe. Nature 2011, 470, 531–534. [Google Scholar] [CrossRef] [PubMed]
- Cronk, Q. Plant extinctions take time. Science 2016, 353, 446–447. [Google Scholar] [CrossRef]
- Nic Lughadha, E.; Bachman, S.P.; Leão, T.C.C.; Forest, F.; Halley, J.M.; Moat, J.; Acedo, C.; Bacon, K.L.; Brewer, R.F.A.; Gâteblé, G.; et al. Extinction risk and threats to plants and fungi. Plants People Planet 2020, 2, 389–408. [Google Scholar] [CrossRef]
- CBD (Convention on Biological Diversity) X/17. Consolidated Update of the Global Strategy for Plant Conservation 2011–2020. Available online: https://www.cbd.int/kb/record/decision/12283?RecordType=decision (accessed on 10 January 2021).
- CBD (Convention on Biological Diversity). In Updated Analysis of the Contribution of Targets Established by Parties and Progress Towards the Aichi Biodiversity Targets. Available online: https://www.cbd.int/kb/record/meetingDocument/111071?Event=COP-13 (accessed on 10 January 2021).
- Buxton, R.; Avery-Gomm, S.; Lin, H.-Y.; Smith, P.A.; Cooke, S.; Bennett, J.R. Half of resources in threatened species conservation plans are allocated to research and monitoring. Nat. Commun. 2020, 11, 1–8. [Google Scholar] [CrossRef]
- Watts, K.; Whytock, R.C.; Park, K.J.; Fuentes-Montemayor, E.; Macgregor, N.A.; Duffield, S.; McGowan, P.J.K. Ecological time lags and the journey towards conservation success. Nat. Ecol. Evol. 2020, 4, 304–311. [Google Scholar] [CrossRef]
- Corlett, R.T. Safeguarding our future by protecting biodiversity. Plant Divers. 2020, 42, 221–228. [Google Scholar] [CrossRef]
- Heywood, V.H. Plant conservation in the Anthropocene—Challenges and future prospects. Plant Divers. 2017, 39, 314–330. [Google Scholar] [CrossRef]
- Arponen, A. Prioritizing species for conservation planning. Biodivers. Conserv. 2012, 21, 875–893. [Google Scholar] [CrossRef]
- Maes, J.; Teller, A.; Erhard, M.; Liquete, C.; Braat, L.; Berry, P.; Egoh, B.; Puydarrieus, P.; Fiorina, C.; Santos, F.; et al. Mapping and Assessment of Ecosystem and Their Services. An Analytical Framework for Ecosystem Assessments under Action 5 of the EU Biodiversity Strategy to 2020; Publications Office of the European Union: Luxemburg, 2013. [Google Scholar]
- Reece, J.S.; Noss, R.F. Prioritizing Species by Conservation Value and Vulnerability: A New Index Applied to Species Threatened by Sea-Level Rise and Other Risks in Florida. Nat. Areas, J. 2014, 34, 31–45. [Google Scholar] [CrossRef]
- Reid, W. V Biodiversity hotspots. Trends Ecol. Evol. 1998, 13, 275–280. [Google Scholar] [CrossRef]
- Brooks, T.M.; Mittermeier, R.A.; da Fonseca, G.A.B.; Gerlach, J.; Hoffmann, M.; Lamoreux, J.F.; Mittermeier, C.G.; Pilgrim, J.D.; Rodrigues, A.S.L. Global biodiversity conservation priorities. Science 2006, 313, 58–61. [Google Scholar] [CrossRef] [PubMed]
- Harrison, S.; Spasojevic, M.J.; Li, D. Climate and plant community diversity in space and time. Proc. Natl. Acad. Sci. USA 2020, 117, 4464–4470. [Google Scholar] [CrossRef]
- Newbold, T.; Oppenheimer, P.; Etard, A.; Williams, J.J. Tropical and Mediterranean biodiversity is disproportionately sensitive to land-use and climate change. Nat. Ecol. Evol. 2020. [Google Scholar] [CrossRef]
- Cañadas, E.M.; Fenu, G.; Peñas, J.; Lorite, J.; Mattana, E.; Bacchetta, G. Hotspots within hotspots: Endemic plant richness, environmental drivers, and implications for conservation. Biol. Conserv. 2014, 170, 282–291. [Google Scholar] [CrossRef]
- Crisp, M.D.; Laffan, S.; Linder, H.P.; Monro, A.N.N.A. Endemism in the Australian flora. J. Biogeogr. 2001, 28, 183–198. [Google Scholar] [CrossRef]
- Linder, H.P. On areas of endemism, with an example from the African restionaceae. Syst. Biol. 2001, 50, 892–912. [Google Scholar] [CrossRef]
- Linder, H.P. Plant diversity and endemism in sub-Saharan tropical Africa. J. Biogeogr. 2001, 28, 169–182. [Google Scholar] [CrossRef]
- Jetz, W.; Rahbek, C.; Colwell, R.K. The coincidence of rarity and richness and the potential signature of history in centres of endemism. Ecol. Lett. 2004, 7, 1180–1191. [Google Scholar] [CrossRef]
- Xu, Y.; Huang, J.; Lu, X.; Ding, Y.; Zang, R. Priorities and conservation gaps across three biodiversity dimensions of rare and endangered plant species in China. Biol. Conserv. 2019, 229, 30–37. [Google Scholar] [CrossRef]
- Kling, M.M.; Mishler, B.D.; Thornhill, A.H.; Baldwin, B.G.; Ackerly, D.D. Facets of phylodiversity: Evolutionary diversification, divergence and survival as conservation targets. Philos. Trans. R. Soc. B Biol. Sci. 2019, 374, 20170397. [Google Scholar] [CrossRef] [PubMed]
- Daru, B.H.; Farooq, H.; Antonelli, A.; Faurby, S. Endemism patterns are scale dependent. Nat. Commun. 2020, 11, 1–11. [Google Scholar] [CrossRef] [PubMed]
- Mishler, B.D.; Knerr, N.; González-Orozco, C.E.; Thornhill, A.H.; Laffan, S.W.; Miller, J.T. Phylogenetic measures of biodiversity and neo-and paleo-endemism in Australian acacia. Nat. Commun. 2014, 5, 4473. [Google Scholar] [CrossRef]
- Scherson, R.A.; Thornhill, A.H.; Urbina-Casanova, R.; Freyman, W.A.; Pliscoff, P.A.; Mishler, B.D. Spatial phylogenetics of the vascular flora of Chile. Mol. Phylogenet. Evol. 2017, 112, 88–95. [Google Scholar] [CrossRef]
- Thornhill, A.H.; Mishler, B.D.; Knerr, N.J.; González-Orozco, C.E.; Costion, C.M.; Crayn, D.M.; Laffan, S.W.; Miller, J.T. Continental-scale spatial phylogenetics of Australian angiosperms provides insights into ecology, evolution and conservation. J. Biogeogr. 2016, 43, 2085–2098. [Google Scholar] [CrossRef]
- Sosa, V.; De-Nova, J.A.; Vásquez-Cruz, M. Evolutionary history of the flora of Mexico: Dry forests cradles and museums of endemism. J. Syst. Evol. 2018, 56, 523–536. [Google Scholar] [CrossRef]
- Spalink, D.; Kriebel, R.; Li, P.; Pace, M.C.; Drew, B.T.; Zaborsky, J.G.; Rose, J.; Drummond, C.P.; Feist, M.A.; Alverson, W.S.; et al. Spatial phylogenetics reveals evolutionary constraints on the assembly of a large regional flora. Am. J. Bot. 2018, 105, 1938–1950. [Google Scholar] [CrossRef]
- Dagallier, L.P.M.J.; Janssens, S.B.; Dauby, G.; Blach-Overgaard, A.; Mackinder, B.A.; Droissart, V.; Svenning, J.C.; Sosef, M.S.M.; Stévart, T.; Harris, D.J.; et al. Cradles and museums of generic plant diversity across tropical Africa. New Phytol. 2020, 225, 2196–2213. [Google Scholar] [CrossRef]
- Fuentes-Castillo, T.; Scherson, R.A.; Marquet, P.A.; Fajardo, J.; Corcoran, D.; Román, M.J.; Pliscoff, P. Modelling the current and future biodiversity distribution in the Chilean Mediterranean hotspot. The role of protected areas network in a warmer future. Divers. Distrib. 2019, 25, 1897–1909. [Google Scholar] [CrossRef]
- Laffan, S.W.; Rosauer, D.F.; Di Virgilio, G.; Miller, J.T.; González-Orozco, C.E.; Knerr, N.; Thornhill, A.H.; Mishler, B.D. Range-weighted metrics of species and phylogenetic turnover can better resolve biogeographic transition zones. Methods Ecol. Evol. 2016, 7, 580–588. [Google Scholar] [CrossRef]
- Critical Ecosystem Partnership Fund Mediterranean Basin Biodiversity Hotspot. Ecosystem Profile. Available online: https://www.cepf.net/sites/default/files/mediterranean-basin-2017-ecosystem-profile-english_0.pdf (accessed on 10 January 2021).
- Médail, F. The specific vulnerability of plant biodiversity and vegetation on Mediterranean islands in the face of global change. Reg. Environ. Chang. 2017, 17, 1775–1790. [Google Scholar] [CrossRef]
- Fady, B.; Conord, C. Macroecological patterns of species and genetic diversity in vascular plants of the Mediterranean basin. Divers. Distrib. 2010, 16, 53–64. [Google Scholar] [CrossRef]
- Nieto Feliner, G. Patterns and processes in plant phylogeography in the Mediterranean Basin. A review. Perspect. Plant Ecol. Evol. Syst. 2014, 16, 265–278. [Google Scholar] [CrossRef]
- Fois, M.; Bacchetta, G.; Cuena-Lombraña, A.; Cogoni, D.; Pinna, M.S.; Sulis, E.; Fenu, G. Using extinctions in species distribution models to evaluate and predict threats: A contribution to plant conservation planning on the island of Sardinia. Environ. Conserv. 2018, 45, 11–19. [Google Scholar] [CrossRef]
- Carta, A.; Gargano, D.; Rossi, G.; Bacchetta, G.; Fenu, G.; Montagnani, C.; Abeli, T.; Peruzzi, L.; Orsenigo, S. Phylogenetically informed spatial planning as a tool to prioritise areas for threatened plant conservation within a Mediterranean biodiversity hotspot. Sci. Total Environ. 2019, 665, 1046–1052. [Google Scholar] [CrossRef]
- Médail, F.; Monnet, A.-C.; Pavon, D.; Nikolic, T.; Dimopoulos, P.; Bacchetta, G.; Arroyo, J.; Barina, Z.; Albassatneh, M.C.; Domina, G. What is a tree in the Mediterranean Basin hotspot? A critical analysis. For. Ecosyst. 2019, 6, 17. [Google Scholar] [CrossRef]
- Fois, M.; Fenu, G.; Cañadas, E.M.; Bacchetta, G. Disentangling the influence of environmental and anthropogenic factors on the distribution of endemic vascular plants in Sardinia. PLoS ONE 2017, 12, e0182539. [Google Scholar] [CrossRef]
- Abdelaal, M.; Fois, M.; Fenu, G.; Bacchetta, G. Biogeographical characterisation of Egypt based on environmental features and endemic vascular plants distribution. Appl. Geogr. 2020, 119, 102208. [Google Scholar] [CrossRef]
- Ojeda, F.; Marañón, T.; Arroyo, J. Plant diversity patterns in the Aljibe Mountains (S. Spain): A comprehensive account. Biodivers. Conserv. 2000, 9, 1323–1343. [Google Scholar] [CrossRef]
- Molina-venegas, R.; Aparicio, A.; Slingsby, J.A. Investigating the evolutionary assembly of a Mediterranean biodiversity hotspot: Deep phylogenetic signal in the distribution of eudicots across elevational belts. J. Biogeogr. 2014, 42, 507–518. [Google Scholar] [CrossRef]
- Molina-Venegas, R.; Aparicio, A.; Pina, F.J.; Valdés, B.; Arroyo, J. Disentangling environmental correlates of vascular plant biodiversity in a Mediterranean hotspot. Ecol. Evol. 2013, 3, 3879–3894. [Google Scholar] [CrossRef] [PubMed]
- Molina-Venegas, R.; Aparicio, A.; Lavergne, S.; Arroyo, J. Climatic and topographical correlates of plant palaeo- and neoendemism in a Mediterranean biodiversity hotspot. Ann. Bot. 2017, 119, 229–238. [Google Scholar] [CrossRef]
- Carta, A.; Pierini, B.; Roma-Marzio, F.; Bedini, G.; Peruzzi, L. Phylogenetic measures of biodiversity uncover pteridophyte centres of diversity and hotspots in Tuscany. Plant Biosyst.-Int. J. Deal. Asp. Plant Biol. 2018, 157, 831–839. [Google Scholar] [CrossRef]
- Dimopoulos, P.; Raus, T.; Bergmeier, E.; Constantinidis, T.; Iatrou, G.; Kokkini, S.; Strid, A.; Tzanoudakis, D. Vascular Plants of Greece: An Annotated Checklist; Botanischer Garten und Botanisches Museum Berlin-Dahlem, Freie Universität Berlin/Hellenic Botanical Society: Athens, Greece, 2013. [Google Scholar]
- Dimopoulos, P.; Raus, T.; Bergmeier, E.; Constantinidis, T.; Iatrou, G.; Kokkini, S.; Strid, A.; Tzanoudakis, D. Vascular plants of Greece: An annotated checklist. Supplement. Willdenowia 2016, 46, 301–347. [Google Scholar] [CrossRef]
- Triantis, K.A.; Mylonas, M. Greek islands, biology. Encycl. Isl. 2009, 388–392. [Google Scholar]
- Strid, A.; Tan, K. Mountain Flora of Greece. Brittonia 1991, 43, 177. [Google Scholar]
- Sakellariou, D.; Galanidou, N. Pleistocene submerged landscapes and Palaeolithic archaeology in the tectonically active Aegean region. Geol. Soc. Lond. Spec. Publ. 2016, 411, 145–178. [Google Scholar] [CrossRef]
- Kapsimalis, V.; Pavlopoulos, K.; Panagiotopoulos, I.; Drakopoulou, P.; Vandarakis, D.; Sakelariou, D.; Anagnostou, C. Geoarchaeological challenges in the Cyclades continental shelf (Aegean Sea). Z. Geomorphol. Suppl. Issues 2009, 53, 169–190. [Google Scholar] [CrossRef]
- Lykousis, V. Sea-level changes and shelf break prograding sequences during the last 400 ka in the Aegean margins: Subsidence rates and palaeogeographic implications. Cont. Shelf Res. 2009, 29, 2037–2044. [Google Scholar] [CrossRef]
- Fassoulas, C. The geodynamic and paleogeographic evolution of the Aegean in the Tertiary and Quaternary: A review. In Biogeography and Biodiversity of the Aegean. In Honour of Prof. Moysis Mylonas; Sfenthourakis, S., Pafilis, P., Parmakelis, A., Poulakakis, N., Triantis, K.A., Eds.; Broken Hill Publishers Ltd.: Nicosia, Cyprus, 2018; pp. 25–46. ISBN 9789925563784. [Google Scholar]
- Cribb, P.; Lack, H.W.; Mabberley, D.J. The Flora Graeca Story. Sibthorp, Bauer, and Hawkins in the Levant. Kew Bull. 1999, 54, 243. [Google Scholar] [CrossRef]
- Strid, A. The botanical exploration of Greece. Plant Syst. Evol. 2020, 306, 1–23. [Google Scholar] [CrossRef]
- Kougioumoutzis, K.; Tiniakou, A.; Georgiadis, T.; Georgiou, O. CONTRIBUTION TO THE FLORA OF THE SOUTH AEGEAN VOLCANIC ARC: THE METHANA PENINSULA (SARONIC GULF, GREECE). Edinburgh J. Bot. 2012, 69, 53–81. [Google Scholar] [CrossRef]
- Kougioumoutzis, K.; Tiniakou, A.; Georgiou, O.; Georgiadis, T. Contribution to the flora of the south aegean volcanic arc: Kimolos island (kiklades, greece). Edinburgh J. Bot. 2014, 71, 135–160. [Google Scholar] [CrossRef]
- Kokkoris, I.; Dimitrellos, G.; Kougioumoutzis, K.; Laliotis, I.; Georgiadis, T.; Tiniakou, A. The native flora of Mountain Panachaikon (Peloponnese, Greece): New records and diversity. J. Biol. Res. 2014, 21, 9. [Google Scholar] [CrossRef]
- Strid, A. Phytogeographia Aegaea and the Flora Hellenica Database. Ann. Naturhistorischen Museums Wien 1996, 98B, 279–289. [Google Scholar]
- Panitsa, M.; Trigas, P.; Iatrou, G.; Sfenthourakis, S. Factors affecting plant species richness and endemism on land-bridge islands-An example from the East Aegean archipelago. Acta Oecologica 2010, 36, 431–437. [Google Scholar] [CrossRef]
- Panitsa, M.; Snogerup, B.; Snogerup, S.; Tzanoudakis, D. Floristic investigation of Lemnos island ( NE Aegean area, Greece). Willdenowia 2003, 33, 79–105. [Google Scholar] [CrossRef]
- Panitsa, M.; Tzanoudakis, D.; Triantis, K.A.; Sfenthourakis, S. Patterns of species richness on very small islands: The plants of the Aegean archipelago. J. Biogeogr. 2006, 33, 1223–1234. [Google Scholar] [CrossRef]
- Tzanoudakis, D.; Iatrou, G.; Panitsa, M.; Trigas, P. Contribution to the Study of the Greek Insular Flora: Antikythera and the Islets Around Kythera. In Progress in Botanical Research; Springer: Dordrecht, The Netherlands, 1998; pp. 177–180. [Google Scholar]
- Trigas, P.; Iatrou, G.; Panitsa, M. Vascular plant species diversity, biogeography and vulnerability in the Aegean islands as exemplified by Evvia island (W.; Aegean, Greece). Fresenius Environ. Bull. 2008, 17, 48–57. [Google Scholar]
- Trigas, P.; Tsiftsis, S.; Tsiripidis, I.; Iatrou, G. Distribution Patterns and Conservation Perspectives of the Endemic Flora of Peloponnese (Greece). Folia Geobot. 2012, 47, 421–439. [Google Scholar] [CrossRef]
- Trigas, P.; Panitsa, M.; Tsiftsis, S. Elevational Gradient of Vascular Plant Species Richness and Endemism in Crete-The Effect of Post-Isolation Mountain Uplift on a Continental Island System. PLoS ONE 2013, 8, e59425. [Google Scholar] [CrossRef] [PubMed]
- Lazarina, M.; Kallimanis, A.S.; Dimopoulos, P.; Psaralexi, M.; Michailidou, D.E.; Sgardelis, S.P. Patterns and drivers of species richness and turnover of neo-endemic and palaeo-endemic vascular plants in a Mediterranean hotspot: The case of Crete, Greece. J. Biol. Res. 2019, 26, 1–13. [Google Scholar] [CrossRef]
- Kougioumoutzis, K.; Simaiakis, S.M.; Tiniakou, A. Network biogeographical analysis of the central Aegean archipelago. J. Biogeogr. 2014, 41, 1848–1858. [Google Scholar] [CrossRef]
- Kallimanis, A.S.; Bergmeier, E.; Panitsa, M.; Georghiou, K.; Delipetrou, P.; Dimopoulos, P. Biogeographical determinants for total and endemic species richness in a continental archipelago. Biodivers. Conserv. 2010, 19, 1225–1235. [Google Scholar] [CrossRef]
- Kallimanis, A.S.; Panitsa, M.; Bergmeier, E.; Dimopoulos, P. Examining the relationship between total species richness and single island palaeo- and neo-endemics. Acta Oecologica 2011, 37, 65–70. [Google Scholar] [CrossRef]
- Panitsa, M.; Iliadou, E.; Kokkoris, I.; Kallimanis, A.; Patelodimou, C.; Strid, A.; Raus, T.; Bergmeier, E.; Dimopoulos, P. Distribution patterns of ruderal plant diversity in Greece. Biodivers. Conserv. 2020, 29, 869–891. [Google Scholar] [CrossRef]
- Panitsa, M.; Bazos, I.; Dimopoulos, P.; Zervou, S.; Yannitsaros, A.; Tzanoudakis, D. Contribution to the study of the flora and vegetation of the Kithira island group: Offshore islets of Kithira (S Aegean, Greece). Willdenowia 2004, 34, 101. [Google Scholar] [CrossRef][Green Version]
- Iliadou, E.; Kallimanis, A.S.; Dimopoulos, P.; Panitsa, M. Comparing the two Greek archipelagos plant species diversity and endemism patterns highlight the importance of isolation and precipitation as biodiversity drivers. J. Biol. Res. 2014, 21, 16. [Google Scholar] [CrossRef]
- Trigas, P.; Iatrou, G. The local endemic flora of Evvia (W Aegean, Greece). Willdenowia 2006, 36, 257. [Google Scholar] [CrossRef]
- Christodoulakis, D. The flora of Ikaria (Greece, E Aegean islands). Phyt.-Ann. Rei Bot. 1996, 36, 63–91. [Google Scholar]
- Honer, D.; Greuter, W. Plant population dynamics and species turnover on small islands near Karapathos (South Aegean, Greece). Vegetatio 1988, 77, 129–137. [Google Scholar] [CrossRef]
- Runemark, H. The plant geography of the central Aegean. Feddes Repert. 1970, 81, 229–231. [Google Scholar] [CrossRef]
- Spanou, S.; Verroios, G.; Dimitrellos, G.; Tiniakou, A.; Georgiadis, T. Notes on flora and vegetation of the sand dunes of western Greece. Willdenowia 2006, 36, 235–246. [Google Scholar] [CrossRef]
- Iliadou, E.; Bazos, I.; Kougioumoutzis, K.; Karadimou, E.; Kokkoris, I.; Panitsa, M.; Raus, T.; Strid, A.; Dimopoulos, P. Taxonomic and phylogenetic diversity patterns in the Northern Sporades islets complex (West Aegean, Greece). Plant Syst. Evol. 2020, 306, 1–17. [Google Scholar] [CrossRef]
- Tiniakou, A. Cytogeographical studies on some species of Viola sect. Viola (Violaceae) from Greece. Willdenowia 1991, 20, 153–158. [Google Scholar]
- Vlachos, A.; Georgiadis, T.; Tiniakou, A. Floristic research of the mountains of Sterea Ellas (Central Greece) and their affinities with mountains of Peloponissos. J. Biol. Res.-Thessalon 2009, 12, 193–209. [Google Scholar]
- Constantinidis, T. The flora of the Kastellorizo island group (East Aegean Islands, Greece): New records and comments. Flora Mediterr. 2013, 23, 69–86. [Google Scholar] [CrossRef]
- Greuter, W. The relict element of the flora of Crete and its evolutionary significance. In Taxonomy, Phytogeography and Evolution; Valentine, D.H., Ed.; Academic Press: London, UK, 1972; pp. 161–177. ISBN 0127102507. [Google Scholar]
- Greuter, W. The Origins and Evolution of Island Floras as Exemplified by the Aegean Archipelago; Academic Press: London, UK, 1979. [Google Scholar]
- Runemark, H. Investigations of the flora in the Central Aegean. Boissiera 1971, 33, 87–106. [Google Scholar] [CrossRef]
- Kougioumoutzis, K.; Tiniakou, A.; Georgiou, O.; Georgiadis, T. Contribution to the flora of the South Aegean volcanic arc: Anafi Island (Kiklades, Greece). Willdenowia 2012, 42, 127–141. [Google Scholar] [CrossRef][Green Version]
- Panitsa, M.; Kagiampaki, A.; Kougioumoutzis, K. Plant diversity and biogeography of the Aegean Archipelago: A New Synthesis. In Biogeography and Biodiversity of the Aegean. In honour of Prof. Moysis Mylonas; Sfenthourakis, S., Pafilis, P., Parmakelis, A., Poulakakis, N., Triantis, K., Eds.; Broken Hill Publishers Ltd.: Nicosia, Cyprus, 2018; pp. 223–244. ISBN 9789925563784. [Google Scholar]
- Kougioumoutzis, K.; Valli, A.T.; Georgopoulou, E.; Simaiakis, S.M.; Triantis, K.A.; Trigas, P. Network biogeography of a complex island system: The Aegean Archipelago revisited. J. Biogeogr. 2017, 44, 651–660. [Google Scholar] [CrossRef]
- Kougioumoutzis, K.; Kokkoris, I.P.; Panitsa, M.; Trigas, P.; Strid, A.; Dimopoulos, P. Plant Diversity Patterns and Conservation Implications under Climate-Change Scenarios in the Mediterranean: The Case of Crete (Aegean, Greece). Diversity 2020, 12, 270. [Google Scholar] [CrossRef]
- Kougioumoutzis, K.; Tiniakou, A. Ecological factors driving plant species diversity in the South Aegean Volcanic Arc and other central Aegean islands. Plant Ecol. Divers. 2014, 8, 1–14. [Google Scholar] [CrossRef]
- Strid, A. Atlas of the Aegean Flora; Botanic Garden and Botanical Museum Berlin, Freie Universität Berlin: Berlin, Germany, 2016; ISBN 9783921800973. [Google Scholar]
- Strid, A.; Tan, K. Recent progress in plant taxonomy and floristic studies in Greece. Bot. Serbica 2017, 41, 123–152. [Google Scholar] [CrossRef]
- Strid, A.; Tan, K. Flora Hellenica; Koeltz Scientific Books: Königstein, Germany, 1997. [Google Scholar]
- Strid, A.; Tan, K. Flora Hellenica. Volume II.; Gantner Verlag: Ruggell, Liechtenstein, 2002. [Google Scholar]
- Tsiftsis, S.; Antonopoulos, Z. Atlas of the Greek Orchids Vol I; Mediterraneo Editions: Rethimno, Crete, Greece, 2017. [Google Scholar]
- Antonopoulos, Z.; Tsiftsis, S. Atlas of the Greek Orchids Vol II; Mediterraneo Editions: Rethimno, Crete, Greece, 2017. [Google Scholar]
- Mastrogianni, A.; Kallimanis, A.S.; Chytrý, M.; Tsiripidis, I. Phylogenetic diversity patterns in forests of a putative refugial area in Greece: A community level analysis. For. Ecol. Manag. 2019, 446, 226–237. [Google Scholar] [CrossRef]
- Matthews, T.J.; Rigal, F.; Kougioumoutzis, K.; Trigas, P.; Triantis, K.A. Unravelling the small-island effect through phylogenetic community ecology. J. Biogeogr. 2020, 47, 2341–2352. [Google Scholar] [CrossRef]
- Stevanović, V.; Tan, K.; Iatrou, G. Distribution of the endemic Balkan flora on serpentine I.-Obligate serpentine endemics. Plant Syst. Evol. 2003, 242, 149–170. [Google Scholar] [CrossRef]
- Kati, V.; Devillers, P.; Dufrêne, M.; Legakis, A.; Vokou, D.; Lebrun, P. Hotspots, complementarity or representativeness? Designing optimal small-scale reserves for biodiversity conservation. Biol. Conserv. 2004, 120, 471–480. [Google Scholar] [CrossRef]
- Tsiftsis, S.; Tsiripidis, I.; Karagiannakidou, V. Identifying areas of high importance for orchid conservation in east Macedonia (NE Greece). Biodivers. Conserv. 2009, 18, 1765–1780. [Google Scholar] [CrossRef]
- Tsiftsis, S.; Tsiripidis, I.; Trigas, P. Identifying important areas for orchid conservation in Crete. Eur. J. Environ. Sci. 2011, 1, 28–37. [Google Scholar] [CrossRef]
- Apostolopoulou, E.; Pantis, J.D. Conceptual gaps in the national strategy for the implementation of the European Natura 2000 conservation policy in Greece. Biol. Conserv. 2009, 142, 221–237. [Google Scholar] [CrossRef]
- Mazaris, A.D.; Kallimanis, A.S.; Sgardelis, S.P.; Pantis, J.D. Does higher taxon diversity reflect richness of conservation interest species?: The case for birds, mammals, amphibians, and reptiles in Greek protected areas. Ecol. Indic. 2008, 8, 664–671. [Google Scholar] [CrossRef]
- Tsianou, M.A.; Mazaris, A.D.; Kallimanis, A.S.; Deligioridi, P.S.K.; Apostolopoulou, E.; Pantis, J.D. Identifying the criteria underlying the political decision for the prioritization of the Greek Natura 2000 conservation network. Biol. Conserv. 2013, 166, 103–110. [Google Scholar] [CrossRef]
- Hoffman, M.; Koenig, K.; Bunting, G.; Costanza, J.; Williams, K.J. Biodiversity Hotspots (version 2016.1). Available online: https://zenodo.org/record/3261807#.YAa7VRapRPY (accessed on 1 January 2021).
- Hijmans, R.J.; Cameron, S.E.; Parra, J.L.; Jones, P.G.; Jarvis, A. Very high resolution interpolated climate surfaces for global land areas. Int. J. Climatol. 2005, 25, 1965–1978. [Google Scholar] [CrossRef]
- Title, P.O.; Bemmels, J.B. ENVIREM: An expanded set of bioclimatic and topographic variables increases flexibility and improves performance of ecological niche modeling. Ecography 2017. [Google Scholar] [CrossRef]
- Hengl, T.; de Jesus, J.M.; Heuvelink, G.B.M.; Gonzalez, M.R.; Kilibarda, M.; Blagotić, A.; Shangguan, W.; Wright, M.N.; Geng, X.; Bauer-Marschallinger, B.; et al. SoilGrids250m: Global gridded soil information based on machine learning. PLoS ONE 2017, 12, e0169748. [Google Scholar] [CrossRef]
- Jarvis, A.; Reuter, H.I.; Nelson, A.; Guevara, E. Hole-filled SRTM for the globe Version 4. CGIAR-CSI SRTM 90 m Database. 2008. Available online: http//srtm.csi.cgiar.org (accessed on 3 November 2020).
- Amatulli, G.; Domisch, S.; Tuanmu, M.-N.; Parmentier, B.; Ranipeta, A.; Malczyk, J.; Jetz, W. A suite of global, cross-scale topographic variables for environmental and biodiversity modeling. Sci. Data 2018, 5, 180040. [Google Scholar] [CrossRef]
- Hijmans, R.J. raster: Geographic Data Analysis and Modeling. Available online: http://CRAN.R-project.org/package=raster (accessed on 1 January 2021).
- Evans, J.S. spatialEco: Spatial Analysis and Modelling Utilities, Version 1.2-0; CRAN, R Core Team: Cary, CA, USA, 2019. [Google Scholar]
- Bornovas, I.; Rondogianni-Tsiambaou, T. Geological Map of Greece. Scale 1:500,000, 2nd ed.; Institute of Geology and Mineral Exploration, Division of General Geology and Economic Geology: Athens, Greece, 1983. [Google Scholar]
- Kennedy, C.M.; Oakleaf, J.R.; Theobald, D.M.; Baruch-Mordo, S.; Kiesecker, J. Managing the middle: A shift in conservation priorities based on the global human modification gradient. Glob. Chang. Biol. 2019, 25, 811–826. [Google Scholar] [CrossRef]
- Owens, H.L.; Guralnick, R. climateStability: An R package to estimate climate stability from time-slice climatologies. Biodivers. Inform. 2019, 14, 8–13. [Google Scholar] [CrossRef]
- Brown, J.L.; Hill, D.J.; Dolan, A.M.; Carnaval, A.C.; Haywood, A.M. Paleoclim, high spatial resolution paleoclimate surfaces for global land areas. Sci. Data 2018, 5, 180254. [Google Scholar] [CrossRef]
- Gamisch, A. Oscillayers: A dataset for the study of climatic oscillations over Plio-Pleistocene time-scales at high spatial-temporal resolution. Glob. Ecol. Biogeogr. 2019, 28, 1552–1560. [Google Scholar] [CrossRef] [PubMed]
- Dormann, C.F.; Elith, J.; Bacher, S.; Buchmann, C.; Carl, G.; Carré, G.; Marquéz, J.R.G.; Gruber, B.; Lafourcade, B.; Leitão, P.J.; et al. Collinearity: A review of methods to deal with it and a simulation study evaluating their performance. Ecography 2013, 36, 027–046. [Google Scholar] [CrossRef]
- Naimi, B.; Hamm, N.A.S.; Groen, T.A.; Skidmore, A.K.; Toxopeus, A.G. Where is positional uncertainty a problem for species distribution modelling? Ecography 2014, 37, 191–203. [Google Scholar] [CrossRef]
- Kuhn, M. Building predictive models in R using the caret package. J. Stat. Softw. 2008, 28, 1–26. [Google Scholar] [CrossRef]
- Guerin, G.R.; Ruokolainen, L.; Lowe, A.J. A georeferenced implementation of weighted endemism. Methods Ecol. Evol. 2015, 6, 845–852. [Google Scholar] [CrossRef]
- Williams, P. Some properties of rarity scores used in site quality assessment. Br. J. Entomol. Nat. Hist. 2000, 13, 73–86. [Google Scholar]
- Zuloaga, J.; Currie, D.J.; Kerr, J.T. The origins and maintenance of global species endemism. Glob. Ecol. Biogeogr. 2019, 28, 170–183. [Google Scholar] [CrossRef]
- Guerin, G.R.; Lowe, A.J. ‘Sum of inverse range-sizes’ (SIR), a biodiversity metric with many names and interpretations. Biodivers. Conserv. 2015, 24, 2877–2882. [Google Scholar] [CrossRef]
- Daru, B.H.; Karunarathne, P.; Schliep, K. phyloregion: R package for biogeographical regionalization and macroecology. Methods Ecol. Evol. 2020, 11, 1483–1491. [Google Scholar] [CrossRef]
- Daru, B.H.; Elliott, T.L.; Park, D.S.; Davies, T.J. Understanding the Processes Underpinning Patterns of Phylogenetic Regionalization. Trends Ecol. Evol. 2017, 32, 845–860. [Google Scholar] [CrossRef] [PubMed]
- Smith, S.A.; Brown, J.W. Constructing a broadly inclusive seed plant phylogeny. Am. J. Bot. 2018, 105, 302–314. [Google Scholar] [CrossRef] [PubMed]
- Jin, Y.; Qian, H.V. PhyloMaker: An R package that can generate very large phylogenies for vascular plants. Ecography 2019, 42, 1353–1359. [Google Scholar] [CrossRef]
- Bruelheide, H.; Dengler, J.; Jiménez-Alfaro, B.; Purschke, O.; Hennekens, S.M.; Chytrý, M.; Pillar, V.D.; Jansen, F.; Kattge, J.; Sandel, B.; et al. sPlot–A new tool for global vegetation analyses. J. Veg. Sci. 2019, 30, 161–186. [Google Scholar] [CrossRef]
- Maitner, B.S.; Boyle, B.; Casler, N.; Condit, R.; Donoghue, J.; Durán, S.M.; Guaderrama, D.; Hinchliff, C.E.; Jørgensen, P.M.; Kraft, N.J.B.; et al. The bien r package: A tool to access the Botanical Information and Ecology Network (BIEN) database. Methods Ecol. Evol. 2018, 9, 373–379. [Google Scholar] [CrossRef]
- Davies, T.J.; Kraft, N.J.B.; Salamin, N.; Wolkovich, E.M. Incompletely resolved phylogenetic trees inflate estimates of phylogenetic conservatism. Ecology 2012, 93, 242–247. [Google Scholar] [CrossRef]
- Swenson, N.G. Phylogenetic Resolution and Quantifying the Phylogenetic Diversity and Dispersion of Communities. PLoS ONE 2009, 4, e4390. [Google Scholar] [CrossRef]
- Li, D.; Trotta, L.; Marx, H.E.; Allen, J.M.; Sun, M.; Soltis, D.E.; Soltis, P.S.; Guralnick, R.P.; Baiser, B. For common community phylogenetic analyses, go ahead and use synthesis phylogenies. Ecology 2019, 100, e02788. [Google Scholar] [CrossRef]
- Laffan, S.W.; Lubarsky, E.; Rosauer, D.F. Biodiverse, a tool for the spatial analysis of biological and related diversity. Ecography 2010, 33, 643–647. [Google Scholar] [CrossRef]
- Allen, J.M.; Germain-Aubrey, C.C.; Barve, N.; Neubig, K.M.; Majure, L.C.; Laffan, S.W.; Mishler, B.D.; Owens, H.L.; Smith, S.A.; Whitten, W.M.; et al. Spatial Phylogenetics of Florida Vascular Plants: The Effects of Calibration and Uncertainty on Diversity Estimates. iScience 2019, 11, 57–70. [Google Scholar] [CrossRef]
- Rosauer, D.; Laffan, S.W.; Crisp, M.D.; Donnellan, S.C.; Cook, L.G. Phylogenetic endemism: A new approach for identifying geographical concentrations of evolutionary history. Mol. Ecol. 2009, 18, 4061–4072. [Google Scholar] [CrossRef] [PubMed]
- Kissling, W.D.; Carl, G. Spatial autocorrelation and the selection of simultaneous autoregressive models. Glob. Ecol. Biogeogr. 2008, 17, 59–71. [Google Scholar] [CrossRef]
- Ver Hoef, J.M.; Peterson, E.E.; Hooten, M.B.; Hanks, E.M.; Fortin, M.J. Spatial autoregressive models for statistical inference from ecological data. Ecol. Monogr. 2018, 88, 36–59. [Google Scholar] [CrossRef]
- Bivand, R.S.; Wong, D.W.S. Comparing implementations of global and local indicators of spatial association. TEST 2018, 27, 716–748. [Google Scholar] [CrossRef]
- Noroozi, J.; Naqinezhad, A.; Talebi, A.; Doostmohammadi, M.; Plutzar, C.; Rumpf, S.B.; Asgarpour, Z.; Schneeweiss, G.M. Hotspots of vascular plant endemism in a global biodiversity hotspot in Southwest Asia suffer from significant conservation gaps. Biol. Conserv. 2019, 237, 299–307. [Google Scholar] [CrossRef]
- Xu, Y.; Shen, Z.; Ying, L.; Wang, Z.; Huang, J.; Zang, R.; Jiang, Y. Hotspot analyses indicate significant conservation gaps for evergreen broadleaved woody plants in China. Sci. Rep. 2017, 7, 1–10. [Google Scholar] [CrossRef]
- Proctor, J. Vegetation and soil and plant chemistry on ultramafic rocks in the tropical Far East. Perspect. Plant Ecol. Evol. Syst. 2003, 6, 105–124. [Google Scholar] [CrossRef]
- Rundel, P.W.; Arroyo, M.T.K.; Cowling, R.M.; Keeley, J.E.; Lamont, B.B.; Vargas, P. Mediterranean Biomes: Evolution of Their Vegetation, Floras, and Climate. Annu. Rev. Ecol. Evol. Syst. 2016, 47, 383–407. [Google Scholar] [CrossRef]
- Taberlet, P.; Fumagalli, L.; Wust-Saucy, A.G.; Cosson, J.F. Comparative phylogeography and postglacial colonization routes in Europe. Mol. Ecol. 1998, 7, 453–464. [Google Scholar] [CrossRef]
- Hewitt, G.M. Mediterranean Peninsulas: The Evolution of Hotspots. In Biodiversity Hotspots; Springer: Berlin/Heidelberg, Germany, 2011; pp. 123–147. [Google Scholar]
- Petit, R.J.; Aguinagalde, I.; De Beaulieu, J.L.; Bittkau, C.; Brewer, S.; Cheddadi, R.; Ennos, R.; Fineschi, S.; Grivet, D.; Lascoux, M.; et al. Glacial refugia: Hotspots but not melting pots of genetic diversity. Science 2003, 300, 1563–1565. [Google Scholar] [CrossRef]
- Griffiths, H.I.; Krystufek, B.; Reed, J.M. Balkan Biodiversity: Pattern and Process in the European Hotspot. J. Paleolimnol. 2007, 38, 609–611. [Google Scholar] [CrossRef]
- Tzedakis, P.C. The Balkans as Prime Glacial Refugial Territory of European Temperate Trees. In Balkan Biodiversity; Springer: Dordrecht, The Netherlands, 2004; pp. 49–68. [Google Scholar]
- Mansion, G.; Rosenbaum, G.; Schoenenberger, N.; Bacchetta, G.; Rosselló, J.A.; Conti, E. Phylogenetic analysis informed by geological history supports multiple, sequential invasions of the Mediterranean Basin by the angiosperm family Araceae. Syst. Biol. 2008, 57, 269–285. [Google Scholar] [CrossRef] [PubMed]
- Frajman, B.; Pachschwöll, C.; Schönswetter, P. Contributions to the knowledge of the flora of the dinarides (Balkan Peninsula). Phyt.-Ann. Rei Bot. 2014, 54, 27–46. [Google Scholar] [CrossRef]
- Lakušić, D.; Liber, Z.; Nikolić, T.; Surina, B.; Kovačić, S.; Bogdanović, S.; Stefanović, S. Molecular phylogeny of the Campanula pyramidalis species complex (Campanulaceae) inferred from chloroplast and nuclear non-coding sequences and its taxonomic implications. Taxon 2013, 62, 505–524. [Google Scholar] [CrossRef]
- Surina, B.; Schönswetter, P.; Schneeweiss, G.M. Quaternary range dynamics of ecologically divergent species (Edraianthus serpyllifolius and E. tenuifolius, Campanulaceae) within the Balkan refugium. J. Biogeogr. 2011, 38, 1381–1393. [Google Scholar] [CrossRef]
- Surina, B.; Schneeweiss, G.M.; Glasnović, P.; Schönswetter, P. Testing the efficiency of nested barriers to dispersal in the Mediterranean high mountain plant Edraianthus graminifolius (Campanulaceae). Mol. Ecol. 2014, 23, 2861–2875. [Google Scholar] [CrossRef]
- Kutnjak, D.; Kuttner, M.; Niketić, M.; Dullinger, S.; Schönswetter, P.; Frajman, B. Escaping to the summits: Phylogeography and predicted range dynamics of Cerastium dinaricum, an endangered high mountain plant endemic to the western Balkan Peninsula. Mol. Phylogenet. Evol. 2014, 78, 365–374. [Google Scholar] [CrossRef]
- Gaston, K.J.; David, R. Hotspots Across Europe. Biodivers. Lett. 1994, 2, 108. [Google Scholar] [CrossRef]
- Gómez, A.; Lunt, D.H. Refugia within Refugia: Patterns of Phylogeographic Concordance in the Iberian Peninsula. In Phylogeography of Southern European Refugia; Springer: Dordrecht, The Netherlands, 2007; pp. 155–188. ISBN 9781402049040. [Google Scholar]
- Médail, F.; Diadema, K. Glacial refugia influence plant diversity patterns in the Mediterranean Basin. J. Biogeogr. 2009, 36, 1333–1345. [Google Scholar] [CrossRef]
- Manafzadeh, S.; Salvo, G.; Conti, E. A tale of migrations from east to west: The Irano-Turanian floristic region as a source of Mediterranean xerophytes. J. Biogeogr. 2014, 41, 366–379. [Google Scholar] [CrossRef]
- Thompson, J.D. Plant Evolution in the Mediterranean; Oxford University Press: Oxford, UK, 2005; ISBN 0198515332. [Google Scholar]
- Magyari, E.K.; Chapman, J.C.; Gaydarska, B.; Marinova, E.; Deli, T.; Huntley, J.P.; Allen, J.R.M.; Huntley, B. The “oriental” component of the Balkan flora: Evidence of presence on the Thracian Plain during the Weichselian late-glacial. J. Biogeogr. 2008, 35, 865–883. [Google Scholar] [CrossRef]
- Đurović, S.; Schönswetter, P.; Niketić, M.; Tomović, G.; Frajman, B. Disentangling relationships among the members of the silene saxifraga alliance (Caryophyllaceae): Phylogenetic structure is geographically rather than taxonomically segregated. Taxon 2017, 66, 343–364. [Google Scholar] [CrossRef]
- Olšavská, K.; Slovák, M.; Marhold, K.; Štubňová, E.; Kučera, J. On the origins of Balkan endemics: The complex evolutionary history of the Cyanus napulifer group (Asteraceae). Ann. Bot. 2016, 118, 1071–1088. [Google Scholar] [CrossRef]
- Eastwood, W.J. Eastwood, W.J. East Mediterranean vegetation and climate change. In Balkan Biodiversity; Springer: Berlin/Heidelberg, Germany, 2004; pp. 25–48. [Google Scholar]
- Kryštufek, B.; Reed, J.M. Pattern and process in Balkan biodiversity—An overview. In Balkan Biodiversity; Springer: Berlin/Heidelberg, Germany, 2004; pp. 1–8. [Google Scholar]
- Stevanović, V.; Tan, K.; Petrova, A. Mapping the endemic flora of the Balkans—a progress report. Bocconea 2007, 21, 131–137. [Google Scholar]
- López-Vinyallonga, S.; López-Pujol, J.; Constantinidis, T.; Susanna, A.; Garcia-Jacas, N. Mountains and refuges: Genetic structure and evolutionary history in closely related, endemic Centaurea in continental Greece. Mol. Phylogenet. Evol. 2015, 92, 243–254. [Google Scholar] [CrossRef] [PubMed]
- Tan, K.; Stevanović, V.; Strid, A. Distribution and centres of diversity for endemic geophytic Monocots in the Balkans. Bocconea 2007, 21, 139–146. [Google Scholar]
- Georghiou, K.; Delipetrou, P. Patterns and traits of the endemic plants of Greece. Bot. J. Linn. Soc. 2010, 162, 130–422. [Google Scholar] [CrossRef]
- Strid, A. The Greek mountain flora, with special reference to the Central European element. Bocconea 1995, 5, 99–112. [Google Scholar]
- Phitos, D. The Red Data Book of Rare and Threatened Plants of Greece; World Wide Fund for Nature: Athens, Greece, 1995. [Google Scholar]
- Kontopanou, A.; Panitsa, M. Elevational Gradient of Chasmophytic Diversity, Monitoring and Conservation. Diversity 2020, 12, 33. [Google Scholar] [CrossRef]
- Strid, A. Phytogeographical aspects of the Greek mountain flora. Fragm. Florist. Geobot. Suppl. 1993, 2, 411–433. [Google Scholar]
- Buira, A.; Aedo, C.; Medina, L. Spatial patterns of the Iberian and Balearic endemic vascular flora. Biodivers. Conserv. 2017, 26, 479–508. [Google Scholar] [CrossRef]
- Buira, A.; Fernández-Mazuecos, M.; Aedo, C.; Molina-Venegas, R. The contribution of the edaphic factor as a driver of recent plant diversification in a Mediterranean biodiversity hotspot. J. Ecol. 2020. [CrossRef]
- Sosa, V.; Loera, I. Influence of current climate, historical climate stability and topography on species richness and endemism in Mesoamerican geophyte plants. PeerJ 2017, 5. [Google Scholar] [CrossRef] [PubMed]
- Millar, T.R.; Heenan, P.B.; Wilton, A.D.; Smissen, R.D.; Breitwieser, I. Spatial distribution of species, genus and phylogenetic endemism in the vascular flora of New Zealand, and implications for conservation. Aust. Syst. Bot. 2017, 30, 134–147. [Google Scholar] [CrossRef]
- Noroozi, J.; Talebi, A.; Doostmohammadi, M.; Rumpf, S.B.; Linder, H.P.; Schneeweiss, G.M. Hotspots within a global biodiversity hotspot-areas of endemism are associated with high mountain ranges. Sci. Rep. 2018, 8, 1–10. [Google Scholar] [CrossRef] [PubMed]
- Steinbauer, M.J.; Field, R.; Grytnes, J.A.; Trigas, P.; Ah-Peng, C.; Attorre, F.; Birks, H.J.B.; Borges, P.A.V.; Cardoso, P.; Chou, C.H.; et al. Topography-driven isolation, speciation and a global increase of endemism with elevation. Glob. Ecol. Biogeogr. 2016, 25, 1097–1107. [Google Scholar] [CrossRef]
- Irl, S.D.H.; Harter, D.E.V.; Steinbauer, M.J.; Gallego Puyol, D.; Fernández-Palacios, J.M.; Jentsch, A.; Beierkuhnlein, C. Climate vs. topography-spatial patterns of plant species diversity and endemism on a high-elevation island. J. Ecol. 2015, 103, 1621–1633. [Google Scholar] [CrossRef]
- Petrova, G.; Moyankova, D.; Nishii, K.; Forrest, L.; Tsiripidis, I.; Drouzas, A.D.; Djilianov, D.; Möller, M. The european paleoendemic haberlea rhodopensis (Gesneriaceae) has an oligocene origin and a pleistocene diversification and occurs in a long-persisting refugial area in southeastern europe. Int. J. Plant Sci. 2015, 176, 499–514. [Google Scholar] [CrossRef]
- Walas, L.; Ganatsas, P.; IszkuLo, G.; Thomas, P.A.; Dering, M. Spatial genetic structure and diversity of natural populations of Aesculus hippocastanum L. in Greece. PLoS ONE 2019, 14. [Google Scholar] [CrossRef]
- Hoorn, C.; Mosbrugger, V.; Mulch, A.; Antonelli, A. Biodiversity from mountain building. Nat. Geosci. 2013, 6, 154. [Google Scholar] [CrossRef]
- Mosbrugger, V.; Favre, A.; Muellner-Riehl, A.N.; Päckert, M.; Mulch, A. Cenozoic evolution of geo-biodiversity in the Tibeto-Himalayan region. Mt. Clim. Biodivers. 2018, 429, 448. [Google Scholar]
- Pyron, R.A.; Costa, G.C.; Patten, M.A.; Burbrink, F.T. Phylogenetic niche conservatism and the evolutionary basis of ecological speciation. Biol. Rev. 2015, 90, 1248–1262. [Google Scholar] [CrossRef] [PubMed]
- Sobierajska, K.; Boratyńska, K.; Jasińska, A.; Dering, M.; Ok, T.; Douaihy, B.; Bou Dagher-Kharrat, M.; Romo, Á.; Boratyński, A. Effect of the Aegean Sea barrier between Europe and Asia on differentiation in Juniperus drupacea (Cupressaceae). Bot. J. Linn. Soc. 2016, 180, 365–385. [Google Scholar] [CrossRef]
- Flantua, S.G.A.; Hooghiemstra, H. Historical connectivity and mountain biodiversity. Mt. Clim. Biodivers; Wiley Blackwell: Hoboken, NJ, USA, 2018; pp. 171–185. [Google Scholar]
- Papageorgiou, A.C.; Tsiripidis, I.; Mouratidis, T.; Hatziskakis, S.; Gailing, O.; Eliades, N.G.H.; Vidalis, A.; Drouzas, A.D.; Finkeldey, R. Complex fine-scale phylogeographical patterns in a putative refugial region for Fagus sylvatica (Fagaceae). Bot. J. Linn. Soc. 2014, 174, 516–528. [Google Scholar] [CrossRef][Green Version]
- Trigas, P.; Iatrou, G.; Karetsos, G. Species diversity, endemism and conservation of the family Caryophyllaceae in Greece. Biodivers. Conserv. 2007, 16, 357–376. [Google Scholar] [CrossRef]
- Cecchi, L.; Coppi, A.; Selvi, F. Evolutionary dynamics of serpentine adaptation in Onosma (Boraginaceae) as revealed by ITS sequence data. Plant Syst. Evol. 2011, 297, 185–199. [Google Scholar] [CrossRef]
- Cecchi, L.; Selvi, F. Phylogenetic relationships of the monotypic genera Halacsya and Paramoltkia and the origins of serpentine adaptation in circummediterranean Lithospermeae (Boraginaceae): Insights from ITS and matK DNA sequences. Taxon 2009, 58, 700–714. [Google Scholar] [CrossRef]
- Augustinos, A.; Sotirakis, K.; Trigas, P.; Kalpoutzakis, E.; Papasotiropoulos, V. Genetic Variation in Three Closely Related Minuartia (Caryophyllaceae) Species Endemic to Greece: Implications for Conservation Management. Folia Geobot. 2014, 49, 603–621. [Google Scholar] [CrossRef]
- Tzanoudakis, D.; Panitsa, M.; Trigas, P.; Iatrou, G. Floristic and phytosociological investigation of the island Antikythera and nearby islets (SW Aegean area, Greece). Willdenowia 2006, 36, 285. [Google Scholar] [CrossRef]
- Runemark, H. The phytogeography of the central Aegean. Opera Bot. 1971, 30, 20–28. [Google Scholar]
- Tan, K.; Iatrou, G. Endemic lants of Greece-The Peloponnese; Tan, K., Iatrou, G., Eds.; Narayana Press: Gylling, Denmark, 2001; ISBN 87-12-03857-1. [Google Scholar]
- Perrigo, A.; Hoorn, C.; Antonelli, A. Why mountains matter for biodiversity. J. Biogeogr. 2020, 47, 315–325. [Google Scholar] [CrossRef]
- Gottschlich, G.; Dunkel, F.G. New taxa of Hieracium and Pilosella (Asteraceae) from Northern Greece. Stapfia 2018, 24, 3–24. [Google Scholar]
- Gottschlich, G.; Dunkel, F.G. New taxa of Hieracium and Pilosella (Asteraceae) from Northern Greece II. Stapfia 2019, 111, 5–32. [Google Scholar]
- Steinbauer, M.J.; Irl, S.D.H.; Beierkuhnlein, C. Elevation-driven ecological isolation promotes diversification on Mediterranean islands. Acta Oecologica 2013, 47, 52–56. [Google Scholar] [CrossRef]
- Flantua, S.G.A.; Payne, D.; Borregaard, M.K.; Beierkuhnlein, C.; Steinbauer, M.J.; Dullinger, S.; Essl, F.; Irl, S.D.H.; Kienle, D.; Kreft, H.; et al. Snapshot isolation and isolation history challenge the analogy between mountains and islands used to understand endemism. Glob. Ecol. Biogeogr. 2020, 29, 1651–1673. [Google Scholar] [CrossRef]
- Rundell, R.J.; Price, T.D. Adaptive radiation, nonadaptive radiation, ecological speciation and nonecological speciation. Trends Ecol. Evol. 2009, 24, 394–399. [Google Scholar] [CrossRef]
- Madriñán, S.; Cortés, A.J.; Richardson, J.E. Páramo is the world’s fastest evolving and coolest biodiversity hotspot. Front. Genet. 2013, 4, 193. [Google Scholar] [CrossRef]
- Hughes, C.E.; Atchison, G.W. The ubiquity of alpine plant radiations: From the Andes to the Hengduan Mountains. New Phytol. 2015, 207, 275–282. [Google Scholar] [CrossRef]
- Hewitt, G. Some genetic consequences of ice ages, and their role in divergence and speciation. Biol. J. Linn. Soc. 1996, 58, 247–276. [Google Scholar] [CrossRef]
- Hewitt, G.M. Genetic consequences of climatic oscillations in the Quaternary. Philos. Trans. R. Soc. B Biol. Sci. 2004, 359, 183–195. [Google Scholar] [CrossRef]
- Tzedakis, P.C.; Lawson, I.T.; Frogley, M.R.; Hewitt, G.M.; Preece, R.C. Buffered tree population changes in a quaternary refugium: Evolutionary implications. Science 2002, 297, 2044–2047. [Google Scholar] [CrossRef] [PubMed]
- Jones, K.E.; Korotkova, N.; Petersen, J.; Henning, T.; Borsch, T.; Kilian, N. Dynamic diversification history with rate upshifts in Holarctic bell-flowers (Campanula and allies). Cladistics 2017, 33, 637–666. [Google Scholar] [CrossRef]
- Zhang, Y.; Qian, L.; Spalink, D.; Sun, L.; Chen, J.; Sun, H. Spatial phylogenetics of two topographic extremes of the Hengduan Mountains in southwestern China and its implications for biodiversity conservation. Plant Divers. 2020. [Google Scholar] [CrossRef]
- Heenan, P.B.; Millar, T.R.; Smissen, R.D.; McGlone, M.S.; Wilton, A.D. Phylogenetic measures of neo- and palaeo-endemism in the indigenous vascular flora of the New Zealand archipelago. Aust. Syst. Bot. 2017, 30, 124–133. [Google Scholar] [CrossRef]
- Vokou, D.; Petanidou, T.; Bellos, D. Pollination ecology and reproductive potential of Jankaea heldreichii (Gesneriaceae); a tertiary relict on Mt Olympus, Greece. Biol. Conserv. 1990, 52, 125–133. [Google Scholar] [CrossRef]
- Dynesius, M.; Jansson, R. Evolutionary consequences of changes in species’ geographical distributions driven by Milankovitch climate oscillations. Proc. Natl. Acad. Sci. USA 2000, 97, 9115–9120. [Google Scholar] [CrossRef]
- Harrison, S.; Noss, R. Endemism hotspots are linked to stable climatic refugia. Ann. Bot. 2017, 119, 207–214. [Google Scholar] [CrossRef]
- Weber, L.C.; VanDerWal, J.; Schmidt, S.; McDonald, W.J.F.; Shoo, L.P. Patterns of rain forest plant endemism in subtropical Australia relate to stable mesic refugia and species dispersal limitations. J. Biogeogr. 2014, 41, 222–238. [Google Scholar] [CrossRef]
- Feng, G.; Ma, Z.; Sandel, B.; Mao, L.; Normand, S.; Ordonez, A.; Svenning, J.C. Species and phylogenetic endemism in angiosperm trees across the Northern Hemisphere are jointly shaped by modern climate and glacial–interglacial climate change. Glob. Ecol. Biogeogr. 2019, 28, 1393–1402. [Google Scholar] [CrossRef]
- Thornhill, A.H.; Baldwin, B.G.; Freyman, W.A.; Nosratinia, S.; Kling, M.M.; Morueta-Holme, N.; Madsen, T.P.; Ackerly, D.D.; Mishler, B.D. Spatial phylogenetics of the native California flora. BMC Biol. 2017, 15, 96. [Google Scholar] [CrossRef]
- Verboom, G.A.; Archibald, J.K.; Bakker, F.T.; Bellstedt, D.U.; Conrad, F.; Dreyer, L.L.; Forest, F.; Galley, C.; Goldblatt, P.; Henning, J.F.; et al. Origin and diversification of the Greater Cape flora: Ancient species repository, hot-bed of recent radiation, or both? Mol. Phylogenet. Evol. 2009, 51, 44–53. [Google Scholar] [CrossRef] [PubMed]
- Crowl, A.A.; Visger, C.J.; Mansion, G.; Hand, R.; Wu, H.-H.; Kamari, G.; Phitos, D.; Cellinese, N. Evolution and biogeography of the endemic Roucela complex (Campanulaceae: Campanula) in the Eastern Mediterranean. Ecol. Evol. 2015, 5, 5329–5343. [Google Scholar] [CrossRef] [PubMed]
- Koutroumpa, K.; Theodoridis, S.; Warren, B.H.; Jiménez, A.; Celep, F.; Doğan, M.; Romeiras, M.M.; Santos-Guerra, A.; Fernández-Palacios, J.M.; Caujapé-Castells, J.; et al. An expanded molecular phylogeny of Plumbaginaceae, with emphasis on Limonium (sea lavenders): Taxonomic implications and biogeographic considerations. Ecol. Evol. 2018, 8, 12397–12424. [Google Scholar] [CrossRef] [PubMed]
- Vargas, P.; Fernández-Mazuecos, M.; Heleno, R. Phylogenetic evidence for a Miocene origin of Mediterranean lineages: Species diversity, reproductive traits and geographical isolation. Plant Biol. 2018, 20, 157–165. [Google Scholar] [CrossRef] [PubMed]
- Bittkau, C.; Comes, H.P. Molecular inference of a Late Pleistocene diversification shift in Nigella s. lat. (Ranunculaceae) resulting from increased speciation in the Aegean archipelago. J. Biogeogr. 2009, 36, 1346–1360. [Google Scholar] [CrossRef]
- Comes, H.P.; Tribsch, A.; Bittkau, C. Plant speciation in continental island floras as exemplified by Nigella in the Aegean Archipelago. Philos. Trans. R. Soc. Lond. B. Biol. Sci. 2008, 363, 3083–3096. [Google Scholar] [CrossRef]
- Jaros, U.; Tribsch, A.; Comes, H.P. Diversification in continental island archipelagos: New evidence on the roles of fragmentation, colonization and gene flow on the genetic divergence of Aegean Nigella (Ranunculaceae). Ann. Bot. 2018, 121, 241–254. [Google Scholar] [CrossRef]
- Daru, B.H.; le Roux, P.C.; Gopalraj, J.; Park, D.S.; Holt, B.G.; Greve, M. Spatial overlaps between the global protected areas network and terrestrial hotspots of evolutionary diversity. Glob. Ecol. Biogeogr. 2019, 28, 757–766. [Google Scholar] [CrossRef]
- Forest, F.; Grenyer, R.; Rouget, M.; Davies, T.J.; Cowling, R.M.; Faith, D.P.; Balmford, A.; Manning, J.C.; Procheş, Ş.; Van Der Bank, M.; et al. Preserving the evolutionary potential of floras in biodiversity hotspots. Nature 2007. [Google Scholar] [CrossRef]
- Ceballos, G.; Ehrlich, P.R. Global mammal distributions, biodiversity hotspots, and conservation. Proc. Natl. Acad. Sci. USA 2006, 103, 19374–19379. [Google Scholar] [CrossRef]
- Orme, C.D.L.; Davies, R.G.; Burgess, M.; Eigenbrod, F.; Pickup, N.; Olson, V.A.; Webster, A.J.; Ding, T.-S.; Rasmussen, P.C.; Ridgely, R.S.; et al. Global hotspots of species richness are not congruent with endemism or threat. Nature 2005, 436, 1016–1019. [Google Scholar] [CrossRef] [PubMed]
- Phitos, D.; Constantinidis, T.H.; Kamari, G. The red data book of rare and threatened plants of Greece, Vol. II (EZ); Hellenic Botanical Society: Patras, Greece, 2009. [Google Scholar]
- Kokkoris, I.P.; Mallinis, G.; Bekri, E.S.; Vlami, V.; Zogaris, S.; Chrysafis, I.; Mitsopoulos, I.; Dimopoulos, P. National Set of MAES Indicators in Greece: Ecosystem Services and Management Implications. Forests 2020, 11, 595. [Google Scholar] [CrossRef]
- Venter, O.; Fuller, R.A.; Segan, D.B.; Carwardine, J.; Brooks, T.; Butchart, S.H.M.; Di Marco, M.; Iwamura, T.; Joseph, L.; O’Grady, D.; et al. Targeting Global Protected Area Expansion for Imperiled Biodiversity. PLoS Biol. 2014, 12, e1001891. [Google Scholar] [CrossRef]
- Rodrigues, A.S.L.; Akcakaya, H.R.; Andelman, S.J.; Bakarr, M.I.; Boitani, L.; Brooks, T.M.; Chanson, J.S.; Fishpool, L.D.C.; Da Fonseca, G.A.B.; Gaston, K.J. Global gap analysis: Priority regions for expanding the global protected-area network. Bioscience 2004, 54, 1092–1100. [Google Scholar] [CrossRef]
- Charitonidou, M.; Halley, J.M. What goes up must come down–why high fecundity orchids challenge conservation beliefs. Biol. Conserv. 2020, 252, 108835. [Google Scholar] [CrossRef]
- Laity, T.; Laffan, S.W.; González-Orozco, C.E.; Faith, D.P.; Rosauer, D.F.; Byrne, M.; Miller, J.T.; Crayn, D.; Costion, C.; Moritz, C.C.; et al. Phylodiversity to inform conservation policy: An Australian example. Sci. Total Environ. 2015, 534, 131–143. [Google Scholar] [CrossRef]
- Rosauer, D.F.; Byrne, M.; Blom, M.P.K.; Coates, D.J.; Donnellan, S.; Doughty, P.; Keogh, J.S.; Kinloch, J.; Laver, R.J.; Myers, C.; et al. Real-world conservation planning for evolutionary diversity in the Kimberley, Australia, sidesteps uncertain taxonomy. Conserv. Lett. 2018, 11, e12438. [Google Scholar] [CrossRef]
- LIFE-IP 4 NATURA. Available online: https://edozoume.gr/en/ (accessed on 12 April 2020).
- Maes, J.; Teller, A.; Erhard, M.; Grizzetti, B.; Barredo, J.I.; Paracchini, M.-L.; Condé, S.; Somma, F.; Orgiazzi, A.; Jones, A. Mapping and Assessment of Ecosystems and their Services: An analytical framework for ecosystem condition. Publ. Off. Eur. Union Luxemb. 2018, 5, 1–78. [Google Scholar]
- Cheminal, A.; Kokkoris, I.P.; Strid, A.; Dimopoulos, P. Medicinal and Aromatic Lamiaceae Plants in Greece: Linking Diversity and Distribution Patterns with Ecosystem Services. Forests 2020, 11, 661. [Google Scholar] [CrossRef]
| Response | Predictor | Coefficients | GR2 | AICc |
|---|---|---|---|---|
| SR | AIT | 11.4 ** | 18.1 | 83671 |
| TPI | −43.02 ** | |||
| PETDRQ | −7.64 ** | |||
| PETWETQ | 8.25 ** | |||
| pH | 10.17 ** | |||
| Slope | 20.66 ** | |||
| Altitude | 43.37 ** | |||
| Iso | −19.78 ** | |||
| ER | AIT | 1.73 ** | 48.0 | 44316 |
| PETDRQ | −0.97 ** | |||
| pH | 0.71 ** | |||
| Slope | 0.73 ** | |||
| Altitude | 4.64 ** | |||
| Iso | −0.91 ** | |||
| CS | −1.52 ** | |||
| CWENAT | AIT | −0.14 ** | 28.5 | 24798 |
| TPI | −0.18 ** | |||
| PETDRQ | −0.37 ** | |||
| Altitude | 0.51 ** | |||
| CWEEND | AIT | 0.1 ** | 32.7 | 6262 |
| TPI | −0.06 ** | |||
| pH | 0.09 ** | |||
| Altitude | 0.39 ** | |||
| CS | −0.09 ** | |||
| PE | Geology | 0.25 * | 26.0 | 21959 |
| PETDRQ | −0.55 * | |||
| RPE | AIT | −0.14 ** | 28.5 | 24798 |
| TPI | −0.18 ** | |||
| PETDRQ | −0.37 ** | |||
| Altitude | 0.51 ** |
Publisher’s Note: MDPI stays neutral with regard to jurisdictional claims in published maps and institutional affiliations. |
© 2021 by the authors. Licensee MDPI, Basel, Switzerland. This article is an open access article distributed under the terms and conditions of the Creative Commons Attribution (CC BY) license (http://creativecommons.org/licenses/by/4.0/).
Share and Cite
Kougioumoutzis, K.; Kokkoris, I.P.; Panitsa, M.; Kallimanis, A.; Strid, A.; Dimopoulos, P. Plant Endemism Centres and Biodiversity Hotspots in Greece. Biology 2021, 10, 72. https://doi.org/10.3390/biology10020072
Kougioumoutzis K, Kokkoris IP, Panitsa M, Kallimanis A, Strid A, Dimopoulos P. Plant Endemism Centres and Biodiversity Hotspots in Greece. Biology. 2021; 10(2):72. https://doi.org/10.3390/biology10020072
Chicago/Turabian StyleKougioumoutzis, Konstantinos, Ioannis P. Kokkoris, Maria Panitsa, Athanasios Kallimanis, Arne Strid, and Panayotis Dimopoulos. 2021. "Plant Endemism Centres and Biodiversity Hotspots in Greece" Biology 10, no. 2: 72. https://doi.org/10.3390/biology10020072
APA StyleKougioumoutzis, K., Kokkoris, I. P., Panitsa, M., Kallimanis, A., Strid, A., & Dimopoulos, P. (2021). Plant Endemism Centres and Biodiversity Hotspots in Greece. Biology, 10(2), 72. https://doi.org/10.3390/biology10020072


