Increases in Genetic Diversity of Weedy Rice Associated with Ambient Temperatures and Limited Gene Flow


Abstract
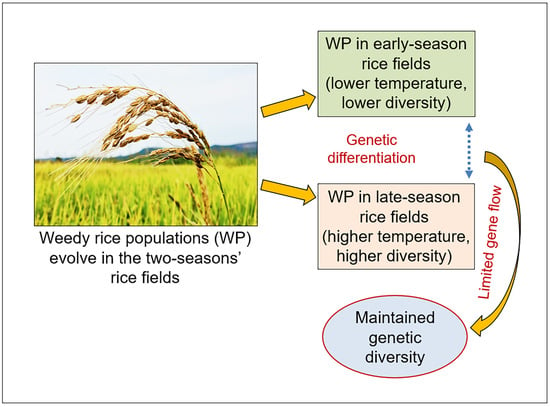
Simple Summary
Abstract
1. Introduction
2. Materials and Methods
2.1. Plant Materials
2.2. DNA Extraction and Polymerase Chain Reaction Amplification
2.3. Estimation of Temperature in the Early and Late Seasons
2.4. Estimation of Genetic Diversity
2.5. Analyses of Genetic Divergence and Correlation
2.6. Analysis of Genetic Structure
3. Results
3.1. Differences in Air Temperature between the Early and Late Rice-Cultivation Seasons
3.2. Genetic Diversity of Weedy Rice Populations and Differentiation between the Early- and Late-Season Populations
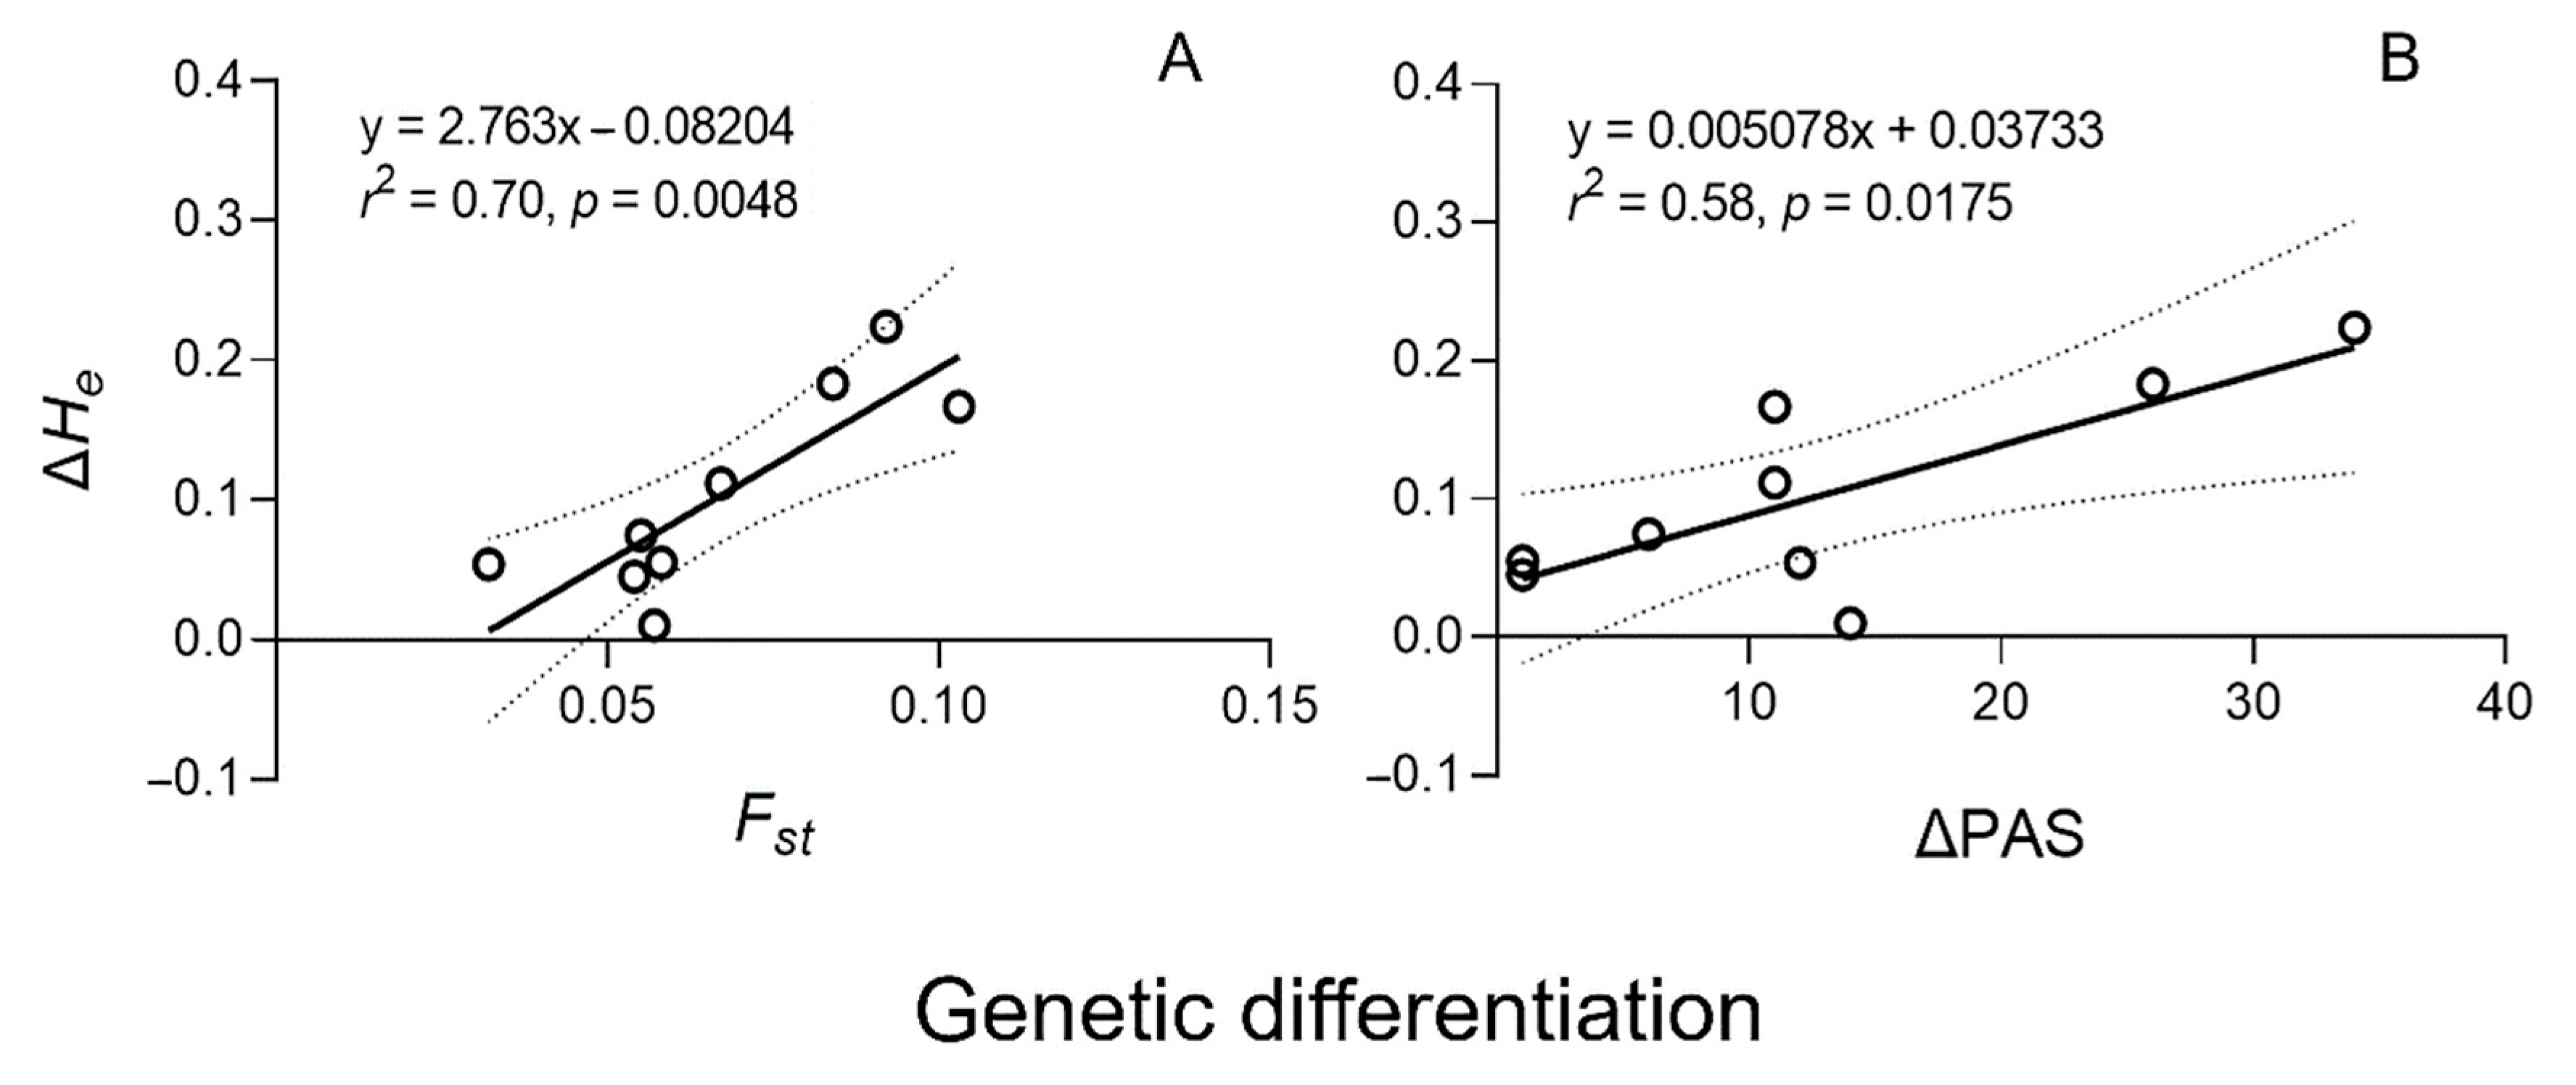
3.3. Correlation between Genetic Diversity and Differentiation in Weedy Rice Populations
3.4. Genetic Structure of the Early- and Late-Season Weedy Rice Populations
4. Discussion
4.1. Increased Genetic Diversity of Weedy Rice Associated with Higher Ambient Temperature
4.2. Limited Gene Flow Promotes the Maintenance of increased Genetic Diversity in the Late-Season Weedy Rice Populations
5. Conclusions
Supplementary Materials
Author Contributions
Funding
Institutional Review Board Statement
Informed Consent Statement
Data Availability Statement
Conflicts of Interest
References
- Bennett, E.M.; Cramer, W.; Begossi, A.; Cundill, G.; Díaz, S.; Egoh, B.N.; Geijzendorffer, I.R.; Krug, C.B.; Lavorel, S.; Lazos, E.; et al. Linking biodiversity, ecosystem services, and human well-being: Three challenges for designing research for sustainability. Curr. Opin. Environ. Sustain. 2015, 14, 76–85. [Google Scholar] [CrossRef]
- Pecl, G.T.; Araújo, M.B.; Bell, J.D.; Blanchard, J.; Bonebrake, T.C.; Chen, I.C.; Clark, T.D.; Colwell, R.K.; Danielsen, F.; Evengård, B.; et al. Biodiversity redistribution under climate change: Impacts on ecosystems and human well-being. Science 2017, 355, eaai9214. [Google Scholar] [CrossRef] [PubMed]
- Kennedy, D.; Norman, C. What don’t we know? Science 2005, 309, 75. [Google Scholar] [CrossRef] [PubMed]
- Rohde, K. Latitudinal gradients in species diversity: The search for the primary cause. Oikos 1992, 65, 514–527. [Google Scholar] [CrossRef]
- Gaston, K.J. Global patterns in biodiversity. Nature 2000, 405, 220–227. [Google Scholar] [CrossRef]
- Willig, M.R.; Kaufman, D.M.; Stevens, R.D. Latitudinal Gradients of Biodiversity: Pattern, Process, Scale, and Synthesis. Annu. Rev. Ecol. Evol. Syst. 2003, 34, 273–309. [Google Scholar] [CrossRef]
- Mannion, P.D.; Upchurch, P.; Benson, R.B.J.; Goswami, A. The latitudinal biodiversity gradient through deep time. Trends Ecol. Evol. 2014, 29, 42–50. [Google Scholar] [CrossRef]
- Beals, E.W. Vegetational change along altitudinal gradients. Science 1969, 165, 981–985. [Google Scholar] [CrossRef]
- Pineda, J.; Caswell, H. Bathymetric species-diversity patterns and boundary constraints on vertical range distributions. Deep-Sea Res. Part II 1998, 45, 83–101. [Google Scholar] [CrossRef]
- Scheiner, S.M.; Rey-Benayas, J.M. Global patterns of plant diversity. Evol. Ecol. 1994, 8, 331–347. [Google Scholar] [CrossRef]
- Kreft, H.; Jetz, W. Global patterns and determinants of vascular plant diversity. Proc. Natl. Acad. Sci. USA 2007, 104, 5925–5930. [Google Scholar] [CrossRef] [PubMed]
- Kier, G.; Mutke, J.; Dinerstein, E.; Ricketts, T.H.; Küper, W.; Kreft, H.; Barthlott, W. Global patterns of plant diversity and floristic knowledge. J. Biogeogr. 2005, 32, 1107–1116. [Google Scholar] [CrossRef]
- Wang, Z.H.; Fang, J.Y.; Tang, Z.Y.; Lin, X. Patterns, determinants and models of woody plant diversity in China. Proc. R. Soc. B Biol. Sci. 2011, 278, 2122–2132. [Google Scholar] [CrossRef] [PubMed]
- Wang, Z.; Fu, M.J.; Zhu, H.G.; Zhu, Y.; Zhao, X.X.; Lu, B.R. Enhanced genetic diversity of weedy rice populations associated with latitude decreases revealed by simple sequence repeat fingerprints. J. Syst. Evol. 2019, 57, 66–74. [Google Scholar] [CrossRef]
- Manel, S.; Guerin, P.E.; Mouillot, D.; Blanchet, S.; Velez, L.; Albouy, C.; Pellissier, L. Global determinants of freshwater and marine fish genetic diversity. Nat. Commun. 2020, 11, 692. [Google Scholar] [CrossRef]
- Hughes, A.R.; Inouye, B.D.; Johnson, M.T.J.; Underwood, N.; Vellend, M. Ecological consequences of genetic diversity. Ecol. Lett. 2008, 11, 609–623. [Google Scholar] [CrossRef]
- Ellegren, H.; Galtier, N. Determinants of genetic diversity. Nat. Rev. Genet. 2016, 17, 422–433. [Google Scholar] [CrossRef]
- Jump, A.S.; Peñuelas, J. Running to stand still: Adaptation and the response of plants to rapid climate change. Ecol. Lett. 2005, 8, 1010–1020. [Google Scholar] [CrossRef]
- Jump, A.S.; Marchant, R.; Peñuelas, J. Environmental change and the option value of genetic diversity. Trends Plant Sci. 2009, 14, 51–58. [Google Scholar] [CrossRef]
- Lindgren, D. The temperature influence on the spontaneous mutation rate II. Investigation by the aid of waxy mutants. Hereditas 1972, 70, 179–184. [Google Scholar] [CrossRef] [PubMed]
- Chu, X.L.; Zhang, B.W.; Zhang, Q.G.; Zhu, B.R.; Lin, K.; Zhang, D.Y. Temperature responses of mutation rate and mutational spectrum in an Escherichia coli strain and the correlation with metabolic rate. BMC Evol. Biol. 2018, 18, 126. [Google Scholar] [CrossRef] [PubMed]
- Gillman, L.N.; Wright, S.D. Species richness and evolutionary speed: The influence of temperature, water and area. J. Biogeogr. 2014, 41, 39–51. [Google Scholar] [CrossRef]
- Fine, P.V.A. Ecological and evolutionary drivers of geographic variation in species diversity. Ann. Rev. Ecol. Evol. Syst. 2015, 46, 369–392. [Google Scholar] [CrossRef]
- Cao, Q.J.; Lu, B.R.; Xia, H.; Rong, J.; Sala, F.; Spada, A.; Grassi, F. Genetic diversity and origin of weedy rice (Oryza sativa f. spontanea) populations found in North-eastern China revealed by simple sequence repeat (SSR) markers. Ann. Bot. 2006, 98, 1241–1252. [Google Scholar] [CrossRef] [PubMed]
- Delouche, J.C.; Burgos, N.R.; Labrada, R.; Gealy, D.R. Weedy rices: Origin, biology, ecology and control. In FAO Plant Production and Protection Paper; FAO: Rome, Italy, 2007. [Google Scholar]
- Lu, B.R.; Yang, C. Gene flow from genetically modified rice to its wild relatives: Assessing potential ecological consequences. Biotechnol. Adv. 2009, 27, 1083–1091. [Google Scholar] [CrossRef] [PubMed]
- Cao, Q.J.; Li, B.; Song, Z.P.; Cai, X.X.; Lu, B.R. Impact of weedy rice populations on the growth and yield of direct-seeded and transplanted rice. Weed Biol. Manag. 2007, 7, 97–104. [Google Scholar] [CrossRef]
- Wang, Z.; Rong, J.; Lu, B.R. Occurrence and damage of weedy rice and its threats to rice production in China (in Chinese). Weed Sci. 2015, 33, 1–9. [Google Scholar]
- Ziska, L.H.; Gealy, D.R.; Burgos, N.; Caicedo, A.L.; Gressel, J.; Lawton-Rauh, A.L.; Avila, L.A. Weedy (red) rice: An emerging constraint to global rice production. Adv. Agron. 2015, 129, 181–228. [Google Scholar]
- Li, G.J.; He, Z.X.; Wang, G.; Ke, B.N.; Luo, C.L.; Lu, B.R. Occurrence, damage and control strategies of weedy rice in Leizhou, Guangdong Province (in Chinese). Weed Sci. 2013, 31, 20–25. [Google Scholar]
- Xia, H.B.; Wang, W.; Xia, H.; Zhao, W.; Lu, B.R. Conspecific crop-weed introgression influences evolution of weedy rice (Oryza sativa f. spontanea) across a geographical range. PLoS ONE 2011, 6, e16189. [Google Scholar] [CrossRef]
- Jiang, Z.X.; Xia, H.B.; Basso, B.; Lu, B.R. Introgression from cultivated rice influences genetic differentiation of weedy rice populations at a local spatial scale. Theor. Appl. Genet. 2012, 124, 309–322. [Google Scholar] [CrossRef] [PubMed]
- Zhang, L.J.; Dai, W.M.; Wu, C.; Song, X.L.; Qiang, S. Genetic diversity and origin of Japonica-and Indica-like rice biotypes of weedy rice in the Guangdong and Liaoning provinces of China. Genet. Resour. Crop Evol. 2012, 59, 399–410. [Google Scholar] [CrossRef]
- He, Z.X.; Jiang, X.Q.; Ratnasekera, D.; Grassi, F.; Perera, U.; Lu, B.R. Seed-mediated gene flow promotes genetic diversity of weedy rice within populations: Implications for weed management. PLoS ONE 2014, 9, e112778. [Google Scholar] [CrossRef] [PubMed]
- Greenhouse Data Sharing Platform (In Chinses). Available online: http://data.sheshiyuanyi.com/WeatherData (accessed on 11 November 2020).
- Murray, M.G.; Thompson, W.F. Rapid isolation of high molecular weight plant DNA. Nucleic Acids Res. 1980, 8, 4321–4326. [Google Scholar] [CrossRef] [PubMed]
- The Gramene Database. Available online: http://www.gramene.org (accessed on 11 November 2020).
- Yang, C.; Wang, Z.; Yang, X.; Lu, B.R. Segregation distortion affected by transgenes in early generations of rice crop-weed hybrid progeny: Implications for assessing potential evolutionary impacts from transgene flow into wild relatives. J. Syst. Evol. 2014, 52, 466–476. [Google Scholar] [CrossRef]
- Wang, Z.; Wang, L.; Wang, Z.; Lu, B.R. Non-random transmission of parental alleles into crop-wild and crop-weed hybrid lineages separated by a transgene and neutral identifiers in rice. Sci. Rep. 2017, 7, 10436. [Google Scholar] [CrossRef]
- Lishi Tianqi Weather Database (In Chinese). Available online: http://lishi.tianqi.com/leizhou/index.html (accessed on 11 November 2020).
- Blalock, H.M. Social Statistics; McGraw-Hill: New York, NY, USA, 1972. [Google Scholar]
- Peakall, R.; Smouse, P.E. GenAlEx 6.5: Genetic analysis in Excel. Population genetic software for teaching and research: An update. Bioinformatics 2012, 28, 2537–2539. [Google Scholar] [CrossRef]
- GraphPad Prism. Available online: https://www.graphpad.com/scientific-software/prism (accessed on 11 November 2020).
- Pritchard, J.K.; Stephens, M.; Donnelly, P. Inference of population structure using multilocus genotype data. Genetics 2000, 155, 945–959. [Google Scholar]
- Falush, D.; Stephens, M.; Pritchard, J.K. Inference of population structure using multilocus genotype data: Linked loci and correlated allele frequencies. Genetics 2003, 164, 1567–1587. [Google Scholar]
- Earl, D.A.; Vonholdt, B.M. STRUCTURE HARVESTER: A website and program for visualizing STRUCTURE output and implementing the Evanno method. Conserv. Genet. Resour. 2012, 4, 359–361. [Google Scholar] [CrossRef]
- Jakobsson, M.; Rosenberg, N.A. CLUMPP: A cluster matching and permutation program for dealing with label switching and multimodality in analysis of population structure. Bioinformatics 2007, 23, 1801–1806. [Google Scholar] [CrossRef]
- Rosenberg Lab at Stanford University. Available online: https://web.stanford.edu/group/rosenberglab/software.html (accessed on 11 November 2020).
- Garris, A.J.; Tai, T.H.; Coburn, J.; Kresovich, S.; McCouch, S. Genetic structure and diversity in Oryza sativa L. Genetics 2005, 169, 1631–1638. [Google Scholar] [CrossRef] [PubMed]
- Wang, M.X.; Zhang, H.L.; Zhang, D.L.; Qi, Y.W.; Fan, Z.L.; Li, D.Y.; Pan, D.J.; Cao, Y.S.; Qiu, Z.E.; Yu, P.; et al. Genetic structure of Oryza rufipogon Griff. in China. Heredity 2008, 101, 527–535. [Google Scholar] [CrossRef] [PubMed][Green Version]
- Reif, J.C.; Hamrit, S.; Heckenberger, M.; Schipprack, W.; Maurer, H.P.; Bohn, M.; Melchinger, A.E. Genetic structure and diversity of European flint maize populations determined with SSR analyses of individuals and bulks. Theor. Appl. Genet. 2005, 111, 906–913. [Google Scholar] [CrossRef] [PubMed]
- Pereira, H.M. A latitudinal gradient for genetic diversity. Science 2016, 353, 1494–1495. [Google Scholar] [CrossRef] [PubMed]
- Dowle, E.J.; Morgan-Richards, M.; Trewick, S.A. Molecular evolution and the latitudinal biodiversity gradient. Heredity 2013, 110, 501–510. [Google Scholar] [CrossRef]
- Chen, L.J.; Lee, D.S.; Song, Z.P.; Suh, H.S.; Lu, B.R. Gene flow from cultivated rice (Oryza sativa) to its weedy and wild relatives. Ann. Bot. 2004, 93, 67–73. [Google Scholar] [CrossRef]
- Schoen, D.J.; Brown, A.H. Intraspecific variation in population gene diversity and effective population size correlates with the mating system in plants. Proc. Natl. Acad. Sci. USA 1991, 88, 4494–4497. [Google Scholar] [CrossRef]
- Cieslarová, J.; Smýkal, P.; Dočkalová, Z.; Hanáček, P.; Procházka, S.; Hýbl, M.; Griga, M. Molecular evidence of genetic diversity changes in pea (Pisum sativum L.) germplasm after long-term maintenance. Genet. Resour. Crop Evol. 2011, 58, 439–451. [Google Scholar] [CrossRef]
- Kitner, M.; Majeský, L.; Křístková, E.; Jemelková, M.; Lebeda, L.; Beharav, A. Genetic structure and diversity in natural populations of three predominantly self-pollinating wild Lactuca species in Israel. Genet. Resour. Crop Evol. 2015, 62, 991–1008. [Google Scholar] [CrossRef]
- Zhang, D.L.; Shen, X.F.; Chen, Y. Investigation on the occurrence and distribution of weedy rice in Guangdong province. Guangdong Agric. Sci. 2013, 23, 70–73. (In Chinese) [Google Scholar]
- Romdhane, M.B.; Riahi, L.; Selmi, A.; Jardak, R.; Bouajila, A.; Ghorbel, A.; Zoghlami, N. Low genetic differentiation and evidence of gene flow among barley landrace populations in Tunisia. Crop Sci. 2017, 57, 1585–1593. [Google Scholar] [CrossRef]
- Yan, X.B.; Guo, Y.X.; Zhao, C.; Liu, F.Y.; Lu, B.R. Intra-population genetic diversity of two wheatgrass species along altitude gradients on the Qinghai-Tibetan Plateau: Its implication for conservation and utilization. Conserv. Genet. 2009, 10, 359–367. [Google Scholar] [CrossRef]
- Yu, G.Q.; Bao, Y.; Shi, C.H. Genetic diversity and population differentiation of Liaoning weedy rice detected by RAPD and SSR markers. Biochem. Genet. 2005, 43, 261–270. [Google Scholar] [CrossRef] [PubMed]
- Li, M.B.; Wang, H.; Cao, L.M. Evaluation of population structure, genetic diversity and origin of Northeast Asia weedy rice based on simple sequence repeat markers. Rice Sci. 2015, 22, 180–188. [Google Scholar]
- Shivrain, V.K.; Burgos, N.R.; Anders, M.M.; Rajguru, S.N.; Moore, J.; Sales, M.A. Gene flow between Clearfield™ rice and red rice. Crop Prot. 2007, 26, 349–356. [Google Scholar] [CrossRef]
- Shivrain, V.K.; Burgos, N.R.; Gealy, D.R.; Moldenhauer, K.A.K.; Baquireza, C.J. Maximum outcrossing rate and genetic compatibility between red rice (Oryza sativa) biotypes and Clearfield™ rice. Weed Sci. 2008, 56, 807–813. [Google Scholar] [CrossRef]
- Shivrain, V.K.; Burgos, N.R.; Gealy, D.R.; Sales, M.A.; Smith, K.L. Gene flow from weedy red rice (Oryza sativa L.) to cultivated rice and fitness of hybrids. Pest. Manag. Sci. 2009, 65, 1124–1129. [Google Scholar] [CrossRef]
- Storfer, A. Gene flow and endangered species translocations: A topic revisited. Biol. Conserv. 1999, 87, 173–180. [Google Scholar] [CrossRef]
- Délye, C.; Clément, J.A.J.; Pernin, F.; Chauvel, B.; Corre, V.L. High gene flow promotes the genetic homogeneity of arable weed populations at the landscape level. Basic Appl. Ecol. 2010, 11, 504–512. [Google Scholar] [CrossRef]
- Golestani, A.; Gras, R.; Cristescu, M. Speciation with gene flow in a heterogeneous virtual world: Can physical obstacles accelerate speciation? Proc. R. Soc. B Biol. Sci. 2012, 279, 3055–3064. [Google Scholar] [CrossRef] [PubMed]
- Nosil1, P.; Harmon, L.J.; Seehausen, O. Ecological explanations for (incomplete) speciation. Trends Ecol. Evol. 2009, 24, 145–156. [Google Scholar] [CrossRef] [PubMed]
- Song, Z.P.; Xu, X.; Wang, B. Genetic diversity in the northernmost Oryza rufipogon populations estimated by SSR markers. Theor. Appl. Genet. 2003, 107, 1492–1499. [Google Scholar] [CrossRef] [PubMed]
- Li, K.Q.; Chen, L.; Feng, Y.H.; Yao, J.X.; Li, B.; Xu, M.; Li, H.G. High genetic diversity but limited gene flow among remnant and fragmented natural populations of Liriodendron chinense Sarg. Biochem. Syst. Ecol. 2014, 54, 230–236. [Google Scholar] [CrossRef]
- Islam, M.S.; Lian, C.L.; Kameyama, N.; Hogetsu, T. Low genetic diversity and limited gene flow in a dominant mangrove tree species (Rhizophora stylosa) at its northern biogeographical limit across the chain of three Sakishima islands of the Japanese archipelago as revealed by chloroplast and nuclear SSR analysis. Plant Syst. Evol. 2014, 300, 1123–1136. [Google Scholar]
- Garrido-Garduño, T.; Téllez-Valdés, O.; Manel, S.; Vázquez-Domínguez, E. Role of habitat heterogeneity and landscape connectivity in shaping gene flow and spatial population structure of a dominant rodent species in a tropical dry forest. J. Zool. 2016, 298, 293–302. [Google Scholar] [CrossRef]
- Jin, X.; Chen, Y.; Liu, P.; Li, C.; Cai, X.X.; Rong, J.; Lu, B.R. Introgression from cultivated rice alters genetic structures of wild relative populations: Implications for in situ conservation. AoB Plants 2017, 10, plx055. [Google Scholar] [CrossRef]
- Sagnard, F.; Deu, M.; Dembélé, D.; Leblois, R.; Touré, L.; Diakité, M.; Calatayud, C.; Vaksmann, M.; Bouchet, S.; Mallé, Y.; et al. Genetic diversity, structure, gene flow and evolutionary relationships within the Sorghum bicolor wild-weedy-crop complex in a western African region. Theor. Appl. Genet. 2011, 123, 1231–1246. [Google Scholar] [CrossRef]
- Jacquemyn, H.; Roldán-Ruiz, I.; Honnay, O. Evidence for demographic bottlenecks and limited gene flow leading to low genetic diversity in a rare thistle. Conserv. Genet. 2010, 11, 1979–1987. [Google Scholar] [CrossRef]
- Sebbenn, A.M.; Carvalho, A.C.M.; Freitas, M.L.M.; Moraes, S.M.B.; Gaino, A.P.S.C.; da Silva, J.M.; Jolivet, C.; Moraes, M.L.T. Low levels of realized seed and pollen gene flow and strong spatial genetic structure in a small, isolated and fragmented population of the tropical tree Copaifera langsdorffii Desf. Heredity 2011, 106, 134–145. [Google Scholar] [CrossRef]
- Vahdati, K.; Pourtaklu, S.M.; Karimi, R.; Barzehkar, R.; Amiri, R.; Mozaffari, M.; Woeste, K. Genetic diversity and gene flow of some Persian walnut populations in southeast of Iran revealed by SSR markers. Plant Syst. Evol. 2015, 301, 691–699. [Google Scholar] [CrossRef]


| Year | Minimum Temperature (°C) | Maximum Temperature (°C) | ||
|---|---|---|---|---|
| Early 1 | Late | Early | Late | |
| 2011 | 20.6 (4.51) | 23.5 (2.12) | 27.3 (5.82) | 30.5 (2.59) |
| 2012 | 22.5 (4.15) | 23.5 (2.12) | 28.8 (5.19) | 30.4 (2.32) |
| 2013 | 22.2 (3.26) | 23.3 (2.32) | 28.8 (3.95) | 30.0 (2.03) |
| 2014 | 22.6 (3.56) | 23.8 (2.19) | 28.7 (4.88) | 31.0 (2.19) |
| 2015 | 23.0 (3.49) | 24.0 (2.27) | 30.1 (4.59) | 30.8 (2.72) |
| 2016 | 22.7 (4.14) | 25.1 (1.60) | 29.1 (5.06) | 31.8 (2.24) |
| 2017 | 22.9 (3.41) | 24.9 (2.67) | 29.0 (4.03) | 31.8 (2.60) |
| 2018 | 22.8 (3.65) | 23.4 (2.35) | 29.4 (3.89) | 30.3 (1.93) |
| 2019 | 23.3 (3.04) | 24.3 (2.20) | 29.9 (3.74) | 31.3 (2.25) |
| 2020 | 22.9 (3.64) | 24.0 (2.43) | 29.8 (4.79) | 30.6 (2.94) |
| 10-year average | 22.6 (0.75) | 24.0 (0.62) | 29.1 (0.80) | 30.9 (0.62) |
| p-value 2 | <0.001 | <0.001 | ||
| Difference 3 | 1.4 | 1.8 | ||
| Location | Population | Nea | P/% | I | He |
|---|---|---|---|---|---|
| Banjiu | Banjiu-E b | 1.78 (0.14) | 88.90 | 0.66 (0.09) | 0.35 (0.05) |
| Banjiu-L | 2.36 (0.15) | 96.30 | 0.93 (0.08) | 0.51 (0.04) | |
| Chidou | Chidou-E | 1.79 (0.15) | 96.30 | 0.69 (0.08) | 0.37 (0.04) |
| Chidou-L | 1.92 (0.12) | 96.30 | 0.77 (0.07) | 0.42 (0.04) | |
| Dongcun | Dongcun-E | 2.14 (0.18) | 96.30 | 0.84 (0.07) | 0.47 (0.04) |
| Dongcun-L | 1.84 (0.12) | 96.30 | 0.72 (0.07) | 0.40 (0.04) | |
| Dadong | Dadong-E | 1.26 (0.07) | 85.19 | 0.31 (0.06) | 0.16 (0.03) |
| Dadong-L | 1.64 (0.12) | 92.59 | 0.65 (0.07) | 0.35 (0.04) | |
| Hejia | Hejia-E | 1.88 (0.14) | 92.59 | 0.71 (0.08) | 0.40(0.04) |
| Hejia-L | 2.07 (0.15) | 96.30 | 0.82 (0.07) | 0.45 (0.04) | |
| Leigao1 | Leigao1-E | 1.54 (0.11) | 88.89 | 0.57 (0.07) | 0.31 (0.04) |
| Leigao1-L | 1.95 (0.14) | 96.30 | 0.77 (0.07) | 0.42 (0.04) | |
| Leigao2 | Leigao2-E | 1.73 (0.13) | 92.59 | 0.69 (0.07) | 0.37 (0.04) |
| Leigao2-L | 1.60 (0.09) | 92.59 | 0.61 (0.06) | 0.32 (0.04) | |
| Shanwei | Shanwei-E | 1.09 (0.03) | 70.37 | 0.15 (0.03) | 0.07 (0.02) |
| Shanwei-L | 1.52 (0.09) | 96.30 | 0.56 (0.06) | 0.29 (0.03) | |
| Xiachu | Xiachu-E | 2.32 (0.16) | 96.30 | 0.93 (0.07) | 0.51 (0.04) |
| Xiachu-L | 2.51 (0.22) | 96.30 | 1.00 (0.08) | 0.52 (0.04) | |
| Average | WR-E c | 1.73 (0.13) | 89.71 (0.03) | 0.62 (0.08) | 0.33 (0.05) |
| WR-L | 1.93 (0.11) | 95.47 (0.01) | 0.76 (0.05) | 0.41 (0.03) |
| Source | d.f. | SS | MS | Est. Var. | % |
|---|---|---|---|---|---|
| Among populations | 17 | 2030 | 119.428 | 1.42 | 20% |
| Within populations | 1422 | 8123 | 5.712 | 5.71 | 80% |
| Total | 1439 | 10153 | 7.13 | 100% |
| Locations | Population Pairs | No. of PAS | Average Freq. of PAS | Season-Specific PAS | Fst |
|---|---|---|---|---|---|
| Banjiu | Banjiu-E a | 17 | 0.19 (0.05) | / | 0.103 |
| Banjiu-L | 28 | 0.14 (0.06) | / | ||
| Chidou | Chidou-E | 23 | 0.13 (0.06) | / | 0.058 |
| Chidou-L | 22 | 0.11 (0.04) | / | ||
| Dongcun | Dongcun-E | 19 | 0.10 (0.05) | / | 0.055 |
| Dongcun-L | 13 | 0.16 (0.09) | / | ||
| Dadong | Dadong-E | 9 | 0.16 (0.07) | / | 0.084 |
| Dadong-L | 35 | 0.09 (0.03) | / | ||
| Hejia | Hejia-E | 12 | 0.05 (0.02) | / | 0.032 |
| Hejia-L | 24 | 0.06 (0.02) | / | ||
| Leigao1 | Leigao1-E | 17 | 0.09 (0.03) | / | 0.067 |
| Leigao1-L | 28 | 0.10 (0.05) | / | ||
| Leigao2 | Leigao2-E | 17 | 0.07 (0.02) | / | 0.054 |
| Leigao2-L | 18 | 0.11 (0.07) | / | ||
| Shanwei | Shanwei-E | 3 | 0.33 (0.17) | / | 0.092 |
| Shanwei-L | 37 | 0.08 (0.03) | / | ||
| Xiachu | Xiachu-E | 9 | 0.11 (0.04) | / | 0.057 |
| Xiachu-L | 23 | 0.06 (0.01) | / | ||
| Average | WR-E b | 14 (2.1) | 0.14 (0.03) | / | 0.067 |
| WR-L | 25 (2.5) | 0.10 (0.01) | RM246-126 c |
Publisher’s Note: MDPI stays neutral with regard to jurisdictional claims in published maps and institutional affiliations. |
© 2021 by the authors. Licensee MDPI, Basel, Switzerland. This article is an open access article distributed under the terms and conditions of the Creative Commons Attribution (CC BY) license (http://creativecommons.org/licenses/by/4.0/).
Share and Cite
Kong, H.; Wang, Z.; Guo, J.-Y.; Xia, Q.-Y.; Zhao, H.; Zhang, Y.-L.; Guo, A.-P.; Lu, B.-R. Increases in Genetic Diversity of Weedy Rice Associated with Ambient Temperatures and Limited Gene Flow. Biology 2021, 10, 71. https://doi.org/10.3390/biology10020071
Kong H, Wang Z, Guo J-Y, Xia Q-Y, Zhao H, Zhang Y-L, Guo A-P, Lu B-R. Increases in Genetic Diversity of Weedy Rice Associated with Ambient Temperatures and Limited Gene Flow. Biology. 2021; 10(2):71. https://doi.org/10.3390/biology10020071
Chicago/Turabian StyleKong, Hua, Zhi Wang, Jing-Yuan Guo, Qi-Yu Xia, Hui Zhao, Yu-Liang Zhang, An-Ping Guo, and Bao-Rong Lu. 2021. "Increases in Genetic Diversity of Weedy Rice Associated with Ambient Temperatures and Limited Gene Flow" Biology 10, no. 2: 71. https://doi.org/10.3390/biology10020071
APA StyleKong, H., Wang, Z., Guo, J.-Y., Xia, Q.-Y., Zhao, H., Zhang, Y.-L., Guo, A.-P., & Lu, B.-R. (2021). Increases in Genetic Diversity of Weedy Rice Associated with Ambient Temperatures and Limited Gene Flow. Biology, 10(2), 71. https://doi.org/10.3390/biology10020071