Article

Effect of the Elemental Content of Shells of the Bivalve Mollusks (Mytilus galloprovincialis) from Saldanha Bay (South Africa) on Their Crystallographic Texture

by
Pavel Nekhoroshkov
1,*,
Inga Zinicovscaia
1,2,
Dmitry Nikolayev
1,
Tatiana Lychagina
1,
Alexey Pakhnevich
1,3,
Nikita Yushin
1 and
Jacques Bezuidenhout
4
1
Frank Laboratory of Neutron Physics, Joint Institute for Nuclear Research, 141980 Dubna, Russia
2
Horia Hulubei National Institute for R&D in Physics and Nuclear Engineering, 077125 Bucharest, Romania
3
Borissiak Paleontological Institute, Russian Academy of Sciences, 117997 Moscow, Russia
4
Faculty of Military Science, Stellenbosch University, Victoria Street, Stellenbosch 7602, South Africa
*
Author to whom correspondence should be addressed.
Biology 2021, 10(11), 1093; https://doi.org/10.3390/biology10111093
Submission received: 13 September 2021 / Revised: 20 October 2021 / Accepted: 21 October 2021 / Published: 25 October 2021

Abstract

:

Simple Summary

The aim was to study the question of whether the texture of mollusk shells changes with alteration in their elemental composition. Even though significant differences between concentrations of elements among the stations were found, the crystallographic textures of mussel shells from the studied bays showed insignificant dissimilarities. The observed differences in the maximum values in the pole figures fell within the range of variability identified for the genus Mytilus. Nevertheless, they appeared to correlate with the concentrations of Br, Mg, and Sr, which merits further investigation using larger sample sizes and higher variabilities of the ecological state of mussels.

Abstract

A both wild and farmed mussels in natural conditions, anthropogenic inputs are usually reflected in the increase of the content of specific elements. To determine the possible effect of the elemental patterns of farmed and wild mussels (Mytilus galloprovincialis) collected in the Saldanha Bay area (South Africa) on the crystallographic texture of the shells, the content of 20 elements in shells and 24 in the soft tissue of mussels was determined by neutron activation analysis. The crystallographic texture of mussel shells was analyzed using time-of-flight neutron diffraction. The wild mussels from open ocean site live in stressful natural conditions and contain higher amounts of the majority of determined elements in comparison with mussels farmed in closed water areas with anthropogenic loadings. The changes between the maximums of the same pole figures of the three samples are in the range of variability identified for the genus Mytilus. The content of Cl, Sr, and I was the highest in mussels from the open ocean site, which is reflected by the lowest mass/length ratio. The determined crystallographic textures of mussels are relatively stable as shown in the analyzed pole figures despite the concentrations of Na, Mg, Cl, Br, Sr, and I in shells, which significantly differ for wild and farmed mussels. The stability of the crystallographic texture that we observed suggests that it can be used as a reference model, where if a very different texture is determined, increased attention to the ecological situation should be paid.

Graphical Abstract

1. Introduction

Mytilus galloprovincialis, a cosmopolite mussel species, has a wide geographical distribution spanning from the Subtropics to the Arctic. In addition, among other species of mussel (including filum Mytilus), it tolerates changes of a wide range of environmental parameters (temperature, salinity, and pH). The adaptation potential of Mytilus galloprovincialis is reflected in the high ranges of micro- and macroelement concentrations relative to the anthropogenic or natural inputs.
The number of works focused on the content of elements in shells of mussels is limited. Usually, the relationships between potential elemental proxies by using specific ratios (element/Ca or element/Na) or effect of environmental factors such as temperature [1], salinity, pH [2,3], and seawater chemistry on elemental composition is investigated. Some studies have focused on the analysis of micro or macroelements along transects of shells to describe the temporal trends connected with change of the environmental parameters and growth rates [1]. Several works are dedicated to the analysis of the interlinking of elements in soft tissues and shells of mussels used as bioindicators of water pollution [4,5]. However, in such studies, the number of determined elements is usually low (3–12 elements). They are hindered by the limits of detection of the techniques and lack of reference data about microelement concentrations.
Since bivalves are sensitive organisms, it is assumed that environmental changes could affect the texture of their shells. The effect of salinity and pH treatments on the crystal orientation in mussel shells was studied by Grenier [6]. They showed that biomineralization processes are significantly affected by lower pH conditions than by lower salinity. It is important to note that in real estuarine conditions, mussels are not exposed to such low levels of salinity and pH to reveal the adaptation mechanism.
The present study aimed to determine the elemental patterns of farmed and wild mussels collected in the Saldanha Bay area (South Africa) and to assess their possible effect on the crystallographic texture of the shells. Neutron activation analysis (NAA) was applied to determine the elemental composition of the samples. The technique is used for an accurate determination of a large number of elements, including rare earth elements, heavy elements such as Sb, Cs, Th, U, and nonmetals such as As, Se in samples with different matrices [7].
Crystallographic texture studies are traditionally carried out using X-ray or electron backscattered diffraction (EBSD). However, due to the small penetration depth into the substance, it is impossible to obtain the necessary information for a complete description of the texture using these methods. Information about texture is traditionally obtained from pole figures. Complete pole figures can only be measured by thermal neutron diffraction. Moreover, it should be noticed that the X-ray and EBSD techniques have special requirements, in that a sample must be flat, whereas a sample for neutron measurements does not require special preparation. It is known in material science that adding elements can drastically change the crystallographic texture of alloys [8]. Therefore, it is of interest to study the question of whether the texture of mollusk shells changes with alteration in their elemental composition. Both techniques are non-destructive and characterized by high sensitivity.
For this study, the Saldanha Bay zone was chosen for its water areas with farmed and wild mussels. The Danger Bay is situated out of the Small bay and the Langebaan lagoon and is influenced by open ocean waters. These three zones have been characterized by a relatively uniform vertical structure of the water column based on temperature and salinity changes [9]. The Saldanha Bay Harbor is a developing industrial area, which exports such products as coal, lead, steel, titanium slag, zinc concentrate, and zircon [10]. These materials could be sources of water pollution with chemical elements, which could accumulate in marine bivalves growing in nearby zones. However, according to ecological state reports, the concentrations of trace elements in mussels from the studied area decreased in the last decade [9]. In mussels from the Saldanha area, the levels of elements were analyzed by several authors [11,12], including our works [13,14,15,16].
Metal concentrations in mussels Mytilus galloprovincialis had been measured since 1985 as part of the Mussel Watch Programme [17]. which. provides some indication of bioavailable metals in the coastal environment. The lack of data on metal concentrations in shells in addition to soft tissues and established limits of their dangerous or safe levels in natural conditions increase the importance of such studies.

2. Materials and Methods
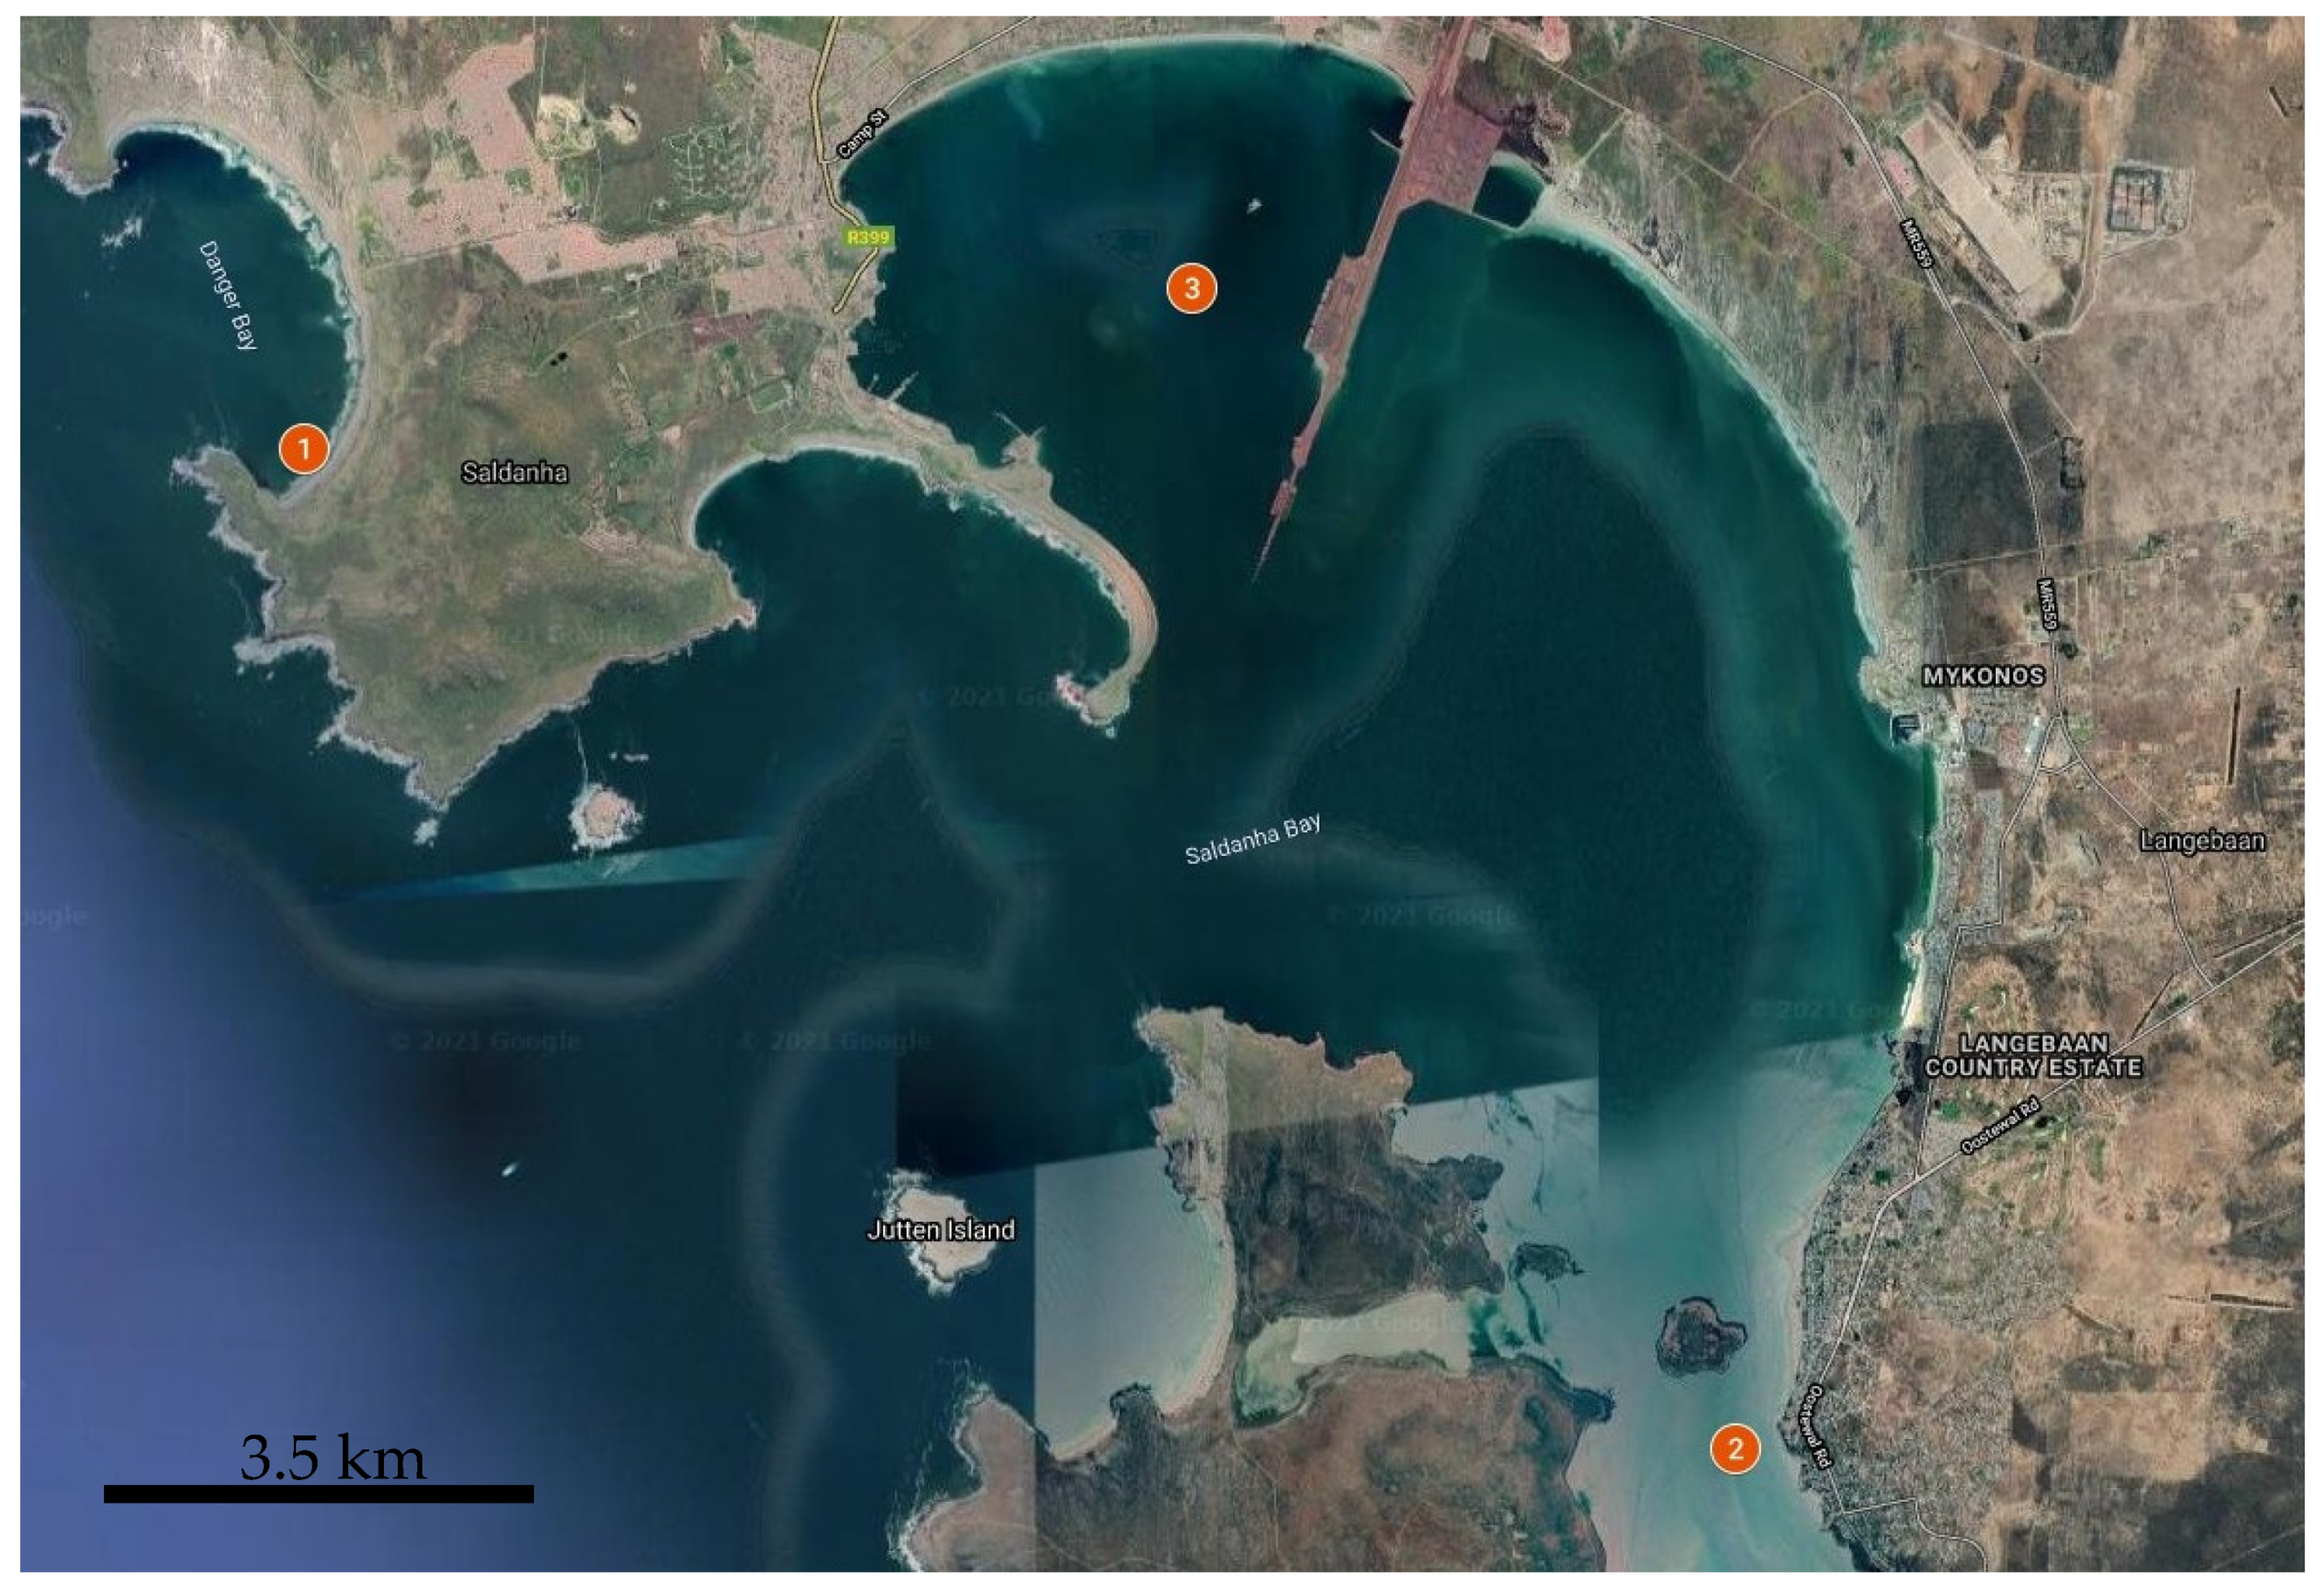
2.1. Sampling

The samples of mussels were collected from three stations in the Saldanha Bay from April 16 to May 09, 2019, before the spawning period (Figure 1). The stations were chosen as the most representative in terms of availability of mussels, stability of environmental parameters, and differences in pollution level according to previous studies [13,14,15,16]:
St. 1. Danger Bay was chosen to represent the features of wild mussels, which grow in a pristine tidal zone and are exposed to waves and sunlight.
St. 2. Mussels from Langebaan Yacht Club were grown under the jetty and were always submerged in water. This site is close to the West Coast National Park, exposed to pollution sources at the mouth of the lagoon.
St. 3. Mussels in Small bay were grown at the West Coast Aqua Culture farm.
From each site, 11–17 individuals of one typical size (50–70 mm) of Mytilus galloprovincialis were chosen randomly and collected. The number of mussels was determined with the following considerations: minimum number of individuals necessary per sampling site, representativeness of the subsample, and minimization of the deviations within the group. In addition, the collection of such number of mussels does not harm the natural population.
The length (maximum anterior-posterior axis), height (maximum dorsal-ventral axis), and width (maximum lateral axis) of shells were measured according to Lauzon-Guay et al. [18]. For biometric characterization, the means of the following ratios were calculated and presented further: mass of soft tissue (mg/kg, dry weight)/length (mm); weight (mm)/height (mm); and conditional index (mg/cm3) calculated as mass of soft tissue (dry weight)/length × width × height, according to [19].
The samples were frozen and transported to the Joint Institute for Nuclear Research, Dubna (Russian Federation) for further analysis.

2.2. Characterization of the Environmental Parameters

The temperature and salinity were in the typical range for open ocean zones according to the Saldanha bay state report [9]. They ranged from 13 to 20 °C and from 32 to 35 PSU, respectively, independently of rain and tidal activities. Even rain and weather changes influencing one of the sites more than the others, the salinity and temperature fluctuations were not as great. This resulted in the adaptation of mussels to specific hydrophysical conditions.
Salinity remained constant within a narrow range for the studied period (34.6–34.9 PSU). High or low salinity outliers were not detected during the monitoring program in the April-May season [9].
In general, at all key sites of the bay during the monitoring study, the water profiles were found to be consistent. Bottom water with lower salinity usually enters the Bay during the upwelling season (summer), and high salinity surface waters are developed in late summer/autumn (the study period).
The introduction of oceanic waters into Saldanha Bay could be identified based on temperature and salinity measurements and it results in the reduction of the levels of nitrate and chlorophyll concentrations. Rarely the fast intrusions in the bay (St. 2 and 3) could change the relatively stable stratification in the upper layer. It tends to create stress conditions for mussels which are expressed by increased rates of accumulation of the majority of microelements in the soft tissue of the organisms. St. 1 is situated in a zone constantly open to the influence of ocean waters and storm activities, so the mussels from this station grow in more stress-related conditions than mussels from the other sites.
Usually, the dissolved oxygen in the bottom waters of the bay reaches low levels in the summer and autumn due to storms and vertical mixing of the water column. The alternate stratification and water column mixing associated with upwelling and relaxation phases over 3–10 day periods are set in the autumn period [9]. The extremely low dissolved oxygen values were recorded for a short period in May (1 to 2 mg/L) which were below the tolerable levels for invertebrates and fish [9]. According to Clark, such low oxygen events could be associated with an introduction of cold water from the adjacent coast where low oxygen water is known to occur during autumn.
Turbidity in the Saldanha Bay usually increases under strong wind conditions (due to the wind and wave action that suspends particulate matter in the water column) and the Danger bay is highly exposed to this impact [9]. Langebaan Lagoon, however, typically remains clear with low levels of turbidity even when the winds stay strong. This could be explained by the coarse structure of the sediment in the lagoon compared to the finer sediment in Saldanha Bay [9]. The water column turbidity data reflected the same general trends, the turbidity in winter generally ranged from 5 to 12 NTU, and in other seasons it typically falls within the interval between 5 and 8 NTU [20].
The influx of nutrient-rich upwelled water into Saldanha Bay is a critical factor for the growth of natural mussel assemblages or mariculture.
The fact that the thermocline is shallower than 5 m depth means that the shallower parts of Saldanha Bay, particularly the Langebaan Lagoon, are not exposed to nutrients (mainly nitrate) from the Benguela upwelling system [9]. As a result, these shallow water areas do not support large plankton blooms and are usually clear.
It is known that winds and upwellings tend to create stress conditions for the mussel population. The stratification of the water column from spring to summer can be caused by wind-driven upwelling, and during the winter the water column stays more or less isothermal [9]. Earlier continuous monitoring of the temperature identified a three-week break in the usual upwelling cycle in December 1999, with consequent gradual warming of the bottom water. This event was associated with a decrease in phytoplankton production due to reduced import of nutrients, which negatively affected local mussel mariculture [21]. Sampling for this study was performed in April-May, as relatively stable stratification conditions were assumed based on the monitoring study by [21].

2.3. Elemental Analysis

In the laboratory, mussels were rinsed with deionized water to remove mud, sediments, and other particles. For NAA each mussel was dissected with a plastic knife, separated into the shell and soft tissue batches, and weighed. The material of soft tissues and shells was firstly lyophilized and then dried to constant weight at 105 °C.
To decrease the inter-individual variability, which was previously studied [14,16], the soft tissues and shells of all mussels from each site were grouped into pooled samples and homogenized.
The samples were homogenized to powder using a planetary mono mill with agate milling balls (PULVERISETTE 6, Fritsch Laboratory Instruments GmbH, Germany) at 400 rpm. Three repeats for each station were created and analyzed independently. The 0.3 g of sample were packed into polythene bags for the determination of short-lived isotopes and aluminum cups for long-lived isotopes of elements.
Neutron activation analysis at the REGATA facility of the reactor IBR-2 (Dubna, Russian Federation) was applied for the determination of 23 macro- and microelements in soft tissues and 20 in shells for each pooled batch of mussels. This method fits well for the determination of specific groups of elements considered as markers, key elements, which allow for estimation of the significance of terrigenous and anthropogenic factors [16].
The instrumental neutron activation analysis was performed differently for 3 groups of elements according to the following determination types [7,16]. For short-lived isotopes (Mg, Al, S, Cl, Ca, Ti, V, Mn, I) the subsamples were irradiated at a neutron flux of 1.6 × 10¹² n cm−2 s−1 for 3 min and immediately measured for 15 min. For long-lived isotopes, the subsamples were irradiated with epithermal neutrons in a channel with a cadmium shield at a neutron flux of 3.31 × 10¹¹ n cm−2 s−1 for 3 days, after 3 and 20 days of decay samples were measured for 30 min (for such elements as Na, K, As, Br, and U) and 90 min (for Sc, Cr, Fe, Co, Ni, Zn, Se, Rb, Sr, Sb, Cs, and Th), respectively. The spectra of induced gamma activity were measured with HPGe detectors (Canberra) with a resolution of 1.9 keV at 1332 keV total absorption peak of 60Co. The detector is calibrated using standard spectrometric and certified reference materials [22].
Specialized software developed in FLNP JINR [21] was used to create a Group Standard Sample (GSS) from standard reference materials (SRMs) irradiated simultaneously with the samples to calculate the content of elements with maximum accuracy. The GSS is also used to test the quality of the analysis. This procedure, applied to SRMs, allowed to compare the obtained and certified values and provided quality control of the analysis [7].
For quality control assurance (Table 1), standard reference materials (SRMs) of different origin provided by the National Institute of Standards and Technology (NIST), Institute of Nuclear Chemistry and Technology (INCT/ICHTJ) and Joint Research Centre (JRC), Institute for Reference Materials and Measurements (IRMM) were used: JRC-IRMM-BCR-063R (Skim milk powder), NIST1633c (Coal fly ash), NIST1549 (Non-fat milk powder), NIST1632d (Trace elements in coal), NIST2710a (Montana Soil), NIST2711a (Montana soil), INCT-CTA-FFA1 (Fine fly ash), JRC-IRMM-BCR-667 (Estuarine sediment), and NIST1566b (Oyster tissue). For the majority of elements, the concentrations were in the range of 5% deviation between determined and certified values. Since the standard material for oyster tissue (1566b) contains only a limited number of certified values, the use of standards of different matrices allowed to expand the number of determinable elements in the mussel samples, [16]. Chemical matrix effects, known to be significant sources of error in other types of instrumental chemical analysis, are insignificant in NAA. In the case of small samples (size and weight), the use of reference materials with matrices different from the analyzed sample is provided by the insignificant matrix effect in NAA [23].

2.4. Crystallographic Texture Analysis of Minerals of Shells

The pole figures presented in this work were measured at the Frank Laboratory of Neutron Physics of the Joint Institute for Nuclear Research (Dubna, Russia). For that, the SKAT spectrometer (Spectrometer for Quantitative Texture Analysis) located on channel 7A-2 of the IBR-2 pulsed nuclear reactor was used [24]. Time-of-flight neutron diffraction was used to obtain diffraction reflections corresponding to the minerals that make up the shells.
SKAT consists of a detector ring (2 m diameter), on which 19 detector-collimator complexes are located at the same scattering angle 2θ = 90°. The detector modules are mounted on the circumference of the detector ring in such a way that the step on the pole figure is 5°. The long flight path of more than 100 m and the collimator system provide a relatively high resolution of Δd∕d = 5 × 10⁻³ at d = 2.5 Å and 2θ as reported by Keppler et al. [25]. This resolution allows having non-overlapped diffraction peaks for some of the calcite and aragonite reflexes of which the shells are composed. Pole figures are extracted from measured 19 × 72 = 1368 diffraction patterns that correspond to the 5° × 5°. It should be noted that thanks to the time-of-flight technique, pole figures from all minerals (phases) presented in the sample are measured simultaneously, that is, they are extracted from the same patterns. The cross-section of the neutron beam of 50 × 90 mm makes it possible to measure large samples up to 100 cm3. It should be emphasized that each partial pattern was measured under the same conditions, meaning that the pole figures obtained in this way do not need correction. Furthermore, due to the large penetration depth of neutrons, bulk samples of centimeter size can readily be investigated in transmission geometry.
The most intense isolated diffraction reflections in each of the recorded patterns were analyzed using the Pole Figure Extractor program [26] to determine the nature of the distribution of the corresponding crystallographic planes in the valves. The intensity of one reflection corresponding to the crystallographic plane with certain Miller indices gives one point on the pole figure indicated by these indices. The conventional approach to extract pole figures from the measured diffraction patterns was used. The way to assign integrated intensity and background value to the corresponding pole figure point could be summarized by formulas:
I I ( y ) = ( t max t min ) i = t min i = t max I ( t i ) ,   B k g ( y ) = 1 ( t max t min ) i = t min i = t max I ( t i ) .
In this case, a part of the measured pattern containing the diffraction reflex is divided into three regions. The side regions are used for background estimation whereas the central region is for intensity estimation.
The intensity on the pole figure is:
P h i ( y ) = I I ( y ) B k g l e f t ( y ) + B k g r i g h t ( y ) 2 .
The approach for PF extraction based on a summation of the intensities was selected because the peak/noise ratio for both calcite and aragonite phases was not very high. It was revealed that the accuracy of pole figures extraction depends on peak/noise ratio [27]. All extracted pole figures were normalized and smoothed with the same parameter [28].
The more ordered the mineral crystals the higher the intensity on the pole figure (pole density), expressed in units of isotropic distribution (multiple random distribution, MRD). An increase of pole figure intensity is interpreted as texture strengthening. A pole density value equal to unity means that the corresponding crystallographic planes are uniformly distributed in all directions in the sample.
For the study, valve sizes of at least 30 mm in length and a mass of at least 10 g were selected. The 3–4 valves were connected using a two-component adhesive. This was carried out to collect a volume of material sufficient for measurements. Then the sample prepared in this way was attached to a glass pin and fixed in the goniometer of the setup (Figure 2). The measurement time for each sample was 22 h.
Either only the left or only the right valves were used. They were studied as a whole, and not as valves surface fragments as is the case of backscattered electron diffraction or X-ray texture analysis.
The shells consist of two mineral phases which are calcite and aragonite. The most intense diffraction reflections corresponding to crystallographic planes with Miller indices (0006) and (10–14) for calcite and (012)/(121) and (102)/(200) for aragonite were analyzed. The neutron diffraction pattern for one of the samples is presented in Figure 2, and it is the sum of 1368 partial patterns measured for different directions.

2.5. Statistics

The obtained data were checked and analyzed by STATISTICA 12 software. For descriptive statistics, the means and standard deviations, excluding the outliers were used. For an indication of the precision of concentrations, we were used the coefficients of variations (CV = SD/mean) in %. For assessment of the significance of differences between the levels of mean concentrations among stations, the Kruskal-Wallis test [29] was performed for the following reasons: the small number of observations (sample size), normality of the data is nonessential (a non-parametric test), each observation is independent of others.

3. Results and Discussion

3.1. Elemental Content of Shells and Soft Tissues and Allometry

Concentrations of 20 elements determined in shells and 24 elements—in soft tissues of mussels from 3 stations are presented in Table 2. According to obtained data, the shells of Mytilus galloprovincialis, as well as the soft tissues, were good accumulators of elements such as Na, Mg, Al, Cl, Sc, V, Cr, Mn, Fe, Co, Ni, Zn, Br, Sb, I, Cs, Th and U. However, the low levels of concentrations for majority of analyzed elements decrease the abilities to use shells in biomonitoring studies. It is worth to note that levels of such elements as Sc, Sb, I, Cs, and Th were found in shells close to those in soft tissues, which means that shells could be used as biomonitors for such elements.
For comparative assessment, the mean levels of elements among stations and literature data are presented for shells in Table 3 and soft tissues in Table 4.
The significant differences between stations were found for the following elements:
In shells:
The concentrations of Cl, Sr, I in mussels from st. 1 were significantly higher (Kruskal-Wallis test, p < 0.003, p < 0.02, and p < 0.05, respectively) than in mussels from St. 2 and 3. The highest concentrations of Na and Mg were found at St. 2 (Langebaan) and they significantly differ (Kruskal-Wallis test, p < 0.01 and p < 0.02, respectively) from St. 1 and St. 3. The highest concentrations of Br were found at St. 3 and it significantly differ (Kruskal-Wallis test, p < 0.03) from St. 2 and St. 3.
In soft tissues:
The highest concentrations of Na, Mg, Cl, Cr, Fe, Co, Ni, Zn, As, Br, Sr, Sb, I, and U were determined at St. 1 and they significantly differ (Kruskal-Wallis test, p < 0.002 to p < 0.03) from St. 2 and 3. The highest concentrations of As, Se, Rb, Cs, and Th at St. 2 significantly differ (Kruskal-Wallis test, p < 0.004 to p < 0.03) from St. 1 and 3. The majority of elements (except Zn, As, Se, and Rb) were significantly lower (Kruskal-Wallis test, p < 0.01 to p < 0.004) at St. 3 than at St. 1 and 2.
The levels of elements in shells from the Saldanha zone are in agreement with similar data for mussels from the Adriatic area (Table 3). However, the concentrations determined by Fatoki et al. [4] in mussels collected in Cape Town were higher than in mussels from Saldanha bay according to our study. They analyzed large mussels of Mytilus galloprovincialis (50–70 mm), using two different techniques: EDXRF and ICP-MS methods. The high concentrations are probably connected with the contribution of terrigenous and anthropogenic components expressed by the high levels of such elements as Al, V, Cr, Mn, Fe, Co, Ni, Zn. The concentrations of these elements in [4] were greater than in mussels from Saldanha bay by one order of magnitude. On the other hand, our data revealed higher levels of Ca and Sr.
The data from the Mediterranean, Cape Town, and other sites in the Saldanha Bay area were used for the comparison of levels of elements in soft tissues of mussels [4,16,30,31,32,33] (Table 4) by using a review study of Yap et al. [34]. Our data were in agreement with the ranges of selected elements in Mytilus galloprovincialis from Spain [31], and the Mediterrainean water area [30,32]. The exception corresponded to mussels from the impacted area in the study of Signa et al. [32]. The individuals from Strandloper, which is situated in the greywater outlet in the Saldanha zone, contained elements at similar or slightly lower levels than those of St. 1 (Danger Bay). It could be explained by an established tolerance of mussels from St. 1 (Danger bay) to stress events and the regulation of levels of elements in soft tissues during the process of adaptation at this station. However, for the majority of elements in mussels, the levels from the polluted zone of Cape Town, as presented by Fatoki et al. [4], and the maximal levels in a study by Richir et al. [33] were higher than those obtained in the present study.
The levels of elements in soft tissues could be compared with maximum permissible levels established for seafood products (MPL) in wet weight (ww) [16,35,36]. For this purpose, the obtained concentrations of elements were transformed from dry to wet weight by a conversion factor (wet weight/dry weight = 0.32), which was calculated for the Saldanha zone previously [16].
The average levels of MPLs for Cr, Ni, Zn, As, and Se were set as 1, 80, 200, 3, and 1.2 µg/g, respectively (according to [35,36]). The mean concentrations of Cr (1.1 µg/g, ww) in the soft tissue of the studied mussels from St. 1 (Danger Bay) exceeded the average MPL probably due to the presence of suspended material with high content of Cr. This is also in agreement with a higher concentration of Cr in shells from St. 1 in respect to other stations. The average MPL for Se (1.2 ppm, ww) exceeded the set point value in soft tissues of mussels from all studied stations (1.6–2.3 ppm, ww). The values for Mn, Ni, Zn, and As, which are known to indicate pollution features, were below the average MPLs in mussels from all stations. Such levels of elements reveal the non-polluted state of mussels collected in the autumn of 2019.
Shells undergo erosion depending on the weather, the position of individuals within the mussel bed and on a substrate, etc. Thus, all of these parameters can hypothetically affect the structure of the shell.
The width/height (W/H) ratio could be used as an indicator of both the relative age and growth rate for the mussels [19]. A high width/height ratio indicates individuals with decreasing growth rate and increased relative physiological age. Moreover, this ratio is an important factor usually associated with high element concentrations [19]. For young fast-growing mussels, the W/H ratio at all sites was 0.6–0.8 while for older mussels of any length it was in the range of 1.0–1.1. The W/H ratio was the highest at St. 1 (0.94, Table 5), and the lowest at St. 2 (0.69).
In addition to indicating the differences in features of growth, the width/height ratio is an important factor associated with element concentrations. It has been reposted that increased element concentrations are associated with decreased growth rate [19]. For mussels from St. 1 (Danger bay) having a higher width/height ratio and a lower mass/length ratio, the highest levels of the majority of micro and macroelements were obtained. However, the condition index was at the level of mussels from St. 2 with lower levels of elements. This could be explained by the action of the stress factors at the Langebaan yacht club (St. 2) such as coastal pollution and ship traffic.
The maximum length of mussels varies from site to site and is generally associated with nutritional factors (e.g., mussels on the upper shore are much smaller than subtidal mussels) but also with stress (e.g., wave action, pollution). The mass/length ratio could reflect the processes of degradation of individuals expressed in decreasing the mass of soft tissues and increasing the length and width of shells [19]. The mass of soft tissue could fluctuate and may even decline with senescence [19] that agreed with W/H ratios and growth features.
According to the low values of the mass/length ratio, mussels from Danger Bay have the lowest weight of soft tissue per shell size. They are exposed to the open ocean, so rapid and continuous changes in wave activity can cause stress to these organisms. This process affects allometry parameters and, according to our data, is reflected in high concentrations of such elements such as Na, Mg, Cl, V, Cr, Fe, Co, Ni, Zn, As, Br, Sr, Sb, I, and U in soft tissues and Al, Cl, Cr, Fe, Ni, Zn, Sr, and I in shells.
However, the conditional index calculated from allometry parameters of shells and mass of soft tissues showed that the mussels from St. 1 grow in better or the same conditions as at St. 2 (Langebaan). That could be explained by the adaptation of individuals to stress conditions at St. 1 On the other hand, the mussels from St. 2 can be are exposed to stress associated with suspended particles of terrigenous origin, which is expressed in high concentrations of elements such as Al, Sc, Rb, Cs, Th (markers of a terrigenous component) in soft tissues. The mussels from St. 3 (Small bay) revealed the highest conditional index according to their morphometry parameters. It is in agreement with the lowest concentrations for the majority of elements in soft tissues determined at this site.

3.2. Environmental Features Based on Element/Na and Element/Ca Ratios

The highest levels of the majority of elements (except Al, Cl, Zn, Sr, and I) in soft tissues of mussels were determined in samples from St. 1 (Danger Bay). This revealed the specific state of mussels from this zone, exposed to the storms, tidal activities, and impact of open ocean waters. Consequently, they accumulated elements such as Na, Mg, Br are in concentrations significantly higher (Kruskal-Wallis test, p < 0.03) than at the other stations, which can be explained by the higher concentrations of elements in the water at St. 1. In addition, this could be connected with the high growth rates of farmed mussels (at St. 3) in comparison with wild offshore mussels [10]. Another possible explanation is the early spawn period in mussels at St. 1 because the trace metal accumulation rates have been linked to the gametogenic cycle [12]. Our previous studies also revealed higher levels of the majority of elements in soft tissues of mussels at this station [13,15]. The specific state of the mussels is expressed also in the lower weight of the soft tissue and greater length of the shells (described further). It is interesting to note that the levels of elements in shells from this station were lower than from other places. Thus, the soft tissues accumulate high levels of micro and macroelements and subsequently release them into surrounding waters, and do not incorporate them into their shells, except for Al, Cl, Zn, Sr, and I, which probably correspond to with their concentration in water.
Sodium was used as a salinity proxy for the determination of elements that may originate from marine waters. Salinity was reflected in the soft tissue of mussels in the following manner: the ratios Element/Na for K, Ca, Mn, Se, Rb were in the increasing order: at St. 1 (Danger Bay), St. 2 (Langebaan), St. 3 (Small Bay). In shells, the ratio of Br/Na is distributed in a similar order (St. 1, St. 2, St. 3). However, the ratios Element/Na for the rest of the determined elements revealed that the shells of mussels from St. 2 (Langebaan) contain lower levels than in mussels from St. 1 (Danger bay), yet higher than mussels from St. 3 (Small bay).
Calcium as a matrix element in shells is present in the form of calcite or aragonite minerals. The ratios Element/Ca reveal elemental impurities in the shell structure. The high content of elements such as Al, Cl, Cr, Fe, etc. in shells of mussels from St. 1 resulted in high values of the Element/Ca ratios. However, these elements are not considered anthropogenic, since the station is situated in a pristine area.
Mg/Ca is considered as a temperature proxy in shells of mussels (Mytilus edulis and Mytilus trossulus) [1]. The values of the Mg/Ca ratio in mussels from St. 2 (Langebaan) were higher than from St. 1 and 3, which agrees with the higher temperature of waters, which is characteristic of the Langebaan lagoon.
In mussels from St. 3 (Small bay) the Mn/Ca ratios reached lower levels than in mussels from St. 1 and St. 2, which can be associated with relatively low levels of nutrients and microalgae. It is known that high Mn/Ca levels could be associated with phytoplankton blooms [37]. The Mn/Ca ratio in many cases indicates chlorophyll in surrounding waters and is associated with the growth of phytoplankton assemblages, on which mussels feed [38].

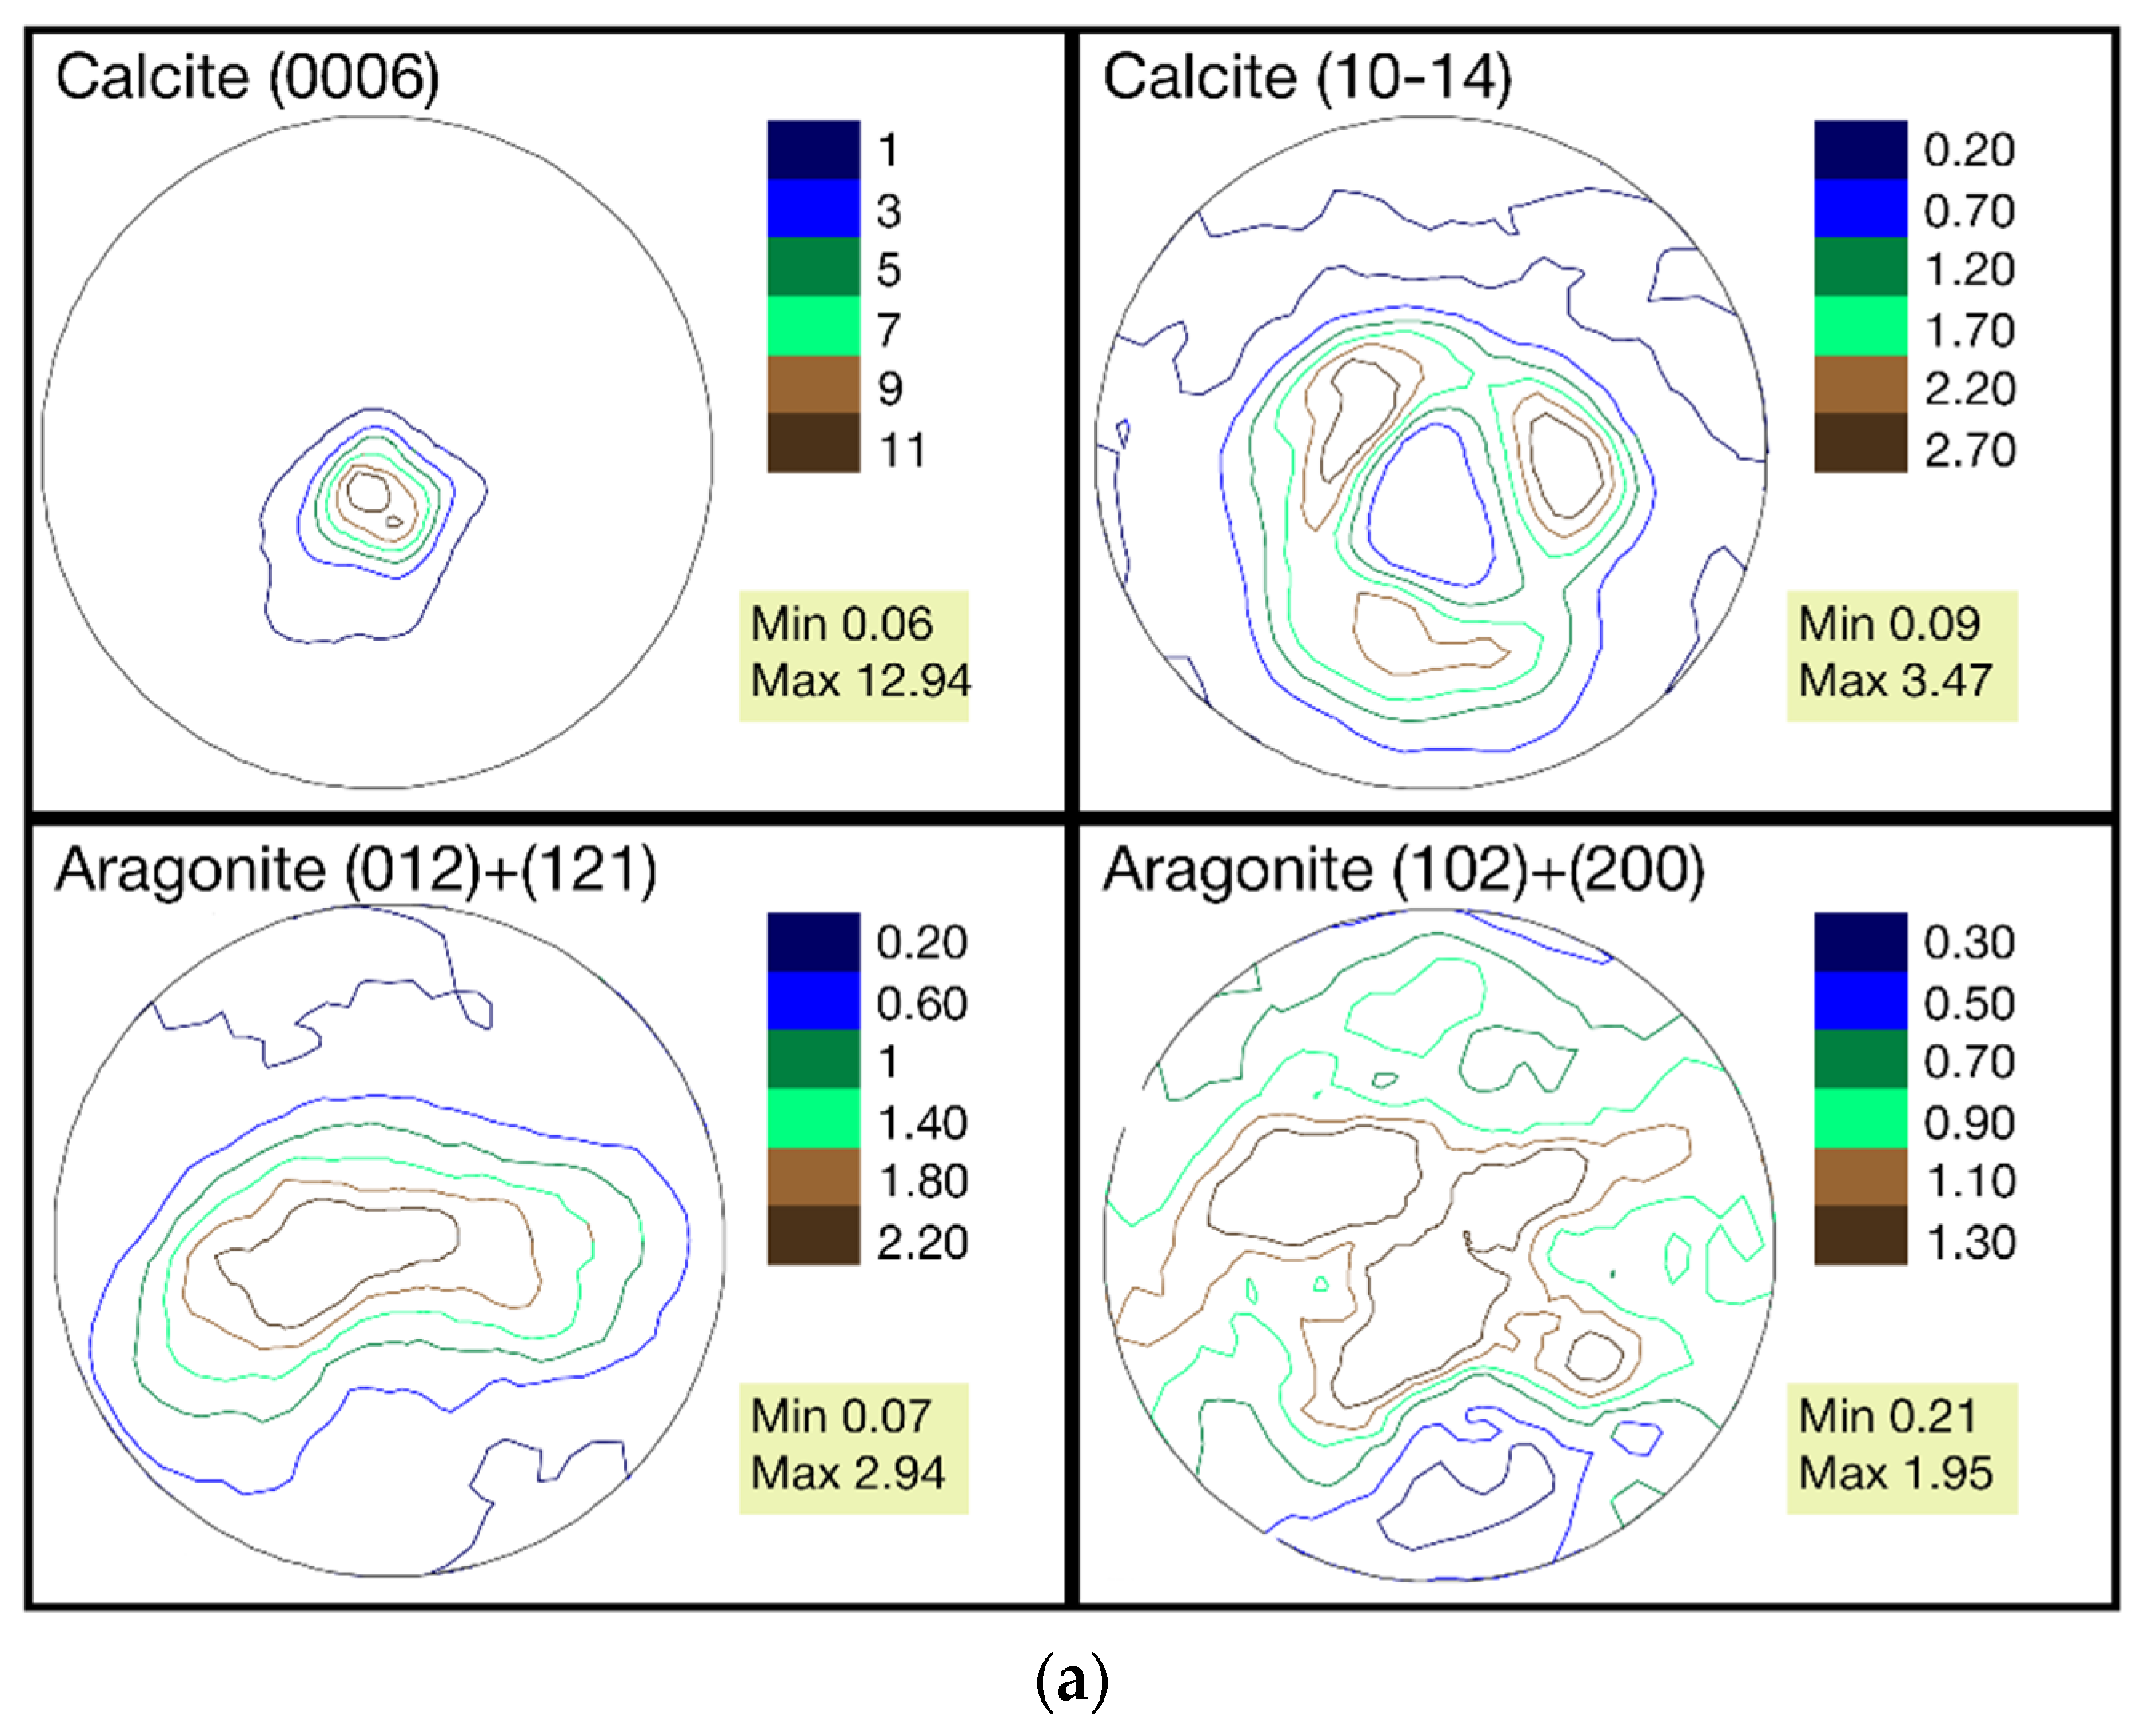
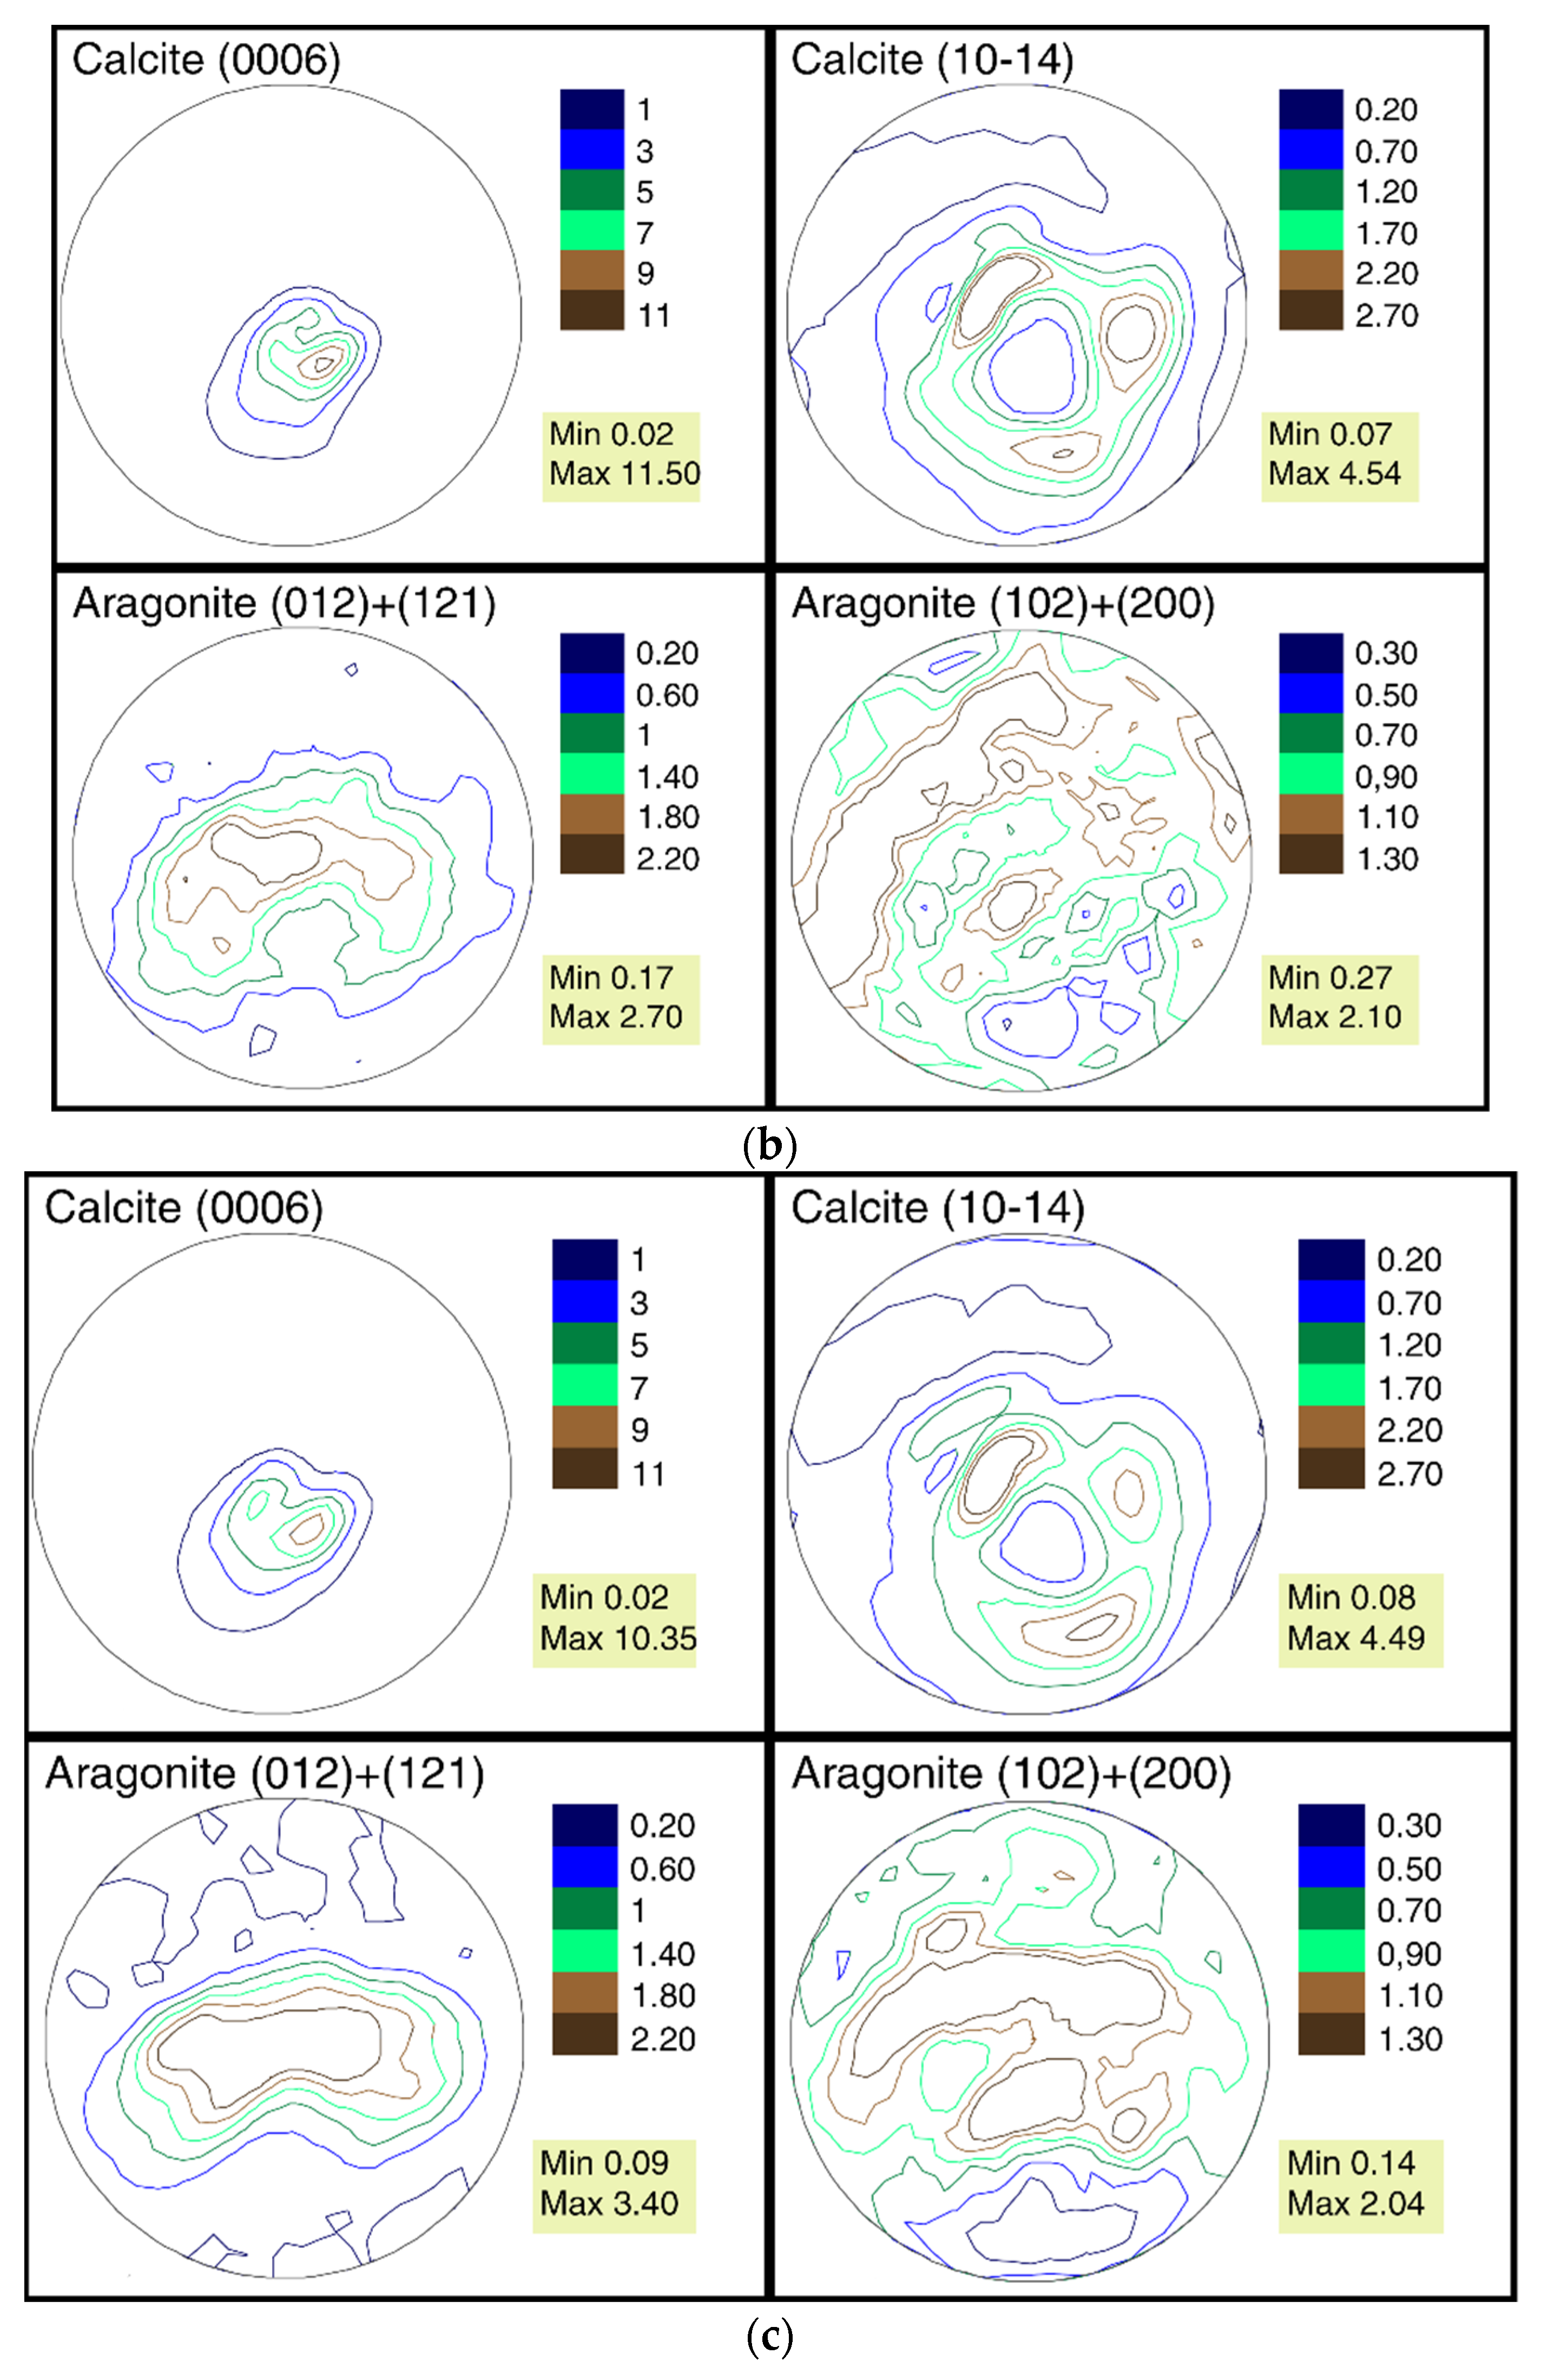
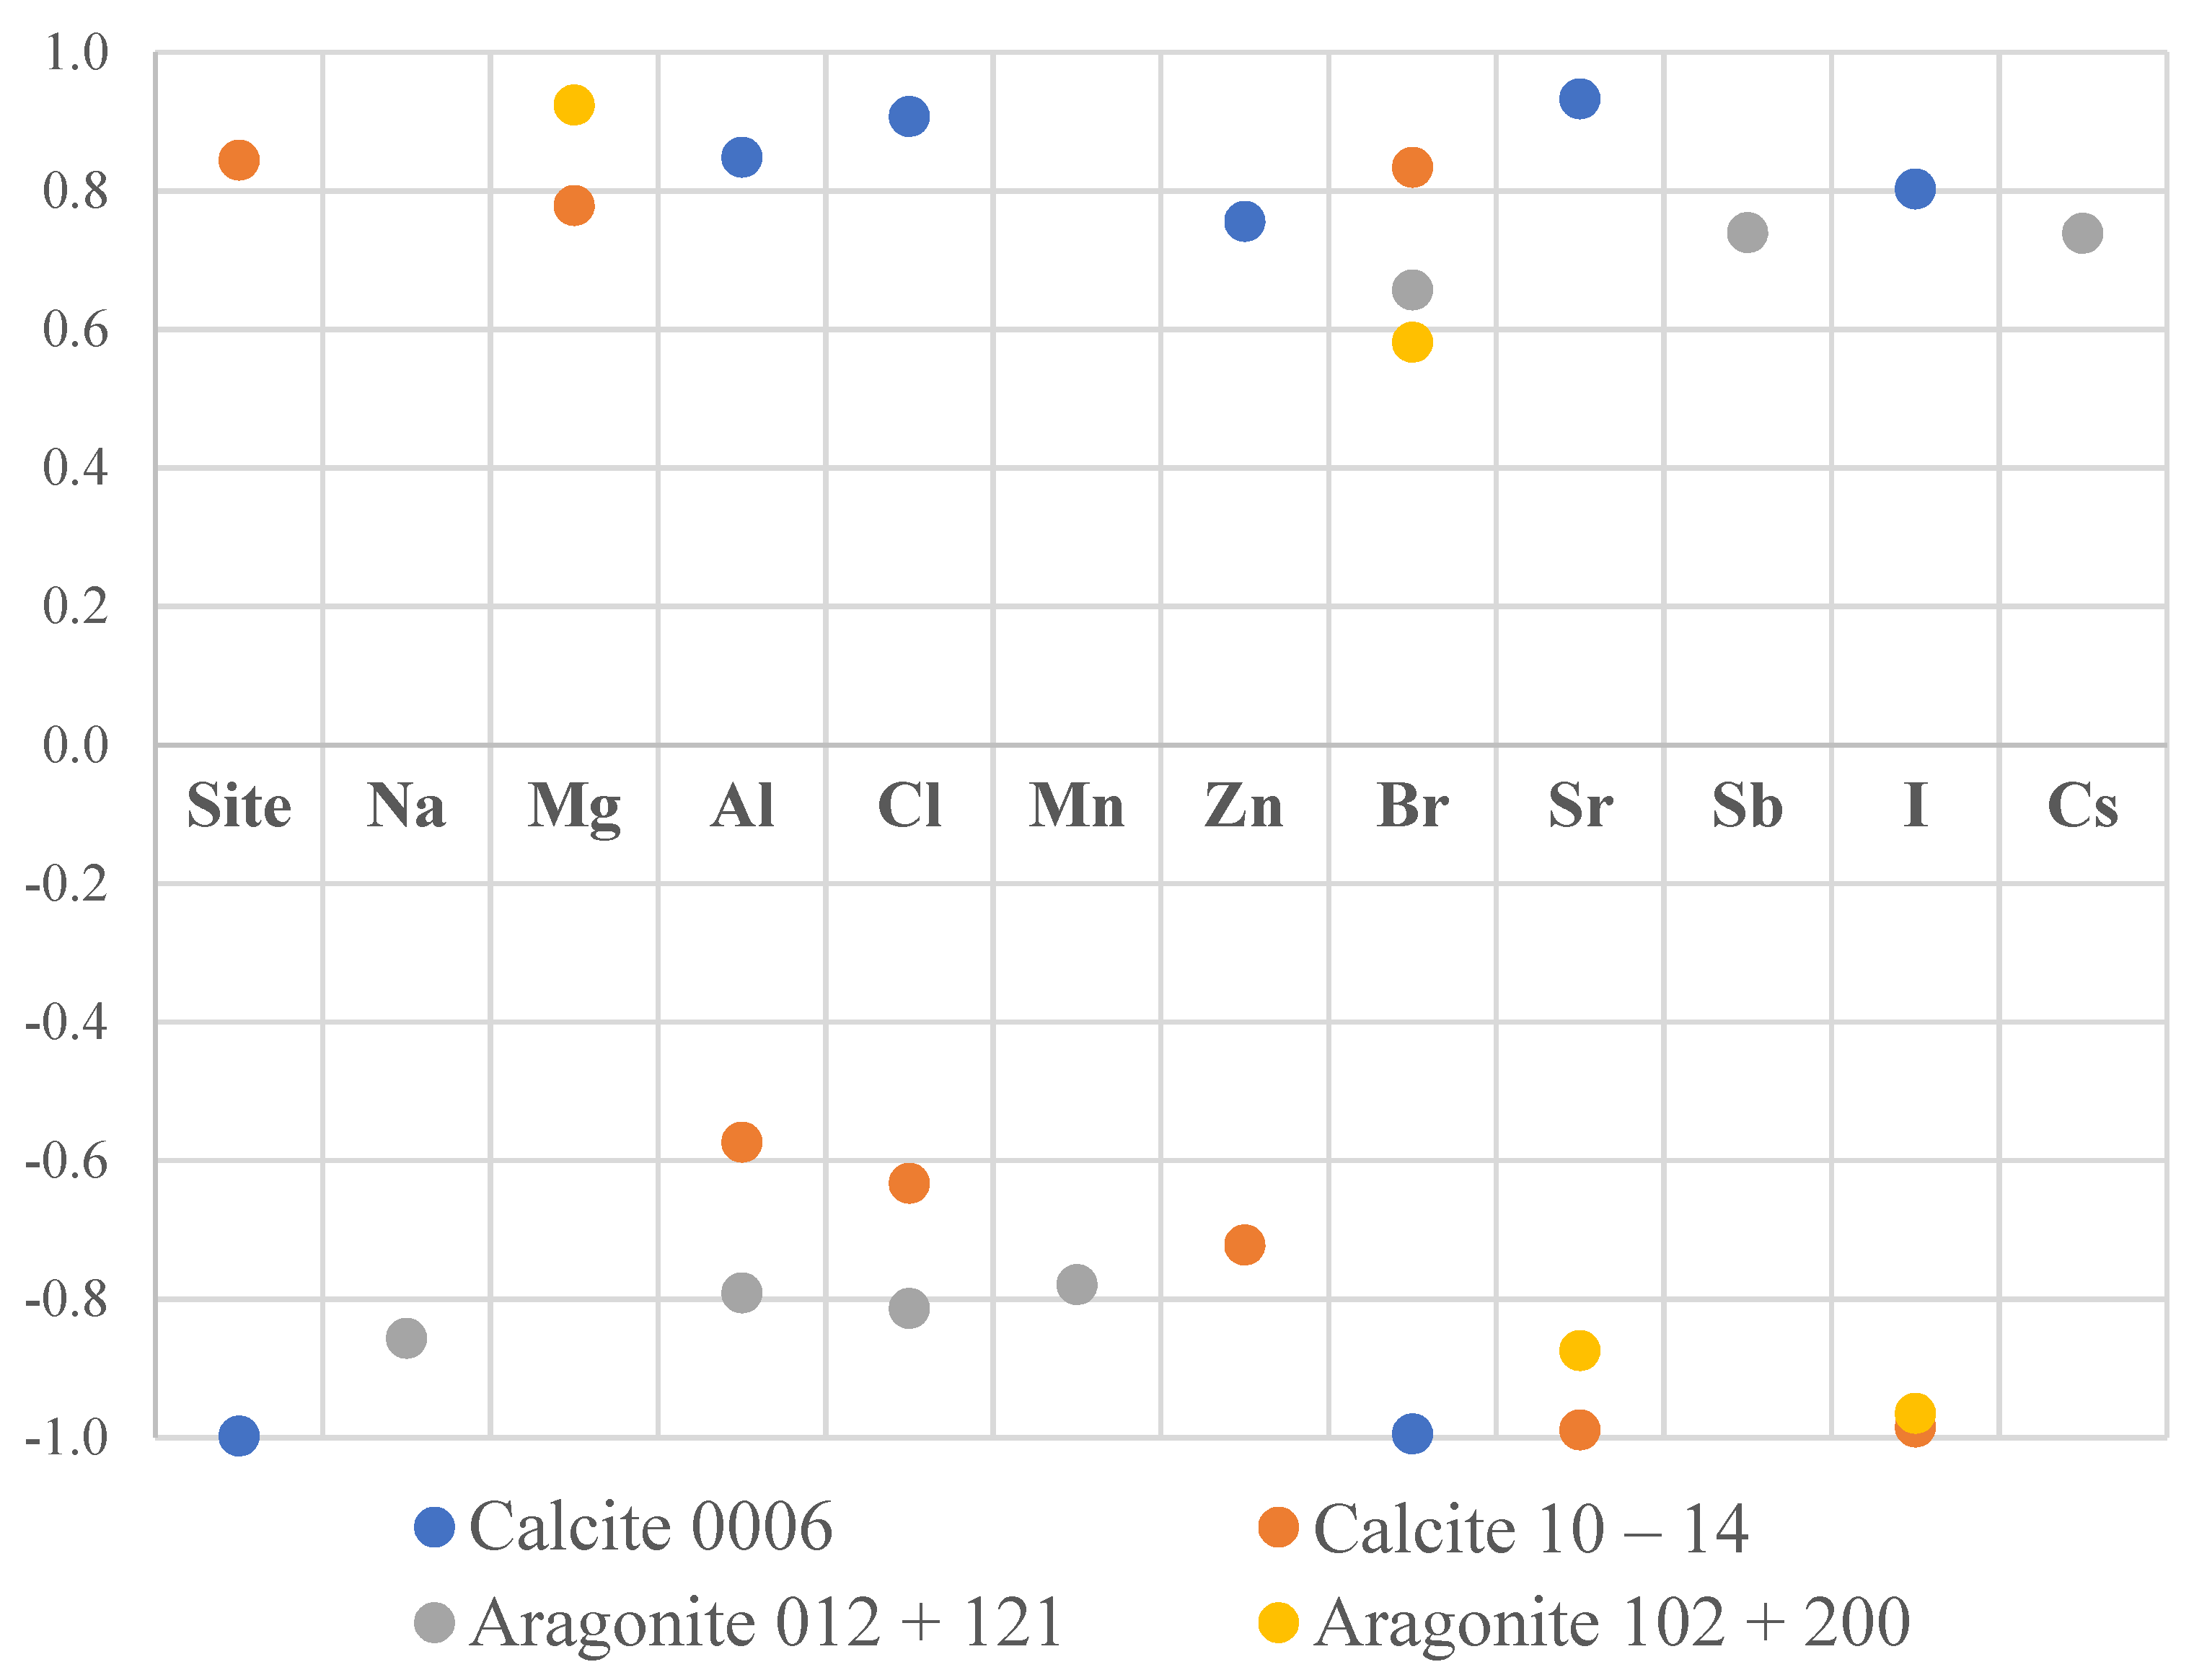
3.3. Crystallographic Texture Results

Crystallographic texture is the preferred orientation of the crystallites composing a polycrystal. The information about the crystallographic texture is presented using pole figures [39]. A pole figure of polycrystalline material is the projection of the normals to a given atomic plane constructed for all crystals of the sample. The pole figure function P h ( y ) gives the volume fraction of the sample for which the lattice plane normal h falls in various sample directions y. If the sample is isotropic (no texture), then the outlets of the plane normals uniformly cover the sphere. In a textured sample, the distribution of normals to the plane is irregular and is represented by lines of constant intensity (isolines). If such a distribution is projected onto the equatorial plane of the sphere, then this stereographic projection will be a pole figure.
The pole figures of the calcite and aragonite phases for samples collected from the three stations are presented in Figure 3a–c.
The calcite phase for all three samples has a very sharp texture, in contrast to the relatively weak texture of aragonite. Indeed, the maxima of pole density for the (0006) calcite pole figure is in the range of 10.35–12.94 MRD for these samples, whereas the ones for the (012) + (121) aragonite pole figure is in the range of 2.7–3.4 MRD. We analyzed the aragonite pole figures for two reflexes jointly because they are overlapped in the diffraction pattern. A similar crystallographic texture for calcite and aragonite phases for Mytilus galloprovincialis shells from Black and Azov seas was observed in previous investigations [24].
When comparing the pole figures of all three samples, it can be seen that the distribution of the texture components for both phases is practically the same. Nevertheless, quantitative changes in the pole density are noticeable. From a comparison of the maximums in the calcite sharpest pole figure (0006), it can be seen that the first sample with a maximum at 12.94 MRD is closer to the second one (11.5 MRD) than to the third (10.35 MRD). The fact that such a trend is not observed for the second calcite pole figure (10–14) and both aragonite pole figures can be explained by measurement errors, that, at the pole density maximum, are approximately 0.2 MRD. Furthermore, the changes between the maximums of the same pole figures of the three samples are in the range of variability identified for the genus Mytilus [24].
It should be mentioned that in quantitative texture analysis, the RP value is commonly used to characterize the similarities of the pole figures [40],
R P i = j = 1 J 100 % Θ [ ε , P h i ( y j ) ] r i j / j = 1 J Θ [ ε , P h i ( y j ) ]
where,
r i j = | P h i 1 ( y j ) P h i 2 ( y j ) | / P h i 1 ( y j ) , Θ ( ε ,   x ) = { 0 , x < ε 1 , x ε .
The results of the poll figures comparison between the samples using the RP values are presented in Table 6.
As can be seen from Table 6, the RP values between samples 1 and 3 are higher than between samples 1 and 2 for both calcite pole figures and one of the aragonite pole figures. However, this trend is not the same for the second aragonite pole figure. This implies no significant difference between the pole figures of the samples collected at the three stations.
An attempt was made to quantitatively study the texture sharpness with the concentration of various elements in the mussel shells. The correlation coefficients between the maximum values of the pole figures for different phases and the concentrations of the elements in shells are the following (Figure 4):
  • Calcite (0006) correlated with Al, Cl, Zn, Sr, I (r > 0.75, p < 0.02) and inversely correlated with Br (r < −0.8, p < 0.001).
  • Calcite (10–14) correlated with Mg, Br (r > 0.75, p < 0.03) and inversely correlated with Zn, Sr, I (r < −0.7, p < 0.3).
  • Aragonite (012) + (121) correlated with Sb, Cs (r > 0.7, p < 0.02) and inversely correlated with Na, Al, Cl, Mn (r < −07, p < 0.01).
  • Aragonite (102) + (200) correlated with Mg (r > 0.9, p < 0.001) and inversely correlated with Sr, I (r < −0.8, p < 0.002).
The small data set does not allow us to draw conclusions based on these results and further investigations are necessary for clarification of these trends.

4. Conclusions

The mussels are organisms suitable for long-term biomonitoring, they accumulate elements in typical ranges proportionate to the presence of elements in the surrounding waters. Thus, extremely short-term changes in the hydrophysical parameters such as temperature, salinity, or dissolved oxygen cannot be investigated following a period of stabilization. On other hand, coastal runoff and repeated long-time introductions of open ocean waters into coastal areas could affect the elemental and crystallographic structure of mussels. In this study, the determined ranges of concentrations of elements showed that mussels from the three studied areas were growing in non-polluted or natural stress conditions, which was ascertained by comparisons with data from polluted sites and maximum permissible levels for elements in seafood products (soft tissues).
The mussels from station 1 (Danger Bay) differ from mussels from another two sites in their concentrations of the majority of elements (in soft tissues and shells) and also in morphometry parameters. As wild organisms, mussels were adapted to the stress influences of the open ocean waters by increased width/height and decreased mass/length ratios.
Even though significant differences between concentrations of elements among the stations were found, the crystallographic textures of mussel shells from the studied bays showed insignificant dissimilarities. The observed differences in the maximum values in the pole figures fell within in the range of variability identified for the genus Mytilus. Nevertheless, they appeared to correlate with the concentrations of Br, Mg, and Sr, which merits further investigation using larger sample sizes.
For future investigations, we propose to determine the content of elements such as Na, Mg, Cl, Br, Sr, and I in mussel shells and Na, Mg, Al, S, Cl, Sc, Cr, Fe, Co, Ni, Zn, As, Se, Br, Rb, Sr, Ag, Sb, I, Cs, Th, and U in soft tissues. The results could be used to establish possible hydrochemical parameters for controlled environments in which mussels are grown.

Author Contributions

Conceptualization, all authors; methodology, P.N., D.N., I.Z., T.L.; software, P.N., N.Y., I.Z., D.N., T.L.; formal analysis, P.N., D.N., T.L.; writing—original draft preparation, P.N., N.Y., I.Z., D.N., T.L., J.B.; writing—review and editing, P.N., N.Y., I.Z., D.N., T.L., J.B.. All authors have read and agreed to the published version of the manuscript.

Funding

This research was funded by Joint Institute for Nuclear Research (JINR-SA), grant number 28.12 21.01.20.

Institutional Review Board Statement

Not applicable.

Informed Consent Statement

Not applicable.

Data Availability Statement

Not applicable.

Acknowledgments

This study was supported by the South Africa—JINR grant #28.12 21.01.20.

Conflicts of Interest

The authors declare no conflict of interest.

References

  1. Freitas, P.; Clarke, L.J.; Kennedy, H.; Richardson, C.; Abrantes, F. Mg/Ca, Sr/Ca, and stable-isotope (δ18O and δ13C) ratio profiles from the fan mussel Pinna nobilis: Seasonal records and temperature relationships. Geochem. Geophys. Geosyst. 2005, 6, 1–16. [Google Scholar] [CrossRef]
  2. Carré, M.; Bentaleb, I.; Bruguier, O.; Ordinola, E.; Barrett, N.T.; Fontugne, M. Calcification rate influence on trace element concentrations in aragonitic bivalve shells: Evidences and mechanisms. Geochim. Cosmochim. Acta 2006, 70, 4906–4920. [Google Scholar] [CrossRef]
  3. Hahn, S.; Rodolfo-Metalpa, R.; Griesshaber, E.; Schmahl, W.W.; Buhl, D.; Hall-Spencer, J.M.; Immenhauser, A. Marine bivalve shell geochemistry and ultrastructure from modern low pH environments: Environmental effect versus experimental bias. Biogeosciences 2012, 9, 1897–1914. [Google Scholar] [CrossRef] [Green Version]
  4. Fatoki, O.S.; Okoro, H.K.; Adekola, F.A.; Ximba, B.J.; Snyman, R.G. Bioaccumulation of metals in black mussels (Mytilus galloprovincialis) in Cape Town Harbour, South Africa. Environmentalist 2012, 32, 48–57. [Google Scholar] [CrossRef]
  5. Rončević, S.; Pitarević Svedružić, L.; Smetiško, J.; Medaković, D. ICP-AES analysis of metal content in shell of mussel Mytilus galloprovincialis from Croatian coastal waters. Int. J. Environ. Anal. Chem. 2010, 90, 620–632. [Google Scholar] [CrossRef]
  6. Grenier, C.; Román, R.; Duarte, C.; Navarro, J.M.; Rodriguez-Navarro, A.B.; Ramajo, L. The combined effects of salinity and pH on shell biomineralization of the edible mussel Mytilus chilensis. Environ. Pollut. 2020, 263, 114555. [Google Scholar] [CrossRef]
  7. Zinicovscaia, I.; Pavlov, S.S.; Frontasyeva, M.V.; Ivlieva, A.L.; Petritskaya, E.N.; Rogatkin, D.A.; Demin, V.A. Accumulation of silver nanoparticles in mice tissues studied by neutron activation analysis. J. Radioanal. Nucl. Chem 2018, 318, 985–989. [Google Scholar] [CrossRef]
  8. Eichelkraut, H.; Hirsch, J.; Lucke, K. Rolling and recrystallization textures in copper-germanium alloys. Int. J. Mater. Res. 1984, 75, 113–123. [Google Scholar] [CrossRef]
  9. Clark, B.M.; Massie, V.; Hutchings, K.; Biccard, A.; Brown, E.; Laird, M.; Gihwala, K.; Swart, C.; Makhosonke, A.; Sedick, S.; et al. The State of Saldanha Bay and Langebaan Lagoon 2019; Technical Report. Report No. AEC 1841/1 Prepared by Anchor Environmental Consultants (Pty) Ltd. for the Saldanha Bay Water Quality Forum Trust; Anchor Environmental Consultants: Cape Town, South Africa, 2019. [Google Scholar]
  10. Clark, B.M.; Massie, V.; Hutchings, K.; Laird, M.; Biccard, A.; Brown, E.; Duna, O.O.; Turpie, J. The State of Saldanha Bay and Langebaan Lagoon 2016; Technical Report. Report No. AEC 1691/1 prepared by Anchor Environmental Consultants (Pty) Ltd. for the Saldanha Bay Water Quality Forum Trust; Anchor Environmental Consultants: Cape Town, South Africa, 2016. [Google Scholar]
  11. Degger, N.; Wepener, V.; Richardson, B.J.; Wu, R.S.S. Application of artificial mussels (AMs) under South African marine conditions: A validation study. Mar. Pollut. Bull. 2011, 63, 108–118. [Google Scholar] [CrossRef] [PubMed]
  12. Firth, D.C.; Salie, K.; O’Neill, B.; Hoffman, L.C. Monitoring of trace metal accumulation in two South African farmed mussel species, Mytilus galloprovincialis and Choromytilus meridionalis. Mar. Pollut. Bull. 2019, 141, 529–534. [Google Scholar] [CrossRef] [PubMed]
  13. Bezuidenhout, J.; Dames, N.; Botha, A.; Frontasyeva, M.V.; Goryainova, Z.I.; Pavlov, D. Trace elements in Mediterranean mussels Mytilus galloprovincialis from the South African west coast. Ecol. Chem. Eng. 2015, 22, 489–498. [Google Scholar] [CrossRef] [Green Version]
  14. Bezuidenhout, J.; Nekhoroshkov, P.; Zinicovscaia, I.; Yushin, N.; Frontasyeva, M. Accumulation Features of Micro and Macroelements in Indigenous and Alien Molluscs in Saldanha Bay, South Africa. Ecol. Chem. Eng. 2020, 27, 495–508. [Google Scholar] [CrossRef]
  15. Pavlov, D.F.; Bezuidenhout, J.; Frontasyeva, M.V.; Goryainova, Z.I. Differences in trace element content between non-indigenous farmed and invasive bivalve mollusks of the South African Coast. Am. J. Anal. Chem. 2015, 6, 886. [Google Scholar] [CrossRef] [Green Version]
  16. Nekhoroshkov, P.S.; Bezuidenhout, J.; Frontasyeva, M.V.; Zinicovscaia, I.I.; Yushin, N.S.; Vergel, K.N.; Petrik, L. Trace elements risk assessment for consumption of wild mussels along South Africa coastline. J. Food Compos. Anal. 2021, 98, 103825. [Google Scholar] [CrossRef]
  17. Sparks, C.; Odendaal, J.; Snyman, R. An analysis of historical Mussel Watch Programme data from the west coast of the Cape Peninsula, Cape Town. Mar. Pollut. Bull. 2014, 87, 374–380. [Google Scholar] [CrossRef]
  18. Lauzon-Guay, J.S.; Hamilton, D.J.; Barbeau, M.A. Effect of Mussel Density and Size on the Morphology of Blue Mussels (Mytilus Edulis) Grown in Suspended Culture in Prince Edward Island, Canada. Aquaculture 2005, 249, 265–274. [Google Scholar] [CrossRef]
  19. Lobel, P.B.; Bajdik, C.D.; Belkhode, S.P.; Jackson, S.E.; Longerich, H.P. Improved protocol for collecting mussel watch specimens taking into account sex, size, condition, shell shape, and chronological age. Arch. Environ. Contam. Toxicol. 1991, 21, 409–414. [Google Scholar] [CrossRef]
  20. Wright, A.G.; Massie, V.; Clark, B.M.; Brown, E. Terrestrial and Marine Biodiversity Impact Assessment for the Proposed Upgrade of the Stormwater Management System, Port of Saldanha, South Africa; Report Prepared by Anchor Environmental Consultants (Pty) Ltd. for Nsovo Environmental; Consulting Report No. 1769/5; Anchor Environmental Consultants: Cape Town, South Africa, 2018; 60p. [Google Scholar]
  21. Monteiro, P.M.S.; Pascall, A.; Brown, S. The Biogeochemical Status of Near-Surface Sediments in Saldanha Bay in 1999. CSIR Rep. 1999. [Google Scholar]
  22. Pavlov, S.S.; Dmitriev, A.Y.; Frontasyeva, M.V. Automation system for neutron activation analysis at the reactor IBR-2, Frank Laboratory of neutron physics, Joint Institute for Nuclear Research, Dubna, Russia. J. Radioanal. Nucl. Chem. 2016, 309, 27–38. [Google Scholar] [CrossRef] [Green Version]
  23. Greenberg, R.R.; Bode, P.; Fernandes, E.A.D.N. Neutron activation analysis: A primary method of measurement. Spectrochim. Acta Part B At. Spectrosc. 2011, 66, 193–241. [Google Scholar] [CrossRef]
  24. Nikolaev, D.; Lychagina, T.; Pakhnevich, A. Experimental neutron pole figures of minerals composing the bivalve mollusc shells. Springer Nat. Appl. Sci. 2019, 1, 344. [Google Scholar] [CrossRef] [Green Version]
  25. Keppler, R.; Ullemeyer, K.; Behrmann, J.H.; Stipp, M. Potential of full pattern fit methods for the texture analysis of geological materials: Implications from texture measurements at the recently upgraded neutron time-of-flight diffractometer SKAT. J. Appl. Crystallogr. 2014, 47, 1520–1534. [Google Scholar] [CrossRef]
  26. Nikolayev, D.I.; Lychagina, T.A.; Nikishin, A.V.; Yudin, V.V. Investigation of measured pole figures errors. Mater. Sci. Forum. 2005, 495–497, 307–312. [Google Scholar] [CrossRef]
  27. Nikolayev, D.I.; Lychagina, T.A.; Nikishin, A.V.; Yudin, V.V. Study of error distribution in measured pole figures. Solid State Phenom. 2005, 105, 77–82. [Google Scholar] [CrossRef]
  28. Nikolayev, D.I.; Ullemeyer, K. A Note on Preprocessing of Diffraction Pole Density Data. J. Appl. Cryst. 1994, 27, 517–520. [Google Scholar] [CrossRef]
  29. Zar, J.H. Critical values for Fisher’s exact test. In Biostatistical Analysis; Prentice-Hall: Englewood Cliffs, NJ, USA, 1984; pp. 220–242. [Google Scholar]
  30. Uğur, A.; Yener, G.; Başsarı, A. Trace metals and 210Po (210Pb) concentrations in mussels (Mytilus galloprovincialis) consumed at western Anatolia. Appl. Radiat. Isot. 2002, 57, 565–571. [Google Scholar] [CrossRef]
  31. De los Ríos, A.; Pérez, L.; Ortiz-Zarragoitia, M.; Serrano, T.; Barbero, M.C.; Echavarri-Erasun, B.; Juanes, J.A.; Orbea, A.; Cajaraville, M.P. Assessing the effects of treated and untreated urban discharges to estuarine and coastal waters applying selected biomarkers on caged mussels. Mar. Pollut. Bull. 2013, 77, 251–265. [Google Scholar] [CrossRef]
  32. Signa, G.; Di Leonardo, R.; Vaccaro, A.; Tramati, C.D.; Mazzola, A.; Vizzini, S. Lipid and fatty acid biomarkers as proxies for environmental contamination in caged mussels Mytilus galloprovincialis. Ecol. Indic. 2015, 57, 384–394. [Google Scholar] [CrossRef]
  33. Richir, J.; Gobert, S. The effect of size, weight, body compartment, sex and reproductive status on the bioaccumulation of 19 trace elements in rope-grown Mytilus galloprovincialis. Ecol. Indic. 2014, 36, 33–47. [Google Scholar] [CrossRef]
  34. Yap, C.K.; Sharifinia, M.; Cheng, W.H.; Al-Shami, S.A.; Wong, K.W.; Al-Mutairi, K.A. A Commentary on the Use of Bivalve Mollusks in Monitoring Metal Pollution Levels. Int. J. Environ. Res. Public Health 2021, 18, 3386. [Google Scholar] [CrossRef] [PubMed]
  35. Nauen, C.E. Compilation of Legal Limits for Hazardous Substances in Fish and Fishery Products; No. 764; FAO Fisheries Circular (FAO): Rome, Italy, 1983. [Google Scholar]
  36. Department of Health (DOH). Regulations Relating to Maximum Levels for Metals in No. R.500; Department of Health: Hong Kong, 2004.
  37. Lazareth, C.E.; Vander Putten, E.; André, L.; Dehairs, F. High-resolution trace element profiles in shells of the mangrove bivalve Isognomon ephippium: A record of environmental spatio-temporal variations? Estuar. Coast. Shelf Sci. 2003, 57, 1103–1114. [Google Scholar] [CrossRef]
  38. Vander Putten, E.; Dehairs, F.; Keppens, E.; Baeyens, W. High resolution distribution of trace elements in the calcite shell layer of modern Mytilus edulis: Environmental and biological controls. Geochim. Cosmochim. Acta 2000, 64, 997–1011. [Google Scholar] [CrossRef]
  39. Bunge, H.J. Texture Analysis in Material Science, Mathematical Methods; Elsevier: London, UK, 1982; 595p. [Google Scholar]
  40. Matthies, S.; Vinel, G.W.; Helming, K. Standard Distributions in Texture Analysis: Maps for the Case of Cubic-Orthorhombic Symmetry; De Gruyter Akademie Forschung: Berlin, Germany, 1987; Volume 1. [Google Scholar]
Figure 1. Collection sites in Saldanha Municipality area: St. 1—Danger Bay, St. 2—Langebaan Yacht club, St. 3—Small bay.
Biology 10 01093 g001
Figure 2. The sum diffraction pattern for mussel shells from station 2 (Langebaan).
Biology 10 01093 g002
Figure 3. (a) The pole figures of calcite and aragonite phases for mussel shells from station 1 (Danger Bay). (b) The pole figures of calcite and aragonite phases for mussel shells from station 2 (Langebaan). (c) The pole figures of calcite and aragonite phases for mussel shells from station 3 (Small Bay).
Biology 10 01093 g003aBiology 10 01093 g003b
Figure 4. Significant correlations (p < 0.05) between the maximums of the pole figures for different phases and levels of elements.
Biology 10 01093 g004
Table 1. Quality control for neutron activation analysis.
ElementsStandard Reference Materials (SRMs)Concentrations, ppmUncertainties, %Deviation, %
DeterminedCertifiedDeterminedCertified
Na2711a11,90012,0008.80.010.5
Mg063R132012637.624.6
Al1633c129,900132,8006.94.62.2
Cl1632d115011427.810.3
KFFA123,42022,00011.3306.4
Ca2710a9450964018.94.71.9
Sc66713.613.75.35.10.4
V1632d23.823.75.70.40.1
Cr2711a53.252.311.561.7
Mn15490.270.261523.14.2
Fe2711a27,90028,2005.50.041.2
Co2711a109.95.621.1
Ni66712612810.371.4
Zn6671771754.57.40.9
As2711a102107654.8
SeFFA14.44.639.1303.3
Br66782.899.74.42.516.9
Rb2711a12612016.634.7
SrFFA125225011.35.20.8
SbFFA118.417.67.614.24.6
I15493.13.415.30.67.4
Cs6677.97.84.390.8
Th66710.2104.752.1
U6672.312.263.36.62.1
Table 2. The ranges of concentrations of elements in shells and soft tissues of Mytilus galloprovincialis in the Saldanha zone.
ElementsShellsSoft Tissues
St. 1St. 2St. 3St. 1St. 2St. 3
Min-MaxCVMin-MaxCVMin-MaxCVMin-MaxCVMin-MaxCVMin-MaxCV
Na0.4–0.4670.46–0.5040.38–0.4035.1–5.433.8–3.911.96–2.011
Mg770–84051040–11505860–96067000–760045500–650082860–32707
Al39–521533–461715–2326159–20313444–480463–716
Cl790–8503.7720–8207.3530–5602.881,000–86,000361,000–62,000129,700–33,1006
K<DL<DL<DL7400–850076700–10,400228700–10,40010
Ca, %3.-372.833–387.137–392.61.02–1.1671.15–1.2230.69–0.797
Sc0.04–0.07390.03–0.04110.04–0.07280.037–0.061250.12–0.1370.018–0.03332
V0.2–0.3180.2–0.3200.3–0.371.25–1.4160.62–1.46490.66–0.916
Cr1.2–1.9230.9–1.6281.5–1.773.2–3.892.4–2.651.1–2.645
Mn1.57–2.2171.74–2.16111.37–1.553.76–5.7255–6.6163.42–5.426
Fe112–2073178–1192184–14627421–4706390–420499–13617
Co0.09–0.14280.06–0.12330.04–0.11480.46–0.5270.225–0.2690.128–0.1363
Ni0.4–0.6240.1–0.6780.2–0.6503.1–4.7240.83–1.51300.75–0.824
Zn4–4.343–3.9132.62–3.7718230–2320.4105–1081.6121–1241.2
As<DL<DL<DL8.3–8.625.3–5.855.7–6.24
Se<DL<DL<DL4.9–5.237–7.215–5.33
Br64–68488–891111–1131463–4670.4289–2910.3163–1650.6
Rb 3.5–3.854.9–5.233.9–4.24
Sr1500–155021090–110011030–10501133–136198–99152–531
Sb0.02–0.04320.01–0.03390.03–0.06340.042–0.057150.021–0.033240.0145–0.020619
I12–1335–526–71256–57112.3–13.754.8–5.79
Cs0.05–0.08290.04–0.05130.05–0.12390.031–0.03790.081–0.09160.024–0.03824
Th0.05–0.09260.05–0.06120.05–0.1330.05–0.050.10.106–0.1091.60.024–0.09428
U0.11–0.17250.04–0.06290.04–0.17580.68–0.97190.19–0.36310.27–0.317
CV, %—coefficient of variation in percentages; <DL—below detection limit.
Table 3. Elements’ concentrations in shells of mussels (ppm, dry weight).
ElementsSaldanha Zone[4][5]
Danger BayLangebaanSmall BayCape TownAdriatic
Mean ± SDMean ± SDMean ± SDMean ± SERange
Na4300 ± 3004767 ± 2103933 ± 120-2500–4000
Mg797 ± 381100 ± 56913 ± 50-800–1400
Al45 ± 6.639 ± 6.618 ± 0.13730 ± 9602.5–27
Cl823 ± 30757 ± 60543 ± 20--
Ca, %36 ± 135.3 ± 2.538 ± 112.6 ± 1.235–37
Sc0.05 ± 0.0020.03 ± 0.0040.06 ± 0.002--
V0.3 ± 0.040.2 ± 0.050.3 ± 0.023.9 ± 0.2-
Cr1.6 ± 0.41.3 ± 0.41.6 ± 0.18.4 ± 0.1-
Mn1.9 ± 0.32 ± 0.21.4 ± 0.127.7 ± 1.32–155
Fe155 ± 2598 ± 21116 ± 311360 ± 14015–550
Co0.1 ± 0.030.09 ± 0.030.09 ± 0.040.72 ± 0.01-
Ni0.5 ± 0.120.3 ± 0.230.4 ± 0.213.56 ± 0.047–33
Zn4 ± 0.23 ± 0.53 ± 0.6142 ± 132.5–15
Br67 ± 289 ± 1112 ± 1--
Sr1523 ± 251093 ± 61043 ± 12365 ± 7500–800
Sb0.03 ± 0.0090.02 ± 0.0080.04 ± 0.015--
I13 ± 0.45 ± 0.16 ± 0.8--
Cs0.06 ± 0.020.04 ± 0.010.1 ± 0.04--
Th0.07 ± 0.020.06 ± 0.010.08 ± 0.03--
U0.13 ± 0.030.05 ± 0.010.12 ± 0.07--
SD—standard deviation; SE—standard error.
Table 4. Concentrations of elements in the soft tissue of Mytilus galloprovincialis (dry weight, ppm).
ElementsOut Study,
Saldanha Zone
[30]
Min-Max
[31]
Min-Max
[32]
Min-Max
[16]
Mean ± SD
[33]
Min-Max
[4]
Mean ± SE
Min-Max
Na19,600–54,000 29,550 ± 5350
Mg2860–7600 6960 ± 1040
Al63–480 134 ± 5339–877
Cl29,700–86,000 6660 ± 1920 4330 ± 180
K6700–10,400 3.69 ± 0.05
Ca, %0.69–1.22 1.02 ± 0.70
Sc0.02–0.13 0.035 ± 0.0142.3–12.53.3 ± 0.3
V0.6–1.5 11–590.63 ± 0.240.19–2.175.9 ± 0.2
Cr1.1–3.8 0.9–4.712–251.7 ± 0.43.4–20.623.2 ± 1.5
Mn3.4–6.6 125–1443.92 ± 0.9966–6561150 ± 150
Fe99–47098–68552–215 171 ± 510.37–1.370.70 ± 0.02
Co0.1–0.5 3–1580.21 ± 0.030.71–3.391.78 ± 0.02
Ni0.8–4.7 0.2–1.520–391.1 ± 0.2435–224204 ± 15
Zn105–232117–42385–28423–265309 ± 10517–469.2 ± 0.1
As5.3–8.6 1.3–15.67.7 ± 1.61.5–4.3
Se4.9–7.2 2.7 ± 0.3
Br163–46791–460 350 ± 58
Rb3.5–5.2 3.1 ± 0.52 209 ± 5
Sr52–13618–67 77 ± 500.007–0.028
Sb0.01–0.06 0.02 ± 0.005
I4.8–57 46.7 ± 8.2
Cs0.02–0.09 0.024 ± 0.009
Th0.02–0.11 0.034 ± 0.012
U0.2–1.0 0.4 ± 0.07
CV (%)—coefficients of variations (min-max among studied sites); SD—standard deviation; SE—standard error.
Table 5. Morphometry ratios in mussel samples from 3 stations of Saldanha Bay.
ParametersSt. 1
Danger Bay
St. 2
Langebaan
St. 3
Small Bay
Mass/Length0.030.050.09
Width/Height0.960.690.84
CI17.716.622.1
CI—condition index (mg/cm3) calculated as [Mass (g) × 106]/[Length (mm) × Width (mm) × Height (mm)] [19]. The standard deviation for calculated ratios (n = 5) were less than 10% for each station.
Table 6. RP (%) values for calcite and aragonite pole figures for the samples of M. galloprovincialis shells.
Pole Figures (PF)Calcite (0006)Calcite (10–14)Aragonite (012) + (121)Aragonite (102) + (200)
Station23232323
132.738.39.114.77.214.45.02.9
Publisher’s Note: MDPI stays neutral with regard to jurisdictional claims in published maps and institutional affiliations.

