Seismic Performance Enhancement of RC Columns Using Thin High-Strength RC Jackets and CFRP Jackets
Abstract
1. Introduction
2. Materials and Methods—Experimental Program and Strengthening Interventions
3. Results
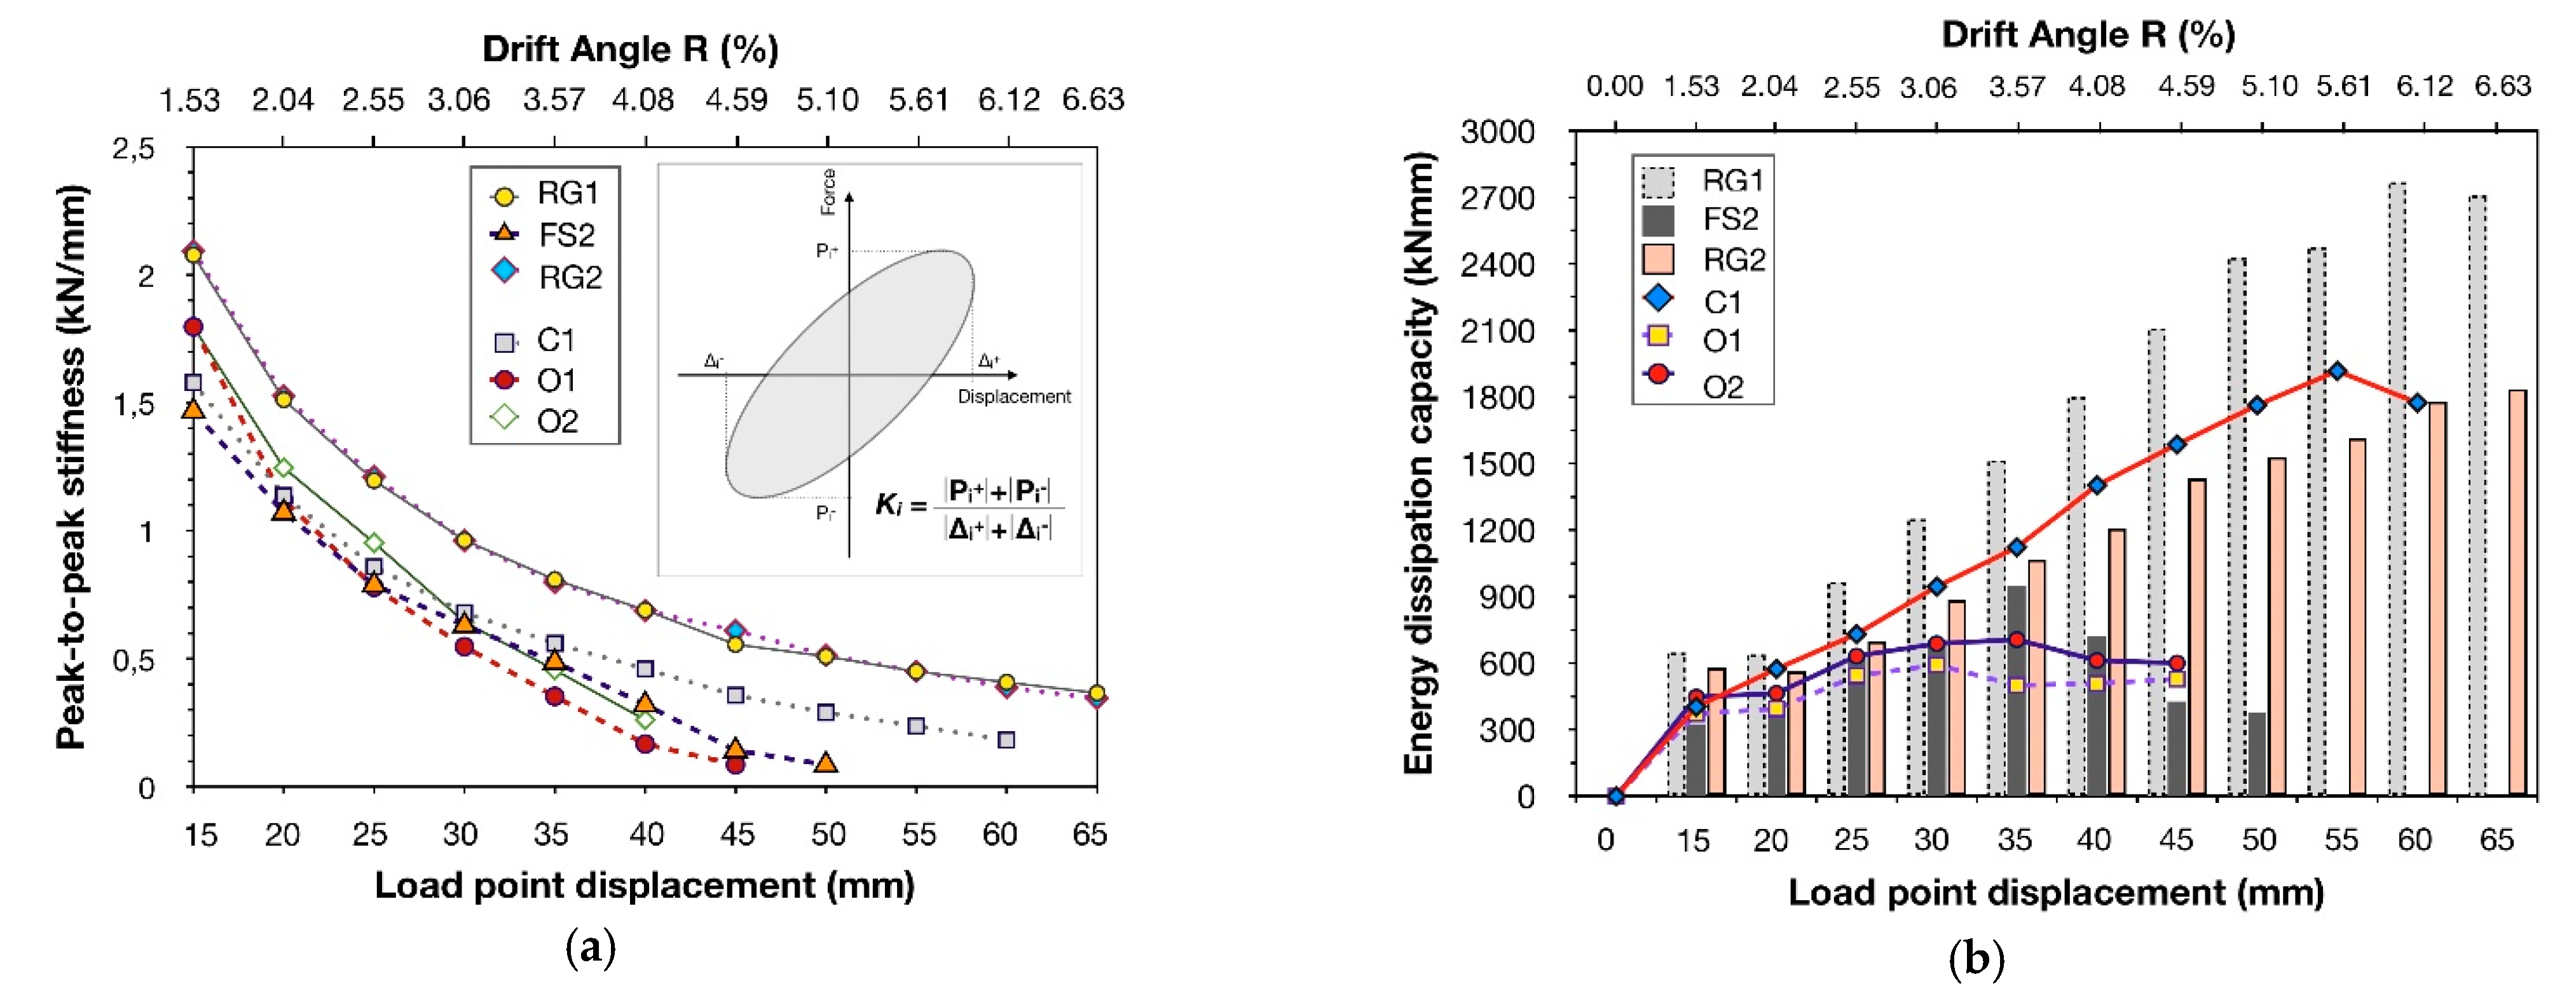
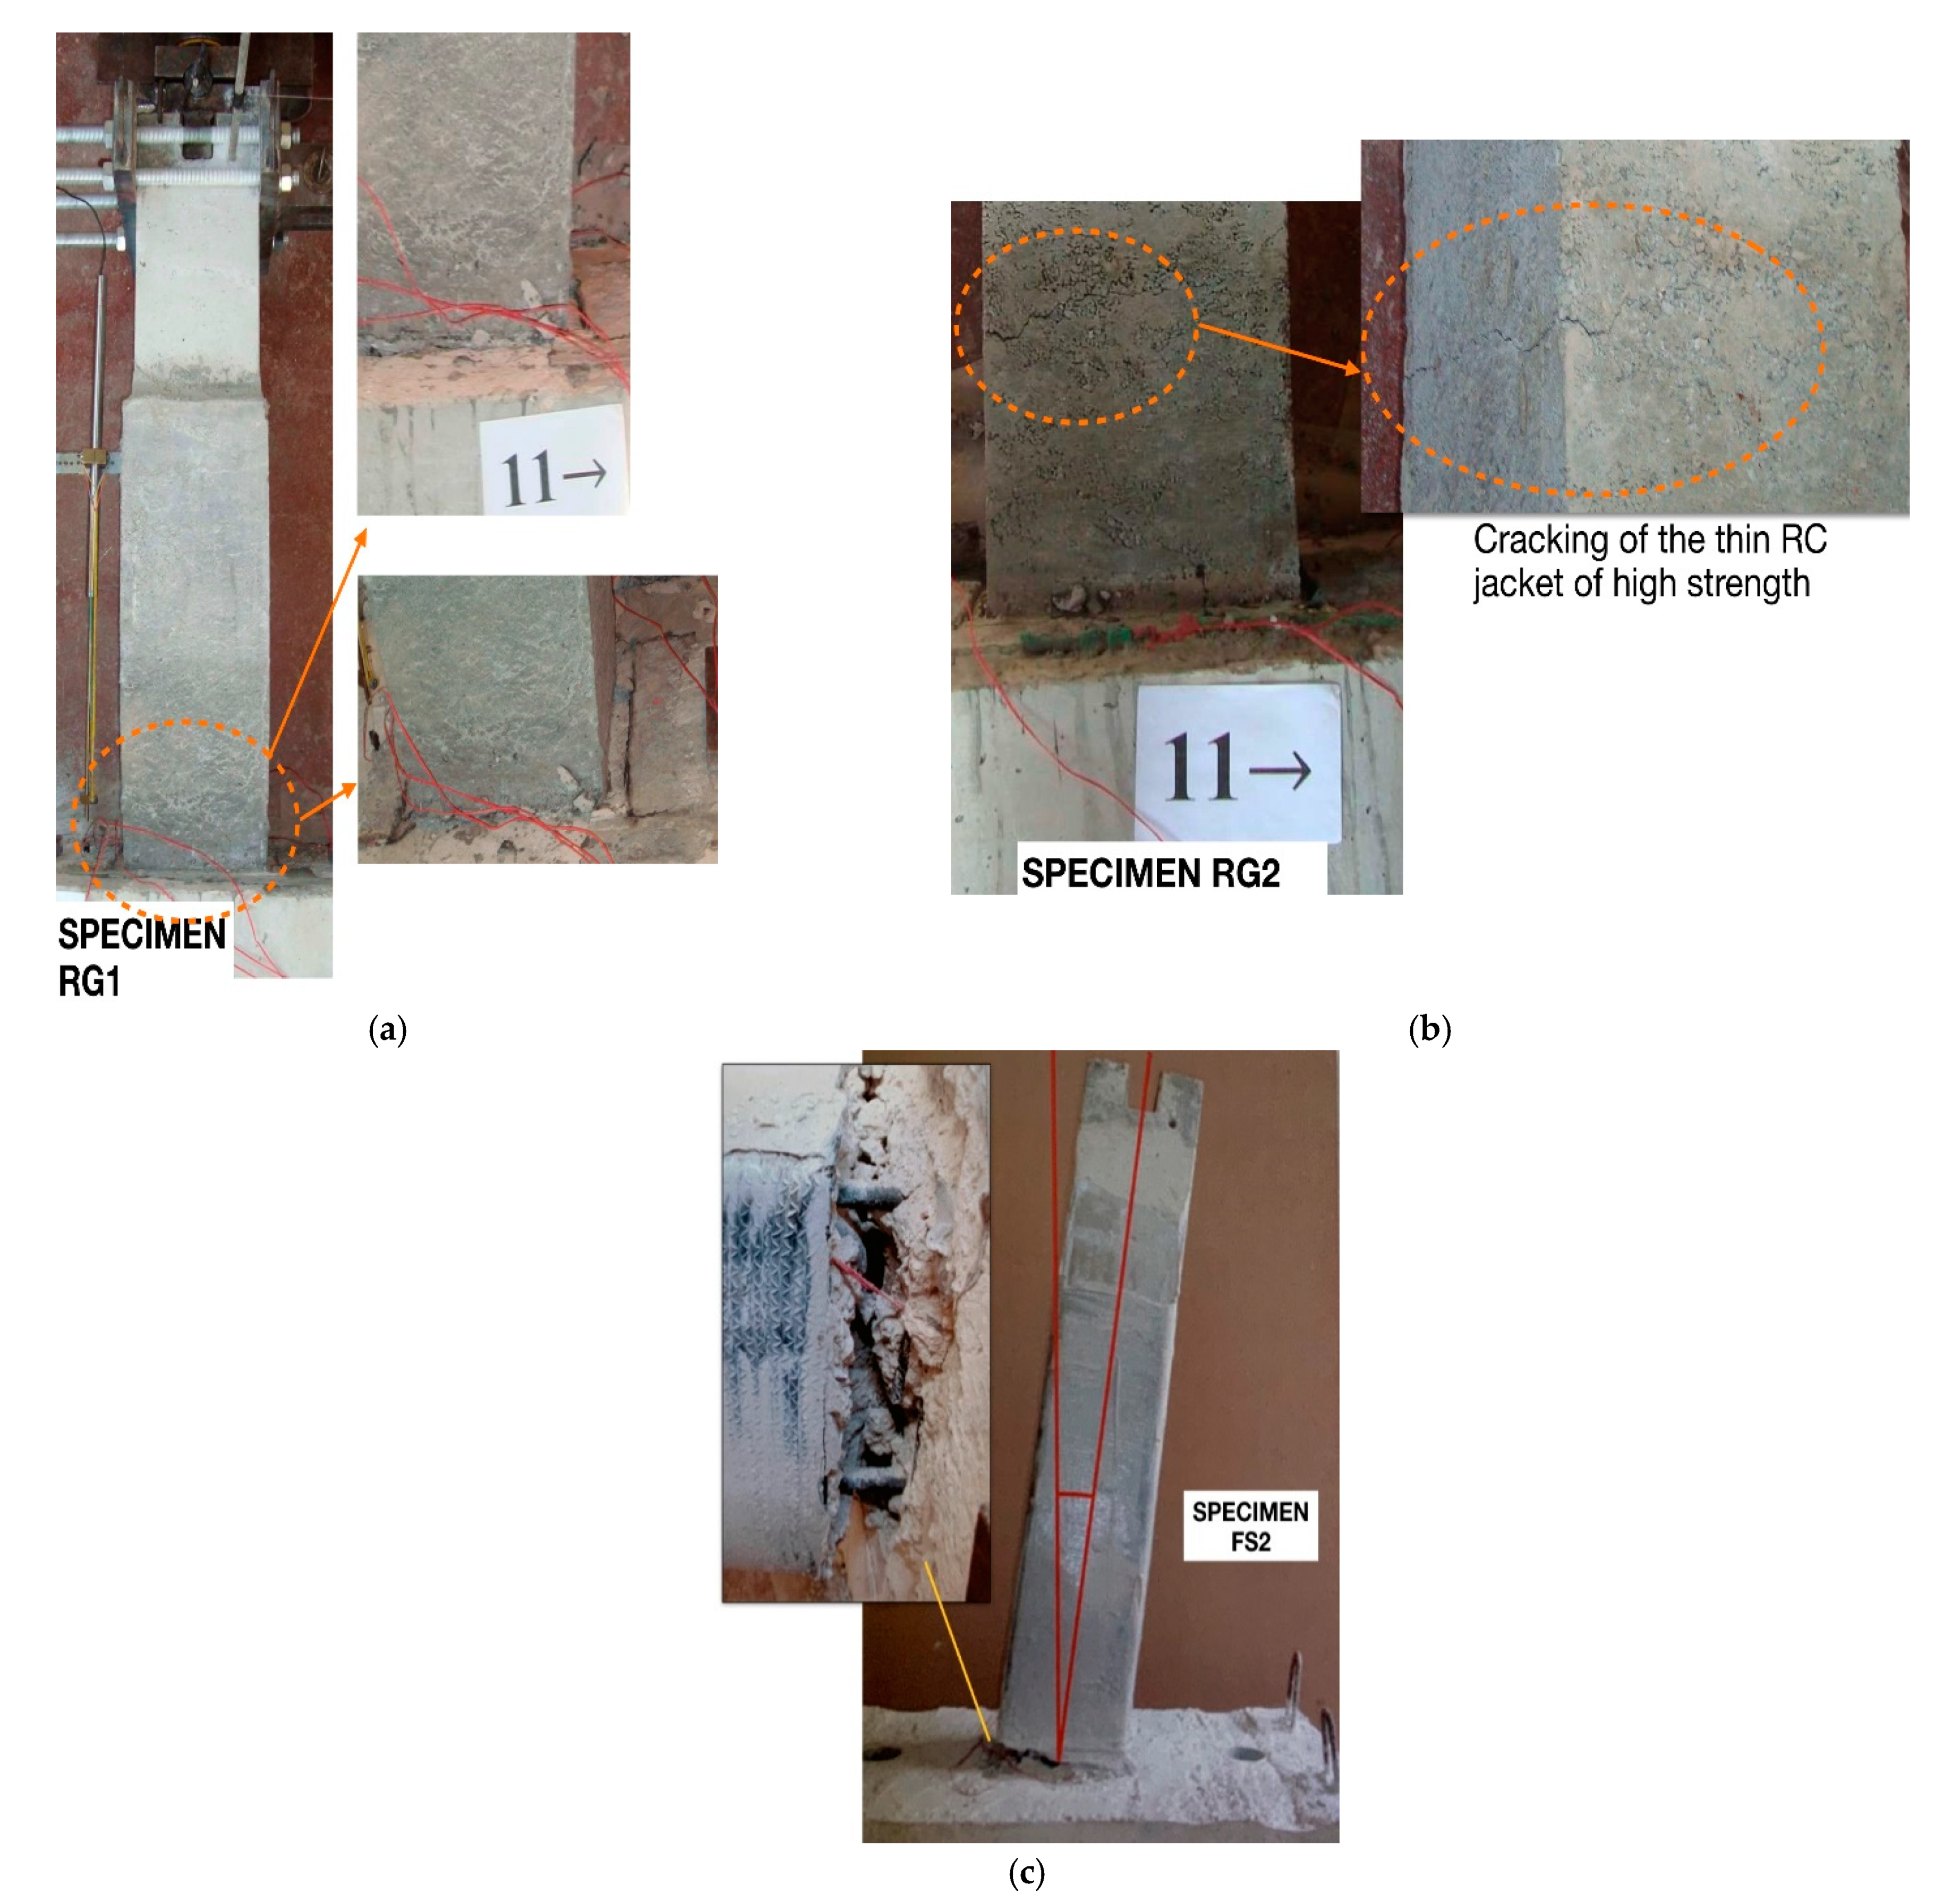
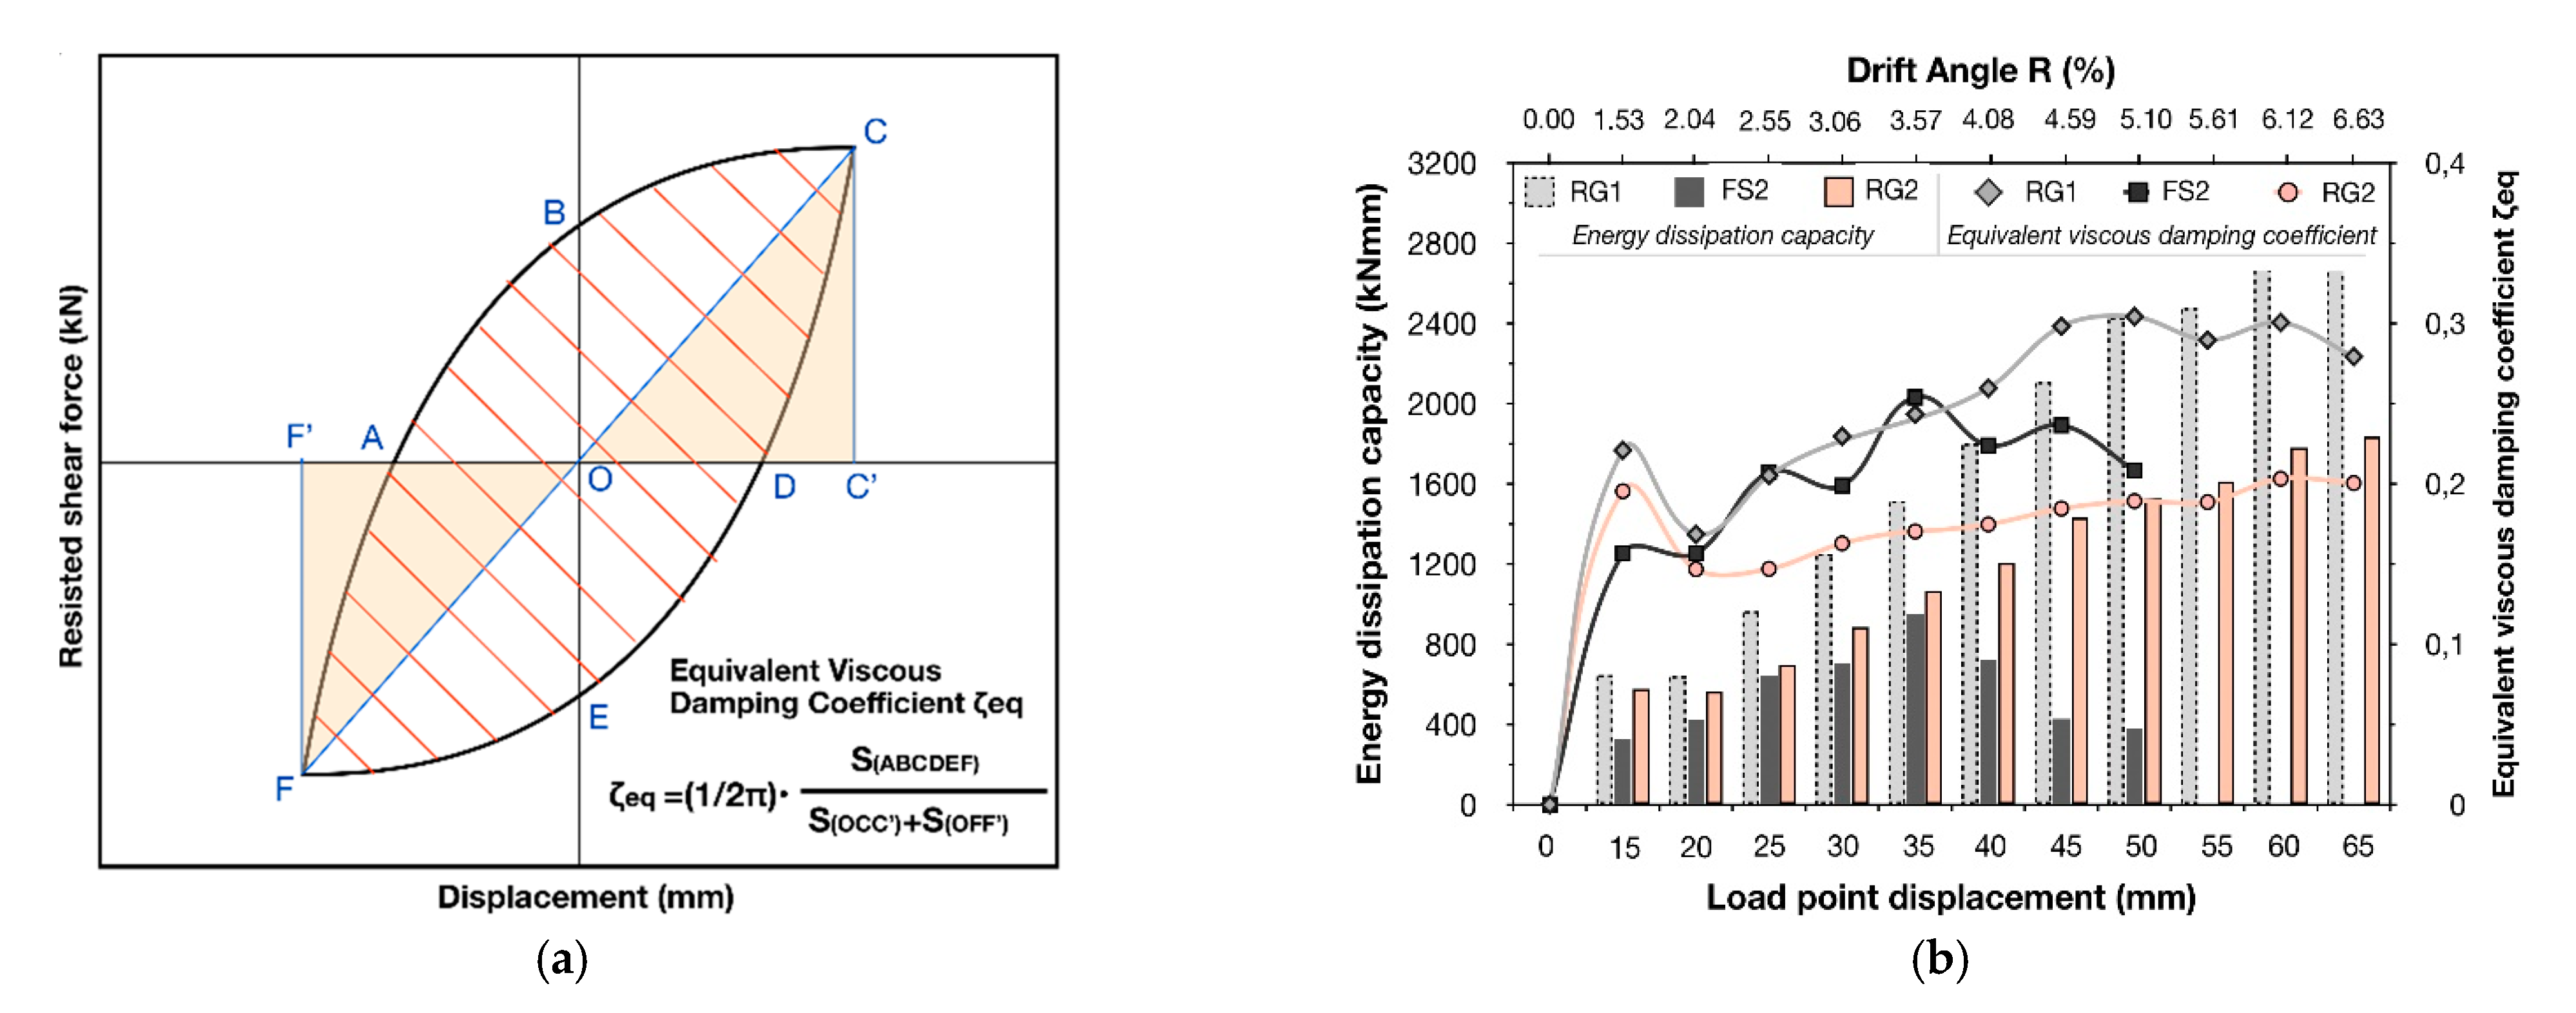
3.1. Interpretation of the Seismic Performance of the Strengthened Specimens
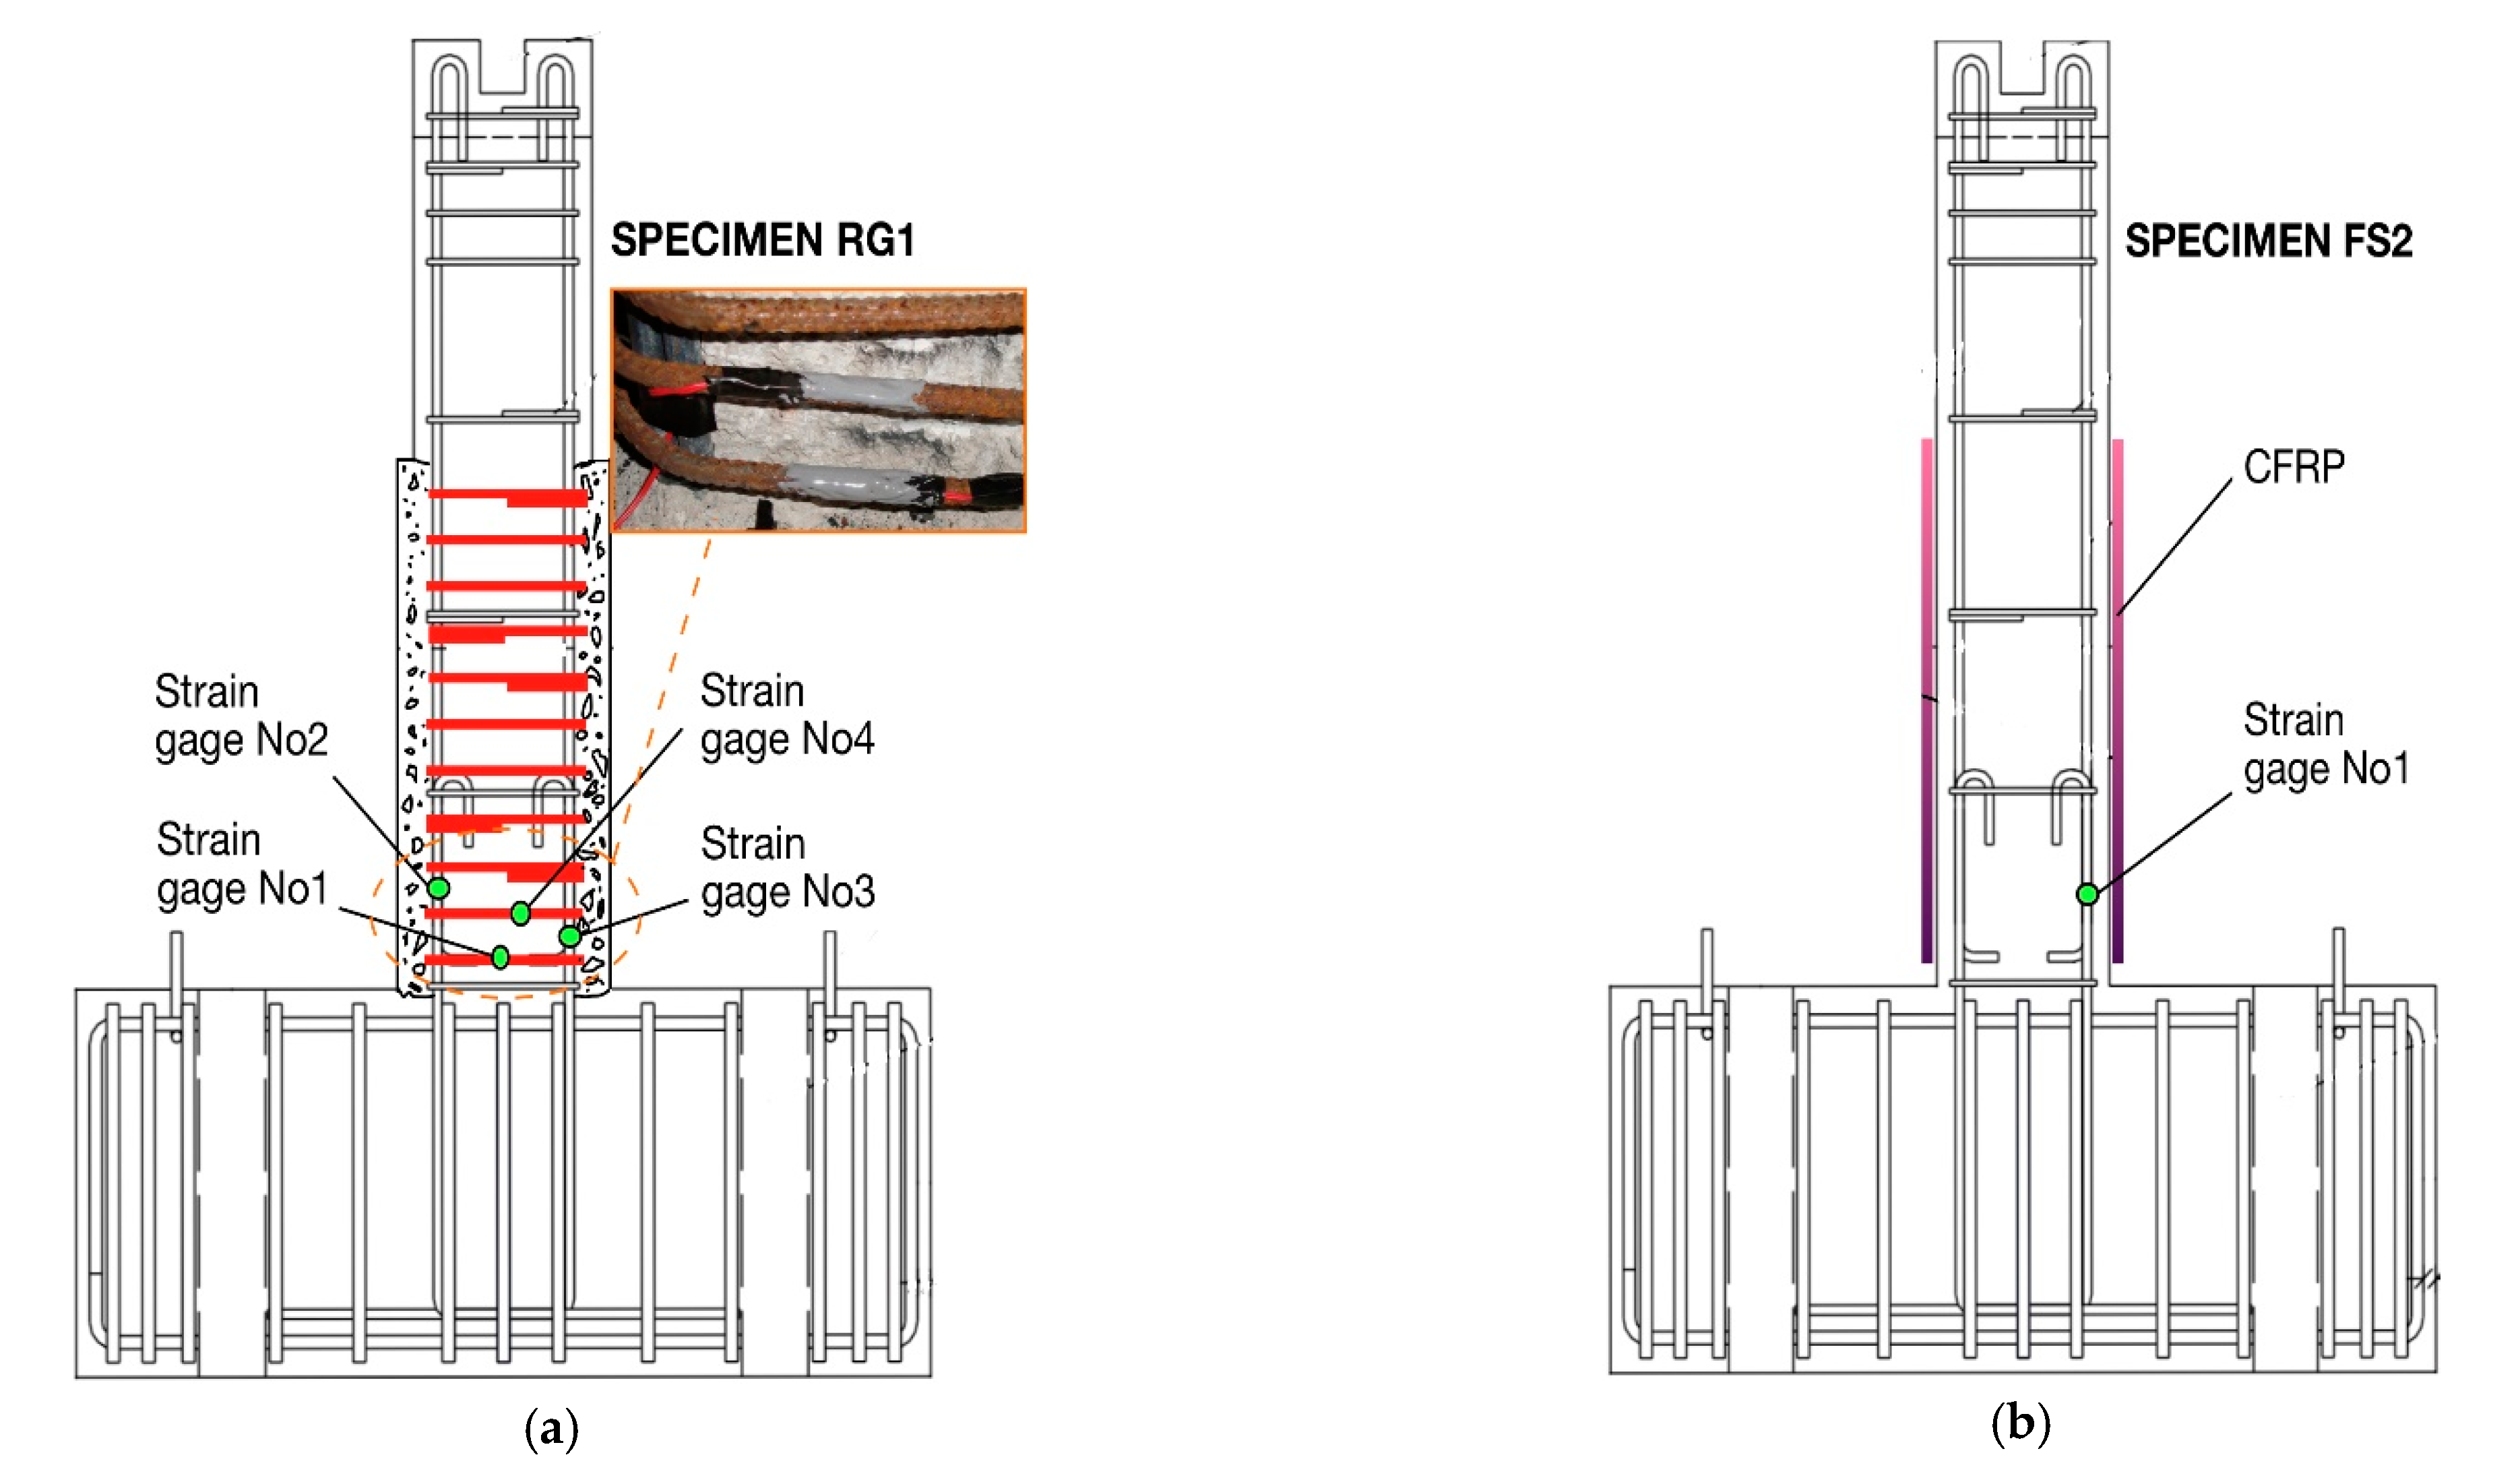
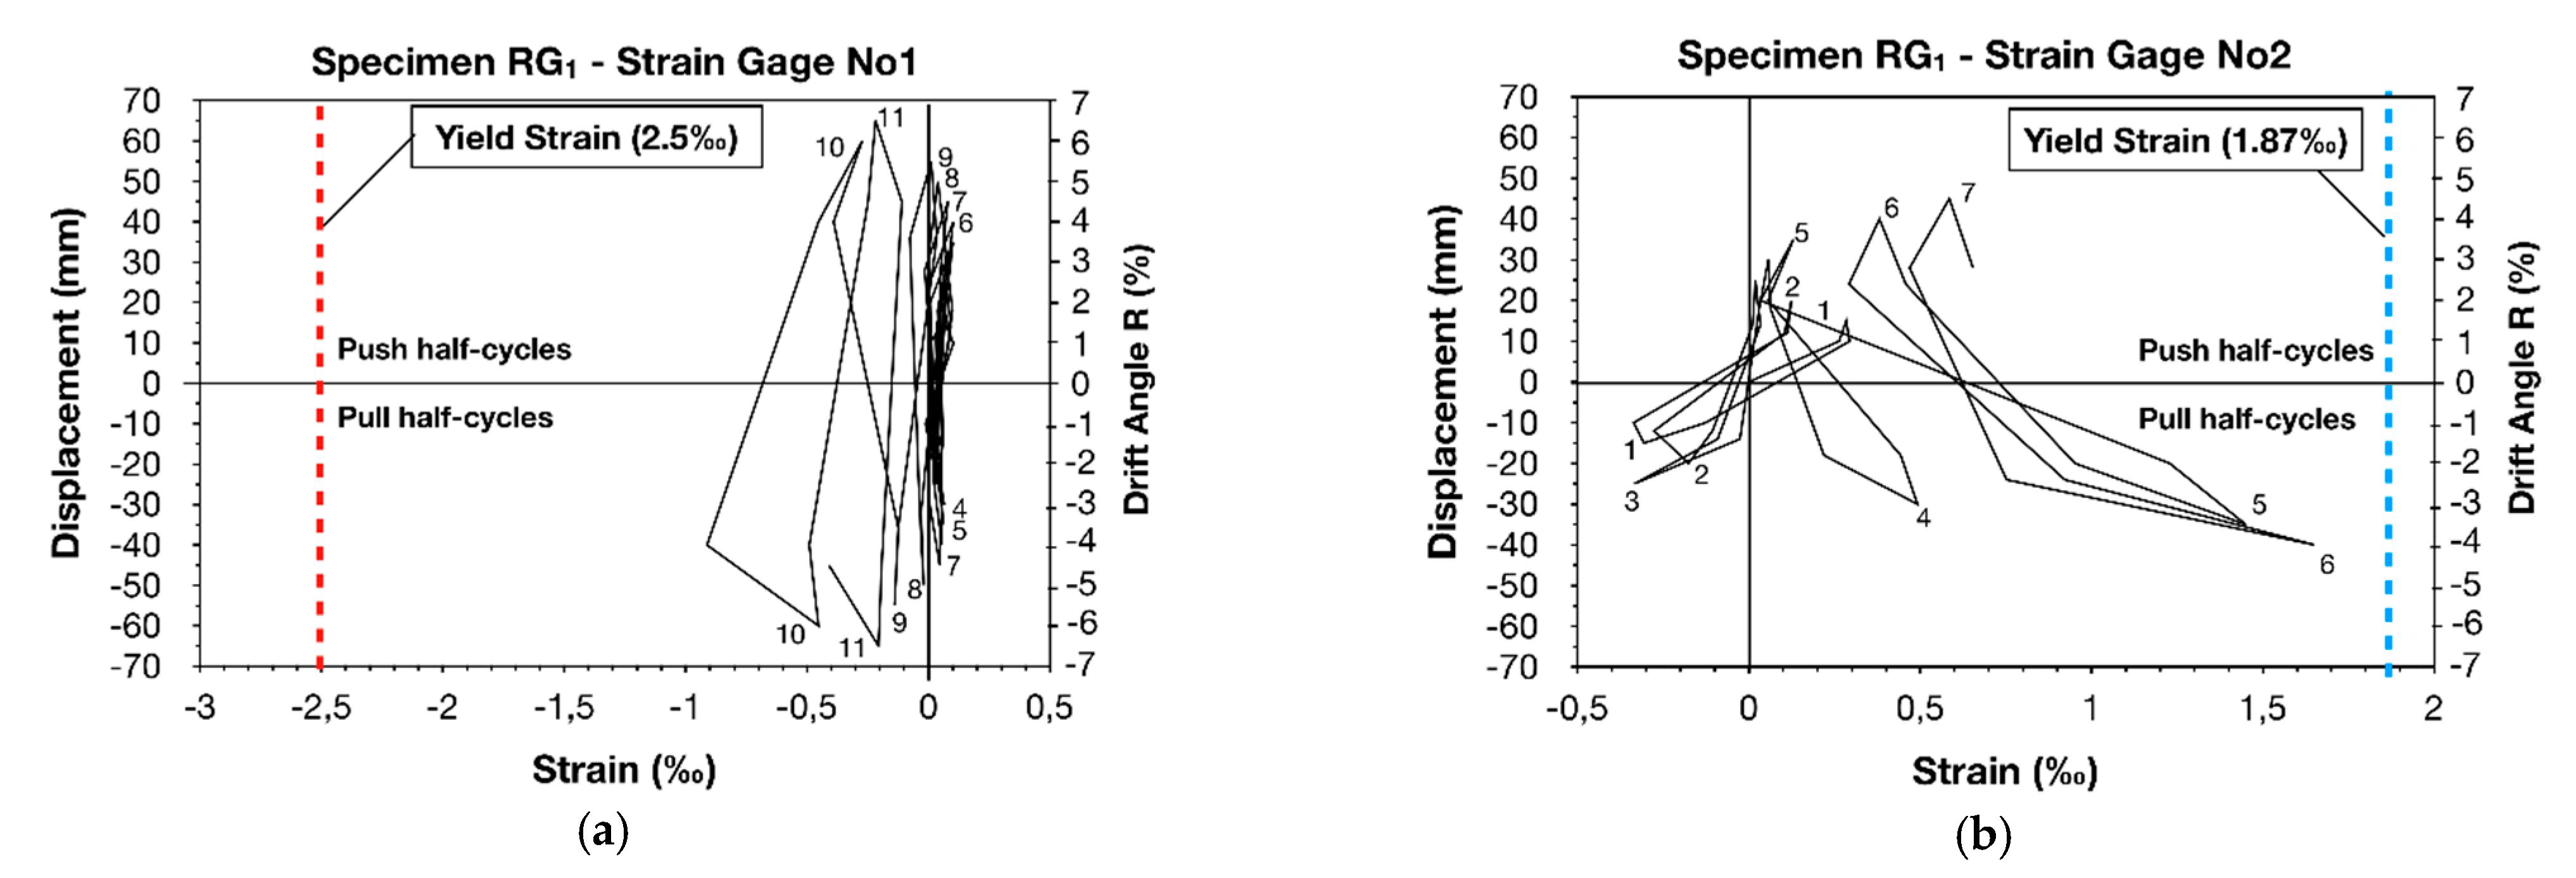
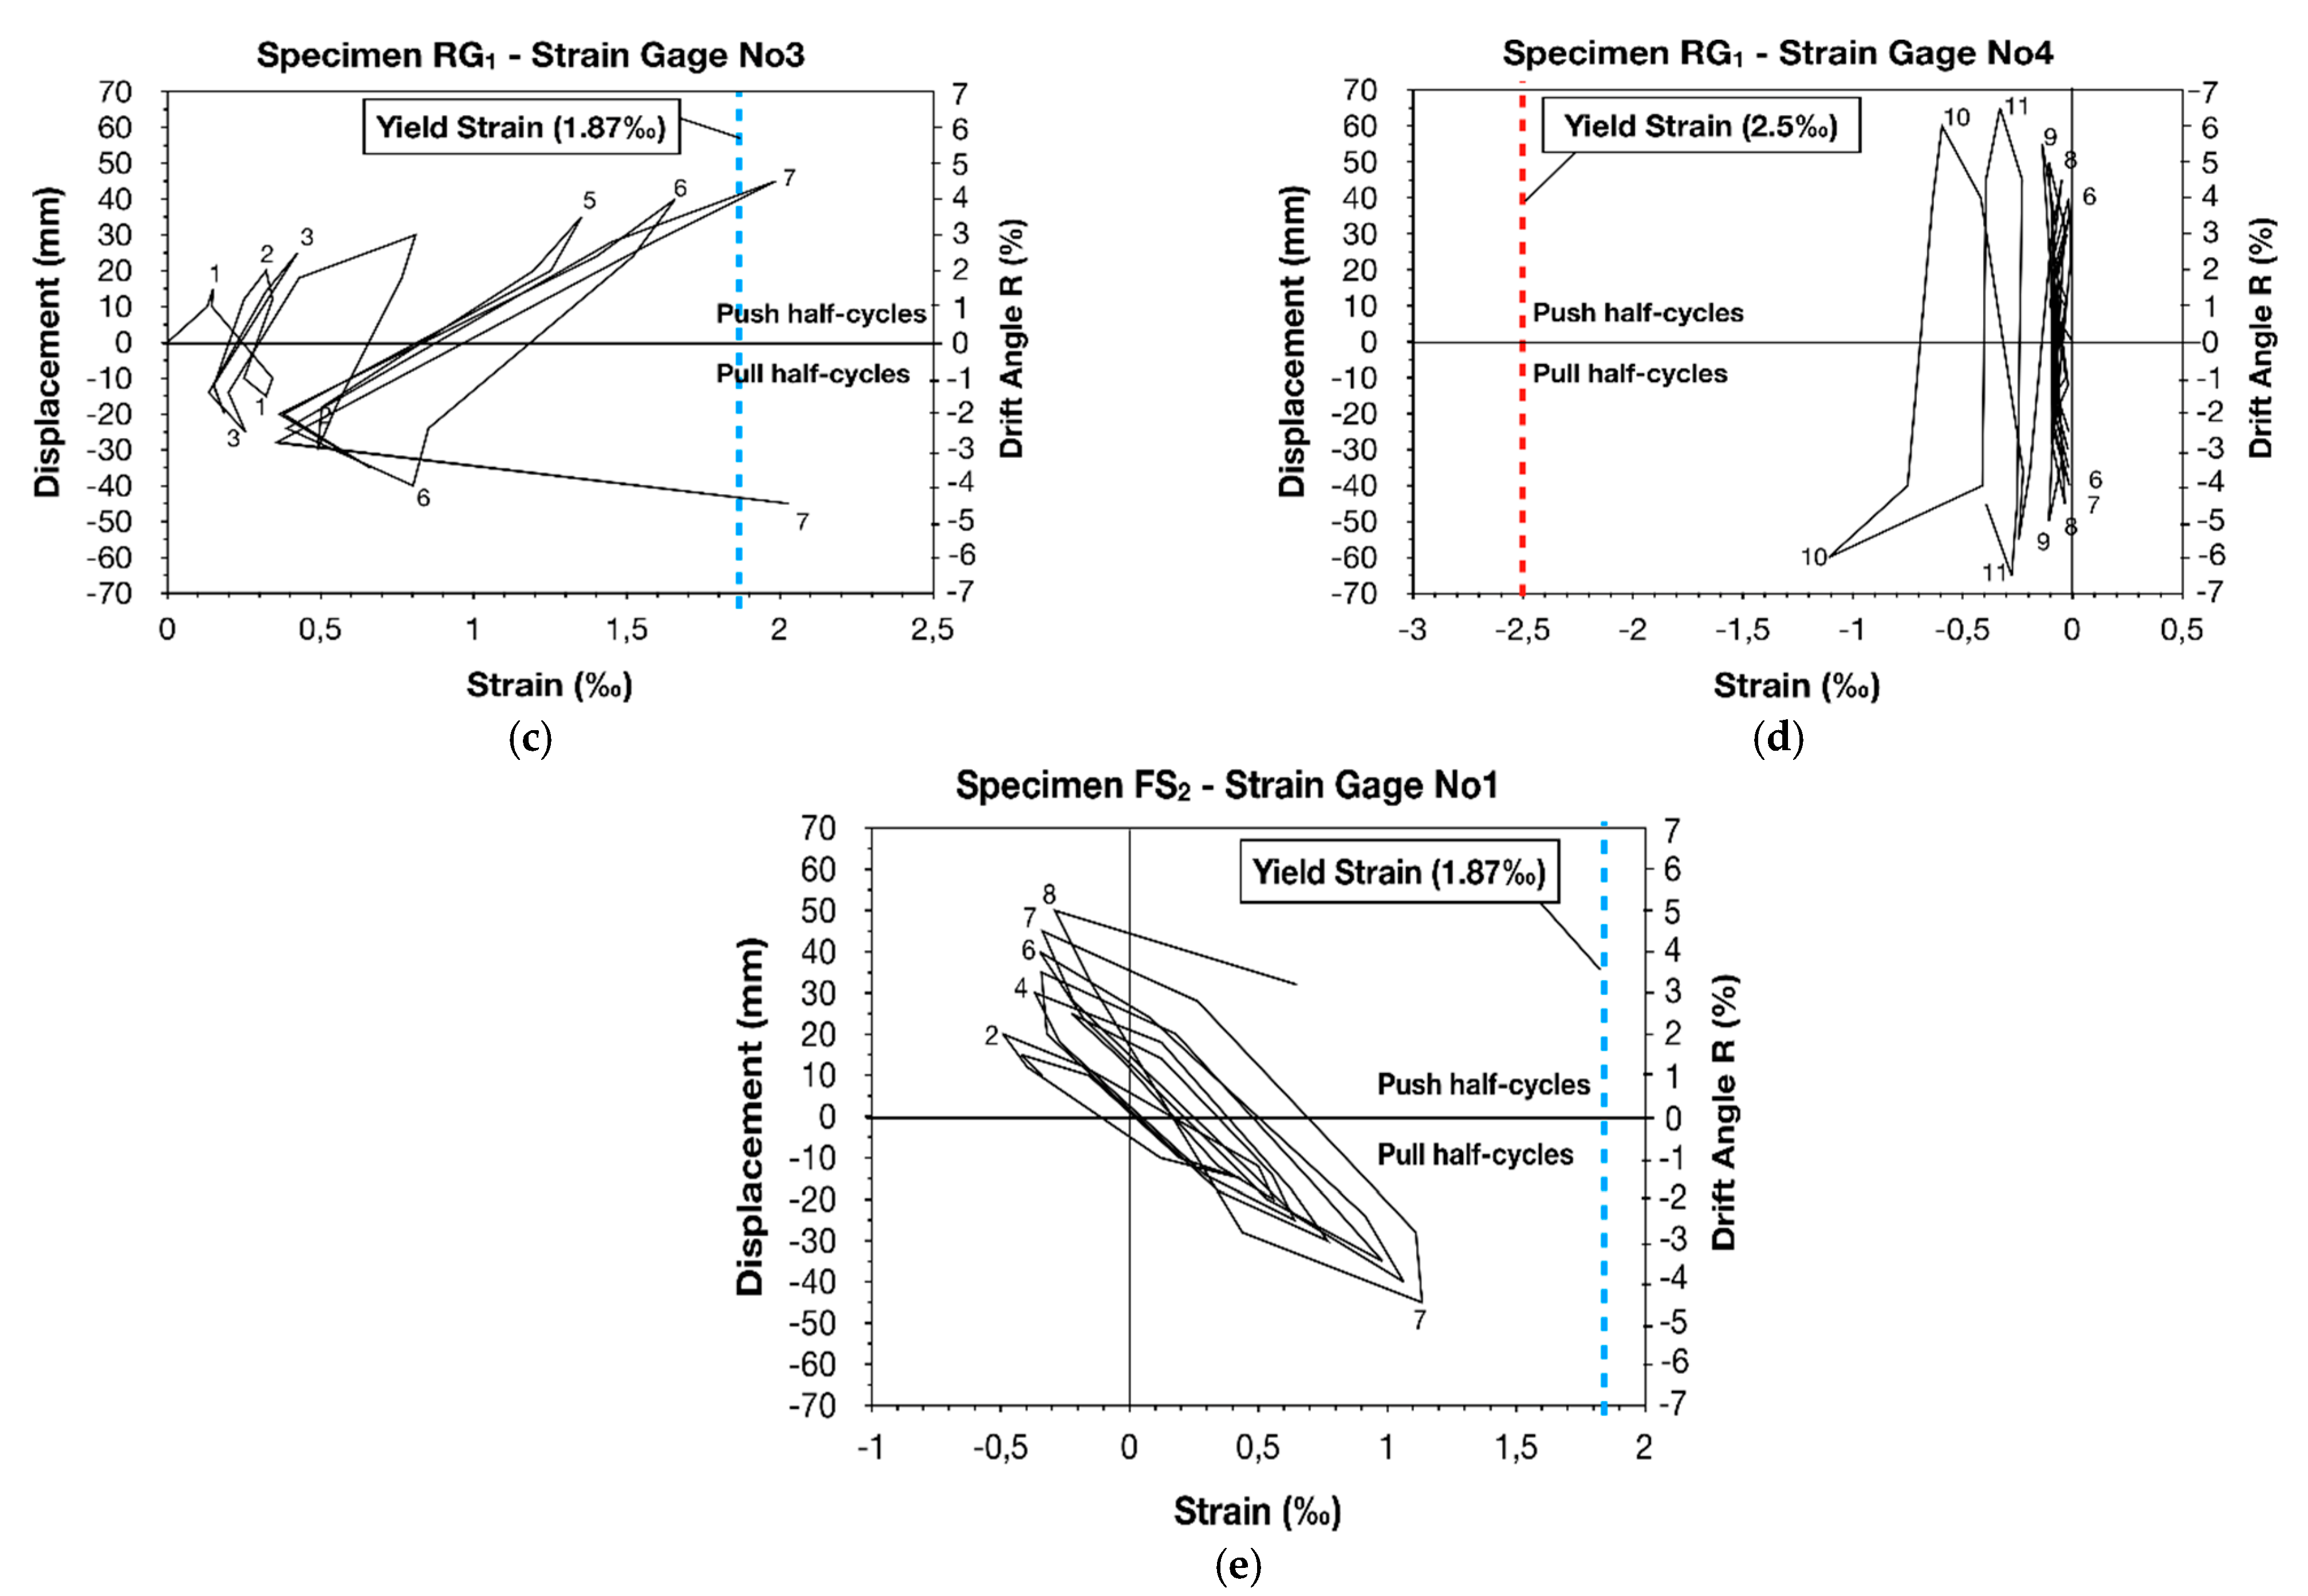
3.2. Monitoring of the Steel Bar Micro-Strain
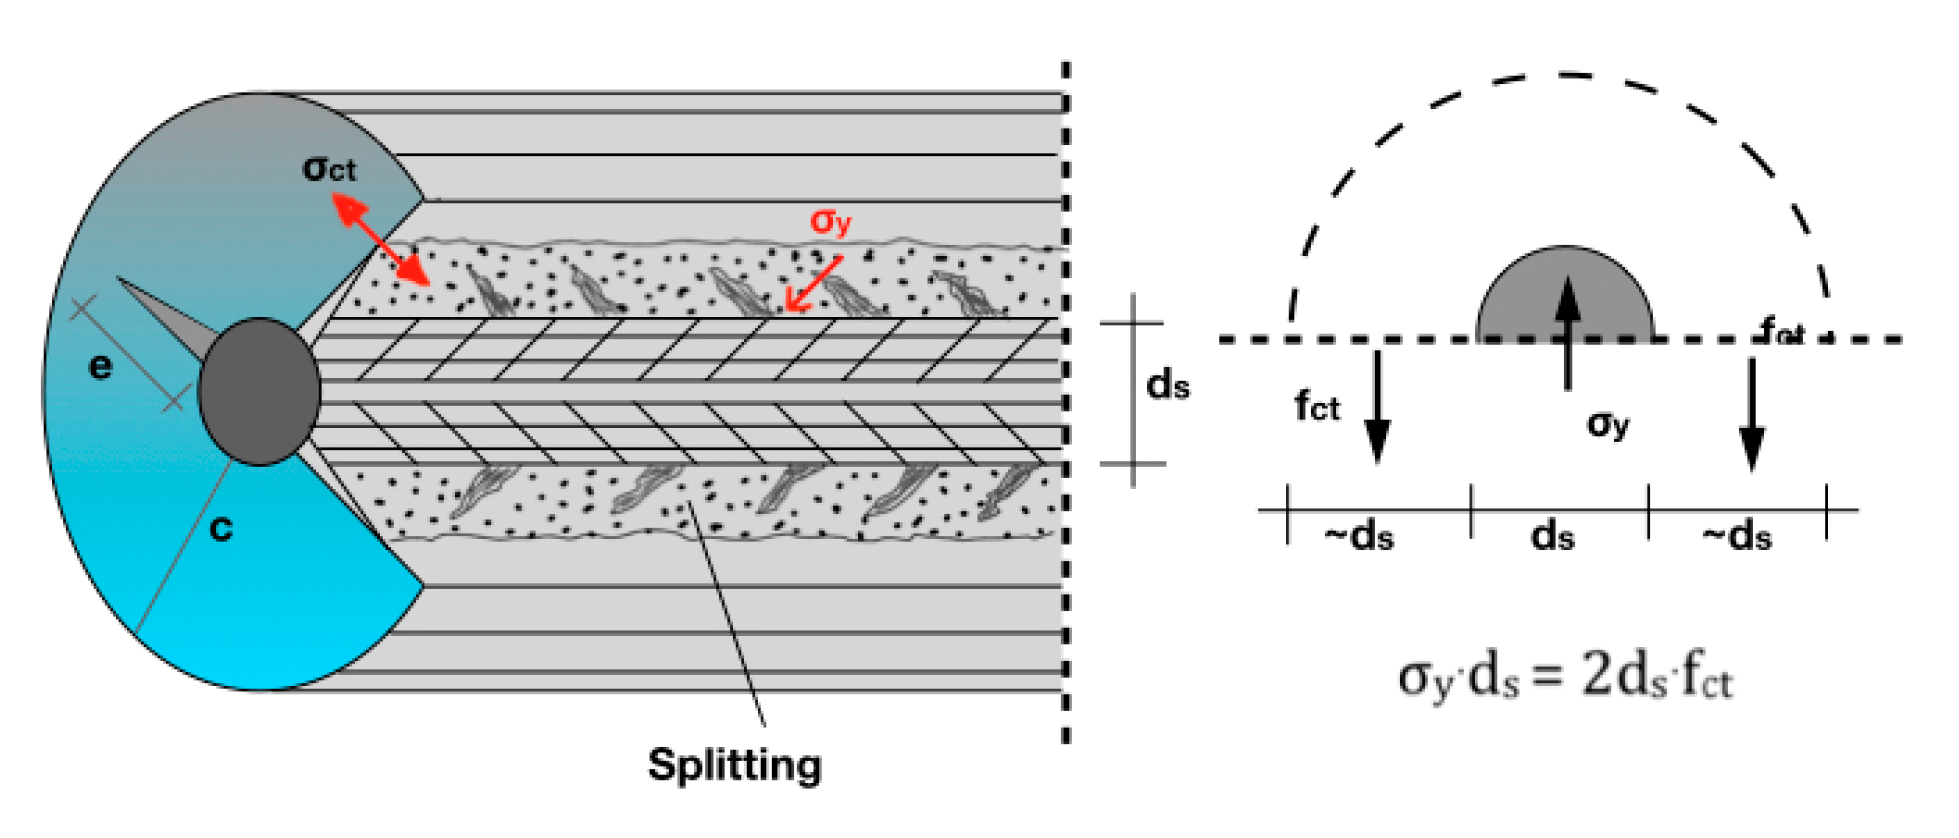
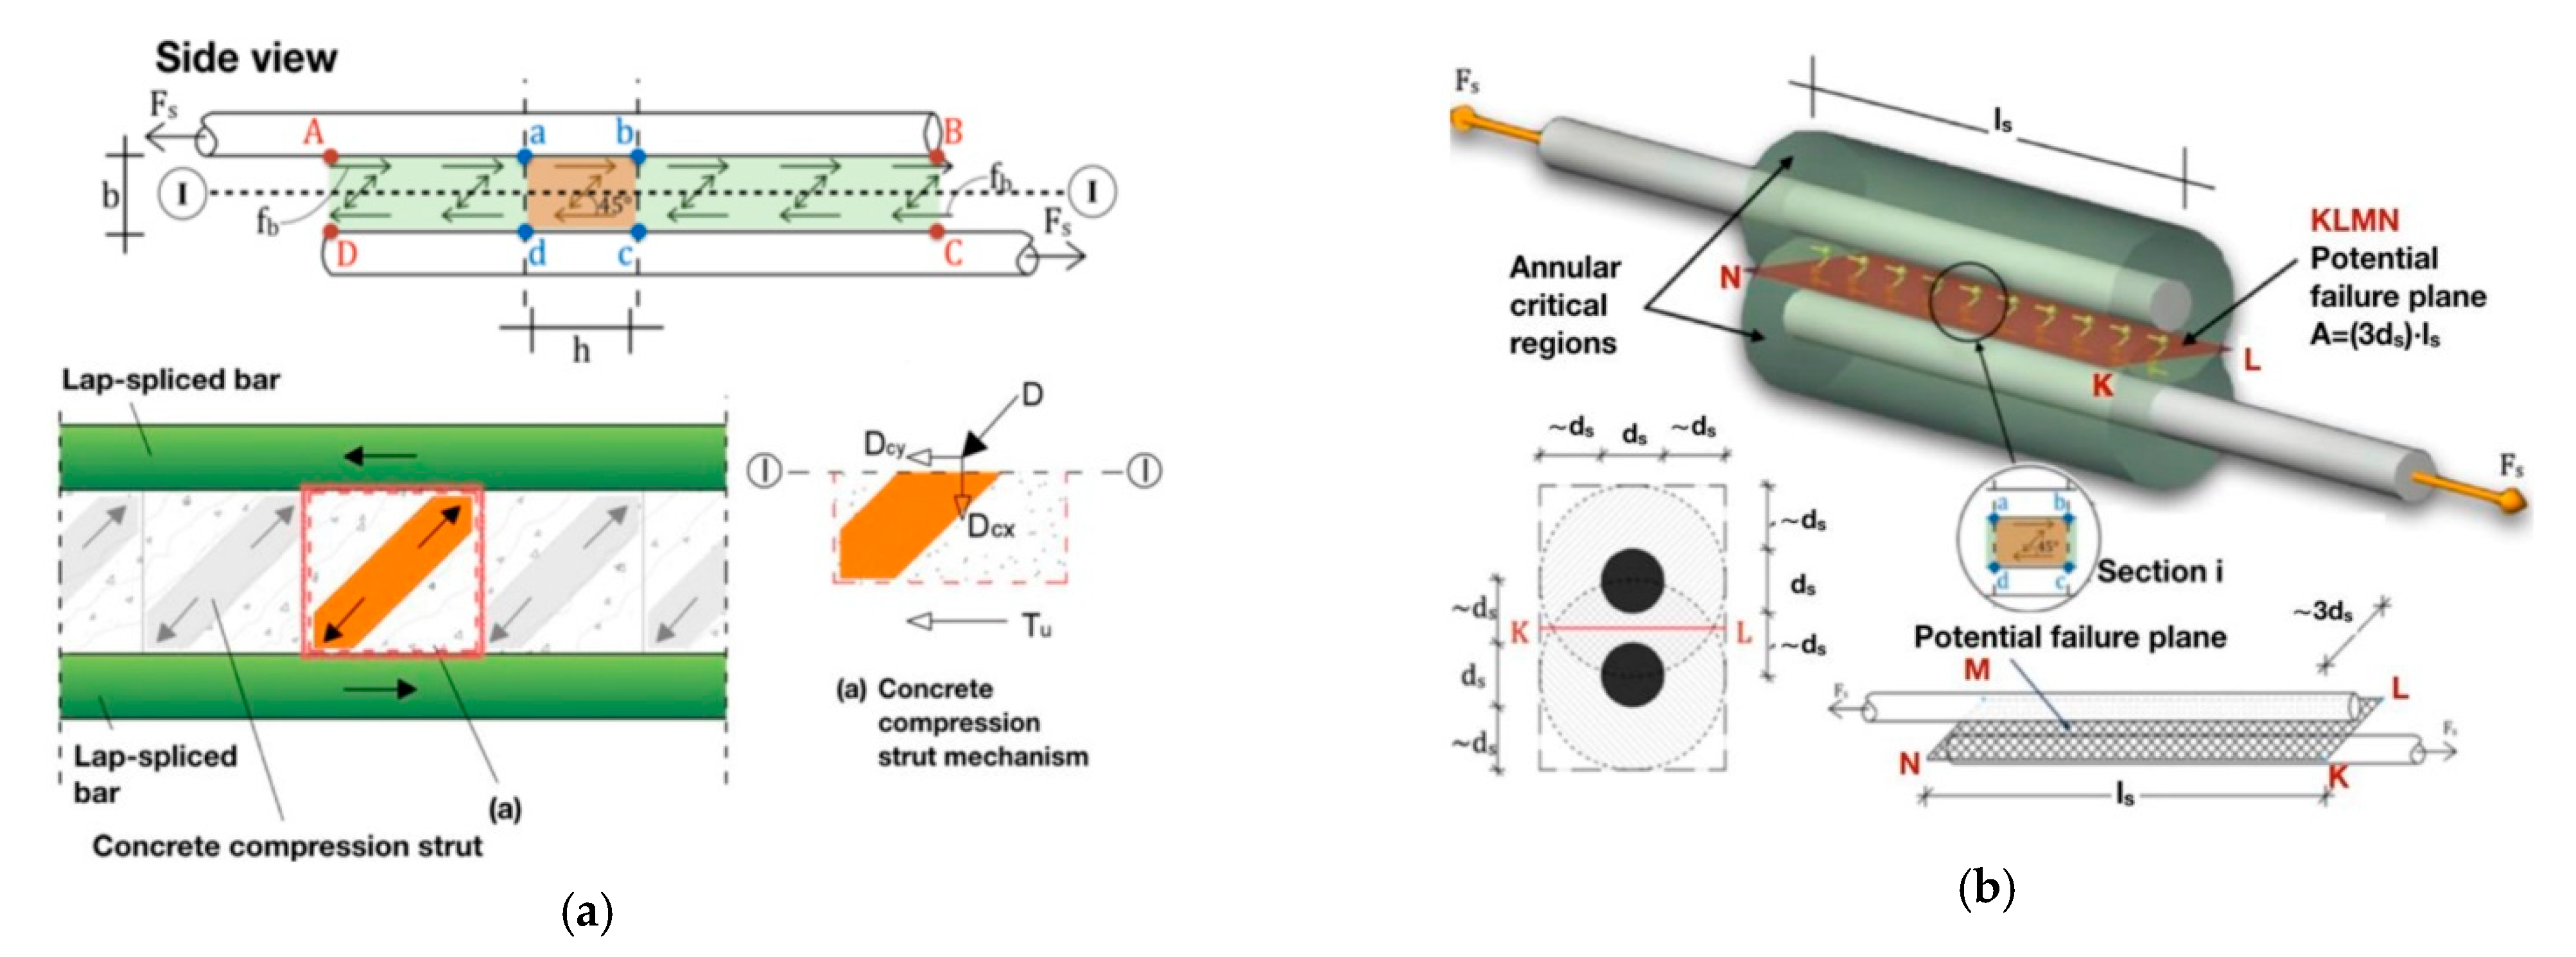
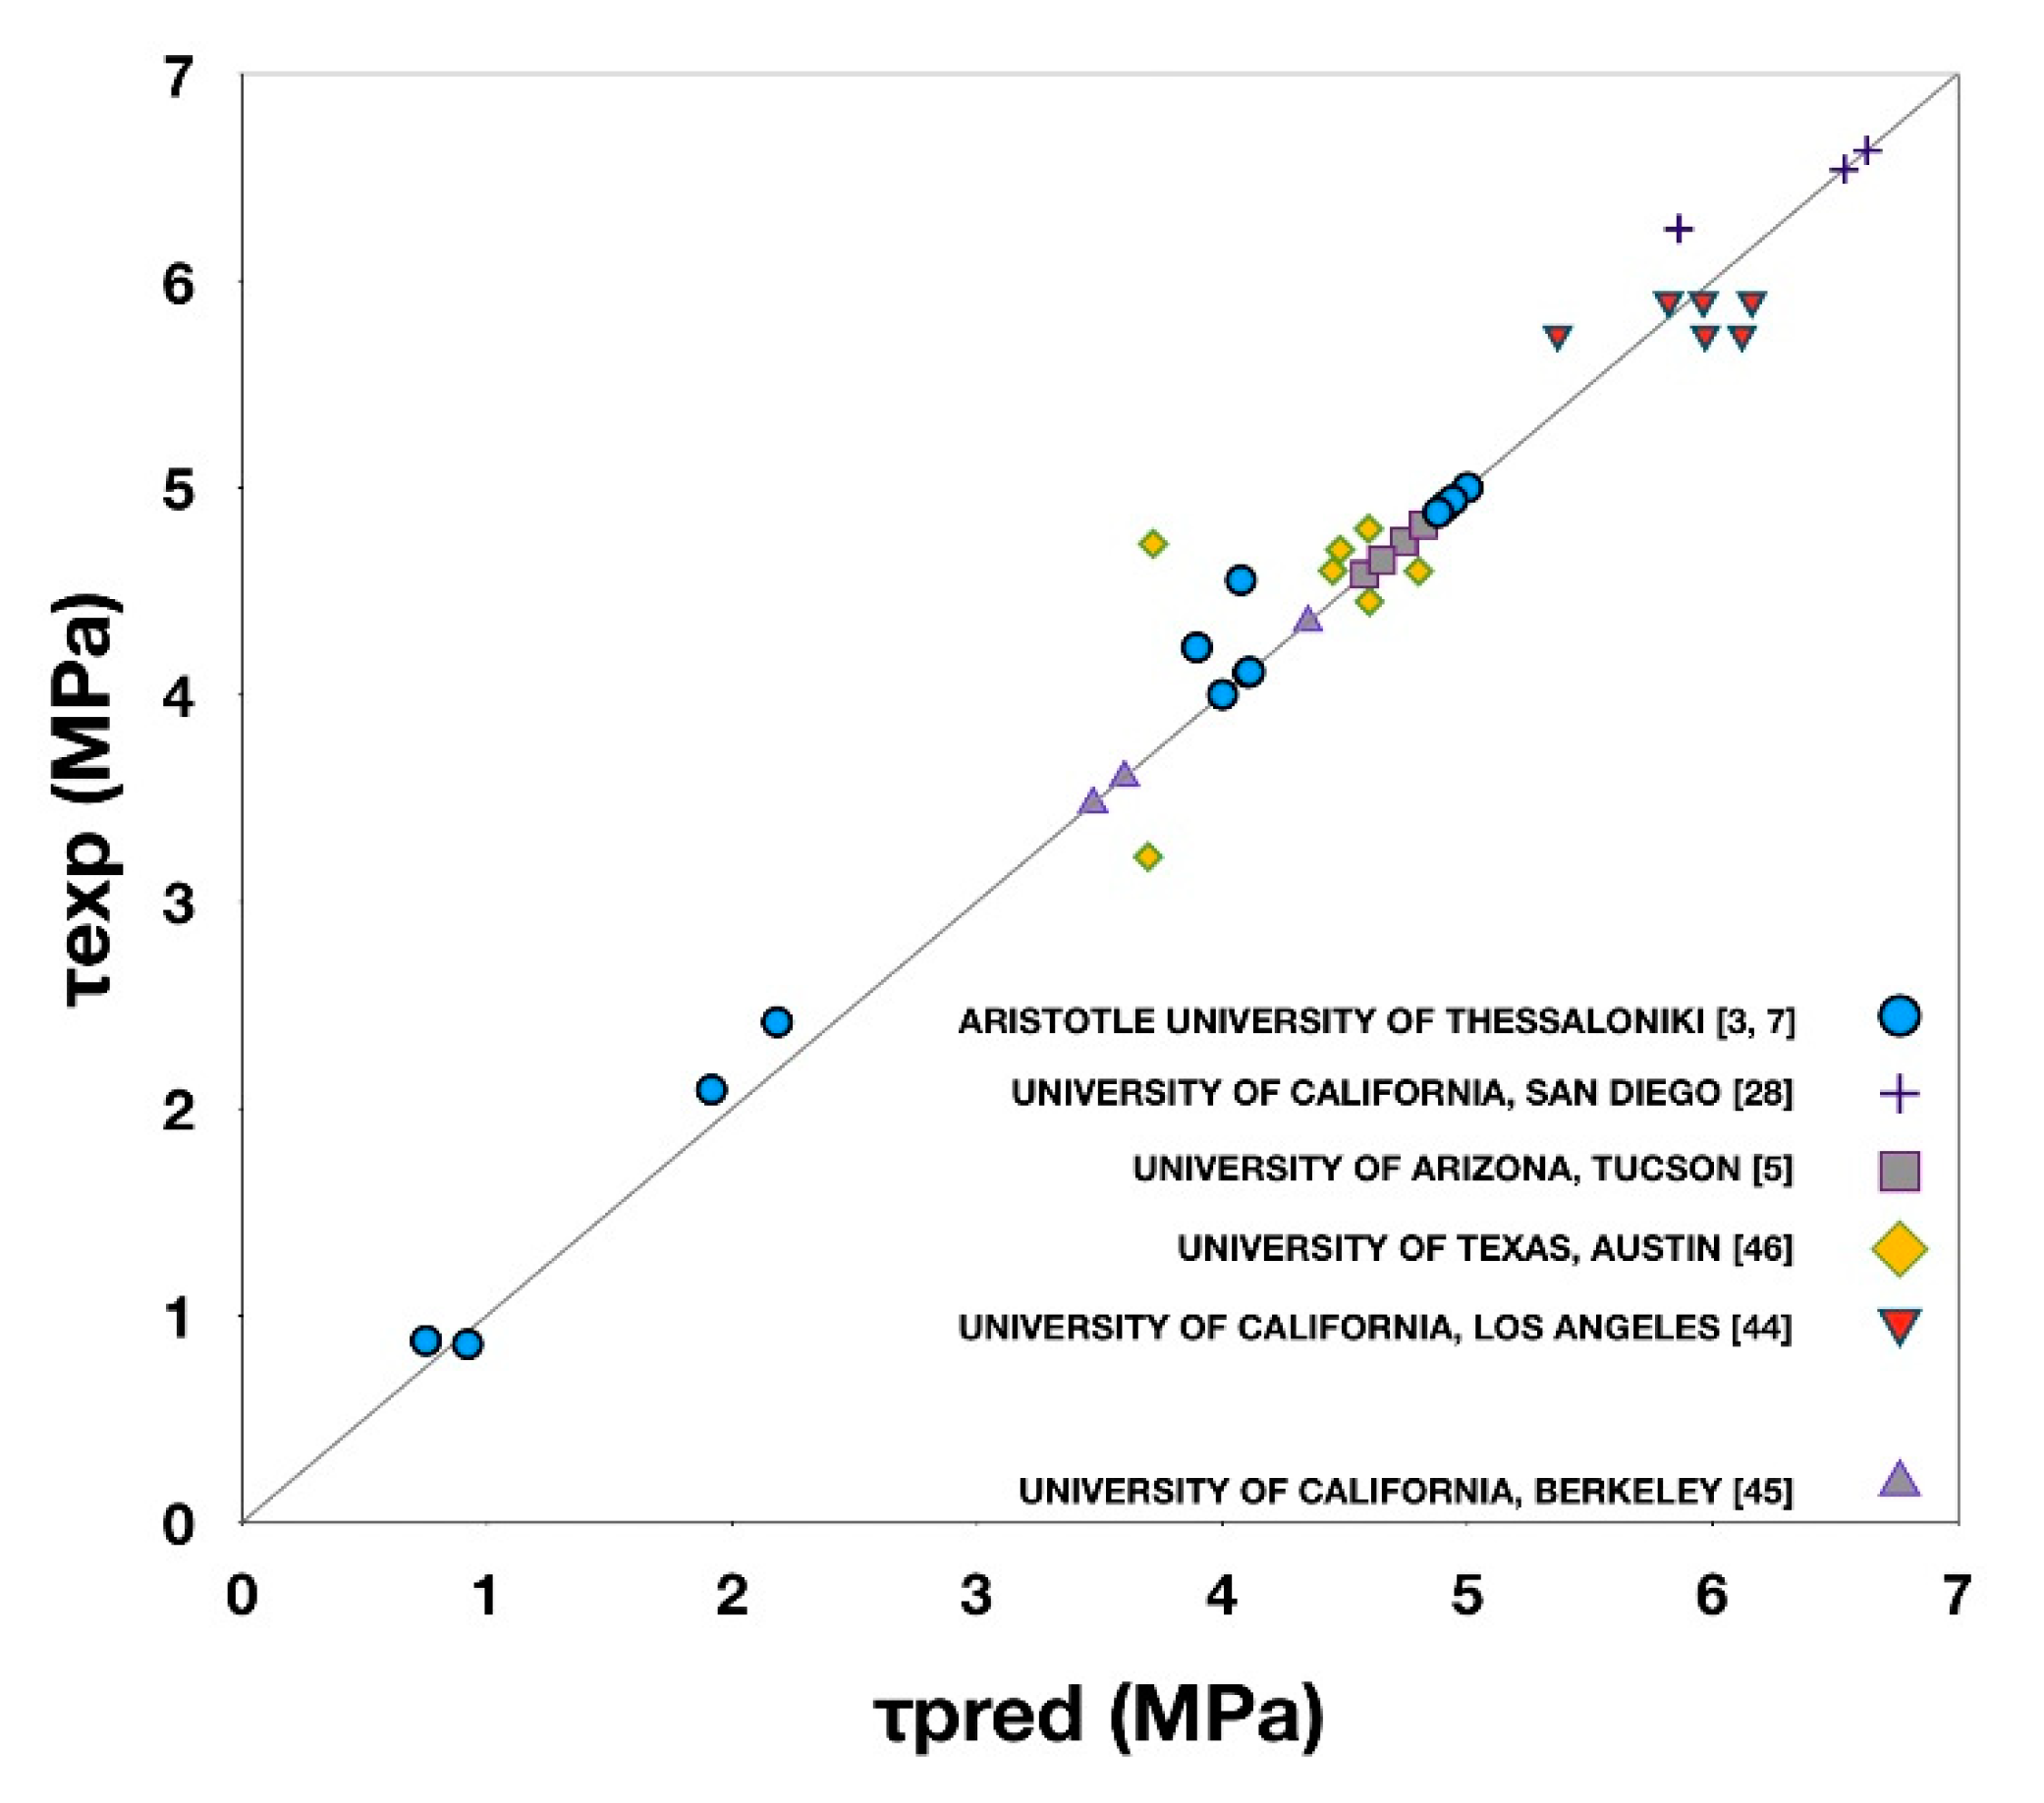
3.3. Theoretical Conciderations
4. Conclusions
Author Contributions
Funding
Institutional Review Board Statement
Informed Consent Statement
Data Availability Statement
Acknowledgments
Conflicts of Interest
References
- Tsonos, A.-D. Design of Reinforced Concrete Structures according to Eurocodes; Sofia: Thessaloniki, Greece, 2017; p. 654. (In Greek) [Google Scholar]
- Paulay, T.; Priestley, M.J.N. Seismic Design of Reinforced Concrete and Masonry Buildings; John Wiley and Sons: New York, NY, USA, 1992. [Google Scholar]
- Kalogeropoulos, G.; Tsonos, A.D. Improvement of the cyclic response of RC columns with inadequate lap splices—Experimental and analytical investigation. Earthq. Struct. 2019, 16, 279–293. [Google Scholar] [CrossRef]
- Yeh, Y.; Mo, Y. Shear retrofit of hollow bridge piers with carbon fiber-reinforced polymer sheets. J. Compos. Constr. 2005, 9, 327–336. [Google Scholar] [CrossRef]
- Saadatmanesh, H.; Ehsani, M.R.; Jin, L. Repair of earthquake-damaged RC columns with FRP wraps. ACI Struct. J. 1997, 94, 206–214. [Google Scholar]
- Pavese, A.; Bolognini, D.; Peloso, S. FRP seismic retrofit of RC square hollow section bridge piers. J. Earthq. Eng. 2004, 8, 225–250. [Google Scholar] [CrossRef]
- Kalogeropoulos, G.; Tsonos, A.D. Cyclic performance of RC columns with inadequate lap splices strengthened with CFRP jackets. Fibers 2020, 8, 39. [Google Scholar] [CrossRef]
- Chalioris, C.E.; Kosmidou, P.-M.K.; Papadopoulos, N.A. Investigation of a new strengthening technique for RC deep beams using carbon FRP ropes as transverse reinforcements. Fibers 2018, 6, 52. [Google Scholar] [CrossRef]
- Chalioris, C.E. Analytical model for the torsional behaviour of reinforced concrete beams retrofitted with FRP materials. Eng. Struct. 2007, 29, 3263–3276. [Google Scholar] [CrossRef]
- Gopinath, S.; Murthy, A.R.; Patrawala, H. Near surface mounted strengthening of RC beams using basalt fiber reinforced polymer bars. Constr. Build. Mater. 2016, 111, 1–8. [Google Scholar] [CrossRef]
- Jabr, A.; El-Ragaby, A.; Ghrib, F. Effect of the fiber type and axial stiffness of FRCM on the flexural strengthening of RC beams. Fibers 2017, 5, 2. [Google Scholar] [CrossRef]
- Tsonos, A.G. Effectiveness of CFRP jackets in post-earthquake and pre-earthquake retrofitting of beam-column subassemblages. Struct. Eng. Mech. 2007, 27, 393–408. [Google Scholar] [CrossRef]
- Tsonos, A.-D. Effectiveness of CFRP-jackets and RC-jackets in post-earthquake and pre-earthquake retrofitting of beam-column subassemblages. Eng. Struct. 2008, 30, 777–793. [Google Scholar] [CrossRef]
- Tsonos, A.G. Ultra-high-performance fiber reinforced concrete: An innovative solution for strengthening old R/C structures and for improving the FRP strengthening method. WIT Trans. Eng. Sci. 2009, 64, 273–284. [Google Scholar]
- Karayannis, C.; Golias, E. Full scale tests of RC joints with minor to moderate seismic damage repaired using C-FRP sheets. Earthq. Struct. 2018, 15, 617–627. [Google Scholar] [CrossRef]
- Karayannis, C.G.; Sirkelis, G.M. Strengthening and rehabilitation of rc beam-column joints using carbon-FRP jacketing and epoxy resin injection. Earthq. Eng. Struct. Dyn. 2008, 37, 769–790. [Google Scholar] [CrossRef]
- Pampanin, S.; Bolognini, D.; Pavese, A. Performance-Based seismic retrofit strategy for existing reinforced concrete frame systems using fiber-reinforced polymer composites. J. Compos. Constr. 2007, 11, 211–226. [Google Scholar] [CrossRef]
- Napoli, A.; Matta, F.; Martinelli, E.; Nanni, A.; Realfonzo, R. Modelling and verification of response of RC slabs strengthened in flexure with mechanically fastened FRP laminates. Mag. Concr. Res. 2010, 62, 593–605. [Google Scholar] [CrossRef]
- Moon, J.; Reda Taha, M.; Kim, J. Flexural strengthening of RC slabs using a hybrid FRP-UHPC system including shear connector. Adv. Mat. Sci. Eng. 2017, 2017, 4387545. [Google Scholar] [CrossRef]
- Seifi, A.; Hosseini, A.; Marefat, M.S.; Zareian, M.S. Improving seismic performance of old-type RC frames using NSM technique and FRP jackets. Eng. Struct. 2017, 147, 705–723. [Google Scholar] [CrossRef]
- Yalçin, C.; Kaya, O.; Sinangil, M. Seismic retrofitting of RC columns having plain rebars using CFRP sheets for improved strength and ductility. Constr. Build. Mater. 2008, 22, 295–307. [Google Scholar] [CrossRef]
- Karayannis, C.; Kosmidou, P.-M.; Chalioris, C. Reinforced concrete beams with carbon-fiber-reinforced polymer bars—Experimental study. Fibers 2018, 6, 99. [Google Scholar] [CrossRef]
- Tsonos, A.-D. An innovative solution for strengthening of old RC structures and for improving the FRP strengthening method. Struct. Monit. Maint. 2014, 1, 323–338. [Google Scholar]
- Zanini, M.A.; Toska, K.; Faleschini, F.; Pellegrino, C. Seismic reliability of reinforced concrete bridges subject to environmental deterioration and strengthened with FRCM composites. Soil Dyn. Earth Eng. 2020, 136. [Google Scholar] [CrossRef]
- Braga, F.; Gigliotti, R.; Laterza, M. Analytical stress-strain relationship for concrete confined by steel stirrups and/or FRP jackets. J. Struct. Eng. 2006, 132, 1402–1416. [Google Scholar] [CrossRef]
- Karayannis, C.; Chalioris, C.; Sirkelis, G. Local retrofit of exterior RC beam-column joints using thin RC jackets—An experimental study. Earthq. Eng. Struct. Dyn. 2008, 37, 727–746. [Google Scholar] [CrossRef]
- Tayeh, B.; Abu Naja, M.; Shihada, S.; Arafa, M. Repairing and strengthening of damaged RC columns using thin concrete jacketing. Adv. Civ. Eng. 2019, 2019, 1–16. [Google Scholar] [CrossRef]
- Chalkia, A.; Kyrkousi, G. Retrofitting of Columns of Existing RC Structures with Inadequate Lap Splices with Carbon Fiber Reinforced Polymer Jackets. Diploma Thesis, Greek, 2011. [Google Scholar]
- Panagiotou, S. Evaluation of the Effectiveness of Additional Ties Used to Improve the Behavior of RC Columns with Inadequate Lap Splices. Diploma Thesis, Greek, 2012. [Google Scholar]
- Chai, H.Y.; Priestley, M.J.N.; Seible, F. Seismic retrofit of circular bridge columns for enhanced flexural performance. ACI Struct. J. 1991, 88, 572–584. [Google Scholar]
- EPPO. Greek Code for Interventions; Earthquake Planning and Protection Organisation: Athens, Greece, 2017. [Google Scholar]
- Soroushian, P.; Sim, J. Axial behavior of reinforced concrete columns under dynamic loads. ACI J. 1986, 83, 1018–1025. [Google Scholar]
- Scott, B.D. Stress-Strain Relationships for Confined Concrete: Rectangular Sections. Master’s Thesis, University of Canterbury, Christchurch, New Zealand, 1980. [Google Scholar]
- CEB. CEB-FIP Modes Code 1990; Bulletin d’ Information CEB, 213/214; CEB: Lausanne, Switzerland, 1993. [Google Scholar]
- Hakuto, S.; Park, R.; Tanaka, H. Seismic load tests on interior and exterior beam-column joints with substandard reinforcing details. ACI Struct. J. 2000, 97, 11–25. [Google Scholar]
- Ehsani, M.R.; Wight, J.K. Exterior reinforced concrete beam-to-column connections subjected to earthquake-type loading. ACI J. Proc. 1985, 82, 492–499. [Google Scholar]
- Durrani, A.J.; Wight, J.K. Earthquake resistance of reinforced concrete interior connections including a floor slab. ACI J. Proc. 1987, 84, 400–406. [Google Scholar]
- Priestley, M.; Seible, F.; Calvi, G.M. Seismic Design and Retrofit of Bridges; Wiley: New York, NY, USA, 1996. [Google Scholar]
- Toska, K.; Faleschini, F.; Zanini, M.A.; Hofer, L.; Pellegrino, C. Repair of severely damaged RC columns through FRCM composites. Constr. Build. Mater. 2021, 273. [Google Scholar] [CrossRef]
- Faleschini, F.; Zanini, M.A.; Hofer, L.; Toska, K.; De Domenico, D.; Pellegrino, C. Confinement of reinforced concrete columns with glass fiber reinforced cementious matrix jackets. Eng. Struct. 2020, 218, 110847. [Google Scholar] [CrossRef]
- Tsonos, A.-D. Lateral load response of strengthened reinforced concrete beam-to-column joints. ACI Struct. J. 1999, 96, 46–56. [Google Scholar]
- Tsonos, A.G. Cyclic load behaviour of reinforced concrete beam-column subassemblages of modern structures. ACI Struct. J. 2007, 194, 468–478. [Google Scholar]
- Tsonos, A.-D. Model for the evaluation of the beam—Column joint ultimate strength—A more simplified version. Earthq. Struct. 2019, 16, 141–148. [Google Scholar]
- Paulay, T.; Park, R. Joints of Reinforced Concrete Frames Designed for Earthquake Resistance; Research Report No. 84–9; Department of Civil Engineering, University of Canterbury: Christchurch, New Zealand, 1984. [Google Scholar]
- Scott, B.D.; Park, R.; Priestley, M.J.N. Stress-Strain behavior of concrete confined by overlapping hoops at low and high strain rates. ACI J. Proc. 1982, 79, 13–27. [Google Scholar]
- Melek, M.; Wallace, J.W. Cyclic behavior of columns with short lap splices. ACI Struct. J. 2004, 101, 802–811. [Google Scholar]
- Lynn, A.C.; Moehle, J.P.; Mahin, S.A.; Holmes, W.T. Seismic evaluation of existing reinforced concrete building columns. Earthq. Spectra 1996, 12, 715–739. [Google Scholar] [CrossRef]
- Aboutaha, R.S.; Engelhardt, M.D.; Jirsa, J.O.; Kreger, M.E. Rehabilitation of shear critical concrete columns by use of rectangular steel jackets. ACI Struct. J. 1999, 96, 68–78. [Google Scholar]

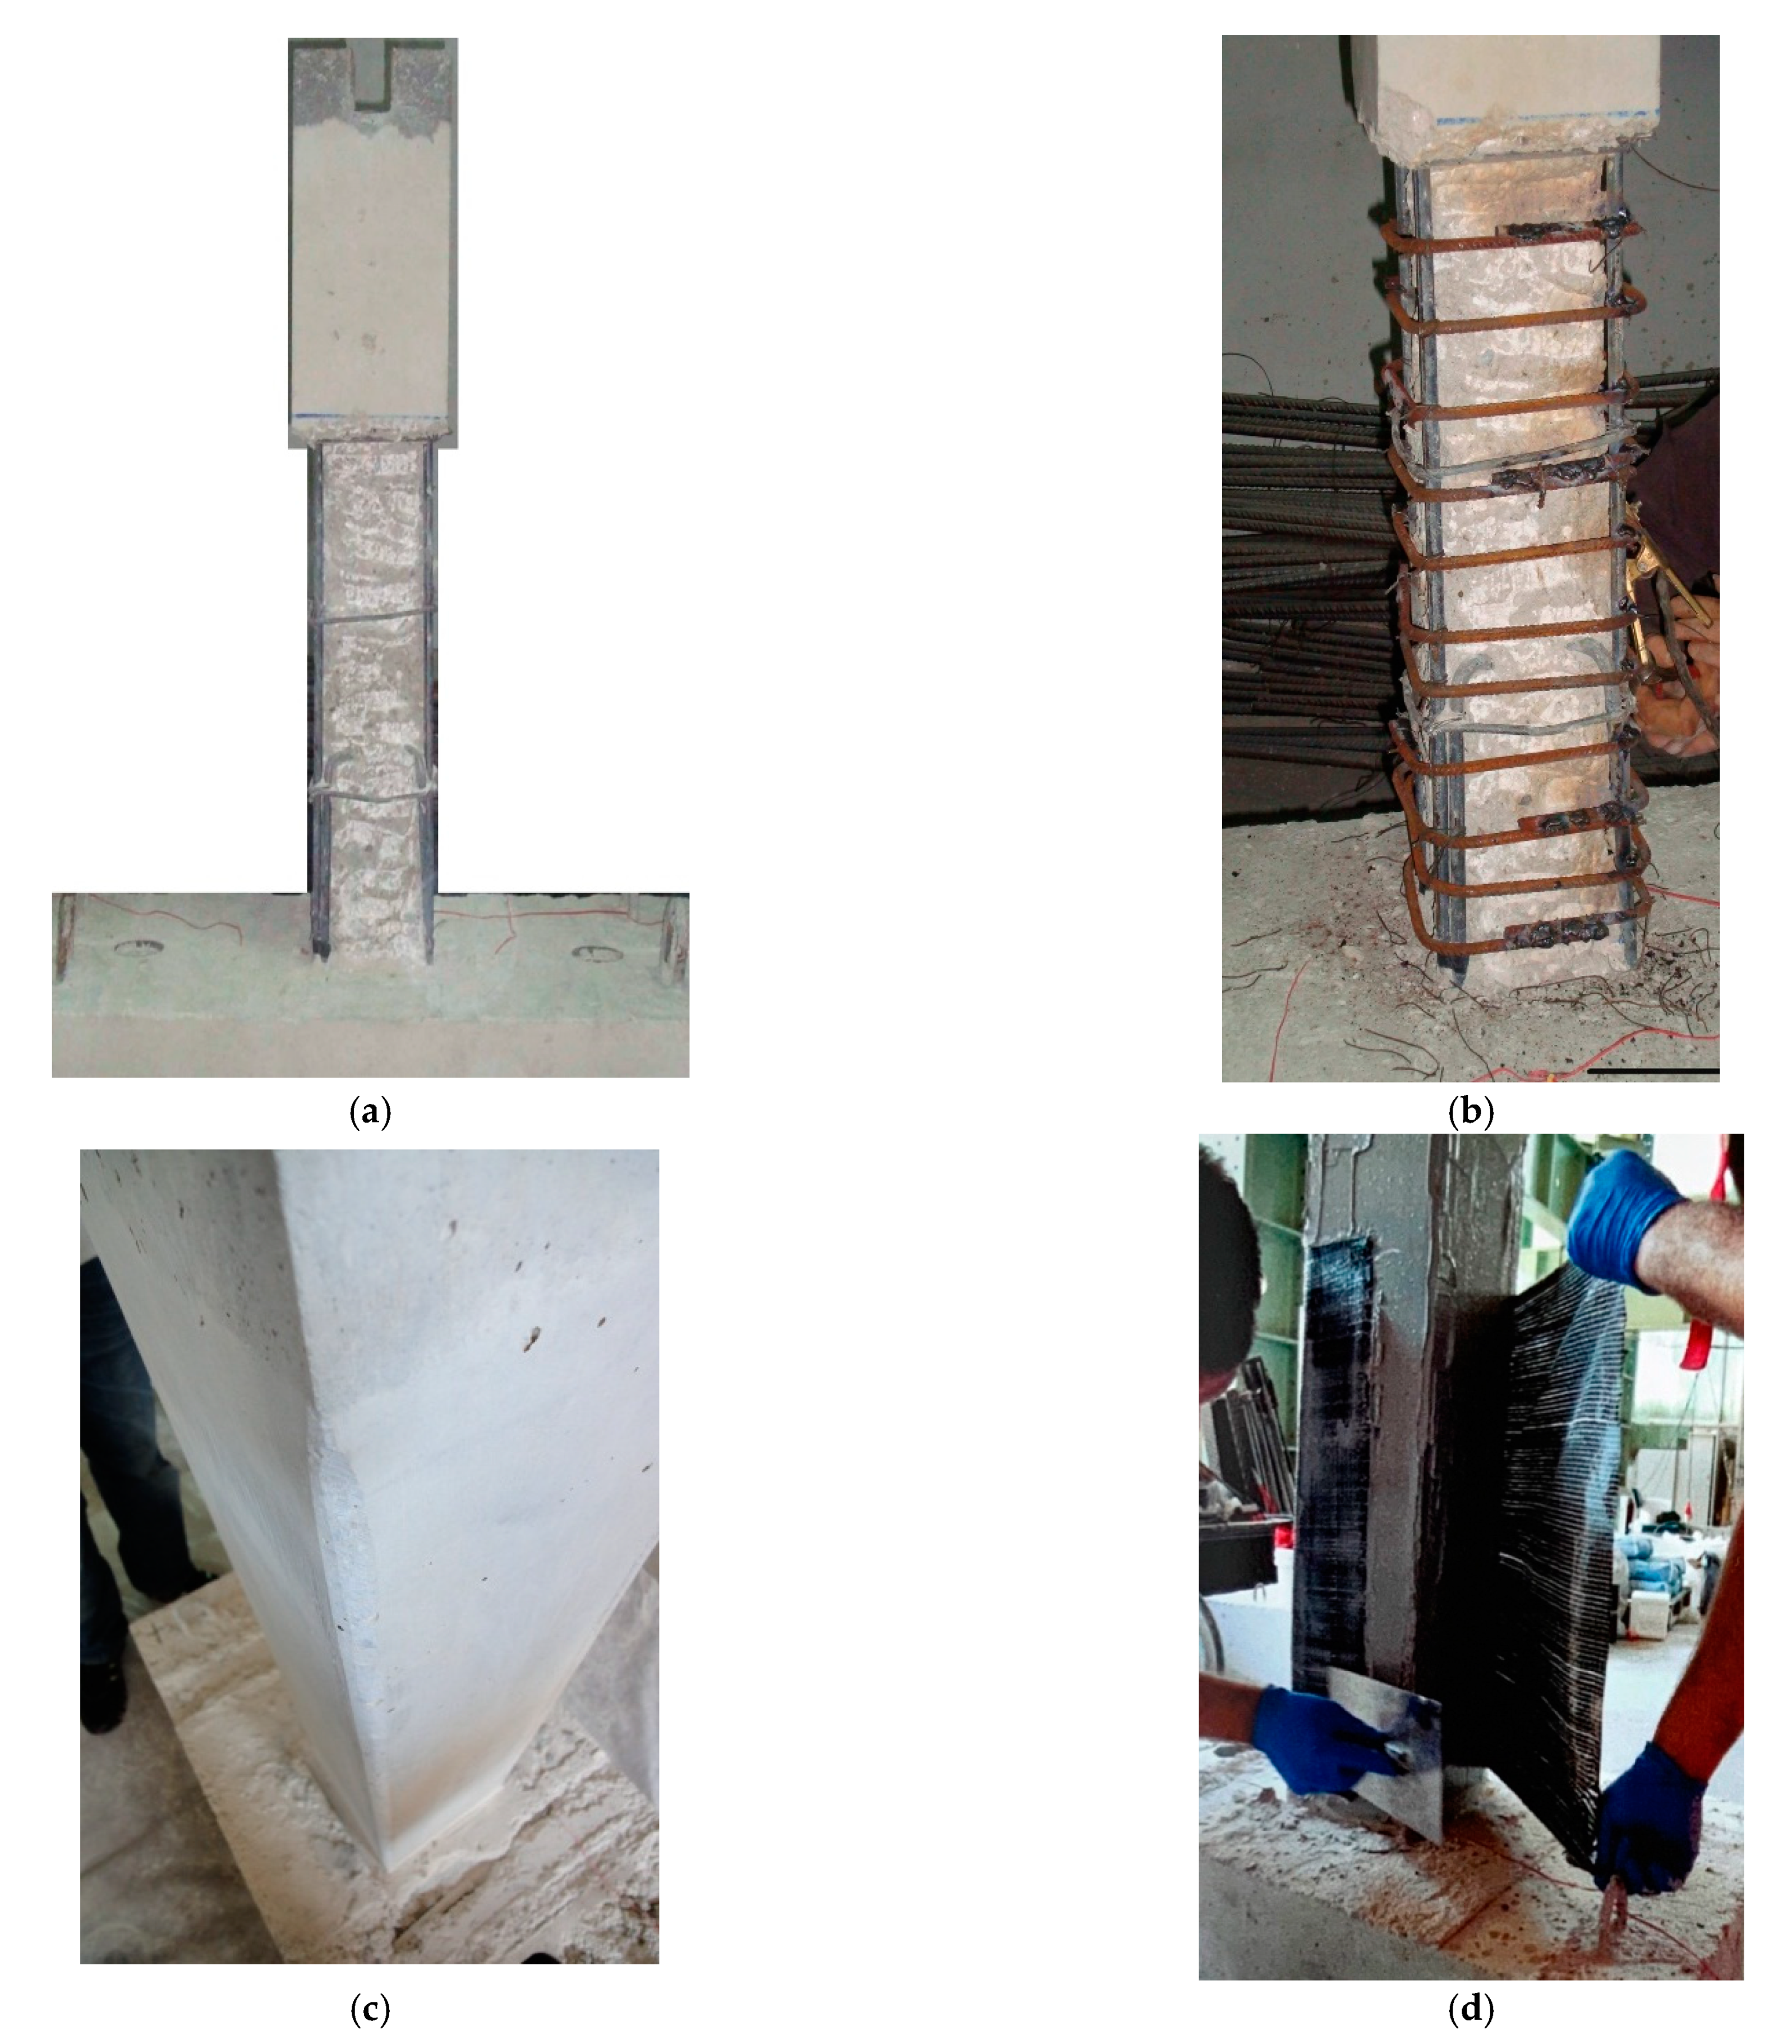
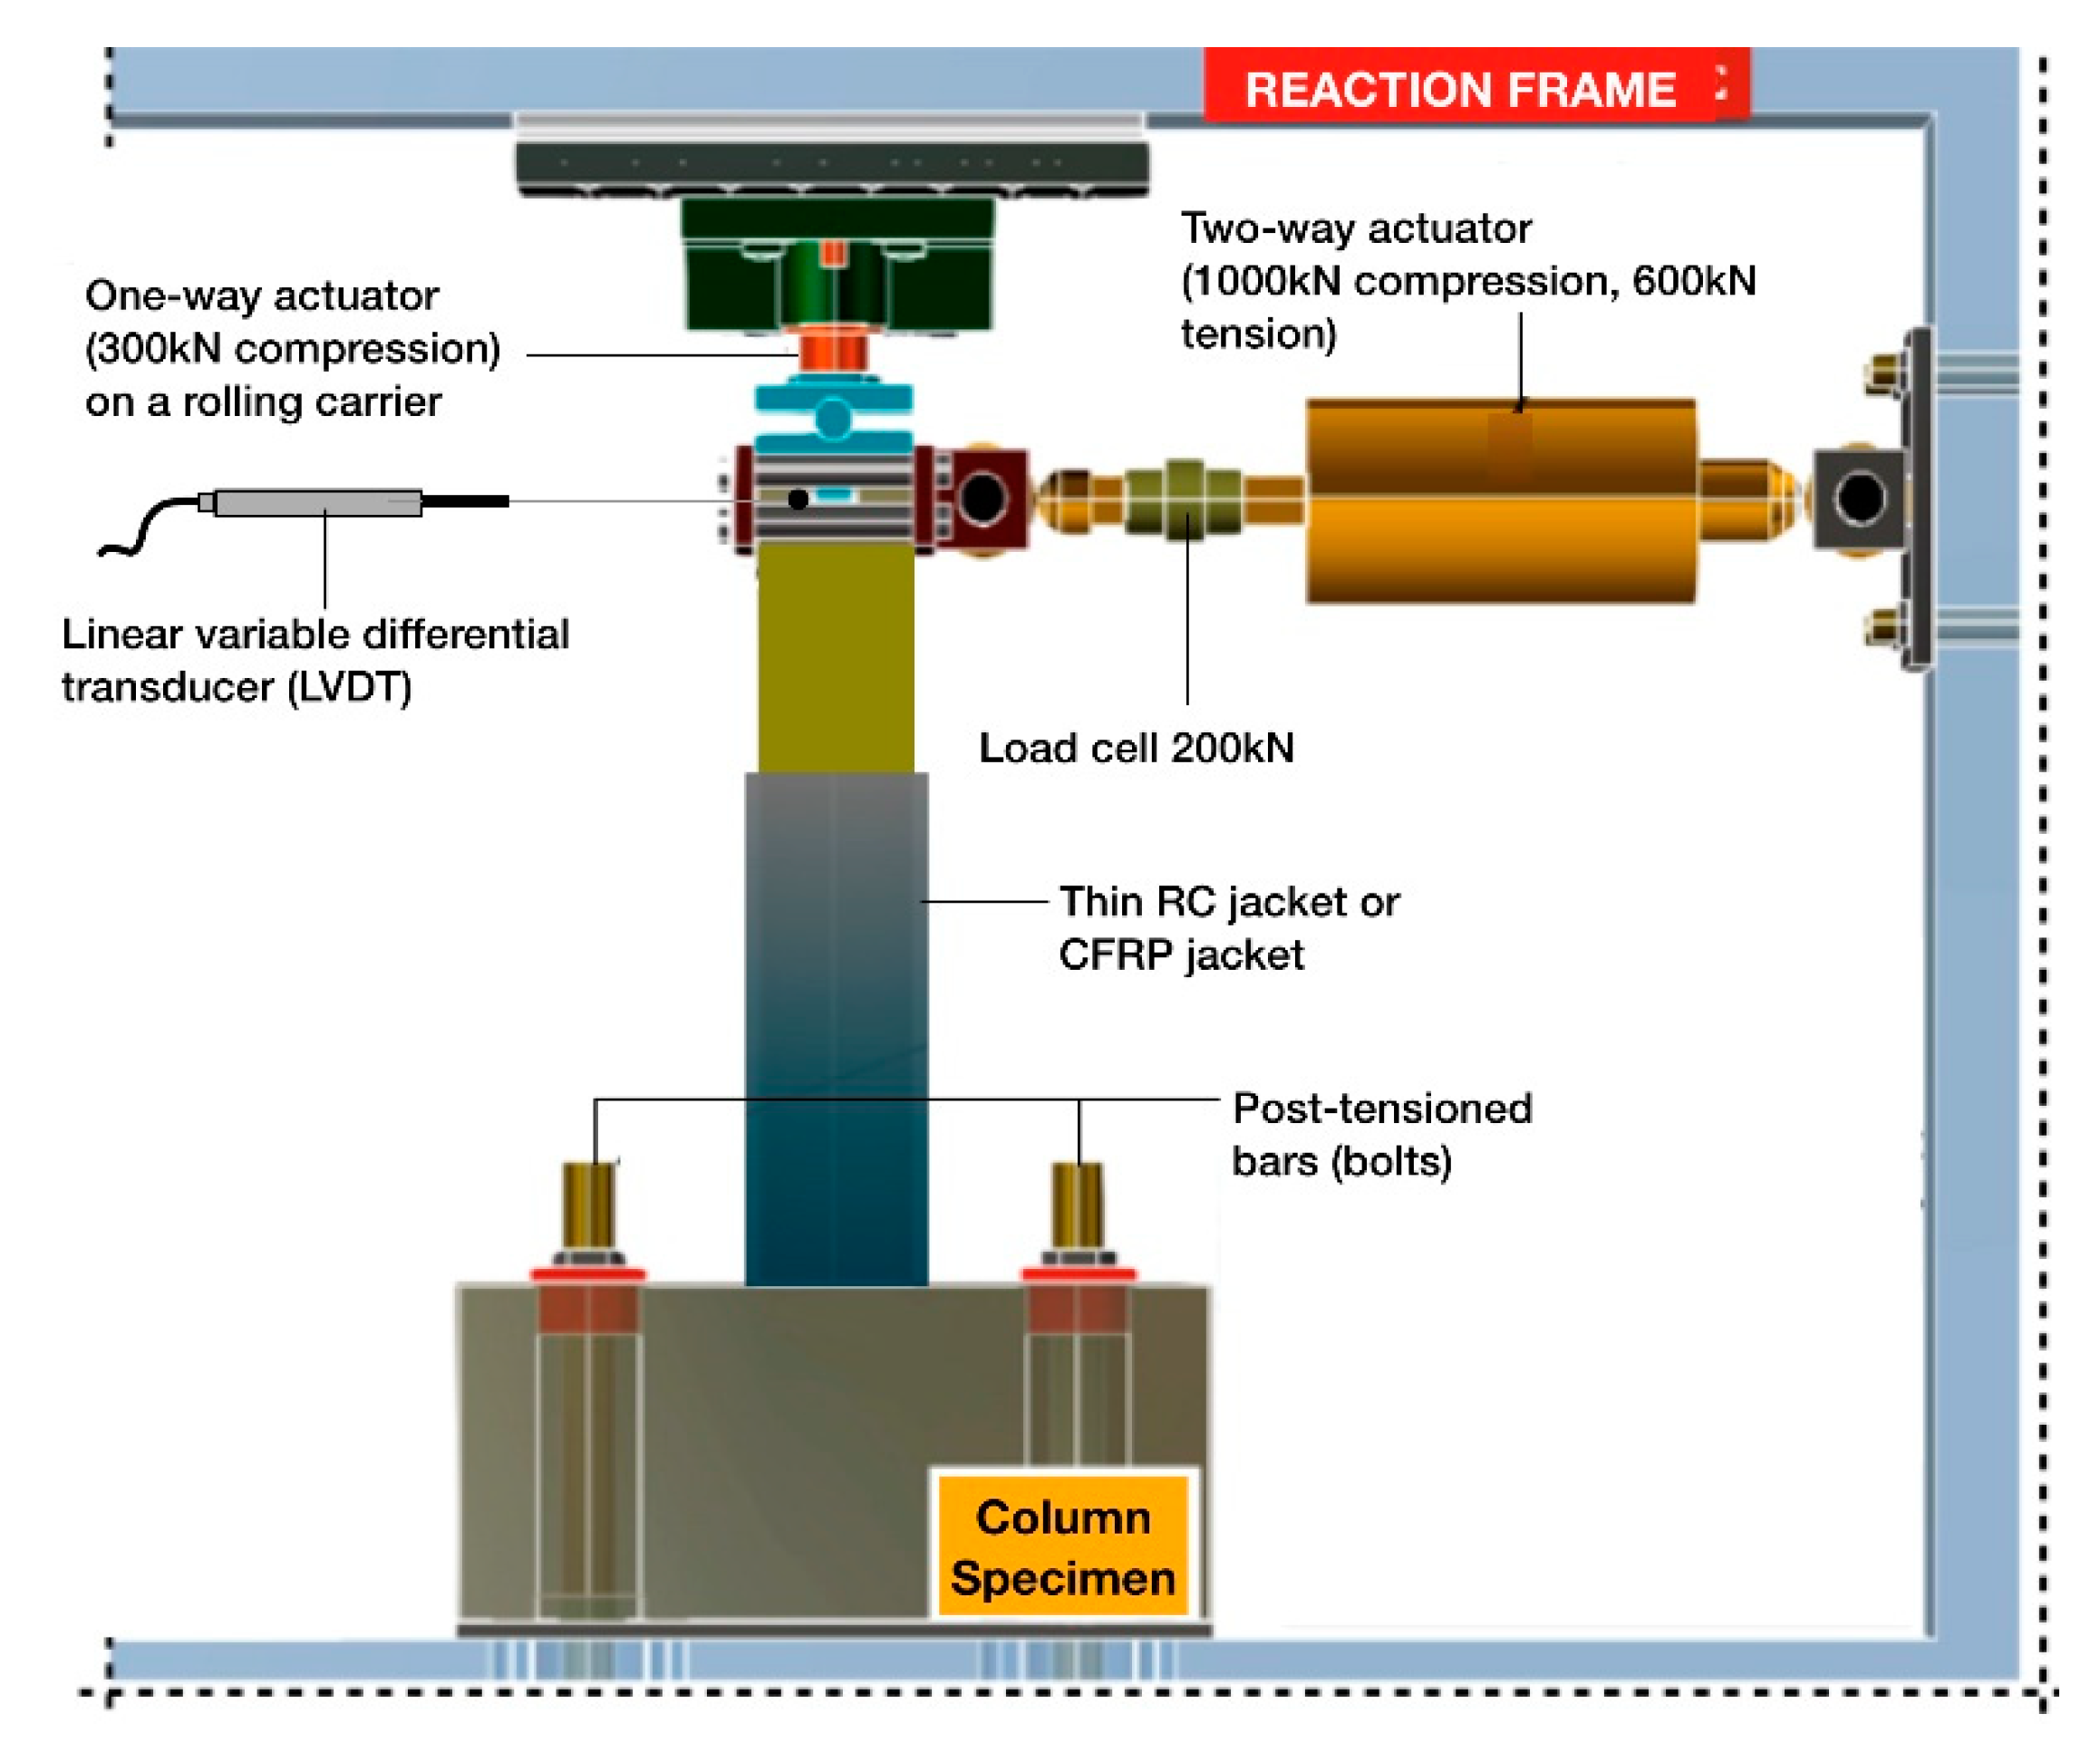
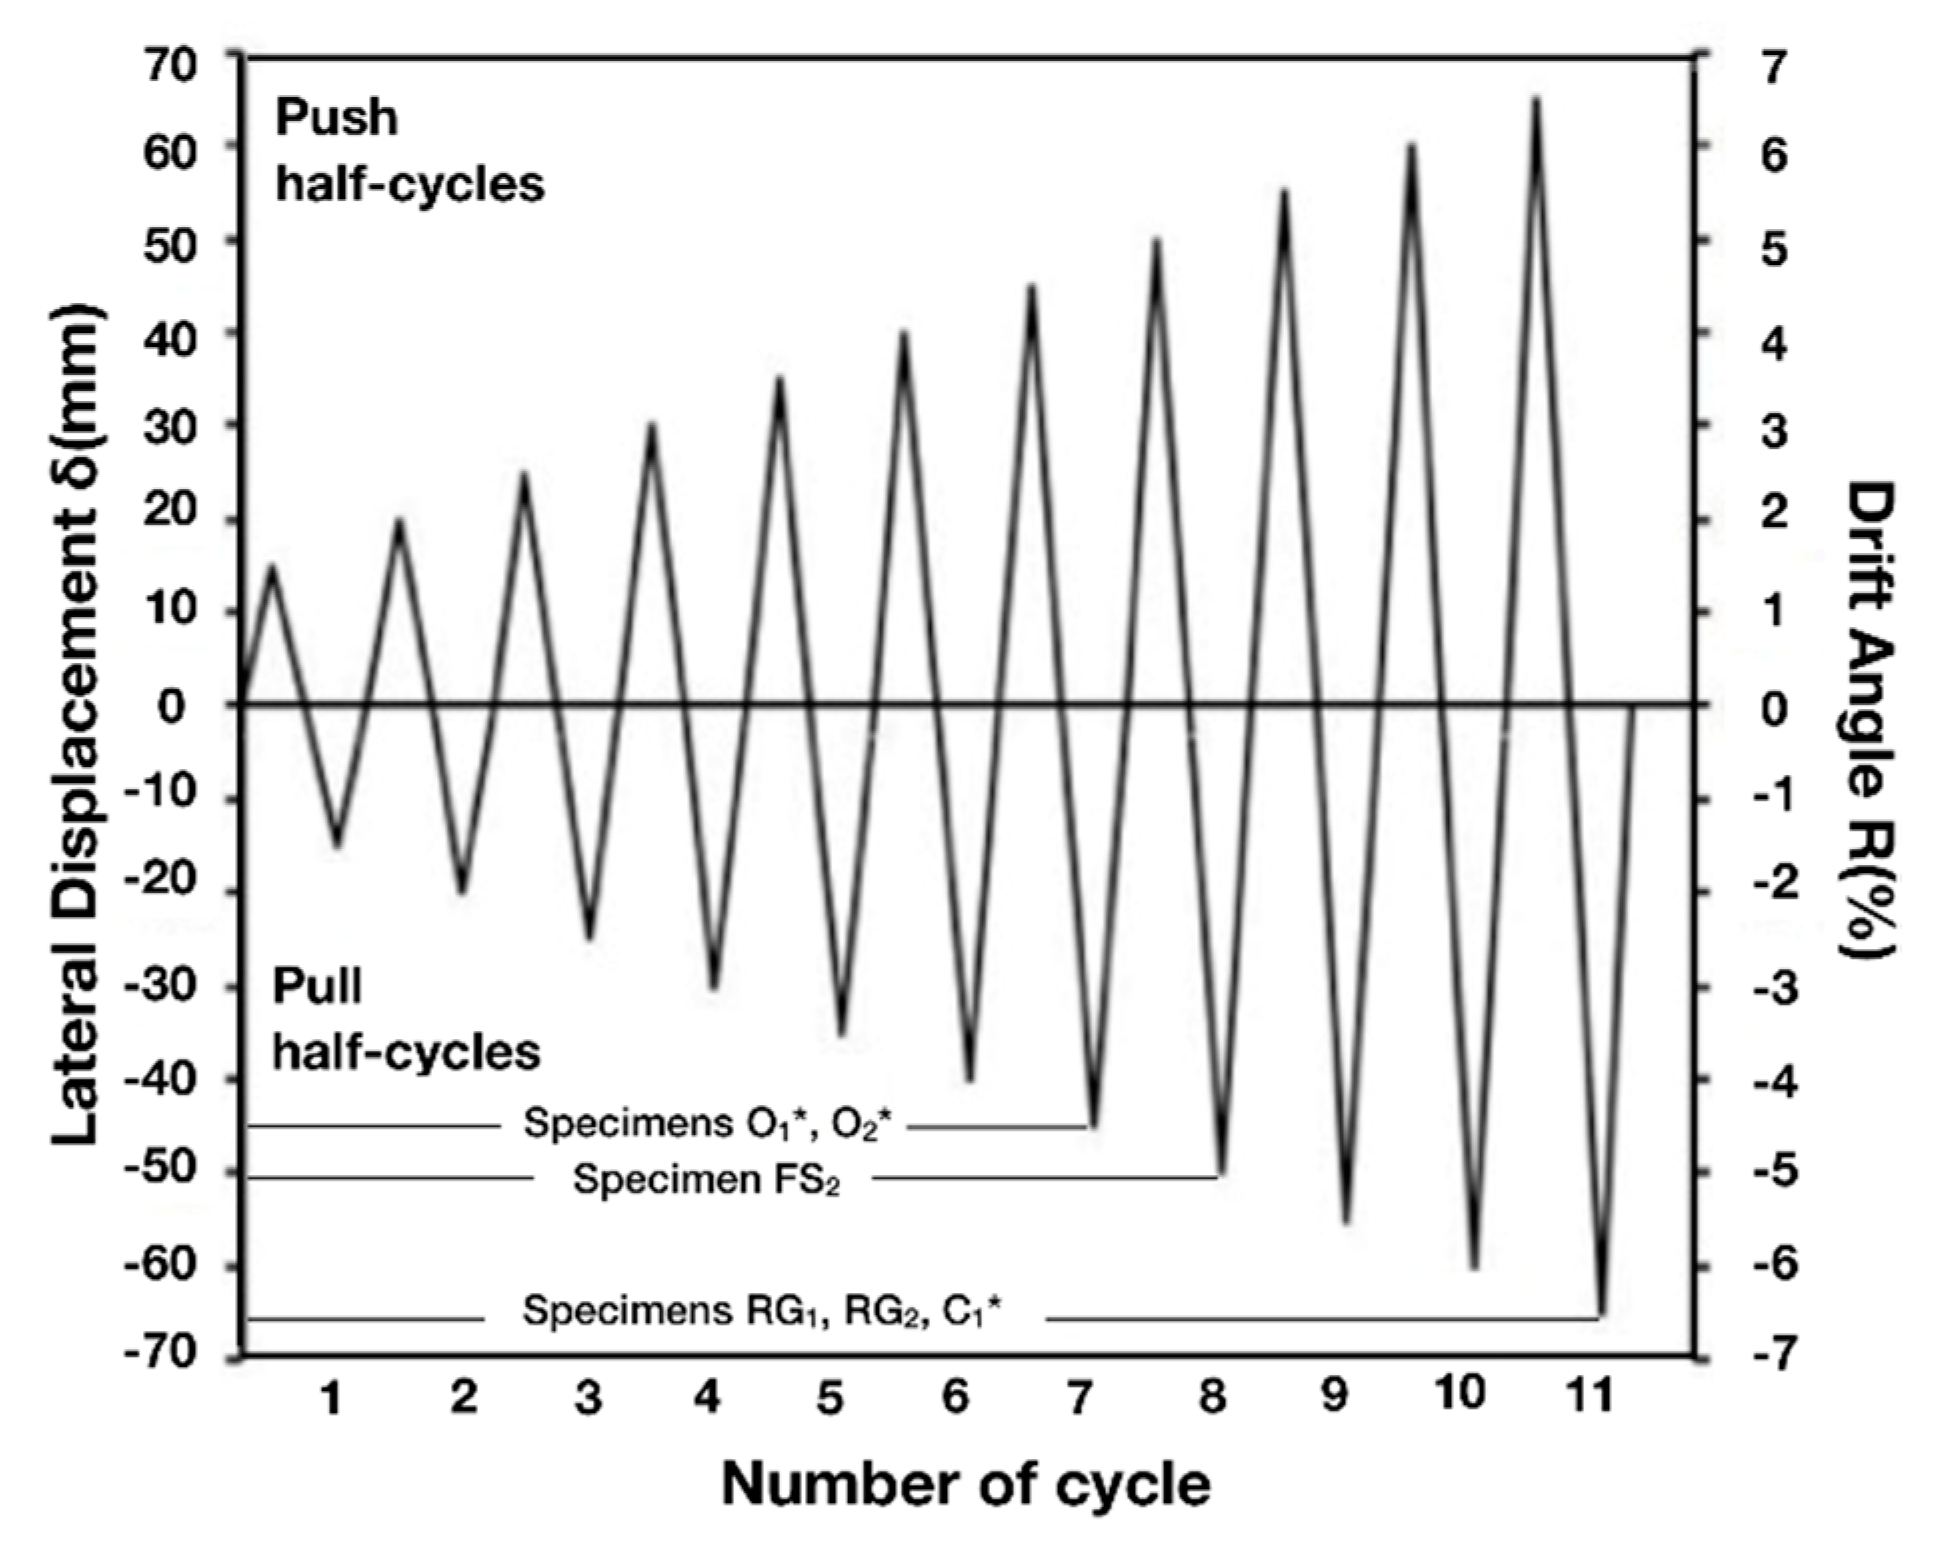
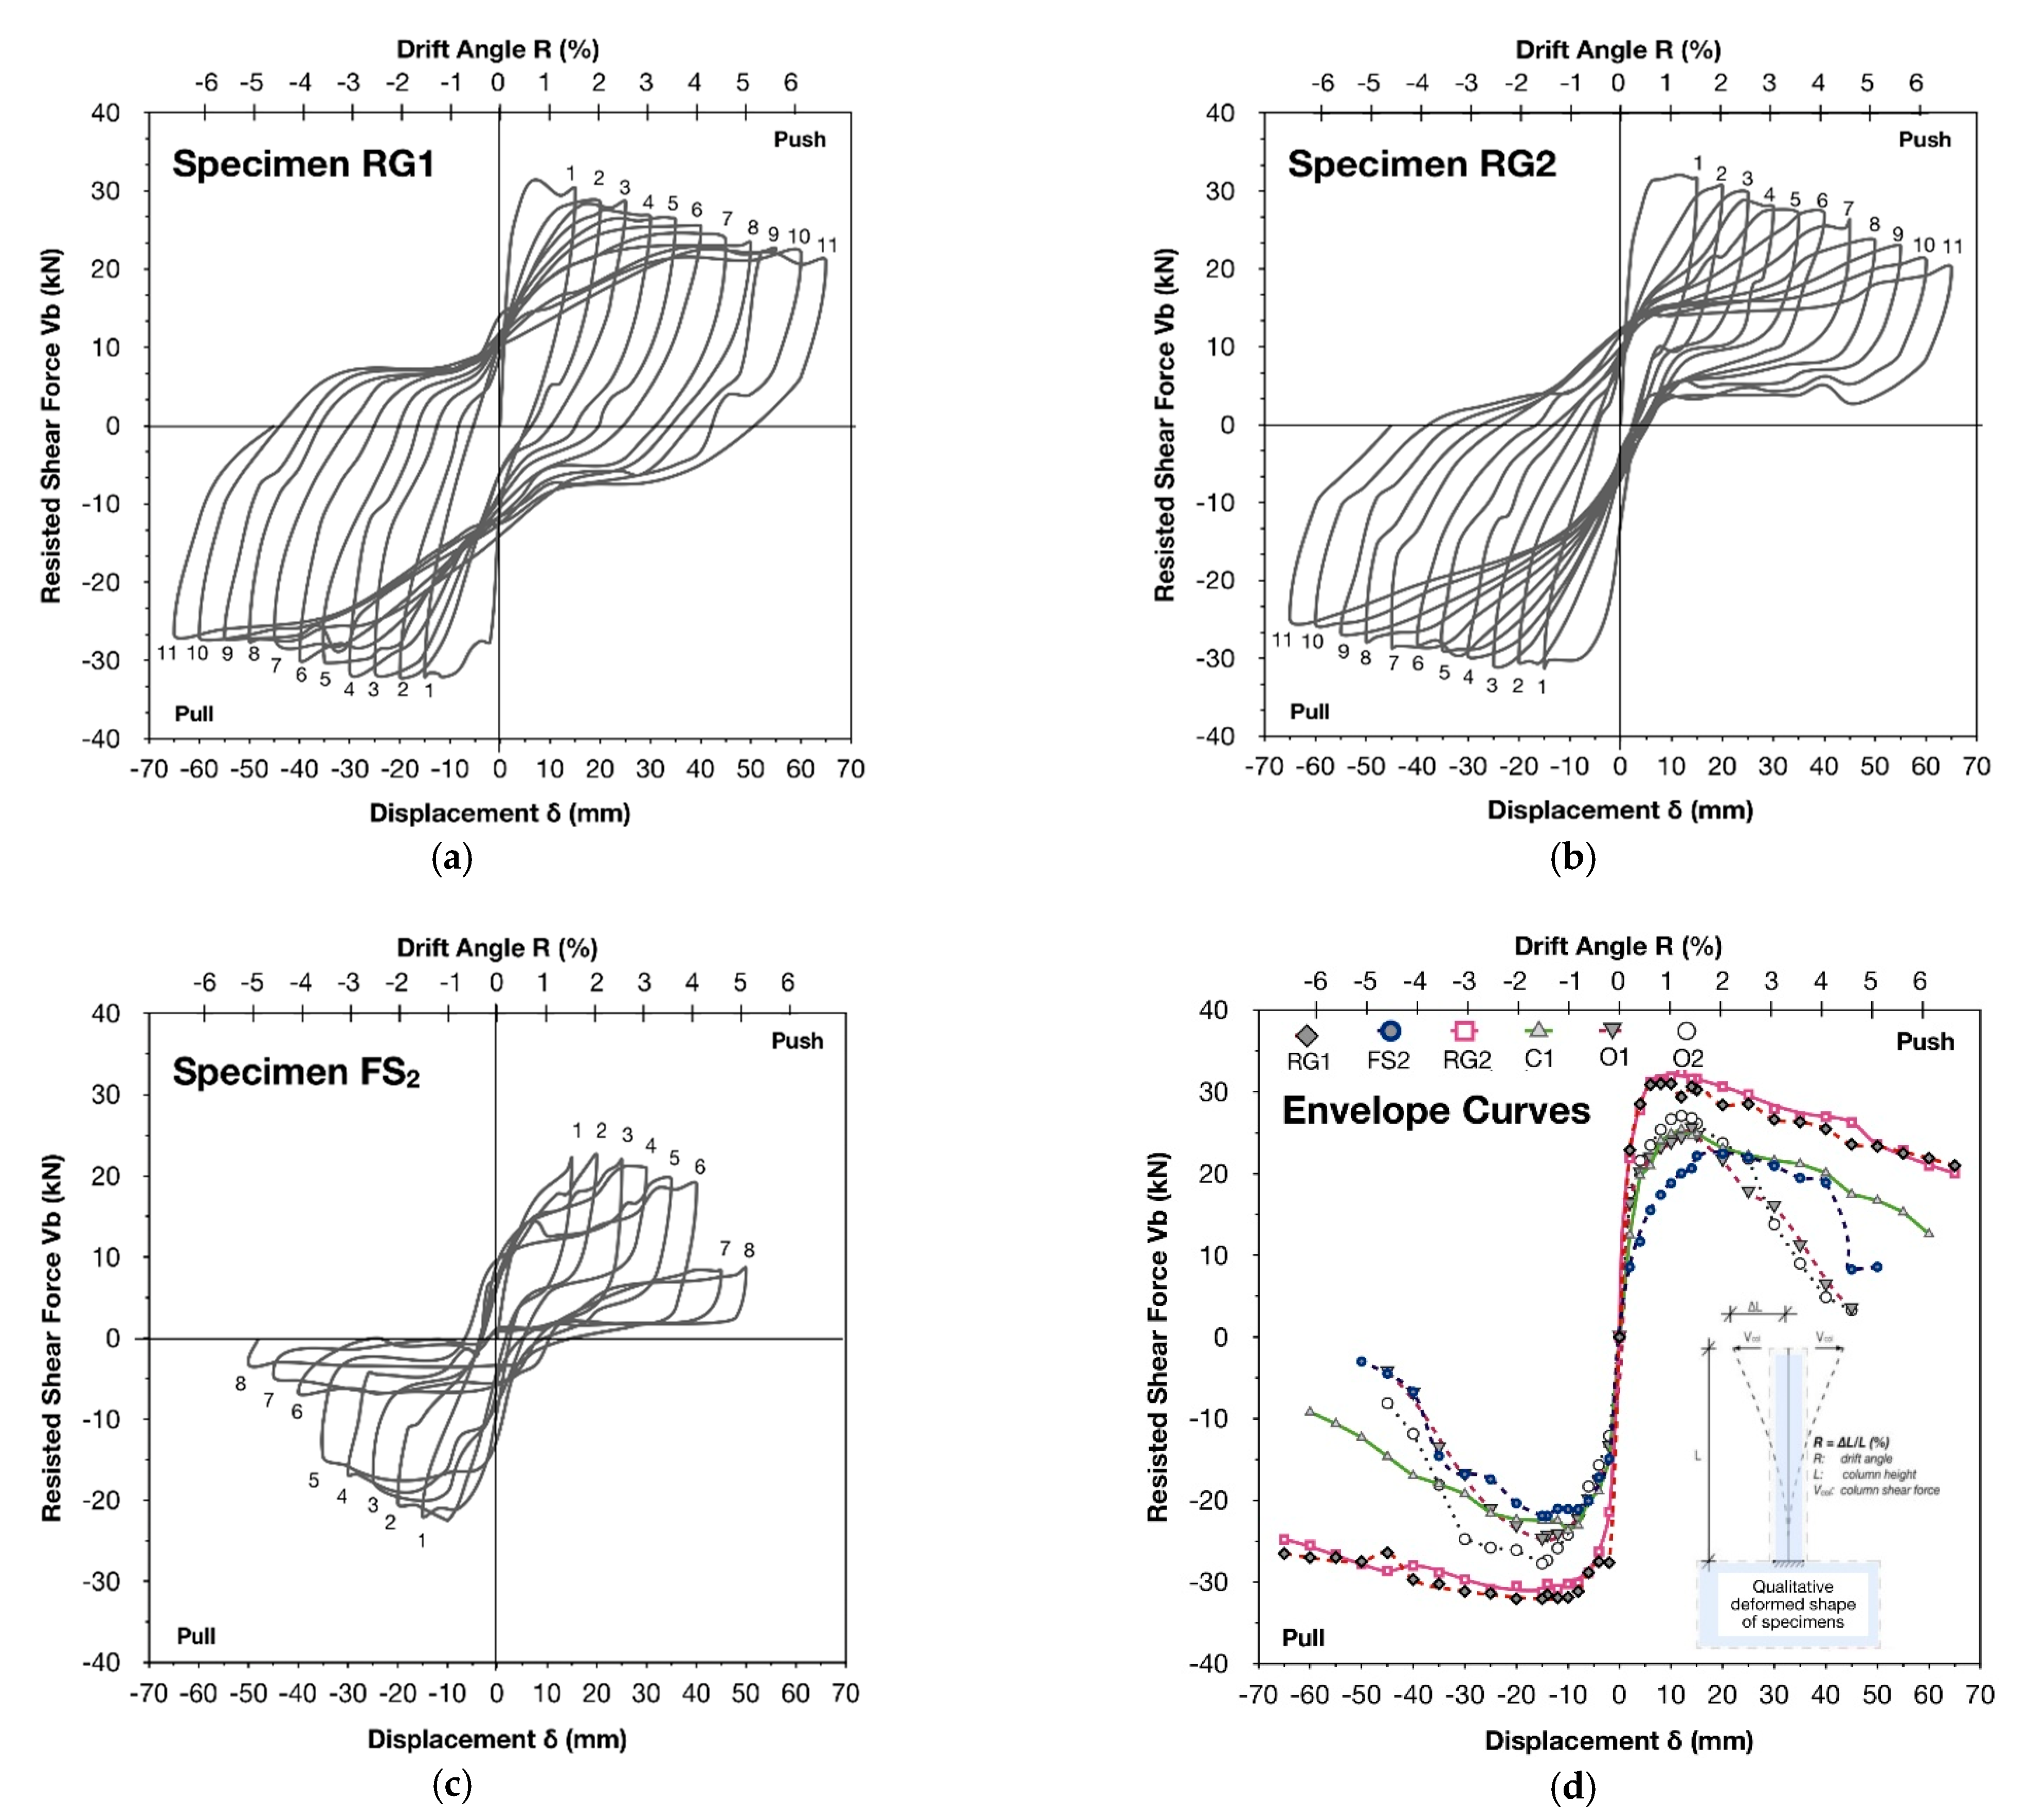



| Specimen | Lap Splice Length (mm) | CFRP Layers | Ties of Thin RC Jacket | Length of the Jacket (mm) | ||
|---|---|---|---|---|---|---|
| * C1 (control) | — | 10.25 | — | — | - | — |
| * O1 (original) | 200 | 9.81 | — | — | - | — |
| * O2 (original) | 240 | 8.80 | — | — | - | — |
| FS2 (strengthened) | 240 | 13.13 | 2 | — | - | max{lcr, 1.30•ls, 600 mm} = 600 |
| RG1 (strengthened) | 200 | 10.42 | — | 60 | Ø8/50 mm B500C | |
| RG2 (strengthened) | 240 | 9.72 | — | 60 | Ø8/50 mm B500C |
| Specimens | * C1 | * O1 | * O2 | FS2 | RG1 | RG2 |
|---|---|---|---|---|---|---|
| Longitudinal reinforcement | 4Ø10 mm plain steel bars (= 374 MPa) | |||||
| Transverse reinforcement | Ø6 mm ties (plain steel) with 90° hook-ends spaced at 200 mm (= 263.5 MPa) | |||||
| Reinforcement of the thin high-strength RC jacket | — | — | — | — | Ø8/50 mm | Ø8/50 mm |
| Column cross-section (mm) | 200 × 200 | 200 × 200 | 200 × 200 | 200 × 200 | 203 × 203 | 203 × 203 |
| CFRP Textile | Epoxy Resin (Two-Part) | ||
|---|---|---|---|
| Jacket height (mm) | 600 | Life-time in container (min) for +20 °C | 35 |
| Weight (g/m2) | 200 | Pasting-time (min) for +20 °C | 45 |
| Modulus of elasticity Efib (GPa) | 235 | Minimum temperature for hardening (°C) | 8 |
| Tensile strength Ffib (MPa) | 3800 | Modulus of elasticity Efib (GPa) | 2500 |
| Eu (%) | 1.5 | Tensile strength Ffib (MPa) | 44.6 |
| Nominal width of textile (mm) | 0.11 | Eu (%) | 1.7 |
| Specimen RG1 | Specimen RG2 | |
|---|---|---|
| (Mpa) | 10.42 | 9.73 |
| (MPa) | 60.00 | 60.00 |
| (Mpa) | 0.63 | 0.53 |
| (Mpa) | 1.25 | 1.25 |
| (Mpa) | 0.63 | 0.53 |
| (Mpa) | 4.88 | 4.11 |
| (Mpa) | 9.68 | 9.68 |
| (Mpa) | 4.88 | 4.11 |
| (Mpa) | 4.88 | 4.11 |
| 1.00 | 1.00 | |
| 0.50 | 0.43 |
Publisher’s Note: MDPI stays neutral with regard to jurisdictional claims in published maps and institutional affiliations. |
© 2021 by the authors. Licensee MDPI, Basel, Switzerland. This article is an open access article distributed under the terms and conditions of the Creative Commons Attribution (CC BY) license (https://creativecommons.org/licenses/by/4.0/).
Share and Cite
Kalogeropoulos, G.; Tsonos, A.-D. Seismic Performance Enhancement of RC Columns Using Thin High-Strength RC Jackets and CFRP Jackets. Fibers 2021, 9, 29. https://doi.org/10.3390/fib9050029
Kalogeropoulos G, Tsonos A-D. Seismic Performance Enhancement of RC Columns Using Thin High-Strength RC Jackets and CFRP Jackets. Fibers. 2021; 9(5):29. https://doi.org/10.3390/fib9050029
Chicago/Turabian StyleKalogeropoulos, George, and Alexander-Dimitrios Tsonos. 2021. "Seismic Performance Enhancement of RC Columns Using Thin High-Strength RC Jackets and CFRP Jackets" Fibers 9, no. 5: 29. https://doi.org/10.3390/fib9050029
APA StyleKalogeropoulos, G., & Tsonos, A.-D. (2021). Seismic Performance Enhancement of RC Columns Using Thin High-Strength RC Jackets and CFRP Jackets. Fibers, 9(5), 29. https://doi.org/10.3390/fib9050029


