1. Introduction
Natural fibers derived from plants can come from various parts of the plant such as stems, leaves, seeds, fruit, or roots. In general, the main components of natural fibers are cellulose, hemicellulose, and lignin. In addition, natural fibers can contain small amounts of pectin, wax, and extractives. The composition of cellulose, hemicellulose, and lignin play a major role in determining the properties of natural fibers. Furthermore, the degree of crystallinity of fibers also influences the mechanical and thermal characteristics of natural fibers [
1].
In recent decades, the utilization of natural fibers as components of composite materials has attracted many researchers around the world. The natural fibers act as reinforcing fillers for matrix materials, which are generally polymeric materials including thermoset such as epoxy, and thermoplastic such as polylactic acid (PLA). The use of natural fibers is an alternative for conventional fibers such as glass and carbon. The advantages of utilization of natural fibers include availability in nature, environmental friendliness, low cost, and low density [
2,
3,
4]. Many natural fibers from plants have been studied in developing composites such as leaf fibers (sisal and abaca), bast fibers (flax, jute, hemp, ramie, and kenaf), grass and reed fibers (rice husk), core fibers (hemp, jute, and kenaf), seed fibers (cotton, kapok, and coir), and other types, which may include wood and roots [
5]. The aim in developing natural fiber-based composites is to replace materials owing to similar properties [
6,
7,
8].
Natural fiber composite polymers have been extensively used in several fields. The application of natural fiber composite polymers depends on their properties, because a specific application normally needs specific physical, mechanical, electrical, and thermal properties. The following are six fields in which natural fiber composite polymers have been used, followed by examples of application for each field: (1) civil (fire-resistant concrete); (2) mechanical (gear pair); (3) automobile (body part); (4) aerospace (aircraft parts); (5) biomedical (dentistry and orthopedic); and (6) marine (marine propeller) [
8].
Aside from depending on the type and composition of its components, mechanical and thermal properties of natural fiber composite polymers are strongly correlated to their structures, which are influenced by procedures during preparation. One popular technique used in natural fiber composite polymers preparation is by compression, in order to make a dense composite. Microcavities often formed within the composite due to spaces between fibers that are not fully filled by adhesive. Several studies have been conducted to understand the relationship between mechanical properties and/or thermal properties with microstructures. Correlation between mechanical properties and microstructure allows for a study of failure evolution on carbon fiber reinforced polymer (CFRP) and epoxy resins by using scanning electron microscopy (SEM) [
9].
To use composite materials effectively, it is important to study the mechanism of damage for composite materials. Several studies on the mechanism of mechanical and thermal damage have been reported. Hua Wang et al. studied the relation of PLA/abutilon fiber composite fractures with SEM images. The SEM image showed some fibers were pulled out, showing a lack of interaction between PLA and fiber [
10]. Kai Zhang et. al. studied the interfacial adhesion between bamboo fibers and epoxy, using an SEM image. They used SEM to observe the surface of fibers after a pull-out test. It was reported that the interfacial bonding between bamboo fibers and epoxy matrix could be improved by using NaOH treated fiber [
11]. Koloor et al. conducted modeling and simulation of damage mechanism of composite related to their structures and the simulation results were compared with experimental results. It was reported that the single-layer FE model-based construction could predict the elastic-damage of the GFRP composite that was fabricated using the vacuum infusion process (VIP) method [
12]. Another study of damage mechanism concerns with the crack-jump phenomenon in carbon fiber reinforced polymer (CFRP) composite laminate materials [
13].
Natural fiber polymer composites experience degradation at elevated temperatures. Basically, thermal damages of composite materials are the thermal damages of the composite components. Because of the main component of the natural fiber polymer composites is natural fibers, the thermal damage of the natural fiber-based composites mainly reflects the damage of natural fibers. As mentioned earlier, the main components of natural fibers are hemicellulose, cellulose, and lignin. Generally, natural fiber degradation occurs in four stages. The first stage is water loss and low-molecular-weight components degradation from 50 to 150 °C for the water that is not chemically bound into the fiber, and thermal dehydration (150 to 240 °C) for moisture found in the fiber. The second stage is related to hemicellulose degradation from 200 to 350 °C. The third stage is related to cellulose degradation (usually between 320 and 400 °C), and the fourth stage is related to lignin degradation, but lignin degradation may occur in a wide range of temperatures, from 100 to 900 °C [
1]. In addition, natural fiber-based composites damage is also affected by matrix damage, which depends on the type of matrix.
Thermal analysis of materials can be carried out in several characterizations including TG (Thermogravimetric), which measures mass reduction and DTA/DSC (Differential Thermal Analysis/Differential Scanning Calorimetry) which measures the heat capacity of the sample under heating. TG analysis uses mass reduction and derivative TG (DTG) curves. Using DTG, the inflection points of decreasing of TG curves are easier to see because they are shown as peaks in DTG curves. DTA and DSC measurement gives the same physical quantity data, namely heat capacity. In DSC analysis, the instrument records the amount of heat given to the reference pan by maintaining the similarity in temperature between the reference and the sample. In DTA analysis, the instrument measures the temperature difference between the sample and the reference. TG and DSC/DTA analysis are used to probe physical or chemical processes that occur in the sample. TG curves show processes that are accompanied by mass reduction such as evaporation or chemical reactions, whereas DSC/DTA curves depict endothermic or exothermic processes. DSC/TGA analysis also can show glass transition, i.e., the change of rigidity, from rigid to be more flexible. This study deals with sago fiber-epoxy composites. The sago fiber was obtained from Papua Indonesia, where the local people consume sago flour as their main food [
14]. The use of sago fiber in the manufacture of composite materials has been studied for certain purposes, for example as a nanofiber hydrogel for a methylene blue drug carrier [
15]. Other researchers examined the mechanical properties of composites made from sago pulp fiber waste with gypsum as a matrix [
16]. Furthermore, another sago tree product, sago starch, has been studied as a basic material for biodegradable films which was aimed to produce biodegradable films for food safety [
17].
Although several studies of sago-based composites have been reported, there are not many studies on the thermal properties of sago fiber-based composites. This paper mainly reports the study results on the thermal properties of sago fiber-epoxy composite and its constituent materials. The thermal characterization was carried out using TG/DTA measurement which allows investigating events and damage at elevated temperatures. Other observations also have been carried out, i.e., observation on the microstructure of the materials by using SEM.
2. Materials and Methods
In this study, the sago fiber—epoxy composites containing several adhesive contents: 9%, 13%, 17%, 20% and 23% w/w were made. The sago fibers were obtained from sago waste from Merauke Papua, Indonesia, and the epoxy resin was purchased from Brataco, the local Chemical supplier. The sago waste was washed and dried before then the coarse sago fibers were collected. The sago fibers were cut to a size of about 0.8 cm prior to being added to the epoxy resin-hardener (1:1 weight) mixture. A small amount of water was added to increase homogeneity. The mixture of sago fiber-epoxy was then hot pressed (100 °C/10 kgf cm−2) for 1 h, followed by cold-pressed (ambient/10 kgf cm−2) for 48 h. The as-prepared composites were left at room temperature for one week.
Thermal and SEM characterization were conducted for the following samples: cleaned and dry sago fiber, epoxy resin, and sago fiber-epoxy composites. The epoxy resin was prepared by the same procedure as sago fiber-epoxy composite. A mixture of epoxy resin and hardener was initially hot pressed (100 °C/10 kgf cm
−2) for 1 h, followed by cold-pressed (ambient/10 kgf cm
−2) for 48 h and then it was left at room temperature for one week. The samples are named in
Table 1.
Microstructure observations were carried out using a scanning electron microscope (SEM) Hitachi SU3500 with an operating voltage of 5 kV, at Research Center for Nanoscience and Nanotechnology, Bandung Institute of Technology. Before SEM observation, samples were coated with gold (Au) using a Hitachi MC1000 sputtering machine at 10 mA for 30 s. The gold coating is necessary to reduce the charging effect that usually occurs during SEM observation of the low conductivity sample.
Thermal analysis was carried out using the Hitachi STA 7300 instrument at Nanoscience and Nanotechnology Research Center, Institut Teknologi Bandung. The Hitachi STA 7300 instrument is equipped with software to determine features such as a starting point, peak point, etc. A small amount of sample (~5 mg) was heated from room temperature (around 20 °C) to 400 °C with a heating rate of 10 °C/min under nitrogen atmosphere. TG measurements give the TG curve (mass reduction in percent) and DTG (first derivative of the TG curve, in percent/°C). DTA curves express heat capacity in mW/mg. In addition, the moisture content of the composite was also measured. A mass of the composites having a dimension of (5 cm × 5 cm), was measured at before and after completely drying in an oven at 104 °C. The measurement was conducted three times for each epoxy concentration.
3. Results and Discussion
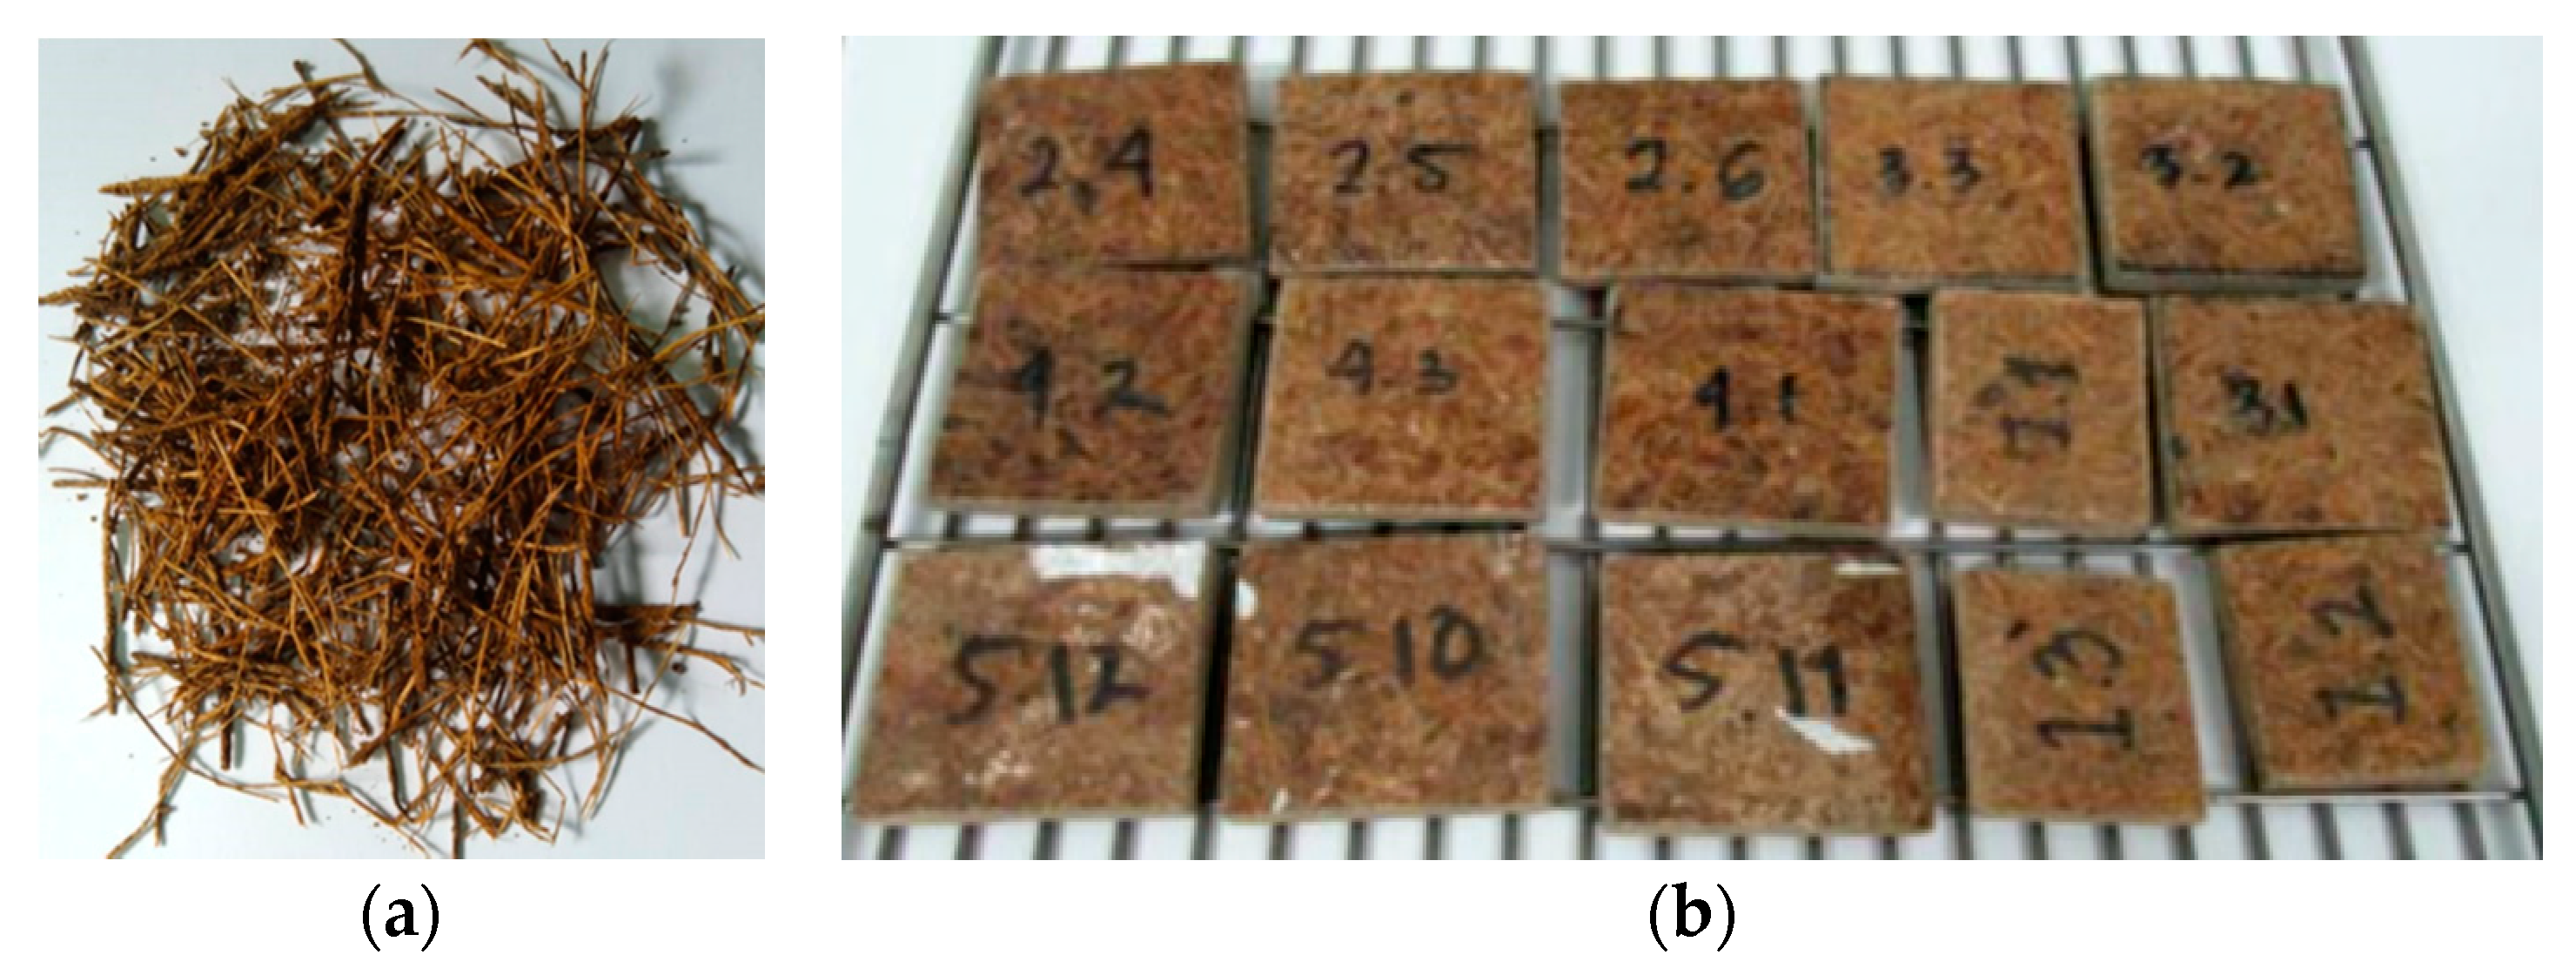
Figure 1 shows sago fibers that have been cleaned and dried (
Figure 1a) and the prepared sago fiber-epoxy composites (
Figure 1b). The sago fibers are brown in color and have non-uniform sizes. The figure also shows that some sago fibers are grouped and sometimes form small bulges. The composites are dark brown in color, with random short lines of sago fiber on their surface.
3.1. Microstructure
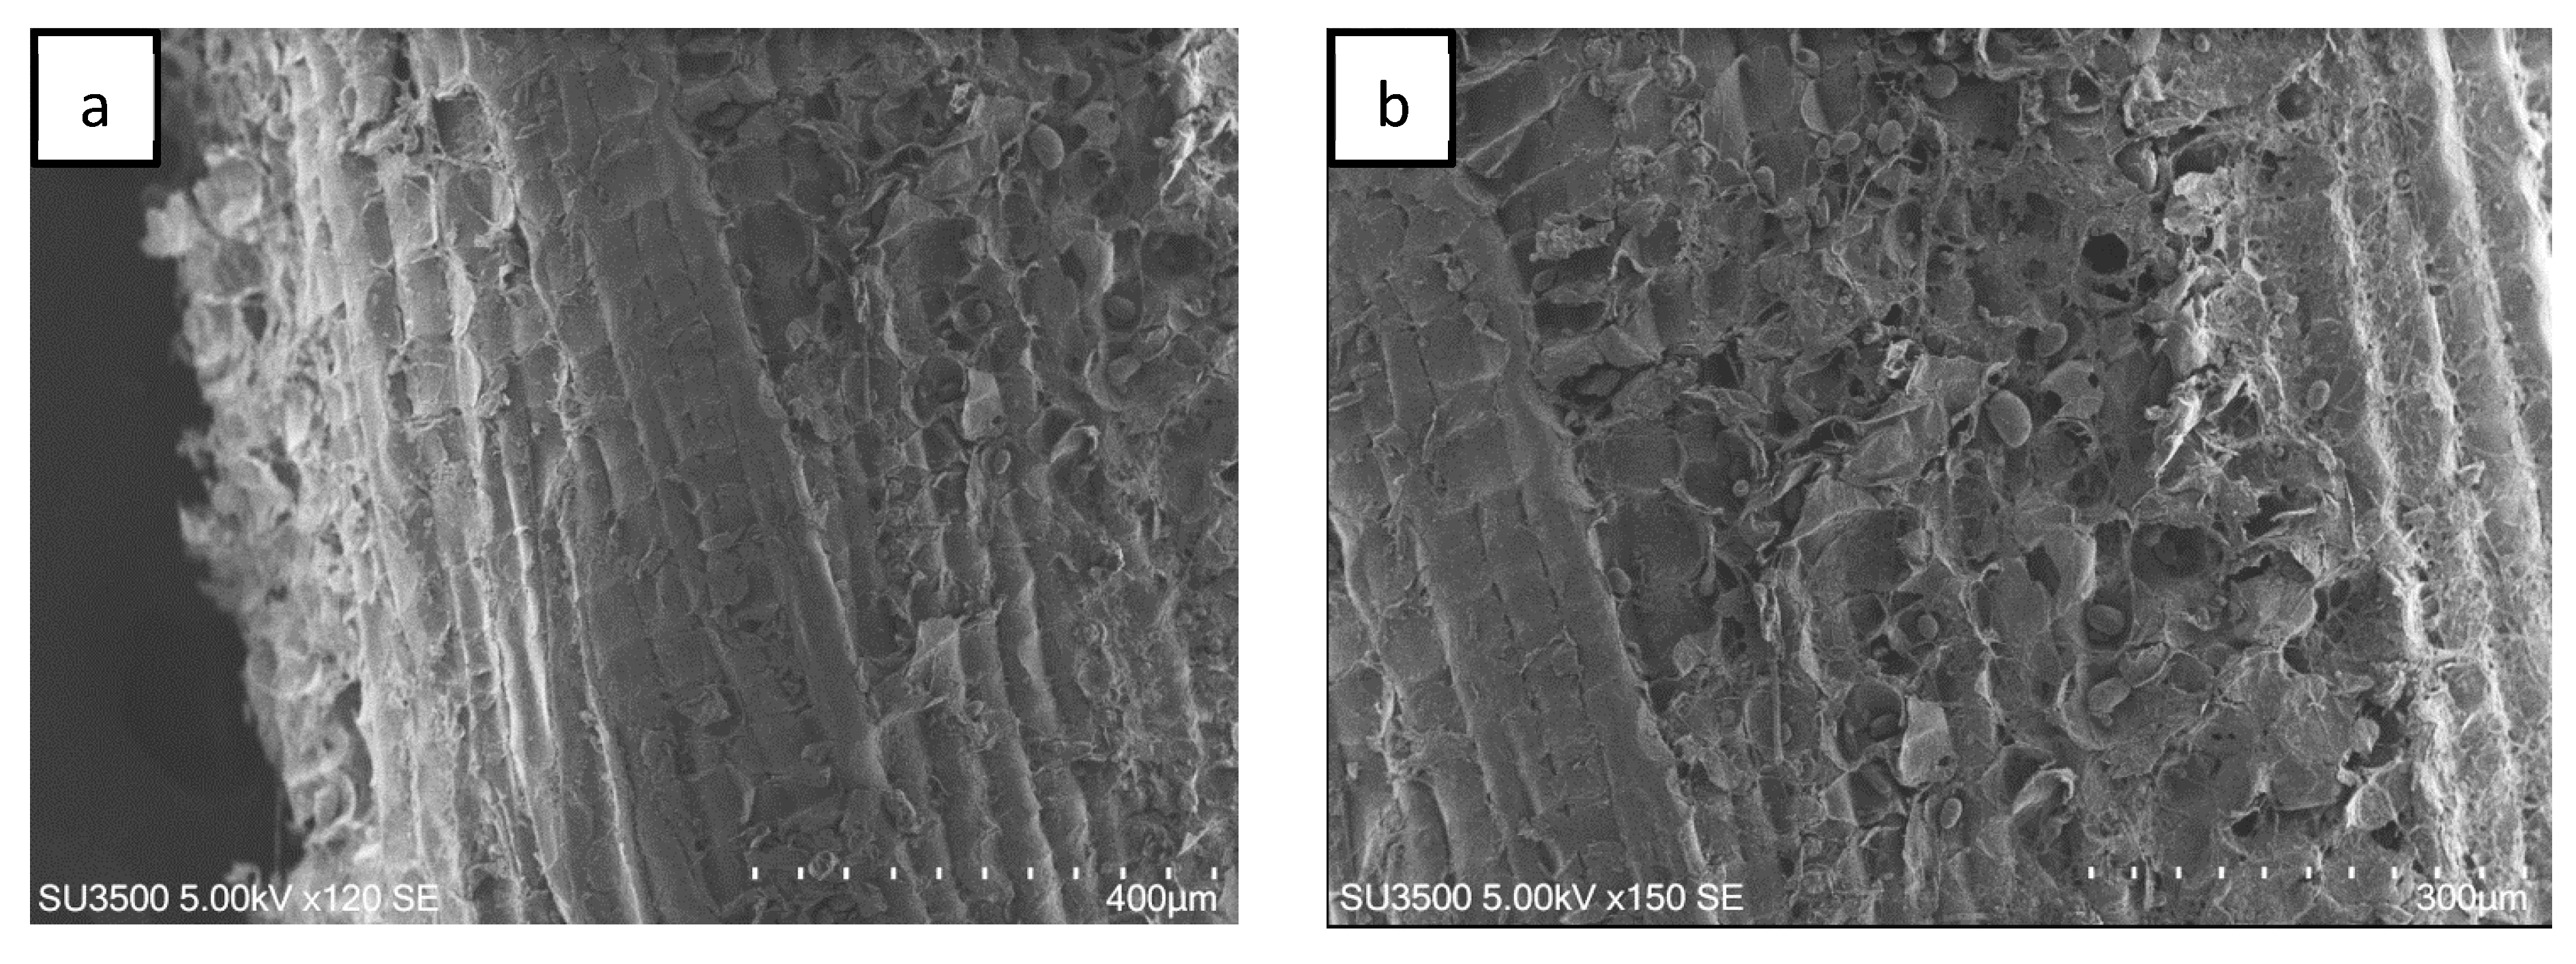
The SEM image of sago fiber is shown in
Figure 2. The surface of sago fiber is not smooth (
Figure 2a). Several fibers may combine to form a bundle of fiber, which is why the fiber has varied diameters. There are fine fibers around the fibers (
Figure 2b). Sago fiber also contains small granules which may represent the remaining sago starch. The presence of sago starch in the fiber is most likely the residual sago starch in the fiber associated with the fiber preparation process, where sago waste was cleaned from sago starch and then dried.
In general, botanical tissue has a complex cell structure. For example, the structure of the henequen cell walls is a rigid multi-layered structure composed of the middle lamella, a primary (P), and a secondary wall (S) that contains cellulose, hemicellulose, and lignin. Lignin and hemicellulose are mainly distributed the middle lamella and primary; and between the lignin and cellulose, respectively [
18].
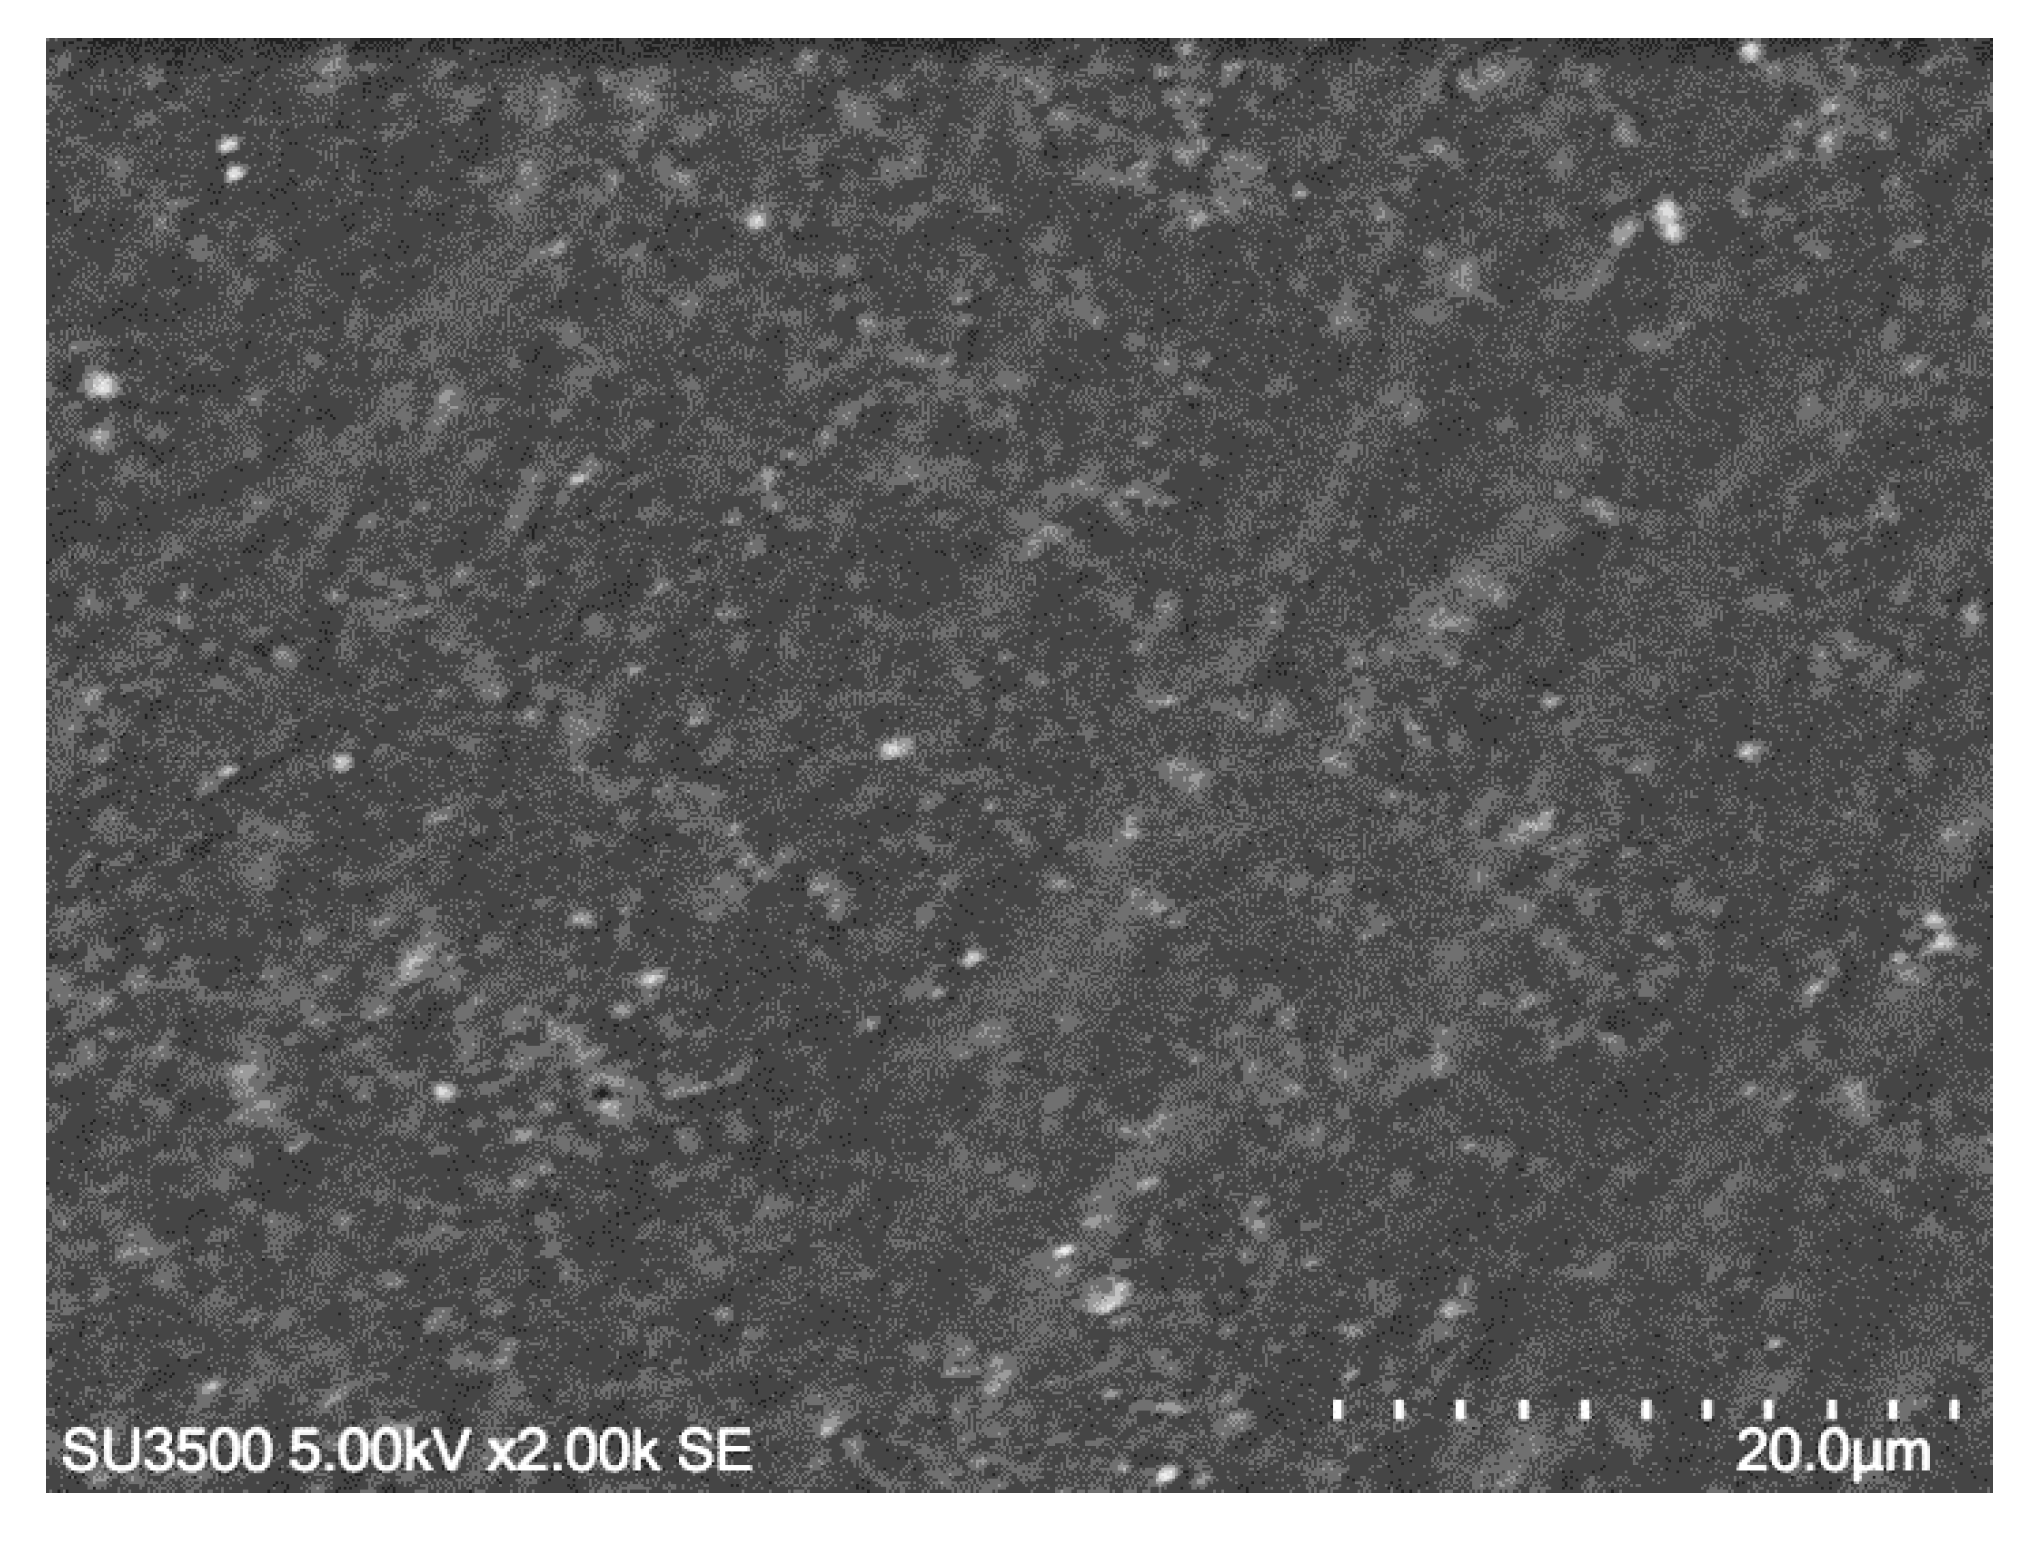
Figure 3 depicts that the epoxy contains small bubbles of trapped air. This might correlate to the preparation process of epoxy. Initially, both the epoxy resin and the hardener are thick fluid, so it is not easy to mix them together to make a homogeneous mixture. During the mixing process, the air can be trapped and remains in the mixture until the mixture was pressed. Some patterned lines in
Figure 3 might be formed by the mold surface during pressing.
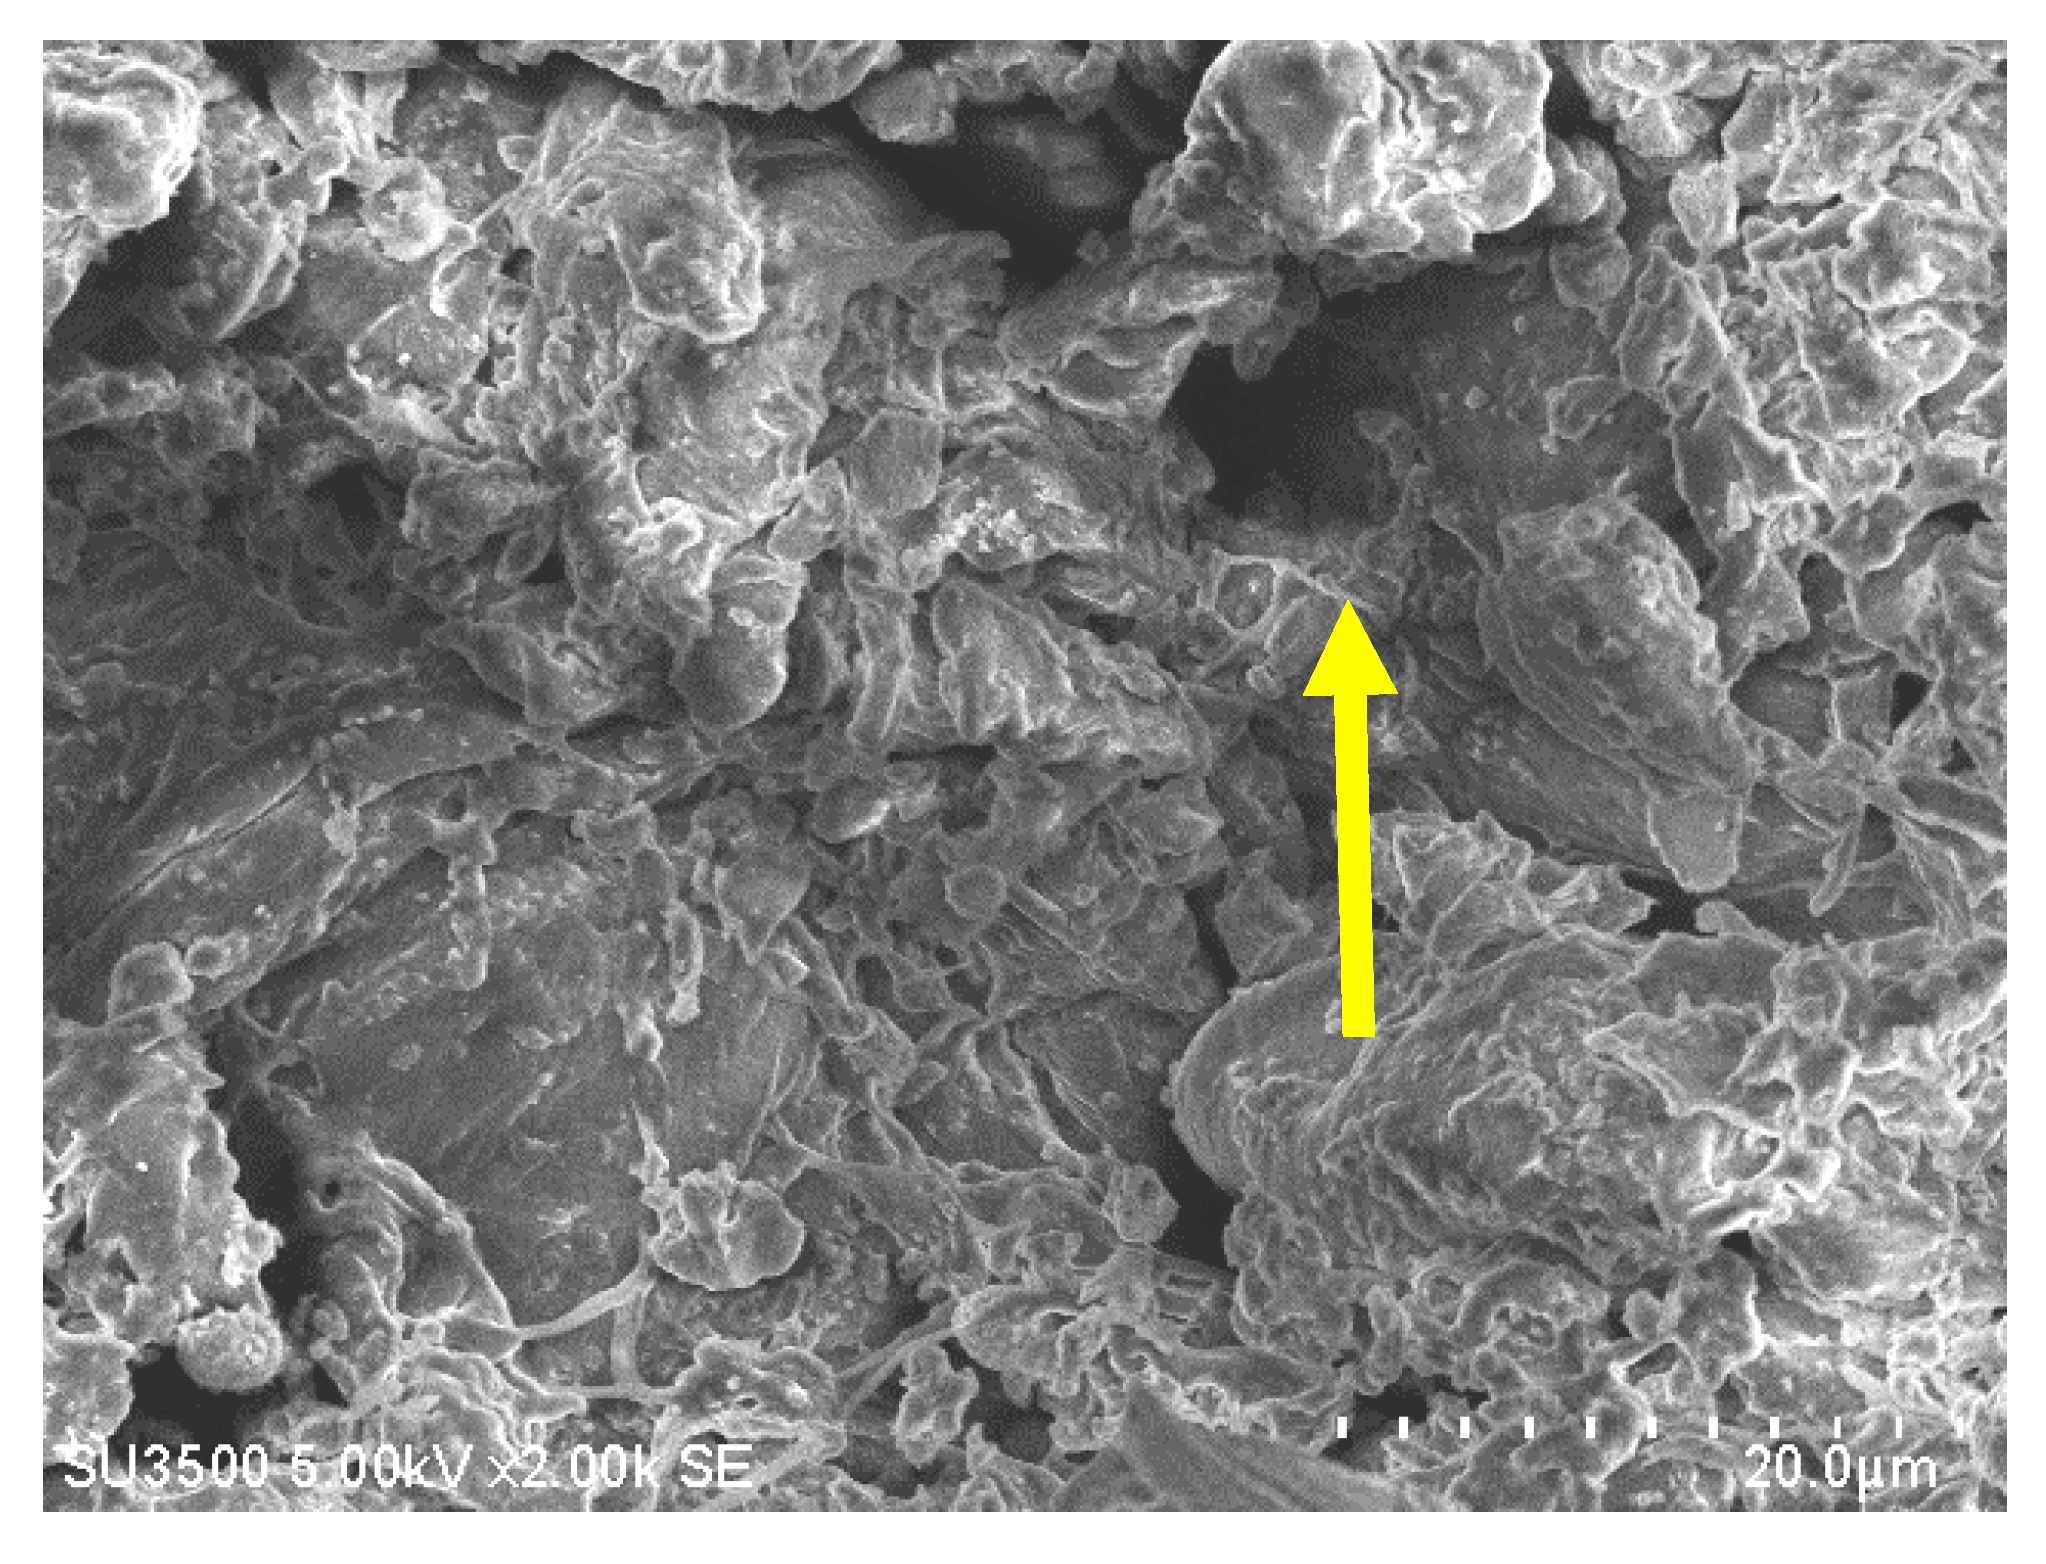
A typical SEM image of a sago fiber-epoxy composite is shown in
Figure 4, taken from E9. The sago fiber is covered with epoxy resin due to good mixing between sago fiber and epoxy. But the image also depicts voids as shown by the yellow arrow. This illustrates that the epoxy resin does not fully fill the space in the composite.
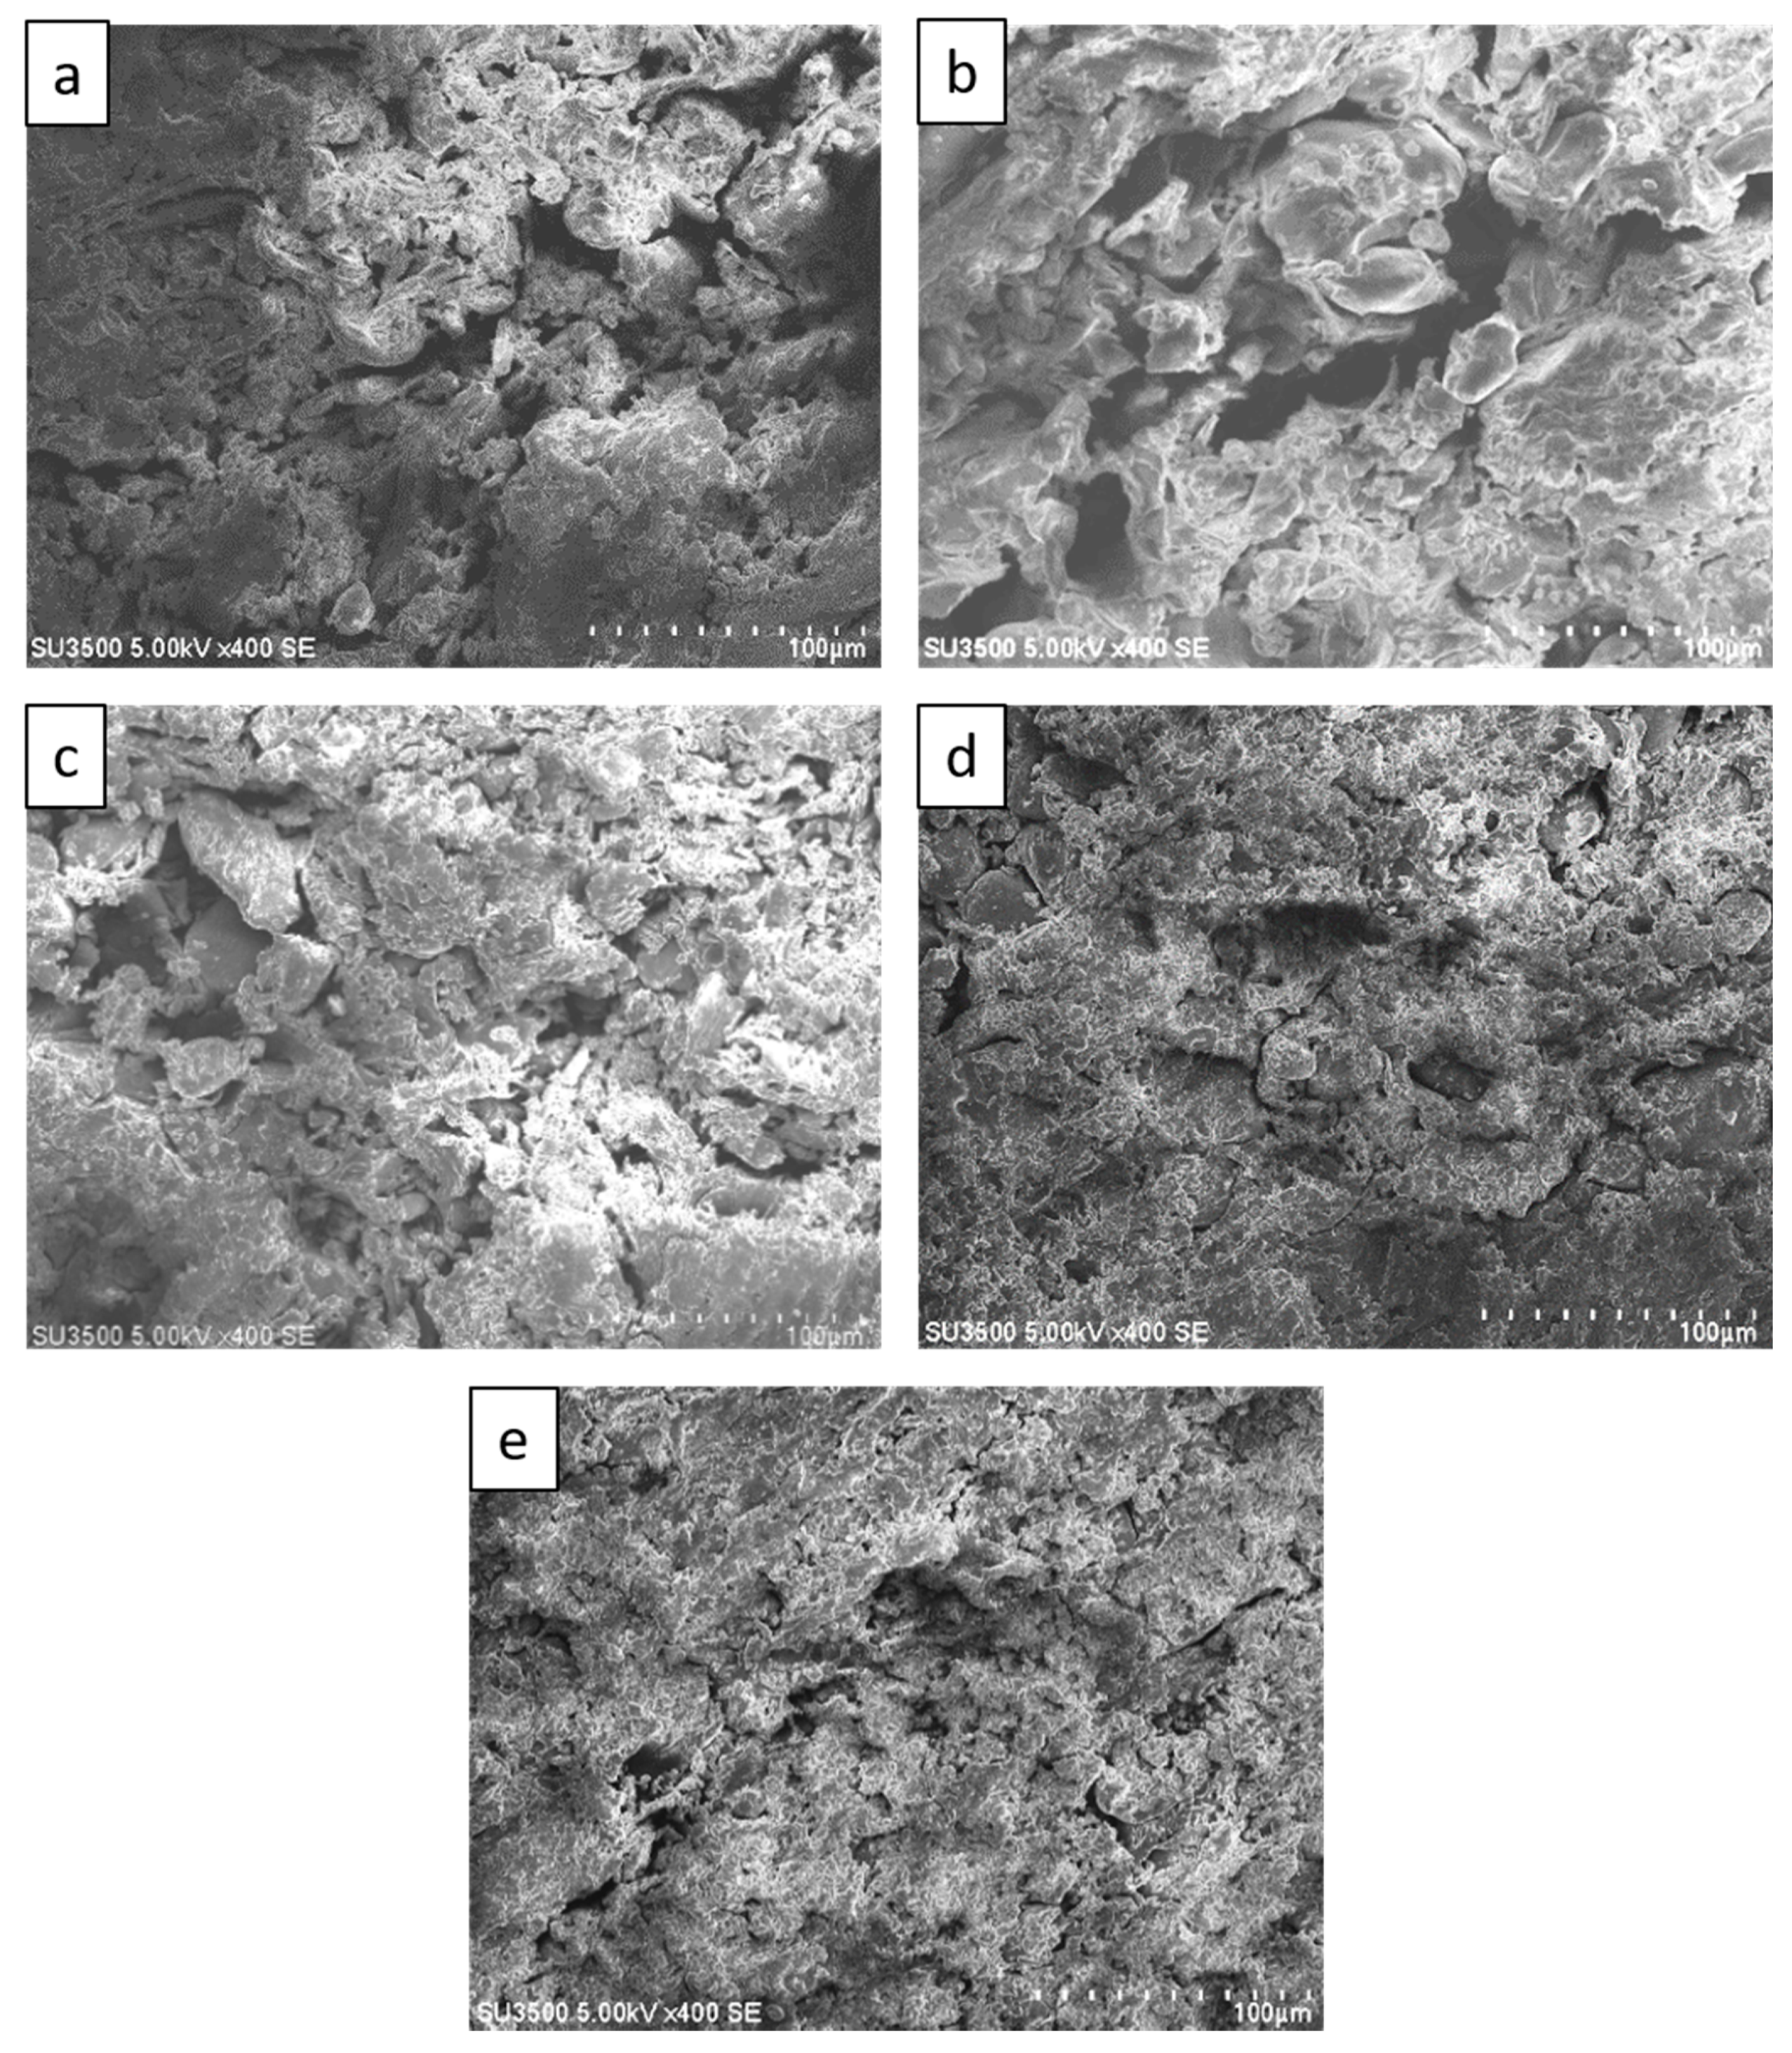
Figure 5 shows SEM images of sago fiber-epoxy composite with different epoxy resin contents showing a decrease of void size with increasing epoxy resin contents. Many large voids, that are larger than 100 µm, are observed in
Figure 5a,b which are the SEM images of sago fiber-epoxy composite with epoxy resin concentration of 9% and 13%, respectively. Those large voids are no longer observed in
Figure 5c−e which are the SEM images of sago fiber-epoxy composite with epoxy resin concentration of 17%, 20%, and 23%, respectively. These results show that the void size decreases with the increase of epoxy resin concentration. Void size may affect the material strength and rigidity of sago fiber-epoxy composite as it was studied previously by Zhu et al. showing that the tensile strengths decrease with increasing void content of fiber reinforced polymer composites [
19].
3.2. TG/DTG Analysis
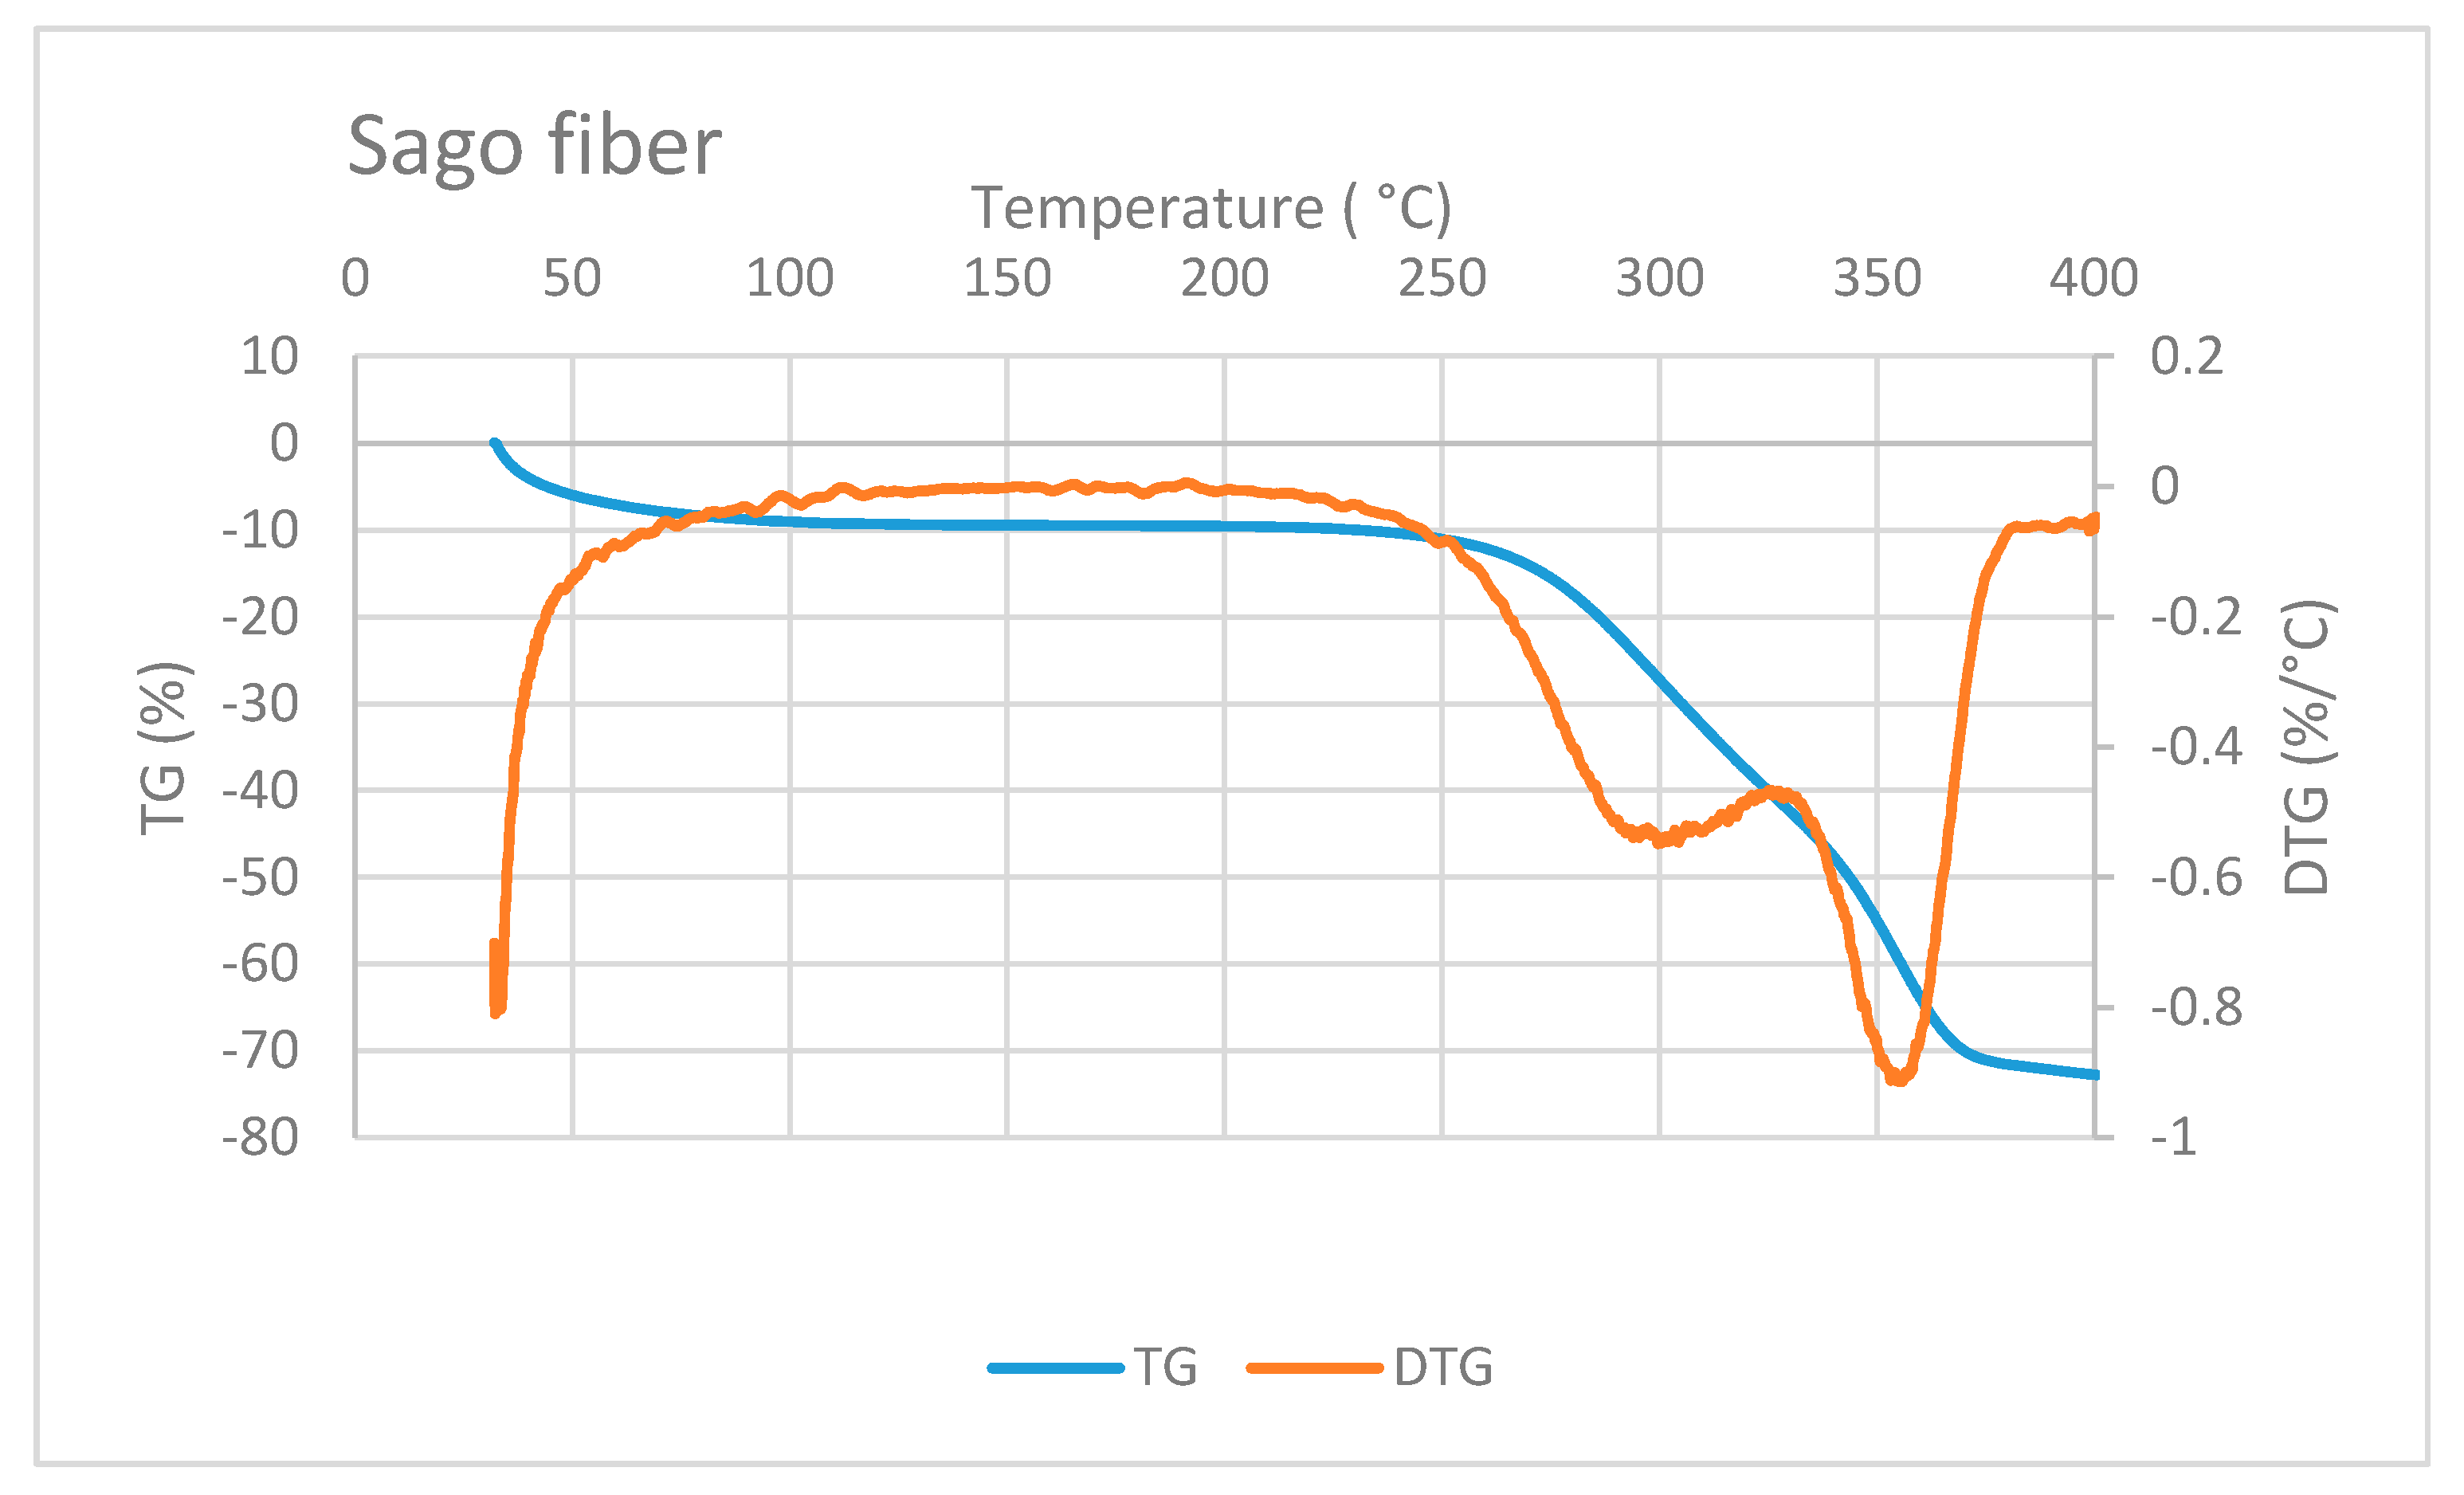
Figure 6 shows the TG/DTG curve of sago fiber. The TG curve depicts that the mass reduction of sago fiber happens within two different temperature ranges: from room temperature to before 100 °C and from above 250 °C to more than 350 °C. Mass reduction at the beginning of heating is caused by the vaporization of water from the fiber. Evaporation at the beginning of heating from ambient temperature was also observed for other plant fibers such as Phormium tenax fiber, which is reported to occur in temperatures up to 130 °C [
20]. Furthermore, the moisture evaporation at the beginning of heating is related to the water that is not chemically bound into the fiber [
1].
Reduction of sago fiber mass in the high-temperature range, i.e., above 250 ° C, is associated with hemicellulose decomposition, followed by cellulose decomposition. Two DTG peak points may represent these two decomposition processes. Hemicellulose degradation occurs at a lower temperature range (200 to 350 °C) compared to cellulose degradation (320 and 400 °C) [
1]. Luis Cabrales et al. reported a study of thermal degradation of cellulose in cotton fiber. The inflection point (peak temperature of DTG) of cotton ranges from 350 to 400 °C. The degradation temperature of cellulose is higher for fibers with greater molecular weight [
21]. In addition, lignin degradation might also contribute to the mass reduction at above 250 °C because lignin degradation can occur in a wide temperature range, from 100 to 900 °C [
1].
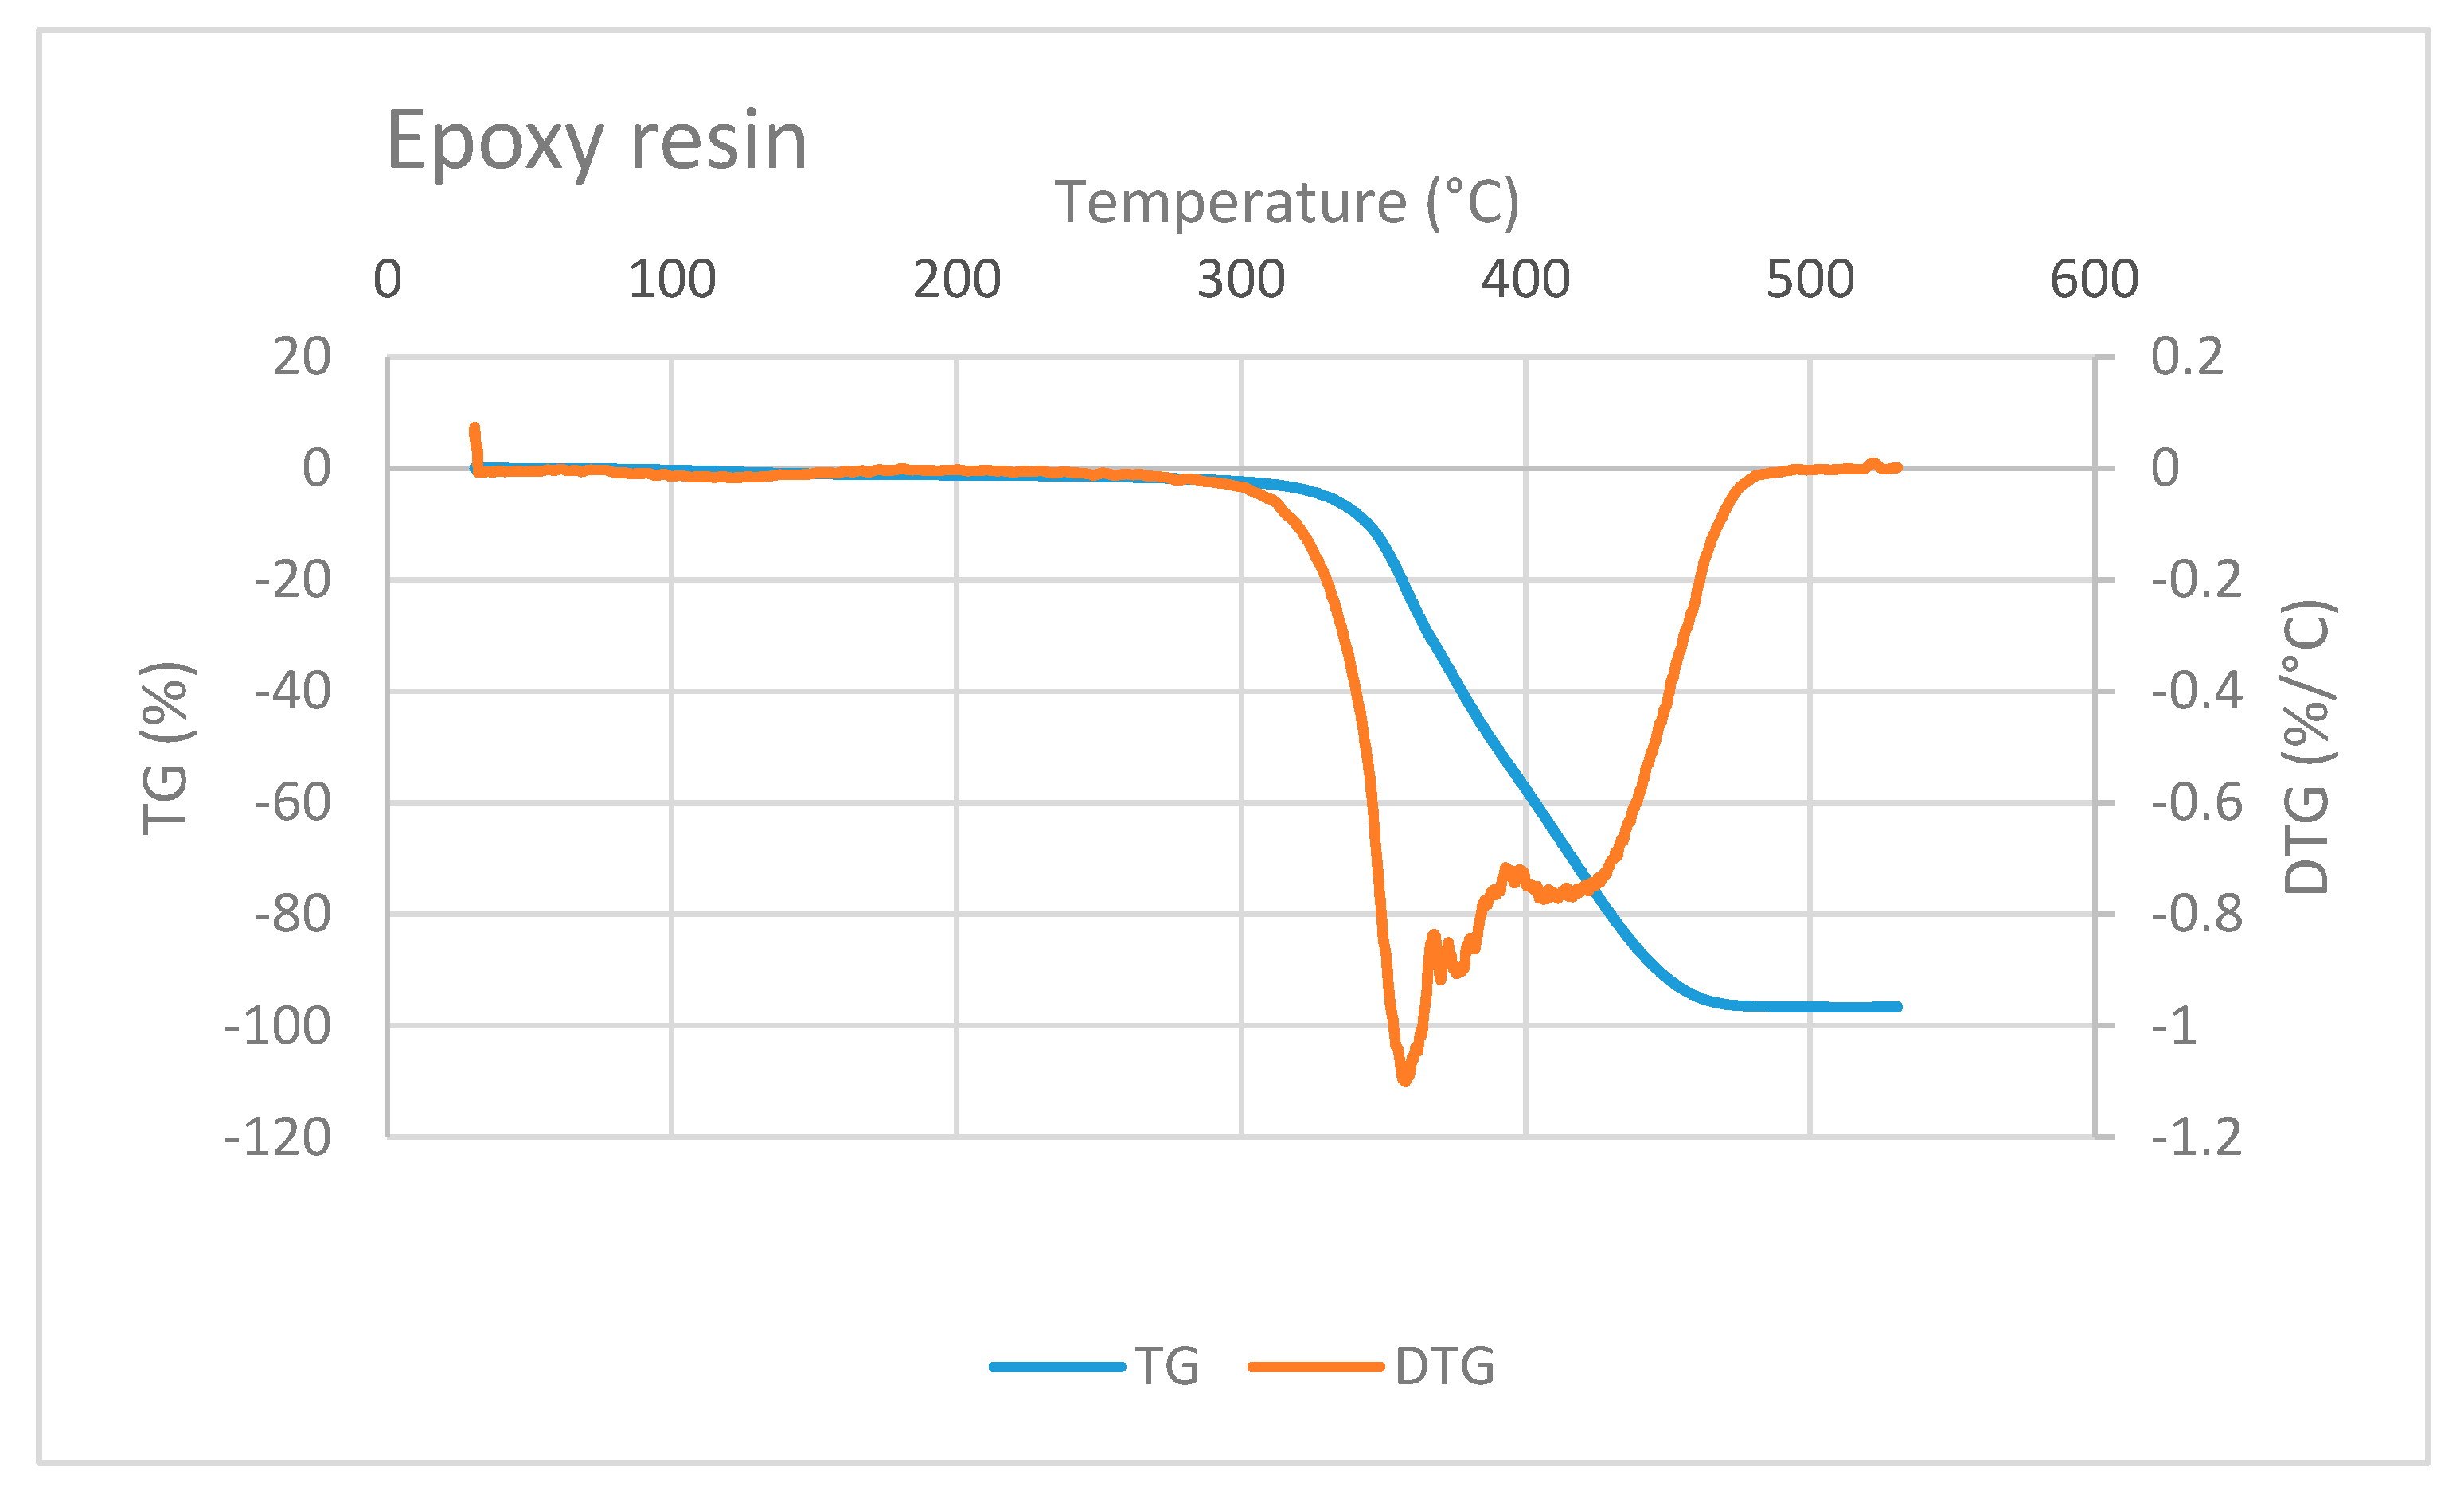
The TG/DTG curve of epoxy resin is shown in
Figure 7. Epoxy mass decreases at a very high temperature, i.e., at above 300 °C. This observation is in accordance with a study conducted by Shigeo Hirose et al. They studied the glass transition and thermal decomposition of epoxy resin synthesized from the carboxylic acid system consisting of ester-carboxylic acid derivatives of alcoholysis lignin and ethylene glycol. It was reported that the thermal decomposition of epoxy resin begins at about 350 °C [
22]. Three DTG peaks in
Figure 7 indicate that the thermal decomposition of epoxy resin may include several types of decomposition.
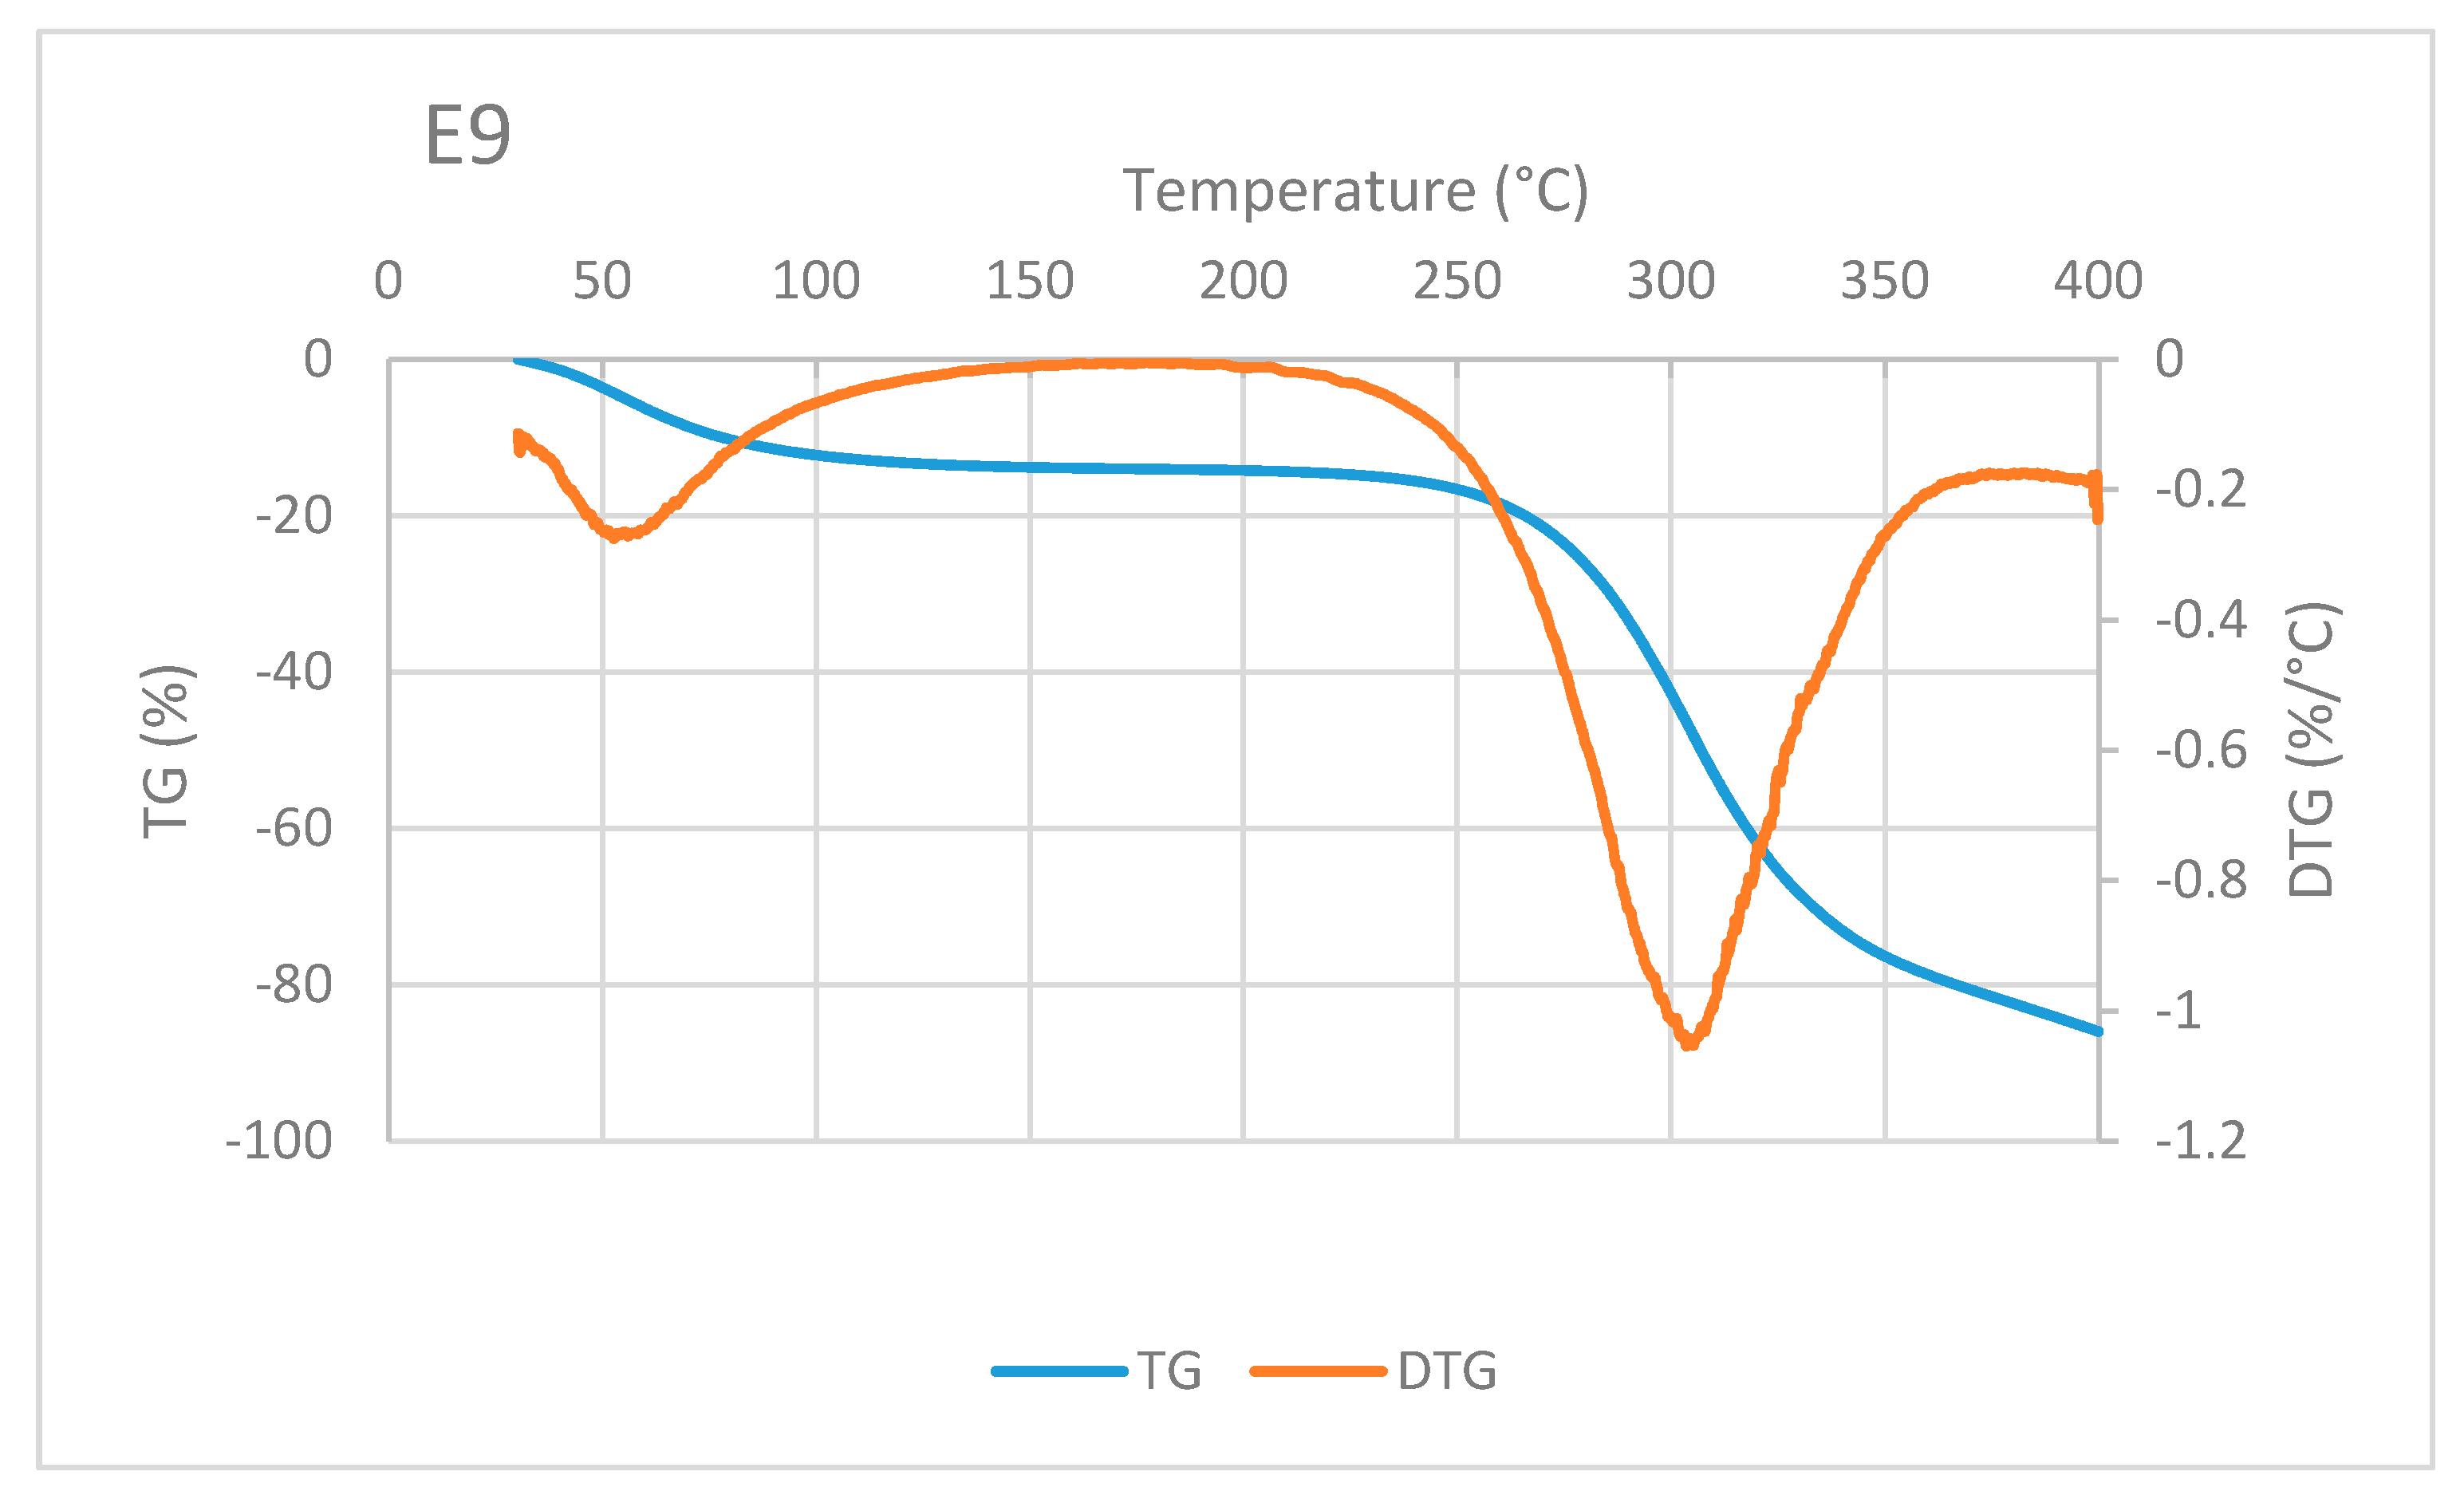
A typical TG/DTG curve of sago fiber-epoxy composite is shown in
Figure 8, taken from E9. The decrease in mass of sago fiber-epoxy composite can be divided into three different temperature ranges. The first is in the temperature range below 100 °C and the second and third are at above 250 °C. It is noted that in the range above 250 °C, i.e., at a temperature above 300 °C, the TG curve gradient decreases. This indicates that different damage occurs at that high temperature. These three ranges of decrease in mass for several natural fiber-epoxy composites have been reported before [
10,
23,
24]. FA Fauzi et al. divided the weight loss process of natural fiber-epoxy composites into two stages: (1) weight loss happened due to the vaporization from the fiber, (2) the weight loss due to decomposition of cellulose at 265 to 595 °C [
25]. Comparing to our results, the weight loss in stage (2) should be a combination of fiber and epoxy decomposition.
Mass reduction at the beginning of heating is related to water evaporation. The decrease in mass in the high-temperature range is mainly related to the decomposition of sago fiber as discussed earlier. Degradation at above 350 °C is mainly associated with epoxy resin decomposition, this corresponds to TG of epoxy in
Figure 7. Two DTG peaks represent inflection points of moisture evaporation and sago fiber decomposition. The results depict the thermal degradation in the composites associated with the degradation of constituent components, i.e., sago fibers and epoxy.
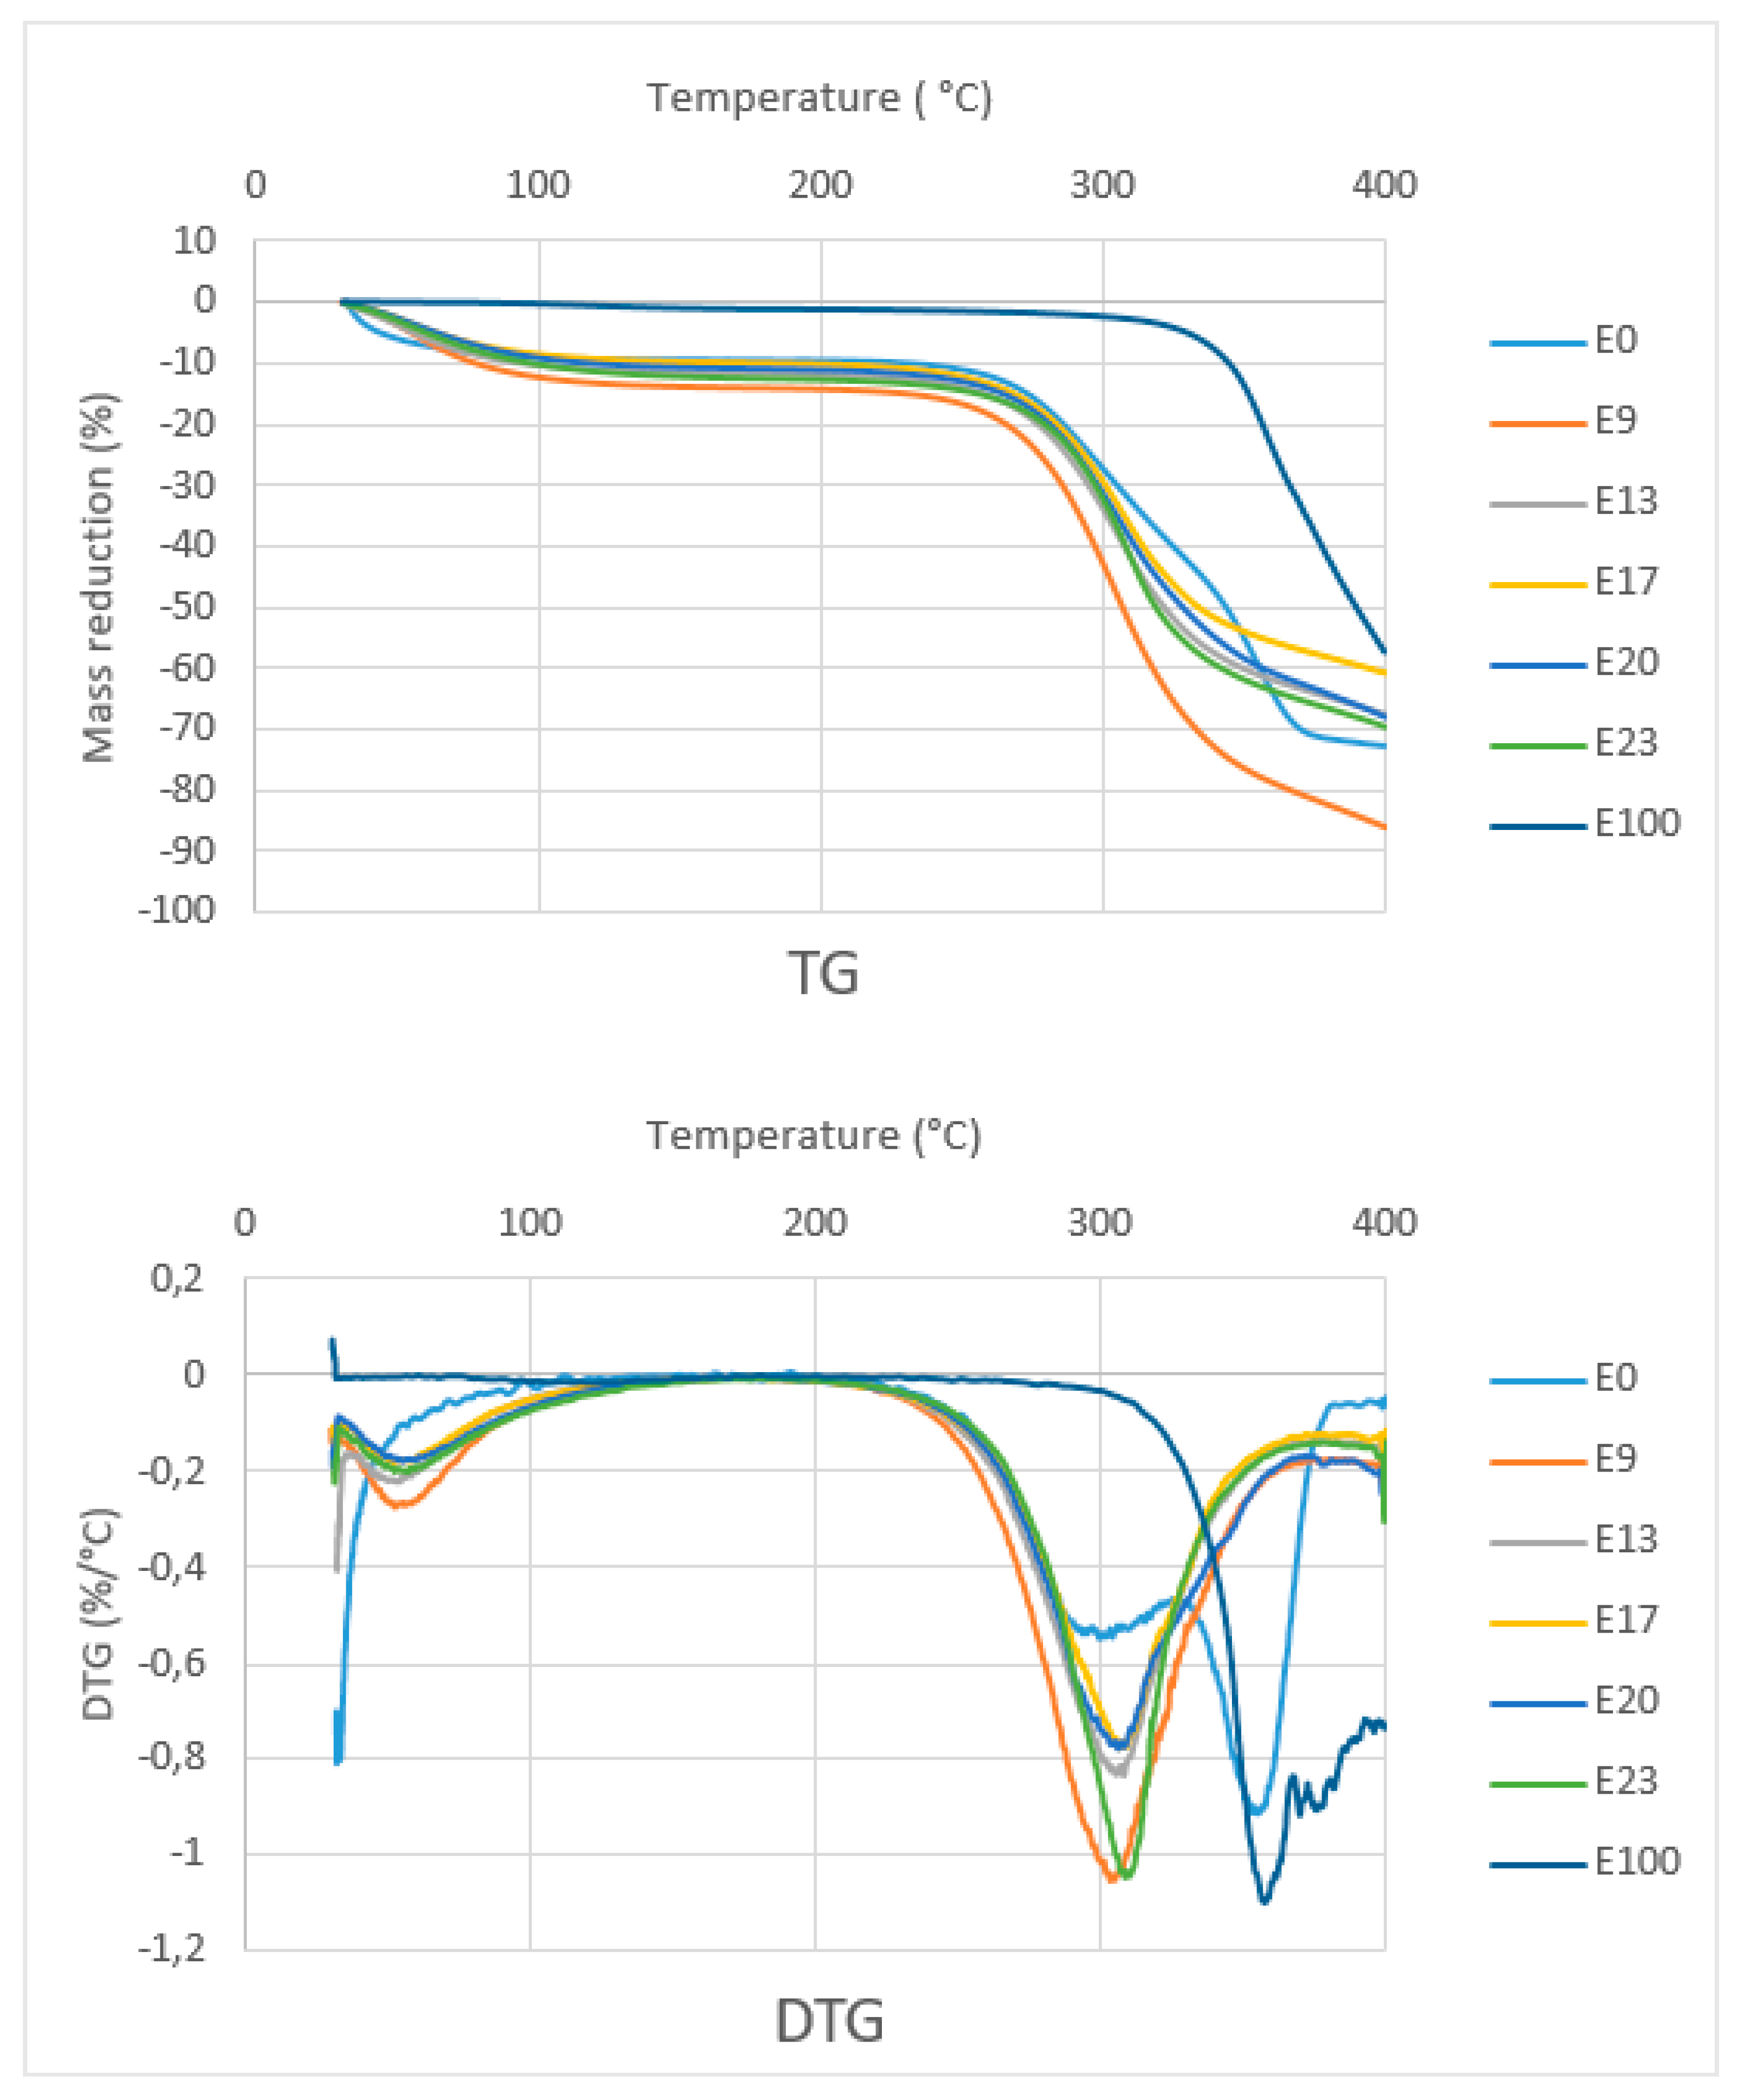
Figure 9 shows the TG curves of composites with various epoxy concentration, sago fiber, and epoxy resin. The TG curve of composites and sago fiber show two temperature ranges of decreasing mass. The first range starts from initial temperature up to around less than 100 °C, and the second range starts from above 250 °C. Initially, it was expected that initial damage temperature of the sago fiber-epoxy composite is higher than that of natural fiber, but in fact, all the composite starts to degrade at temperatures below the starting point of natural fiber degradation. A possible explanation is a compression during preparation influenced the starting point of fiber degradation. The starting point of degradation of epoxy resin is far higher than the others.
TG/DTG curve analysis is divided into two regions, namely region 1 (T < 150 °C) and region 2 (150 °C < T < 400 °C). Detailed data obtained from the TG/DTG curves in
Figure 9 are shown in
Table 2. In region 1, except for epoxy resin, there is a mass reduction of up to 13.3% due to water evaporation from sago fiber or from sago fiber contained in the composites. This correlates with the results on the measurement of water content in the composites as shown in
Table 3, which shows the average water content is within the range of 14.57% to 19.59%. The differences in water content data obtained via direct measurement and TG characterization may due to different methods/tools.
In region 2, sago fiber-epoxy composites experienced mass decreasing in a wide range: 274.2 to 360.5 °C. It is noted that at above this temperature, the mass decreasing process continues but at a lower rate. In accordance with the starting temperature of mass decreasing of fiber and epoxy, it seems that in region 2, the mass reduction initially associated with sago fiber decomposition (hemicellulose followed by cellulose), followed by decomposition of epoxy resin.
3.3. DTA Analysis
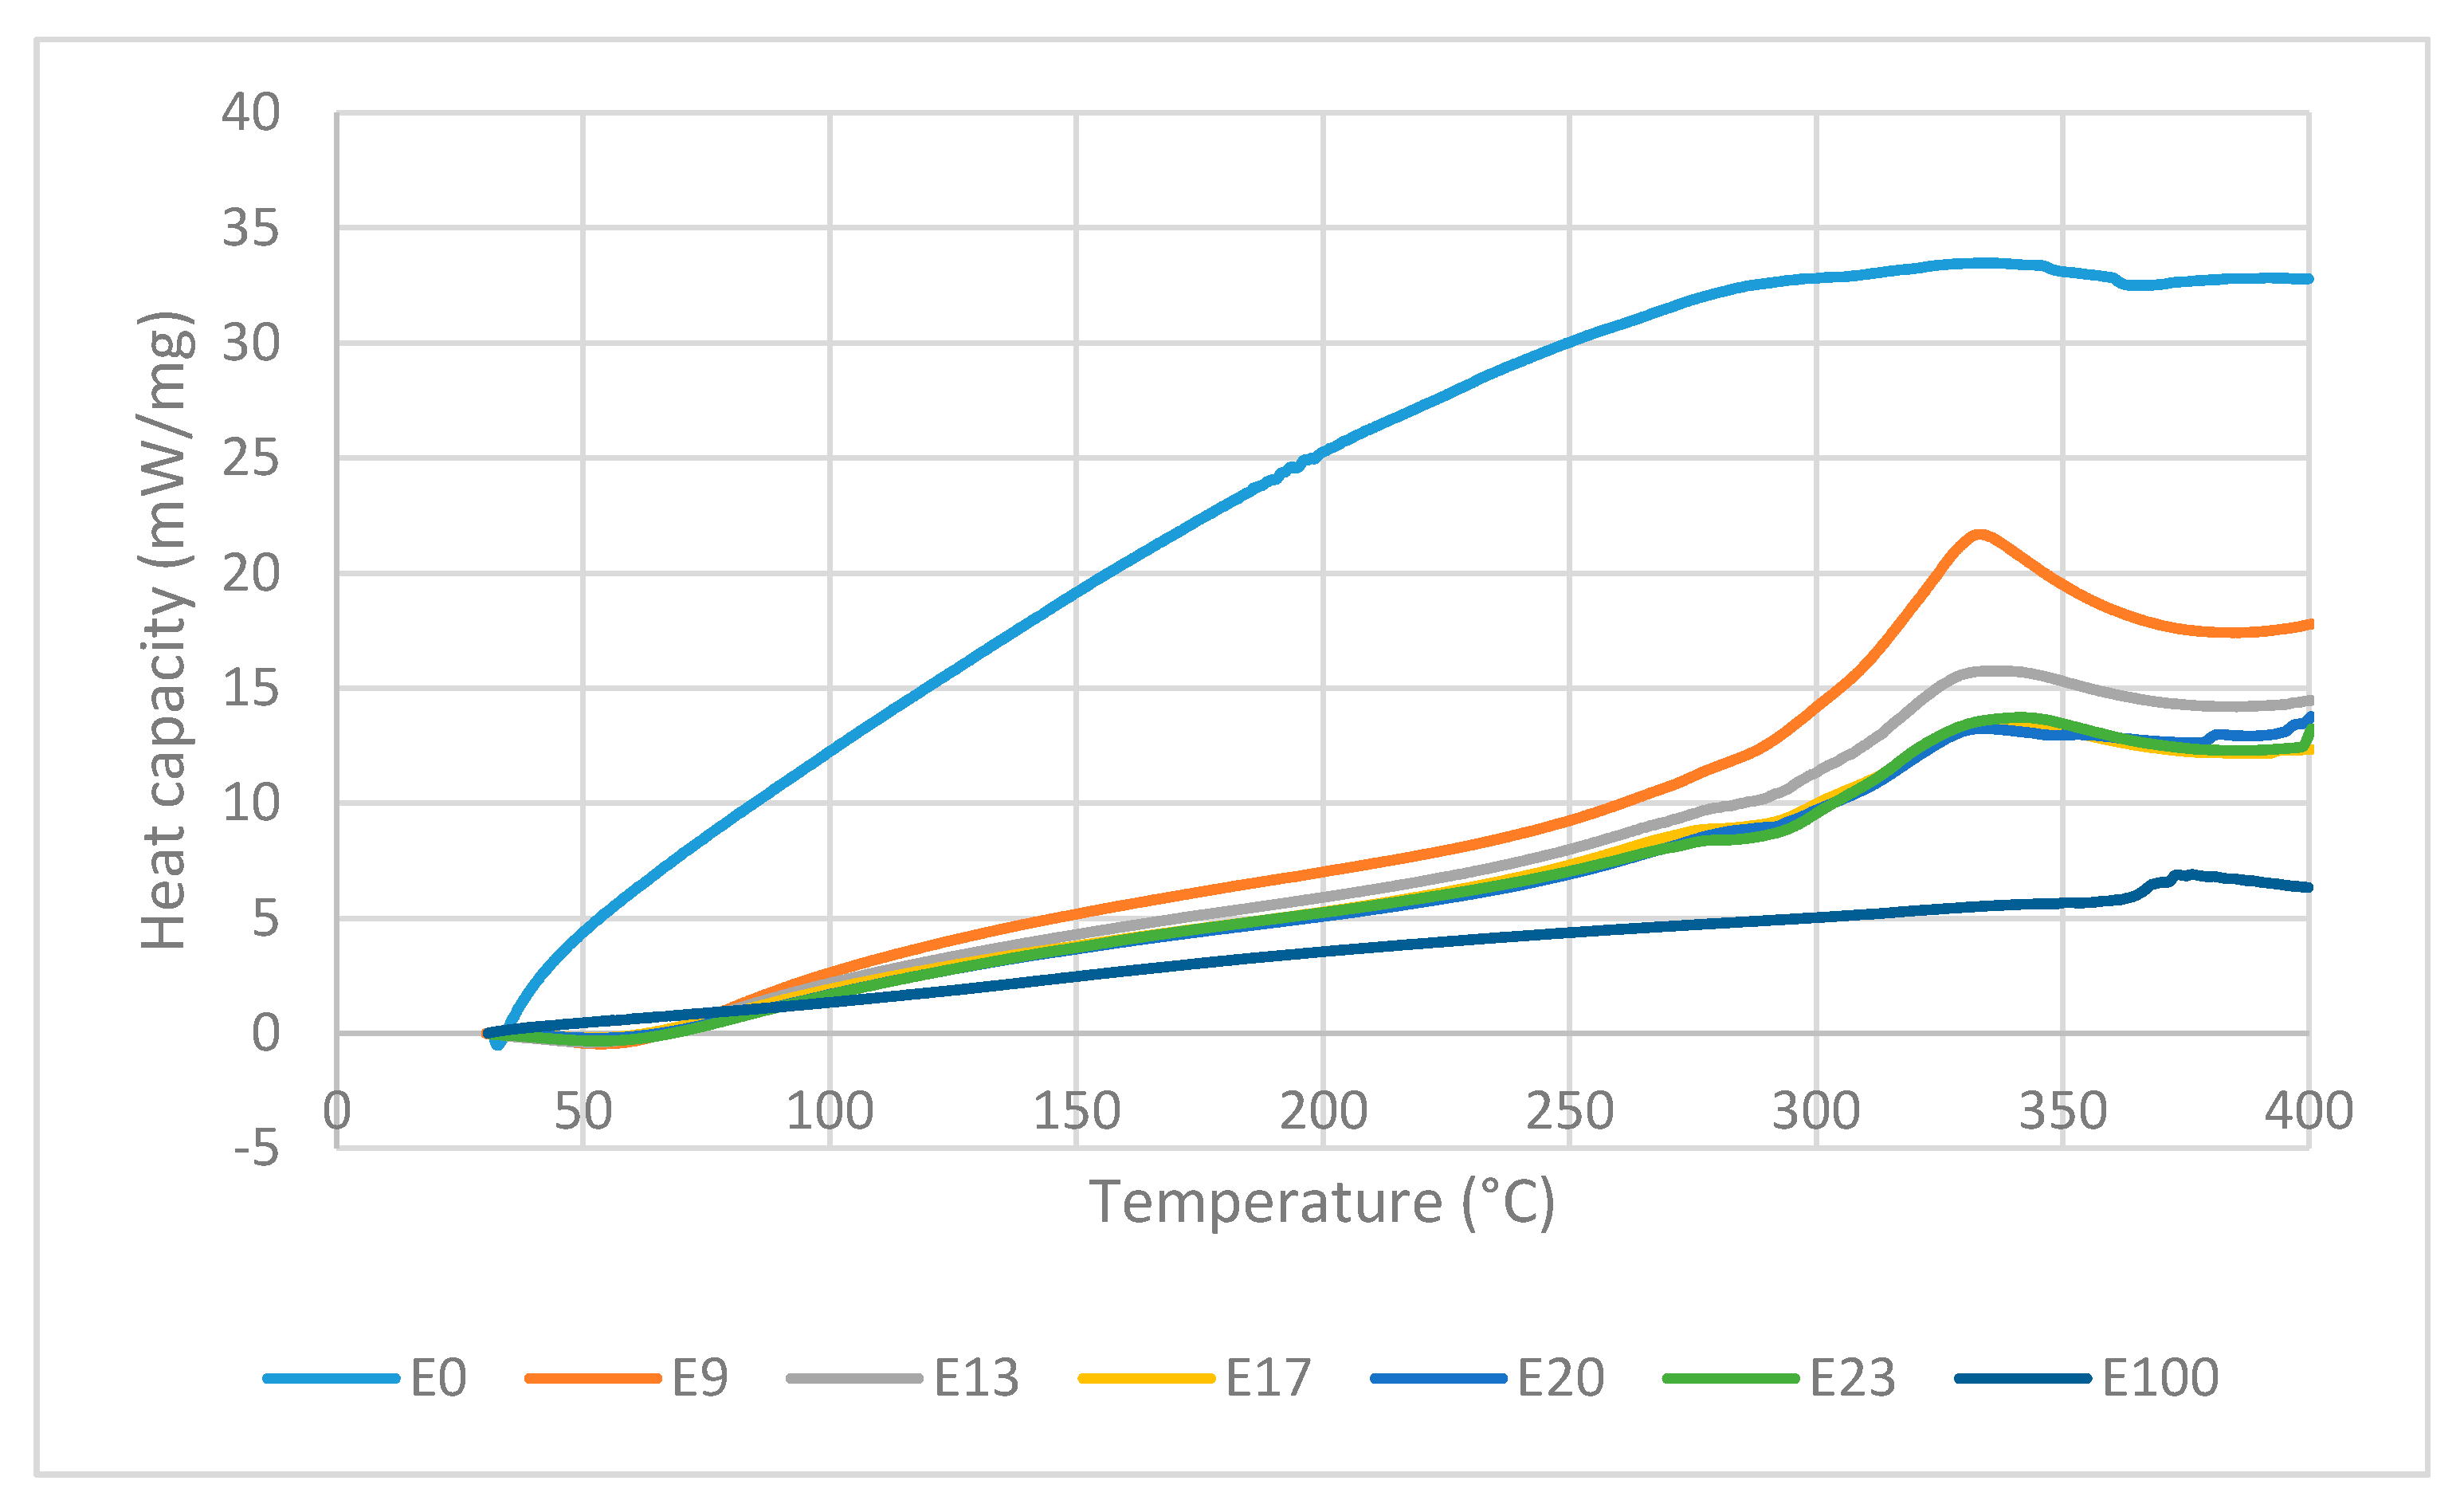
Figure 10 shows the DTA curves of the sago fiber-epoxy composite with various epoxy concentration, sago fiber, and epoxy resin. DTA curves is analyzed in two regions: region 1 (T < 150 °C) and region 2 (150 °C < T < 400 °C). Detailed information of every process and related temperatures shown by DTA curves are displayed in
Table 4.
In region 1, an endothermic event occurs at temperature below 100 °C in all composites with peak temperature within the range of 51.3 to 57.9 °C. The DTG/TG and DTA curves come from the same events, so features shown by DTA should associate with decreasing mass in TG curves. In accordance with TG observations, the endothermic process that occurs at temperatures below 100°C is attributed to the water evaporation process. During evaporation, water molecules change from liquid to gas phase. In the gas phase, water molecules move more freely than in the liquid phase, which means that water molecules in the gas phase have higher kinetic energy. Thus, the evaporation of water is an endothermic process, as depicted by DTA. It is noted that the endothermic process of water evaporation in the fiber is not observed in the DTA, this might due to the peak was not large enough to be observed. Epoxy does not show any event in region 1.
In region 2, the sago fiber, epoxy, and composite curve profiles are different from each other. The DTA curve of sago fiber shows an exothermic process that occurs in a very wide temperature range (229.9–362.4 °C) with two non-sharp peaks. This wide range is related to the decomposition process of hemicellulose, cellulose, and lignin in sago fiber. Lignin undergoes decomposition over a very wide range. Hemicellulose and cellulose begin to decompose at 250 °C and 290 °C, respectively. It is possible that the decomposition of lignin, hemicellulose, and cellulose to occur simultaneously at a certain temperature range. Peak points of the sago fiber exothermic process at 300.1 °C and 355.8 °C correlate with the decomposition of hemicellulose and cellulose, respectively. In region 2, the DTA curve of epoxy shows an exothermic process at very high temperatures (352.2–396.1 °C) with a peak temperature of 376.2 °C. Similar observation was reported by Md Shah et al., where the DSC characterization of epoxy showed an exothermic peak at above 340 °C [
26].
In region 2, the DTA curves of sago fiber-epoxy composites show two features: a shoulder in the range of 250 to 312.7 °C and an exothermic process in the range of 290 to 369.9 °C with a peak in the range of 333.3 to 341.3 ° C. It can be seen from
Figure 10 that the lower the epoxy content, the shoulder pattern tends to disappear. The shoulder pattern is replaced by the initial rise of the curve associated with exothermic events. The changes in shoulder pattern suggest that the shoulder formed might be the initial effect of fiber degradation (i.e., hemicellulose decomposition) on the epoxy baseline. For the second feature,
Figure 10 shows that the biggest exothermic area is shown by composite with the lowest epoxy concentration. This exothermic process occurs at temperatures below the epoxy resin degradation temperature. These suggest that the exothermic process is mainly associated with the decomposition of natural fibers (i.e., hemicellulose and cellulose decomposition).
4. Conclusions
Thermal properties of sago fiber-epoxy composites have been studied using TG/DTA characterization. The results illustrate that the thermal properties of sago fiber-epoxy composites are a combination of the thermal properties of their constituent materials: sago fibers and epoxy resins. Thermal damage of sago fiber occurs in a wide temperature range. Sago fiber thermal damage is dominated by cellulose decomposition followed by hemicellulose decomposition. Hemicellulose and cellulose decomposition occur in the range of 275 to 370 °C. On the other hand, the decomposition of epoxy resin starts at above 350 °C.
The thermal properties of the composite have been analyzed for two temperature regions. In region 1 (T < 150 °C), evaporation of water molecules occurs in sago fiber and sago fiber-epoxy composites at below 100 °C. In region 2 (150 °C < T < 400 °C) the sago fiber-epoxy composite undergoes thermal damage which begins with hemicellulose decomposition, followed by cellulose decomposition and epoxy resin decomposition at very high temperatures. Since some thermal decompositions occur in region 2, it is possible that several types of thermal decomposition occur simultaneously at a certain range. The TG/DTA measurement is for the overall thermal process, thus if there are two or more processes that occur simultaneously, TG/DTA does not give information about each process separately.


