Abstract
Bio-based adhesives and resins are sought as alternatives to synthetics in order to fabricate all-biobased composite wood panels (CWPs), which provide environmentally friendly building products for indoor use. Very little information exists as to how these bio-based CWPs would perform long-term in non-temperature controlled structures such as warehouses and storage units where extreme temperatures occur depending on the season. In this study, novel all-bio-based CWPs were fabricated using a matrix of 50% distiller’s dried grains with solubles (DDGS) and 50% soybean flour ProsanteTM (PRO) mixed with wood particles. Bio-based CWPs were subjected to accelerated thermal aging for a 10-year period resembling outdoor temperatures in Peoria, IL USA. Four seasonal periods (Winter, Spring, Summer, and Fall) were simulated varying from −26–40 °C and 36–76% relative humidity (RH). The bio-based adhesive employed consisted of 50% distiller’s dried grains with solubles (DDGS) and 50% soybean flour ProsanteTM (PRO). CWPs consisted of 15 or 50% DDGS/PRO with 85% or 50% pine wood. CWPs were evaluated for 5, 7.5, and 10-years for their physical, flexural, dimensional stability, surface roughness, FTIR, TGA, and spectral properties. The changes in the CWP properties were notable during the initial 5 years, and later aged samples showed less change.
1. Introduction
Petroleum-based resins and adhesives create human health and environmental problems [1,2]. Therefore, environmentally benign and safe alternatives such as bio-based adhesive/resins to replace petroleum-based binders are being investigated in the research and industrial communities [1,3,4,5]. Soybean flour is one of the most studied bio-based binder [2,6,7,8,9,10]. Defatted soy flour contains ~50% protein, which is responsible for its adhesive properties [8]. However, soy flour is relatively expensive at a cost of ~$0.45/lb ($1.00/Kg) [11,12]. Alternatively, a relatively inexpensive distiller’s dried grains (DDGS) containing ~30% proteins has been found to exhibit excellent binding properties [5]. The cost of DDGS is ~$0.07/lb (~$0.15/Kg) [11]. World soybean meal production was approximately 235 million metric tons in 2018, including the estimated U.S. production of 41.5 million metric tons [12,13,14]. U.S. production of DDGS for 2016-17 was estimated at 44.8 million tons [15]. One of the objectives of this study was to evaluate the possibility of employing DDGS/soy flour mixtures as a less expensive alternative binder to the soy flour alone. Equal concentrations of DDGS and a commercial soybean flour, ProsanteTM (PRO), at various dosages varying from 10% to 75% with pine wood (PiW) were used to fabricate composite wood panels (CWPs). These CWPs were evaluated for their dimensional and morphological stability, and mechanical properties under accelerated aging studies. Fabrication of CWPs consisting of soy flour and DDGS with properties resembling CWPs utilizing PRO only would considerably lower the cost of bio-based CWPs. However, much information is required to determine the durability of these bio-based CWPs. We are interested in determining how environmental conditions affect bio-based CWPs. Past studies have shown that CWPs subjected to exterior environments testing light, moisture, and temperature cause profound structural deterioration [16,17,18,19,20,21,22,23,24,25,26,27,28,29]. CWPs are employed as indoor building materials such as wall, flooring, and ceiling panels, and are unlikely in this context to be exposed to light and high moisture environments but they would be periodically exposed to extreme temperature changes throughout the year. This situation occurs for CWPs utilized in non-temperature regulated structures (e.g., warehouses, sheds, barns, and storage units).
Various cyclic physical parameters have been employed to evaluate how CWPs respond to aging such as UV light [16], relative humidity [17], moisture [18,19], and temperature [20,21]. Accelerated thermal aging has been conducted to determine the durability of composites [3,22,23,24,25,26,27,28,29]. Previous accelerated thermal aging studies have employed a synthetic adhesive as the binding agent in the CWP [20,21]. In this study, we investigated the durability of an entirely bio-based CWP (i.e., DDGS/PRO-PiW panels) to accelerated thermal aging by employing seasonal temperature changes representing spring, summer, autumn, and winter extreme temperatures occurring in Peoria, IL (40°43′15″ N 89°36′34″ W). Herein, we report the stability of biocomposites given up to 2688 thermal cycles representing simulated natural times of 0, 5, 7.5, and 10 years. The influence of thermal cycling temperatures on the physical (density and thickness), flexural, dimensional stability, surface roughness, and spectra changes are assessed. In addition, the results of Fourier transform infrared spectroscopy (FTIR) and thermogravimetric analysis (TGA) are conducted to assess the chemical stability of the CWPs.
2. Materials and Methods
2.1. Materials
DDGS was procured from a commercial animal corn feed pellet feed product (Archers Daniel Midland Co., Decatur, IL, USA). DDGS were defatted in a Soxhlet extractor with hexane to obtain a DDGS containing ~30% crude protein. Defatted DDGS was ground to a fine powder in a Ririhong Hi-speed Multifunctional grinder (Model RRH-A500, Shanghai Yuanwo Industrial and Trade Company, Shanghai, China). DDGS flour was then sieved through a #80 U.S. standard screen with a Ro-TapTM Shaker (Model RX-29, Tyler, Mentor, OH, USA) to obtain ≤250 µm particles. Commercial soybean flour, ProsanteTM (200/90) (PRO) containing 50% protein was employed as provided (Cargill Inc., Cedar Rapids, IA, USA). Pine wood shavings (Pinus ponderosa Douglas ex. C. Lawson) (PiW) (PetSmart, Phoenix, AZ, USA) were used as the wood reinforcement fraction. Using a Thomas-Wiley grinder (Model 4, Thomas Scientific, Swedesboro, NJ, USA) PiW shavings were ground through 4-, 2-, and then 1-mm stainless steel screens to obtain different particle sizes. Milled PiW were sized by sieving with #12 and #30 US standard screens via a shaker. Two PiW mixtures were obtained consisting of 600–1700 µm particles and ≤600 µm particles. In all cases, equal proportions of the two PiW size fractions were employed.
2.2. Panel Preparations
CWPs of 10%, 15%, 25%, 50%, and 75% adhesive/resin (DDGS, PRO, or equal concentrations of DDGS and PRO (DDGS/PRO)) were combined with PiW composed of equal amounts of ≤600 µm particles and 600–1700 µm particles to obtain panels weighing 160 g. In subsequent experiments, CWPs composed of 15% or 50% DDGS/PRO with 85 or 50% PiW were employed in thermal aging. Mixing of adhesive powders and PiW was performed in a zip-lock bag. Mixtures were transferred to an aluminum mold (outer dimensions: 15.2 cm width × 30.5 cm length × 5 cm depth and mold cavity: 12.7 cm width × 28 cm length × 5 cm depth) pre-sprayed with a mold release (Paintable Dry Spray with Teflon, No. T212-A, IMS, Chagrin Falls, OH, USA). A hydraulic press (Model 4126, Carver Press Inc., Wabash, IN, USA) was used to compress and mold the samples at a temperature of 185 °C. Molds were initially pressed with 2.8 MPa pressure for 4 min followed by a release of pressure then pressed to 4.2 MPa for 4 min and followed by another pressure release. Molds were finally pressed to 5.6 MPa for an additional 4 min. Mold pressure was maintained at 5.6 MPa while the heating was stopped, and the cooling process was commenced via by circulating cold water through the press platens. The mold was removed from the Carver press when the mold surface reached 27 °C.
2.3. Accelerated Thermal Cycling
Several CWPs (12.7 cm width × 28 cm length × 3.5–5.5 mm depth) were placed in a thermal environmental chamber (Model EC127, Sun Electronics Systems, Inc., Titusville, FL, USA). Panels were subjected to thermal cycling as per the regiment shown in Table 1 and Figure 1. Experiments were conducted in complete darkness. These temperatures correspond to the seasonal temperatures that occur in Peoria, IL. Previously, researchers have suggested that 270 cycles would correspond to a “Year of Use” [28,29]. Ninety-minute thermal cycling began in the winter season at −25.6 °C, and the heating rate proceeded at 3.5 °C min−1 to 23.3 °C for 68 cycles, corresponding to 3 months. Next, the spring season was administered for 68 cycles with temperatures varying from −21.1 °C to 34.4 °C, followed by the 68 cycles for the summer season (8.9 °C to 40 °C) and then 68 cycles for the fall season (−12.2 °C to 37.8 °C). Panels were removed at 5, 7.5, and 10 accelerated years for dimensional, flexural, dimensional stability, surface roughness, colorimetric, thermal, and infrared analysis. Relative humidity (RH) in Peoria varies somewhat during the year, with the highest values (76%) occurring in summer and the lowest values in winter (69%) [30]. However, these are reported as average RH’s and no data are provided as to their minimums or maximums. In our thermal cycling chamber, the lowest temperatures of the season tested correspondingly resulted in the lowest RH’s and the higher temperatures resulted in the highest RH’s.

Table 1.
Thermal Cycling Settings for Test Chamber. Duration of each cycle is 90 min, as shown in Figure 1. For each season minimum temperature corresponds to minimum relative humidity (RH); maximum temperature corresponds to maximum RH.
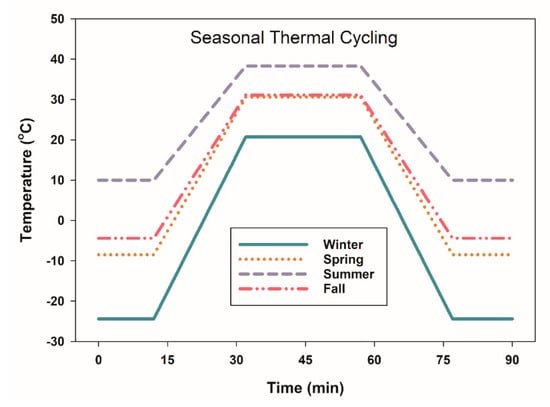
Figure 1.
Seasonal thermal cycling profiles for accelerated aging studies.
2.4. Physical, Flexural, and Dimensional Stability Analysis
All the CWPs were conditioned at 50% relative humidity at 25 °C for 72 h prior to table sawing into five specimen boards necessary for three-point bending tests [31]. Specimen boards were 50 mm W × 127 mm L × 3.5–5.5 mm thick. Specimen board dimensions (thickness and density) were measured. Flexural tests to analyze modulus of rupture (MOR) and modulus of elasticity (MOE) were conducted with a universal testing machine [Instron Model 1122 (Instron Corp., Norwood, MA, USA) [31]. Water absorption (WA) and thickness swelling (TS) tests were conducted by submerging the 50 × 50 mm square samples in water for 24 h [32]. A surface roughness tester (Model SJ-210, Mitutoyo Corp., Kanagawa, Japan) fitted with a stylus profile detector measured surface roughness. Average roughness (Ra), mean peak-to-valley height (Rz), and maximum roughness (maximum peak-to-valley height) (Ry) were measured [33]. Profilometer specifications were speed of 0.5 mm/s, pin diameter of 10 μm, pin angle of 90°, tracing line (Lt) length of 12.5 mm, cut-off (λx) of 2.5 μm, and scanning arm measuring force of 4 mN. A Chroma Meter CR-400 spectrophoto-colorimeter (Konica Minolta, Ramsey, NJ, USA) was employed to measure color properties. The colorimeter was calibrated with a white tile. L* values [lightness, ranging from 0 (black) to 100 (white)]; a* values [redness or green-red coordinate, ranging from −100 (green) to +100 (red)]; b* values [yellowness or blue-yellow coordinate, ranging from −100 (blue) to +100 (yellow)]; C*ab values (chromaticity, color saturation); and H* ab values (Hue angle, tonality angle) were determined. C*ab and H*ab values are derived using the formulas
and
respectively. Specimens were photographed with a digital camera fitted with 5× optical/2× digital zoom lenses (Model # DSCF707 Cyber-shot 5 MP, Sony Corp., Tokyo, Japan). Both the surfaces and sawn cross sections of specimens were examined and photographed.
C*ab = √ (a*2 + b*2),
H*ab = arctan (b*/a*),
2.5. FTIR
FTIR spectra of the samples were measured on an ABB Arid Zone FT-IR spectrometer (ABB, Houston, TX, USA) equipped with a pyroelectric deuterated Tri glycine sulfate (DTGS) detector. All samples were finely ground to a powder (homogenized) prior to testing. Test samples were transparent discs that consisted of 1.00 mg solids homogenized with 300 mg of dry spectronic grade KBr, placed in a KBr die and compressed at 24,000 psi using a Carver press. Absorbance spectra were acquired at 4 cm−1 resolution and signal-averaged over 32 scans. Spectra were baseline corrected and adjusted for mass differences and normalized to the methylene peak at 2927 cm−1. Multiple homogenized samples for each ingredient and CWPs were analyzed to verify that valid representative FTIR spectra are presented.
2.6. TGA Characterizations
Ingredients and CWPs were ground to a powder (homogenized) in order to be tested. Thermogravimetric analysis (TGA) was conducted using a Model Q50 TGA (TA instruments, New Castle, DE, USA) under nitrogen with 60 mL/min flow rate. Approximately 10 mg samples were placed on a platinum sample pan, and the pan was loaded with the autosampler. Samples were heated at 10 °C/min from 25 °C to 800 °C. TA Universal Analysis software was used to analyze the results. Several homogenized samples were analyzed in order to present representative TGA and derivative thermogravimetric (DTG) curves.
2.7. Statistical Analysis
As applicable, experimental data were analyzed using the Duncan’s Multiple Range Test (p ≤ 0.05) and Pearson correlations coefficients comparing various variables (Statistix 9, Analytical Software, Tallahassee, FL, USA).
3. Results and Discussion
3.1. Influence of Resin Types and Concentration
The flexural strength, dimensional stability, and other physical (density and thickness) properties of the CWPs containing various dosages and resin types are presented in Figure 2. Generally, the thickness of the CWPs was related to the matrix and wood dosage. Overall, these results confirm earlier experiments in which the authors employed various concentrations of bio-based adhesives mixed with wood to fabricate CWPs [4,5]. CWPs with high matrix dosages and low wood dosages (e.g., 75DDGS-25PiW) were thinner than CWPs containing low matrix dosages and high wood dosages (e.g., 10DDGS-90PiW). As the thickness declined, the density of the CWPs increased. Increasing the matrix dosage caused an increase in the flexural properties with the highest flexural properties (MOR and MOE) occurring at the 50% matrix dosage and then declining thereafter at the 75% matrix dosage (Figure 2). Correspondingly, the dimensional stability properties (WA and TS) were lower in panels containing higher matrix dosage concentration (Figure 2). The lowest WA and TS values occurred in CWPs composed of 50% and 75% matrix dosages, while the highest WA and TS values occurred in CWPS composed of 10% and 15% matrix dosages (Figure 2). These observations conform with earlier studies utilizing soybean flour, DDGS, or tree seed flours [4,5].
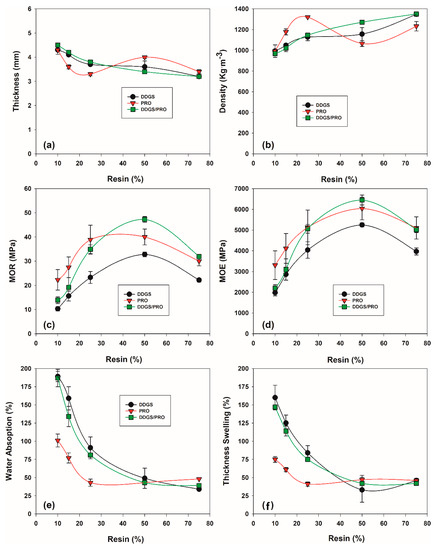
Figure 2.
Relationship of how resin types and concentrations affect the physical, flexural, and dimensional stability properties of composite wood panels (CWPs). Composites resins employed: distiller’s dried grains with solubles (DDGS) = 100% DDGS; ProsanteTM (PRO) = 100% PRO; DDGS/PRO = 50%DDGS/50%PRO. Curve plots: (a) thickness, (b) density, (c) modulus of rupture (MOR), (d) modulus of elasticity (MOE), (e) water absorption, and (f) thickness swelling.
Generally, the flexural and dimensional stability properties of DDGS-PiW composites were inferior to PRO-PiW CWPs. Pro (50%) contained 67% more protein than DDGS (~30%). We attribute the improved flexural properties of CWPs containing 50% matrix dosages to their higher protein concentrations (Figure 2). Mixing equal proportions of DDSG and PRO produces a matrix fraction that contains ~40% protein and results in CWPs (DDGS/PRO-PiW) with improved flexural properties compared to the DDGS-PiW composites. Dimensional stability properties of the DDGS/PRO-PiW composites were inferior to the PRO-PiW composites containing the low resin (matrix) concentrations (10%, 15% or 25%). However, at the 50% and 75% resin concentrations, all three composite types (DDGS-PiW, PRO-PiW, and DDGS/PRO-PiW) exhibited similar dimensional stability properties. This is due to high interfacial binding between the matrix and the reinforcement [4,5]. Based on these results, since the DDGS/PRO-PiW composites exhibited satisfactory properties they were used in subsequent testing.
3.2. Thermal Cycling of CWPs
Thermal cyclic aging did not cause an immediate discernible change in the appearance of the CWPs regardless of the years aged. Visually, panels appeared similar in appearance and retained their overall structure form (i.e., length and width). However, detailed examination provided evidence of much alternation due to the thermal aging. For example, changes in physical (density and thickness) and flexural properties of the CWPs as a function of time are presented in Figure 3. Most significant changes in physical and flexural properties occurred during the first five years of thermal aging (Figure 3). Thickness of the CWPs increased slightly with thermal cycling, while correspondingly density of the composites decreased with thermal cycling. After 5 years of aging, thickness and density values of 15DDGS/PRO-85PiW and 50DDGS/PRO-50PiW exhibited +19% and −12% and +7% and −1% changes, respectively, compared to original untreated CWP. Likewise, the largest change in the flexural properties of CWPs occurred between 0 and 5 years of use (Figure 3). MOR and MOE values of 15DDGS/PRO-85PiW and 50DDGS/PRO-50PiW exhibited 63% and 75% and 55% and 70% reductions, respectively, compared to untreated controls. This may be due to thermal relaxation of the materials involved. The rate of relaxation decreases as the age of the samples beyond five years. Little change in MOR and MOE values occurred after for the 7.5 and 10 years of thermal cycling. Changes in dimensional stability values (WA and TS) varied depending on the CWP composition. The 50DDGS/PRO-50PiW CWPs subjected to 5 years of thermal cycling showed 26% reduction in thickness swell compared to a 15DDGS/PRO-85PiW CWP, which exhibited a 36% reduction. It is interesting that thermal cycling aging actually causes an improvement in the dimensional stability properties of CWPs. The explanation for this improvement can only be speculated at this time. Past studies have found that low temperatures such as freezing (0 °C) do not affect the CWP properties [18,21]. Therefore, we suspect that the higher temperatures associated with the spring, summer, and fall seasons are primarily responsible for the change in CWP properties. When relative humidity is held constant, temperature does not affect wood properties [34]. However, when relative humidity is unregulated, temperature greatly affects the relative humidity and in turn alters the moisture content within the wood, resulting in its expansion and shrinkage [34]. Such physical changes occurring within the CWPs disrupt the bonding between the wood and the matrix resulting in lowering of the CWPs flexural properties. In this study, the relative humidity was found to vary greatly depending on the simulated season (Table 1). Humidity was unregulated in this study and needs to be examined more closely in further studies as the cause of CWP degradation. Further, in this study the seasonal changes were simulated by administering the extreme temperatures occurring in the season daily. In reality, these temperature extremes do not occur on the same day but rather gradual temperature changes occur with periodic short-term extremes occurring. Nevertheless, these results provide evidence that dramatic changes occur in CWPs subjected to thermal cycling.
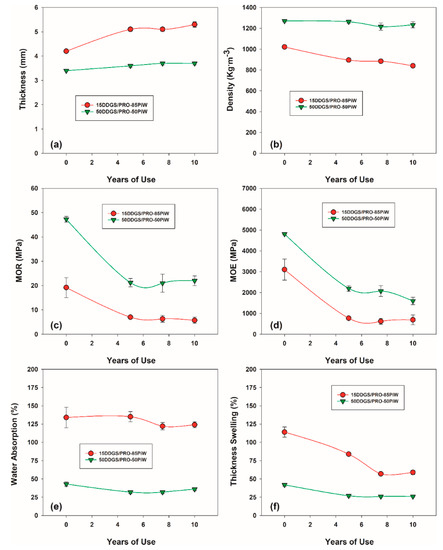
Figure 3.
The influence of thermal cycling on the physical, flexural, and dimensional stability properties of various CWPs. Curve plots: (a) thickness, (b) density, (c) MOR, (d) MOE, (e) water absorption, and (f) thickness swelling.
Various accelerated aging techniques on wood panels usually result in severe degradation of their mechanical properties [35]. Prior accelerated aging tests have correlated well with a 2-year natural aging study using commercial CWPs [35]. The employment of a 10-year thermal aging study on commercial CWPs has not been performed to date. Results suggest that shorter-term thermal aging studies correlating to 1 to 5 years should be conducted wherein the influence of CWP moisture content and chamber relative humidity are more closely monitored. Comparison between the European Committee for standardization nominal properties for commercial CWPs and CWPs subjected to thermal cyclic ageing are presented in Table 2. The 15DDGS/PRO-PW and 50DDGS/PRO-PW CWPs had MOR and MOE values that were initially similar to commercial panels (Table 2). Following thermal ageing, these values dropped dramatically and often fell below the nominal standards required for commercial use.
Table 2.
Comparing European Committee for Standardization nominal properties for various CWPs employed in interior dry and humid conditions with thermally tested CWPs.
3.3. Surface Roughness Influenced by Thermal Cycling
Surface roughness or surface irregularities are important properties of wood panels [39,40,41,42]. Surface roughness affects the tactual sensation, visual aesthetic appeal, behavior of coatings, and the contact relationship to other surfaces [39]. The surface roughness properties of wood panels are related to the composition of the ingredients employed [42]. Weathering of particleboards causes increased surface roughness due to the particle properties’ interaction with the matrix [42]. Surface roughness properties were profoundly affected by thermal cycling (Figure 4). The most dramatic increase in surface roughness properties occurred after the first five years of thermal cycling.
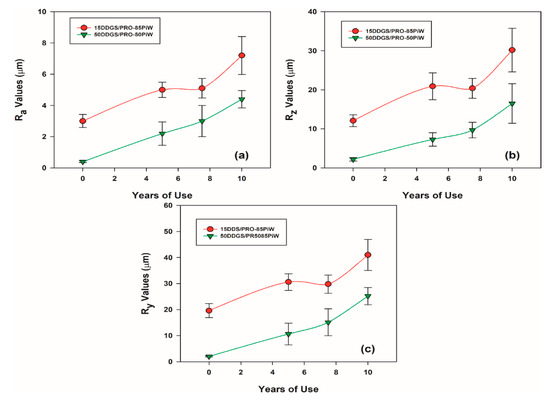
Figure 4.
The influence of thermal cycling on the surface roughness properties of various CWPs. Curve plots: (a) Ra values, (b) Rz values, and (c) Ry values.
Generally, surface roughness properties (Ra, Rz, and Ry) increased as the period of thermal cycling increased (e.g., 15DDGS/PRO-85PiW, 50DDGS/PRO-50PiW). Thermal cycling (e.g., 7.5 and 10 years) resulted in a progressive increase in surface roughness values (Figure 4). For example, 50DDGS/PRO-50PiW Ra, Rz, and Ry values at 5, 7.5, and 10 years of thermal cycling increased 265%, 401%, and 675%, respectively, versus values at 0 years of thermal cycling. This corresponds to an increase in surface deterioration caused by a breakdown between the adhesive binding to the wood particles. Apparently surface roughness is independent of the resin concentration employed (Figure 4). Surface roughness changes are associated with a deterioration of the surface due to swelling-shrinkage phases brought on by the temperature and relative humidity fluctuations [41,42].
3.4. Spectra Properties Influenced by Thermal Cycling
The color of wood is an important aesthetic feature of wood products, but it is not a functional feature [43,44,45,46]. However, the type or grade of engineered panels can be affected by the color of the product (Figure 5). Figure 6 represents the color properties of the CWPs in graphical form. Wood is susceptible to weathering and color changes and naturally fades in sunlight. Ultra-violet (UV) rays in sunlight are considered to be the major factor for wood color change [44,45]. UV inhibitors are routinely added to stains to combat this problem. In this study, we observed lightening or fading of the wood with thermal aging. Wood products can exhibit color changes by high temperatures [46,47,48]. High temperatures (e.g., ~60–65 °C) cause thermal degradation of hemicellulose and lignin and result in darkening. In our thermal testing, temperatures never exceeded more than 40 °C. Yet, we found that over the accelerated thermal aging years a marked lightness of the CWPs occurred. Most of the color changes occurred during the first 5 years of thermal aging, and thereafter no or little color changes occurred (Figure 5). Color changes in our thermal aging study were probably due to alterations of the chromophores in the carbohydrate portion of the CWPs and alterations of the natural extractives occurring the CWPs in response to the higher temperatures occurring in the spring, summer, and fall periods. Lightness values (L*) increase with thermal aging for both CWPs. However, the 15DDGS/PRO-85PiW composites exhibited less lighting than the 50DDGS/PRO-50PiW composites. For example, the 15DDGS/PRO-85PiW and 50DDGS/PRO-50PiW composites exhibited 18% and 65% increases in L* values, respectively, after 10 years of thermal cycling compared to their initial L* values (Figure 5). This is visually apparent in the photographic image (Figure 6). Thermal cycling caused changes in redness values (a*) in all composites. For example, 15DDGS/PRO-85PiW composites exhibited −27% change in a* values, respectively, after 10 years of thermal cycling while 50DDGS/PRO-50PiW exhibited +41% change in a* values, respectively, compared to their initial a* values. Overall the blue values (b*), chromaticity values (C*ab) and Hue angle values (H*ab) were found to increase with thermal cycling (Figure 5). 50DDGS/PRO-50PiW composites exhibited greater increases in b* and C*ab than 15DDGS/PRO-85PiW composites.
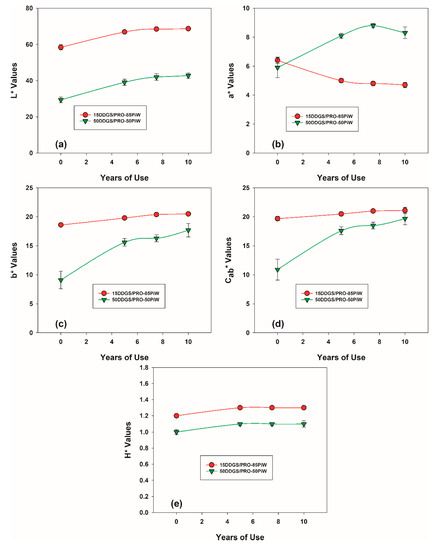
Figure 5.
The influence of thermal cycling on the spectral properties of various CWPs. Curve plots: (a) L* values, (b) a* values, (c) b* values, (d) Cab values, and (e) H* values.
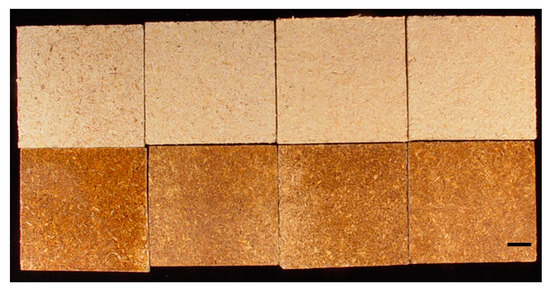
Figure 6.
Examples of CWP specimens subjected to thermal cycling: columns from left to right: 0, 5, 7.5, and 10 years of use. Top row, 15DDGS/PRO-85PiW composites; and bottom row: 50DDGS/PRO-50PiW composites. Bar = 10 mm.
3.5. FTIR Spectroscopic Analysis
FTIR analysis for ingredients and CWPs are presented in Figure 7. The FTIR spectra of DDGS and PRO were similar (Figure 7). Both DDGS and PRO showed a prominent peak occurring at the 3276–3284 cm−1 representing the free bound O-H and N-H bending [49,50]. The PiW ingredient showed this a similar peak at 3347 cm−1. DDGS and PRO showed a prominent peak at 2927–2935 cm−1, which represents the C-H symmetric and asymmetric stretching. PiW showed a similar peak at 2912 cm−1. Three common amide peaks were observed for DDGS and PRO at 1642–1645 cm−1 (C=O stretching, amide I), 1523–1548 cm−1 (N-H deformation, amide II), and 1229–1245 (N-H vibration, amide III). PiW only showed bands at 1634 cm−1 and 1027 cm−1. In contrast, CWPs showed similar banding patterns regardless of the accelerating thermal aging process administered (Figure 7). This suggests that few chemical changes occurred within the ingredients of the CWPs during the thermal aging processes. Peak changes in the 3920 cm−1 peak occurred in the 15DDGS/PRO-PW CWPs, indicating some moisture absorption occurs but less so in the 50DDGS/PRO-PW CWPs. This could be attributed to higher binding between the matrix and the wood, which prevented moisture uptake.
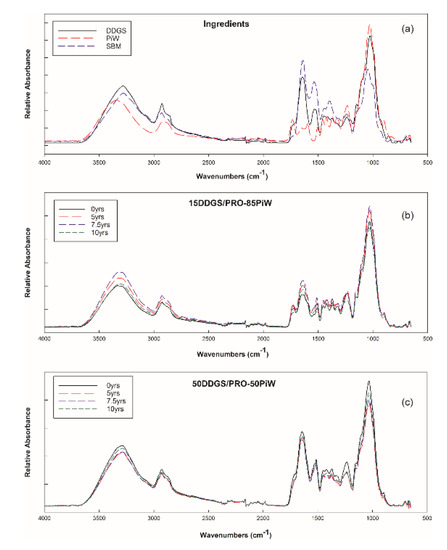
Figure 7.
FT-IR curves for ingredients and WPCs. Curve plots: (a) FT-IR ingredients, (b) FT-IR 15DDGS/PRO-85PiW, and (c) FT-IR 50DDGS/PRO-50PiW.
3.6. TGA Analysis
Figure 8 illustrates the mass loss of ingredients and CWPs as a function of temperature. Between 50 and 150–200 °C, loss of free and absorbed water occurs for both the ingredients and CWPs. Maximal degradation peak occurs for DDGS and PRO around 280–287 °C. The PiW ingredient similarly shows this peak, although its maximum degradation peak occurs at 350 °C. Similarly, the maximum degradation peak for 15 DDGS/PRO-85PiW CWPs occurs around 330 °C. For the 50 DDGS/PRO-50PiW CWP, the maximal degradation peak occurs around 308–335 °C. This suggests that a gradual shifting of the maximal peak is occurring, probably due to the bonding between the green adhesives (DDGS/PRO) and the reinforcement wood (PiW). Interestingly, there is a shift of the maximal degradation peak for the thermally treated CWPs from 331 °C to 306–316 °C. The reduction of this maximal peak is an indication of thermal degradation of the bonding between the adhesive and the wood reinforcement [50,51,52,53]. Soybean–wood composites that exhibited greater TGA mass residues were suggested to have greater thermal stability, which results in greater tensile strength [52,53]. Similarly, we noted that non-treated CWPs in our study had the highest TGA mass residues and the highest tensile strengths (Figure 3 and Figure 8). The residual mass of the original CWPs (i.e., 0 yr 15 DDGS/PRO-85PiW and 50 DDGS/PRO-50PiW) were higher than CWPs subjected to accelerated thermal aging (Figure 8). For example, residual mass of 0 yr-15 DDGS/PRO-85PiW was 19.7%, and this mass dropped progressively until at 10 yr-15 DDGS/PRO-85PiW it yielded only 4.5%. This indicates that these non-aged CWPs were more thermally stable and had higher binding properties than thermally aged CWPs [51,52,53].
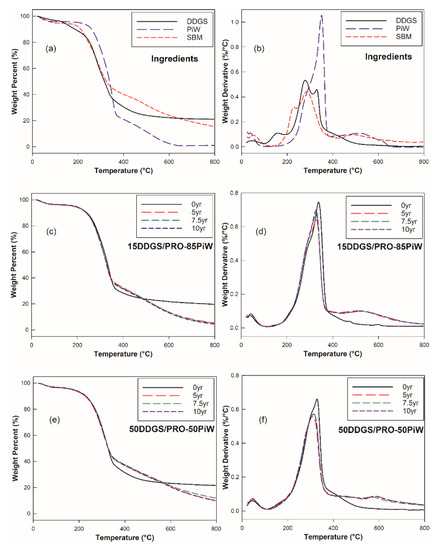
Figure 8.
Thermogravimetric analysis (TGA) and derivative thermogravimetric (DTG) curves for ingredients and CWPs. Curve plots: (a) TGA of ingredients, (b) DTG of ingredients, (c) TGA of 15DDGS/PRO-85PiW, (d) DTG of 15DDGS/PRO-85PiW, (e) TGA of 50DDGS/PRO-50PiW, and (f) DTG of 50DDGS/PRO-50PiW.
4. Conclusions
CWPs were fabricated employing 50% DDGS and 50% Prosante soybean flours as the matrix with pinewood reinforcements that rivaled the flexural properties of CWPs employing a matrix containing only Prosante flour only with pine wood. An evaluation of how these CWPs would respond to indoor nonthermal building environments that occur in Peoria, Il, USA was performed using accelerated thermal aging. The effect of ten years of thermal cyclic aging on the performance of CWPs was evaluated using a thermal environmental chamber that mimicked the Peoria, Illinois climate in 24 weeks (168 days) period whose interior CWPs was subjected to non-temperature controlled structures. After 10 years of thermal cyclic, aging all CWPs were found to retain their overall general dimensional shape and properties (i.e., thickness, length, and width). However, accelerated thermal cyclic aging had profound effects on the colorimetry, flexural, surface roughness, and dimensional stability properties of CWPs. Generally, thermal cyclic aging results in an overall deterioration of the CWPs properties, except for their dimensional stability properties, with the maximum loss occurring during the first 5 years of thermal aging. Dimensional stability properties improve after thermal aging. Based on the FTIR spectra, there were no obvious chemical changes in the composites regardless of accelerated thermal aging administered. However, the moisture content at 3920 cm−1 changed, indicating some moisture absorption occurs. TGA maximal peaks of ingredients and CWPs were decidedly different. TGAs showed that there were some thermal changes of CWPs that occurred during the first 5 years, but further aging of the CWPs did not show significant changes.
Author Contributions
B.T. and V.M.B. conceived and designed the experiments; N.M. prepared materials and panels, monitored the thermal testing equipment, and conducted mechanical testing; and B.T. and V.M.B. analyzed the data and wrote the paper. All authors have read and agreed to the published version of the manuscript.
Funding
This research received no external funding.
Acknowledgments
The authors thank Jason Adkins and Ashley Maness for TGA and FTIR analysis and Cargill Inc. for providing Prosante soybean flour. Mention of trade names or commercial products in this publication is solely for the purpose of providing specific information and does not imply recommendation or endorsement by the US Department of Agriculture. USDA is an equal opportunity provider and employer.
Conflicts of Interest
The authors declare no conflict of interest.
References
- Adhikari, B.B.; Appadu, P.; Kislitsin, V.; Chae, M.; Choi, P.; Bressler, D.C. Enhancing the adhesive strength of a plywood adhesive developed from hydrolyzed specified risk materials. Polymers 2016, 8, 285. [Google Scholar] [CrossRef] [PubMed]
- Chen, M.; Chen, Y.; Zhou, Z.; Lu, B.; He, M.; Sun, S.; Ling, X. Improving water resistance of soy-protein wood adhesive by using hydrophilic additives. Bioresources 2015, 10, 41–54. [Google Scholar] [CrossRef]
- Battegazzore, D.; Alongi, J.; Duraccio, D.; Frache, A. All natural high-density fiber- and particleboards from hemp fibers or rice husk particles. J. Polym. Environ. 2018, 26, 1652–1660. [Google Scholar] [CrossRef]
- Tisserat, B.; Harry-O’kuru, R. Osage orange, honey locust, black locust seed meal adhesives employed to fabricate composite wood panels. Fibers 2019, 7, 91. [Google Scholar] [CrossRef]
- Tisserat, B.; Hwang, H.S.; Vaughn, S.F.; Berhow, M.A.; Peterson, S.C.; Joshee, N.; Vaidya, B.N.; Harry-O’Kuru, R. Fiberboard created using the natural adhesive properties of distillers dried grains with solubles. Bioresources 2018, 13, 2678–2701. [Google Scholar] [CrossRef]
- Saenghirunwattan, P.; Noomhorm, A.; Rungsardthrong, V. Mechanical properties of soy protein based “green” composites reinforced with surface modified cornhusk fiber. Ind. Crops Prod. 2014, 60, 144–150. [Google Scholar] [CrossRef]
- Bacigalupe, A.; Poliszuk, A.K.; Eisenberg, P.; Escoba, M.M. Rheological behavior and bonding performance of an alkaline soy protein suspension. Int. J. Adhes Ahdes 2015, 62, 1–6. [Google Scholar] [CrossRef]
- Frihart, C.R.; Birkeland, M. Soy Products for Wood Bonding. In Proceedings of the 59th International Convention of Society of Wood Science and Technology, Curitiba, Brazil, 6–10 March 2016; Volume 7. Available online: https://www.fs.usda.gov/treesearch/pubs/51014 (accessed on 7 April 2020).
- Deepmala, K.; Singh, V.; Chauhan, S.; Jain, N. Soy protein based green composite: A review. RRJOMS 2017, 5, 66–77. [Google Scholar] [CrossRef]
- Pradyawong, S.; Zi, G.; Li, N.; Sun, X.S.; Wang, D. Adhesion properties of soy protein adhesives enhanced by biomass lignin. Int. J. Adhes Adhes 2017, 75, 66–73. [Google Scholar] [CrossRef]
- Distillers-Dried-Grains-with-Solubles. Available online: https://www.alibaba.com/showroom/distillers-dried-grains-with-solubles.html (accessed on 7 April 2020).
- Soybean-Meal-Prices. Available online: https://www.alibaba.com/showroom/soybean-meal-prices.html (accessed on 7 April 2020).
- Statista. Production of Soybean Meal Worldwide for 2013/14 to 2017/18, by Country (in Million Metric Tons). The Statistics Portal. Available online: https://www.statista.com/statistics/612537/soybean-meal-production-worldwide-by-country/ (accessed on 2 November 2019).
- Schafer, S. Equal Corn and Soybean Acres Predicted in 2018. Available online: https://www.agweb.com/article/equal-corn-and-soybean-acres-predicted-in-2018-naa-sara-schafer/ (accessed on 12 November 2019).
- Wisner, R. Estimated U.S. Dried Distillers’ Grains with Solubles (DDGS) Production & Use. AgMRC. Available online: https://www.extension.iastate.edu/agdm/crops/outlook/dgsbalancesheet.pdf (accessed on 12 November 2019).
- Mahat, K.B.; Alarifi, I.; Alharbi, A.; Asmatulu, R. Effects of UV light on mechanical properties of carbon fiber reinforced PPS thermoplastic composites. Macromol. Symp. 2016, 365, 157–168. [Google Scholar] [CrossRef]
- Fernández-Golfín Seco, J.I.; Díez Barra, M.R. Long-term deformation of MDF panels under alternating humidity conditions. Wood Sci. Technol. 1998, 32, 33–41. [Google Scholar] [CrossRef]
- Karlsson, O.A.; McNatt, J.D.; Verrill, S.P. Vacuum-Pressure Soak Plus Oven Dry as an Accelerated-Aging Test for Wood-Based Panel Products. For. J. 1996, 46, 84–88. Available online: https://www.fpl.fs.fed.us/documnts/pdf1996/karls96a.pdf (accessed on 12 November 2019).
- Tribulová, T.; Kačík, F.; Evtuguin, D.; Čabalová, I. Assessment of Chromophores in Chemically Treated and Aged Wood by UV-VIS Diffuse Reflectance Spectroscopy. Cellulose Chem. Technol. 2016, 50, 659–667. Available online: http://www.cellulosechemtechnol.ro/pdf/CCT5-6(2016)/p.659-667.pdf (accessed on 7 April 2020).
- George, M.F.; Cutter, B.C.; Chin, P.P.S. Freezing of Water in Hardboard: Absence of Changes in Mechanical Properties. Wood Fib. Sci 1992, 24, 252–259. Available online: https://wfs.swst.org/index.php/wfs/article/view/102 (accessed on 7 April 2020).
- Hann, R.A.; Black, J.M.; Blomquist, R.F. How Durable is Particleboard? Part II. The Effect of Temperature and Humidity. For. Prod. J. 1963, 13, 169–174. Available online: https://www.fpl.fs.fed.us/documnts/pdf1963/hann63a.pdf (accessed on 3 April 2020).
- Bowles, K.J.; Madhukar, M.; Papadopoulos, D.S.; Inghram, L.; McCorkle, L. The effects of fiber surface modification and thermal again of composites toughness and its measurement. J. Comp. Mat. 1997, 31, 552–579. [Google Scholar] [CrossRef]
- Barjasteh, E.; Bosze, E.J.; Tsa, Y.I.; Nutt, S.R. Thermal aging of fiberglass/carbon-fiber hybrid composites. Compos. Part. A 2009, 40, 2038–2045. [Google Scholar] [CrossRef]
- Lv, X.; Wang, R.; Liu, W.; Jiang, L. Surface and interface properties of carbon fiber composites under cyclical aging. Appl. Surf. Sci. 2011, 257, 10459–10646. [Google Scholar] [CrossRef]
- Odegard, G.M.; Bandypadhyay, A. Physical aging of epoxy polymers and their composites. J. Polym. Sci. Part B Polym. Phys. 2011, 49, 1695–1716. [Google Scholar] [CrossRef]
- Ahmed, K.; Nizami, S.S.; Raza, N.A.; Mahmood, K. Mechanical, swelling, and thermal aging properties of marble sludge-natural rubber composites. Int. J. Ind. Chem. 2012, 3, 12. [Google Scholar] [CrossRef]
- Isamil, H.; Muniandy, K.; Othman, N. Fatigue Life, Morphological Studies, and Thermal Aging of Rattan Power-Filled Natural Rubber Composites as a Function of Filler Loading and a Silane Coupling Agent. Bioresources 2012, 7, 841–858. Available online: https://ojs.cnr.ncsu.edu/index.php/BioRes/article/view/BioRes_07_1_0841_Ismail_MO_Fatigue_Morpholog_Thermal_Aging_Rattan_Composite/1352 (accessed on 3 April 2020).
- Patel, J.S.; Gao, E.; Boddu, V.M.; Stephenson, L.D.; Kumar, A. Accelerated long-term assessment of thermal and chemical stability of bio-based phase change materials. Build. Phys. 2016, 40, 1–12. [Google Scholar] [CrossRef]
- Gao, E.; Zhang, B.; Stephenson, L.D.; Boddu, B.; Trovillion, J. Prediction of Phase Change Material (PCM) Degradation. In Proceedings of the Thermal Performance of the Exterior Envelopes of Whole Buildings XII, Clearwater, FL, USA, 1–5 December 2013; Available online: https://web.ornl.gov/sci/buildings/conf-archive/2013%20B12%20papers/115-Gao.pdf (accessed on 7 April 2020).
- Climate-zone. Peoria. Available online: https://climate-zone.com/climate/united-states/illinois/peoria/ (accessed on 3 April 2020).
- European Committee for Standardization. Wood-Based Panels—Determination of Modulus of Elasticity in Bending and of Bending Strength; EN 310: 1993; European Committee for Standardization: Brussels, Belgium, 1993. [Google Scholar] [CrossRef]
- European Committee for Standardization. Particleboards and Fibreboards—Determination of Swelling in Thickness after Immersion in Water; EN 317 1993; European Committee for Standardization: Brussels, Belgium, 1993. [Google Scholar] [CrossRef]
- International Organization for Standardizations. Geometrical Product Specifications (GPS)—Surface Texture: Profile Method-Terms, Definitions and Surface Texture Parameters; ISO 4287:1997; International Organization for Standardizations: Genève, Switzerland, 1997. [Google Scholar] [CrossRef]
- Woodworkingnetwork.com. Temperature Change and Its Effect on Wood. Available online: https://www.woodworkingnetwork.com/magazine/fdmc-magazine/temperature-change-and-its-effect-wood (accessed on 3 April 2020).
- Gillespie, R.H. Accelerated Aging of Wood-Based Panel Products: A Review and Commentary. USDA-FS-SFES, Gen. Techn. Rept. SO-53. 1984. Available online: https://www.fpl.fs.fed.us/documnts/pdf1984/gille84a.pdf (accessed on 3 April 2020).
- European Committee for Standardization. Fibreboards—Specifications—Part. 2: Requirements for Hardboards; EN 622-2:1997; European Committee for Standardization: Brussels, Belgium, 1997. [Google Scholar]
- European Committee for Standardization. Particleboard—Specifications. Particleboard—Specifications; EN 312:2003; European Committee for Standardization: Brussels, Belgium, 2003. [Google Scholar]
- European Committee for Standardization. Fibreboards—Specifications—Part. 5: Requirements for Dry Process. Boards (MDF); EN 622-5:2006; European Committee for Standardization: Brussels, Belgium, 2006. [Google Scholar]
- Rolleri, A.; Roffael, E. Influence of the surface roughness of particleboards and their performance towards coating. Maderas Cienc. Technol. 2010, 12, 143–148. [Google Scholar] [CrossRef]
- Ayrilmis, N.; Benthien, J.T.; Thoemen, H. Effects of formulation variables on surface properties of wood plastic composite. Compos. Part B 2012, 43, 325–331. [Google Scholar] [CrossRef]
- Saad, S.; Kobori, H.; Kojima, Y.; Suzuki, S. Effect of accelerated aging treatment on a surface property and dynamic mechanical properties of commercial wood-based panels. J. Wood Sci. 2017, 63, 496–505. [Google Scholar] [CrossRef]
- Sahin, H.T.; Arslan, M.B. Weathering performance of particleboards manufactured from blends of forest residues with red pine (Pinus brutia) wood. Maderas Cienc. Technol. 2011, 13, 337–346. [Google Scholar] [CrossRef]
- Wbpionline.com. Price, Performance and Aesthetic Appeal, Wood Based Panel International. Available online: http://www.wbpionline.com/features/price-performance-and-aesthetic-appeal/ (accessed on 3 April 2020).
- J. Gibson McIlvain Co. Wood Color Changes Explained. Available online: https://www.mcilvain.com/wood-color-changes-explained/ (accessed on 3 April 2020).
- Woodmagazine.com. Color Changing Wood. Available online: https://www.woodmagazine.com/woodworking-tips/techniques/finishing/color-changing (accessed on 7 April 2020).
- Sandoval-Torres, S.; Jomaa, W.; Marc, F.; Puiggali, J.-R. Causes of color changes in wood during drying. For. Stud. China 2010, 12, 167–175. [Google Scholar] [CrossRef]
- Chen, Y.; Fan, Y.; Gao, J.; Stark, N.M. The effect of heat treatment on the chemical and color change of black locust (Robinia pseudoacacia) wood flour. Bioresources 2012, 7, 1157–1170. Available online: https://ojs.cnr.ncsu.edu/index.php/BioRes/article/view/BioRes_07_1_1157_Chen_FGS_Heat_Treat_Chem_Color_Wood (accessed on 3 April 2020). [CrossRef]
- Nguyen, T.; Nguyen, T.; Ji, X.; Guo, M. Predicting color change in wood during heat treatment using an artificial neutral network model. Bioresources 2018, 13, 6250–6264. Available online: https://ojs.cnr.ncsu.edu/index.php/BioRes/article/view/BioRes_13_3_6250_Nguyen_Color_Change_Wood_Heat (accessed on 3 April 2020).
- Ghahri, S.; Mohebby, B.; Pizzi, A.; Mirshokraie, A.; Mansouri, H.R. Improving water resistance of soy-based adhesive by vegetable tannin. J. Polym. Environ. 2018, 26, 1881–1890. [Google Scholar] [CrossRef]
- Yuan, C.; Chen, M.; Luo, J.; Li, X.; Gao, Q.; Li, J. A novel water-based process produces eco-friendly bio-adhesive made from green cross-linked soybean soluble polysaccharide and soy protein. Carbohydr. Polym. 2017, 169, 417–425. [Google Scholar] [CrossRef]
- Zhang, Y.; Zhang, M.; Chen, M.; Luo, J.; Li, X.; Gao, Q.; Li, J. Preparation and characterization of a soy protein-based high-performance adhesive with a hyperbranched cross-linked structure. Chem. Eng. J. 2018, 354, 1032–1041. [Google Scholar] [CrossRef]
- Gao, Z.; Zhang, Y.; Fang, B.; Zhang, L.; Shi, J. The effects of thermal-acid treatment and crosslinking on the water resistance of soybean protein. Ind. Crop Prod. 2015, 74, 122–133. [Google Scholar] [CrossRef]
- Chen, N.; Zheng, P.; Zeng, Q.; Lin, Q.; Rao, J. Characterization and Performance of Soy-Based Adhesives Cured with Epoxy Resin. Polymers 2017, 9, 514. [Google Scholar] [CrossRef]


© 2020 by the authors. Licensee MDPI, Basel, Switzerland. This article is an open access article distributed under the terms and conditions of the Creative Commons Attribution (CC BY) license (http://creativecommons.org/licenses/by/4.0/).