Article

Dissolution Kinetics of R-Glass Fibres: Influence of Water Acidity, Temperature, and Stress Corrosion

1
Department of Mechanical and Industrial Engineering (past: Department of Engineering Design and Materials), Norwegian University of Science and Technology, 7491 Trondheim, Norway
2
Institute of General Chemical Engineering, Faculty of Materials Science and Applied Chemistry, Riga Technical University, P. Valdena str. 3/7, Riga LV-1048, Latvia
3
Department of Environmental Science, University of Latvia, Riga LV-1004, Latvia
*
Author to whom correspondence should be addressed.
Fibers 2019, 7(3), 22; https://doi.org/10.3390/fib7030022
Submission received: 11 February 2019 / Revised: 3 March 2019 / Accepted: 5 March 2019 / Published: 12 March 2019
(This article belongs to the Special Issue Advances in Glass Fibers)

Abstract

:
Glass fibres slowly degrade due to dissolution when exposed to water. Such environmental aging results in the deterioration of the mechanical properties. In structural offshore and marine applications, as well as in the wind energy sector, R-glass fibre composites are continuously exposed to water and humid environments for decades, with a typical design lifetime being around 25 years or more. During this lifetime, these materials are affected by various temperatures, acidity levels, and mechanical loads. A Dissolving Cylinder Zero-Order Kinetic (DCZOK) model was able to explain the long-term dissolution of R-glass fibres, considering the influence of the p H , temperature, and stress corrosion. The effects of these environmental conditions on the dissolution rate constants and activation energies of dissolution were obtained. Experimentally, dissolution was measured using High Resolution Inductively Coupled Plasma Mass Spectrometry (HR-ICP-MS). For stress corrosion, a custom rig was designed and used. The temperature showed an Arrhenius-type influence on the kinetics, increasing the rate of dissolution exponentially with increasing temperature. In comparison with neutral conditions, basic and acidic aqueous environments showed an increase in the dissolution rates, affecting the lifetime of glass fibres negatively. External loads also increased glass dissolution rates due to stress corrosion. The model was able to capture all of these effects.

Graphical Abstract

1. Introduction

Glass fibres (GFs) are the most common fibrous reinforcement material used in fibre-reinforced composites (fibre-reinforced polymers; FRPs) [1]. The GFs possess desirable reinforcement material properties, such as high hardness, strength, and stiffness [2,3]. Various types of GFs exist, such as E, ECR, R, and S-glass, listed in the order of their increasing mechanical strength. Glass fibre-reinforced composites (GFRPs) are often used in structural applications in marine and offshore industries, as well as in the wind energy sector [4,5,6,7,8,9,10,11]. In these applications, GFRPs are continuously exposed to water and humid environments for decades, with a typical design lifetime being around 25 years or more [8]. When exposed to such environments, hydrolytic degradation of the glass material occurs [12,13], leading to a reduction of the mechanical strength and the initiation of corrosion-induced defects in fibres and composites [14]. The degradation of glass fibres due to environmental attacks can severely affect the performance of GFRPs [1]. Aqueous environments clearly have a negative effect on the fatigue properties of GFRPs and such environments act primarily to reduce the fibre strength [15]. The fact that even water may corrode glass fibres has been known for many years [15]. In the long-term, hydrolytic degradation occurs mainly via the glass dissolution mechanism [12]. Thus, understanding the dissolution behaviour of glass is necessary to predict the deterioration of the composite’s physical and mechanical properties [16].
The long-term environmental degradation of glass materials has been previously studied, mainly with respect to nuclear waste applications [17,18]. Most of the existing works on glass dissolution have been performed with bulk silicate glass and fibres are not studied often [12]. Recently, there has been an increasing interest in the environmental aging of FRPs, where R-glass and E-glass are often used as reinforcement [4,12,16,19,20,21]. Even so, very few studies exist on the kinetics of GF dissolution (mostly on E-glass) [22,23] and even less on R-glass [12,16].
The degradation of GFs in water can be divided into two kinetic regions (Phases I and II). Phase I is the short-term non-steady-state. Phase II is the long-term steady-state [12,16]. Phase I is complex and involves such processes as ion exchange, gel formation, and dissolution [12,17]. However, once the long-term kinetic region is reached, glass dissolution becomes a dominant process [12,17,24]. For the studied GFs, this transition to steady-state occurs in about a week (166 h) [12,16]. This time is very negligible compared to the typical design lifetime of about 25 years or more for the structures in which these materials are implemented [8]. Thus, as in the case of structural applications, when the long-term degradation is mainly of interest, dissolution is the governing process, which has to be understood and well-predictable.
During glass-water interactions, several chemical reactions may occur, shown in the chemical reactions (1)–(11) [12,17,24,25]:
( S i O N a ) + H 2 O ( S i O H ) + O H + N a +
( S i O K ) + H 2 O ( S i O H ) + O H + K +
( S i O ) 2 C a + H 2 O 2 ( S i O H ) + 2 O H + C a 2 +
( S i O ) 2 M g + H 2 O 2 ( S i O H ) + 2 O H + M g 2 +
( S i O A l = ) + H 2 O ( S i O H ) + ( = A l O H )
( S i O ) 2 F e + H 2 O 2 ( S i O H ) + 2 O H + F e 2 +
( S i O ) 3 F e + H 2 O 3 ( S i O H ) + 3 O H + F e 3 +
( S i O S i ) + O H ( S i O H ) + ( S i O )
( S i O ) + H 2 O ( S i O H ) + O H
S i O 2 + 2 H 2 O H 4 S i O 4
M e C l x H 2 O ( M e x + ) + x C l
The chemical reaction (10) can also be written as a combination of the subsequent reactions (12) and (13), meaning that initially H 2 S i O 3 is formed, which dissociates weakly and further reacts with water to form silicic acid:
S i O 2 + H 2 O H 2 S i O 3
H 2 S i O 3 + H 2 O H 4 S i O 4
The elements that are released during the degradation of R-glass are Na, K, Ca, Mg, Fe, Al, Si, and Cl [12]. The cumulative mass loss is the summary mass of all of the ions released [12]. The total mass loss is what causes the radius reduction [12]. As shown in the chemical reactions (1)–(11), various competing reactions happen in parallel. During Phase I, these reactions happen at independent rates, then one process later becomes limiting and dominates the behaviour (Phase II). Thus, the degradation process should be divided into two aforementioned stages. Furthermore, the sub-processes may follow individual kinetics and may be interdependent during Phase I [12]. During Phase I, the process is rather complex. It involves competing leaching mechanisms in addition to the dissolution reactions, i.e., ion exchange and gel formation. Therefore, it cannot be fully described with just one kinetic equation [12,17,24]. The complexity and varying rates of the competing processes during Phase I turn this stage of the glass degradation into a non-linear and non-steady-state process.
During Phase II, however, dissolution becomes dominant [17,24] and the process becomes steady-state, governed by the dissolution kinetics [12,16]. For R-glass, the contribution from Si to the total mass loss is the largest (56.1% by mass) and governs the long-term steady-state dissolution [12]. Once the steady-state is reached, the reactions proceed at constant independent rates [12]. It may be speculated that, during Phase II, an equilibrium composition of glass (likely different from the bulk composition) is obtained in the outer layers in contact with water. This allows elements to dissolve at a limiting rate and proportionally to their content in the outer layers of the glass, being indicative of the glass outer layer composition [12]. In other words, the long-term dissolution is dominated by the slowest dissolving element and the other elements following proportionally, at some equilibrium composition [12].
The non-linear non-steady-state stage of degradation can be approximated using the Dissolving Cylinder Zero-Order Kinetic (DCZOK) model, when the exact shape of the non-linear short-term part is not important, i.e., when the long-term degradation is of the most interest, such as in cases of the long service life of structures implementing GFs [8,12].
Glass dissolution kinetics depend on the surface area of the glass in contact with water. This surface area is proportional to the glass fibre radius. As the dissolution proceeds, the radius decreases and results in the deceleration of the mass loss; the DCZOK model accounts for this effect [12,16]. Glass dissolution kinetics are affected by the p H , temperature, glass composition (i.e., E, ECR, R, S-glass), solution composition (distilled water or seawater), surface area of the glass, the protective effect of the sizing, and the ionic strength of the solution, to a lesser extent. The temperature and p H are considered to be key parameters for the long-term glass dissolution [16,17,20,24,26,27]. Elevated temperatures accelerate the dissolution since the dissolution is exothermic [17,20,26]. The activity of the water is dependent on the composition of the aqueous environment, notably, on the, as well as ionic concentration of some species in the glass composition [28]. Interestingly enough, for R-glass, the sizing was found to slow down the dissolution kinetics of the GFs by almost an order of magnitude [16]. In addition, external loads may have an influence on glass dissolution kinetics, due to stress corrosion [27,28].
Humid and water environments reduce the strength of silicate glasses due to the growth of flaws, such as surface cracks, under the combination of stress and chemical attacks, known as stress corrosion [1,15]. The glass corrosion (dissolution) rate is accelerated by this stress [1].
The classical theory of stress corrosion involves the chemical reaction of a water molecule with silica, and was described elsewhere [27]. A model and the details of the chemical interaction between the adsorbed water and the Si–O bond was described by Michalske and Freiman [29]. Their model showed that water is efficient in the stress-activated corrosion of glass [27]. The basic mechanism of the stress corrosion reaction was related to the stress-enhanced thermal activation of a dissociative hydrolysis reaction, presented in Figure 1 [28,29].
Any molecule that is able to donate a proton (hydrogen ion and has a lone pair of electrons, such as water, can react with the strained Si–O bond at the tip of a crack, provided that the molecular diameter is smaller than 0.5 nm [30]. The first property is necessary for the harmonized reaction of adsorption and the chemical scission of the siloxane bridges of the glass network. The small diameter is necessary to avoid steric problems, so that the reactive water molecules can reach the strained bonds at the crack tip [28]. The constrained Si–O bonds have an enhanced chemical reactivity with water due to the intensity of the strain, as was shown via hydrolysis experiments for different siloxane ring structures, after [31]. Michalske and Bunker [32] also supported the effect of stress on the stress corrosion reaction rate. They proved this hypothesis by conducting molecular-orbital simulations of the stress corrosion reaction on distorted siloxane bonds. Several other reactions are possible for other glass compositions, but they all share the feature of being stress-enhanced and thermally activated, therefore explaining the exponential (Arrhenius type) relationship [28]. In addition, it is believed that the interaction of water with cations in the flaws leads to hydrolysis and a local increase in the concentration of hydroxyl ions, leading to an increase in the p H locally [33].
Various approaches have been proposed on how to model the kinetics of glass degradation. Grambow has developed a general rate equation for the reaction of glass in nuclear wastewater solutions with different p H levels, surface areas, times, temperatures, and compositions of the reagents [18]. Delage et al. described the dissolution of borosilicate glass in aqueous media using a combination of surface reaction kinetics and diffusion [34]. Mišíková et al. have studied the kinetics of the leaching of E-glass fibres in distilled water at various temperatures, linking the glass fibre dissolution to the temperature using statistical methods [22]. Tournié et al. presented an extensive experimental study of the glass corrosion mechanism in both acidic and basic solutions. They reported that a strong acid attack was dependent on the composition of the glass [13]. Ma et al. presented a model for the glass dissolution, based on the combination of the chemical affinity and diffusion [35]. Bashir et al. studied the kinetics of the dissolution of E-glass fibres in hot alkaline solutions using zero-order and shrinking cylinder models [23,36]. They reported that both an increased temperature and increased alkalinity (higher p H ) accelerated the dissolution reaction rates [23]. Bashir et al. concluded that the rate-limiting step was either the glass dissolution itself or the diffusion of hydroxide ions [23]. Krauklis and Echtermeyer developed and presented a Dissolving Cylinder Zero-Order Kinetic (DCZOK) model that explained the long-term dissolution of R-glass in water for both fibres [12,16] and GFRPs [16]. The DCZOK model is able to predict both the mass loss and the radius reduction kinetics due to dissolution [12].
Glasses formulated with significant amounts of various metal oxides, such as R-glass, have rarely been studied, but they are becoming popular for structural applications [12,18]. Thus, this work focuses on the dissolution kinetics of R-glass in water at various environmental conditions ( p H , temperature, stress corrosion). However, the model should be applicable to other types of glass as well, as SiO2 is the major component in virtually all types of glass [23].
The aim of this work is to study the effects of the p H , temperature, and stress corrosion on the R-glass fibre dissolution kinetics, in terms of the rate constants and activation energies, and to capture these effects using the Dissolving Cylinder Zero-Order Kinetics (DCZOK) model.

2. Materials and Methods

2.1. Materials

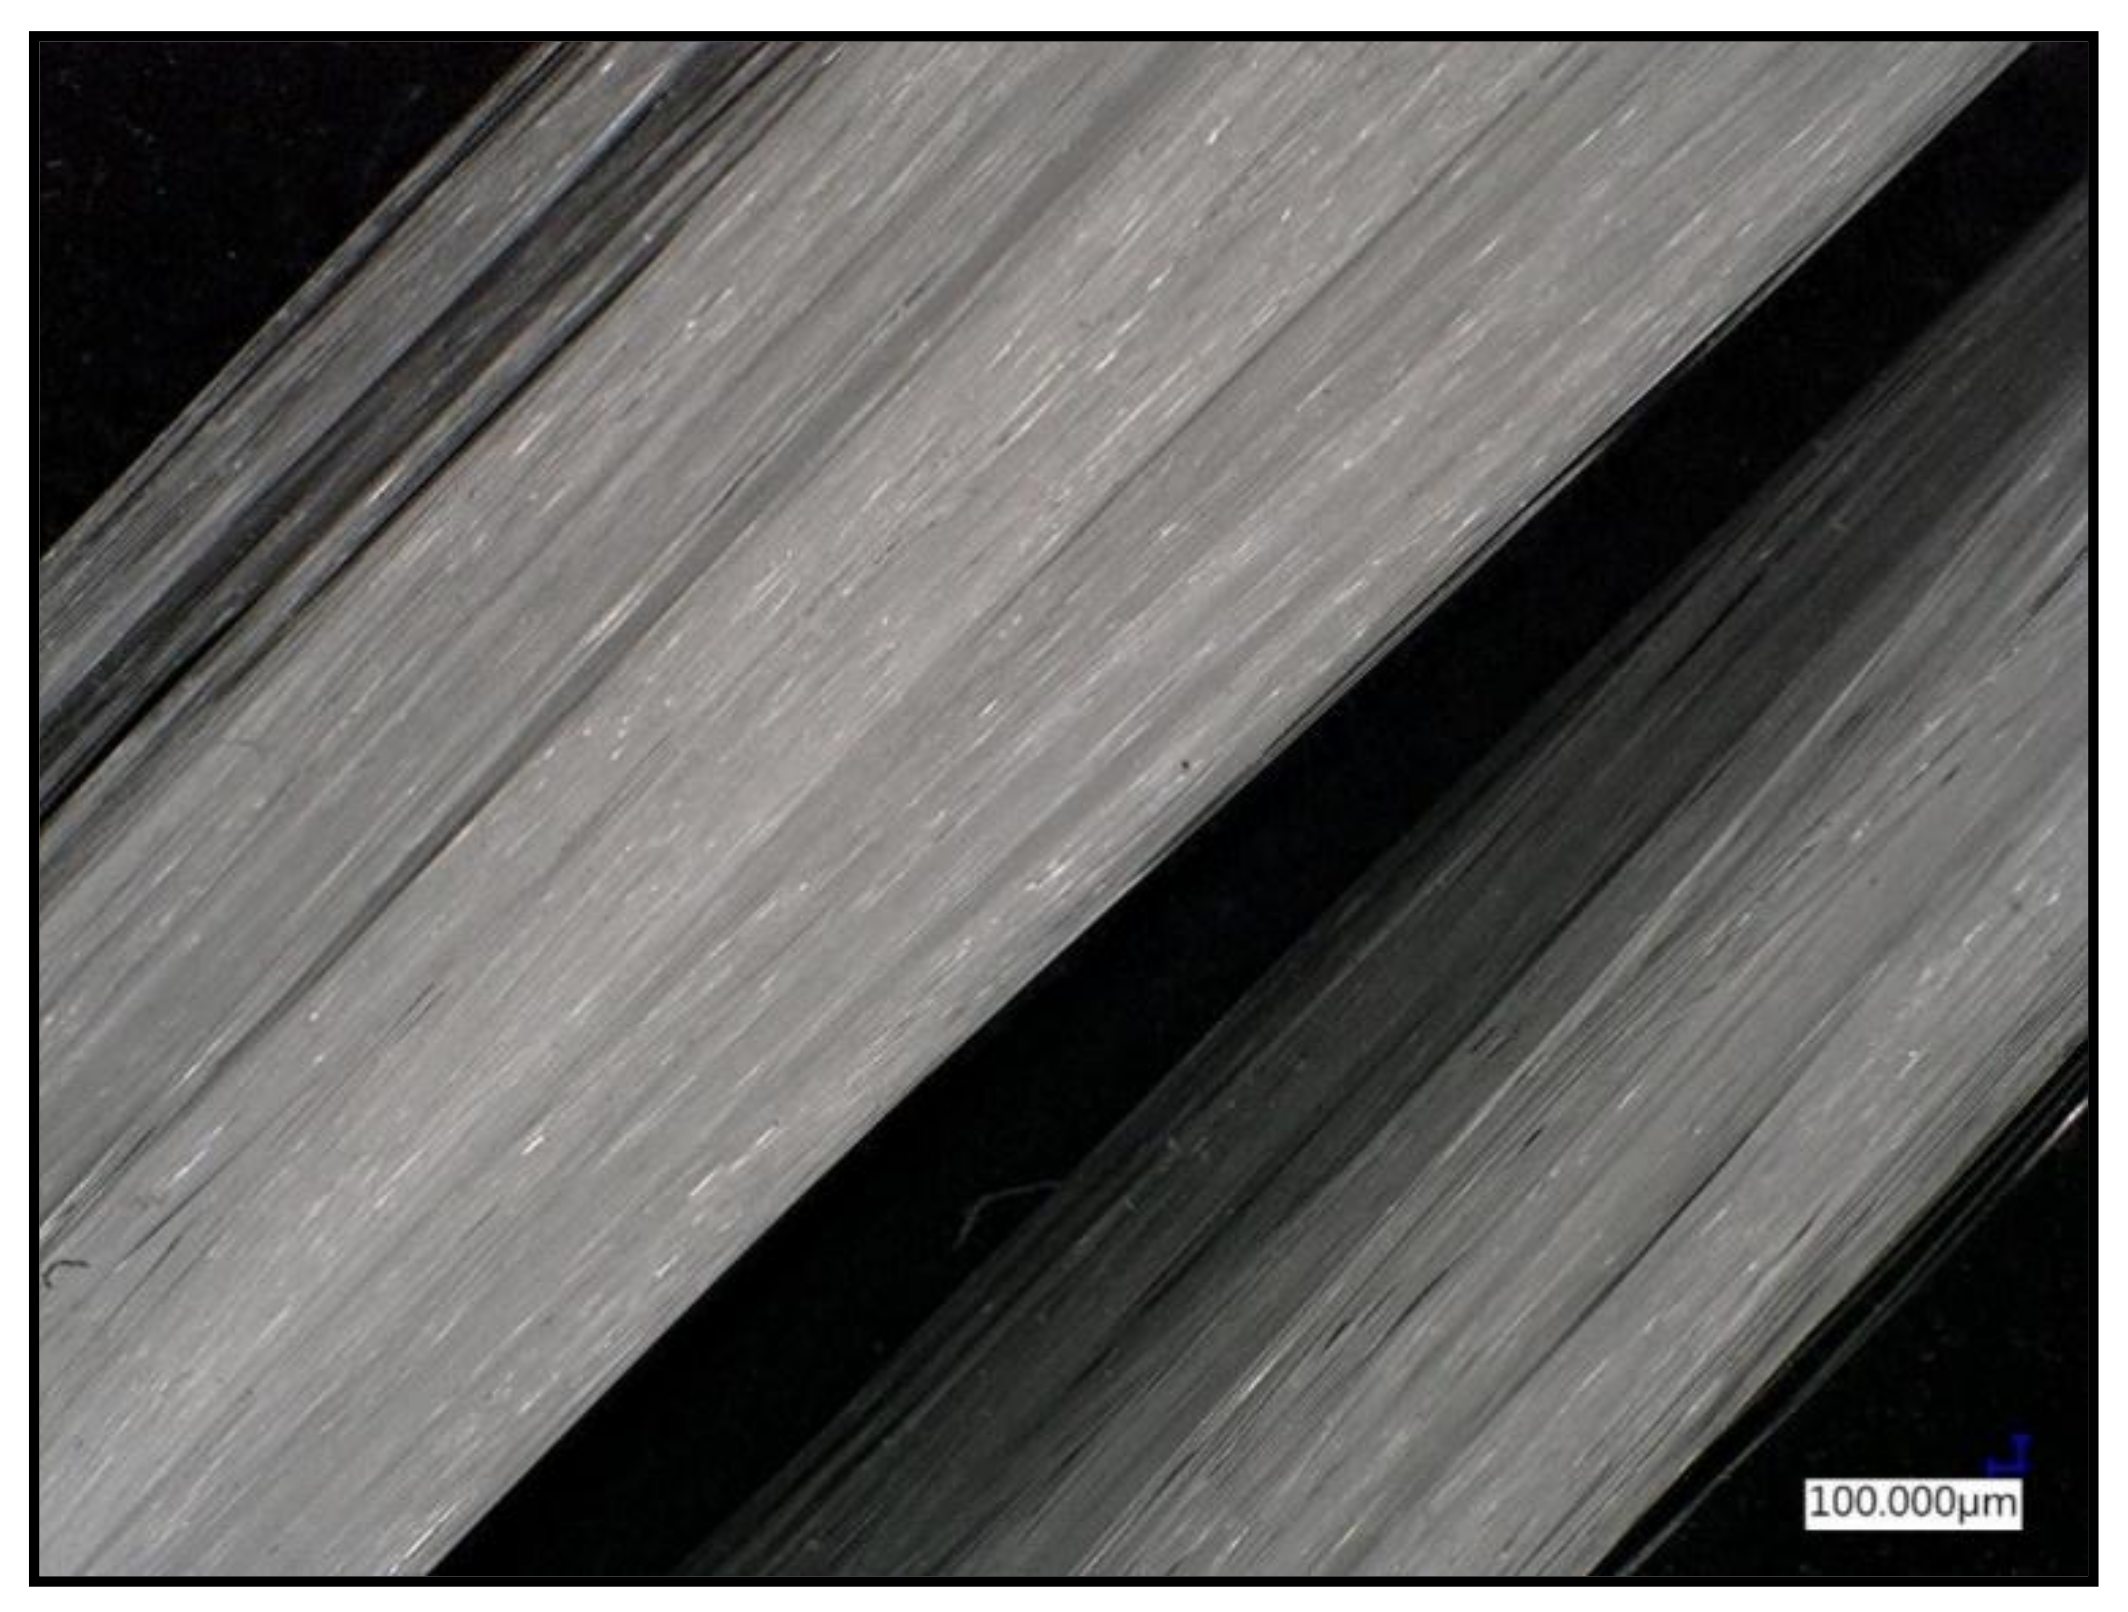
A typical glass fibre used for marine, oil, and gas applications was selected for this study. Boron-free and fluorine-free high strength, high modulus 3B HiPer-Tex™ W2020 R-glass fibre bundles were used. These were classified as high-strength, high modulus R-glass (defined by an international standard [37]). The average fibre diameter was 17 ± 2 μm [12,38]. The density of the glass ( ρ f ) was 2.54 g/cm3 [12,38]. The authors estimated that a bundle had about 4098 fibres [12]. The specific surface area of the glass fibres was determined to be 0.09 m2/g from the geometrical considerations, as a product of the number, circumference, and length of the fibres [12]. All of the fibres used during this work were sized, whereas the dissolution of unsized R-glass fibres was previously studied in another study by Krauklis and Echtermeyer [16]. A micrograph of R-glass fibre bundles is shown in Figure 2.
Distilled water (0.5–1.0 MΩ·cm) was used for the conditioning of the GF bundles, produced using a water purification system, the Aquatron A4000 (Cole-Parmer, Vernon Hills, IL, USA). The p H of the distilled water was 5.650 ± 0.010, being lower than neutral due to the dissolved CO2 from the atmosphere in equilibrium. IUPAC standard buffer solutions (Radiometer analytical, Lyon, France) were used for studying the effect of the p H on the kinetics of the GF dissolution. The solutions of p H 1.679 ± 0.010, 4.005 ± 0.010, 5.650 ± 0.010, 7.000 ± 0.010, and 10.012 ± 0.010 were used.

2.2. Methods

Glass Dissolution Experiments:

Aqueous dissolution experiments of GF samples were performed using a batch system. The samples for the dissolution study were weighed using AG204 analytical scales (±0.1 mg; Mettler Toledo, OH, USA) before the experiments. The samples were placed in inert closed vessels filled with 50 mL of distilled water or p H buffer solutions. The tight sealing of samples was ensured. The water-tight vessels, with the samples and water solutions in them, were placed into the water bath.
The water’s temperature (25, 40, 60, 80 °C) in the bath was controlled via proportional–integral–derivative (PID)-controlled heating, giving an accuracy of ±1 °C. A two-stage heating system was used in order to make sure that there is no contact of the sample water with potential contaminating ion release sources, i.e., the heating element.
p H measurements were performed using a standard MeterLab PHM210 p H -meter (Radiometer analytical, France) calibrated with IUPAC standard buffer solutions, providing an accuracy of ±0.010 p H .
The concentration of the dissolved ions in the water from the vessels was analysed over time via high resolution inductively coupled plasma mass spectrometry (HR-ICP-MS), providing glass dissolution kinetics. Experimentally, the total mass loss of glass material was measured as a sum of all of the ions’ release, quantified with HR-ICP-MS. Analyses were performed using a double focusing magnetic sector field ICP-MS Finnigan ELEMENT 2 (Thermo-Scientific, Waltham, MA, USA), equipped with a PrepFAST sample introduction system (ESI/Elemental Scientific) and an UltraClave pre-treatment/digestion machine (Milestone, Brøndby Kommune, Denmark). The acidification of samples was performed using an ultra-pure grade HNO3 SubPur (Milestone) in order to avoid the adsorption of ions into the wall of the sample vials that would otherwise give erroneous results.
The benefit of HR-ICP-MS versus gravimetric analysis is that it allows the measurement of the dissolution kinetics of each separate ion, as well as the total mass loss [12]. The data obtained from the HR-ICP-MS experiments are in the form of the non-cumulative mass concentration at each point in time (g/L) and need to be converted to the cumulative m d i s s o l v e d form by using Equation (14):
m d i s s o l v e d = V w a t e r 0 t c d t
where V w a t e r is the volume of a water sample using the HR-ICP-MS measurement. The V w a t e r used for the experiments was 50 mL. Equation (14) is valid for each individual ion release and for the total mass loss.
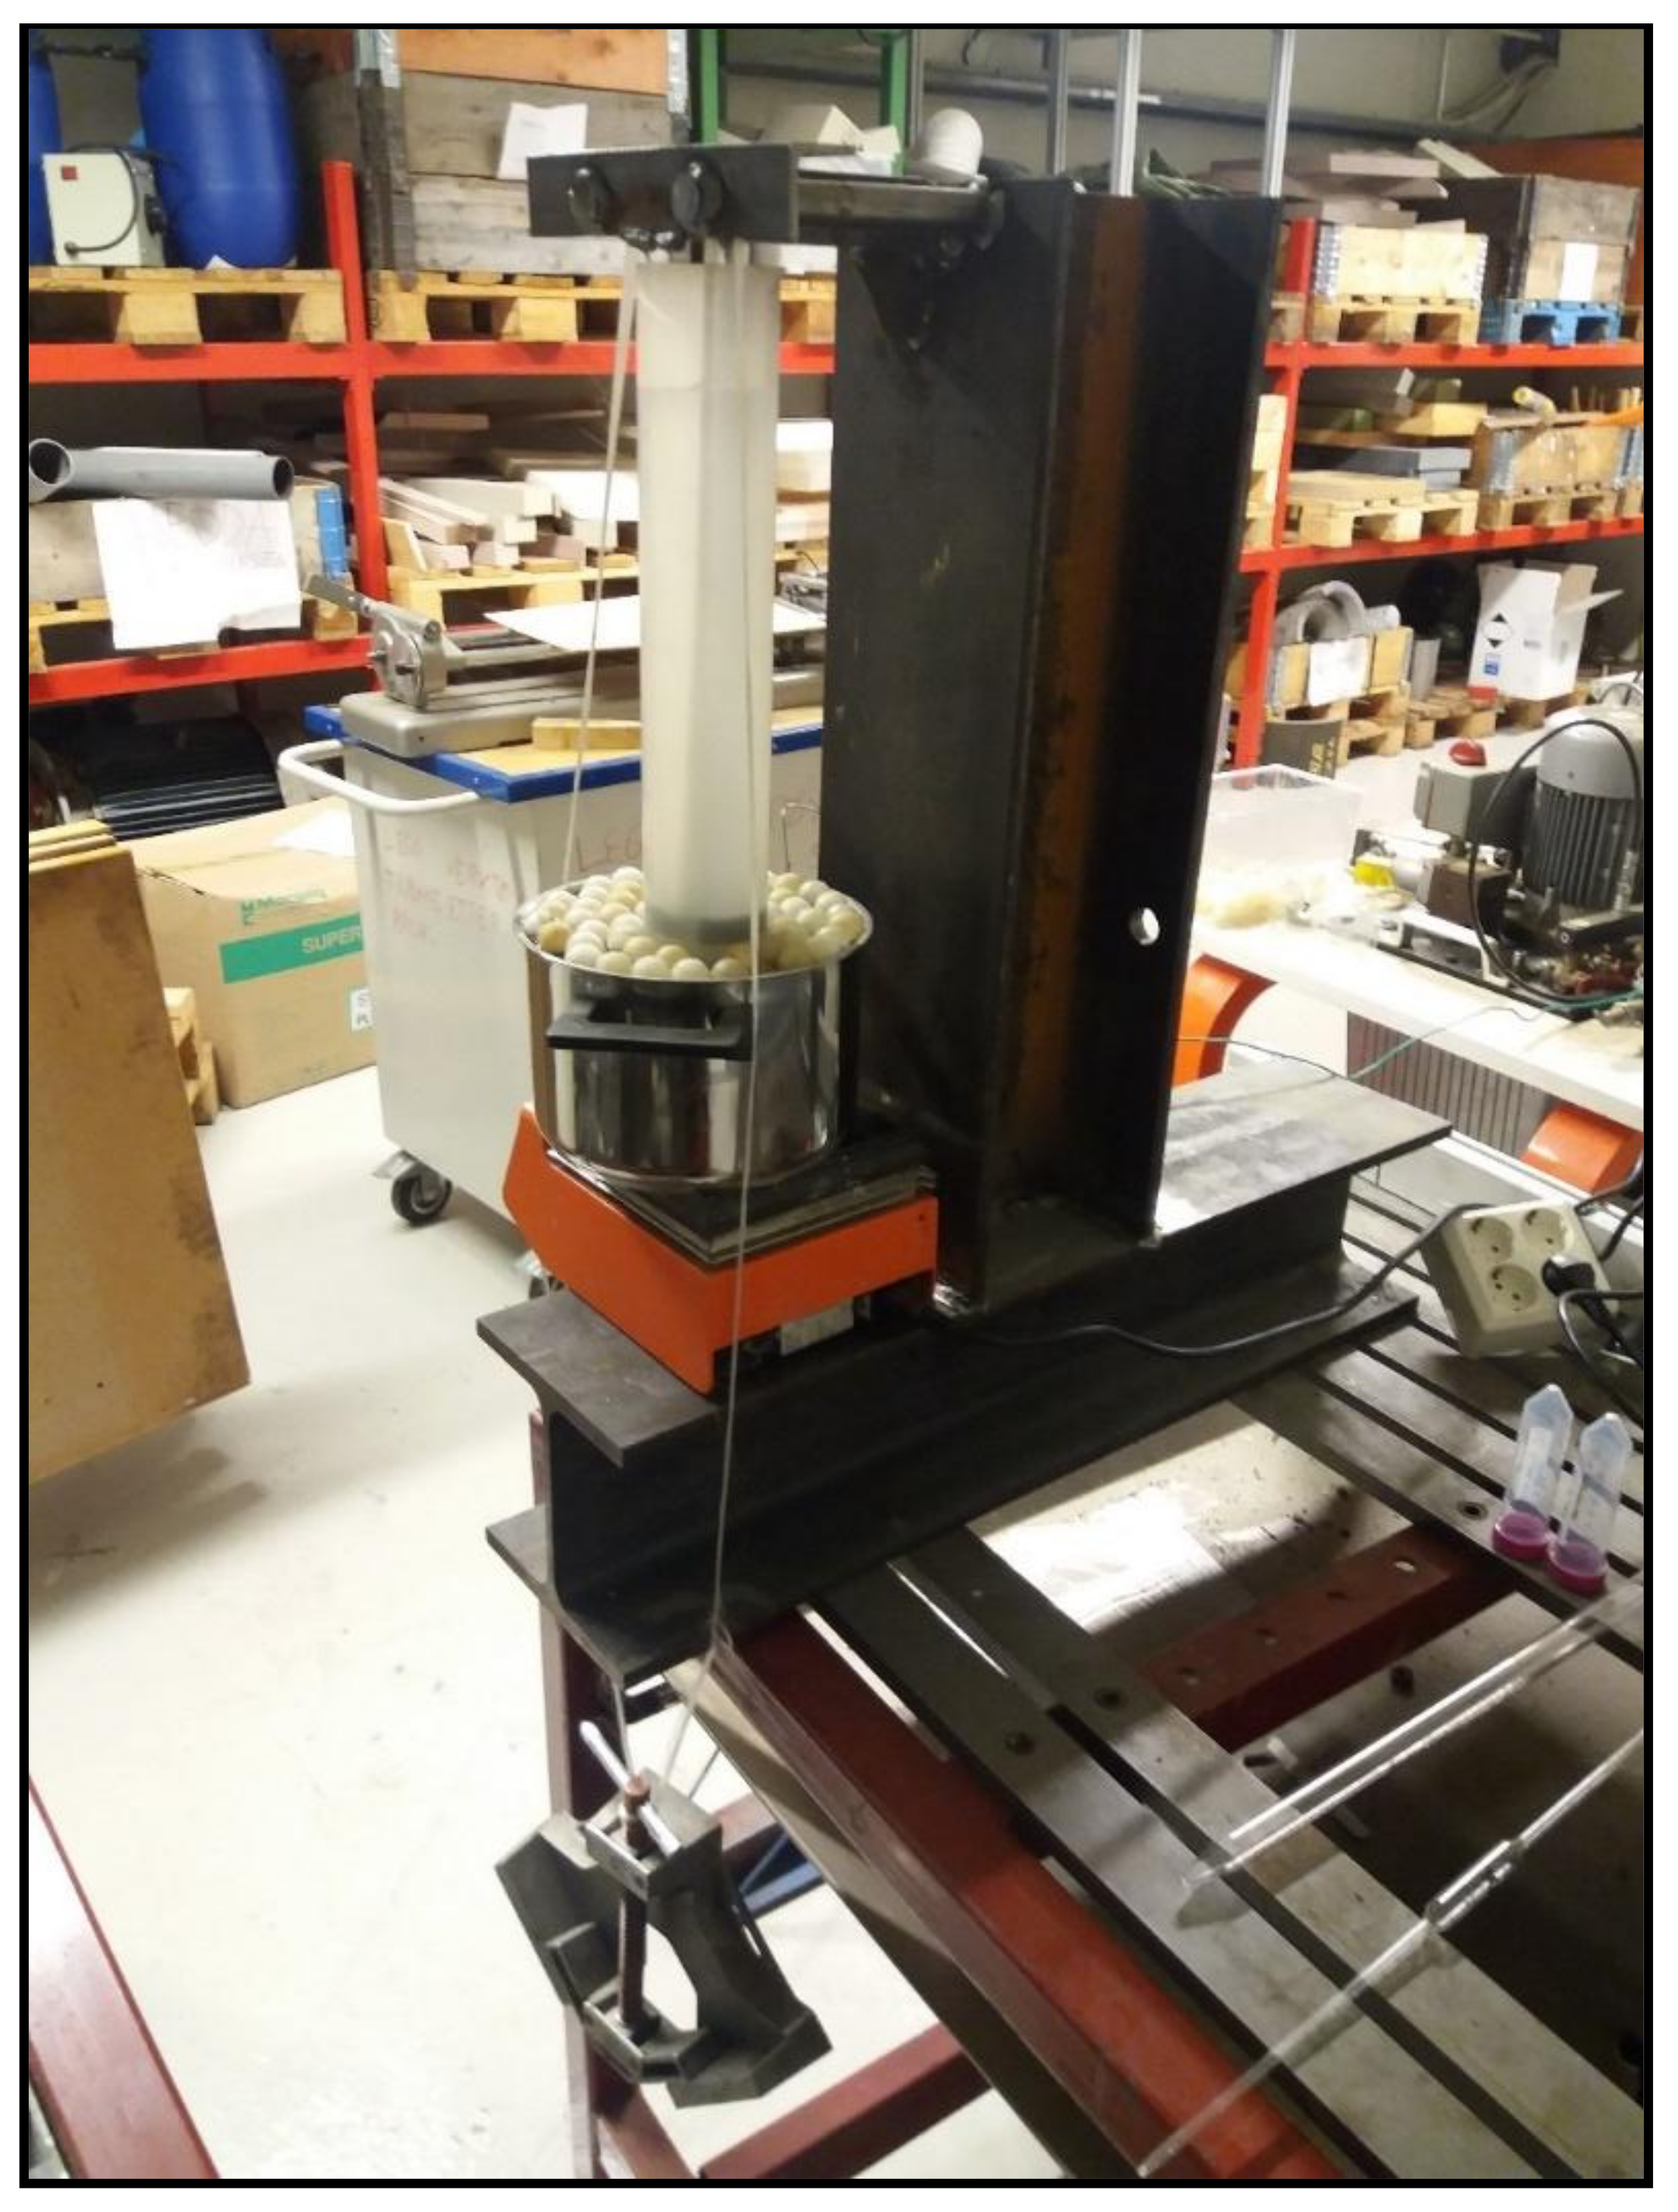
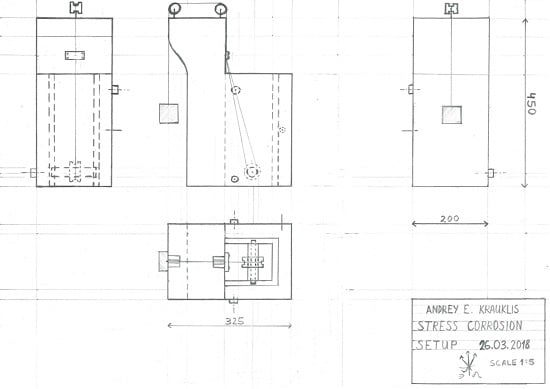
For studying the influence of the external loads on the dissolution kinetics, a stress corrosion rig was designed, built, and used during the experiments. The experimental rig is shown in Figure 3 and the design schematics of the stress corrosion setup are attached in Appendix A. The principle is that glass fibres are inside an inert cylinder pushed by an inert rod, which transfers the stress from the weights to the fibres. The water samples for the HR-ICP-MS analyses were taken from the main cylinder, where the distilled water was in contact with the stressed glass fibres. The temperature was PID-controlled by using a two-stage heating system, ensuring a temperature of 60 ± 1 °C. Polymeric spheres, seen in Figure 3, were used to reduce the evaporation rate of the heating water.

3. Dissolving Cylinder Zero-Order Kinetic (DCZOK) Model

3.1. The Model and Its Assumptions

An approach used to describe the glass dissolution kinetics in the fibres was proposed and explained in works by Krauklis and Echtermeyer [12,16]. This approach is used as a basis for this study. In this work, the kinetic constants are obtained for the Dissolving Cylinder Zero-Order Kinetic (DCZOK) model for various p H and temperature conditions, as well as for different stress levels. The protective effect of sizing is accounted for in this model [16].
The rate of the dissolution is dependent on the glass dissolution rate constant ( K 0 ), the glass surface area exposed to water (𝑆), and the effect of sizing ( ξ s i z i n g ) [12]. For fibres, in infinite water availability conditions, the dissolution, being a surface reaction, can be well-described with zero-order kinetics [23], but the decrease in the fibre radius, and thus in the surface area over time, should be accounted for [12]. For sizeless fibres, Equation (15) should be used [16]:
m t = K 0 S ( t )
For sized fibres, the effect of sizing, ξ s i z i n g , should also be accounted for, as shown in Equation (16) [16]:
m t = K 0 ξ s i z i n g S ( t )
where m is the total cumulative mass dissolved after time t , K 0 is a material/environment interaction property, and ξ s i z i n g is the protective effect of sizing. K 0 is affected by environmental effects [12].
In this Equation (16), K 0 and ξ s i z i n g are the time-independent parameters, whereas S changes with time. As the dissolution continues, the fibre’s radius is reduced and the total surface area ( S ) is decreased. This leads to a decrease in the dissolution rate. The ion release rate slows down linearly with a decrease in the fibre’s radius [12]. The glass fibre’s radius reduction is linear with time. The proportionality is given by the dissolution rate constant ( K 0 (g/(m2∙s))) and the density of the glass ( ρ g l a s s (g/m3)) [12]. A linear radius decrease of the glass fibres over time was previously experimentally observed elsewhere [23] and is accounted for in the DCZOK model [12].
The effect of sizing on the glass dissolution ( ξ s i z i n g ) for the studied R-glass is 0.165, protecting the fibres from water by almost an order of magnitude, in terms of dissolution rates. The effect of sizing ( ξ s i z i n g ) is assumed to be time-independent [16]. ξ s i z i n g goes into the model linearly, since fibres are covered in “islands” or patches of sizing, meaning not the whole surface is coated [39]. These areas of the bare unsized glass dominate the dissolution behaviour (the difference being roughly an order of magnitude) [16].
Taking into account the geometry of the fibres, the mass loss kinetic DCZOK model equation in its differential form is the following, as shown in Equation (17) [12]:
m t = 2 n π l ( r 0 K 0 ξ s i z i n g K 0 2 ξ s i z i n g 2 ρ g l a s s t )
where n is the number of fibres (-), l is the length of the fibres (m), r 0 is the initial fibre radius (m), and ρ g l a s s is the density of the glass (g/m3).
The model shows the rate of mass loss due to dissolution. It can be used for the total mass loss ( m t ) , as well as for Si ( m S i t ) or another ion’s release.
As can be seen from the differential expression of the DCZOK model in Equation (17), the radius reduction over time is accounted for in the model. The p H , temperature, and stress corrosion affect the material-environment energy-activated interactions, thus affecting the dissolution rate constants ( K 0 ) , as represented by Equation (18).
K 0 = f ( p H , T , σ )
where p H is the acidity of the environment (-), T is the temperature (K), and σ is the stress (MPa).
The model involves the following assumptions: the model is deterministic and all of the glass fibres are assumed to have the same initial fibre radius ( r 0 ) ; the cross-sectional surface area at the ends of the fibres is assumed negligible in the surface area calculations; the length of the fibres ( l ) is assumed to be constant during the whole dissolution process. During the whole degradation process, the density of the glass material is assumed to be constant ( ρ g l a s s ). The effect of sizing ( ξ s i z i n g ) is assumed to be independent of the environmental conditions and time [12,16]. For free fibre bundles (not embedded in the composite), the condition of the infinite availability of water is ensured by using large volumes of water, thus making the rate of the reaction independent of the water concentration [12,16].

3.2. The Effect of the Environment on the Dissolution Rate Constant

It has been reported that the temperature dependence of the rate of the glass fibre radius reduction follows an exponential trend and the diameter reduction is linearly related to the loss of material in fibres due to dissolution [12,23]. The fact that the temperature dependence of a dissolution rate constant is described by the Arrhenius equation is also confirmed by the evidence reported further in this manuscript. The temperature dependence of a dissolution rate constant can be described using the Arrhenius equation (Equation (19)), being an exponential function:
K 0 = A e E A ( p H , σ ) R T
where A is the pre-exponential factor (g/(m2∙s)), R is the gas constant being 8.314 J/(mol∙K), T is the absolute temperature (K), and E A is the activation energy (J/mol). Both the p H and stress corrosion are thought to affect the activation energy term in the Arrhenius equation [31,40].
The activation energy can be obtained through the graphing of the constant p H and σ , using Equation (20) [18]:
l n K 0 = E A R 1 T + l n A
The rate constant can be calculated for each temperature from the general differential mass loss DCZOK model equation. To obtain the E A , the   l n K 0 is plotted against 1 T . The pre-exponential factor ( A ) is assumed to be constant. The DCZOK model can be expanded (Equation (21)):
m t = 2 n π l ( r 0 K 0 ξ s i z i n g ( K 0 ξ s i z i n g ) 2 ρ g l a s s t ) = 2 n π l ( r 0 A e E A ( p H , σ ) R T ξ s i z i n g ( A e E A ( p H , σ ) R T ξ s i z i n g ) 2 ρ g l a s s t )

3.3. Modelling of the Two Distinct Stages of Glass Degradation

Mass loss curves made during the aging of glass over time can be divided into two parts: Short-term non-steady-state degradation and long-term steady-state dissolution [12]. When the long-term dissolution (Phase II) is of the most interest, the shape of the non-linear short-term stage (Phase I) is not important. In such case, an approximate solution can then be used to describe the Phase I of degradation as well, using the DCZOK model. In the case when the short-term degradation (Phase i) is of the most interest, the kinetic models for each of the individual sub-processes, i.e., ion exchange, gel formation, and dissolution, should be implemented.
The model can also predict the fibre radius reduction kinetics during the dissolution, using the same four parameters that can be determined experimentally [12]. The DCZOK model can be used to describe the dissolution for each element separately, as well as for the total mass loss. The glass mass loss (all elements included) is described by four parameters ( r 0 ,   t s t ,   K 0 I ,   K 0 I I ). For each ion, the individual K 0 I and K 0 I I values have to be obtained, while the t s t and r 0 for each individual ion release are the same and are equivalent to that for the total mass loss [12]. K 0 I and K 0 I I are the dissolution rate constants (g/(m2∙s)) for the Phase I and Phase II regions, respectively.
For each material, the activation energy function ( E A ( p H , σ ) ) of the p H and stress has to be established experimentally for both the short-term and long-term stages of glass degradation.
The total material loss and the release of Si at various environmental conditions were modelled using the DCZOK model Equation (21) and the rate constants were obtained and reported.

4. Results

From the measured cumulative concentration data of the ions released during the dissolution of glass, the dissolution rate constants were obtained using non-linear regression for Si ( K 0 S i I and K 0 S i I I ) and for the total mass loss ( K 0 t o t a l I and K 0 t o t a l I I ). The Generalized Reduced Gradient (GRG) non-linear regression method was used. It involved minimization of the sum of the squares of the differences between the modelled values and the experimental values. The obtained parameters are systematized in Table 1, Table 2 and Table 3 for the effect of the p H , temperature, and stress, respectively. The values obtained are comparable with the dissolution rates of other glass fibres, reported in the literature [12,16,41].
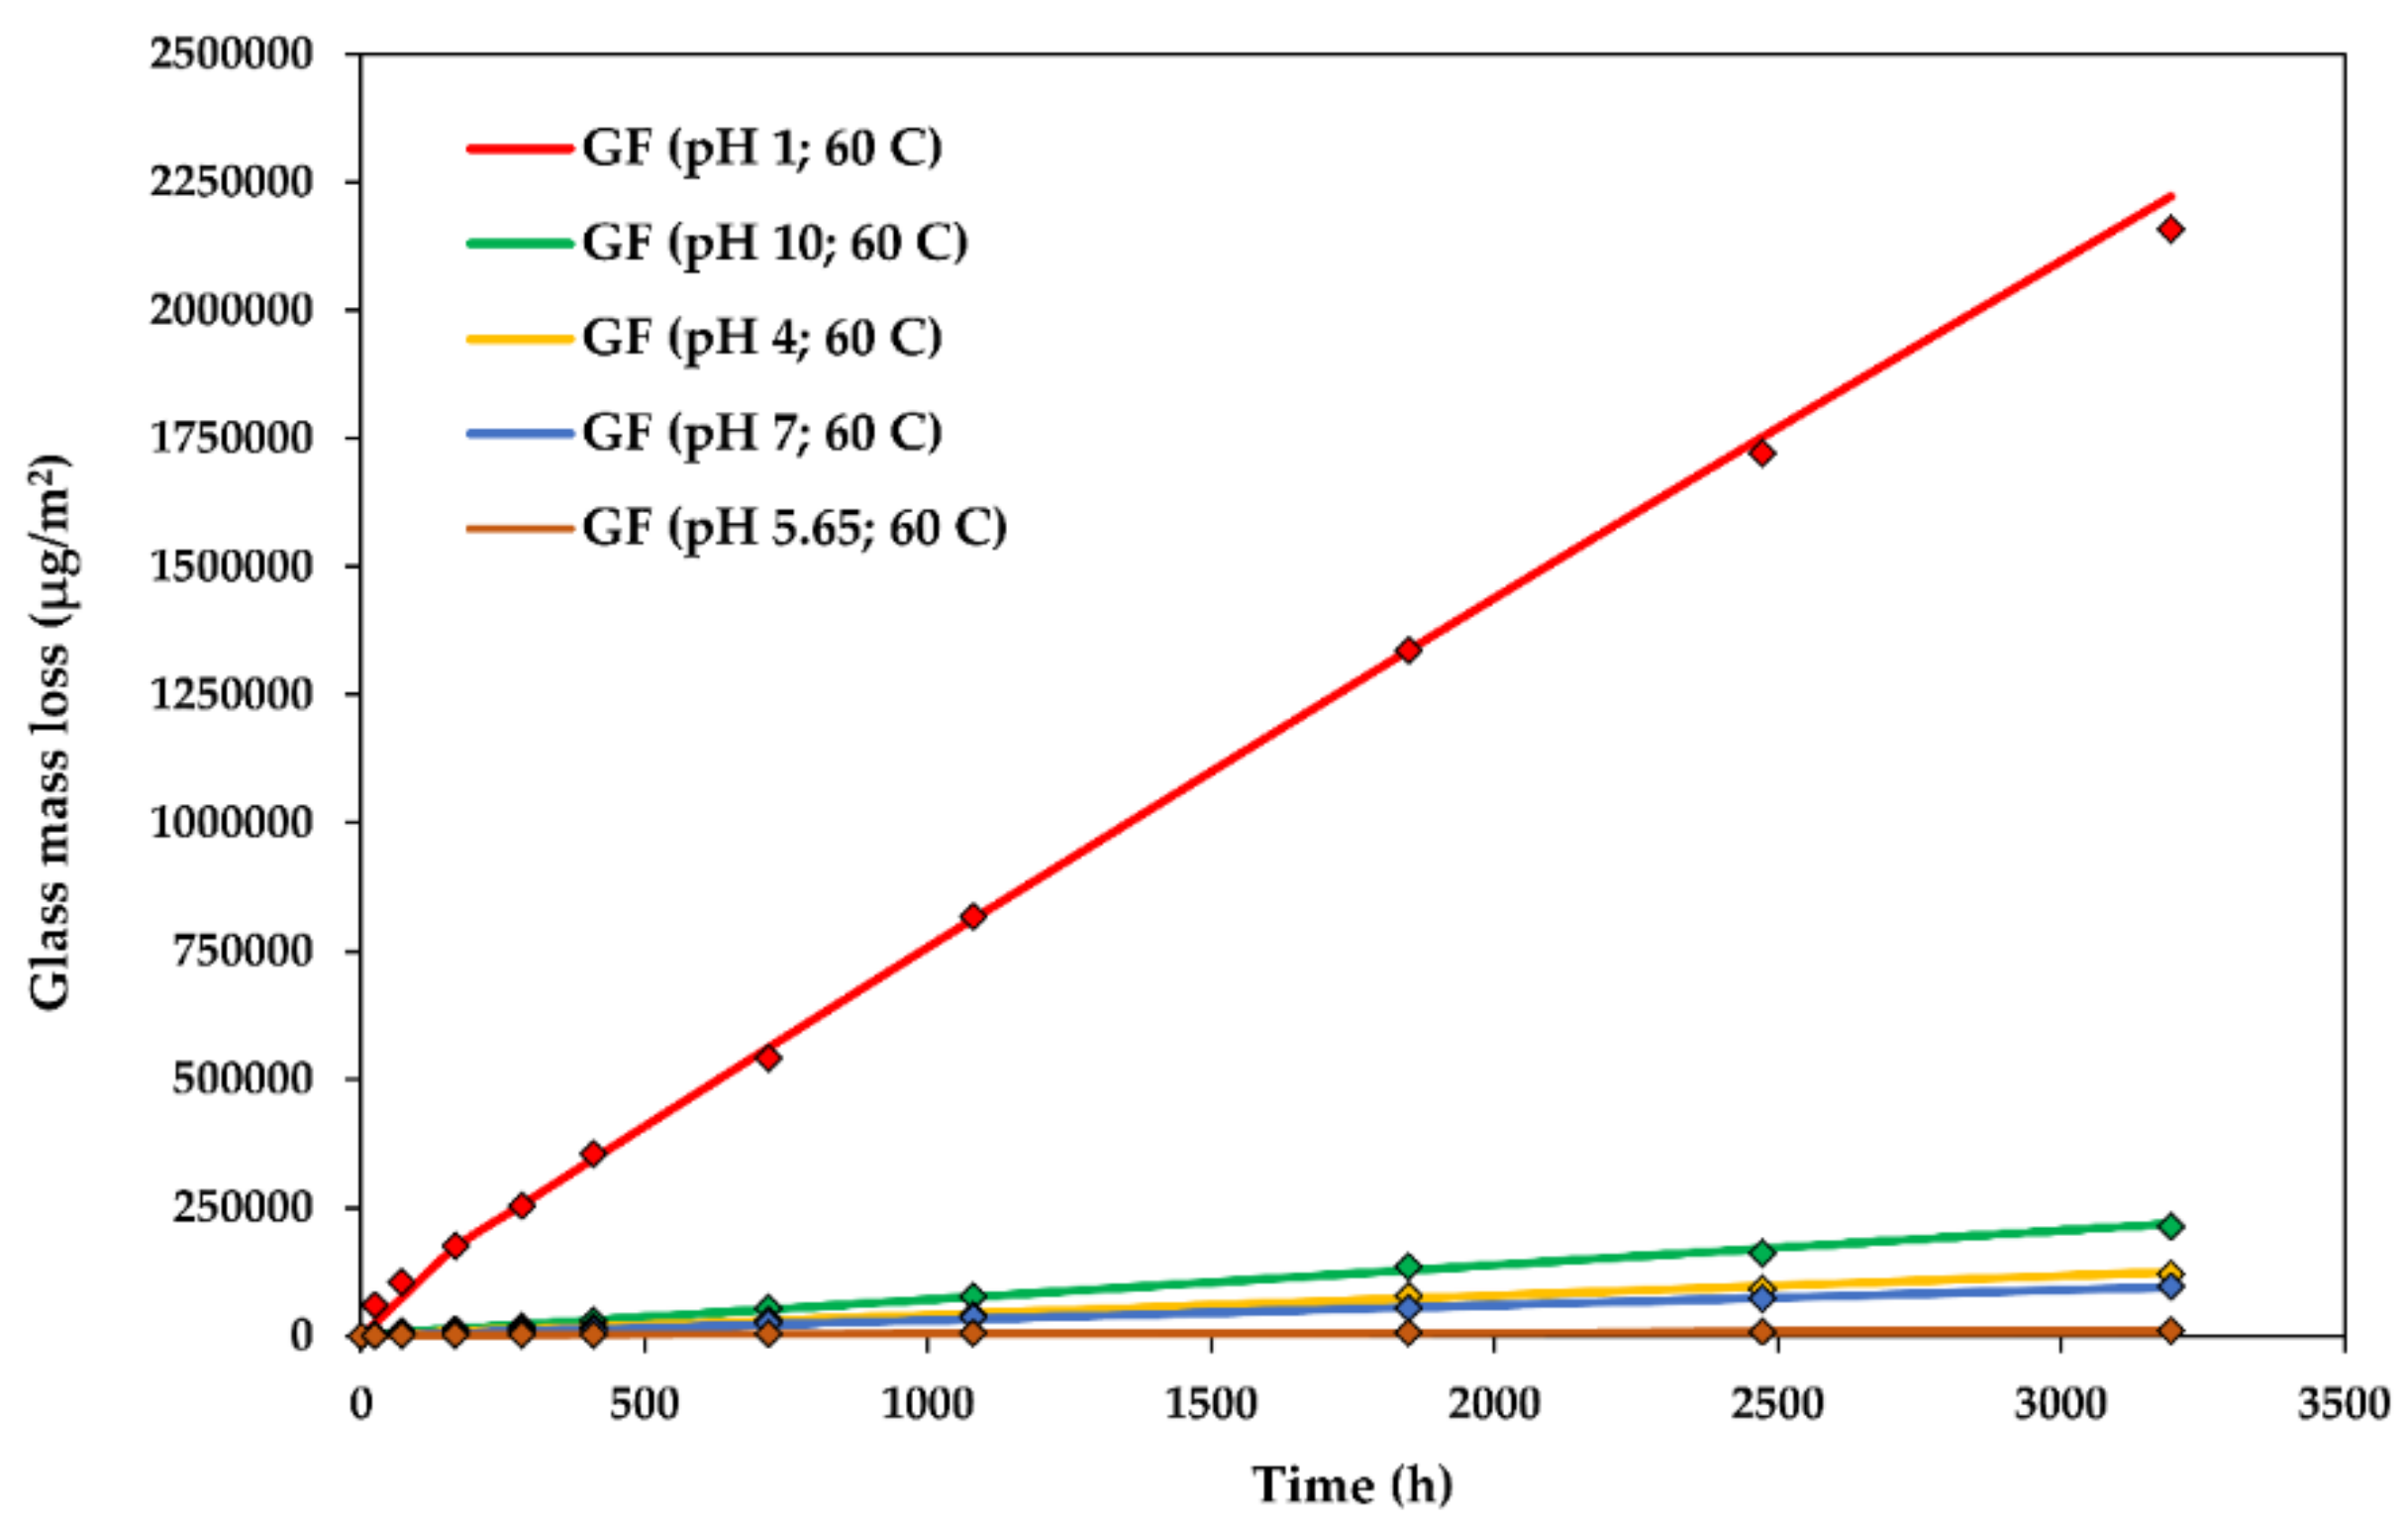
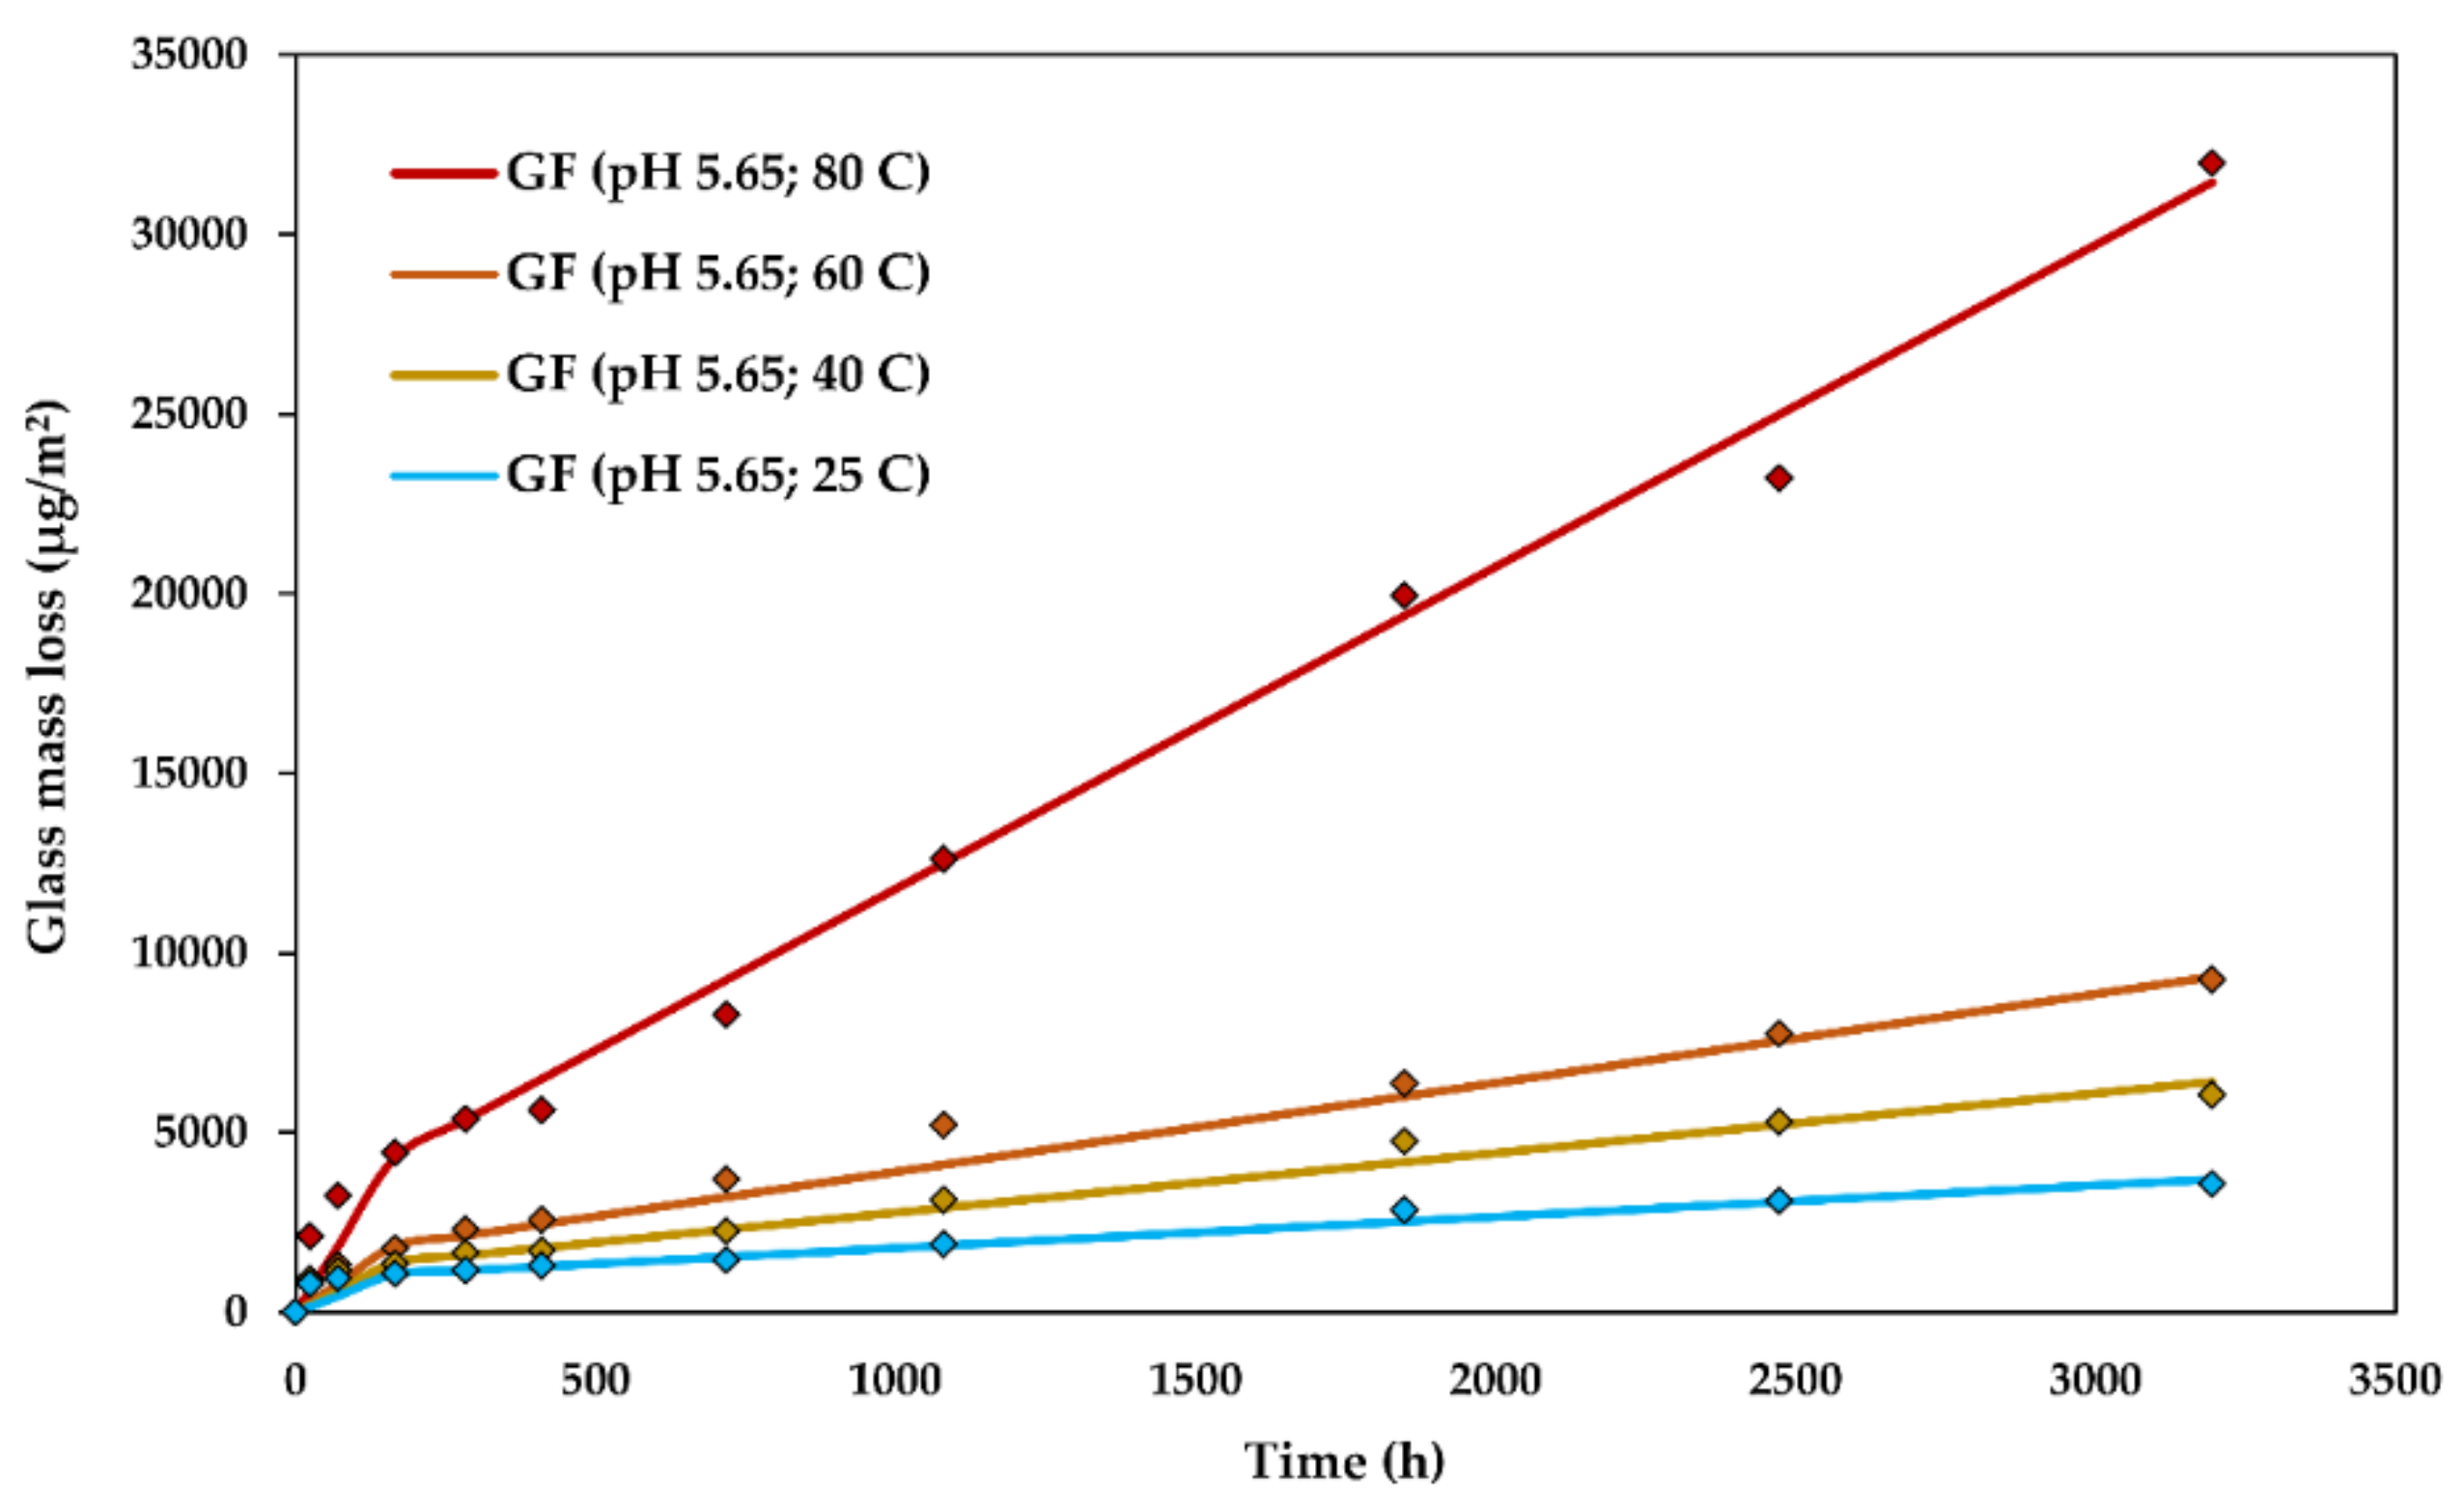
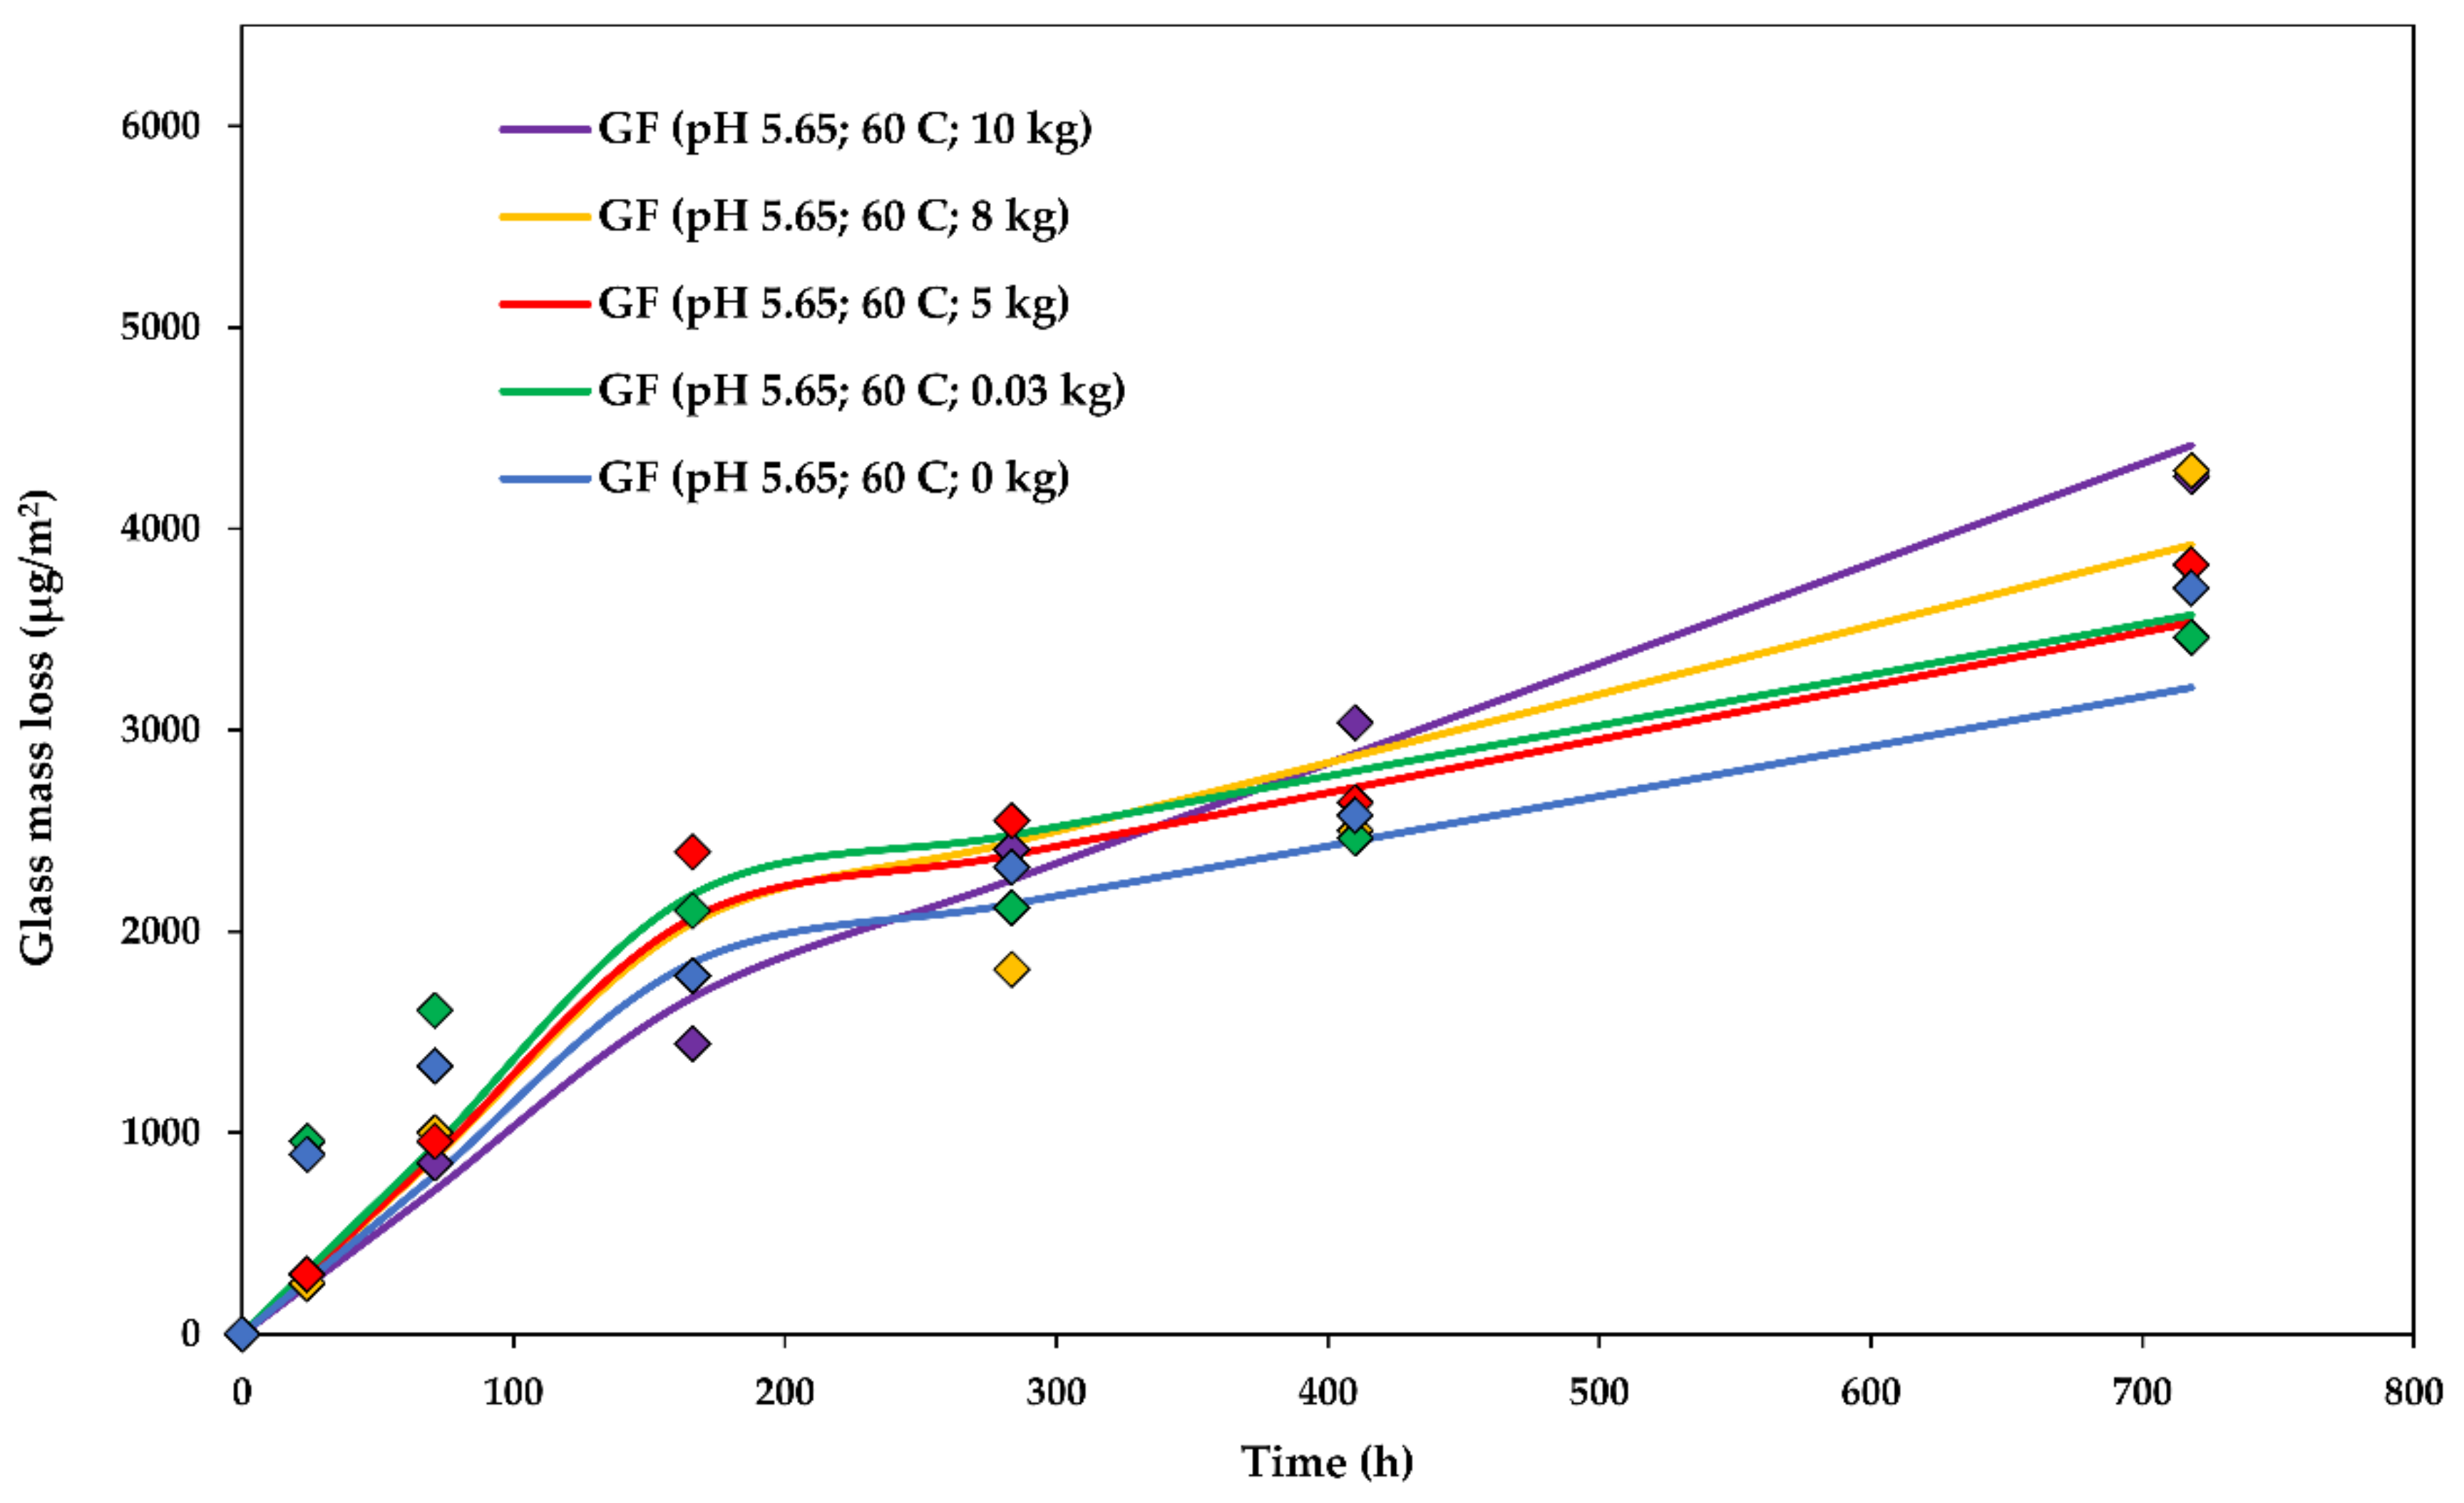
In Figure 4, and further also for the glass dissolution kinetics at various stress levels and temperatures, the points represent the experimental data, whereas the lines represent the DCZOK modelled curves using the rate constants reported in Table 1, Table 2 and Table 3, respectively. In figures of the glass dissolution kinetics at various environmental conditions, the glass mass loss is reported as normalized per the initial surface area of the fibres ( S 0 ), as is common for surface reaction kinetics [12,16,42]. The effect of sizing on the glass dissolution ( ξ s i z i n g ) for the studied R-glass was 0.165 [16].

4.1. Effect of p H on the Glass Dissolution Kinetics

The dissolution rate constants for the glass dissolution from fibres in water at various pH levels at 60 ± 1 °C are shown in Table 1. This steady-state was achieved after about a week.
The experimental glass dissolution data and the modelled DCZOK dissolution curves for various p H levels are shown in Figure 4.
It is possible to obtain a p H influence on the activation energies of dissolution by rearranging Equation (19) into the following form (Equation (22)):
E A = R T ( l n A l n K 0 )
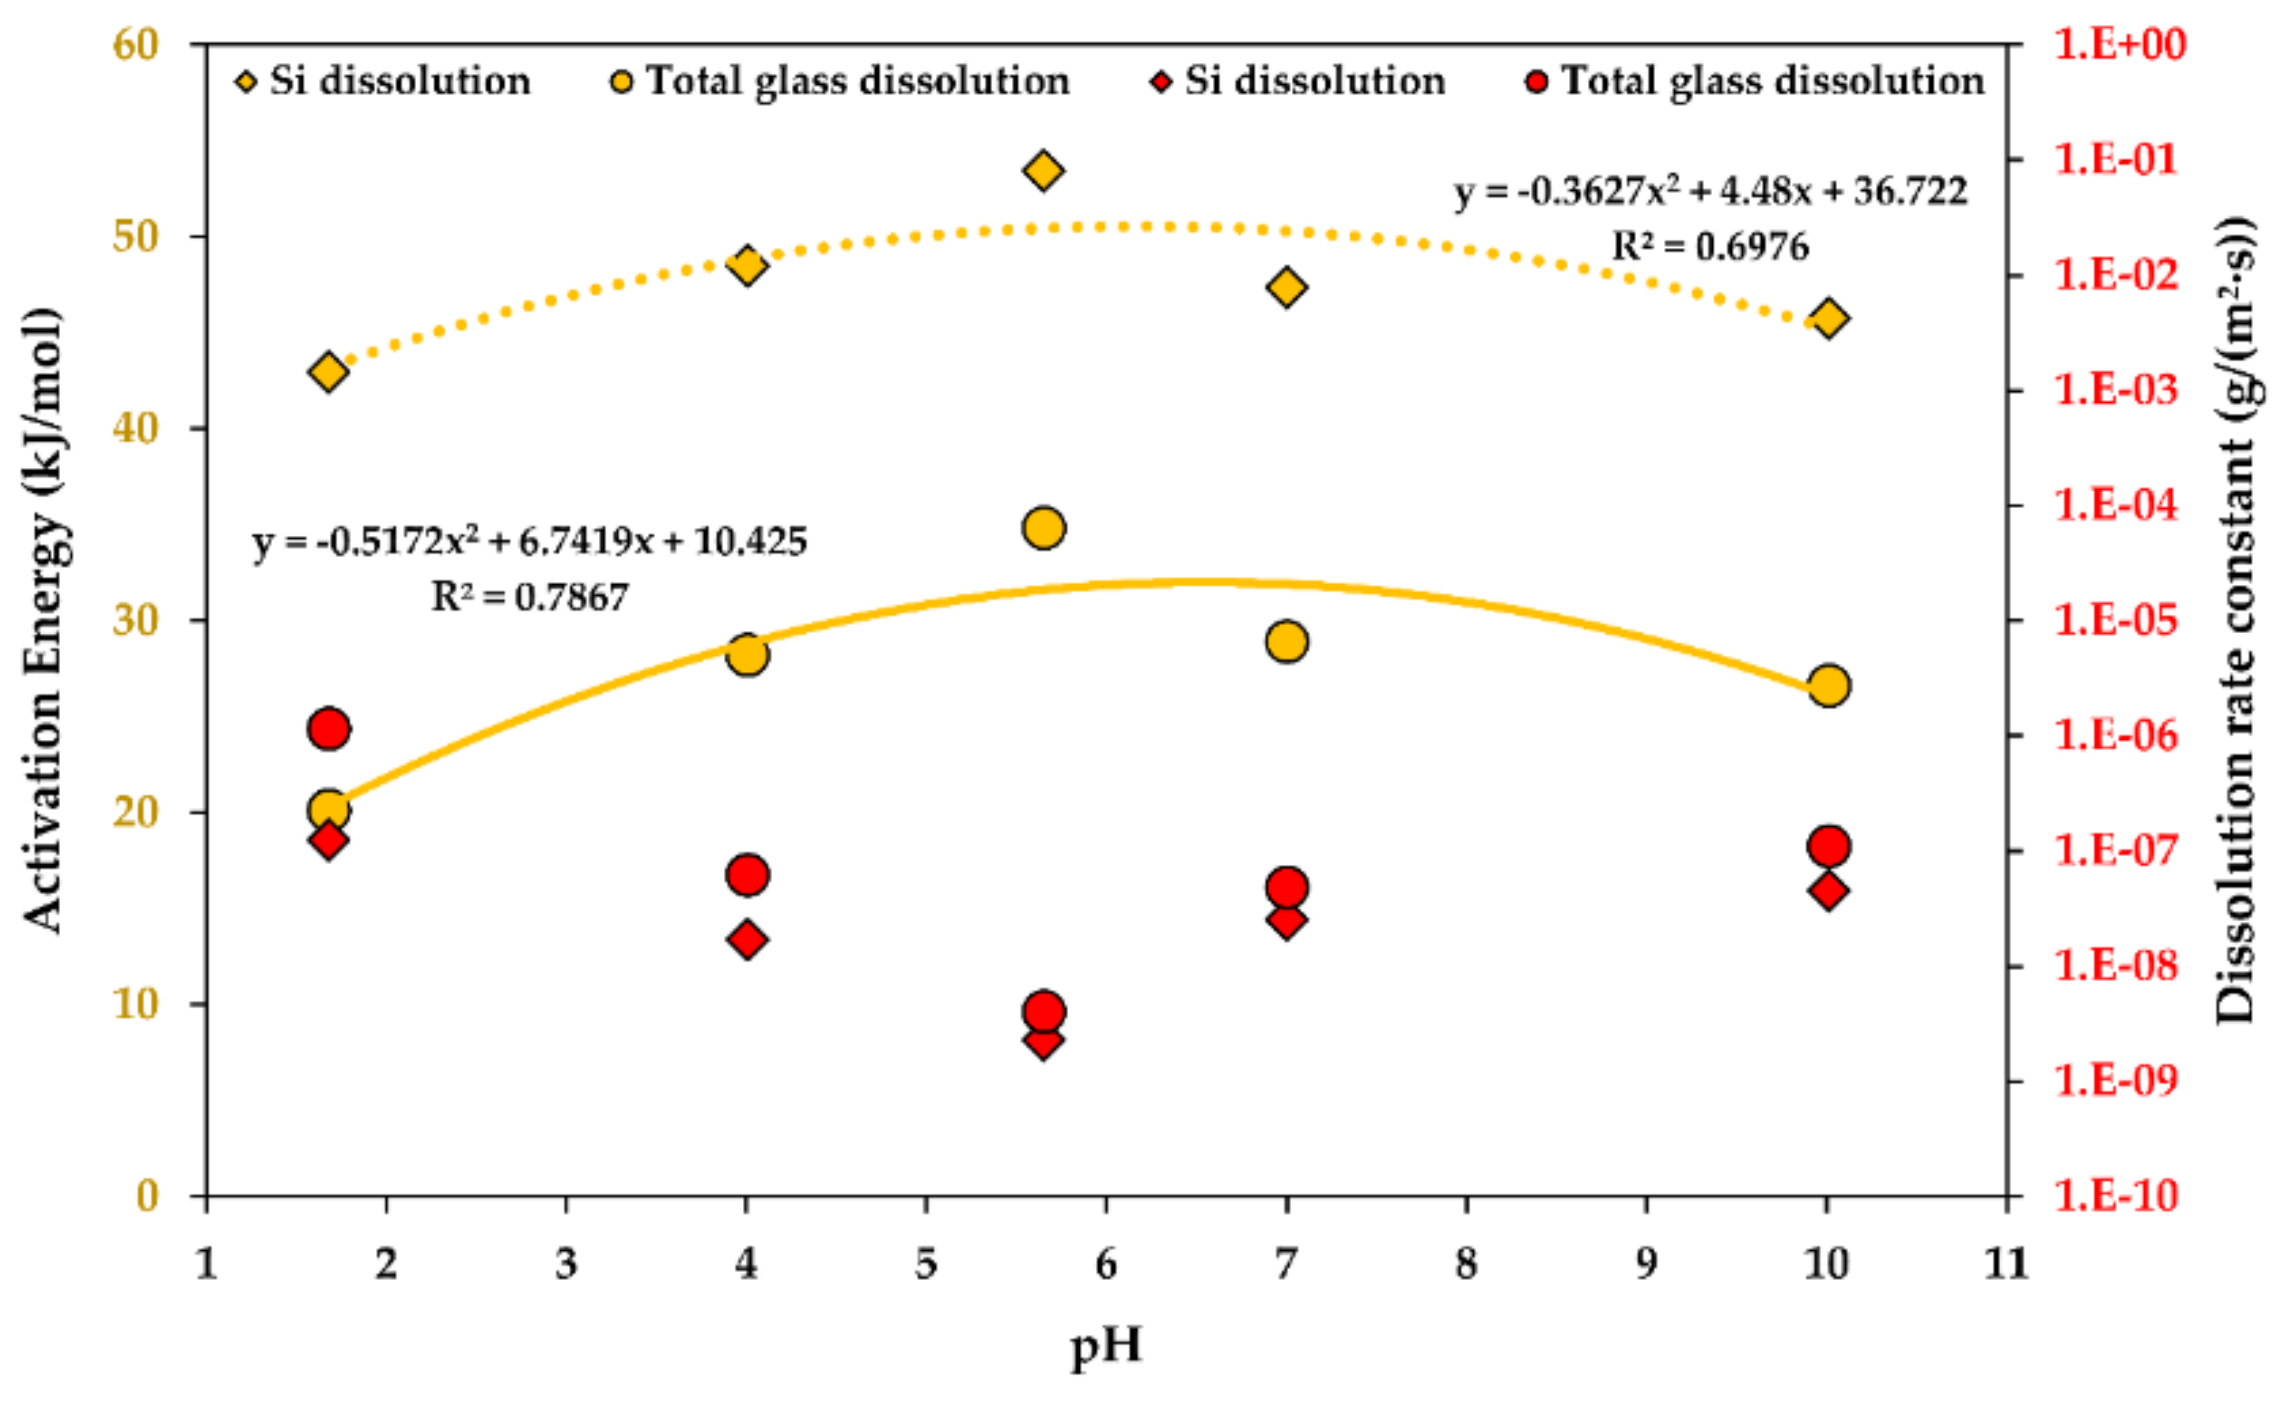
A pH function of the activation energy of dissolution ( E A I I = f ( p H ) ) is shown in Figure 5. It is fine to approximate the kinetic p H dependency as a polynomial function, being a parabolic function in this case [43,44,45,46].
Both the glass and the Si dissolution rate constant trends are similar, with an exception at low p H levels, i.e., at a p H of 1, the rates of Si dissolution increase more dramatically than the total glass dissolution rates, indicating a higher contribution of Si to the material loss during the dissolution in strongly acidic environments. Thus, GFRPs should not be used in strongly acidic conditions. This is in agreement with an observation in another study, stating that many GFRPs fail catastrophically after a critical time when exposed to acids [1].

4.2. The Effect of Temperature on Glass Dissolution Kinetics

The dissolution rate constants for glass dissolution from the fibres in water at various temperatures at a p H of 5.650 ± 0.010 are shown in Table 2. The steady-state was achieved after about a week.
The Arrhenius approach was used to obtain the activation energy of the steady-state Si and glass dissolution. The activation energy was obtained through graphing at a constant p H and σ , similar to what was done in another study, using Equation (23) [23]:
l n K 0 = E A R 1 T + l n A
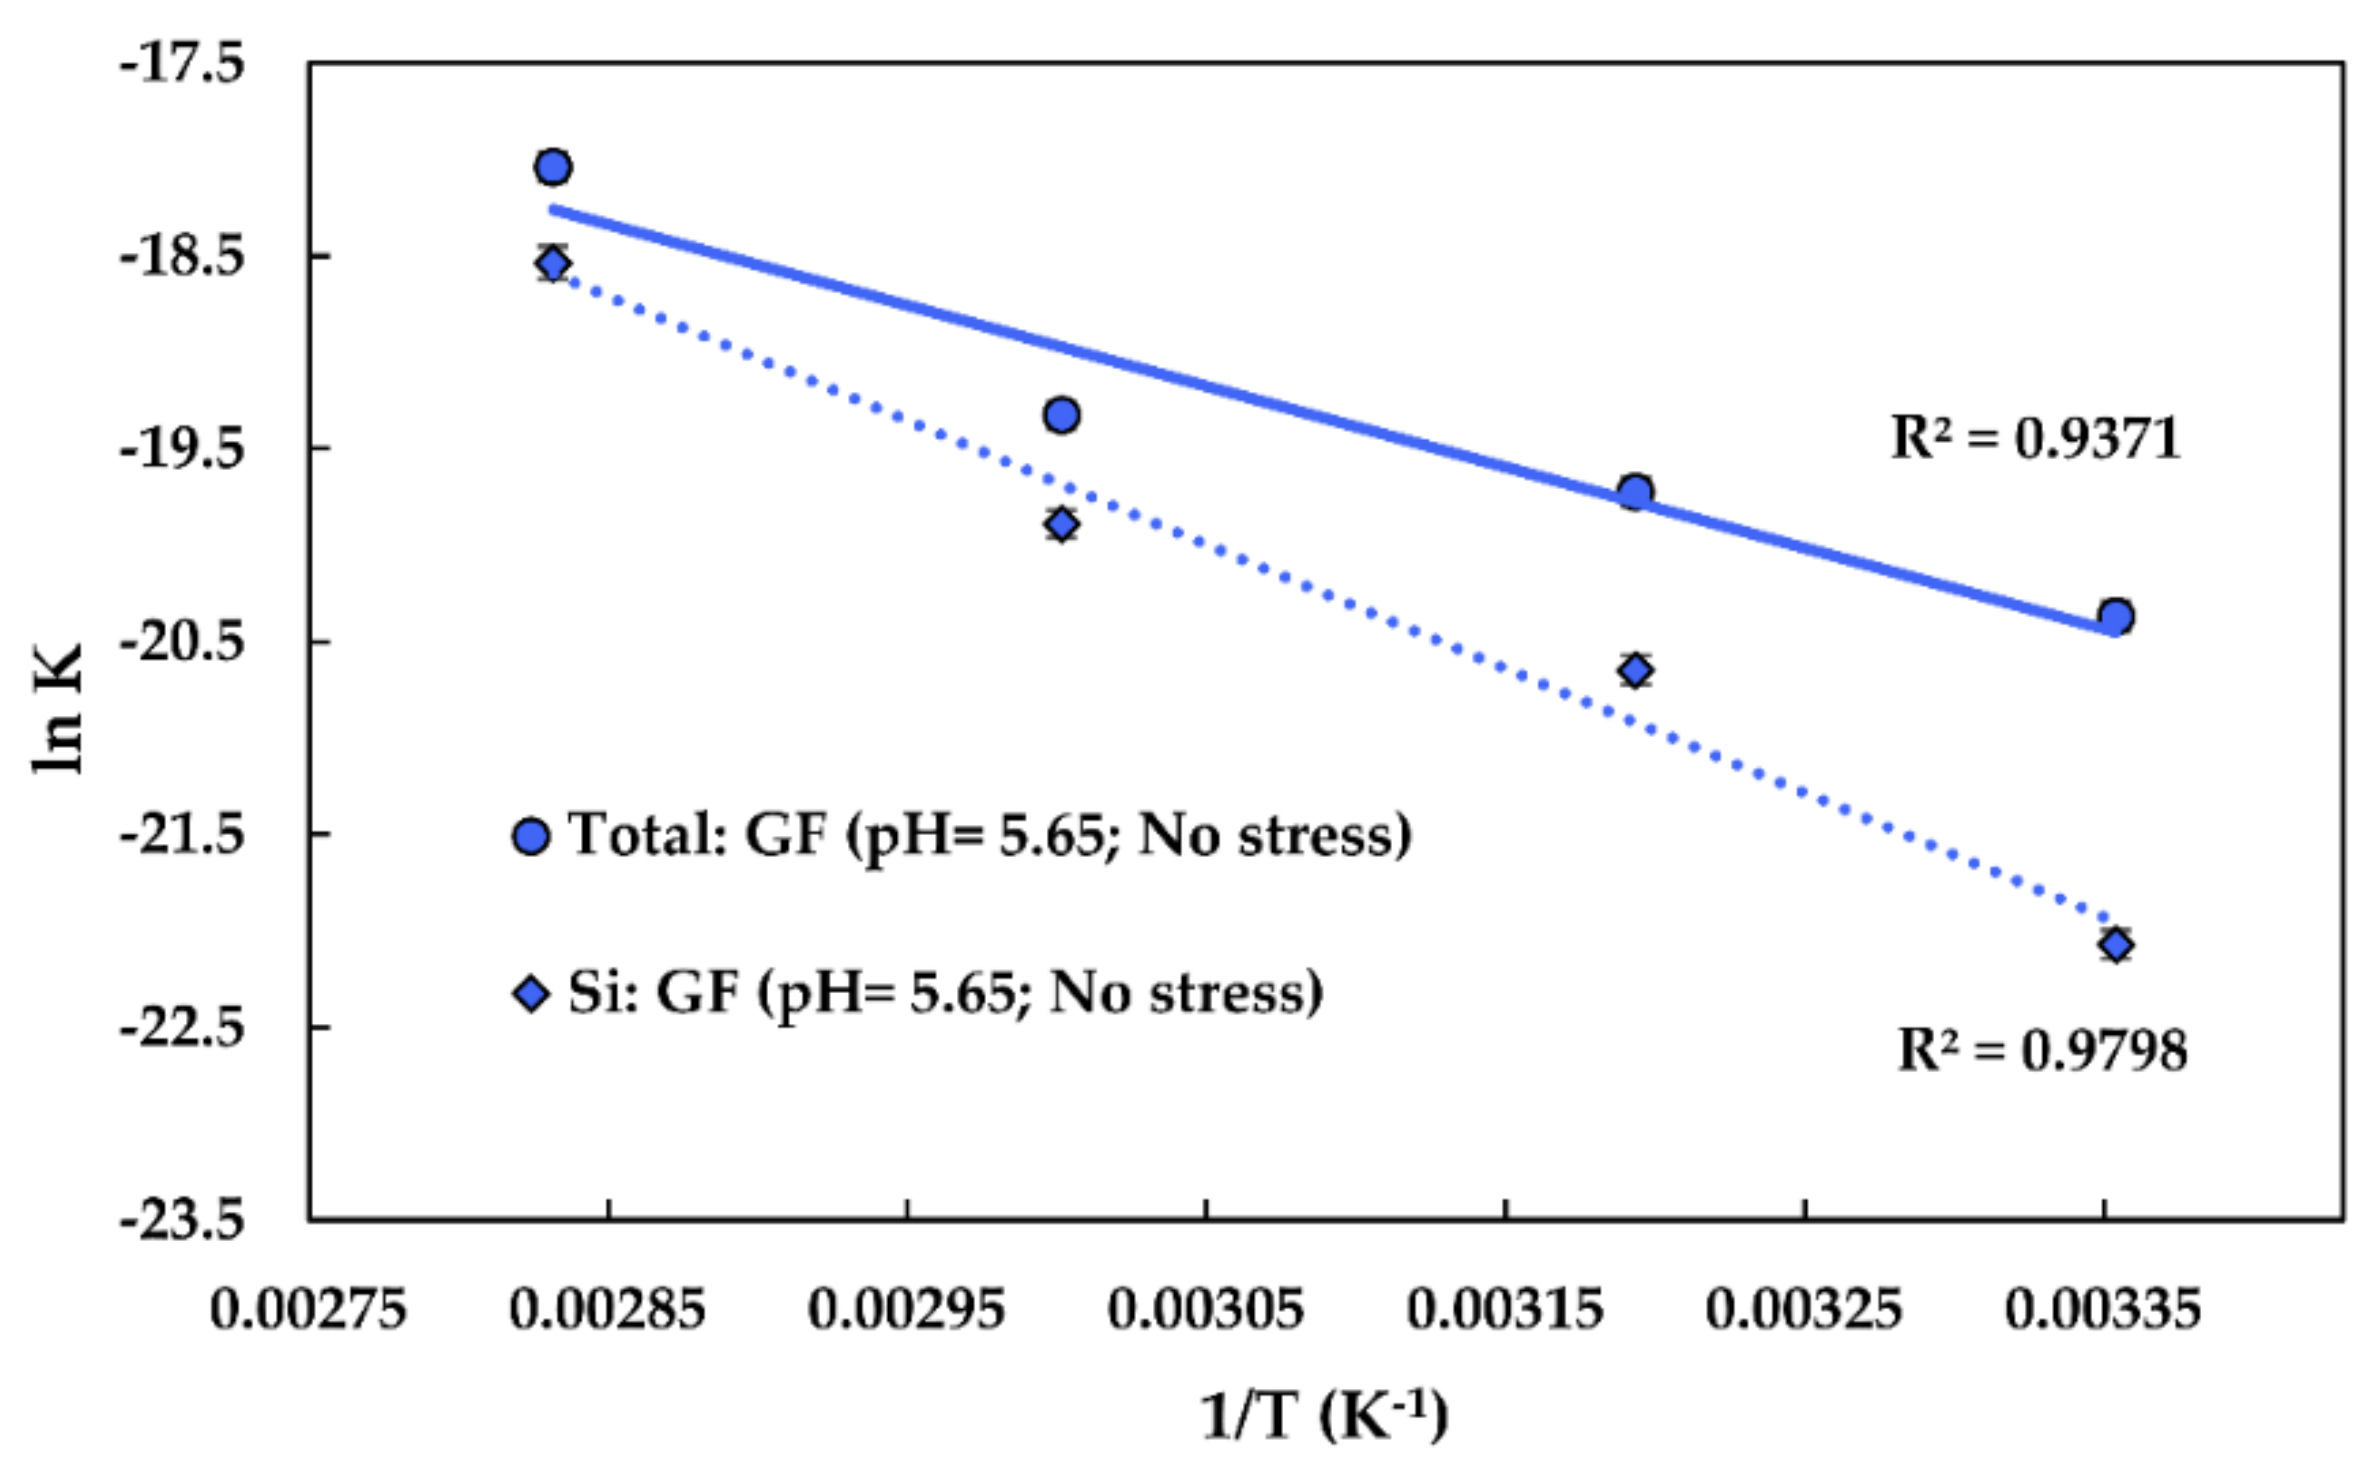
The graphing approach is shown in Figure 6. The obtained activation energy ( E A ) of Si dissolution is 53.46 kJ/mol (using K 0 S i I I values). The pre-exponential factor ( A ) for Si dissolution is 6.82∙10−1 g/(m2∙s). The obtained activation energy ( E A ) of the total glass dissolution is 34.84 kJ/mol (using K 0 t o t a l I I values). The pre-exponential factor for the glass dissolution ( A ) is 1.67∙10−3 g/(m2∙s).
The obtained values are consistent with the values reported in the literature, being slightly lower than for E-glass (58–79 kJ/mol in alkaline solutions [23]). The activation energy for the Si dissolution of various silica-based materials may be around 60 kJ/mol [47].
The experimental glass dissolution data and the modelled DCZOK dissolution curves for various temperatures are shown in Figure 7.

4.3. The Effect of Stress Corrosion on Glass Dissolution Kinetics

The dissolution rate constants for glass dissolution from fibres in water loaded with various weights (0.03, 5, 8, and 10 kg) at a p H of 5.650 ± 0.010 and at 60 ± 1 °C are shown in Table 3. The stress was calculated as half of the weight divided by the cross-sectional area of the glass fibre bundles (0.93 mm2). The division by two is due to the fact that the weight is carried by a bundle which goes from each side of the rig, meaning that the total area is that of two bundles. In order to visualize the setup and the fibre arrangement, the experimental rig in action is shown in Figure 3. The steady-state was achieved after about 5 days (120 h), sooner than in all of the unstressed cases, indicating that stress may slightly accelerate the transition towards the steady-state dissolution.
The experimental glass dissolution data and the modelled DCZOK dissolution curves for various stress levels are shown in Figure 8.
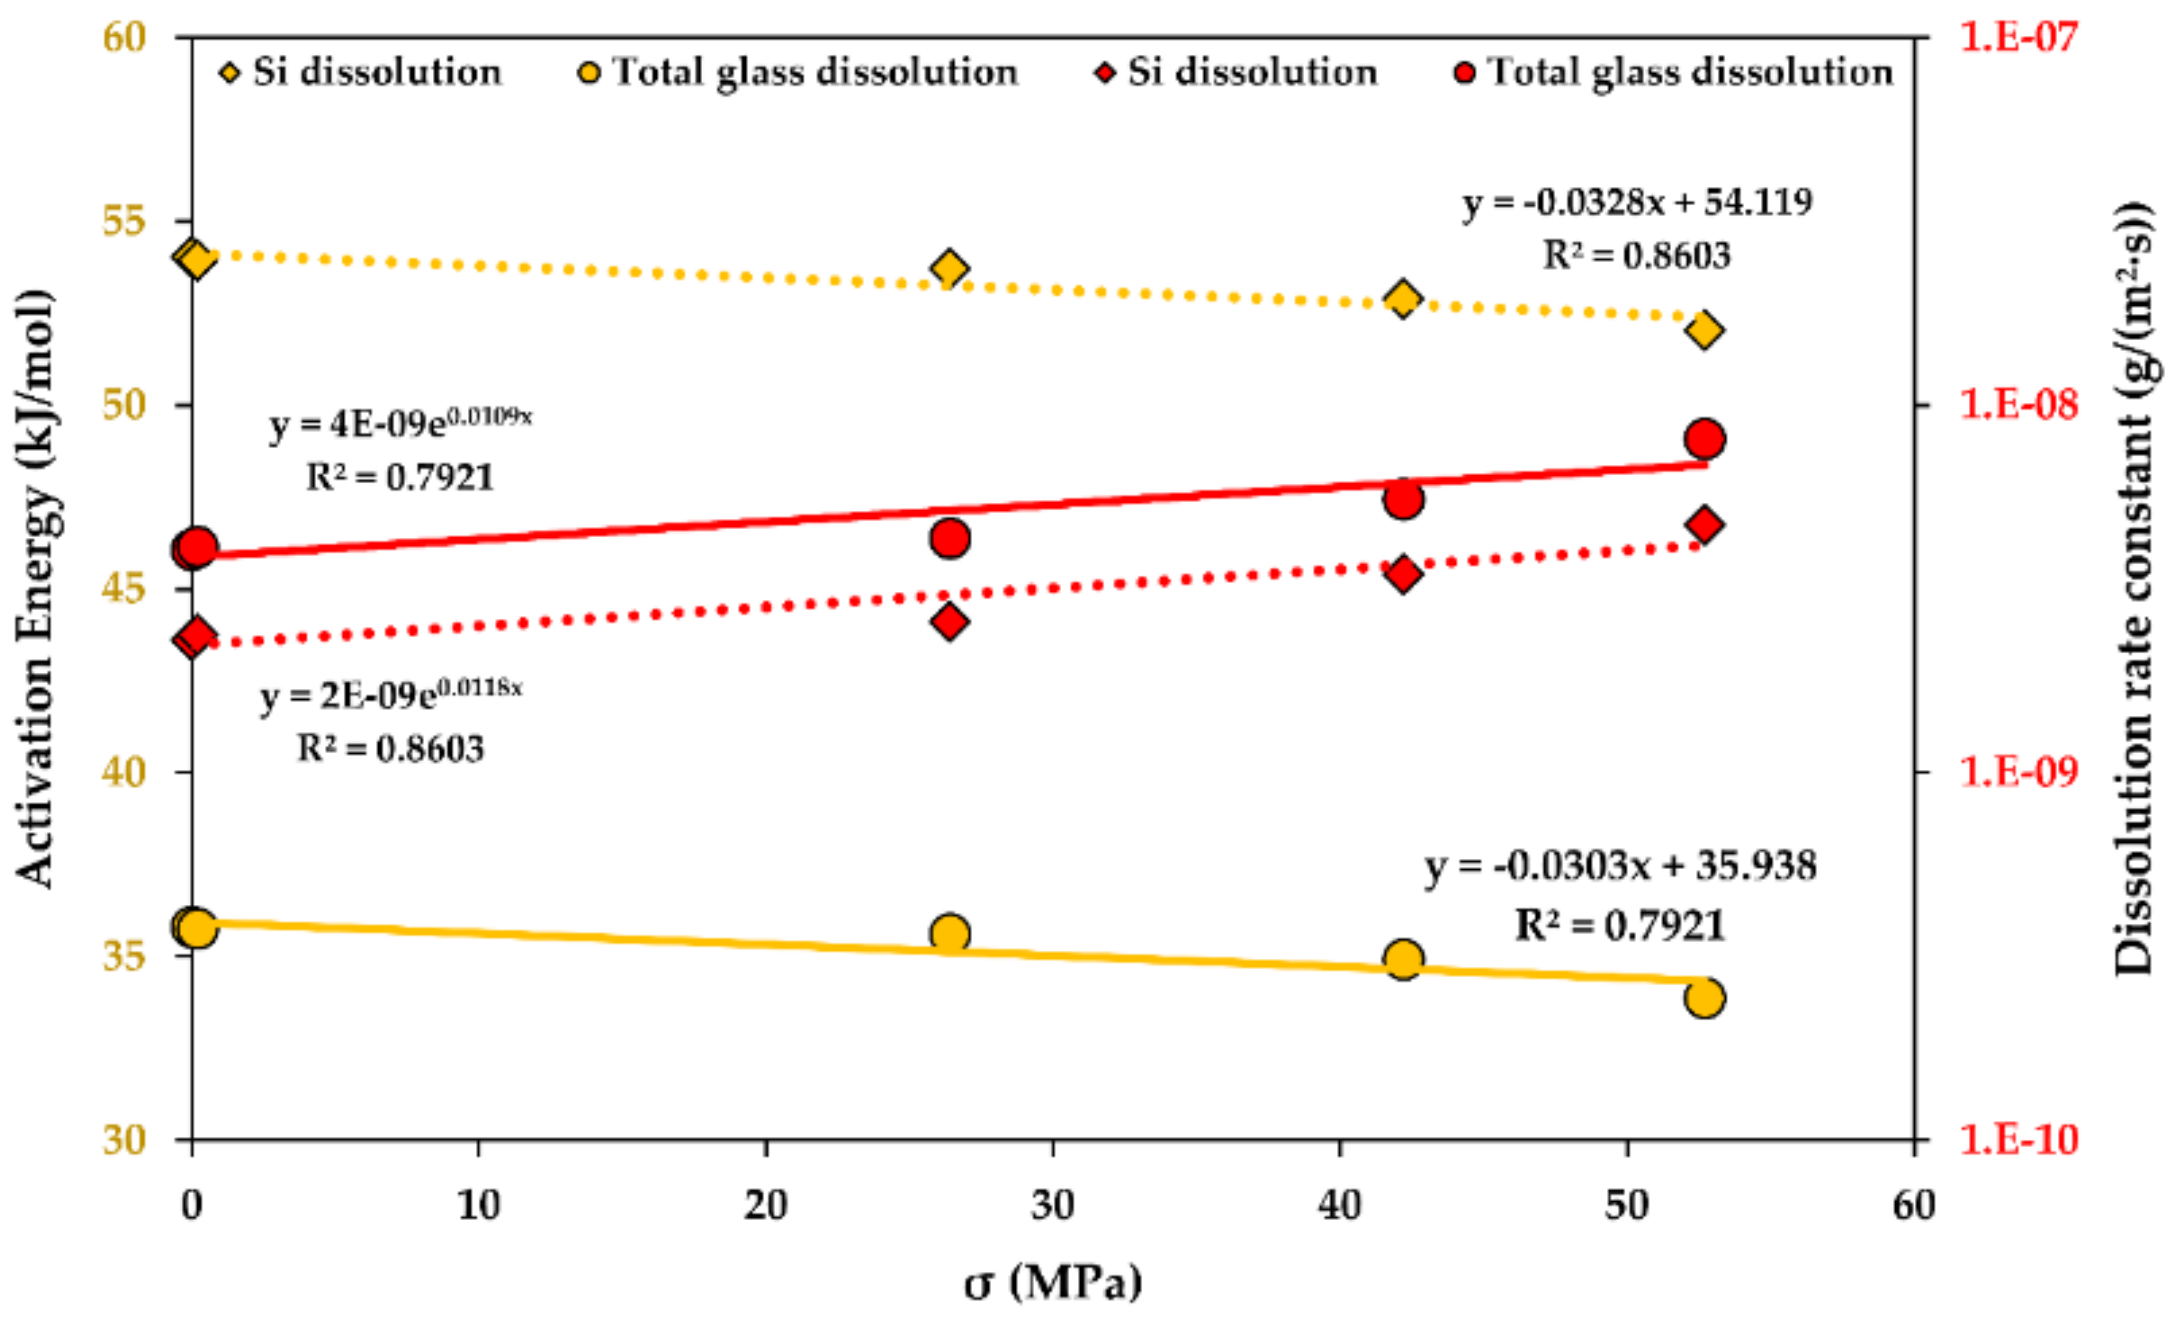
A stress function of the activation energy of dissolution ( E A I I = f ( σ ) ) for R-glass fibre bundles is shown in Figure 9. An increase in the stress seems to accelerate glass dissolution, showing a similar trend for both Si and the total mass loss kinetics. The increase in the stress reduces the activation energy of dissolution linearly and accelerates the glass dissolution rates exponentially. Additional studies involving higher stresses are recommended to establish this influence in more detail.

5. Discussion

R-glass fibres were studied in this work. However, there should be no limitations to applying the DCZOK model to other types of glass fibres. Validation of the model with various types of glass fibres, such as E, ECR, and S, is advised. The processes for all of these fibres are expected to follow similar trends, whereas only the values of the terms in the model have to be assessed for each material individually.
The industry is interested in the p H , temperature, and stress corrosion for environmental effects. Temperatures are also interesting to the industry for accelerated testing purposes. As the industry is concerned with lowering the testing time for the fibre-dominated property deterioration in GFRPs, the model allows the prediction of the loss of glass material. While it takes time to obtain the parameters, the most significant time saving comes from using the kinetic constants and the model.
The influence of the p H , temperature, and stress corrosion on the rate constants and dissolution activation energies was obtained, however, the influence of each parameter was studied once at a time. Thus, a suggestion for future work includes a cross-parametric study of the p H , temperature, and stress corrosion, in order to deduce a general analytical solution for the environmental influence on the activation energy of dissolution and to study whether there is a coupled effect. The DCZOK model should be extendable to include the effect of the ionic strength and, finally, to be further used in linking the reduction in the mechanical strength of the fibres with the dissolution kinetics.
The authors think that validating the DCZOK model for seawater conditions (about 1.84–12.62 mg SiO2/kg water; p H of seawater at 7.8) would be highly beneficial, especially for the marine and offshore industries, since the real-life structures most often operate in the seawater environment. When GFs are used in seawater, the dissolution of glass occurs at a slower rate, due to the presence of silica in the seawater, which is in seawater from the contact with sand and minerals [48,49,50,51]. The approach in distilled water is conservative with regards to seawater, meaning that structures implementing glass fibres designed for distilled water conditions should not encounter penalties to their service time in the seawater.
The model should be applicable to other types of glass as well, as SiO2 is the major component in virtually all types of glass [23], but it would be beneficial to validate this model experimentally with other types of glass fibres. Information on the exact composition of the studied R-glass was not available from the manufacturer, supplier, or technical data sheets. However, it may be possible to speculate that the composition of the dissolving ions during steady-state Phase II is somewhat representative of the glass composition, since all ions follow the slowest dissolving element, as was reported elsewhere for the same material [12]. The ion composition during the steady-state was the following: 2.7 wt% Na, 1.4 wt% K, 14.3 wt% Ca, 15.1 wt% Mg, 0.1 wt% Fe, 6.9 wt% Al, 56.1 wt% Si, and 3.4 wt% Cl [12].
Another aspect that should be investigated is the effect of the sizing on the glass fibre dissolution, i.e., its chemical composition, amount, and distribution on the fibres. For the studied R-glass, it is known that the sizing is epoxy-compatible and its loss on ignition (LOI) value is 0.64 wt%. The protective effect of sizing for the studied R-glass fibres was reported in another study [16].
It was previously observed by Scheffler et al. [52] that strong alkaline solutions can significantly damage glass fibres due to the chemical attack [52]. This observation is consistent with the results in this work, indicating much higher dissolution rates at a p H of 10 (at least an order of magnitude higher) compared to the neutral conditions.

6. Conclusions

The analytical model, termed the Dissolving Cylinder Zero-Order Kinetic model, was successfully used to explain the long-term glass dissolution experiments of R-glass fibres with various environmental conditions:
m t = 2 n π l ( r 0 K 0 ξ s i z i n g ( K 0 ξ s i z i n g ) 2 ρ g l a s s t ) = 2 n π l ( r 0 A e E A ( p H , σ ) R T ξ s i z i n g ( A e E A ( p H , σ ) R T ξ s i z i n g ) 2 ρ g l a s s t )
The model accounts for the influence of the p H , temperature, and stress, as well as the effects of sizing protection ( ξ s i z i n g for the studied R-glass is 0.165). The glass dissolution rate constants were obtained and reported for various p H levels and temperatures, as well as for various stress corrosion conditions.
The temperature showed an Arrhenius-type influence on the kinetics, increasing the rate of dissolution exponentially with an increasing temperature. The activation energy of the steady-state glass dissolution was obtained and reported at a p H of 5.65 and with no stress (53.46 and 34.84 kJ/mol for Si and the total glass dissolution, respectively). The activation energy of dissolution is affected by the p H and stress. The activation energy decreases linearly as the stress increases. The influence of the p H is more complicated and may be described by a parabolic polynomial function; the activation energy peaks at a p H of 5.65 and decreases towards more basic, as well as more acidic, conditions.
In comparison with neutral conditions, basic and acidic aqueous environments showed an increase in the dissolution rates, affecting the lifetime of the glass fibres negatively.
External loads also increased the glass dissolution rates due to stress corrosion. The stress seems to accelerate the glass dissolution rates exponentially. The model was able to capture all of these effects.

Author Contributions

Conceptualization, A.E.K. and A.T.E.; methodology, A.E.K. and A.T.E.; software, A.E.K.; validation, A.E.K. and I.K.; formal analysis, A.E.K. and I.K.; investigation, A.E.K.; resources, A.E.K., K.V., M.K., and A.T.E.; data curation, A.E.K.; writing—original draft preparation, A.E.K. and A.I.G.; writing—review and editing, A.E.K., M.K., and A.T.E.; visualization, A.E.K.; supervision, A.T.E.; project administration, A.T.E.; funding acquisition, A.T.E.

Funding

This research was funded by The Research Council of Norway (Project 245606/E30 in the Petromaks 2 programme).

Acknowledgments

This work is part of the DNV GL-led Joint Industry Project “Affordable Composites” with 19 industrial partners and the Norwegian University of Science and Technology (NTNU). The authors would like to express their thanks for the financial support from The Research Council of Norway (Project 245606/E30 in the Petromaks 2 programme). The authors are thankful to Børge Holen, Carl-Magnus Midtbø, Cristian Torres Rodriguez, Melanie Shebel, Syverin Lierhagen, and Konstantīns Viligurs. Andrey is especially grateful to Oksana V. Golubova.

Conflicts of Interest

The authors declare no conflicts of interest.

Abbreviations

r Fibre radius (m)
r 0 Initial fibre radius (m)
K 0 Dissolution rate constant (g/(m2∙s))
K 0 S i I Dissolution rate constant for Si only (non-steady-state) (g/(m2∙s))
K 0 S i I I Dissolution rate constant for Si only (steady-state) (g/(m2∙s))
K 0 t o t a l I Dissolution rate constant for glass (non-steady state) (g/(m2∙s))
K 0 t o t a l I I Dissolution rate constant for glass (steady-state) (g/(m2∙s))
t s t Time when long-term steady state is reached (s)
n Number of fibres (-)
l Length of fibres (m)
S Glass fibre surface area (m2)
S 0 Initial glass fibre surface area (m2)
p H Acidity of the environment (-)
A Pre-exponential factor (g/(m2∙s))
R Universal gas constant (8.314 J/(mol∙K))
T Absolute temperature (K)
E A Dissolution activation energy (J/mol)
ρ g l a s s Density of the glass (g/m3)
t Time (s)
σ Stress (MPa)
m ; m d i s s o l v e d Total mass loss due to dissolution (g)
m S i Si mass loss due to dissolution (g)
ξ s i z i n g Protective effect of sizing against glass dissolution (-)
c Non-cumulative ion mass concentration measured with HR-ICP-MS (g/L)
V w a t e r Volume of a water sample used for the HR-ICP-MS (L)
G F Glass Fibre
G F R P Glass Fibre-Reinforced Polymer; same as Glass Fibre-Reinforced Composite
D C Z O K Dissolving Cylinder Zero-Order Kinetic (model)
E g l a s s “Electrical” glass
E C R g l a s s “Electrical/Chemical Resistance” glass
R g l a s s “Reinforcement” glass
S g l a s s “Strength” glass
FRPFibre-Reinforced Polymer, same as fibre-reinforced composite
HR-ICP-MSHigh Resolution Inductively Coupled Plasma Mass Spectrometry

Appendix A. The Schematics of the Stress Corrosion Rig.
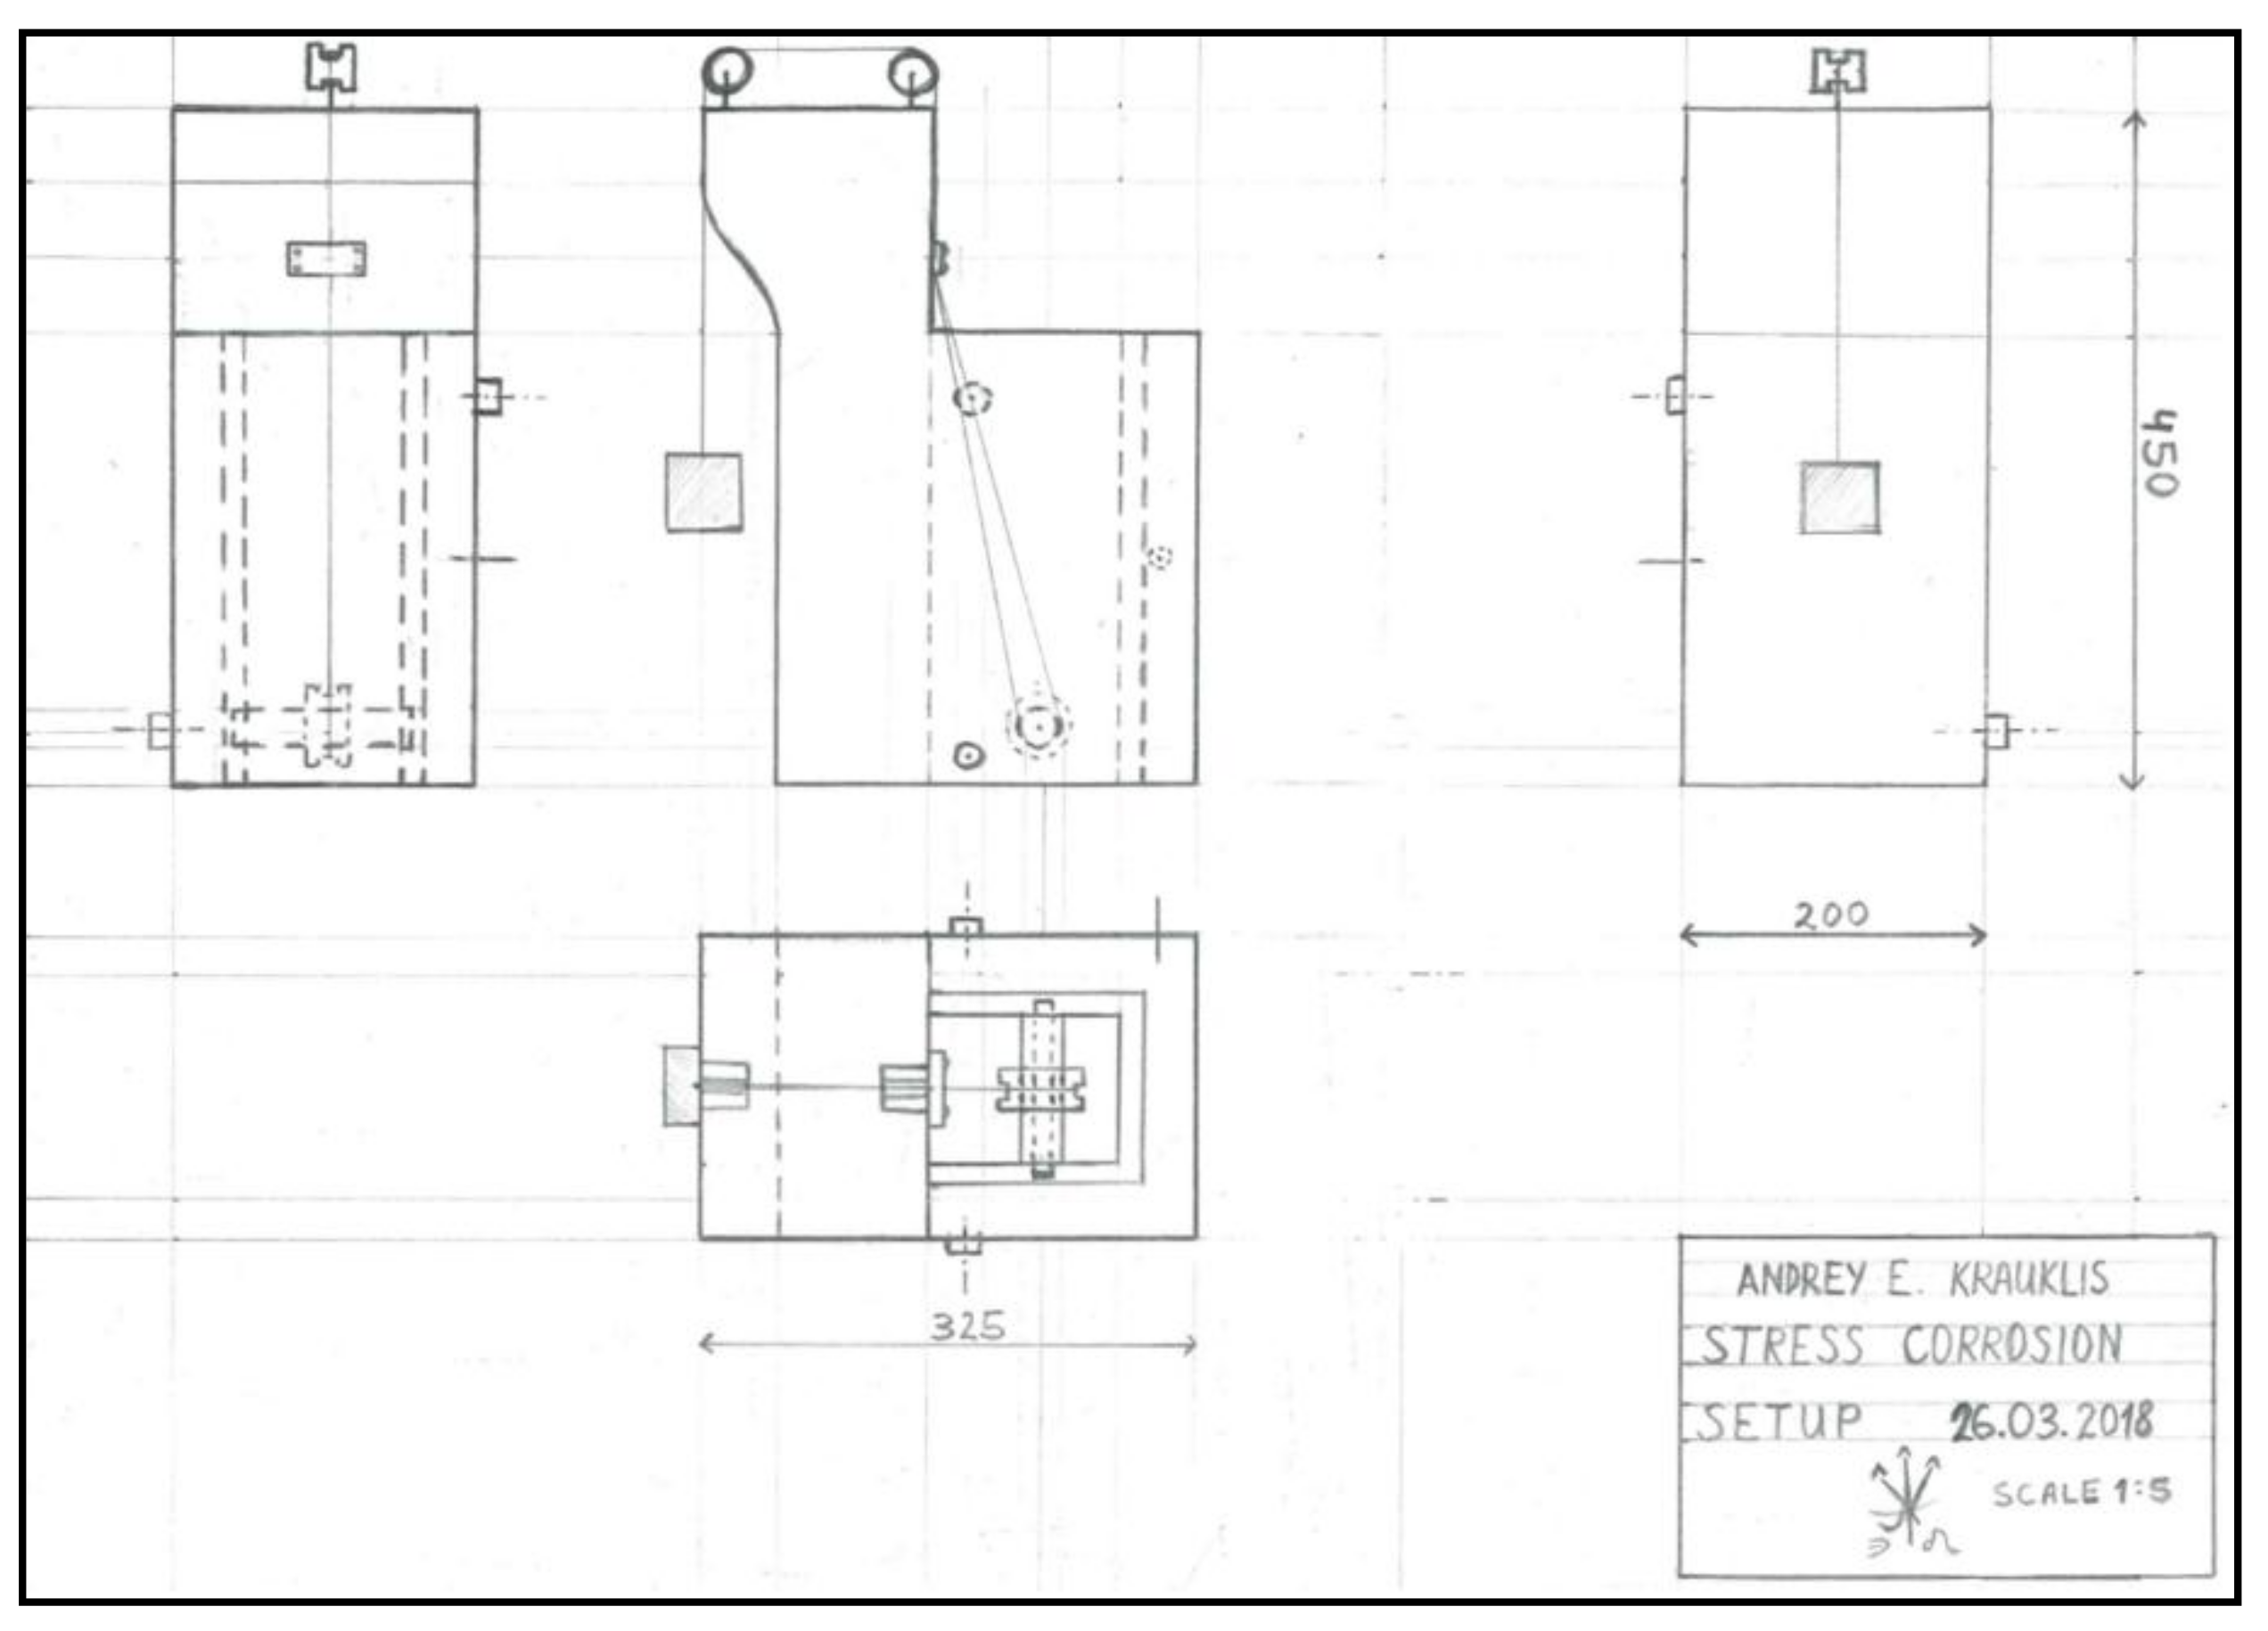
Figure A1. The design schematics of the stress corrosion rig for the glass fibre bundles, indicating the placement of the fibres and the weights.
Fibers 07 00022 g0a1

References

  1. Agarwal, B.D.; Broutman, L.J. Analysis and Performance of Fibre Composites, 2nd ed.; John Wiley and Sons, Inc.: Hoboken, NJ, USA, 1990; pp. 339–359. ISBN 978-0-471-51152-6. [Google Scholar]
  2. Wallenberger, F.T. Commercial and Experimental Glass Fibres. In Fibreglass and Glass Technology; Wallenberger, F.T., Bingham, P.A., Eds.; Springer: New York, NY, USA, 2010; ISBN 978-1-4419-0735-6. [Google Scholar]
  3. Steinmann, W.; Saelhoff, A.-K. Essential Properties of Fibres for Composite Applications. In Fibrous and Textile Materials for Composite Applications, Textile Science and Clothing Technology; Rana, S., Fangueiro, R., Eds.; Springer: Singapore, 2016; ISBN 978-981-10-0232-8. [Google Scholar]
  4. Krauklis, A.E.; Echtermeyer, A.T. Mechanism of Yellowing: Carbonyl Formation during Hygrothermal Aging in a Common Amine Epoxy. Polymers 2018, 10, 1017. [Google Scholar] [CrossRef]
  5. Xiao, G.Z.; Shanahan, M.E.R. Swelling of DGEBA/DDA epoxy resin during hygrothermal ageing. Polymer 1998, 39, 3253–3260. [Google Scholar] [CrossRef]
  6. Toscano, A.; Pitarresi, G.; Scafidi, M.; Di Filippo, M.; Spadaro, G.; Alessi, S. Water diffusion and swelling stresses in highly crosslinked epoxy matrices. Polym. Degrad. Stab. 2016, 133, 255–263. [Google Scholar] [CrossRef]
  7. Grabovac, I.; Whittaker, D. Application of bonded composites in the repair of ships structures—A 15-year service experience. Compos. Part A 2009, 40, 1381–1398. [Google Scholar] [CrossRef]
  8. McGeorge, D.; Echtermeyer, A.T.; Leong, K.H.; Melve, B.; Robinson, M.; Fischer, K.P. Repair of floating offshore units using bonded fibre composite materials. Compos. Part A 2009, 40, 1364–1380. [Google Scholar] [CrossRef]
  9. Gustafson, C.-G.; Echtermeyer, A. Long-term properties of carbon fibre composite tethers. Int. J. Fatigue 2006, 28, 1353–1362. [Google Scholar] [CrossRef]
  10. Salama, M.M.; Stjern, G.; Storhaug, T.; Spencer, B.; Echtermeyer, A. The First Offshore Field Installation for a Composite Riser Joint; OTC-14018-MS; Offshore Technology Conference: Houston, TX, USA, 2002. [Google Scholar]
  11. Echtermeyer, A.T.; Gagani, A.I.; Krauklis, A.E.; Mazan, T. Multiscale Modelling of Environmental Degradation—First Steps. In Durability of Composites in a Marine Environment 2. Solid Mechanics and Its Applications; Davies, P., Rajapakse, Y.D.S., Eds.; Springer: Cham, Switzerland, 2018; Volume 245, pp. 135–149. ISBN 978-3-319-65145-3. [Google Scholar]
  12. Krauklis, A.E.; Echtermeyer, A.T. Long-Term Dissolution of Glass Fibres in Water Described by Dissolving Cylinder Zero-Order Kinetic Model: Mass Loss and Radius Reduction. Open Chem. 2018, 16, 1189–1199. [Google Scholar] [CrossRef]
  13. Tournié, A.; Ricciardi, P.; Colomban, Ph. Glass Corrosion Mechanisms: A Multiscale Analysis. Solid State Ionics 2008, 179, 2142–2154. [Google Scholar] [CrossRef]
  14. Brown, E.N.; Davis, A.K.; Jonnalagadda, K.D.; Sottos, N.R. Effect of surface treatment on the hydrolytic stability of E-glass fibre bundle tensile strength. Compos. Sci. Technol. 2005, 65, 129–136. [Google Scholar] [CrossRef]
  15. Bledzki, A.; Spaude, R.; Ehrenstein, G.W. Corrosion Phenomena in Glass Fibres and Glass Fibre Reinforced Thermosetting Resins. Compos. Sci. Technol. 1985, 23, 263–285. [Google Scholar] [CrossRef]
  16. Krauklis, A.E.; Echtermeyer, A.T. Dissolving Cylinder Zero-Order Kinetic Model for Predicting Hygrothermal Aging of Glass Fibre Bundles and Fibre-Reinforced Composites. In 4th International Glass Fibre Symposium; Gries, Th., Pico, D., Lüking, A., Becker, Th., Eds.; Mainz, G (Verlag): Aachen, Germany, 2018; pp. 66–72. ISBN 978-3-95886-249-4. [Google Scholar]
  17. Grambow, B.; Müller, R. First-order dissolution rate law and the role of surface layers in glass performance assessment. J. Nucl. Mater. 2001, 298, 112–124. [Google Scholar] [CrossRef]
  18. Grambow, B. A General Rate Equation for Nuclear Waste Glass Corrosion. MRS Symp. Proc. Libr. Arch. 1985, 44, 15–27. [Google Scholar] [CrossRef]
  19. Krauklis, A.E.; Gagani, A.I.; Echtermeyer, A.T. Near-Infrared Spectroscopic Method for Monitoring Water Content in Epoxy Resins and Fibre-Reinforced Composites. Materials 2018, 11, 586. [Google Scholar] [CrossRef]
  20. Stamenović, M.R.; Putić, S.S.; Rakin, M.B.; Medjo, B.; Čikara, D. Effect of alkaline and acidic solutions on the tensile properties of glass–polyester pipes. Mater. Des. 2011, 32, 2456–2461. [Google Scholar] [CrossRef]
  21. Amaro, A.M.; Reis, P.N.B.; Neto, M.A.; Louro, C. Effects of alkaline and acid solutions on glass/epoxy composites. Polym. Degrad. Stab. 2013, 98, 853–862. [Google Scholar] [CrossRef]
  22. Mišíková, L.; Liška, M.; Galusková, D. Corrosion of e-glass fibres in distilled water. Ceram. Silik. 2007, 51, 131–135. [Google Scholar]
  23. Bashir, S.T.; Yang, L.; Liggat, J.J.; Thomason, J.L. Kinetics of dissolution of glass fibre in hot alkaline solution. J. Mater. Sci. 2018, 53, 1710–1722. [Google Scholar] [CrossRef]
  24. Hunter, F.M.I.; Hoch, A.R.; Heath, T.G.; Baston, G.M.N. Report RWM005105, AMEC/103498/02 Issue 2: Review of Glass Dissolution Models and Application to UK Glasses; AMEC: Didcot, Oxfordshire, UK, 2015. [Google Scholar]
  25. Li, H.; Gu, P.; Watson, J.; Meng, J. Acid corrosion resistance and mechanism of E-glass fibres: Boron factor. J. Mater. Sci. 2013, 48, 3075–3087. [Google Scholar] [CrossRef]
  26. Icenhower, J.; Steefel, C.I. Dissolution Rate of Borosilicate Glass SON68: A Method of Quantification Based upon Interferometry and Implications for Experimental and Natural Weathering Rates of Glass. Geochim. Cosmochim. Acta 2015, 157, 147–163. [Google Scholar] [CrossRef]
  27. Gy, R. Stress corrosion of silicate glass: A review. J. Non-Cryst. Solids 2003, 316, 1–11. [Google Scholar] [CrossRef]
  28. Ciccotti, M. Stress-corrosion mechanisms in silicate glasses. J. Phys. D Appl. Phys. 2009, 42, 214006–214039. [Google Scholar] [CrossRef]
  29. Michalske, T.A.; Freiman, S.W. A Molecular Mechanism for Stress Corrosion in Vitreous Silica. J. Am. Ceram. Soc. 1983, 66, 284–288. [Google Scholar] [CrossRef]
  30. Michalske, T.A.; Bunker, B.C. Steric Effects in Stress Corrosion Fracture of Glass. J. Am. Ceram. Soc. 1987, 70, 780–784. [Google Scholar] [CrossRef]
  31. Michalske, T.A.; Bunker, B.C. A Chemical Kinetics Model for Glass Fracture. J. Am. Ceram. Soc. 1993, 76, 2613–2618. [Google Scholar] [CrossRef]
  32. Michalske, T.A.; Bunker, B.C. Slow fracture model based on strained silicate structures. J. Appl. Phys. 1984, 56, 2686–2693. [Google Scholar] [CrossRef]
  33. Schmitz, G.K.; Metcalfe, A.G. Stress Corrosion of E-Glass Fibres. Ind. Eng. Chem. Prod. Res. Dev. 1966, 5, 1–8. [Google Scholar] [CrossRef]
  34. Delage, F.; Ghaleb, D.; Dussossoy, J.L.; Chevallier, O.; Vernaz, E. A mechanistic model for understanding nuclear waste glass dissolution. J. Nucl. Mater. 1992, 190, 191–197. [Google Scholar] [CrossRef]
  35. Ma, T.; Jivkov, A.P.; Li, W.; Liang, W.; Wang, Y.; Xu, H.; Han, X. A mechanistic model for long-term nuclear waste glass dissolution integrating chemical affinity and interfacial diffusion barrier. J. Nucl. Mater. 2017, 486, 70–85. [Google Scholar] [CrossRef]
  36. Khawam, A.; Flanagan, D.R. Solid-State Kinetic Models: Basics and Mathematical Fundamentals. J. Phys. Chem. B 2006, 110, 17315–17328. [Google Scholar] [CrossRef]
  37. International Standard ISO 2078:1993 (revised in 2014), Textile Glass—Yarns—Designation. 2014. Available online: https://www.iso.org/standard/6865.html (accessed on 11 February 2019).
  38. 3B Fibreglass technical data sheet. HiPer-tex W2020 rovings, Belgium. 2012. Available online: https://www.3b-fibreglass.com/ (accessed on 24 July 2018).
  39. Thomason, J.L. Glass Fiber Sizings: A Review of the Scientific Literature; J.L. Thomason: Middletown, DE, USA, 2012; p. 127. ISBN 978-0-9573814-1-4. [Google Scholar]
  40. Shiue, Y.S.; Matthewson, M.J. Stress dependent activation entropy for dynamic fatigue of pristine silica optical fibres. J. Appl. Phys. 2001, 89, 4787–4793. [Google Scholar] [CrossRef]
  41. Eastes, W.; Potter, R.M.; Hadley, J.G. Estimating in-vitro glass fibre dissolution rate from composition. Inhal. Toxicol. 2000, 12, 269–280. [Google Scholar] [CrossRef] [PubMed]
  42. Papadimitriou, S.; Kennedy, H.; Kennedy, P.; Thomas, D.N. Kinetics of ikaite precipitation and dissolution in seawater-derived brines at sub-zero temperatures to 265 K. Geochim. Cosmochim. Acta 2014, 140, 199–211. [Google Scholar] [CrossRef]
  43. Ozola, R.; Krauklis, A.E.; Leitietis, M.; Burlakovs, J.; Vircava, I.; Ansone-Bertina, L.; Bhatnagar, A.; Klavins, M. FeOOH-modified clay sorbents for arsenic removal from aqueous solutions. Environ. Technol. Innov. 2016. [Google Scholar] [CrossRef]
  44. Krauklis, A.E.; Ozola, R.; Burlakovs, J.; Rugele, K.; Kirillov, K.; Trubaca-Boginska, A.; Rubenis, K.; Stepanova, V.; Klavins, M. FeOOH and Mn8O10Cl3 Modified Zeolites for As(V) Removal in Aqueous Medium. J. Chem. Technol. Biotechnol. 2017, 92, 1948–1960. [Google Scholar] [CrossRef]
  45. Anxolabéhère-Mallart, E.; Costentin, C.; Policar, C.; Robert, M.; Savéant, J.M.; Teillout, A.L. Proton-coupled electron transfers in biomimetic water bound metal complexes. The electrochemical approach. Faraday Discuss. 2011, 148, 83–95. [Google Scholar] [CrossRef]
  46. Secula, M.S.; Creţescu, I.; Petrescu, S. An experimental study of indigo carmine removal from aqueous solution by electrocoagulation. Desalination 2011, 277, 227–235. [Google Scholar] [CrossRef]
  47. Criscenti, L.J.; Kubicki, J.D.; Brantley, S.L. Silicate Glass and Mineral Dissolution: Calculated Reaction Paths and Activation Energies for Hydrolysis of a Q3 Si by H3O+ Using Ab Initio Methods. J. Phys. Chem. A 2006, 110, 198–206. [Google Scholar] [CrossRef]
  48. Fournier, R.O.; Rowe, J.J. The solubility of amorphous silica in water at high temperatures and high pressures. Am. Miner. 1977, 62, 1052–1056. [Google Scholar]
  49. Crundwell, F.K. On the Mechanism of the Dissolution of Quartz and Silica in Aqueous Solutions. ACS Omega 2017, 2, 1116–1127. [Google Scholar] [CrossRef]
  50. Von Damm, K.L.; Edmond, J.M.; Grant, B.; Measures, C.I.; Walden, B.; Weiss, R.F. Chemistry of submarine hydrothermal solutions at 21°N, East Pacific Rise. Geochim. Cosmochim. Acta 1985, 49, 2197–2220. [Google Scholar] [CrossRef]
  51. Holland, H.D. The Chemistry of the Atmosphere and Oceans; Wiley: New York, NY, USA, 1978; p. 351. ISBN 978-0471035091. [Google Scholar]
  52. Scheffler, C.; Förster, T.; Mäder, E.; Heinrich, G.; Hempel, S.; Mechtcherine, V. Aging of alkali-resistant glass and basalt fibers in alkaline solutions: Evaluation of the failure stress by Weibull distribution function. J. Non-Cryst. Solids 2009, 355, 2588–2595. [Google Scholar] [CrossRef]
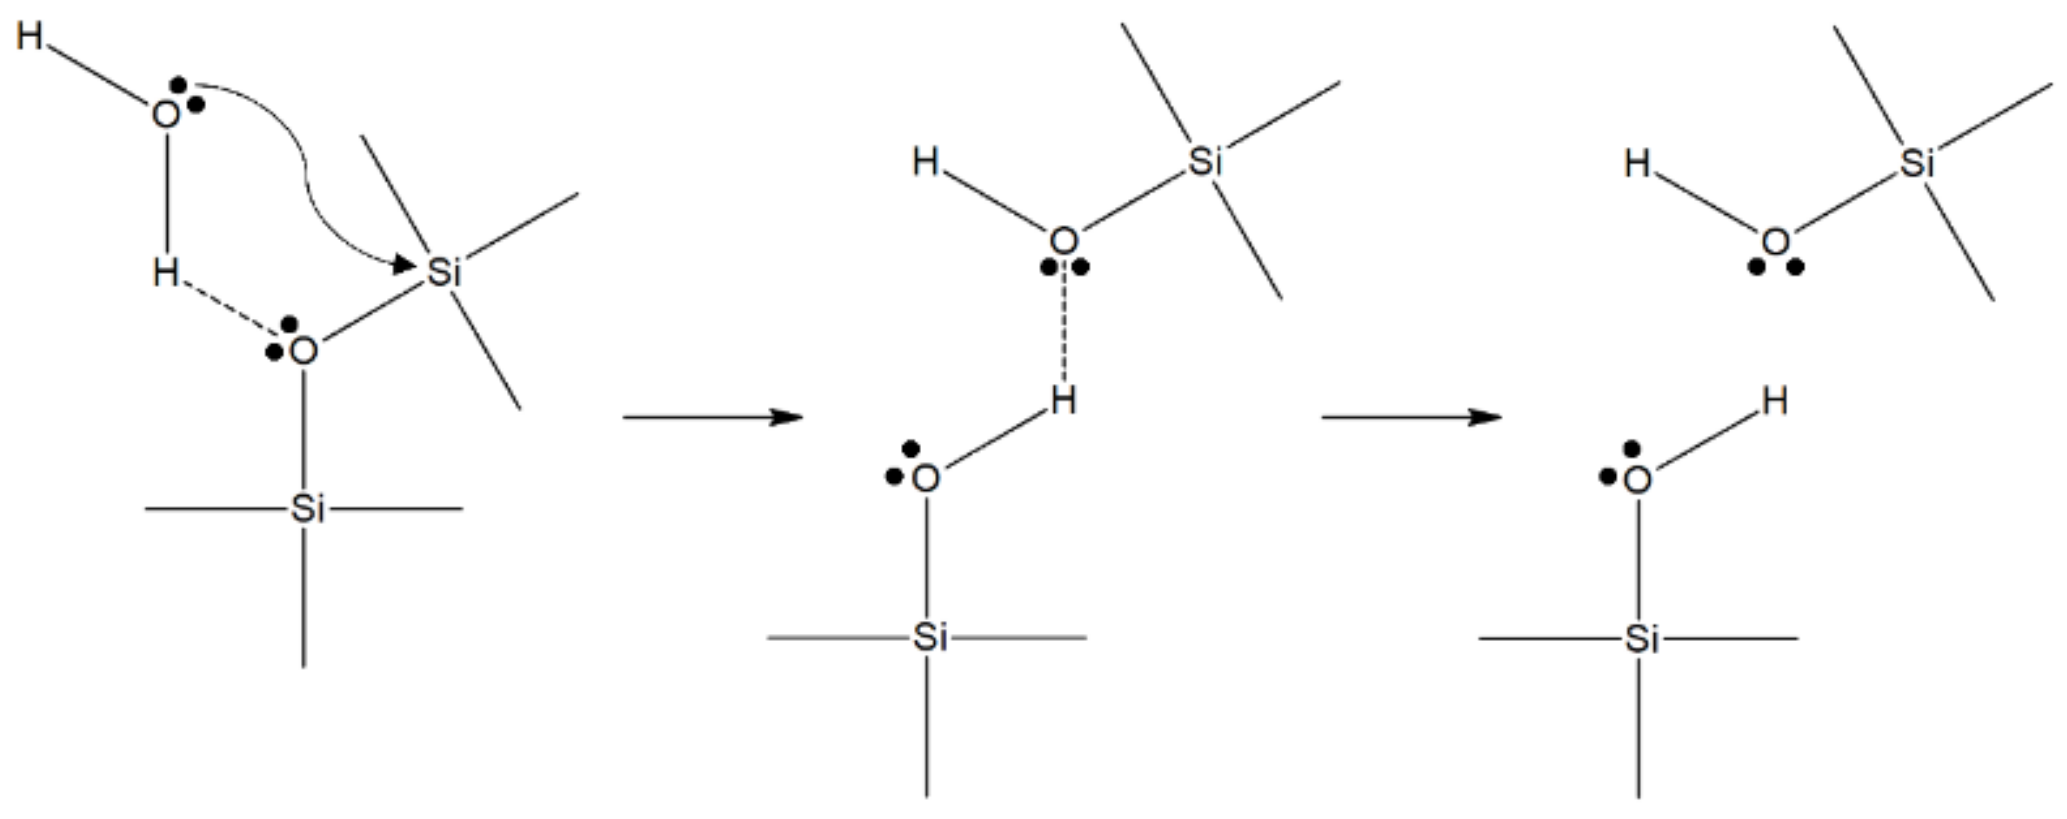
Figure 1. The chemical mechanism of stress corrosion in glass, proposed by Michalske and Freiman [29].
Fibers 07 00022 g001
Figure 2. A micrograph of R-glass fibre bundles taken with a digital microscope, the Keyence VHX6000 (Osaka, Japan).
Fibers 07 00022 g002
Figure 3. The glass fibre stress corrosion experimental setup.
Fibers 07 00022 g003
Figure 4. The glass dissolution kinetics at various p H levels: The experimental data and modelled Dissolving Cylinder Zero-Order Kinetic (DCZOK) dissolution curves for the R-glass fibre bundles. GF: Glass fibre.
Fibers 07 00022 g004
Figure 5. The activation energy (yellow) and the rate constants (red) of the steady-state R-glass dissolution as a function of the p H . Determination coefficients R2 are shown. 1.E-10 stands for “1 × 10⁻¹⁰”.
Fibers 07 00022 g005
Figure 6. The graphing approach used to obtain the pre-exponential factors, the activation energies of Si, and the total glass dissolution of the fibres at a p H of 5.65 and under no stress. GF: Glass fibre. 1/T stands for reciprocal temperature; R2 is the determination coefficient.
Fibers 07 00022 g006
Figure 7. The glass dissolution kinetics at various temperatures: The experimental data and the modelled Dissolving Cylinder Zero-Order Kinetic (DCZOK) dissolution curves for R-glass fibre bundles. GF: Glass fibre.
Fibers 07 00022 g007
Figure 8. The glass dissolution kinetics at various stress levels: The experimental data and the modelled Dissolving Cylinder Zero-Order Kinetic (DCZOK) dissolution curves for glass fibre bundles. GF: Glass fibre.
Fibers 07 00022 g008
Figure 9. The activation energy of dissolution (yellow) and the dissolution rate constants (red), functions of the stress (σ) for the glass fibre bundles at the steady-state. Determination coefficients R2 are shown. 4E-9 stands for “4 × 10⁻⁹”.
Fibers 07 00022 g009
Table 1. The glass dissolution rate constants obtained via the regression of the experimental data of the R-glass fibre bundles using the Dissolving Cylinder Zero-Order Kinetic (DCZOK) model for Si and the total mass loss at 60 °C and various p H levels. K 0 Si I ,   K 0 Si II , K 0 total I and K 0 total II are dissolution rate constants for Phase I and II for Si and total glass dissolution, as indicated by indices.
pH K 0 S i I   ( g / ( m 2 · s ) ) K 0 S i I I   ( g / ( m 2 · s ) ) K 0 t o t a l I   ( g / ( m 2 · s ) ) K 0 t o t a l I I   ( g / ( m 2 · s ) ) Reference
1.679 ± 0.010(3.10 ± 0.44)∙10−7(1.25 ± 0.09)∙10−7(1.70 ± 0.19)∙10−6(1.16 ± 0.08)∙10−6This work
4.005 ± 0.010(2.59 ± 0.33)∙10−8(1.70 ± 0.11)∙10−8(8.48 ± 1.21)∙10−8(6.24 ± 0.36)∙10−8This work
5.650 ± 0.010(6.67 ± 1.03)∙10−9(2.30 ± 0.16)∙10−9(1.82 ± 0.29)∙10−8(4.05 ± 0.29)∙10−9This work, [12,16]
7.000 ± 0.010(3.64 ± 0.53)∙10−8(2.55 ± 0.19)∙10−8(5.46 ± 0.82)∙10−8(4.85 ± 0.38)∙10−8This work
10.012 ± 0.010(8.97 ± 1.27)∙10−8(4.56 ± 0.32)∙10−8(1.39 ± 0.16)∙10−7(1.11 ± 0.07)∙10−7This work
Table 2. The glass dissolution rate constants obtained via the regression of the experimental data using the Dissolving Cylinder Zero-Order Kinetic (DCZOK) model for Si and the total mass loss at a p H of 5.65 and at various temperatures. K 0 Si I ,   K 0 Si II , K 0 total I and K 0 total II are dissolution rate constants for Phase I and II for Si and total glass dissolution, as indicated by indices.
Temperature (°C) K 0 S i I   ( g / ( m 2 · s ) ) K 0 S i I I   ( g / ( m 2 · s ) ) K 0 t o t a l I   ( g / ( m 2 · s ) ) K 0 t o t a l I I   ( g / ( m 2 · s ) ) Reference
25 ± 1(1.46 ± 0.23)∙10−9(2.60 ± 0.18)∙10−10(1.04 ± 0.12)∙10−8(1.42 ± 0.11)∙10−9This work
40 ± 1(2.62 ± 0.37)∙10−9(1.08 ± 0.08)∙10−9(1.37 ± 0.19)∙10−8(2.72 ± 0.19)∙10−9This work
60 ± 1(6.67 ± 1.03)∙10−9(2.30 ± 0.16)∙10−9(1.82 ± 0.29)∙10−8(4.05 ± 0.29)∙10−9This work, [12,16]
80 ± 1(2.19 ± 0.31)∙10−8(8.91 ± 0.73)∙10−9(4.24 ± 0.59)∙10−8(1.47 ± 0.11)∙10−8This work
Table 3. The glass dissolution rate constants obtained via the regression of the experimental data using the Dissolving Cylinder Zero-Order Kinetic (DCZOK) model for Si and the total mass loss at 60 °C and at a p H of 5.65 at various stress levels. σ stands for stress; K 0 Si I ,   K 0 Si II , K 0 total I and K 0 total II are dissolution rate constants for Phase I and II for Si and total glass dissolution, as indicated by indices.
Weight (kg) σ K 0 S i I   ( g / ( m 2 · s ) ) K 0 S i I I   ( g / ( m 2 · s ) ) K 0 t o t a l I   ( g / ( m 2 · s ) ) K 0 t o t a l I I   ( g / ( m 2 · s ) ) Reference
00.0(6.67 ± 1.03)∙10-9(2.30 ± 0.16)∙10−9(1.82 ± 0.29)∙10−8(4.05 ± 0.29)∙10−9This work, [12]
0.030.2(7.27 ± 1.15)∙10−9(2.38 ± 0.21)∙10−9(2.08 ± 0.42)∙10−8(4.12 ± 0.33)∙10−9This work
526.4(7.45 ± 1.03)∙10−9(2.58 ± 0.19)∙10−9(2.04 ± 0.33)∙10−8(4.35 ± 0.35)∙10−9This work
842.2(8.30 ± 1.33)∙10−9(3.47 ± 0.25)∙10−9(2.01 ± 0.41)∙10−8(5.56 ± 0.44)∙10−9This work
1052.7(9.21 ± 1.33)∙10−9(4.73 ± 0.33)∙10−9(1.65 ± 0.44)∙10−8(8.12 ± 0.67)∙10−9This work