Abstract
In this study, we investigated injection molded wood-polypropylene composites based on various wood sources and their decay resistance against white rot (Trametes versicolor) and brown rot (Coniophora puteana) in a laboratory test according to EN 15534-1:2014. The manufactured composites consisted of poplar (Populus spp.), willow (Salix spp.), European beech (Fagus sylvatica L.), Norway spruce (Picea abies (L.) H. Karst.), and a commercial wood source (Arbocel® C100), respectively. All formulations were compounded on a co-rotating twin screw extruder and subsequently injection molded to wood–PP specimens with a wood content of 60% or 70% by weight. It was found that the test procedure had a significant effect on the mechanical properties. Loss in mechanical properties was primarily caused by moisture and less by fungal decay. Moisture caused a loss in the modulus of rupture and modulus of elasticity of 34 to 45% and 29 to 73%, respectively. Mean mass and wood mass losses were up to a maximum of 3.7% and 5.3%, respectively. The high resistance against fungal decay was generally attributed to the encapsulation of wood by the polymer matrix caused by sample preparation, and enhanced by reduced moisture uptake during the preconditioning procedure. Notable differences with respect to the wood particle source and decay fungi were also observed. Structural characterization confirmed the decay pattern of the fungi such as void cavities close the surface and the deposition of calcium oxalates.
1. Introduction
During the past two decades, the utilization of wood–polymer composites (WPCs) such as wood–polypropylene composites has increased remarkably. Most WPC products are employed in external applications (e.g., decking, cladding, railing, and fencing). Given the notable market increase of WPC decking, long service life, low maintenance costs, and given warranties for up to two decades are stated as key aspects and unique selling points [1].
Decay resistance and good long-term weathering performance were initially expected from WPCs due to their anticipated low moisture absorption and attained degree of encapsulation of wood particles in a thermoplastic matrix [2]. However, some laboratory and field studies have indicated that WPCs can severely be affected by wood decaying fungi [3,4]. As stated by Krause and Gellerich [5], wetting is necessary to prepare WPCs for durability testing. To examine the durability of WPCs, they performed a preconditioning procedure of two weeks according to EN 84 [6,7]. Until now, there have only been limited experiences and studies in assessing the durability of WPCs according to the modified test procedures in EN 15534-1 [6].
Apart from moisture, the biological durability of WPCs is known to be strongly affected by the wood–polymer ratio, the applied process, and the used additives [8,9]. The sources for WPC products are usually by-products from the timber and timber-based industry. Mainly Norway spruce (Picea abies (L.) H. Karst.) is used, but other softwoods are also commonly used. However, the availability of softwoods is decreasing, for example in Germany [10], as a result of implemented changes concerning the forestry and silviculture concepts. In terms of volume and price, hardwood species, especially beech wood (Fagus sylvatica L.), are likely to become a very important source in future markets [11]. Moreover, fast-growing wood species (e.g., poplar and willow) from short-rotation coppices (SRCs) can be of interest for material utilization, which is nowadays still exclusively used for energy purposes. However, materials from SRCs are usually made within full-tree utilization and consequently contain a notable amount of bark material. This is unavoidable because the cost of debarking would exceed the benefits of using such low value wood sources.
In previous studies, Krause et al. [12,13] examined the influence of various wood sources on the physico-mechanical properties of wood–polypropylene composites. We hypothesize that the test procedure according to EN 15534-1 [6] is a suitable test method for determining the biological durability of WPCs, especially against wood-destroying basidiomycetes. However, to the knowledge of the authors, this is the first time that this standard has been applied and fundamentally discussed. To study the decay resistance of the manufactured injection molded WPC, the following objectives were followed:
- (I)
- Evaluation of the relative loss in mechanical properties caused by the test procedure such as moisture and fungi;
- (II)
- Examine the relationship between moisture content (ω)/mass loss and modulus of rupture (MOR)/modulus of elasticity (MOE);
- (III)
- Study the impact of wood source on decay resistance; and
- (IV)
- Study the impact of fungal decay on the internal composite structure.
2. Materials and Methods
All WPC formulations consisted of wood particles (WPs), isotactic polypropylene (PP), a coupling agent (MA-PP), and a color master batch (Table 1). Different types of WPs were incorporated into the wood PP formulations achieving a wood content of 60% by weight. The source of the produced WPs originated from poplar (Populus spp.) and willow (Salix spp.) grown in SRCs, Norway spruce (Picea abies (L.) H. Karst), and European beech (Fagus sylvatica L.). WPs made from European beech were distinguished between the types B1, characterized by a low tree diameter and a high amount of juvenile wood, and B2 including old stems with large diameters, partly discolored, and biologically affected stem sections. In addition to the produced WPs, commercially available WPs type C100 (Arbocel® C100, J. Rettenmaier & Söhne GmbH + Co KG, Kaisersesch, Germany) was used as an industrial reference material. The thermoplastic matrix was polypropylene (PP) 575P from Sabic (Saudi Basic Industries Corporation, Riyadh, Saudi Arabia), melt flow index 11 g/10 min (230 °C and 2.16 kg load), melting point 160 °C, density 905 kg m−3, in the form of granulates. Licocene® PP MA 7452 TP (Clariant International Ltd., Muttenz, Switzerland) was used as a coupling agent. The grafting level with maleic anhydride was 7%. Additionally, a PP-based color master batch (RAL 8012, Master Tec GmbH and Co. KG, Wunsiedel, Germany) was used. Polypropylene with MA-PP and the PP-based master batch were used as the polymer reference. More information on the used WPs and utilized tree stems can be found in Krause et al. [12,13].

Table 1.
Material composition of the wood–polypropylene (PP) composites and the polymer reference.
2.1. Processing and Wood-Polypropylene Composite Manufacturing
All wood material was chipped and subsequently ground with a hammer mill (Electra VS1 N, France) with an aperture size of 15 mm and 1 mm, respectively. After kiln-drying, the WPs were compounded with PP in a Leistritz MICRO27 GL/GG40D co-rotating twin-screw extruder (Leistritz Extrusionstechnik GmbH, Germany) with a gravimetric feeder and a hot-cut pelletizer. The temperature profile (zone 1 to zone 9) was set to 180 °C, 175 °C, 175 °C, 175 °C, 170 °C, 165 °C, 160 °C, 153 °C, and 145 °C, respectively. The temperature at the die was adjusted to 140 °C. The average melting temperature was kept around 145 °C, applying an average screw speed of 30 rpm, a pelletizer speed of 240 rpm, and a throughput of 1.5 kg/h. Afterward, all compounded formulations were injection molded to test specimens using an Arburg Allrounder 420 C (Arburg GmbH & Co KG, Loßburg, Germany). A 2 + 2 multi cavity tool was used for the production of specimens. Two bending test specimens (80 10 4 mm3) and two tensile dog bone shaped tensile test specimens (type 1A) were produced with each injection molding cycle, respectively. The injection molding temperature was adjusted to 170 °C, at a pressure ranging between 1500 and 2500 bar.
2.2. Sample Preparation and Fungal Test
A decay resistance test against basidiomycetes was carried out according to EN 15534-1 [6]. For the decay test, specimens were sterilized in an autoclave (Tuttnauer 5075 ELVC, Syntec GmbH, Wettenberg, Germany) for 21 min at 120 °C. The tested specimens (each variant, n = 10) were incubated with the brown rot fungus Coniophora puteana ((Schumach.: Fr.) P. Karst.; BAM Ebw. 15) (C.p.) and the white rot fungus Trametes versicolor ((L.: Fr.) Lloyd; CTB 863 A) (T.v.) in Kolle flasks for 16 weeks at 22 °C and 70% RH. Moisture uptake control specimens were exposed in Kolle flasks without fungal inoculation (each variant, n = 10). After 16 weeks, the specimens were oven dried to determine the material moisture content and the mass loss (ML (%)), according to ENV 12038 [14] including the changes given in EN 15534-1 [6] (Table 2, see also Figure S1).
Table 2.
Material moisture content (ω) throughout the test procedure and mass loss (ML) of the WPC. Respective wood moisture content (ωw) and wood mass losses (WML) are presented in parentheses.
The material moisture content (ω), mass loss (ML), wood moisture content (ωw), and wood mass loss (WML) were determined by using Equations (1)–(4).
where m0 is the initial dry mass of the sample, expressed in (g); mi is the mass of the wet sample, expressed in (g); mt is the dry mass of the sample after the test procedure, expressed in (g); wt is the weight percent of wood of the entire composite material, expressed in (%); ω is the material moisture content of the tested sample, expressed in (%); ML is the mass loss of the entire sample, expressed in (%); ωw is the wood moisture content of the tested sample, expressed in (%); and WML is the wood mass loss of the tested sample, expressed in (%).
Additionally, the effect of the test procedure on the physico-mechanical properties were evaluated according to EN 15534-1 [6]. Therefore, the relative loss in flexural strength () and modulus of elasticity (MOE) caused by moisture (σfm, Efm), test procedure (σfd, Efd), and fungi (σff, Efm) were determined, respectively, by using Equations (5)–(10).
where σi is the initial flexural strength of the specimen, expressed in MPa; σm is the moisture dependent flexural strength of the specimen, expressed in MPa; σd is the degradation dependent flexural strength of the specimen, expressed in MPa; σfm is the relative loss of flexural strength of the specimen caused by moisture; σff is the relative loss of flexural strength of the specimen caused by fungi; and σfd is the relative loss of flexural strength of the specimen caused by test procedure.
where Ei is the initial modulus of elasticity in flexure of the specimen (MPa); Em is the moisture dependent modulus of elasticity in flexure of the specimen (MPa); Ed is the degradation dependent modulus of elasticity in flexure of the specimen (MPa); Efm is the relative loss of modulus of elasticity in flexure of the specimen caused by moisture; Eff is the relative loss of modulus of elasticity in flexure of the specimen caused by fungi; and Efd is the relative loss of modulus of elasticity in flexure of the specimen caused by test procedure.
The flexural strength () and the MOE () of the test specimens were determined before (untreated), after pre-wetting (EN 84 [7]; water storage in distilled water), and after the fungal test procedure. The bending tests were conducted using a universal testing machine (Zwick/Roell, Z010 Allround Line, Germany) equipped with the software TestExpert II at a crosshead speed of 2 mm min−1. The tests were carried out immediately before drying.
The statistical analysis was performed using the Kruskal–Wallis non-parametric test with a 5% significance level. The Kruskal-Wallis test is similar to that of the parametric one-way ANOVA, except that it is based on ranks rather than means. All data analyses were executed using Statistica 13.3.1 (StatSoft, Tulsa, OK, USA). The descriptive statistical analysis was presented in Tukey boxplots and scatter plots. The boxplots were featured with the median, mean, interquartile ranges (IQR), whiskers of ±1.5 IQR., and outliers beyond whiskers.
2.3. Structural Characterization
For structural characterization, scanning electron microscopy (SEM), and x-ray computed micro-tomography (XμCT) were used. Both imaging techniques were applied on untreated, treated, and/or decayed specimens. For the tomographic examination, each specimen and treatment (untreated, pre-wetting, T.v., C.p., no fungi) were cut into match-stick sized samples measuring mm3 using a frame saw. Afterwards, double samples were prepared. Thereby, two samples were vertically glued on a cylindrical glass rod 0.5 mm in diameter using a thermoplastic hot-melt adhesive (Emil Lux GmbH & Co. KG, Wermelskirchen, Germany). We used a commercial XμCT system (Nanotom® s, phoenix|x-ray, GE Sensing & Inspection Technologies GmbH, Wunstorf, Germany) to tomographically capture our specimens. The system featured a cone-beam geometry, a transmission molybdenum target, and a CMOS (Complementary Metal-Oxide Semiconductor) flat-panel detector. Its mode of action has been briefly described by Koddenberg and Militz [15]. For scanning, we used a peak tube voltage of 45 kV, current of 320–360 μA, and a 2000 ms x-ray exposure time of 2000 ms. The source-to-object distance was 5.5 mm and the source-to-detector distance was 240 mm. By this means, a 5 to 7 μM tomographic resolution was achieved for our images. In total, 2000 16-bit TIFF projection images were captured by rotating the sample through 360° during continuous tomography mode. Once the scanning procedure was completed, artifacts (i.e., ring artefacts and sample-motion artifacts) were suppressed and the dataset was converted into a volumetric dataset using the datos|x reconstruction® software (phoenix|x-ray, GE Sensing & Inspection Technologies GmbH, Wunstorf, Germany). For image analysis of the volumetric datasets, we used the Avizo® 9 software (FEI, Thermo Fisher Scientific, Hillsboro, OR, USA). Quantitative analysis of the material structure was performed on defined regions of interest (ROIs). ROIs µM3 in size were extracted from each volumetric dataset. Image segmentation on the ROIs used Avizo’s Segmentation Editor. Segmentation of the air voids used the seeded region-growing method, which excluded noise from the cell lumens. By choosing an arbitrary seed voxel of the air, this method selects the largest connected area that contains the seed voxel and all voxels with grayscale values inside a user-defined range. Segmentation of the high absorbing particulates was done through manual thresholding using similar threshold levels for each dataset. The size (i.e., feret length and feret width) of the particulates and percentage of material was obtained after segmentation and labeling.
As above-mentioned, specimens were also imaged using a scanning electron microscope (SEM) system (ZEISS EVO® LS 15, Carl Zeiss Microscopy GmbH, Jena, Germany) equipped with an energy-dispersive x-ray spectroscopy (EDX) module (X-MaxN (50 mm), Oxford Instruments, Abingdon, UK). In total, 52 specimens measuring mm3 were prepared of the sample and treatment (untreated, pre-wetting, T.v., C.p., no fungus) for the SEM analysis. Samples were prepared with the help of a microtome (Sartorius, Göttingen, Germany). Samples were mounted on aluminum stubs using carbon adhesive discs and coated with carbon. The SEM used an accelerating voltage of 5 or 10 kV, a current of 40 pA, and a working distance of 8.5 mm. Both backscattered electron (BSE) and secondary electron (SE) detectors were used to capture images of each sample. Images were captured as TIFF files. The compositional mapping of the samples was accomplished using SEM-EDX.
3. Results
3.1. Mass Loss of Decayed Specimens
Mean mass losses (MLs) were generally low for all WPC specimens tested (Figure 1). Mean MLs and wood mass losses (WMLs) ranged up to a maximum of 3.7% and 5.3%, respectively. It became evident that the obtained MLs notably varied, depending on the wood source and applied decay fungus. Comparing both wood-rot fungi, the WPC containing hardwood sources showed higher decay rates when subjected to T.v. (i.e., white rot) when compared to C.p (i.e., brown rot). WPCs containing softwood sources exhibited only slightly increased decay rates when subjected to C.p. when compared to T.v. Composites based on the SRC sources revealed increased decay rates when compared to the composites based on beech or spruce.
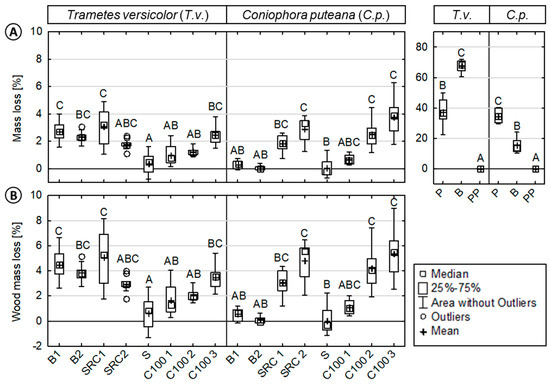
Figure 1.
Resistance of injection molded wood-polypropylene composites and reference materials against basidiomycetes. (Left): (A) Mass loss (ML) and (B) wood mass loss (WML) of the composites/reference materials inoculated with Trametes versicolor (T.v.) or Coniophora puteana (C.p.). (Right): ML of the reference materials (beech wood, pine sapwood, and polypropylene). Results of the statistical analyses are displayed, where values assigned with the same letter are not significantly different from each other at a significance level of α = 0.05 (Kruskal-Wallis). The mass loss evaluation of the virulence control samples showed that the test was valid (average mass loss >20%). Pinus sylvestris virulence control samples showed an average weight loss of 41.4% (±7.2) and Fagus sylvatica virulence control samples of 28.3% (±1.9) (data not shown), respectively.
In the case of T.v., composites based on hardwoods exhibited increased MLs (WMLs) when compared to composites based on softwood sources. SRC 2 showed the highest WMLs of 5.1% (±2.2), followed by B1 with 3.9% (±1.2), and B2 with 3.5% (±0.7). The composites based on industrial wood particles, namely C100 1-3, showed a significant increase in MLs (WMLs) with increasing wood content. An increase in MLs (WMLs) was also observed for composites without a coupling agent. The lowest ML and WML values were observed for S with 0.4% (±0.8) and 0.6% (±1.3), respectively.
In the case of C.p., the highest MLs (WMLs) were observed for composites based on industrial softwood particles and SRC sources. C100 3 showed the highest WMLs with 5.3% (±2.2), followed by SRC 2 with 4.8% (±1.6), and C100 2 with 4.2% (±1.6). Compared to these composites, low WMLs were revealed for S, B2, B1, and C100 1 with 0.1% (±2.0), 0.1% (±0.6), 1.1% (±0.9), and 1.1% (±1.0), respectively.
Generally, increasing wood content and a lack of coupling agent resulted in increased MLs, respectively. Calculated wood mass losses (WMLs) were considerably higher, showing that the conditions were favorable for the growth of the test fungi. Untreated beech wood showed MLs of 67.6% (±4.0) and 15.4% (±4.8), when exposed to T.v. and C.p., respectively. Untreated pine sapwood resulted in MLs of 37.3% (±8.7) and 34.7% (±4.2) when exposed to T.v. and C.p., respectively. No MLs were observed for the polymer reference.
The moisture dynamics of the tested materials throughout the test procedure, by means of material (ω) and wood moisture content (ωw), are shown in Table 2. The results have shown that the pre-wetting procedure (water storage for 14 days) and further test procedure (no fungus) significantly increased moisture content. As indicated by the respective ωw, composites that had been incubated with test fungi and those that were not showed both wood moisture contents close to fiber saturation (FS). However, exposure to fungi further increased ω (ωw). This increase became more pronounced with increasing MLs (WMLs), indicating favorable conditions for the growth and activity of the fungi.
3.2. Structural Characteristics and Alterations of Decayed Specimens
The data presented here are representative of repeated comparisons analyzing different scans of different sample sections. Generally, XμCT images revealed severe structural changes within all composites, either attributed to moisture or fungi. With respect to the test procedure, changes attributed to decay fungi are depicted in Figure 2. As indicated for composites with increased MLs, it became evident that there were severe air pockets (voids) present, caused by fungal decay. Additionally, bright spherical particulates were present within several decayed WPC and solid wood specimens. In the case of WPCs, the bright particulates were present in samples exposed to C.p. and T.v. The particulates were primarily localized within the observed voids close to the composite surface. In the case of the wood reference, however, such particulates were widely distributed throughout the entire sample. Compositional mapping through SEM-EDX showed that calcium was a major elemental component of these particulates. XμCT enabled the visualization of spatial distributions of calcium particulates and air voids, and provided insights that were often not apparent in two-dimensional (2D) images acquired by SEM. In particular, XμCT revealed that usually one to five large particulates with a size up to 150 µM were deposited in the observed voids. We also observed that the deposition of particulates sometimes stopped locally, even though adjacent voids caused by fungal decay were present.
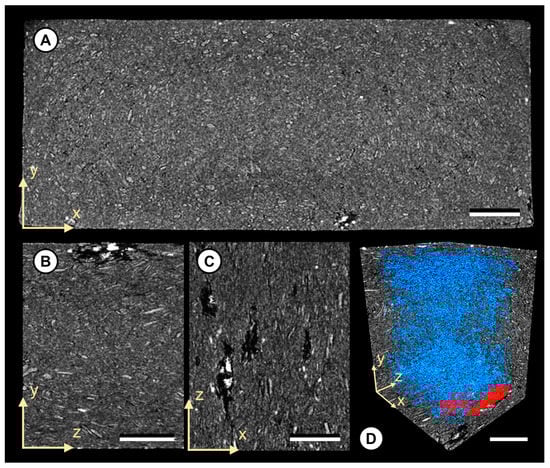
Figure 2.
Tomographic images of WPC C100 1 exposed to the white rot fungus Trametes versicolor. (A) The yx-plane view displaying the entire cross-section of the sample. Note the visible particle/matrix delamination patterns and large air pockets close to the composite surface. (B,C) Detailed view of the air pockets close to the composite surface (yz-plane and zx-plane). Note the high absorbing particulates (white) within the pocket cavity. (D) Detailed view of the spatial void distribution throughout the sample. Note the separated air pockets marked in red. Scale bar: 1000 μM.
With respect to fungal decay, composites exposed to the brown rot fungus C.p. revealed an increase in void volume close to the near surface (up to 50 μM) and high absorbing particulates in composites based on SRCs or C100. However, composites exposed to the white rot fungus T.v. revealed larger air pockets up to 2000 µM in length and altered structures at a depth of up to 1000 µM from the surface. Interestingly, even composites with low mass losses showed notable structural alterations attributed to moisture and fungal decay. For the latter, this is exemplarily shown for a C100 1 specimen exposed to T.v. (1.2% ML; 2.0% WML) in Figure 2. In direct comparison to the untreated and treated samples without fungus, the relative and total number (n) of air voids increased. After the exposure to T.v., the relative (total) air void volume within the composite was 1.29% (n = 32,757). For the untreated and treated samples without fungi, relative (total) air void volumes of 0.19% (n = 7990) and 0.42% (n = 12,531) were determined, respectively.
3.3. Fungal Test Procedure—Effect of Moisture and Fungi on Mechanical Properties
The general impact of the test procedure on the tested materials is shown by their relative mean loss of mechanical properties (MOR, MOE) (Figure 3). Mechanical properties of both the wood and wood–polypropylene composites were strongly affected by the test procedure. The mechanical properties of both materials were nearly reduced by half. The properties of the polymer reference were not at all affected by the test procedure (see Figure 4 and Figure 5).
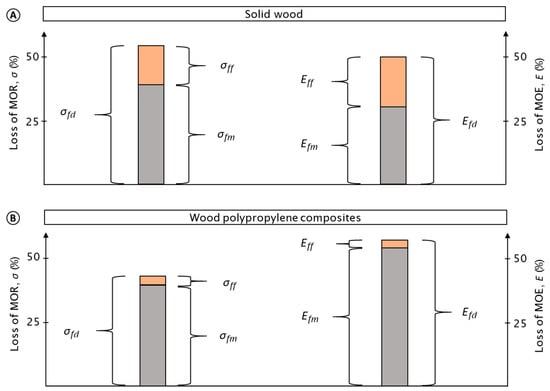
Figure 3.
Mean percentage loss in the modulus of rupture (MOR) and modulus of elasticity (MOE) for wood (A) and wood–polypropylene composites (WPC) (B). Loss in MOR/MOE caused by the entire test procedure (σfd; Efd), moisture (σfm; Efm), and fungi (σff; Eff) are presented, respectively. In total, eight variants of WPC, two variants of wood, and one variant of pure polymer were analyzed. The pure polymer composites were excluded from this figure as no loss in mechanical properties was observed. Note that for WPC, mechanical properties were greatly affected by moisture and marginally affected by fungi, respectively.
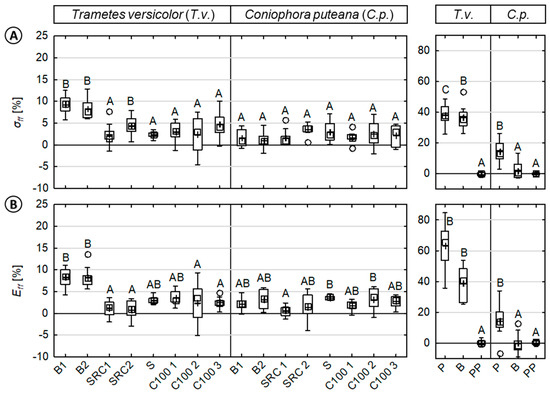
Figure 4.
Loss in mechanical properties caused by fungi of injection molded wood–polypropylene composites and reference specimen against basidiomycetes. (Left): (A) MOR (σff) and (B) MOE (Eff) of composites/reference materials inoculated with Trametes versicolor (T.v.) or Coniophora puteana (C.p.). (Right): For direct comparison, the MOR and MOE of the reference materials (beech wood, pine sapwood, and polypropylene) are shown. Results of the statistical analyses are displayed, whereas values assigned with the same letter are not significantly different from each other at a significance level of α = 0.05. (Kruskal-Wallis).
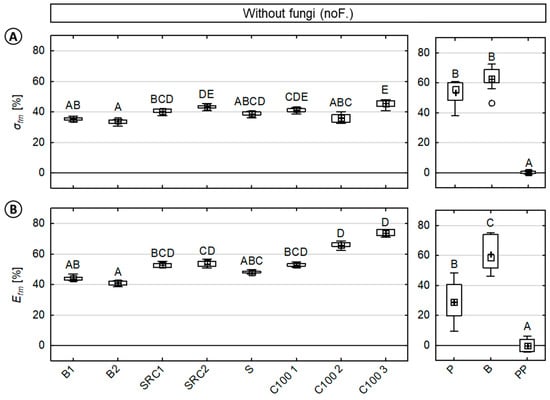
Figure 5.
Percentage loss in (A) MOR (σfm) and (B) MOE (Efm) of injection molded wood-polypropylene composites caused by moisture during the test procedure. (Right) For direct comparison, percentage loss in the MOR and MOE of reference materials (beech wood, pine sapwood, and polypropylene) are shown, respectively. Results of the statistical analyses are displayed, whereas values assigned with the same letter are not significantly different from each other at a significance level of α = 0.05. (Kruskal–Wallis).
In the case of the WPC, the losses in mechanical properties were particularly caused by moisture. This moisture-induced reduction was more than ten times higher when compared to the loss caused by fungi. Caused by moisture, mean relative losses in MOR of 39.3% (±4.1) and MOE of 54.0% (±10.4) were observed, respectively. Caused by fungi, mean relative losses in MOR and MOE of 3.4% (±3.1) and 3.0% (±3.0) were determined, respectively.
In the case of solid wood, mechanical properties were also notably reduced by moisture, although the relative losses in properties caused by fungi increased. Thus, more than half of the loss in mechanical properties was caused by moisture corresponding to the mean relative losses in MOR of 38.8% (±28.7) and MOE of 30.1% (±27.2), respectively. In contrast, fungal-induced mean relative losses in MOR and MOE were 15.2% (±17.6) and 19.5% (±25.7), respectively.
3.4. Impact of Different Wood Sources on Decay Resistance
With respect to the various wood sources in WPCs, significant differences were observed in relative losses of MOR (σ) and MOE (E) caused by fungi (Figure 4) and moisture (Figure 5), respectively. As shown in Figure 4, the relative losses in mechanical properties caused by fungi varied to some extent for the tested WPC and the applied test fungi, but significantly less when compared to solid wood. As above-mentioned, no loss in mechanical properties was observed for the virgin polymer reference.
In the case of WPC material, relative losses in MOR and MOE appeared to be very evenly distributed for all composites with only partially significant differences with respect to the wood source (i.e., beech wood). WPCs based on beech wood exhibited the highest losses in MOR and MOE with mean relative losses of up to 10% caused by T.v. Most of the other WPC samples exhibited mean relative losses in MOR and MOE between 0–5%, respectively.
In the case of solid wood, significant differences in mechanical properties were observed between the test fungi. In most cases, significant differences were also observed between pine and beech wood. For both solid wood materials, a major reduction in the MOR and MOE were revealed for T.v. rather than C.p. In the case of T.v., mean relative losses in MOR were 36.0% (±7.6) and 37.8% (±7.5) for beech and pine wood, respectively. Mean relative losses in MOE were 37.8% (±11.4) and 61.2% (±14.3) for beech and pine wood, respectively. Losses in properties caused by C.p. were rather small when compared to T.v. Mean relative losses in MOR were 1.0% (±5.6) and 14.2% (±7.3) for beech and pine wood, respectively. Mean relative losses in the MOE were 0.3% (±4.1) and 14.2% (±8.7) for beech and pine wood, respectively.
In direct comparison to the latter losses in mechanical properties caused by fungi, losses caused by moisture varied significantly between the tested WPC, and also in comparison to the solid wood references, as shown in Figure 5. Once more, negligible losses in mechanical properties were observed for the virgin polymer reference.
In the case of WPC material, both MOR (σfm) and MOE (Efm) values exhibited mean relative losses of 39.3% (±4.1) and 54.0% (±10.4), respectively. The results also showed less variation in the MOR when compared to the MOE. Mean relative losses in the MOR varied between 33.7% (B2) to 45.5% (C100 3). Mean relative losses in the MOE varied between 41.0% (B2) to 73.7% (C100 3). The composites based on beech wood showed significantly decreased losses in the MOE. In direct comparison to composites with a coupling agent, composites without a coupling agent (C100 2, C100 3) revealed notably increased losses in the MOE, but no increased losses in the MOR.
In the case of solid wood, significant differences between beech and pine wood were observed only for the MOE. For both solid wood materials, a major reduction by half in the MOR was revealed. Mean relative losses in the MOR were 54.6% (±7.7) and 63.5% (±7.6) for pine and beech wood, respectively. Mean relative losses in the MOE were 31.2% (±12.9) and 62.1% (±11.5) for pine and beech wood, respectively.
3.5. Relationship between Moisture Content (ω %) and Modulus of Rupture (MOR) or Modulus of Elasticity (MOE)
The mechanical properties and moisture contents are plotted in Figure 6 and show the relationship between moisture content (ω %) and the MOR or MOE. Within the investigated range, the MOR and MOE strongly decreased with increasing moisture values. Linear regression models indicate the relative data reductions between the MOR/MOE and increasing ω (%) for solid wood and the WPC (see Table S1). For the latter, strong negative correlations were found. Strong to weak negative correlations were found for wood. It became evident that the data for solid wood references varied drastically. No correlation was found for the virgin polymer reference.
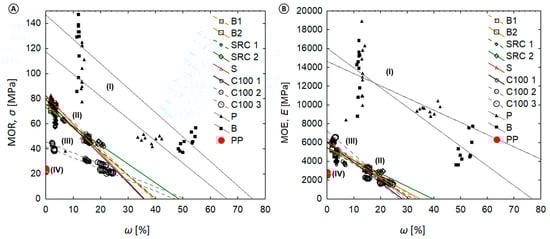
Figure 6.
Relationship between material moisture content (ω in %) and (A) MOR and (B) MOE. Note that the following clusters of material classes became evident. (I) wood (P, B)—Strong to weak negative correlation, high variation of individual data values; (II) WPC with MAPP—Strong to moderate negative correlation; narrow variation of data values; (III) WPC without MAPP—Strong negative correlation, narrow variation of data values; (IV) pure polypropylene—No correlation, very low variation of data values.
Within the investigated range, regression models also indicate the relative data reductions between the MOR/MOE and increasing ML (%) with respect to solid wood and the WPC. Strong to weak negative correlations was found between the ML and MOR/MOE data. However, no correlation was found for the PP reference, composites without ML, or composites with a ML below 0.5%.
4. Discussion
4.1. Fungal Test Procedure—Effect of Moisture and Fungi
In general, the fungal test procedure is suggested to fundamentally affect WPCs and foster the virulence of basidiomycetes to decay the material [5]. Up to the authors knowledge, this is the first time the fungal test procedure according to EN 15534-1 [6] has been applied to the WPC. Determining the decay resistance of wood-based materials is still not a trivial issue because of the numerous parameters influencing it. Difficulties in testing emerge mainly from the large variability of resistance within and among the utilized composites, wood sources, wood species, additives, and manufacturing processes. Following the standard, an evaluation based on the entire composite mass is suggested because (1) the wood content in commercial products is often unknown, and (2) some polymers and additives may absorb water and can be degraded by fungi. In our study, polypropylene content is given and was neither affected by water nor showed any ML during the test.
As displayed in Figure 3 and in line with previous studies, the mechanical properties of WPCs are rather more affected by moisture than by fungal decay [2,5,16,17]. WPC materials revealed a significantly different moisture behavior when compared to solid wood. Nevertheless, WPC is a wood based material interacting with moisture and can be clearly separated from the pure polymer materials. Therefore, the initial assumption that within the WPC, the wooden particles are entirely encapsulated and therefore inaccessible to water and fungi, like the virgin pure polymer, had to clearly be rejected [2,4,8,18,19]. As the WPC takes up less water, and particularly more slowly, the entire biological durability test procedure needs to be assessed by using a preconditioning procedure that take its slow sorption into account [17]. However, after preconditioning, the ωw of most WPC variants was still far below the FS (Table 2). This phenomenon is likely due to the preparation of samples by injection molding.
Bay and Tucker [20,21] illustrated that injected molded composite disks could be separated into different layers of preferential orientation of fibers, symmetrical about the mid-thickness of the sample. They stated that toward the center, a layer of biaxial oriented fibers, a layer of radially aligned fibers in the flow, a transition layer with random alignment, and finally, a core layer where the fibers are aligned perpendicular to the flow are formed [20,21]. Bledzki and Faruk [22] studied the elaboration of injection molded microcellular wood fiber–polypropylene composites. They highlighted a three layer sandwich structure with various fibers alignments, in accordance with a skin core effect. Correa et al. [23] investigated the anisotropy of injected short cellulose fiber composites and showed that fiber alignment varied, depending on the position inside the mold, most likely affected by the injection flow pattern. Moreover, in several studies, a notable spatial increase of polymer (polymer enriched surface) was assumed [24,25]. The increase of polymer near the surface is formed by the mold filling procedure and the flow pattern during injection-molding in a manner of a fountain flow [26]. Regarding the latter studies, the low MLs can be explained by the composite structure and integrity, and the polymer enriched surface layer, resulting in low ωw.
Previous studies on WPCs without a preconditioning procedure displayed ω up to 10% at the end of the test procedure and only insignificant MLs [27,28]. Despite preconditioning being essential, some recent studies on the decay resistance of WPC such as that reported by Candelier et al. [29] have still been performed without preconditioning and still only according to wood-related standards such as CEN TS 15083-1 [29]. Therefore, the declared high resistance against basidiomycetes can be explained by a lack of moisture rather than its general resistance against fungal decay. Reasons for still applying wood standards might be a lack of awareness or the complexity of the new modified test procedures to address the biological degradation of WPCs, by means of enabling the initiation of fungal growth. Clemons and Ibach [30] noted that the influence of the test procedure, by means of fungal decay and moisture, is clearly essential and needs to be addressed adequately by the preconditioning test procedure. In terms of preconditioning, Defoirdt et al. [17] applied an immersion in water at 70 °C for at least one week in their study on an extruded WPC based on a wood content between 50 and 70% and polypropylene, polyethylene, and polyvinyl chloride, respectively. With this method, a relative ωw from 21 to 43% has been reported [17], which was higher when compared to those in this study. However, the authors openly discussed that 70 °C is rarely reached in nature and likely changes the integrity of the composite structure, which was also verified by XµCT imaging. In contrast, Krause and Gellerich [5] investigated three different test procedures for compression molded WPCs based on a wood content between 50 and 60% and PP and PVC, respectively. They reported an increase in material (ω) and wood moisture content (ωw) up to 7 to 16% (ω) and 15 to 25% (ωw), respectively. These ω corresponded with the findings for the injection molded WPC. However, the stated MLs of up to 10% for C.p. were higher [5] when compared to the observed MLs of up to 4% for C.p. As wood content and additive utilization was almost comparable in both studies, this difference is likely caused by the manufacturing process. The internal structure and physico-mechanical properties of injection molded composites are different and significantly higher when compared to compression molded composites, respectively [31,32,33]. Composites manufactured by compression molding were also the first WPC products where brown and white rot fungi have been reported to be growing after four years of exposure in Florida [8].
An issue not often discussed is the effect of specimen size on the decay resistance of the tested material. Grünwald [34] examined the impact of sample size and shape on the decay resistance of scots pine sapwood against brown rot (C.p.). The results indicate that there is a correlation between MLs and surface to volume ratio. For scots pine sapwood, maximum MLs were found for surface to volume ratios, quite close to the surface to volume ratios determined for the tested WPC specimens. Following this correlation, high fungi activity and increased decay rates were expected. However, we can’t be certain that the same correlation also applies for WPC. In case of specimen size and shape, further studies on WPC are definitely needed.
4.2. Correlation between Moisture Content (MC) and MOR, MOE
As shown in Figure 6 and above-mentioned, moisture content is key and dominantly affects the mechanical properties of wood and WPC. As wood is hygroscopic, it attracts and retains moisture [35]. The moisture content of wood has a profound effect on the mechanical properties of the wood cell wall and, therefore the macroscopic properties of wood [35]. Mechanical properties such as MOR and MOE are strongly affected by changes in moisture content below the fiber saturation point (FSP) [36]. The MOR and MOE of wood are reduced by approx. 50% with increasing moisture content up to FS [36]. In accordance with the results found in this study, Niemz [37] confirmed a linear correlation between wood moisture up to FS and loss in bending strength for beech, spruce, ash, and maple wood.
The MOR and MOE of the WPC varied less when compared to solid wood, but revealed the same reductions in mechanical properties caused by moisture. Different wood particle sources seemed to have a minor impact on wood—moisture relationships. However, it became evident that the coupling agent greatly affects the mechanical properties [38] and, hence the slope of decrease. The observed four clusters clearly revealed the impact of moisture on the mechanical properties of the observed materials.
As expected, the obtained values for both the solid wood references (clusters I) clearly varied. Wood characteristics and natural variation are the main contributing factors to this issue. Clear straight-grained wood is used for determining their mechanical properties, however, due to the natural growth characteristics of trees, wood products vary in specific gravity, can contain cross grain, or may have knots and localized slope of grain. Natural defects, by means of pitch pockets, may occur accordingly due to biological or climatic elements influencing the living tree. These wood characteristics must be taken into account in assessing the genuine properties or estimating the actual performance of wood products [36].
4.3. The Effect of Wood Particle Source and Wood Species
For most wood particle sources and wood species, it is expected that low natural resistance against decay fungi would result in increasing fungal activity and higher MLs. Hence, MLs are influenced by anatomical properties and the chemical nature of the extractives [39]. As stated by Da Silveira [40], wood species with higher extractive content often reveal enhanced decay resistance. In terms of extractives, tannins are widely known to have antifungal activity against brown rot fungi [41,42]. However, the resistance against brown rot did not increase for composites including bark. Composites based on SRC material showed high decay rates for both decay fungi, but some slight affectations for one decay fungi. These results indicate that the bark content, containing a high amount of extractives, appeared to interfere with fungal decay. It can be assumed that a high amount of easily metabolizable extractives like sugars increase the decay process. However, the acidity of extractives like tannins can interfere with the chemical reaction of some additives (i.e., the coupling agent) resulting in increased moisture contents. Fabiyi et al. [19] assumed that incorporation of high lignin and extractive content of wood particles in the WPC should lower water absorption because these compounds tend to be hydrophobic (i.e., resin and wax). However, we assumed that it rather reduced the velocity of water uptake than the capacity. On this basis, the WPC based on the SRC containing material (e.g., poplar (lignin = 18%)) [19], exhibited the highest water absorption, as presented in Table 2. Due to high temperatures during manufacturing, extractives might migrate to the surface where they concentrate and physically block adhesive contact with the wood [36]. The extent to which extractives influence strength is assumed to be a function of the amount and kind of extractives, the moisture content of the specimen piece, and the mechanical property under consideration [36]. Shortly, both the morphology and biochemistry of the decay fungi may affect the properties and WMLs [36,39,40,43].
In general, the obtained results for the WML are in agreement with the findings from the literature [5,8,18,44,45,46]. As assumed for wood, higher MLs were observed for composites based on conifers (i.e., spruce wood), and exposed to brown rot (C.p.). However, composites based on hardwoods and, particularly wood species with a low natural durability such as beech wood, increased WMLs were observed when composites were exposed to white rot (T.v.). As indicated by several studies, this is attributed to the preferred attack pattern of white or brown rot fungi, besides the effect of anatomical properties, natural variation, and selective fungal activity in wood samples [39,44]. Generally speaking, all WPC specimens resulted in notable lower variance when compared to wood, indicating a homogenous structure and the reduced impact of the used wood species for all tested composites.
Increasing the moisture content of WPC materials, like composites without a coupling agent, appeared to result in further losses in mechanical properties. Nonetheless, these losses are still small compared to those of wood (Figure 4 and Figure 5). It became evident that the mechanical properties and mass losses of wood clearly varied depending on the wood species.
4.4. Structural Characterization
X-ray micro-computed tomography (XµCT) has become entrenched as a valuable imaging technique to material characterization [47]. In this study, we demonstrated that XµCT makes it possible to analyze the internal structure of the otherwise opaque WPC in three-dimensions (Figure 2) as XµCT based high absorbing particulates in WPC after fungal decay could be distinctly localized by their distinctly brighter voxel values. Previous XµCT-based studies [15,48] revealed that such voxels indicate the presence of particles that are composed of (inorganic) elements with a high atomic number (Z). For example, Koddenberg et al. [15] succeeded in analyzing silica particles in Australian turpentine wood (Syncarpia glomulifera (Sm.) Nied.) by means of their greater x-ray attenuation (Z = 14). Yamauchi et al. [48] used that advantage of x-ray imaging to study the spatial distribution of calcium (Z = 20) oxalates in seeds of Lotus miyakojimae. However, XµCT alone does not provide detailed chemical specifications regarding the elemental composition of particles. Their elemental compositions were further validated by using SEM-EDX analyses. Through elemental mapping using SEM-EDX analysis, the main element in the particles in this study could be identified as calcium enriched particulates. Since calcium oxalate is commonly present in decayed wood [39,49,50,51,52], these calcium-based particles are considered as calcium oxalate (CaOx). With regard to decayed wood, Koddenberg et al. [53] exposed the presence of calcium-based particles in soft-rot decayed wood of Fagus sylvatica and Picea abies through XµCT. It is suggested that oxalate plays a unique role in lignocellulose degradation by basidiomycetes, acting as a low molecular mass agent initiating decay [54]. The authors assume that in white rot fungi such as T.v., oxalate acts as a potential electron donor for lignin-peroxidase catalyzed reduction and chelates manganese, allowing for the dissolution of Mn3+ from the manganese-enzyme complex and thus stimulating extracellular manganese peroxidase activity [54]. Close to the oxalates, large void cavities attributed to the decay of the fungus were observed in the WPCs.
5. Conclusions
The intention of this study was to evaluate the effect of the fungal test procedure according to EN 15534-1 and to analyze the effect of fungal decay and moisture on the mechanical properties of injection molded WPC. The resistance against basidiomycetes was analyzed by material and wood mass losses. The altered structural characteristics were investigated by x-ray microcomputed tomography imaging. Moreover, various WPC materials were tested to address the impact of different wood sources on the resistance of WPC against basidiomycetes.
It was found that
- ▪
- the test procedure is suitable to test injection molded WPC;
- ▪
- moisture is key and wood–moisture interactions play a vital role when accessing different WPC variants and fungal infestation;
- ▪
- after preconditioning, the wood moisture content of many injection molded WPC is still below fiber saturation;
- ▪
- mass losses up to 3.7% (wood mass losses up to 5.3%) were determined for WPC;
- ▪
- wood mass loss is a valuable parameter for the actual degradation of wooden material caused by fungi within polyolefin based composites;
- ▪
- moisture content is strongly correlated with the mechanical properties of WPC;
- ▪
- structural analysis via XµCT provides valuable insights into the degradation pattern of wood decay fungi;
- ▪
- calcium oxalates were present in decayed WPC;
- ▪
- more data and further research on the fungal test procedure for WPC are required;
- ▪
- potential fields of interest are the impact of preconditioning, specimen size and shape, and fungi species; and
- ▪
- open issues are the informative value of mass losses and the classification to durability classes validated by a round robin test.
Supplementary Materials
The following are available online at https://www.mdpi.com/2079-6439/7/10/92/s1, Figure S1: Left: Exemplarily image of sterilized WPC specimens (i.e., S) placed in a kolle flask at the beginning of the degradation procedure. The test fungus (i.e., Trametes versicolor) is growing towards the WPC specimens. Right: Extracted WPC specimens (i.e., C100 2) covered by fungus mycelium (i.e., Trametes versicolor) after the degradation procedure (i.e., 16 weeks), Table S1: Statistical data of linear correlations between mass loss (ML %) or moisture (ω %) and modulus of rupture (MOR) and modulus of elasticity (MOE), respectively.
Author Contributions
Conceptualization, K.C.K., C.B., and A.K.; Formal analysis, K.C.K., C.B., and T.K.; Investigation, K.C.K., and T.K.; Methodology, K.C.K., C.B., and A.K.; Project administration, K.C.K., and A.K.; Supervision, H.M., and A.K.; Visualization, K.C.K., A.B., and T.K.; Writing–original draft, K.C.K.; Writing–review & editing, K.C.K., C.B., A.B., H.M., T.K., and A.K.
Funding
This research was funded by Federal Ministry of Education and Research (BMBF), grant number 2210070. We acknowledge the Open Access Publication Funds of the Göttingen University.
Acknowledgments
The authors gratefully thank Johannes Beruda for his help with manufacturing the WPCs, Antje Gellerich for her support with the test design, and Petra Heinze for her help with the fungal experiments.
Conflicts of Interest
The authors declare no conflicts of interest.
References
- Strohmeyer, A.; Walther, H. Overview of the German Wood-Plastic Composite Industry. In Proceedings of the 7th Biocomposites Conference Cologne, Cologne, Germany, 6 December 2017. [Google Scholar]
- Schirp, A.; Ibach, R.E.; Pendleton, D.E.; Wolcott, M.P. Biological degradation of Wood-Plastic Composites (WPC) and strategies for improving the resistance of WPC against biological decay. In ACS Symposium Series (982); American Chemical Society: Washington, DC, USA, 2008; pp. 480–507. ISBN 978-0-8412-3951-7. [Google Scholar]
- Sun, G.; Ibach, R.E.; Faillace, M.; Gnatowski, M.; Glaeser, J.A.; Haight, J. Laboratory and exterior decay of wood-plastic composite boards: Voids analysis and computed tomography. Wood Mater. Sci. Eng. 2017, 12, 263–278. [Google Scholar] [CrossRef]
- Ibach, R.; Gnatowski, M.; Sun, G.; Glaeser, J.A.; Leung, M.; Haight, J. Laboratory and environmental decay of wood-plastic composite boards: Flexural properties. Wood Mater. Sci. Eng. 2018, 13, 81–96. [Google Scholar] [CrossRef]
- Krause, A.; Gellerich, A. Evaluating durability of thermoplastic wood composites against basidiomycetes and development of a suitable test design. Wood Mater. Sci. Eng. 2014, 9, 179–185. [Google Scholar] [CrossRef]
- European Committee for Standardization (CEN). Composites Made from Cellulose-Based Materials and Thermoplastics (Usually Called Wood-Polymer Composites (WPC) or Natural Fibre Composites (NFC))—Part 1: Test Methods for Characterisation of Compounds and Products, EN 15534-1, German version: DIN EN 15534-1; European Committee for Standardization: Brussels, Belgium, 2014. [Google Scholar]
- European Committee for Standardization (CEN). Wood Preservatives—Accelerated Ageing of Treated Wood Prior to Biological Testing—Leaching Procedure; European Committee for Standardization: Brussels, Belgium, 1997. [Google Scholar]
- Mankowski, M.; Morrell, J.J. Patterns of fungal attack in wood-plastic composites following exposure in a soil block test. Wood Fiber Sci. 2000, 32, 340–345. [Google Scholar]
- Kim, J.W.; Harper, D.P.; Taylor, A.M. Effect of wood species on water sorption and durability of wood-plastic composites. Wood Fiber Sci. 2008, 40, 519–531. [Google Scholar]
- Dritte Bundeswaldinventur (BWi3)—Third National Forest Inventory. Available online: https://bwi.info (accessed on 6 June 2018).
- Mantau, U.; Prins, K.; Lindner, M.; Verkerk, H.; Eggers, J.; Leel, N.; Oldenburger, J.; Asikainer, A.; Anttila, P. Real Potential for Changes in Growth and Use of EU Forests. Methodology Report. Available online: https://www.ab.gov.tr/files/ardb/evt/1_avrupa_birligi/1_9_politikalar/1_9_6_enerji_politikasi/euwood_methodology_report.pdf (accessed on 6 June 2018).
- Krause, K.C.; Müller, M.; Krause, A. Converting wood from short rotation coppice and low-value beech wood into thermoplastic composites. In Bioenergy from Dendromass for the Sustainable Development of Rural Areas; Wiley-Vch: Weinheim, Germany, 2015; pp. 483–496. ISBN 978-3-527-68298-0. [Google Scholar]
- Krause, K.C.; Müller, M.; Militz, H.; Krause, A. Enhanced water resistance of extruded wood–polypropylene composites based on alternative wood sources. Eur. J. Wood Prod. 2017, 75, 125–134. [Google Scholar] [CrossRef]
- European Committee for Standardization (CEN). Durability of Wood and Wood-Based Products. Wood-Based Panels: Method of Test for Determining the Resistance Against Wood-Destroying Basidiomycetes; European Committee for Standardization: Brussels, Belgium, 2002. [Google Scholar]
- Koddenberg, T.; Krause, K.C.; Krause, A. Tomographic analysis of siliceous particulates in Australian turpentine wood (Syncarpia glomulifera) through X-ray micro-computed tomography. Micron 2019, 117, 22–28. [Google Scholar] [CrossRef] [PubMed]
- Schirp, A.; Wolcott, M.P. Influence of fungal decay and moisture absorption on mechanical properties of extruded wood-plastic composites. Wood Fiber Sci. 2005, 37, 643–652. [Google Scholar]
- Defoirdt, N.; Gardin, S.; Van den Bulcke, J.; Van Acker, J. Moisture dynamics of WPC and the impact on fungal testing. Int. Biodeterior. Biodegrad. 2010, 64, 65–72. [Google Scholar] [CrossRef][Green Version]
- Morris, P.I.; Cooper, P. Recycled plastic/wood composite lumber attacked by fungi. For. Prod. J. 1998, 48, 86–88. [Google Scholar]
- Fabiyi, J.S.; McDonald, A.G. Degradation of polypropylene in naturally and artificially weathered plastic matrix composites. Maderas Cienc. Tecnol. 2014, 16, 275–290. [Google Scholar] [CrossRef]
- Bay, R.S.; Tucker, C.L. Fiber orientation in simple injection moldings. Part I: Theory and numerical methods. Polym. Compos. 1992, 13, 317–331. [Google Scholar] [CrossRef]
- Bay, R.S.; Tucker, C.L. Fiber orientation in simple injection moldings. Part II: Experimental results. Polym. Compos. 1992, 13, 332–341. [Google Scholar] [CrossRef]
- Bledzki, A.K.; Faruk, O. Injection moulded microcellular wood fibre-polypropylene composites. Compos. Part A Appl. Sci. Manuf. 2006, 37, 1358–1367. [Google Scholar] [CrossRef]
- Correa, R.A.; Nunes, R.C.R.; Filho, W.Z.F. Effect of injections on the orientation of short fibre composites. An optical microscopic analysis. Polym. Test. 1996, 15, 467–475. [Google Scholar] [CrossRef]
- Mertens, O. Performance and Processing Evaluation of Thermoplastic Wood Fiber Composites. Master’s Thesis, Universität Hamburg, Hamburg, Germany, 2018. [Google Scholar]
- Bourmaud, A.; Ausias, G.; Lebrun, G.; Baley, C.; Tachon, M.L. Observation of the structure of a composite polypropylene/flax and damage mechanisms under stress. Ind. Crops Prod. 2013, 43, 225–236. [Google Scholar] [CrossRef]
- Peters, S.T. Handbook of Composites, 2nd ed.; Springer: Boston, MA, USA, 1998; ISBN 978-0-412-54020-2. [Google Scholar]
- Khavkine, M.; Kazayawoko, M.; Law, S.; Balatinecz, J.J. Durability of Wood Flour-Thermoplastic Composites under Extreme Environmental Conditions and Fungal Exposure. Int. J. Polym. Mater. 2000, 46, 255–269. [Google Scholar] [CrossRef]
- Segerholm, B.K.; Ibach, R.E.; Westin, M. Moisture sorption, biological durability, and mechanical performance of WPC containing modified wood and polylactates. BioRes 2012, 7, 4575–4585. [Google Scholar] [CrossRef]
- Candelier, K.; Atli, A.; Alteyrac, J. Termite and decay resistance of bioplast-spruce green wood-plastic composites. Eur. J. Wood Prod. 2019, 77, 157–169. [Google Scholar] [CrossRef]
- Clemons, C.M.; Ibach, R.E. Application of Laboratory Fungal Resistance Tests to Solid Wood and Wood-Plastic Composites. Plast. Build. Constr. 2003, 27, 7–14. [Google Scholar]
- Sobczak, L.; Lang, R.W.; Haider, A. Polypropylene composites with natural fibers and wood—General mechanical property profiles. Compos. Sci. Technol. 2012, 72, 550–557. [Google Scholar] [CrossRef]
- Müller, M. Influence of Wood Modification on the Properties of Polyvinyl Chloride Based Wood Polymer Composites (WPC). Bachelor’s Thesis, Georg-August University of Goettingen, Göttingen, Germany, 2011. [Google Scholar]
- Radovanovic, I. Verarbeitung und Optimierung der Rezeptur von Wood Plastic Composites (WPC). Master’s Thesis, University of Osnabrück, Osnabrück, Germany, 2007. [Google Scholar]
- Grünwald, L.K. Influence of Specimen Size and Shape on the Durability of Wood in Laboratory Tests. Master’s Thesis, Georg-August University of Goettingen, Göttingen, Germany, 2019. [Google Scholar]
- Ansell, M.P. Wood Composites; Elsevier/WP, Woodhead: Amsterdam, The Netherlands, 2015; p. 437. ISBN 978-1-78242-477-2. [Google Scholar]
- Ross, R.J. Wood Handbook: Wood as an Engineering Material; U.S. Dept. of Agriculture, Forest Service, Forest Products Laboratory: Madison, WI, USA, 2010; p. 508. ISBN 978-1-48485-970-4.
- Niemz, P. Physik des Holzes und der Holzwerkstoffe/Physics of Wood and Wood-Based Materials; ETH—Eidgenössische Technische Hochschule: Zürich, Zwitzerland, 2005; p. 159. ISBN 3-87191-324-9. [Google Scholar]
- Xie, Y.; Hill, C.A.S.; Xiao, Z.; Militz, H.; Mai, C. Silane coupling agents used for natural fiber/polymer composites: A review. Compos. Part A Appl. Sci. Manuf. 2010, 41, 806–819. [Google Scholar] [CrossRef]
- Schwarze, F.W.M.R. Wood decay under the microscope. Fungal Biol. Rev. 2007, 21, 133–170. [Google Scholar] [CrossRef]
- Da Silveira, M.F.; Gouveia, F.N.; Moreira, A.C.O.; Oliveira, J.R.V.; Silva, A.S.V.S.; Almeida, G.F.; Costa, A.F. Natural resistance of eight Brazilian wood species from the region Caatinga determined by an accelerated laboratory decay test against four fungi. Holzforschung 2019, 73, 151–154. [Google Scholar] [CrossRef]
- Laks, P.; Vehring, K.; Verhey, S.; Richter, D. Mold growth on wood-plastic composites. In Canadian Wood Preservation Association (CWPA) Proceedings; CWPA: Vancouver, BC, Canada, 2007; pp. 60–69. [Google Scholar]
- Laks, P.E.; McKaig, P.A. Flavonoid Biocides: Wood Preservatives Based on Condensed Tannins. Holzforschung 1988, 42, 299–306. [Google Scholar] [CrossRef]
- Hale, M.D.C.; Eaton, R.A. Soft Rot Cavity Widening—A Consideration of the Kinetics; IRG/WP/1227; International Research Group on Wood Preservation (IRG): Stockholm, Sweden, 1984; pp. 1–12. [Google Scholar]
- Schmidt, O.; Czeschlik, D. Wood and Tree Fungi: Biology, Damage, Protection, and Use; Springer: Berlin/Heidelberg, Germany, 2006. [Google Scholar]
- Müller, M.; Gellerich, A.; Militz, H.; Krause, A. Resistance of modified polyvinyl chloride/wood flour composites to basidiomycetes. Eur. J. Wood Prod. 2013, 71, 199–204. [Google Scholar] [CrossRef][Green Version]
- Morrell, J.J.; Stark, N.M.; Pendleton, D.E.; McDonald, A.G. Durability of wood-plastic composites. In Proceedings of the 10th International Conference on Wood & Biofiber Plastic Composites Forest Products Society, Madison, WI, USA, 11–13 May 2009; pp. 71–75. [Google Scholar]
- Van den Bulcke, J.; Biziks, V.; Andersons, B.; Mahnert, C.M.; Militz, H.; Van loo, D.; Dierick, M.; Masschaele, B.; Boone, M.N.; Brabant, L.; et al. Potential of X-ray computed tomography for 3D anatomical analysis and microdensitometrical assessment in wood research with focus on wood modification. Int. Wood Prod. J. 2013, 4, 183–190. [Google Scholar] [CrossRef]
- Yamauchi, D.; Tamaoki, D.; Hayami, M.; Takeuchi, M.; Karahara, I.; Sato, M.; Toyooka, K.; Nishioka, H.; Terada, Y.; Uesugi, K.; et al. Micro-CT observations of the 3D distribution of calcium oxalate crystals in cotyledons during maturation and germination in Lotus miyakojimae seeds. Microsc. Oxf. Engl. 2013, 62, 353–361. [Google Scholar] [CrossRef]
- Daniel, G. Use of electron microscopy for aiding our understanding of wood biodegradation. FEMS Microbiol. Rev. 1996, 13, 199–233. [Google Scholar] [CrossRef]
- Eriksson, K.-E.L.; Blanchette, R.; Ander, P. Microbial and Enzymatic Degradation of Wood and Wood Components; Springer: Berlin/Heidelberg, Germany, 2012. [Google Scholar] [CrossRef]
- Guggiari, M.; Bloque, R.; Aragno, M.; Verrecchia, E.; Job, D.; Junier, P. Experimental calcium-oxalate crystal production and dissolution by selected wood-rot fungi. Int. Biodeterior. Biodegrad. 2011, 65, 803–809. [Google Scholar] [CrossRef]
- Schilling, P.J.; Karedla, B.R.; Tatiparthi, A.K.; Verges, M.; Herrington, P.D. X-ray computed microtomography of internal damage in fiber reinforced polymer matrix composites. Compos. Sci. Technol. 2005, 65, 2071–2078. [Google Scholar] [CrossRef]
- Koddenberg, T.; Zauner, M.; Militz, H. REM und µCT-Aufnahmen von Holz nach Pilzbefall im Labortest—SEM and µCT imaging of wood after fungal decay in laboratory test. In Proceedings of the Deutsche Holzschutztagung, Dresden, Germany, 4–5 April 2019; pp. 115–125. [Google Scholar]
- Dutton, M.V.; Evans, C.S. Oxalate production by fungi: Its role in pathogenicity and ecology in the soil environment. Can. J. Microbiol. 1996, 42, 881–895. [Google Scholar] [CrossRef]


© 2019 by the authors. Licensee MDPI, Basel, Switzerland. This article is an open access article distributed under the terms and conditions of the Creative Commons Attribution (CC BY) license (http://creativecommons.org/licenses/by/4.0/).