Abstract
Combining the sol-gel method for fiber material production with the granulated silica method for preform assembly results in a robust method that offers a high degree of freedom regarding both the composition and the geometry of the produced fiber. Using this method, two types of Yb-doped silica glass composition, that feature an excess in P concentration with respect to Al, have been prepared. The elemental distributions in a fiber core were analyzed by scanning transmission electron microscopy (STEM). The elemental mapping shows a similar localization of Al, P and Yb through the microstructure. In addition, the influence of the variation in the co-dopant concentration, with respect to Yb, on the fiber properties has been investigated. The results show an increase in the refractive index step and in the fiber’s transmission loss as the excess concentration of P increases. A significant contribution to the losses can be assigned to the existence of impurities such as iron, which was detected in our samples by mass spectrometer. Single exponential fluorescence decays with lifetimes of around 0.88 ms were measured for the two compositions. Finally, pumping at 976 nm a laser slope efficiency of 67% at 1031 nm was achieved for one of the fiber compositions.
1. Introduction
Optical fibers doped with ytterbium (Yb) ions have attracted increasing interest for the development of high-power laser systems for applications requiring bright and high power beams, such as materials processing, medicine and telecommunications [1,2,3,4,5,6]. In comparison with other rare-earth (RE) ions, Yb is the favored lasing ion for emission at around 1 µm due to its numerous advantages, such as a simple energy-level diagram with only two electronic multiplets (2F5/2 and 2F7/2), a long fluorescence lifetime which provides the benefit of energy storage, and broad absorption and emission bands [7,8,9]. However, Yb and RE ions in general tend to form microstructural clusters when doped in silica glass and therefore co-doping with high field strength ions such as aluminum (Al) and/or phosphorus (P) is very important in order to improve the atomic distribution of Yb ions and to suppress their cluster formation in the silica matrix [10,11].
The main focus of this work is to investigate the influence of a fixed Al to P concentration ratio and varying content concentration with respect to Yb on the optical and laser properties of the fibers. Due to its simplicity and flexibility in tailoring the Al and P co-dopants’ concentration, the sol-gel based granulated silica method has been used to prepare two Yb-doped fibers with different Al and P co-dopant concentrations
As a host for Yb ions, silica glasses are of high importance because of their special properties such as high mechanical strength, high purity and low optical losses [12,13]. However, because of the low solubility of Yb ions in pure silica glass, the RE cations with their high field strength require a high number of non-bridging oxygens to coordinate with, in order to compensate for the positive charge [10]. This is difficult to achieve in a network that has few non-bridging oxygen hole centers, like that of SiO2 [14,15]. As a result, the RE ions can be forced to escape the rigid network in order to form clusters where they share non-bridging oxygen ions RE-O-RE [10,16]. With poor solubility of RE ions in molten silica glass, these RE microstructural clusters form even at very low concentrations [11,17]. Fortunately, co-doping silica glass with a second high field strength ion such as Al and/or P improves the solubility of RE ions in the matrix, which results in the suppression of RE ion formation, thereby improving the fluorescence properties of the glass [12,15,16].
The improved distribution of RE ions by co-doping with Al could be due to the formation of a solvation shell around the RE ions, since RE ions are soluble in alumina but not in silica [18]. The AlO4/2 and/or AlO6/2 coupled with SiO4/2 surround the RE ions to accommodate them in the glass network without sacrificing excess enthalpy. One model proposes that [AlO4]− anion compensates for the positive charge of the RE cations [16]. In this case, three Al per RE would be needed, but experimentally a ratio of 10:1 was found to be necessary to dissolve RE in silica [10]. Also, density functional theory-based energy calculations indicated a higher energy state for dissolved RE when co-doped with Al than for the clustered RE ions [19]. Another model proposes an entropic effect of Al co-doping that compensates for the higher enthalpy of the dissolved RE ions. The entropic effect is caused because Al adopts an octahedral state coordinated with six oxygen atoms, similar to a RE ion in silica. In this state Al could share sites with RE ions, resulting in more sites containing less RE ions than without Al co-doping [20]. Because the P co-dopant changes the fluorescence spectrum in a similar way to Al, an analogous solvation shell model is proposed for the influence of the P co-dopant on the RE dispersion in glass [10]. Co-doping with P creates orthophosphate, pyrophosphate, metaphosphate and phosphoryl groups [21]. These introduce negative charge and non-bridging oxygen into the glass network and thereby increase the solubility of the RE ions. In contrast to the Al effect, the direct interaction between P and RE ions supports a solvation shell model and, therefore, an enthalpic mechanism for the solubility improvement [20].
In this paper, we present two fibers with a fixed Al to P concentration ratio (Al/P = 0.86) but varying absolute content concentration, with respect to an Yb concentration of 0.3 at.%. The production method of the realized fibers, and its advantages and disadvantages in comparison with the standard production methods, are described. The effect of co-doping with Al and P on the atomic distribution of Yb in the silica matrix is examined by atomic resolution analytical scanning transmission electron microscopy (STEM). In addition, since the additional material processing (required by the sol-gel powder approach) has pronounced effects on the transmission properties of the fiber, one fiber composition was treated at two different temperatures in order to study its influence on the fiber transmission properties. Furthermore, variations in the fiber properties caused by the different Al-P concentrations with respect to Yb have been investigated by measuring their optical characteristics, such as refractive index profiles, transmission losses, and fluorescence lifetime. Finally, a laser slope efficiency of 67% was achieved at 1031 nm by pumping one of the fibers at 976 nm with a fiber-pigtailed laser diode (LD).
2. Fiber Production Method
Most RE doped silica glass fiber preforms for industrial applications are fabricated using the standard modified chemical vapor deposition (MCVD) method, in combination with solution doping, because it gives an excellent degree of achievable purity and low optical loss [22,23]. However, the MCVD method has geometrical limitations; it is mainly suited to producing fiber shapes with a cylindrical symmetry and limited in core size, because it is difficult to prepare large fiber cores while maintaining the homogeneity of the dopants and co-dopants [24]. These limitations make it challenging to fabricate RE-doped silica based fibers with large mode area (LMA) using the standard MCVD method. Furthermore, with MCVD it is difficult to maintain proper control over the preform/fiber parameters such as the dopant concentration, the usable dopants, and the dopant distribution [25,26].
In comparison, the sol-gel based granulated silica method has the potential to overcome some of the fabrication constraints of the conventional techniques by combining the benefits of the sol-gel based granulate/powder with the advantages of the powder-in-tube technique [27]. The advantages of the sol-gel method are mild reaction conditions, such as ambient temperature and pressure, that can be easily maintained [28,29]. In addition, since the process starts from a solution, materials of high homogeniety can be produced. However, if the sol-gel method is used only to coat the interior of the preform tubes, although one exploits the compositional freedom offered by the method, it does not afford the structural flexibility needed to make micro-structured fiber concepts, such as photonic crystal fibers (PCF) and leakage channel fibers (LCF).
The alternative preform production technology that we have been studying is the granulated silica method. A straightforward approach for this method is the so-called “oxides approach”, which is based on mixing the dopant and co-dopant powders with coarse grains of pure silica oxide powder, which offers unprecedented flexibility with respect to the fiber geometry and microstructure [30]. However, this approach suffers from high scattering losses due to the formation of micro-bubbles and glass inhomogeneities as a result of inhomogenously doped powder grains and incomplete diffusion. Nevertheless, due to the attractive flexibility of the granulated silica method, several processes and additional techniques have been introduced to reduce the scattering losses and to obtain a more homogeneous distribution of the dopants and co-dopants in the glass [31,32,33,34,35,36].
Among these techniques is the REPUSIL (reactive powder sintering of silica) process, which mixes fine silica powder with dopants and co-dopants in liquid form [24]. This technique leads to homogeneously doped glasses. However, the efficient and practical way for evacuation from the top of the preform while drawing the fiber, as a result of using a coarse grain size, is lost. Another technique is homogenization by means of stack-and-draw [37]. This method yields very low scattering losses; however, the homogenization is achieved after several cycles of drawing-stacking-consolidation which can be very time consuming.
Our approach is to combine the sol-gel method with the granulated silica method into the so called sol-gel granulated silica approach [38,39,40]. This combination offers a high degree of freedom concerning the composition and concentration of dopants and co-dopants, while also giving more control over the fiber geometry and microstructure [30,34,40]. This freedom enables a very high level of control over the refractive index of the core, allowing fabrication of optical fibers with a desired refractive index contrast. This approach is very attractive for matching passive to active fibers, and for production of fibers such LMA fibers and LCFs, where a small refractive index contrast between core (LMA) and cladding or core and microstructure (LCFs) is needed. On the counter side, using the sol-gel approach for fiber material production requires an additional material processing step in order to remove all the used solvents and organic material. During such processes, diffusion may occur, resulting in dopant concentration gradients and crystallization, which result in higher transmission losses in comparison with the standard methods. Nevertheless, since we are targeting applications for active fibers with a fiber length of a few meters, not kilometers, the higher losses of the fiber can be afforded and can be compensated for by the gain of the active fiber.
2.1. Method Description
The basic principle and development of the sol-gel based granulated silica method for active fiber production has been previously described in detail in [27,38,41]. It starts with mixing silica, dopant, and co-dopant material in the liquid phase. This results in the homogenous dissolving of dopant and co-dopant precursors, and permits high dopant concentrations (up to several at.%) [30]. The simplicity and flexibility of the sol-gel process also enables freedom for adopting varied dopant and co-dopant materials. Furthermore, it has been reported that silica powder based on the sol-gel method can show lower impurities compared to the natural quartz powder which is commonly used for producing pure silica glass [42]. Therefore, the sol-gel method is very well suited to making doped material for the production of rare-earth doped fibers. The sol-gel procedure process is shown in Figure 1, and described as follow:
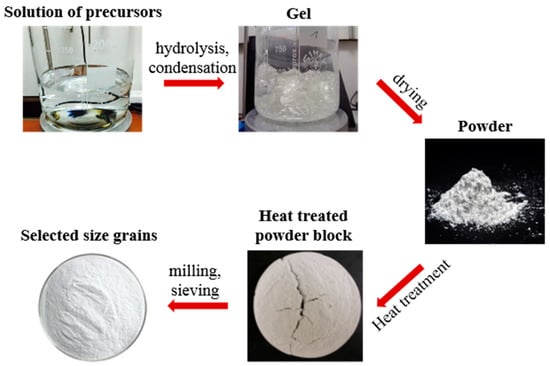
Figure 1.
Schematic of the sol-gel based granulated silica method process.
- Taking place at room temperature, the sol-gel process starts from a liquid condition by mixing an alkoxide precursor (TEOS) with other dopant precursors.
- By adding distilled water while stirring at moderate temperature, the solution undergoes hydrolysis and condensation, forming a gel at the end.
- This gel is then dried, resulting in a powder where every grain is homogenously doped.
Thereafter, several post-processing steps are applied in order to use the powder and the final granulate together with a slightly adapted powder-in-tube preform assembly for fiber drawing [27]:
- In a first processing step, the powder is heat treated into a powder block, in order to eliminate most OH-groups. Choice of correct heat treatment temperature is of high importance in order to prevent the formation of crystalline structures which could lead to high transmission losses.
- The powder block is then milled into granulates and, by sieving the granulates, the grain size can be selected in order to facilitate the evacuation of the preform while drawing. The selected grain size is in the range of 150 µm to 1 mm.
After obtaining the doped granulated silica by the sol-gel method, the following steps take place (see Figure 2):
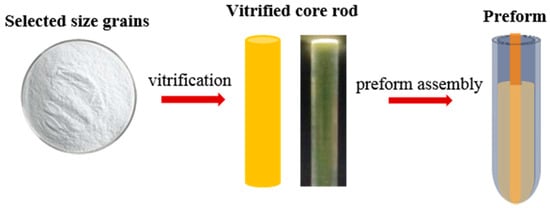
Figure 2.
Schematic of powder vitrification and preform assembly.
- The doped powder is vitrified into a core rod in the drawing tower, before fiber drawing [38,39].
- The preform is then assembled by placing the vitrified core rod in the center of a large silica tube and filling the gap with pure silica powder.
- Finally, the preform is drawn into a fiber at around 2000 °C.
2.2. Fabrication of Yb-Doped, Al and P Co-Doped Silica Fibers by the Sol-Gel Granulated Silica Method
For the sol-gel process, we used tetraethyl orthosilicate (TEOS: Si) as silica precursor, ytterbium (III) nitrate pentahydrate (Yb·5) as Yb dopant precursor, and for optically passive co-dopants, the precursors aluminum nitrate nonahydrate (Al·9) and phosphorus pentoxide ().
In previous work [43], we have studied the effects of different Al to P concentration ratios on the performance of Yb-doped silica fibers prepared by the sol-gel based granulated silica method. Favored performance was achieved for the composition with a slightly higher P concentration than Al (Al/P = 0.82). In this work, two core compositions have been prepared with Al to P concentration ratio fixed at this optimum ratio (Al/P = 0. 82), but with two different absolute concentrations with respect to 0.3 at.% of Yb concentration. The two compositions were treated at a maximum applied temperature of 1550 °C before drawing, and then drawn into fibers named A1550 and B1550. The powder derived from the sol-gel of one of the compositions was also treated at a maximum temperature of 1200 °C to yield the fiber named B1200 after drawing. The core precursor compositions (given in at.% while neglecting the oxygen content) and heat treatment temperatures for the fibers are listed in Table 1.

Table 1.
Core precursor composition and maximum heat treatment temperature.
While our production method gives no limitation on the core size, the fibers were drawn with core/cladding diameters of 10/125 µm corresponding to LMA fibers, as a benchmark geometry for testing their different compositions/heat treatment effects. The core and cladding diameters vary from one piece to another by 1 and 2 µm respectively. The fibers were then coated with a low index coating in order to obtain double-clad Yb-doped fibers. Figure 3 shows an image of the cross section of fiber B1200.
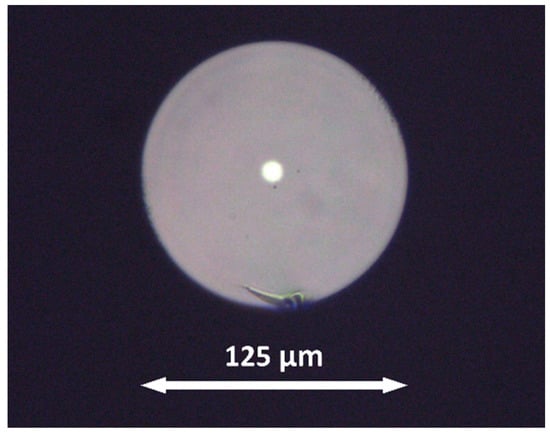
Figure 3.
Image of the cross section of fiber B1200 illuminated from the bottom side.
3. Measurements and Results
3.1. Structural Imaging and Analysis
The atomic distribution of Yb ions, and general elemental distributions in the vitrified core rod of A1550 sample, were observed with aberration-corrected STEM in combination with energy-dispersive X-ray spectroscopy (EDXS). The analysis was performed on Titan Themis 60-300 (FEI/Thermo Fisher Scientific, Eindhoven, The Netherlands) operated at 200 kV high tension and using probe currents of 85 pA for the atomic imaging and 250 pA for the imaging with chemical analysis. The high sensitivity Super-X EDXS detectors (FEI/Thermo Fisher Scientific, Eindhoven, The Netherlands) of the instrument allowed mapping of the distribution of different elements in the fiber core sample.
To prepare the samples for STEM imaging, the core of the fibers was first mechanically crushed into powder using a diamond tip. The powder was then dropped onto a Quantifoil carbon grid, i.e., perforated amorphous carbon films supported on Cu grids. No Argon sputtering was applied during the sample preparation.
Figure 4 shows example high-angle annular dark-field (HAADF) STEM images of the vitrified core of sample A1550. Because of the high atomic number of the Yb ions relative to that of the silica matrix, there is strong scattering of electrons from their nuclei to the HAADF detector. Combining this scattering with the STEM imaging using an aberration-corrected sub-Å diameter electron probe, the images show the atomic distribution of Yb ions in the silica matrix. Individual ions are visible as bright dots on the darker background of the silica matrix, similar to the analysis in reference [44]. In the images, the Yb ions are clearly grouped into clusters of ~3–6 nm in diameter. Some of the clusters are outlined by red ellipses in order to help the reader distinguish them.
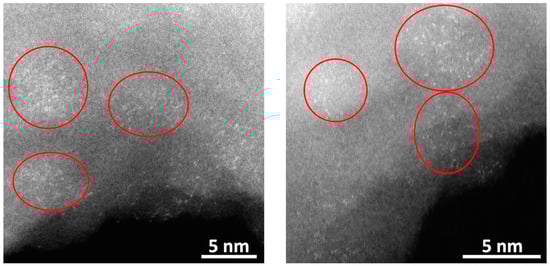
Figure 4.
Aberration-corrected high-angle annular dark-field (HAADF) scanning transmission electron microscopy (STEM) images of the fiber core of sample A1550, taken from different regions at slightly different magnifications. The white dots in the images correspond to individual Yb cations contained in the silica matrix; the latter is seen as a more homogeneous, darker background. (Note that the dots are sometimes distorted because of small dynamic motions of the cations under the electron beam used for imaging.) The Yb cations are seen to form clusters ~3–6 nm in diameter, rather than being uniformly distributed. Some of these clusters are approximately outlined by red ellipses, to help indicate their presence to the reader.
Figure 5 shows the chemical analysis of a region of sample which is similar to those shown in Figure 4, but chosen to be slightly thicker in order to increase the X-ray signal. In the HAADF image of Figure 5a, clouds of white dots indicate the Yb ion clusters. Confirming that this image interpretation is correct, the EDX spectrum in Figure 5b integrated from signal acquired over a region containing a cluster, as indicated with the red box on Figure 5a, shows a clear Yb signal in the form of a small Yb-Lα peak. In contrast Figure 5c, a spectrum taken from a region away from the Yb clusters, as indicated on Figure 5a with a blue box, shows no Yb-Lα peak signal. Panels Figure 5d–i show elemental EDXS maps of the whole of the region shown in the HAADF image Figure 5a.
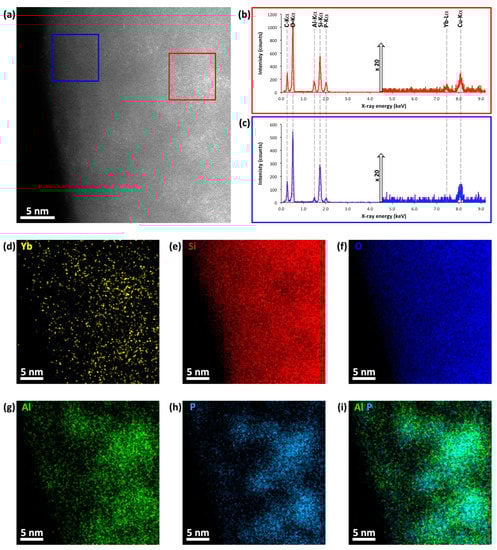
Figure 5.
Chemical analysis of a region of sample A1550. (a) aberration-corrected HAADF STEM image of the region mapped by energy-dispersive X-ray spectroscopy (EDXS). The region contains clouds of white dots corresponding to clusters of Yb cations, similar to the clusters shown in Figure 4. (b) integrated EDX spectrum from a region containing a Yb cluster; the region is indicated by the red box on image (a). (c) EDX spectrum from a region without Yb ions as indicated on image (a) by the blue box. On both spectra the main peaks are indicated and labeled with their corresponding elemental X-ray emissions. (Note that the Cu-Kα peak is fluoresced from the Cu transmission electron microscope (TEM) grid.) Because of the very low signal from the small number of Yb atoms, in order to show the weak Yb-Lα peak, the intensity of the right-hand part of the spectrum is multiplied by a factor of 20 compared to the left-hand part of the spectrum. (d–i) elemental maps for Yb, Si, O, Al, P and composite Al-P, across the whole of the region shown in image (a). Each map is calculated by integrating the area under the corresponding elemental peaks indicated on the EDX spectra (b,c); a 2D Gaussian blur is applied to each map to reduce noise. When interpreted together with the HAADF image (a), the maps show that the Al and P are co-localized with the Yb clusters.
Map Figure 5d shows the chemical distribution of Yb, which, although noisy because of the very small Yb signal, correlates well with the Yb clusters seen as clouds of white dots in the HAADF image Figure 5a. In contrast, maps for Si and O, Figure 5e,f respectively, confirm that these two main matrix elements are much more homogeneously distributed, according with the background intensity from the matrix in the HAADF image Figure 5a. In comparison, maps Figure 5g,h for Al and P, and the composite Al-P map in Figure 5i, show that these two dopants are both localized to each. Furthermore, comparison of their distribution to the Yb clusters seen in the HAADF image shows that the three elements are co-localized together; that is, the Al and P are associated with the Yb clusters. As a final confirmation of this co-localization, the EDX spectrum Figure 5b from the cluster region shows a much higher signal from P and Al relative to the matrix Si signal than that for the spectrum Figure 5c from the Yb-free region of the matrix.
3.2. Refractive Index Profiles
The refractive index profile is one of the essential guiding parameters to determine various properties of optical fiber, such as the numerical aperture (NA) and the single mode cutoff. Bubnov [45], studied the effect of Al and P concentrations on the refractive index in silica glass showing that, individually, each co-dopant would increase the refractive index, but, in combination, the P compensates for the refractive index change arising from the Al [46].
To confirm the effect of the Al and P concentration on the refractive index steps, an accurate measurement of the refractive index profile is required. Therefore, the refractive index profiles were measured by two different methods. The first one is a self-built inverse refracted near-field technique, which is based on the refracted near-field technique but modified in such a way to allow a two-dimensional (2-D) measurement of the refractive index profile [47,48,49]. The second setup is a self-built reflection-based refractive index mapping setup with high measurement accuracy [50].
Figure 6 shows the 2-D refractive index profile of fiber A1550 and Figure 7 shows the refractive index profile of a line scan over the fiber’s cross section. The refractive index steps were obtained from the 2-D refractive index profiles by subtracting the average refractive index of a selected area within the core from the average refractive index of a selected area within the cladding. The refractive index steps were measured at 630 nm and, therefore, the NAs were estimated at 630 nm. The measured values and their uncertainties with 95% confidence bounds are listed in Table 2. The measured refractive index steps correspond well with the Al and P co-dopant concentrations. The smaller the difference between Al and P concentrations, the smaller the refractive index contrast to the pure silica cladding, and thus the smaller the NA.
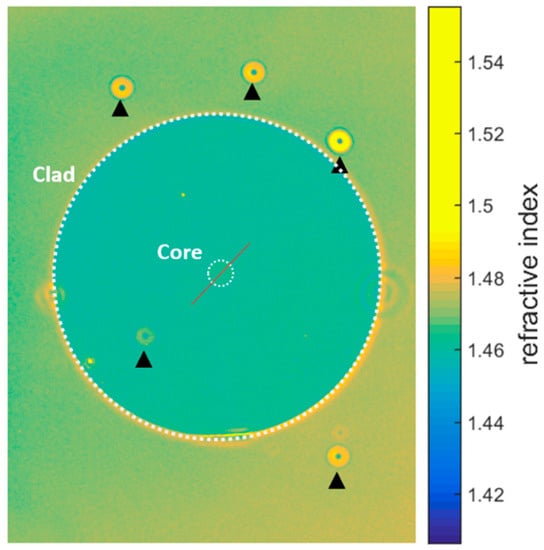
Figure 6.
Two dimensional refractive index profile of A1550 fiber obtained from the 2-D refractive index profiling setup. The core and cladding region are circled in white for clarity. The black triangles represent dust particles.
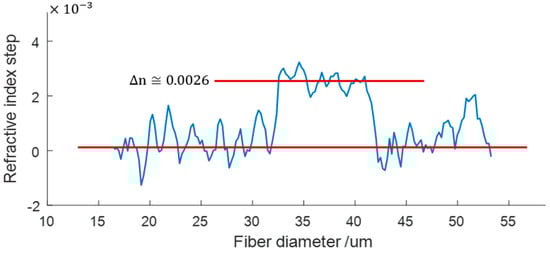
Figure 7.
One-dimensional refractive index profile of A1550 fiber (cladding was set to be zero). The scanning line is indicated in Figure 6, in red.
Table 2.
Refractive index step between doped core and pure silica cladding.
3.3. Transmission Losses
The transmission losses of the fiber cores are determined by a cutback method. Light from a helium-neon laser at 630 nm is modulated using a chopper and launched into one end of the fiber being tested. The light emitted from the other end of the fiber is collected by a large-area photo detector and the resulting signal is amplified by a lock-in amplifier. The fiber is then cut back by a known length and the cleaved end reinserted into the detector assembly. The loss measurement of each fiber was performed over a fiber length of 3.5–4 m. In order to obtain accurate loss measurements, five measurement points (cutbacks) over the fiber length were obtained for each fiber. The transmission loss of each measurement point was then calculated using the following equation:
where and are the detected transmitted power through the fiber before and after the fiber is cut respectively, and is the length of the cut piece. The average transmission loss for each fiber was then obtained by linearly fitting the five measurement points and calculating its slope.
Since the fibers being tested are double cladding fibers, stripping the cladding modes is essential for obtaining accurate measurements of the transmission losses of the fiber core. In order to do that, a specific length of the coating was removed and the uncoated part was placed in index-matching oil. Since the fibers had big scattering centers which could lead to additional cladding modes as the light propagates in the fiber, the coating was removed towards the fiber end under measurement after every cutback. This allows most of the cladding light (due to in-coupling and scattering) to be refracted away from the fiber. Additional spatial filtering is applied by using a pinhole that is placed between the fiber end and the detector, in order to make sure that only the guided light from the core reaches the detector. The measured transmission losses of the fibers are summarized in Table 3.
Table 3.
Transmission losses of fibers derived from the sol-gel granulated silica method.
In our fibers, the main sources of optical loss are optical scattering and impurity absorption. Optical scattering could be a result of doping inhomogeneity and/or scattering centers, such as bubbles or unvitrified powder grains. By lowering the heat treatment temperature to 1200 °C during the post-processing of the powder (derived from the sol-gel), the number of scattering centers can be reduced. Although that is not well reflected by the measured transmission losses of the two fibers (B1550 and B1200) with the two different heat treatment temperatures (1550 °C and 1200 °C), the scattering centers were nevertheless reduced in the latter fiber. This was already evident with the naked eye, with the B1550 fiber visibly showing more scattering centers. Impurity absorption mainly originates from iron (Fe), which can dramatically increase the optical losses of the Yb-doped silica fibers owing to its strong and broad absorption band centered at around 1200 nm. To check for Fe impurities in our fibers, Fe content was measured using a laser ablation inductively coupled plasma mass spectrometer (LA-ICP-MS). The measured Fe concentrations are summarized in Table 4. The significant Fe concentrations detected in our fibers, and especially in A1550, could be the reason (in addition to the optical scattering) for the high transmission losses. In comparison with the loss level of the fibers produced by the state-of-the-art methods, the measured transmission losses of our fibers are higher than the loss level that can be achieved in for example, MCVD, sol-gel, and powder sinter technology, where losses in the range of 0.02–0.05 dB/m can be achieved at 1200 nm [51,52]. However, due to significant Fe concentration in our fibers which could lead to high absorption at 1200 nm, transmission loss measurements at 1200 nm are in progress in order to have a direct comparison with the other state-of-the-art methods.
Table 4.
Fe concentrations in the fibers derived from the sol-gel based granulated silica method.
3.4. Fluorescence Lifetime
One of the most important features of Yb is its associated long upper-level excited state lifetime that allows the storage of large energies in the excited state. The excited state lifetime of Yb ions can be as long as 2 ms [53]. However, the lifetime is strongly dependent on the host material; depending on this, several mechanisms can lead to the broadening of the spectral line-width of transitions which shortens the fluorescence lifetime of the Yb ions. The shortening of the excited state lifetime is a result of homogeneous broadening of the spectral line-width due to interactions between the Yb ions with the host lattice via phonons, and of inhomogeneous broadening due to site-to-site variation of the ligand field around the Yb ions [54].
In silica glass, the excited state lifetime is in the order of 1 ms. Nevertheless, additional unwanted mechanisms, such as energy transfer between Yb ions, can result in quenching of the overall intensity of the fluorescence [55]. These quenching processes can be apparent as a further reduction in the fluorescence lifetime of the excited Yb ions in silica [56]. Therefore, the measurement of the excited state lifetime is of high importance, as it indicates whether there is significant quenching of the excited Yb ions, which could consequently influence the laser performance of an Yb-doped fiber.
To measure the fluorescence lifetimes at the maximum Yb emission at 976 nm, short fiber pieces were excited with a pulsed diode laser (915 nm, 500 mW) with rectangular pulses of 100 ms and a trailing edge slope of less than 5 μs. The pump light was filtered out by using several long pass filters centered at 950 nm and the generated and transmitted fluorescence emission at 976 nm was detected using a photomultiplier with a large sensitive area. Fluorescence decay curves were measured and evaluated. The decay curves were described well by a single exponential fit as shown in Figure 8, and fluorescence lifetimes of around 0.88 ms were obtained for both compositions. The measured lifetimes of our fibers were comparable with the fluorescence lifetime of a commercial fiber (Nufern: LMA-YDF-25/250-VIII) (Nufern, East Granby, CT, USA), for which a lifetime of 0.91 ms was measured. This indicates that there is no significant quenching in the overall fluorescence intensity of Yb due to clustering. The lifetime results are summarized in Table 5.
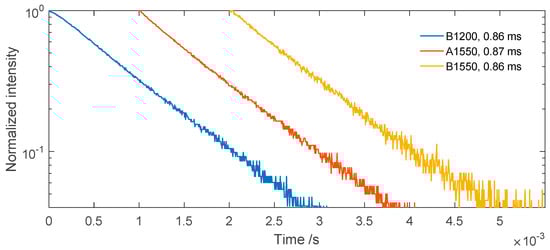
Figure 8.
Fluorescence lifetime decays of fibers derived from the sol-gel granulated silica method (log scale). The fluorescence decays of the fibers are separated by 1 ms for clarity.
Table 5.
Fluorescence lifetime of fibers derived from the sol-gel granulated silica method.
3.5. Laser Properties
Due to its better optical properties, namely the lowest transmission loss, the B1200 fiber was characterized with a continuous-wave (CW) free-space laser setup. The fiber features a core NA of 0.073 and was coated with low-index coating, resulting in a double cladding fiber with an inner-cladding NA of 0.48. For pumping the Yb-doped fiber, we used cladding-pumping, which relaxes the requirements on pump beam quality and launch alignment. Another reason for the use of cladding-pumping is to allow a much higher incident pump power than that which could be tolerated by the core alone, for damage reasons.
For the cladding-pumping configuration, the absorption per unit length of pump light travelling in the inner cladding, without further measures, can be estimated by a factor approaching the ratio of the areas of the inner cladding and the core, compared to direct core-pumping. However, this reduced absorption per unit length can be simply compensated by using a combination of longer fiber length and a pump wavelength where there is strong pump absorption. In Yb-doped silica fiber, the highest peak absorption occurs at 976 nm.
The experimental setup is shown in Figure 9. We used a forward pumping scheme with a fiber-pigtailed LD with a silica fiber (NA 0.22) operating at 976 nm with output power up to 15 W. The yellow and red arrows in the experimental setup represent the pump beam and the signal beam, respectively. The pump beam was coupled into the double-clad Yb-doped fiber using collimating and a focusing lenses, through a dichroic mirror () with high transmission (HT) at the pump wavelength at 976 nm and high reflection (HR) at the signal wavelength at around 1030 nm. On the output arm of the laser cavity, a feedback was provided by the Fresnel reflection from the cleaved fiber end.
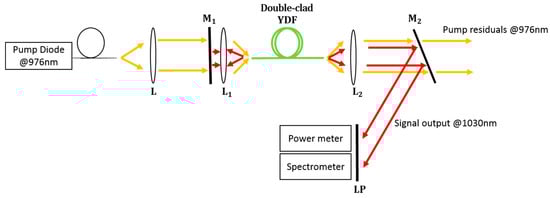
Figure 9.
Yb-doped fiber (YDF) free-space laser arrangement, with fiber-pigtailed pump diode source, collimating and coupling lenses (L, L1, and L2), in-coupling dichroic mirror (), dichroic mirror (), and a set of long pass filters centered at 1000 nm.
The output signal from the Yb-doped fiber was separated from the pump beam using another dichroic mirror (). Additional long pass filters centered at 1000 nm were used to make sure that no residual pump wavelength is in the signal beam. Finally, the spectrum of the laser output signal was measured by an Ocean Optics USB4000 spectrometer (Ocean Optics, Dunedin, FL, USA). The laser output spectrum of the fiber is shown in Figure 10.
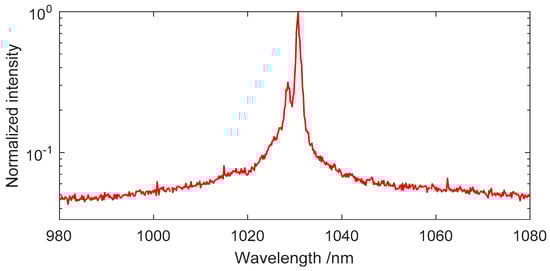
Figure 10.
Laser output spectrum of B1200 fiber derived from the sol-gel granulated silica method, with an emission peak at around 1031 nm (log scale).
By cladding-pumping at 976 nm in 2.13 m of fiber length of fiber B1200, an absorbed pump power of 55% (including losses) was obtained. This gives an absorption coefficient of 1.63 dB/m. Considering the Yb concentration in the fiber and the overlap factor between the pumped and doped area (cladding pumped), the absorption cross section was estimated to be around , which is in good agreement with the absorption cross section of other Yb-doped alumino-phospho-silicate glasses found in literature [57,58]. With respect to the absorbed pump power in 2.13 m of fiber length, a slope efficiency of 67% was achieved for fiber B1200. The laser output power at the signal wavelength versus the absorbed pump power is shown in Figure 11.
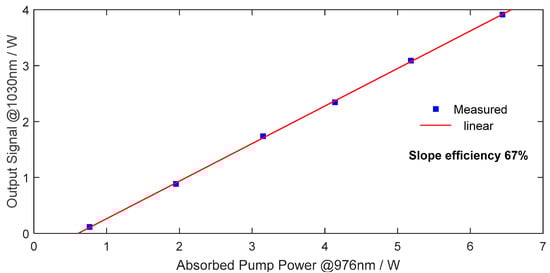
Figure 11.
Laser output power at 1031 nm versus absorbed pump power at 976 nm of fiber B1200.
4. Discussion
Two Yb-doped silica glass compositions with fixed Al to P concentration ratio (Al/P = 0. 82) and varying absolute concentration with respect to 0.3 at.% of Yb concentration were prepared by the sol-gel based granulated silica method. The compositions were drawn into fibers, whose optical characteristics were investigated.
As mentioned in the introduction, the incorporation of co-dopants like Al and P can improve the solubility of Yb and RE ions in general in silica glass, by forming a solvation shell around the RE ions that can be merged and dissolved in the silica network. To support this, the atomic distribution of the dopant (Yb) and co-dopants (Al and P) was observed using high-resolution atomic imaging and chemical analysis (Figure 4 and Figure 5). The elemental mappings obtained and their overlaps support this model, as they show the similar preferable localization of Al, P and Yb through the microstructure (Figure 5a,d,g–i). This is in very good agreement with Arai’s suggestion [10]. In addition, the EDX spectra comparing the compositions of cluster-containing and cluster-free zones (Figure 5b,c) confirm the similar localization of Al, P, and Yb. These nano-scale clusters of Yb, Al and P are supposed to be one of the major causes of the optical loss in the manufactured fibers.
The influence of variation in the co-dopant concentration with respect to Yb on the optical properties of the fibers was also investigated. For the fiber B1550, which has a lower excess of P concentration with respect to Al (P—Al = 1 at.%), we observed a decrease in the refractive index compared to the fiber A1550 having P—Al = 2 at.%. This is due to there being a better compensation of the refractive index change arising from the Al by the P, consistent with Bubnov’s study on the influence of Al and P on the optical properties of silica fibers [46].
The transmission losses of the fibers were measured at 630 nm using a cutback method. A large loss increase is observed in the fiber containing a higher excess P concentration. Similar effects have been also observed in [59,60], where an additional loss component that extends from the visible to the near infrared region was observed for the compositions that contain excess in P concentration with respect to Al, and it disappears as Al exceeds P concentration. Bubnov in [45,46] suggests that this increase in the losses is not due to the intrinsic properties of the -- system containing excess in P, but its due to Fe impurities. In silica glass, Fe can be present in the form of and . The ion leads to strong absorption at wavelengths lower than 400 nm [46]. . in silica glass is characterized by a broad absorption band around 1200 nm, very similar to the one observed in -- fibers containing an excess of in [45,46,59,60,61]. The valence of Fe is dependent on many factors, one of them being the fiber composition [46]. Gambling et al. [62] pointed out that Fe impurities in phosphosilicate glasses were particularly undesirable because they had a valence of 2+. Therefore, having an excess in P could enhance the formation of that leads to a broad absorption band around 1200 nm. To test whether Bubnov’s study supports the trend observed in our samples [46], the impurity concentration of Fe was measured by the means of LA-ICP-MS. Significant Fe concentration ranges from 9 to 18 ppm was found in both compositions, and is already contained within the precursors (i.e., not introduced due to any powder post-processing step). While this supports Bubbnov’s suggestion, further measurements and investigations are needed for confirmation.
Further improvement in the transmission properties were obtained when the temperature of the heat treatment of the powder derived from the sol-gel was reduced from 1550 °C to 1200 °C. This is most probably due to the growth of crystals (e.g., cristobalite for ) at 1550 °C which results in higher scattering losses.
The fluorescence lifetime of the upper-level excited state of Yb has been measured for the two compositions. The similar behavior in the fluorescence lifetime for the two compositions shows that the atomic distribution of the Yb dopant is not significantly influenced by the variation of a fixed Al to P concentration ratio with respect to Yb concentration, as long as the Al to Yb and/or P to Yb concentration ratio is greater than 10 and 15, respectively.
Finally, the laser characteristics of the B1200 fiber were measured. Using cladding-pumping at 976 nm in 2.13 m of fiber length, 55% of absorbed pump power at 976 nm and a slope efficiency of 67% with respect to the absorbed pump power at 1031 nm were achieved. The limited slope efficiency could be a result of the high transmission losses in the fiber due to impurities, in combination with non-radiative transitions that occur due to the Yb nano-clusters shown in the STEM-HAADF images.
5. Conclusions and Outlook
We have shown the advantages of the sol-gel based granulated silica method regarding the flexibility and simplicity of incorporating dopant and co-dopants at room temperature, by preparing Yb-doped, Al and P co-doped silica fibers.
The dependence of the fiber properties on the Al and P concentrations, as well as on the powder heat treatment condition, have been studied. With the results presented here and the previous investigation reported in [43], first comparisons can be made and conclusions drawn concerning the behavior of Yb in the glass host -- with different Al and P concentrations. Improved Yb solubility, which leads to a longer excited state lifetime and better laser characteristics, have been obtained for compositions that contain a slight excess in P concentration with respect to Al [43]. However, as the excess in P concentration increases, higher transmission losses were observed. The reasons behind this increase in the transmission losses is not clear yet, but one valid assumption could be due to impurities in the samples. Additional losses due to large scattering centers along the fiber were present in the composition that was heat treated at 1550 °C. By lowering the temperature of the heat treatment to 1200 °C, less scattering centers were observed. These components are featured in B1200 fiber with composition of 0.3 at.% Yb, 4.5 at.% Al and 5.5 at.% P, and heat treated at 1200 °C. When pumping this fiber with a LD at 976 nm, a slope efficiency of 67% at around 1031 nm was achieved.
Finally, additional work is currently going on in order to further improve the distribution of the dopant and co-dopants in our fibers. This would prevent the formation of the nano-clusters, in turn reducing the probability of the non-radiative transitions, and thus improving the laser slope efficiency. In addition, further measures are to be taken in order to reduce the transmission losses in our fibers, such as reducing and eliminating the impurities that we have detected in our samples (namely the iron), by using high purity starting materials.
Author Contributions
Conceptualization, A.E. and V.R.; Methodology, A.E. and V.R.; Validation, A.E., S.P. and V.R.; Formal Analysis, A.E., H.N. and D.T.L.A.; Investigation, A.E., S.P., M.H., H.N. and D.T.L.A.; Resources, A.E. and V.R.; Data Curation, A.E. and S.P.; Writing-Original Draft Preparation, A.E.; Writing-Review and Editing, A.E., S.P., M.H., H.N., D.T.L.A. and V.R.; Visualization, A.E., M.H. and S.P.; Supervision, S.P. and V.R.; Project Administration, V.R.; Funding Acquisition, V.R.
Funding
This research was partially funded by Swiss Commission for Technology and Innovation CTI under project numbers 18613.1 and 17133.1.
Acknowledgments
We are very thankful to J. Scheuner, Ch. Bacher and D. Lopez for active help in powder post-processing and in fiber drawing. Many thanks to T. Feurer and H. Kim for discussions, and to D. Kummer, S. Berger, A. Ruefenacht, and G. Karametaxas for their help in sol-gel material production. We also thank T. Petke for providing the LA-ICP mass spectrometer.
Conflicts of Interest
The authors declare no conflict of interest.
References
- Petit, V.; Tumminelli, R.P.; Minelly, J.D.; Khitrov, V. Extremely Low NA Yb Doped Preforms (<0.03) Fabricated by MCVD; Ballato, J., Ed.; SPIE: Bellingham, WA, USA, 2016; p. 97282R. [Google Scholar]
- Beier, F.; Hupel, C.; Kuhn, S.; Hein, S.; Nold, J.; Proske, F.; Sattler, B.; Liem, A.; Jauregui, C.; Limpert, J.; et al. Single mode 43 kW output power from a diode-pumped Yb-doped fiber amplifier. Opt. Express 2017, 25, 14892–14899. [Google Scholar] [CrossRef] [PubMed]
- Xu, W.; Lin, Z.; Wang, M.; Feng, S.; Zhang, L.; Zhou, Q.; Chen, D.; Zhang, L.; Wang, S.; Yu, C.; et al. 50 μm core diameter Yb3+/Al3+/F− codoped silica fiber with M2 <11 beam quality. Opt. Lett. 2016, 41, 504–507. [Google Scholar] [CrossRef] [PubMed]
- He, W.; Leich, M.; Grimm, S.; Kobelke, J.; Zhu, Y.; Bartelt, H.; Jäger, M. Very large mode area ytterbium fiber amplifier with aluminum-doped pump cladding made by powder sinter technology. Laser Phys. Lett. 2015, 12. [Google Scholar] [CrossRef]
- Li, W.; Zhou, Q.; Zhang, L.; Wang, S.; Wang, M.; Yu, C.; Feng, S.; Chen, D.; Hu, L. Watt-level Yb-doped silica glass fiber laser with a core made by sol-gel method. Chin. Opt. Lett. 2013, 11, 091601–91603. [Google Scholar] [CrossRef]
- Wang, S.; Li, Z.; Yu, C.; Wang, M.; Feng, S.; Zhou, Q.; Chen, D.; Hu, L. Fabrication and laser behaviors of Yb3+doped silica large mode area photonic crystal fiber prepared by sol-gel method. Opt. Mater. 2013, 35, 1752–1755. [Google Scholar] [CrossRef]
- Moghaddam, M.R.A.; Harun, S.W.; Ahmad, H. Comparison between Analytical Solution and Experimental Setup of a Short Long Ytterbium Doped Fiber Laser. Opt. Photonics J. 2012, 2, 65–72. [Google Scholar] [CrossRef]
- Liu, S.; Li, H.; Tang, Y.; Hu, L. Fabrication and spectroscopic properties of Yb3+-doped silica glasses using the sol-gel method. Chin. Opt. Lett. 2012, 10, 8–11. [Google Scholar] [CrossRef]
- Wang, S.; Feng, S.; Wang, M.; Yu, C.; Zhou, Q.; Li, H.; Tang, Y.; Chen, D.; Hu, L. Optical and laser properties of Yb3+-doped Al2O3–P2O5–SiO2 large-mode-area photonic crystal fiber prepared by the sol–gel method. Laser Phys. Lett. 2013, 10, 115802. [Google Scholar] [CrossRef]
- Arai, K.; Namikawa, H.; Kumata, K.; Honda, T.; Ishii, Y.; Handa, T. Aluminum or phosphorus co-doping effects on the fluorescence and structural properties of neodymium-doped silica glass. J. Appl. Phys. 1986, 59, 3430–3436. [Google Scholar] [CrossRef]
- Sen, S.; Rakhmatullin, R.; Gubaidullin, R.; Pöppl, A. Direct spectroscopic observation of the atomic-scale mechanisms of clustering and homogenization of rare-earth dopant ions in vitreous silica. Phys. Rev. B 2006, 74, 2–5. [Google Scholar] [CrossRef]
- Unger, S.; Lindner, F.; Aichele, C.; Leich, M.; Schwuchow, A.; Kobelke, J.; Dellith, J.; Schuster, K.; Bartelt, H. A highly efficient Yb-doped silica laser fiber prepared by gas phase doping technology. Laser Phys. 2014, 24. [Google Scholar] [CrossRef]
- Gambling, W.A. The rise and rise of optical fibers. IEEE J. Sel. Top. Quantum Electron. 2000, 6, 1084–1093. [Google Scholar] [CrossRef]
- Warren, B.E.; Pincus, A.G. Atomic Consideration of Immiscibility in Glass Systems. J. Am. Ceram. Soc. 1940, 23, 301–304. [Google Scholar] [CrossRef]
- Glasser, F.P.; Warshaw, I.; Roy, R. Liquid immiscibility in silicate systems. Phys. Chem. Glasses 1960, 1, 39. [Google Scholar]
- Sen, S. Atomic environment of high-field strength Nd and Al cations as dopants and major components in silicate glasses: A Nd LIII-edge and Al K-edge X-ray absorption spectroscopic study. J. Non-Cryst. Solids 2000, 261, 226–236. [Google Scholar] [CrossRef]
- Savel, E.A.; Krivovichev, A.V.; Golant, K.M. Clustering of Yb in silica-based glasses synthesized by SPCVD. Opt. Mater. 2016, 62, 518–526. [Google Scholar] [CrossRef]
- Arai, K.; Yamasaki, S.; Isoya, J.; Namikawa, H. Electron-spin-echo envelope-modulation study of the distance between Nd3+ ions and Al3+ ions in the co-doped SiO2 glasses. J. Non-Cryst. Solids 1996, 196, 216–220. [Google Scholar] [CrossRef]
- Lægsgaard, J. Dissolution of rare-earth clusters in SiO2 by Al codoping: A microscopic model. Phys. Rev. B 2002, 65, 174114. [Google Scholar] [CrossRef]
- Funabiki, F.; Kamiya, T.; Hosono, H. Doping effects in amorphous oxides. J. Ceram. Soc. Jpn. 2012, 120, 447–457. [Google Scholar] [CrossRef]
- Canevali, C.; Mattoni, M.; Morazzoni, F.; Scotti, R.; Casu, M.; Musinu, A.; Krsmanovic, R.; Polizzi, S.; Speghini, A.; Bettinelli, M. Stability of Luminescent Trivalent Cerium in Silica Host Glasses Modified by Boron and Phosphorus. J. Am. Chem. Soc. 2005, 127, 14681–14691. [Google Scholar] [CrossRef] [PubMed]
- Nagel, S.R.; MacChesney, J.B.; Walker, K.L. An Overview of the Modified Chemical Vapor Deposition (MCVD) Process and Performance. IEEE Trans. Microw. Theory Tech. 1982, 30, 305–322. [Google Scholar] [CrossRef]
- Poole, S.B.; Payne, D.N.; Mears, R.J.; Fermann, M.E.; Laming, R.I. Fabrication and Characterization of Low-Loss Optical Fibers Containing Rare-Earth Ions. J. Lightwave Technol. 1986, 4, 870–876. [Google Scholar] [CrossRef]
- Langner, A.; Schötz, G.; Such, M.; Kayser, T.; Reichel, V.; Grimm, S.; Kirchhof, J.; Krause, V.; Rehmann, G. A new material for high power laser fibers. Proc. SPIE 2008, 6873, 687311. [Google Scholar] [CrossRef]
- Wang, S.; Lou, F.; Wang, M.; Yu, C.; Feng, S.; Zhou, Q.; Chen, D.; Hu, L. Characteristics and Laser Performance of Yb3+-Doped Silica Large Mode Area Fibers Prepared by Sol–Gel Method. Fibers 2013, 1, 93–100. [Google Scholar] [CrossRef]
- Montiel i Ponsoda, J.J.; Norin, L.; Ye, C.; Bosund, M.; Söderlund, M.J.; Tervonen, A.; Honkanen, S. Ytterbium-doped fibers fabricated with atomic layer deposition method. Opt. Express 2012, 20, 25085. [Google Scholar] [CrossRef] [PubMed]
- Pilz, S.; Najafi, H.; Ryser, M.; Romano, V. Granulated Silica Method for the Fiber Preform Production. Fibers 2017, 5, 24. [Google Scholar] [CrossRef]
- MacChesney, J.B.; Johnson, D.W., Jr.; Bhandarkar, S.; Bohrer, M.P.; Fleming, J.W.; Monberg, E.M.; Trevor, D.J. Optical fibers by a hybrid process using sol–gel silica overcladding tubes. J. Non-Cryst. Solids 1998, 226, 232–238. [Google Scholar] [CrossRef]
- Locher, M.; Romano, V.; Weber, H.P. Rare-earth doped sol-gel materials for optical waveguides. Opt. Lasers Eng. 2005, 43, 341–347. [Google Scholar] [CrossRef]
- Romano, V.; Pilz, S.; Etissa, D. Sol-gel-based doped granulated silica for the rapid production of optical fibers. Int. J. Mod. Phys. B 2014, 28, 1442010. [Google Scholar] [CrossRef]
- Auguste, J.L.; Humbert, G.; Leparmentier, S.; Kudinova, M.; Martin, P.O.; Delaizir, G.; Schuster, K.; Litzkendorf, D. Modified powder-in-tube technique based on the consolidation processing of powder materials for fabricating specialty optical fibers. Materials 2014, 7, 6045–6063. [Google Scholar] [CrossRef] [PubMed]
- Ballato, J.; Snitzer, E. Fabrication of fibers with high rare-earth concentrations for Faraday isolator applications. Appl. Opt. 1995, 34, 6848. [Google Scholar] [CrossRef] [PubMed]
- Dauliat, R.; Gaponov, D.; Jamier, R.; Schuster, K.; Grimm, S.; Valette, S.; Benoit, A.; Salin, F.; Roy, P. Powder technology and innovative fiber design enabling a new generation of high-power single-mode fiber laser sources. Adv. Laser Technol. 2012. [Google Scholar] [CrossRef]
- Renner-Erny, R.; Di Labio, L.; Lüthy, W. A novel technique for active fibre production. Opt. Mater. 2007, 29, 919–922. [Google Scholar] [CrossRef]
- Neff, M.; Romano, V.; Lüthy, W. Metal-doped fibres for broadband emission: Fabrication with granulated oxides. Opt. Mater. 2008, 31, 247–251. [Google Scholar] [CrossRef]
- Wilhelm, B.; Romano, V.; Weber, H.P. Fluorescence lifetime enhancement of Nd3+-doped sol-gel glasses by Al-codoping and CO2-laser processing. J. Non-Cryst. Solids 2003, 328, 192–198. [Google Scholar] [CrossRef]
- Velmiskin, V.V.; Egorova, O.N.; Mishkin, V.; Nishchev, K.; Semjonov, S.L. Active material for fiber core made by powder-in-tube method: Subsequent homogenization by means of stack-and-draw technique. Proc. SPIE 2012, 8426. [Google Scholar] [CrossRef]
- Pilz, S.; Najafi, H.; El Sayed, A.; Boas, J.; Kummer, D.; Scheuner, J.; Etissa, D.; Ryser, M.; Raisin, P.; Berger, S.; et al. Progress in the Fabrication of Optical Fibers by the Sol-Gel-Based Granulated Silica Method. In Proceedings of the SPIE—The International Society for Optical Engineering; Kalli, K., Mendez, A., Eds.; SPIE: Brussels, Belgium, 2016; Volume 9886, p. 988614. [Google Scholar]
- Scheuner, J.; Heidt, A.M.; Pilz, S.; Raisin, P.; El Sayed, A.; Najafi, H.; Ryser, M.; Feurer, T.; Romano, V.; Bacher, C.; et al. Advances in optical fibers fabricated with granulated silica. In Proceedings of the 2017 Optical Fiber Communications Conference and Exhibition (OFC), Los Angeles, CA, USA, 19–23 March 2017. [Google Scholar]
- Pedrazza, U.; Romano, V.; Lüthy, W. Yb3+:Al3+: sol-gel silica glass fiber laser. Opt. Mater. 2007, 29, 905–907. [Google Scholar] [CrossRef]
- Bacher, C.; Scheuner, J.; Pilz, S.; El Sayed, A.; Ryser, M.; Heidt, A.; Romano, V. Spectroscopy of a heated Yb-doped optical fiber with high aluminum content. In Proceedings of the SPIE—The International Society for Optical Engineering; Kalli, K., Kanka, J., Mendez, A., Peterka, P., Eds.; SPIE: Prague, Czech Republic, 2017; Volume 10232, p. 102320J. [Google Scholar]
- Tomozawa, M.; Kim, D.-L.; Lou, V. Preparation of high purity, low water content fused silica glass. J. Non-Cryst. Solids 2001, 296, 102–106. [Google Scholar] [CrossRef]
- El Sayed, A.F.; Pilz, S.; Scheuner, J.; Najafi, H.; Feurer, T.; Romano, V. Properties of Yb doped silica fibers with different Al and P co-dopants concentrations produced by the Sol-Gel based granulated silica method. In Micro-Structured and Specialty Optical Fibres V; Bunge, C.-A., Kalli, K., Mendez, A., Eds.; SPIE: Strasbourg, France, 2018; Volume 1068105, p. 49. [Google Scholar]
- Mizoguchi, T.; Findlay, S.D.; Masuno, A.; Saito, Y.; Yamaguchi, K.; Inoue, H.; Ikuhara, Y. Atomic-Scale Identification of Individual Lanthanide Dopants in Optical Glass Fiber. ACS Nano 2013, 7, 5058–5063. [Google Scholar] [CrossRef] [PubMed]
- Bubnov, M.M.; Vechkanov, V.N.; Gur’yanov, A.N.; Zotov, K.V.; Lipatov, D.S.; Likhachev, M.E.; Yashkov, M.V. Fabrication and optical properties of fibers with an Al2O3-P2O5-SiO2 glass core. Inorg. Mater. 2009, 45, 444–449. [Google Scholar] [CrossRef]
- Bubnov, M.M.; Gur’yanov, A.N.; Zotov, K.V.; Iskhakova, L.D.; Lavrishchev, S.V.; Lipatov, D.S.; Likhachev, M.E.; Rybaltovsky, A.A.; Khopin, V.F.; Yashkov, M.V.; et al. Optical properties of fibres with aluminophosphosilicate glass cores. Quantum Electron. 2009, 39, 857–862. [Google Scholar] [CrossRef]
- Raine, K.W.; Baines, J.G.N.; Putland, D.E. Refractive index profiling-state of the art. J. Light. Technol. 1989, 7, 1162–1169. [Google Scholar] [CrossRef]
- Young, M. Optical fiber index profiles by the refracted-ray method (refracted near-field scanning). Appl. Opt. 1981, 20, 3415–3422. [Google Scholar] [CrossRef] [PubMed]
- El Sayed, A.; Pilz, S.; Ryser, M.; Romano, V. Two-Dimensional Refractive Index Profiling of Optical Fibers by Modified Refractive Near-Field Technique. In Proceedings of the SPIE—The International Society for Optical Engineering; Kalli, K., Mendez, A., Eds.; SPIE: San Francisco, CA, USA, 2016; Volume 9744, p. 98861N. [Google Scholar]
- Raisin, P.; Scheuner, J.; Romano, V.; Ryser, M. High-precision confocal reflection measurement for two dimensional refractive index mapping of optical fibers. In Proceedings of the SPIE—The International Society for Optical Engineering; Kalli, K., Kanka, J., Mendez, A., Eds.; Kalli, K., Kanka, J., Mendez, A., Eds.; SPIE: Prague, Czech Republic, 2015; Volume 9507, p. 95070O. [Google Scholar]
- Wang, S.; Xu, W.; Wang, F.; Lou, F.; Zhang, L.; Zhou, Q.; Chen, D.; Feng, S.; Wang, M.; Yu, C.; et al. Yb3+-doped silica glass rod with high optical quality and low optical attenuation prepared by modified sol-gel technology for large mode area fiber. Opt. Mater. Express 2017, 7, 2012–2022. [Google Scholar] [CrossRef]
- Leich, M.; Just, F.; Langner, A.; Such, M.; Schötz, G.; Eschrich, T.; Grimm, S. Highly efficient Yb-doped silica fibers prepared by powder sinter technology. Opt. Lett. 2011, 36, 1557–1559. [Google Scholar] [CrossRef] [PubMed]
- Krishnaiah, K.V.; Kumar, K.U.; Agarwal, V.; Murali, C.G.; Chaurasia, S.; Dhareshwar, L.J.; Jayasankar, C.K.; Lavin, V. Fluorescence and Spectroscopic Properties of Yb3+-Doped Phosphate Glasses. Phys. Procedia 2012, 29, 109–113. [Google Scholar] [CrossRef]
- Dong, L.; Samson, B. Optical Fibers: Materials and Fabrication. In Fiber Lasers; CRC Press and Taylor & Francis Group: Boca Raton, FL, USA, 2016; pp. 61–82. [Google Scholar]
- Paschotta, R.; Nilsson, J.; Barber, P.R.; Caplen, J.E.; Tropper, A.C.; Hanna, D.C. Lifetime quenching in Yb-doped fibres. Opt. Commun. 1997, 136, 375–378. [Google Scholar] [CrossRef]
- Wang, X.; Zhang, R.; Ren, J.; Vezin, H.; Fan, S.; Yu, C.; Chen, D.; Wang, S.; Hu, L. Mechanism of cluster dissolution of Yb-doped high-silica lanthanum aluminosilicate glass: Investigation by spectroscopic and structural characterization. J. Alloys Compd. 2017, 695, 2339–2346. [Google Scholar] [CrossRef]
- Jetschke, S.; Unger, S.; Schwuchow, A.; Leich, M.; Kirchhof, J. Efficient Yb laser fibers with low photodarkening by optimization of the core composition. Opt. Express 2008, 16, 15540. [Google Scholar] [CrossRef] [PubMed]
- Melkoumov, M.A.; Bufetov, I.A.; Bubnov, M.M.; Kravtsov, K.S.; Semjonov, S.L.; Shubin, A.V.; Dianov, E.M. Ytterbium Lasers Based on P2O5- and Al2O3-doped Fibers. In Proceedings of the Europeen Conference on Oprical Communication, Stockholm, Sweden, 5–9 September 2004. [Google Scholar]
- Unger, S.; Schwuchow, A.; Jetschke, S.; Reichel, V.; Leich, M.; Scheffel, A.; Kirchhof, J. Influence of aluminum-phosphorus codoping on optical properties of ytterbium-doped laser fibers. Proc. SPIE 2009, 7212, 72121B. [Google Scholar] [CrossRef]
- Unger, S.; Schwuchow, A.; Dellith, J.; Kirchhof, J. Codoped materials for high power fiber lasers: Diffusion behaviour and optical properties. Proc. SPIE 2007, 6469, 646913. [Google Scholar] [CrossRef]
- Unger, S.; Schwuchow, A.; Jetschke, S.; Reichel, V.; Scheffel, A.; Kirchhof, J. Optical properties of Yb-doped laser fibers in dependence on codopants and preparation conditions. Proc. SPIE 2008, 6890, 689016. [Google Scholar] [CrossRef]
- Gambling, W.A.; Payne, D.N.; Hammond, C.R.; Norman, S.R. Optical fibres based on phosphosilicate glass. Proc. Inst. Electr. Eng. 1976, 123, 570–576. [Google Scholar] [CrossRef]
© 2018 by the authors. Licensee MDPI, Basel, Switzerland. This article is an open access article distributed under the terms and conditions of the Creative Commons Attribution (CC BY) license (http://creativecommons.org/licenses/by/4.0/).