Article

Production of Nanocellulose from Pineapple Leaf Fibers via High-Shear Homogenization and Ultrasonication

1
Department of Mechanical Engineering, Andalas University, Padang 25163, Indonesia
2
Department of Agriculture Technology, Andalas University, Padang 25163, Indonesia
3
Department of Chemistry, Andalas University, Padang 25163, Indonesia
*
Author to whom correspondence should be addressed.
Fibers 2018, 6(2), 28; https://doi.org/10.3390/fib6020028
Submission received: 9 April 2018 / Revised: 26 April 2018 / Accepted: 1 May 2018 / Published: 3 May 2018
(This article belongs to the Special Issue Biopolymer Nanofiber)

Abstract

:
In this study, the isolation and characterization of nanocellulose from pineapple leaf fibers (PLF) were carried out. Chemical pretreatment included pulping, bleaching, and acid hydrolysis to remove lignin, hemicellulose, and extractive substances were conducted. This was followed by high-shear homogenization and ultrasonication to produce nanocellulose. Morphological changes to the PLF due to treatment were investigated using scanning electron microscopy (SEM). This showed that the PLF had a diameter of 1–10 µm after high-shear homogenizing. Transmission electron microscopy (TEM) indicated that the nanofibers after ultrasonication for 60 min showed 40–70 nm diameters. Particle size analysis (PSA) indicates that the fibers had an average diameter of 68 nm. Crystallinity index was determined by X-ray diffraction (XRD) and had the highest value after acid hydrolysis at 83% but after 60 min ultrasonication, this decreased to 62%. Meanwhile, Fourier transform infrared (FTIR) spectroscopy showed there was no chemical structure change after acid hydrolysis. The most significant finding from thermal gravimetric analysis (TGA) is that the higher degradation temperature of nanofibers indicates superior thermal stability over untreated fiber. These results indicate that PLF waste could become a viable source of commercially valuable nanocellulose.

1. Introduction

Over the last few decades, research into the development of biodegradable materials from renewable sources has led to an increasing interest in biocomposites manufactured from various natural fibers. These natural fibers are abundant and renewable, and their utilization can minimize negative environmental effects and are able to generate profits [1,2,3].
Natural fibers consist of lignin, cellulose, and hemicelluloses. Lignin and hemicelluloses are amorphous in structure while cellulose is semicrystalline and thus, differs in its physical and mechanical properties [4]. Cellulose is used to manufacture textiles and paper. It is a long linear glucose polymer linked by β-1,4 glycosidic bonds [5]. Cellulose has relatively high strength, high stiffness, low density and good thermal stability [2]. Therefore, it is a promising candidate for reinforcing biocomposites.
To obtain pure cellulose, the raw material is treated with alkali and bleached [3,6,7]. This chemical treatment breaks intermolecular and intramolecular hydrogen bonding between the hydroxyl groups of cellulose and hemicellulose and can increase the hydrophilicity of fibers [2,3]. However, alkali treatment and bleaching do not significantly increase the crystallinity of cellulose fiber. Some studies suggest that subsequent acid hydrolysis can increase crystallinity and reduce the diameter of fibers [8,9].
Several abundantly available renewable natural fiber sources which contain cellulose have been investigated. These include water hyacinth [10,11,12], oil palm empty fruit bunch (OPEFB) [13], banana (pseudo stem), jute (stem) and pineapple leaf fiber [2], arecanut husk fiber [14], kenaf bast (Hibiscus cannabinus) [15], coconut husk [16], Helicteres isora plant [17] and bacterial cellulose [18,19,20].
Pineapple cultivation occurs throughout the South East Asian region. The Philippines, Thailand, and Indonesia are three of the largest producers of this crop globally. In 2014, in Indonesia alone, 1.8 million tons of fruit were harvested [21]. Old leaves must also be removed regularly. The weight of these leaves is about 7% that of the fruit. Hence, in Indonesia, 126,000 tons of fiber-rich pineapple leaves are removed from the plants each year. PLF from these leaves are used for mulch but much of this resource is yet to be used optimally. One possible way to increase the profitability of pineapple growing would be to use these discarded leaves commercially to produce nanofiber for biocomposite reinforcement.
PLF has a unique combination of properties that make it an ideal source for nanofiber production such as has high strength, stiffness and low density [1,3]. Its cellulose content is higher than that of OPEFB [22], water hyacinth and mengkuang (screw pine) leaves [23]. Cherian et al. reported that PLF has 81.27% cellulose, 12.31% hemicellulose, 3.46% lignin and 10.52% moisture content [9]. However, these values will depend on the variety and environmental factors where the plant is grown.
Nanofibers of cellulose are more transparent and thermally stable than microfibers [24,25]. They can be used to manufacture a range of products including flexible electronic film, coating for packaging, receptacles for drug delivery and optical digital storage media [14,26]. Various nanocellulose extraction methods have been explored; steam explosion along with mild chemical treatment [2], chemical-ultrasonic process [8], steam explosion alone [9,17], a chemo-mechanical process using acid hydrolysis and homogenized [14], wet blending [7], sulfuric acid hydrolysis [1,16,27,28], a mechanical technique involving refining, cryo-crushing, and high pressure homogenization [15], high pressure homogenization alone [29], and high-shear homogenization [30].
It has been shown that high-shear homogenization is a more environmentally friendly method for production of nanocellulose than chemical treatment and results in higher crystallinity, thermal stability, and transparency. Moreover, nanocellulose production via ultrasonication is a very effective way to depolymerize cellulose [8]. The method used in this study is new and uses both high-shear homogenization and ultrasonication. This has several advantages compared to preparation methods of PLF used in previous studies as it requires only two repeats of the bleaching and acid hydrolysis processes compared to the six-step bleaching and eight-step hydrolysis Cherian et al. used for PLF fiber [9]. This, in turn, minimized the use of expensive and potentially environmentally damaging chemicals. Furthermore, the crystallinity index of the PLF in this study is higher and the size of the nanofibers is comparable.
The characteristics of PLF before and after treatments were observed by using Fourier Transform Infrared (FTIR), X-ray Diffraction (XRD), Thermal Gravimetric Analysis (TGA), Scanning Electron Microscopy (SEM), Particle Size Analysis (PSA) and Transmission Electron Microscopy (TEM).

2. Materials and Methods

2.1. Materials

PLF was collected from an agricultural plant in Subang, West Java, Indonesia. Analytical grade distilled water, acetic acid (CH3COOH), sodium hydroxide (NaOH), sodium chlorite (NaClO2), and hydrochloric acid (HCl) with were obtained from the Faculty of Agrotechnology, Andalas University, Padang, West Sumatra, Indonesia.

2.2. Preparation of Cellulose Fibers from Pineapple Leaf Fibers

The cellulose was isolated based on previously published techniques with certain modifications [14].
Pulping procedure. Two-hundred grams of dried PLF was cut into 15 mm lengths then cooked in a digester with 25% NaOH solution for 60 min at 150 °C and 9 bar. The ratio of distilled water to fibers used was 10:1. The fiber was washed with distilled water until pH 7 and dried in a drying oven at 60 °C.
Bleaching process. The fiber was broken up in a blender for 10 min and mixed with NaClO2: CH3COOH (4:1) at 60 °C and 600 rpm for 2 h. Then, it was soaked again in 5% NaOH solution at 50 °C for 4 h. The suspension of bleached fiber was washed to pH 7 before acid hydrolysis.
Acid hydrolysis. The suspension was hydrolyzed with 3.5 M HCl at 50 °C for 12 h then was washed until pH 7 followed by hydrolyzation, a second time with 7.5 M HCl at 50 °C overnight. It was washed until a neutral pH was achieved.

2.3. Preparation of Nanocellulose from Pineapple Leaf Fibers

High-shear homogenization. High-shear homogenization was performed to reduce the diameter size of the PLF in suspension. A WiseTis Homogenizer HG-15D DAIHAN Scientific Co., Ltd. from Gangwon-do, Korea was used. The diameter of the stator and rotor were 180 and 130 mm, respectively. A 5% suspension was dispersed in 100 mL of distilled water then homogenized at 12,000 rpm at room temperature for 10 min.
Ultrasonication. Ultrasonication was performed with an ultrasonic cell crusher Ningbo Yinzhou SJIA Lab Equipment Co., Ltd. (Ningbo, China) using 400 W. One-hundred milliliters of the suspension were sonicated for 30 and 60 min at 60 °C.

2.4. Chemical Composition of Pineapple Leaf Fibers

The chemical composition of PLF before and after chemical treatments was observed. Cellulose and lignin content were measured by using Technical Association of the Pulp and Paper Industry (TAPPI) Standard T 9M-54 and TAPPI Standard T 13M-54, respectively. The holocellulose content, a combination of cellulose and hemicellulose content, was measured according to American Standard Testing Materials (ASTM) 1104-56.

2.5. Characterization of Pineapple Leaf Fibers

2.5.1. X-ray Diffraction

All samples were dried in a drying oven at 60 °C before XRD was conducted to determine the index of crystallinity of PLF at each stage in the process (bleaching, acid hydrolysis, high-shear homogenizing and ultrasonication). XRD patterns of all samples were examined on a X’Pert PRO PANalytical instrument (Philips Analytical, Almelo, The Netherlands), using CuKα radiation (λ = 0.154), 40 kV operating voltage and 30 mA. Intensity at 2θ was recorded from 10 to 30°. The crystallinity index (CrI) was calculated by using the Segal method (Equation (1)).
CrI = [(I002−Iam)/I002] × 100%,
where I002 (2θ = 22.6°) and Iam (2θ = 18°) correspond to the crystalline and amorphous regions, respectively [31].

2.5.2. Fourier Transform Infrared

FTIR characterization was performed by using a Perkin-Elmer FTIR spectrometer Frontier instrument (PerkinElmer, Inc., Waltham, MA, USA) with wave numbers of 600–4000 cm−1. Before characterization, all samples were dried in an oven, drying at 50 °C until a constant weight was achieved.

2.5.3. Scanning Electron Microscopy

The surface morphology of the PLF fiber was investigated by using SEM. All samples were dried in dying oven until constant weight. The operation voltage during characterization was 10 kV.

2.5.4. Transmission Electron Microscopy

Five percent PLF cellulose was suspended in 100 mL distilled water. After that, it was ultrasonicated for 60 min to produce nanocellulose fibers. Its morphology was observed by using JEM-1400 Transmission Electron Microscopy (JEOL Ltd., Akishima, Tokyo, Japan) at 100 keV. The nanocellulose suspension was dropped onto a carbon film over a copper grid and then dried. The dried samples were directly observed via TEM at room temperature.

2.5.5. Thermal Gravimetric Analysis

Measurements of thermal stability of untreated and treated PLF were carried out by using DTG-60 SHIMADZU serial no. C30565000570 (Kyoto, Japan). The thermal analysis was done in a nitrogen atmosphere at a flow rate 50 mL/min. The heating rate was 20 °C/min.

2.5.6. Particle Size Analysis

The particle size distribution after 60 min ultrasonication was tested with a Malvern Zetasizer Nano ZS instrument (Malvern Instruments Limited, Worcestershire, UK). Samples of nanocellulose suspended in water were diluted and analyzed with a particle size analyzer using dynamic light scattering (DLS). Non Invasive Back Scattering technique was used with a 173° detector angle using a HeNe 4 mW laser (633 nm). Measurements were repeated 3 times for each sample.

3. Results

3.1. Main Composition of Pineapple Leaf Fibers before and after the Chemical Treatment

Table 1 shows the main chemical composition of PLF at each stage of chemical treatment. Raw PLF has the largest percentage of hemicellulose, lignin, and extractive substances. The bleaching process reduced the amount of lignin and hemicellulose from 13.8% to 10.2%. This is due to the breaking of hemicellulose-lignin bonds and some lignin was hydrolyzed.
Hydrolyzed PLF consists of 81.3% cellulose, a similar figure to that contained in more intensively chemically treated (five cycles of treatment) wood, but lower than that of bamboo, wheat straw and flax fiber [8].
After acid hydrolysis, fiber diameter size decreased with the cellulose content was 20% higher than in the untreated PLF. This was due to removal of the amorphous content of the fiber which increased the crystalline cellulose fraction. The increasing proportion of crystalline cellulose leads to increases in thermal stability. This result is supported by XRD and TGA results and previous work [8,15,32].

3.2. Physical of Pineapple Leaf Fibers at Different Treatment

The physical structure of PLF before and after treatments is shown in Figure 1. Figure 1a shows the raw fiber. It is a brownish color due to the lignin, hemicelluloses, and extractive substances content as reported by previous studies [27]. After bleaching, PLF became white as the lignin and hemicellulose were removed during the process (Figure 1b). The removal of lignin and hemicellulose is also evident in the XRD and chemical composition results. Acid hydrolysis and high-shear homogenization results in a white suspension (Figure 1c,d) which indicates the pure cellulose content.
Figure 1e shows the nanocellulose suspension after 60 min ultrasonication. The suspension was transparent due to the nano-sized fiber particles that are too small to reflect light. A similar phenomenon was observed in OPEFB nanofibers [16].

3.3. X-ray Diffraction

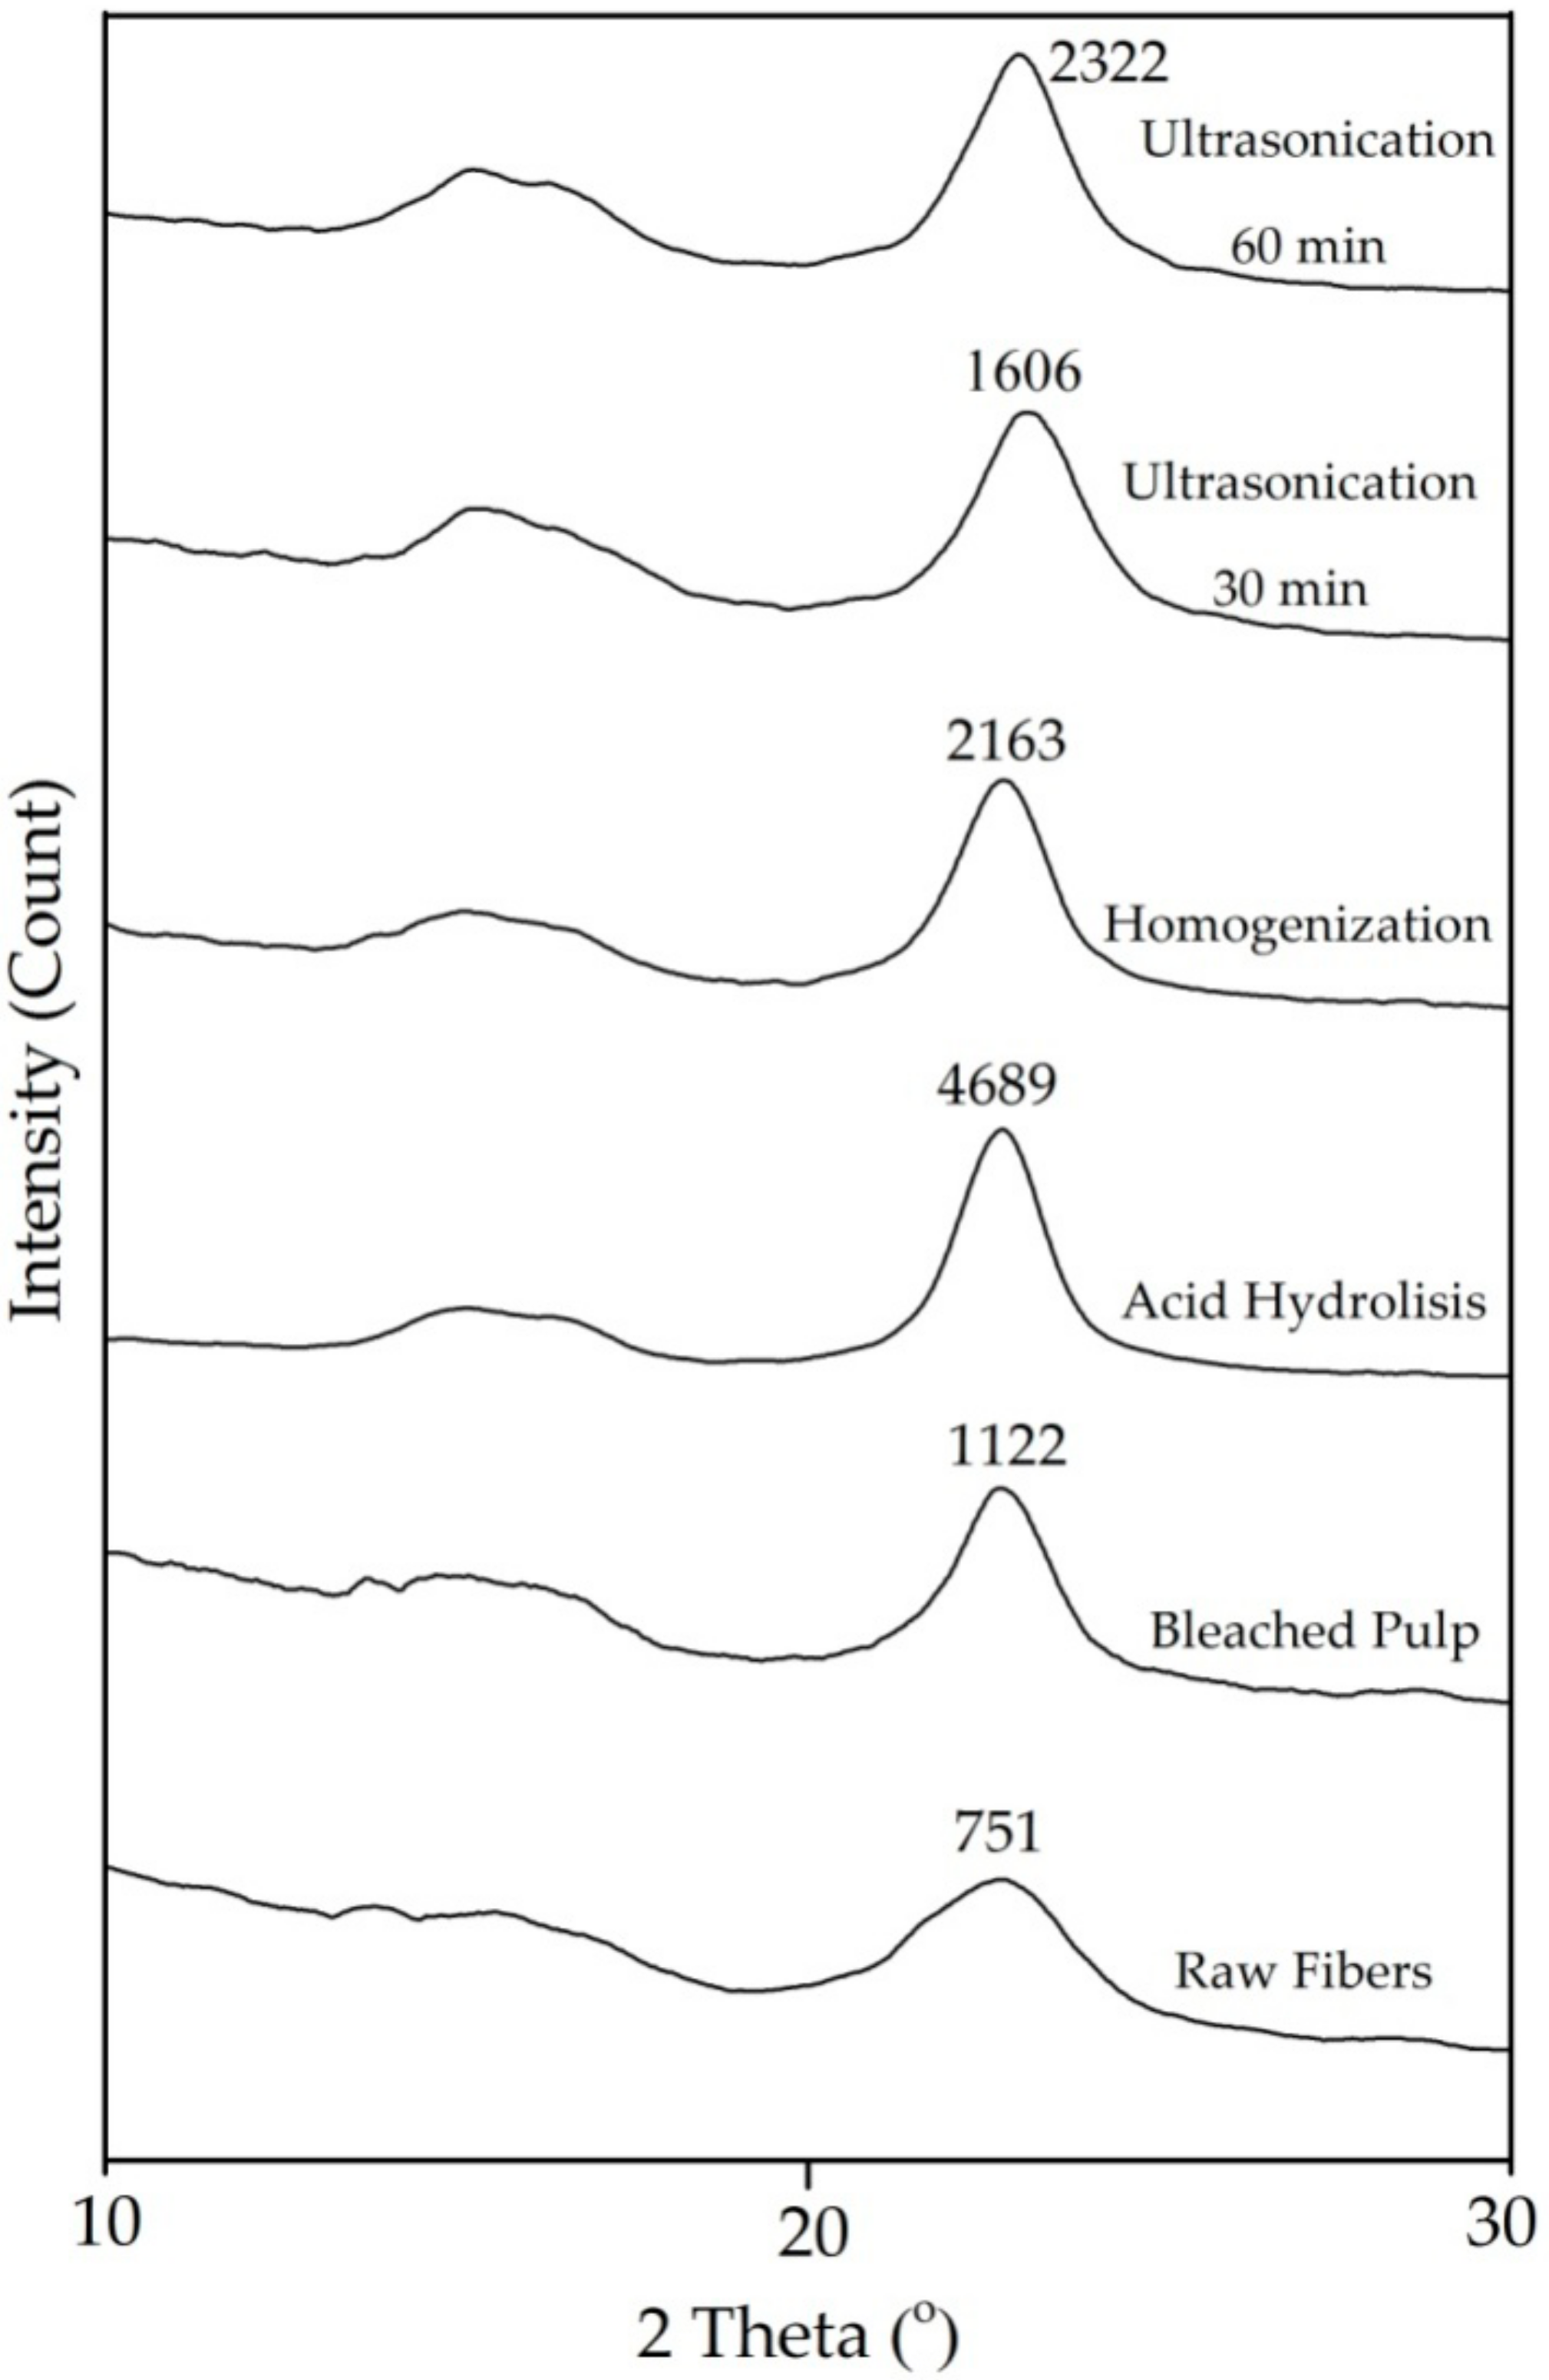
Figure 2 shows the XRD curve of all samples. Peaks appear at 2θ = 18° and 22.6°, suggesting the characteristic of amorphous and crystalline regions, respectively [31]. There is a significant difference in peak intensity between raw fiber and 60 min ultrasonicated fiber (Figure 2) indicating differences in crystallinity index [16]. The crystallinity index of raw fiber was 41.47% which was lower than any treated fiber (Figure 2 and Table 2). This is due to removed non-crystalline components and has been previously reported [2].
The highest index crystallinity was after acid hydrolysis (Table 2) as the amorphous content of the fiber was hydrolyzed and hemicellulose and lignin content were reduced so increased leaving a larger semicrystalline cellulose fraction [16,17]. After mechanical treatment, the crystallinity decreased. XRD measurements show that homogenization and ultrasonication result in fiber with a lower crystallinity index than acid hydrolysis. This is an indication that the intermolecular hydrogen bonds between the cellulose chains were broken destroying the crystalline structure of cellulose [8,29,30,32].

3.4. Fourier Transform Infrared

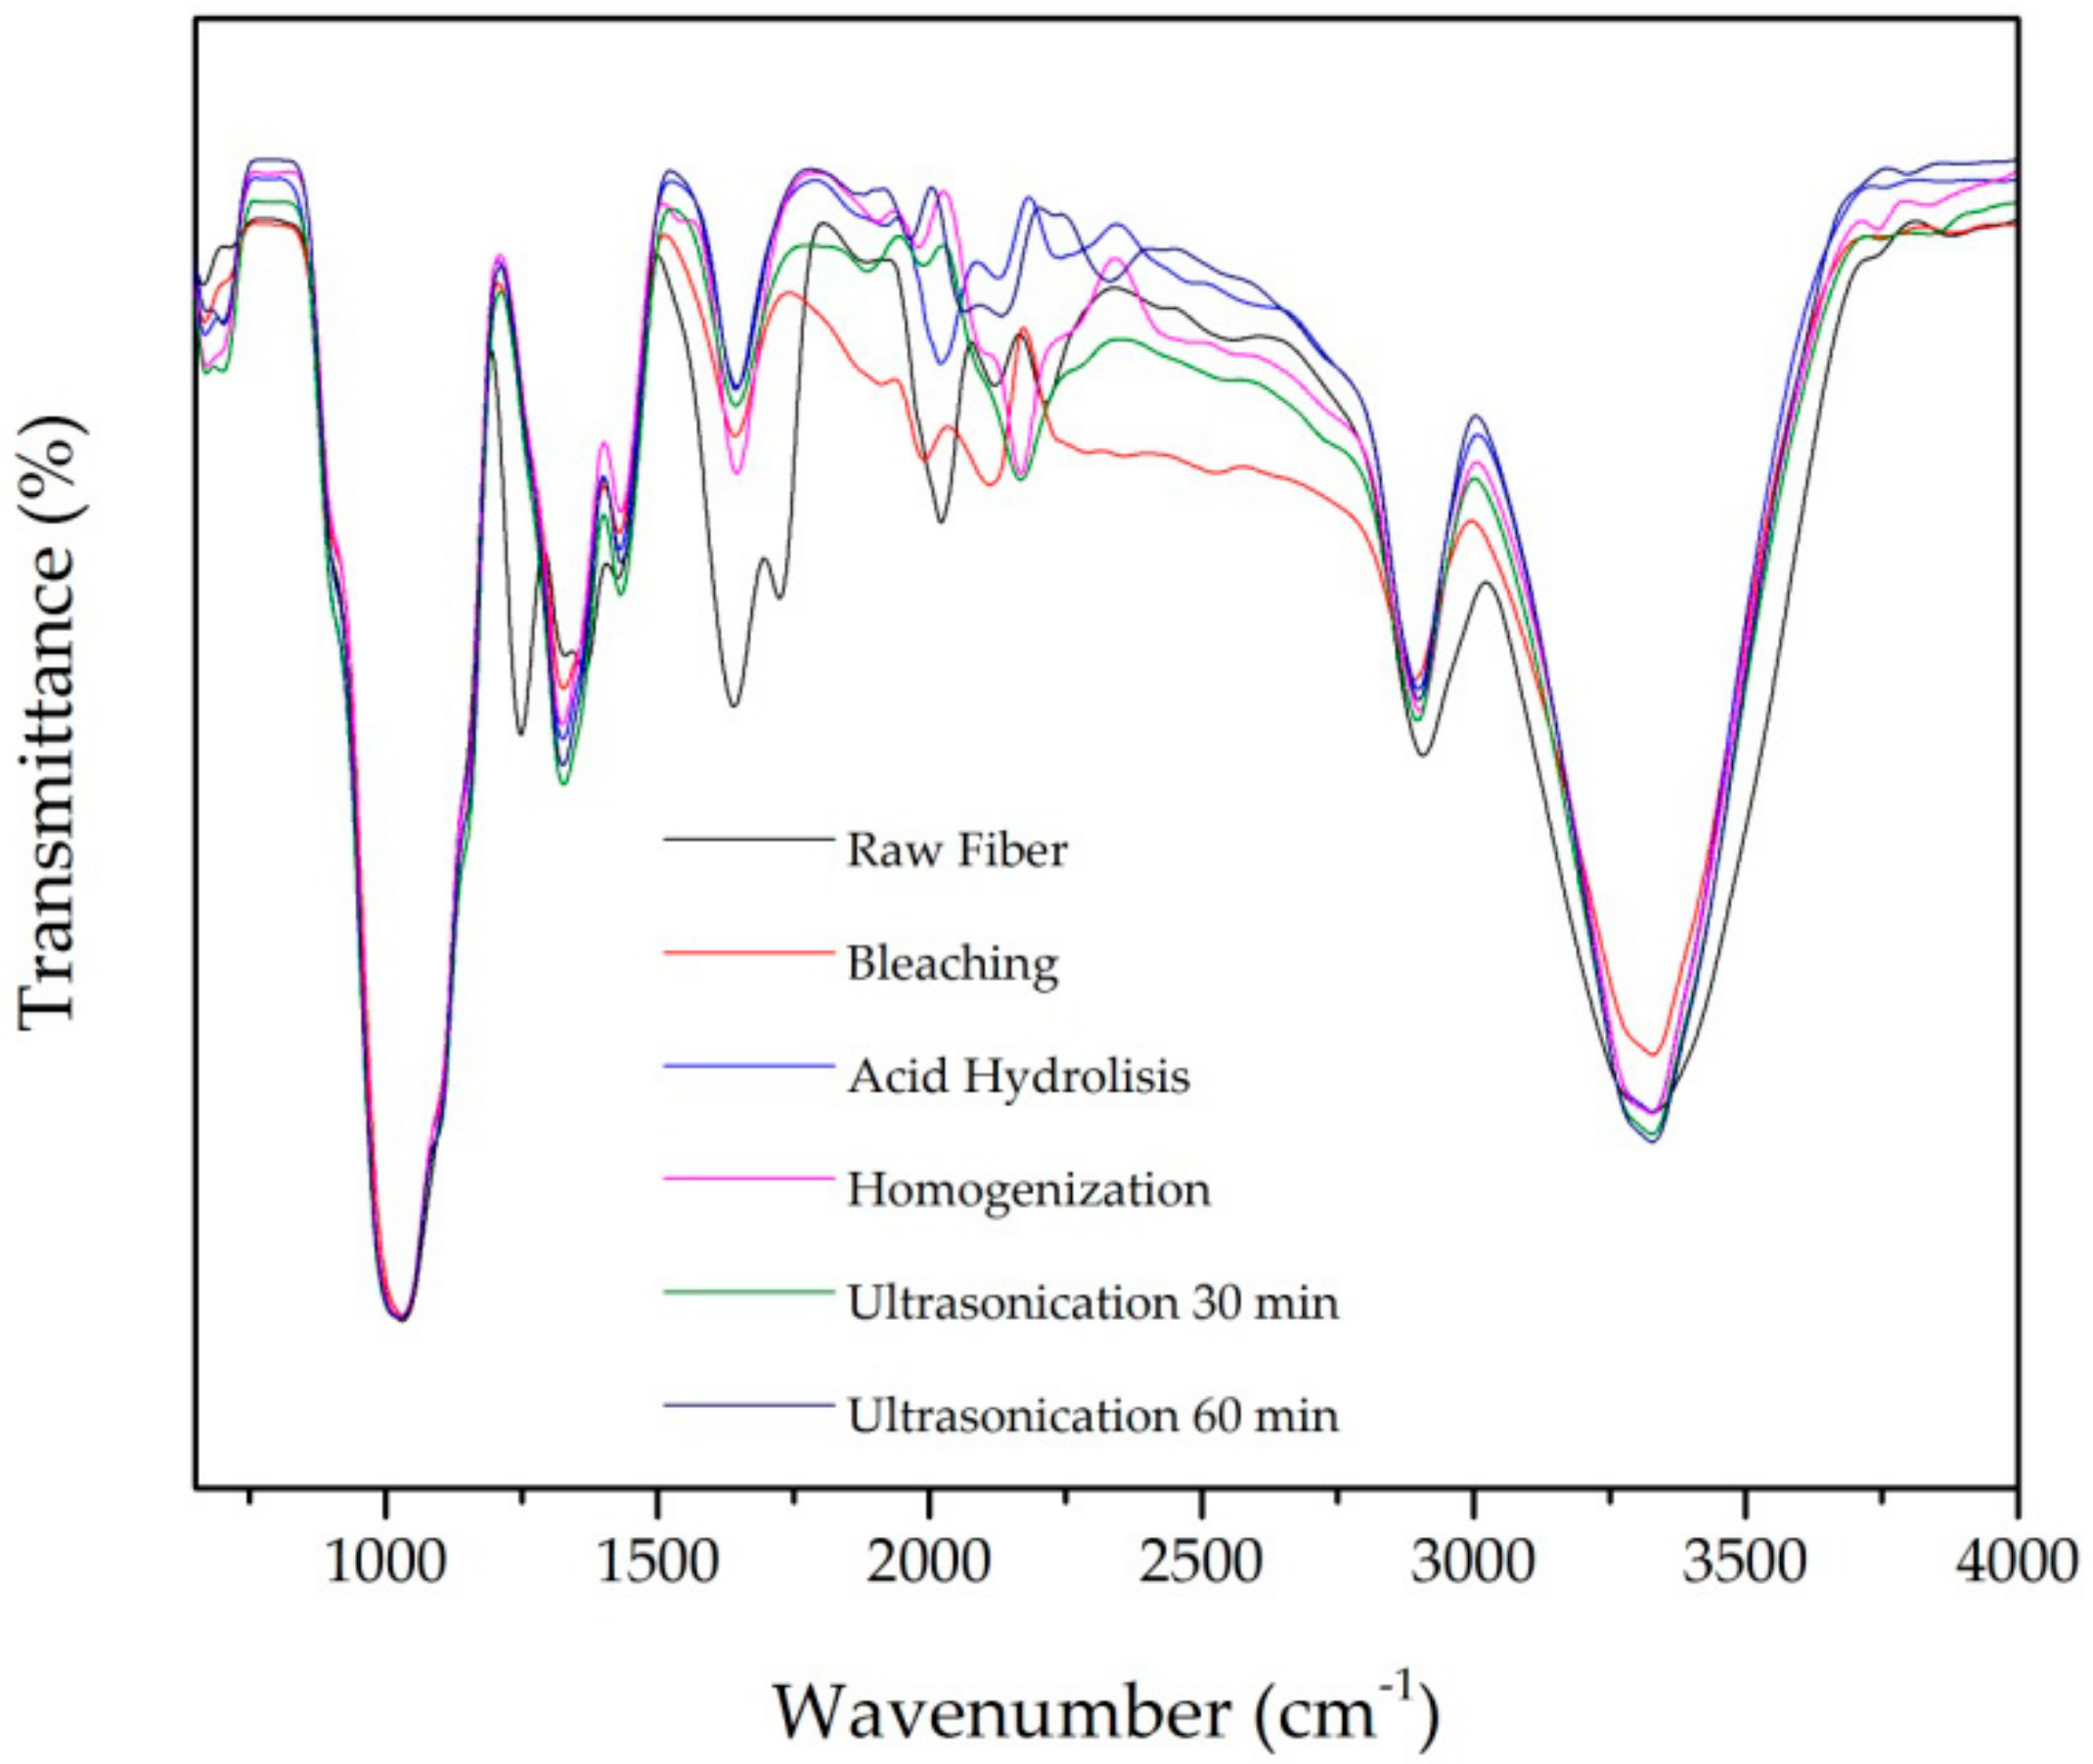
FTIR characterization was used to identify functional groups present in the chemical structure such as alkanes, esters, aromatic, and alcohols. Figure 3 and Table 3 present the FTIR spectra and functional groups identified in untreated and treated fiber. All samples show peaks at wavenumbers around 3328 cm−1 and 2900 cm−1 due to stretching vibration in hydroxyl (OH) and C-H groups, respectively [4].
The characteristic peak of lignin’s aromatic ring vibration presents at wavenumber 1200–1300 cm−1. This peak disappeared after chemical and mechanical treatment. This is due to the removal of lignin during the pulping and bleaching [8,17,32]. The OH group water absorption peak at around wavenumber 1640 cm−1 appears in all samples as expected from other studies [8,32].

3.5. Morphology of Different Treatment of Pineapple Leaf Fibers

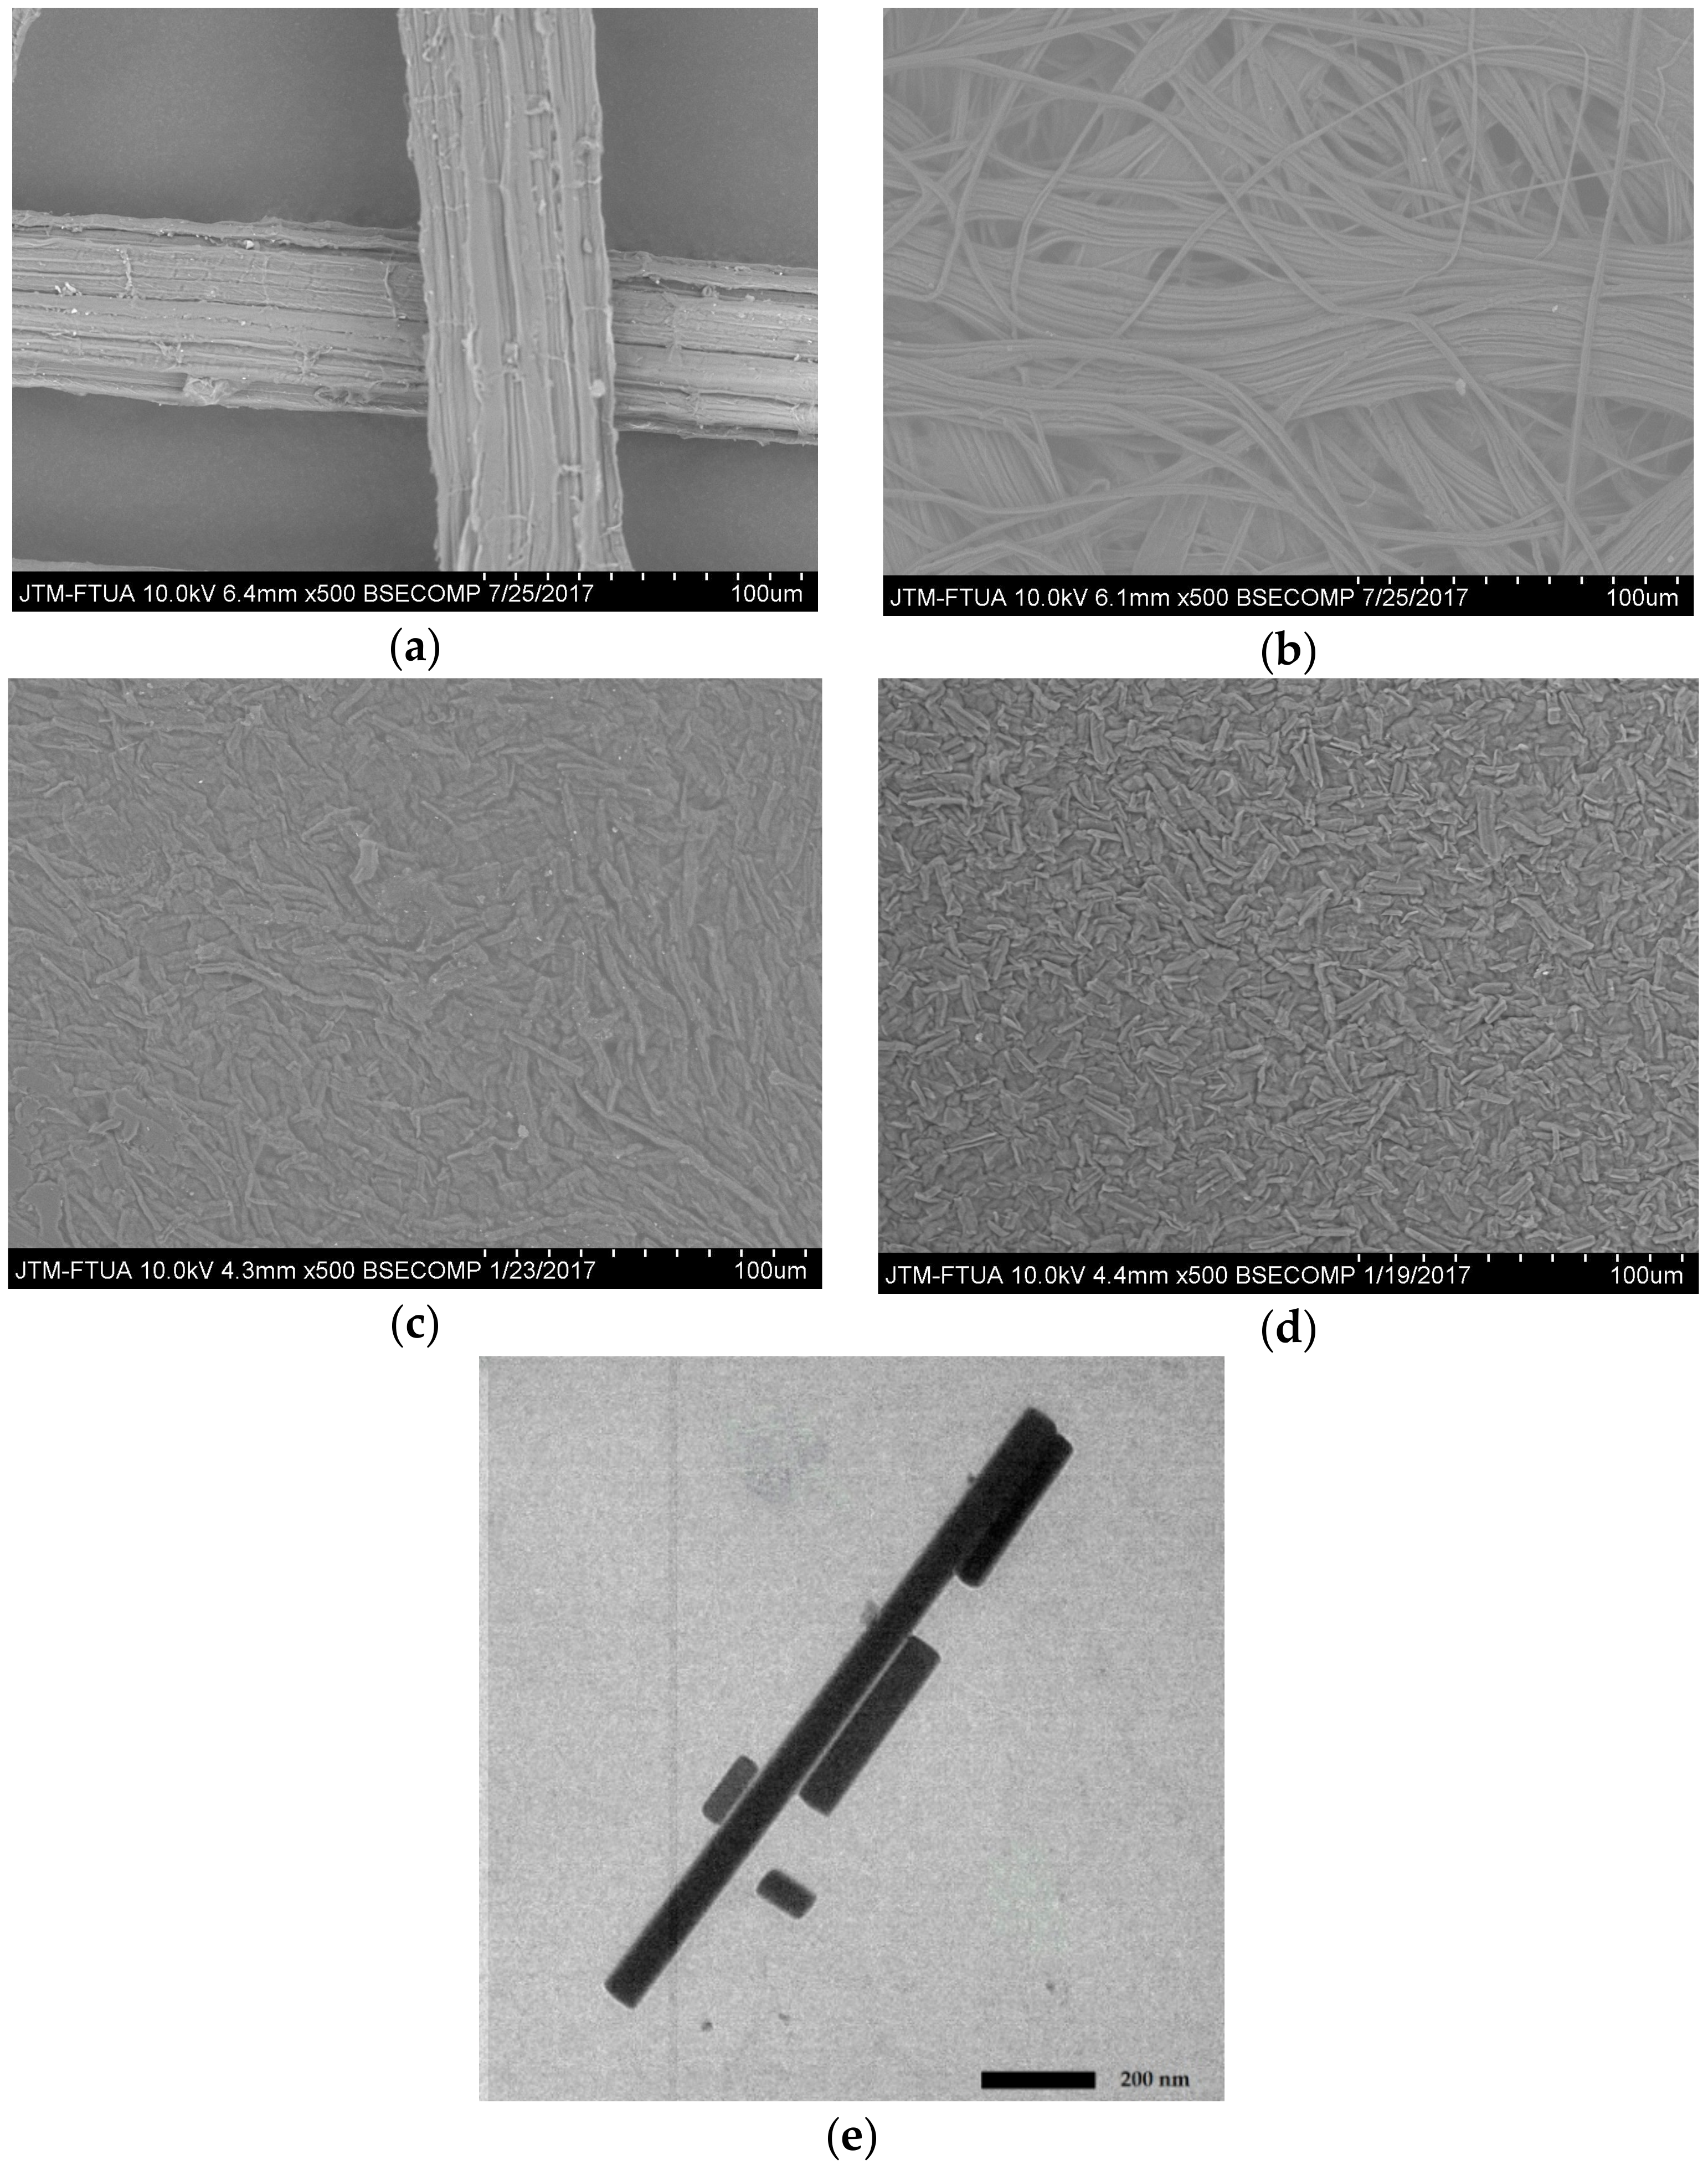
Figure 4 shows SEM and TEM images of the morphological surface of PLF fiber before and after treatments. Figure 4a is an SEM image of raw PLF showing the fiber has a 50 μm diameter appears smooth and microfibrils are still bound to one another due to the presence of lignin and hemicellulose components [33].
After bleaching treatment (Figure 4b) the bonding between lignin and hemicellulose has been broken due to the removal of the amorphous content resulting in microfibril bundles. This explanation is also supported by XRD crystallinity index data.
The SEM image of PLF after acid hydrolysis treatment shows a reduction in fiber size (Figure 4c). The PLF cellulose consists of microfibril bundles with diameters of around 1–5 μm (Figure 4c). This is the result of depolymerization and has also been observed in previous research [17]. The SEM image in Figure 4d shows the morphological surface of PLF cellulose after homogenizing with reduced PLF diameter.

3.6. Morphological Properties of Nanocellulose

Figure 4e is a TEM image of PLF cellulose after high power intensity ultrasonication for 60 min. It shows nanocellulose appearing as individual 40–70 nm diameter thin particles with 88–1100 nm lengths. These results are similar to Zhao et al. [30] who demonstrated that high-shear homogenization for 2 h was able to damage cellulose chains resulting in nanoparticle production. Six-hour and ten-hour ultrasonication of cellulose chains has also been shown to result in 20–50 nm diameter nanoparticles [34,35]. The present study demonstrates nanocellulose production after a significantly shorter timeframe than has been reported previously.

3.7. Thermogravimetric Analysis and Derivative Thermogravimetry

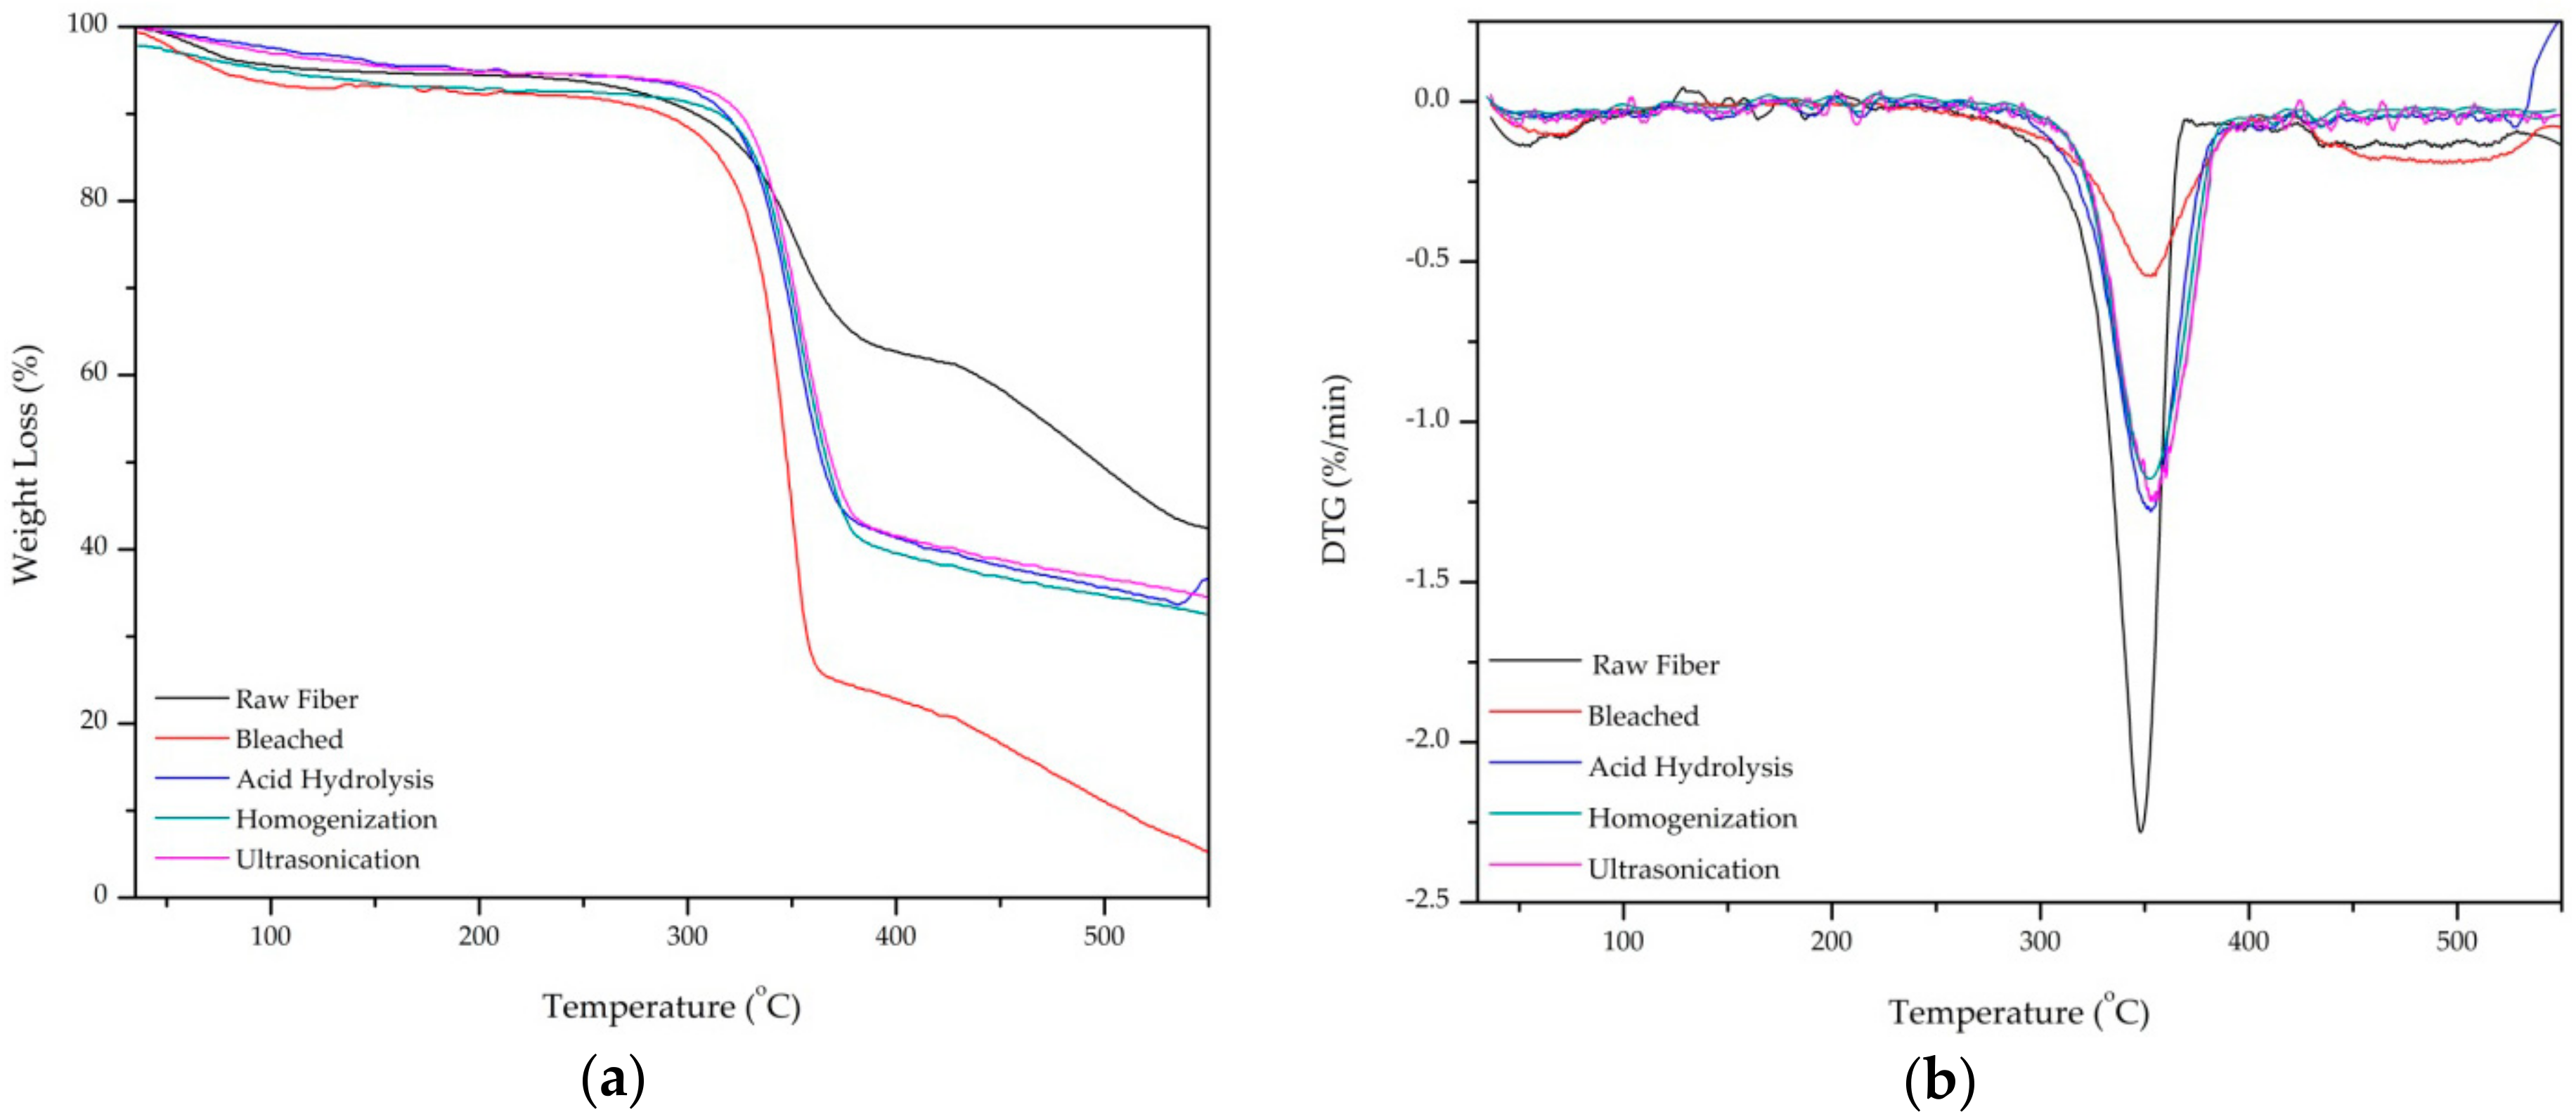
Thermal stability of the PLF after each treatment was tested using thermogravimetric analysis from 35–550 °C. Thermogravimetric analysis (TGA) and the derivative thermogravimetry (DTG) curve are shown in Figure 5a,b, respectively. There are three regions of temperature degradation which occur in around 100 °C, 250–450 °C, and 450–550 °C, respectively.
The weight loss around 100 °C is likely attributed the evaporation water [22]. This is shown as a small trough on the left side of the DTG curve. All samples show a major weight loss in the 250–450 °C region as the hemicellulose and glycosidic linkages in cellulose were depolymerized and broken [14]. The onset degradation temperature of raw, bleached, acid hydrolysis fiber, high-shear homogenization, and ultrasonication were 215, 230, 300, 310, and 320 °C, respectively as shown in the sharp troughs in the DTG curve (Figure 4b). Raw fiber has lower thermal stability than treated fiber.
From 450–550 °C (region 3) all samples were decomposed completely to ash [32]. However, raw fiber has more residue than treated fiber because of the hemicellulose content still left behind in fiber. This result is expected as similar trends have been observed in previous studies [32,36]. The most significant finding from TGA is that the higher degradation temperature of ultrasonicated fiber (320 °C) indicates superior thermal stability over untreated fiber (215 °C).

3.8. Particle Size Analysis

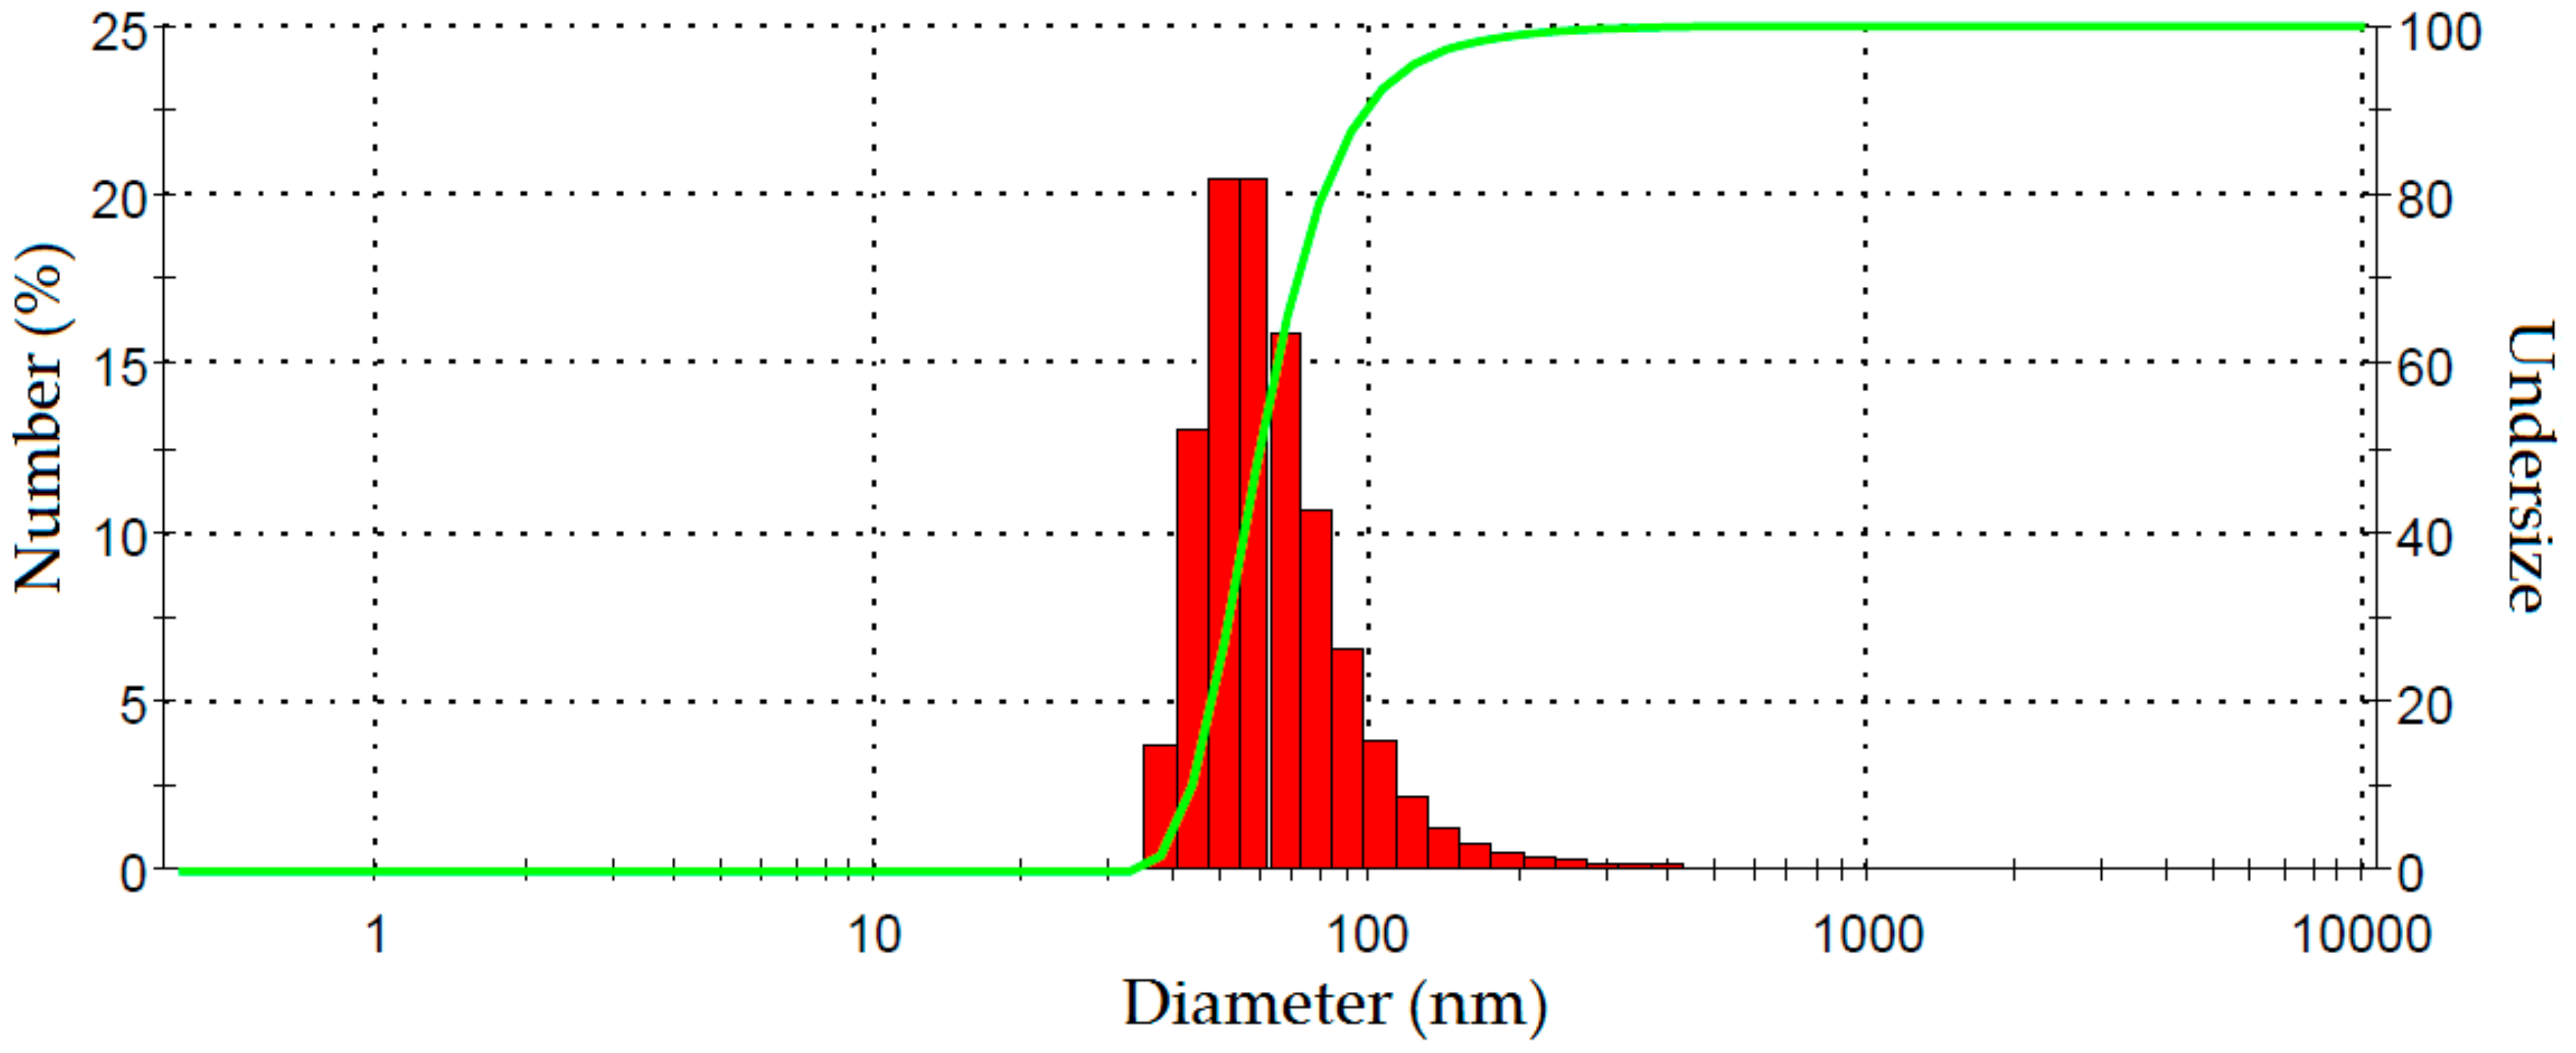
Fiber size after 60 min ultrasonication was determined using PSA. The nanofiber size distribution in a suspension (1 wt %) as measured by dynamic light scattering analysis is shown in Figure 6. The average diameter of these fibers was 68 nm and 91% were less than 100 nm which is the nanofiber range. The particle size distribution is relatively narrow. These results are further evidence of the successful production of nano sized cellulose fibers both in terms of length and width. Furthermore, the particle size distribution shows that the nanofibers obtained from PLF with mechanical treatment are relatively homogeneous. A similar range of fiber size was also reported for Helicteres isora nanofiber processed using steam explosion and homogenization [17].

4. Conclusions

PLF nanocellulose has been successfully fabricated using a new method. A combination of high-shear homogenization and ultrasonication reduced the need for extensive chemical pretreatment. Single stage pre-bleaching and acid hydrolysis were sufficient to produce microcellulose with a high degree of purity. This treatment is more environmentally friendly than previous methods using repeated bleaching [9]. One-hour sonication was sufficient to produce high purity nanocellulose fibers with an average of 68 nm diameters and length less than 88–1100 nm. Chemical analysis and FTIR testing of PLF indicates that most lignin, hemicelluloses, and extractive substances have been eliminated. The crystallinity of the nanocellulose fiber is 50% higher than that of the raw fiber and the thermal stability has increased to yield degradation temperatures around 320 °C. These properties suggest PLF nanofiber may be an effective reinforcing material for biocomposites.

Author Contributions

M.M., H.A., A.K., S.A., and M.A. conceived and designed the experiments. M.M. and M.A. performed the experiments. All authors analyzed the data. M.M. and A.K. contributed reagents and materials. M.M. wrote the paper. All authors approved the paper.

Acknowledgments

This work was financially supported by the Ministry of Research, Technology and Higher Education of the Republic of Indonesia from PMDSU batch 2 program. This work was also supported by the postgraduate program of Andalas University.

Conflicts of Interest

The authors declare no conflict of interest.

References

  1. Dos Santos, R.M.; Neto, W.P.F.; Silvério, H.A.; Martins, D.F.; Dantas, N.O.; Pasquini, D. Cellulose nanocrystals from pineapple leaf, a new approach for the reuse of this agro-waste. Ind. Crop. Prod. 2013, 50, 707–714. [Google Scholar] [CrossRef]
  2. Abraham, E.; Deepa, B.; Pothan, L.A.; Jacob, M.; Thomas, S.; Cvelbar, U.; Anandjiwala, R. Extraction of nanocellulose fibrils from lignocellulosic fibres: A novel approach. Carbohydr. Polym. 2011, 86, 1468–1475. [Google Scholar] [CrossRef]
  3. Hossain, M.K.; Karim, M.R.; Chowdhury, M.R.; Imam, M.A.; Hosur, M.; JeelAppani, S.; Farag, R. Comparative mechanical and thermal study of chemically treated and untreated single sugarcane fiber bundle. Ind. Crop. Prod. 2014, 58, 78–90. [Google Scholar] [CrossRef]
  4. Yang, H.; Yan, R.; Chen, H.; Lee, D.H.; Zheng, C. Characteristics of hemicellulose, cellulose and lignin pyrolysis. Fuel 2007, 86, 1781–1788. [Google Scholar] [CrossRef]
  5. Moon, R.J.; Martini, A.; Nairn, J. Simonsen, J.; Youngblood, J. Cellulose nanomaterials review: Structure, properties and nanocomposites. Chem. Soc. Rev. 2011, 40, 3941–3994. [Google Scholar] [CrossRef] [PubMed]
  6. Sari, N.H.; Wardana, I.N.G.; Irawan, Y.S.; Siswanto, E. The Effect of Sodium Hydroxide on Chemical and Mechanical Properties of Corn Husk Fiber. Orient. J. Chem. 2017, 33, 3037–3042. [Google Scholar] [CrossRef]
  7. Asrofi, M.; Abral, H.; Kasim, A.; Pratoto, A. Characterization of the microfibrillated cellulose from water hyacinth pulp after alkali treatment and wet blending. IOP Conf. Ser. Mater. Sci. Eng. 2017, 204, 12018. [Google Scholar] [CrossRef]
  8. Chen, W.; Yu, H.; Liu, Y.; Hai, Y.; Zhang, M.; Chen, P. Isolation and characterization of cellulose nanofibers from four plant cellulose fibers using a chemical-ultrasonic process. Cellulose 2011, 18, 433–442. [Google Scholar] [CrossRef]
  9. Cherian, B.M.; Leão, A.L.; de Souza, S.F.; Thomas, S.; Pothan, L.A.; Kottaisamy, M. Isolation of nanocellulose from pineapple leaf fibres by steam explosion. Carbohydr. Polym. 2010, 81, 720–725. [Google Scholar] [CrossRef]
  10. Asrofi, M.; Abral, H.; Putra, Y.K.; Sapuan, S.M.; Kim, H.J. Effect of duration of sonication during gelatinization on properties of tapioca starch water hyacinth fiber biocomposite. Int. J. Biol. Macromol. 2018, 108, 167–176. [Google Scholar] [CrossRef] [PubMed]
  11. Abral, H.; Dalimunthe, M.H.; Hartono, J.; Efendi, R.P.; Asrofi, M.; Sugiarti, E.; Sapuan, S.M.; Park, J.W.; Kim, H.J. Characterization of tapioca starch biopolymer composites reinforced with micro scale water hyacinth fibers. Starch/Starke 2018. [Google Scholar] [CrossRef]
  12. Asrofi, M.; Abral, H.; Kasim, A.; Pratoto, A. XRD and FTIR studies of nanocrystalline cellulose from water hyacinth (Eichorniacrassipes) fiber. J. Metastab. Nanocrystalline Mater. 2017, 29, 9–16. [Google Scholar] [CrossRef]
  13. Abral, H.; Putra, G.J.; Asrofi, M.; Park, J.W.; Kim, H.J. Effect of vibration duration of high ultrasound applied to bio-composite while gelatinized on its properties. Ultrason. Sonochem. 2018, 40, 697–702. [Google Scholar] [CrossRef] [PubMed]
  14. Candra, C.S.J.; George, N.; Narayanankutty, S.K. Isolation and characterization of cellulose nanofibrils from arecanut husk fibre. Carbohydr. Polym. 2016, 142, 158–166. [Google Scholar]
  15. Jonoobi, M.; Harun, J.; Mishra, M.; Oksman, K. Chemical composition, crystallinity and thermal degradation of bleached and unbleached kenaf bast (Hibiscus cannabinus) pulp and nanofiber. BioResources 2009, 4, 626–639. [Google Scholar]
  16. Fahma, F.; Iwamoto, S.; Hori, N.; Iwata, T.; Takemura, A. Effect of pre-acid-hydrolysis treatment on morphology and properties of cellulose nanowhiskers from coconut husk. Cellulose 2011, 18, 443–450. [Google Scholar] [CrossRef]
  17. Chirayil, C.J.; Joy, J.; Mathew, L.; Mozetic, M.; Koetz, J.; Thomas, S. Isolation and characterization of cellulose nanofibrils from Helicteres isora plant. Ind. Crop. Prod. 2014, 59, 27–34. [Google Scholar] [CrossRef]
  18. Abral, H.; Mahardika, M. Tensile properties of bacterial cellulose nanofibers-polyester composites. IOP Conf. Ser. Mater. Sci. Eng. 2016, 137, 12019. [Google Scholar] [CrossRef]
  19. Qiu, K.; Netravali, A. In Situ Produced Bacterial Cellulose Nanofiber-Based Hybrids for Nanocomposites. Fibers 2017, 5, 31. [Google Scholar] [CrossRef]
  20. Abral, H.; Lawrensius, V.; Handayani, D.; Sugiarti, E. Preparation of nano-sized particles from bacterial cellulose using ultrasonication and their characterization. Carbohydr. Polym. 2018, 191, 161–167. [Google Scholar] [CrossRef] [PubMed]
  21. Nuryati, L.; Noviati; Astrid Susanti, A. Outlook Komoditas Pertanian Subsektor Hortkultura Nenas; Pusat Data dan Sistem Informasi Pertanian; Portal Epublikasi Pertanian: Jakarta, Indonesia, 2015; pp. 1507–1907. [Google Scholar]
  22. Fahma, F.; Iwamoto, S.; Hori, N.; Iwata, T.; Takemura, A. Isolation, preparation, and characterization of nanofibers from oil palm empty-fruit-bunch (OPEFB). Cellulose 2010, 17, 977–985. [Google Scholar] [CrossRef]
  23. Sheltami, R.M.; Abdullah, I.; Ahmad, I.; Dufresne, A.; Kargarzadeh, H. Extraction of cellulose nanocrystals from mengkuang leaves (Pandanus tectorius). Carbohydr. Polym. 2012, 88, 772–779. [Google Scholar] [CrossRef]
  24. Nogi, M.; Iwamoto, S.; Nakagaito, A.N.; Yano, H. Optically transparent nanofiber paper. Adv. Mater. 2009, 21, 1595–1598. [Google Scholar] [CrossRef]
  25. Karimi, S.; Tahir, P.M.; Karimi, A.; Dufresne, A.; Abdulkhani, A. Kenaf bast cellulosic fibers hierarchy: A comprehensive approach from micro to nano. Carbohydr. Polym. 2014, 101, 878–885. [Google Scholar] [CrossRef] [PubMed]
  26. Dufresne, A. Cellulose nanomaterial reinforced polymer nanocomposites. Curr. Opin. Colloid Interface Sci. 2017, 29, 1–8. [Google Scholar] [CrossRef]
  27. Johar, N.; Ahmad, I.; Dufresne, A. Extraction, preparation and characterization of cellulose fibres and nanocrystals from rice husk. Ind. Crop. Prod. 2012, 37, 93–99. [Google Scholar] [CrossRef]
  28. Liew, S.Y.; Thielemans, W.; Hewakandamby, B. Separation of sulphuric acid from an acid suspension of cellulose nanocrystals by manual shaking. J. Nano Res. 2016, 38, 58–72. [Google Scholar] [CrossRef]
  29. Li, J.; Wei, X.; Wang, Q.; Chen, J.; Chang, G.; Kong, L.; Su, J.; Liu, Y. Homogeneous isolation of nanocellulose from sugarcane bagasse by high pressure homogenization. Carbohydr. Polym. 2012, 90, 1609–1613. [Google Scholar] [CrossRef] [PubMed]
  30. Zhao, J.; Zhang, W.; Zhang, X.; Zhang, X.; Lu, C.; Deng, Y. Extraction of cellulose nanofibrils from dry softwood pulp using high shear homogenization. Carbohydr. Polym. 2013, 97, 695–702. [Google Scholar] [CrossRef] [PubMed]
  31. Segal, L.; Creely, J.J.; Martin, J.A.E.; Conrad, C.M. An Empirical Method for Estimating the Degree of Crystallinity of Native Cellulose Using the X-ray Diffractometer. Text. Res. J. 1959, 29, 786–794. [Google Scholar] [CrossRef]
  32. Chen, X.; Yu, J.; Zhang, Z.; Lu, C. Study on structure and thermal stability properties of cellulose fibers from rice straw. Carbohydr. Polym. 2011, 85, 245–250. [Google Scholar] [CrossRef]
  33. Abe, K.; Yano, H. Comparison of the characteristics of cellulose microfibril aggregates of wood, rice straw and potato tuber. Cellulose 2009, 16, 1017. [Google Scholar] [CrossRef]
  34. Hu, Y.; Tang, L.; Lu, Q.; Wang, S.; Chen, X.; Huang, B. Preparation of cellulose nanocrystals and carboxylated cellulose nanocrystals from borer powder of bamboo. Cellulose 2014, 21, 1611–1618. [Google Scholar] [CrossRef]
  35. Wang, N.; Ding, E.; Cheng, R. Thermal degradation behaviors of spherical cellulose nanocrystals with sulfate groups. Polymer 2007, 48, 3486–3493. [Google Scholar] [CrossRef]
  36. Kargarzadeh, H.; Ahmad, I.; Abdullah, I.; Dufresne, A.; Zainudin, S.Y.; Sheltami, R.M. Effects of hydrolysis conditions on the morphology, crystallinity, and thermal stability of cellulose nanocrystals extracted from kenaf bast fibers. Cellulose 2012, 19, 855–866. [Google Scholar] [CrossRef]
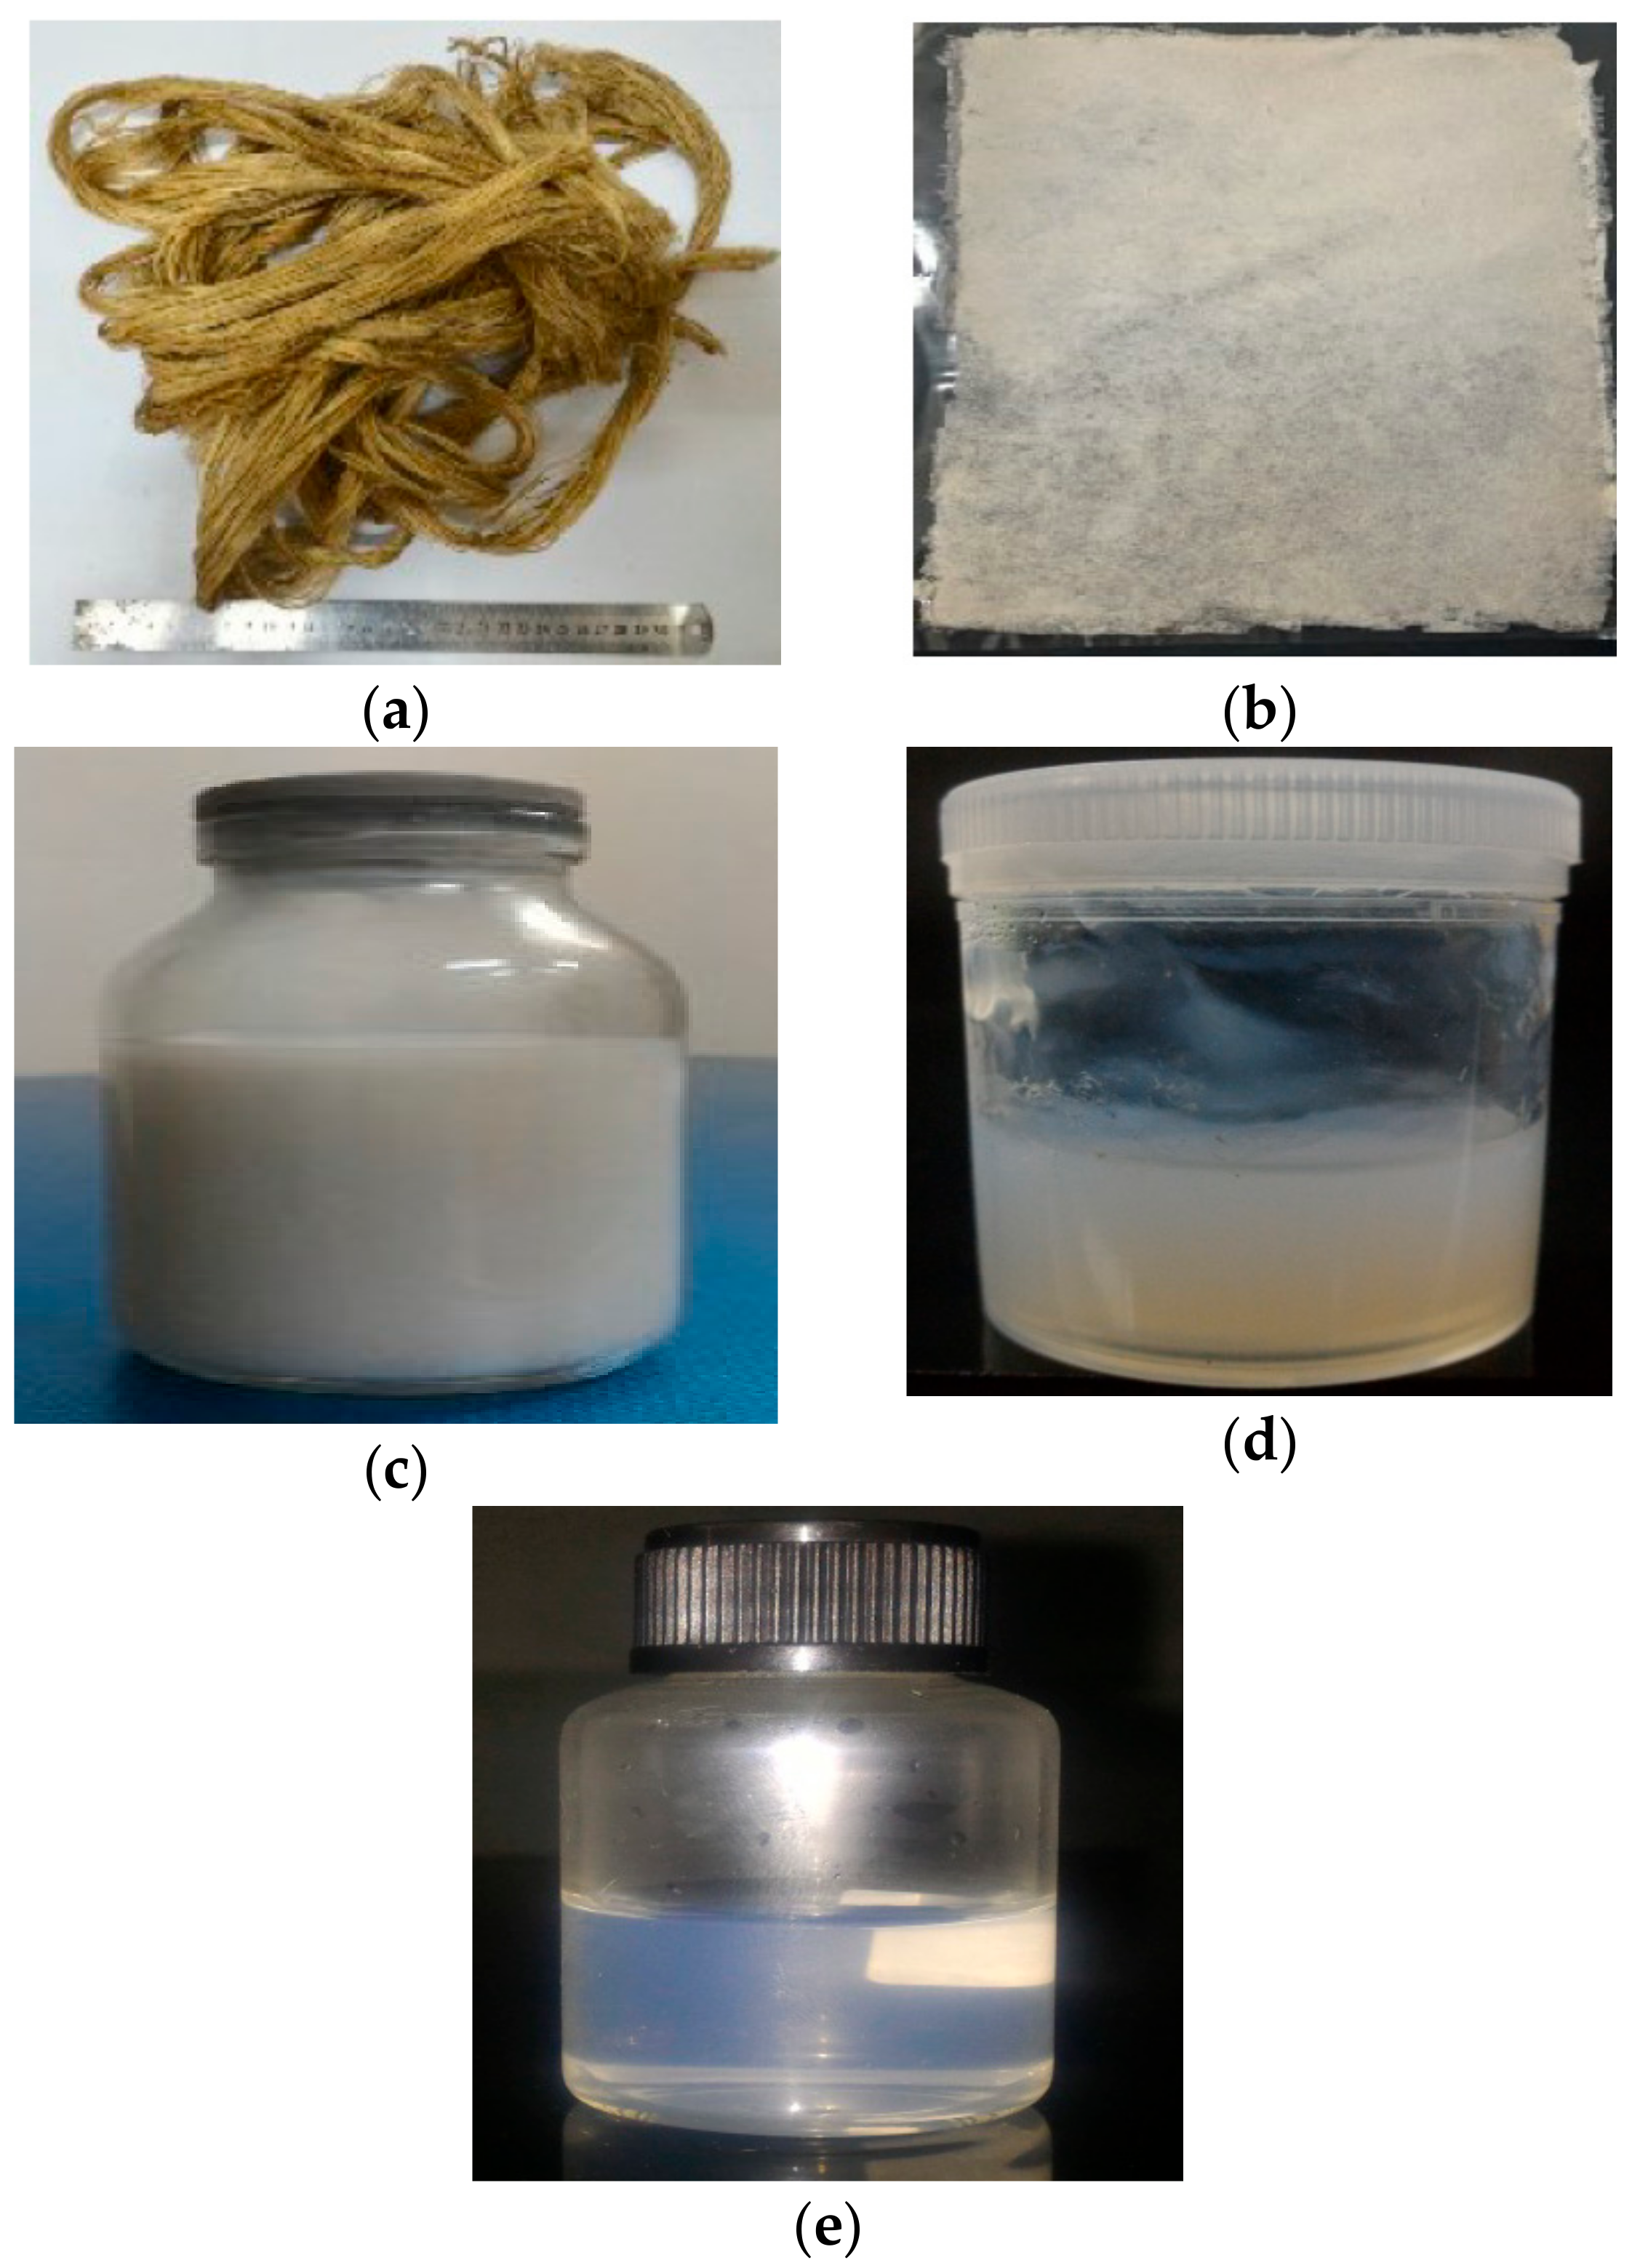
Figure 1. Physical structure of PLF: (a) Raw fibers; (b) bleached process; (c) acid hydrolysis; (d) high-shear homogenization; and (e) ultrasonication 60 min.
Fibers 06 00028 g001
Figure 2. X-ray Diffraction patterns of Pineapple Leaf Fibers with different treatment.
Fibers 06 00028 g002
Figure 3. Fourier Transform Infrared spectra after each treatment of PLF.
Fibers 06 00028 g003
Figure 4. Photograph SEM and TEM of PLF: (a) SEM of untreated fiber; (b) SEM of bleached fiber; (c) SEM of acid hydrolysis; (d) SEM of high-shear homogenization; and (e) TEM of ultrasonication 60 min.
Fibers 06 00028 g004
Figure 5. (a) Thermogravimetric Analysis and (b) Derivative Thermogravimetry curves of raw fiber, bleached, acid hydrolysis, high-shear homogenization, and ultrasonication.
Fibers 06 00028 g005
Figure 6. Dynamic light scattering analysis spectrum showing size distribution of fibers after ultrasonication 60 min.
Fibers 06 00028 g006
Table 1. Main chemical composition of Pineapple Leaf Fibers in every step chemical treatment.
TreatmentCellulose (%)Hemicellulose (%)Lignin (%)Extractives (%)
Raw PLF62.513.915.94.2
Bleached pulp71.310.212.42.4
Acid Hydrolysis81.32.91.50.3
Table 2. Crystallinity index of Pineapple Leaf Fibers with different treatment.
TreatmentCrI (%)
Raw Pineapple Leaf Fibers41.5
Bleached pulp54.4
Acid Hydrolysis82.7
High-shear homogenization69.4
Ultrasonication 30 min48.8
Ultrasonication 60 min61.7
Table 3. Functional group of Pineapple Leaf Fibers with different treatment.
Treatment–OH Stretching (cm−1)C–H Vibration (cm−1)Absorbed Water (cm−1)Aromatic Ring Vibration of Lignin (cm−1)C–C Stretching (cm−1)
Raw PLF33292906164012481031
Bleached pulp332928921642-1032
Acid Hydrolysis332828981643-1028
High-shear homogenization332829001643-1028
Ultrasonication 30 min332728961644-1026
Ultrasonication 60 min332828981645-1027