1. Introduction
Short-fiber-reinforced thermoplastics are widely used in lightweight engineering because they combine low density, cost-efficient processing, and adjustable mechanical properties. Injection-molded compounds based on polypropylene (PP) and polyamides (PA), reinforced with glass, basalt, or natural fibers, are highly relevant for structural and semi-structural applications. Their morphology formation, structure–property relationships, and stiffness prediction have therefore been studied extensively [
1,
2,
3]. For material selection and component design, reliable prediction of the Young’s modulus is essential.
Micromechanical models are commonly used to estimate the stiffness of fiber-reinforced polymers from constituent properties and reinforcement morphology. Besides rule-of-mixtures-based approaches, several alternative micromechanical models have been proposed for the stiffness prediction of short-fiber-reinforced polymers, including Halpin–Tsai-type relations, Mori–Tanaka-based mean-field approaches, and Tandon–Weng formulations. However, these approaches also rely on idealizing assumptions and generally do not account explicitly for interfacial adhesion losses in the form addressed here.
While the rule of mixtures provides a useful upper-bound description for continuous fibers aligned with the loading direction, short-fiber-reinforced thermoplastics deviate substantially from this idealized case because finite fiber length and non-ideal fiber orientation reduce the effective reinforcing contribution. To account for these effects, Cox introduced a shear-lag-based length efficiency concept, and Krenchel added an orientation efficiency factor for non-aligned fibers. The resulting Cox–Krenchel framework has become one of the most widely used analytical approaches for predicting the Young’s modulus of short-fiber-reinforced polymers [
3,
4,
5,
6,
7,
8,
9,
10]. At the same time, recent data-driven approaches underline both the practical importance of stiffness prediction and the remaining limitations of purely analytical models [
2].
Previous studies have reported that Cox–Krenchel-type predictions can be competitive with, and in several cases more accurate than, alternative analytical approaches such as Halpin–Tsai or Tsai–Pagano for discontinuous fiber systems [
3,
4,
5,
6,
7,
8,
9]. Good agreement between prediction and experiment has been reported for a range of composite systems, including flax/polypropylene [
3], pineapple leaf fiber/epoxy [
4], kenaf/epoxy [
5], sugar palm fiber/polystyrene [
7], kenaf/polypropylene [
8], and glass-fiber-reinforced polypropylene when measured fiber orientation and fiber length are used as model inputs [
9]. Nevertheless, noticeable deviations remain common. Depending on the fiber–polymer system, the quality of the morphological input data, and the presence of coupling agents or surface treatments, reported differences between the calculated and measured Young’s moduli range from below 10% to about 45% [
3,
5,
6,
7,
8]. For example, deviations of up to approximately 45% have been reported for flax-fiber-reinforced polypropylene [
6], and substantial errors were also observed for flax/PP systems without coupling agents [
3]. More generally, recent work has emphasized that commonly used analytical models are still insufficiently accurate for practical stiffness prediction in randomly oriented short-fiber composites [
11]. Conversely, very good agreement has been obtained for systems with favorable interfacial conditions, such as glass-fiber-reinforced polypropylene with coupling agents [
9] and carbon-fiber-reinforced polyamide 6 [
10]. Overall, these findings suggest that commonly used analytical models remain insufficiently accurate for general stiffness prediction in heterogeneous short-fiber systems when only morphology-based inputs are considered [
3,
4,
5,
6,
7,
8,
9,
10,
11].
These observations indicate that deviations between analytical prediction and experiment cannot always be explained by fiber volume fraction, fiber length, and fiber orientation alone. In this context, interfacial shear strength (IFSS) is frequently used as a mechanical descriptor of fiber–matrix interaction, and a variety of experimental methods have been proposed for its determination, including pull-out, fragmentation, microdroplet, and modified short-beam-shear-based approaches [
12]. However, such methods are often experimentally demanding, geometry-dependent, or limited in their applicability to specific fiber types and interface configurations [
12]. This suggests that, beyond morphology, the efficiency of stress transfer across the fiber–polymer interface is an additional governing factor. This interpretation is consistent with studies showing that interfacial adhesion can be modified substantially by changes in fiber surface state and surface energy, with corresponding effects on interfacial shear strength and wetting behavior, including basalt-fiber-reinforced systems [
13]. However, in the present work, the focus is not on interfacial failure phenomena, but on interface-state effects that may already influence elastic load transfer in the small-strain regime [
3,
5,
8].
The role of the interface in composite mechanics has long been discussed in the context of wetting and adhesion [
14,
15,
16,
17,
18,
19]. Effective load transfer is generally facilitated by adequate wetting and by the formation of an interface state that allows efficient elastic stress transfer in the solidified composite. Thermodynamic descriptions of adhesion commonly relate material interaction to surface energy or surface tension [
20,
21,
22,
23,
24,
25]. From the perspective of wetting theory, these interactions are reflected in contact-angle relations and interfacial force balance [
17,
26,
27]. Related sessile-drop-based studies also illustrate how contact angle, surface tension, liquid–solid interfacial tension, and the work of adhesion can be linked within a common thermodynamic framework for comparative interface characterization [
28]. In polymer and interface science, such concepts are frequently formulated by separating dispersive and polar contributions to the surface energy [
29,
30,
31,
32,
33]. On this basis, interfacial tension and compatibility between two phases can be estimated for polymer systems [
34,
35,
36,
37,
38,
39,
40,
41]. Within the Owens–Wendt–Rabel–Kaelble framework, the total surface energy is decomposed into polar and dispersive components, allowing the interfacial tension between two materials to be derived from measurable quantities [
29,
30,
31,
38]. Although surface-energy-based concepts are well-established in adhesion science and in the characterization of modified polymer interfaces [
21,
25,
29,
30,
31,
33,
37,
38,
40,
41,
42], they are not explicitly included in standard analytical stiffness predictions for short-fiber-reinforced thermoplastics.
The present study addresses this gap by introducing an adhesion efficiency factor into the Cox–Krenchel model. The proposed extension is based on the interfacial tension between the fiber and polymer derived from surface-tension components and is intended to represent incomplete elastic load transfer at the interface while preserving the analytical simplicity of the original model. The approach is evaluated for three injection-molded composite systems based on PP and PA 6.6 matrices combined with basalt and glass fibers, for which the fiber volume fraction, fiber length, and fiber orientation were determined experimentally. In addition, the transferability of the proposed concept is explored using an independent literature case for PA 6 composites reinforced with basalt fibers of different surface states [
43], combined with literature surface-tension data for PA 6 [
44].
Direct mechanical characterization of the interface, for example, by IFSS-based methods, can provide valuable information on fiber–matrix bonding and has been used to assess fiber-surface modification effects [
12,
13]. However, such methods generally require dedicated testing concepts and are not always readily transferable across material systems and processing states. Against this background, the aim of this work is to examine whether a surface-energy-based description of fiber–polymer adhesion can reduce the remaining deviation between Cox–Krenchel predictions and experimental Young’s moduli across different thermoplastic–fiber combinations without requiring combination-specific mechanical interface tests. The present study introduces a semi-empirical, analytically simple interface-related efficiency term derived from surface-tension-based interfacial tension and intended as a physically motivated correction.
3. Theoretical Background and Model Development
3.1. Classical Cox–Krenchel Model
The Young’s modulus of short-fiber-reinforced thermoplastics was first described using the classical Cox–Krenchel approach. In this framework, the composite modulus is expressed as a function of the matrix modulus, the fiber modulus, the fiber volume fraction, and efficiency factors accounting for fiber orientation and fiber length. The model assumes that the reinforcing fibers contribute to composite stiffness according to their intrinsic stiffness and their effective load-bearing capability within the matrix. Accordingly, the composite modulus
can be written as Equation (1), in which the fiber contribution is reduced by orientation and length efficiency factors.
where
is the Young’s modulus of the matrix,
is the Young’s modulus of the fiber,
is the fiber volume fraction,
is the orientation efficiency factor, and
is the effective Cox length efficiency factor obtained from the individually measured fiber lengths of the respective material system by length-weighted averaging.
To account for the reduced reinforcing efficiency of discontinuous fibers, Cox introduced the length efficiency factor given in Equation (2):
where
is the length of an individual measured fiber and
is the shear-lag parameter. The shear-lag parameter
is calculated according to Equation (3):
where
is the shear modulus of the matrix,
is the fiber cross-sectional area,
is the mean distance between neighboring fibers, and
is the fiber radius.
The mean distance between fibers was estimated from the fiber volume fraction under the assumption of a homogeneous fiber distribution within the composite. For this purpose, a hexagonal packing arrangement was assumed in the cross-sectional plane, yielding:
Based on Equations (2)–(4), an individual length efficiency factor
was calculated for each experimentally measured fiber length. To account for the measured fiber population directly, an effective global length efficiency factor
was then obtained by length-weighted averaging of the individual values:
where
is the length of the
-th measured fiber and
is the corresponding individual Cox length efficiency factor.
The orientation efficiency factor
was determined according to Equation (6):
where
denotes the fraction of fibers belonging to orientation sector
, and
is the corresponding three-dimensional fiber orientation angle relative to the loading direction.
The orientation factor
accounts for deviations from ideal unidirectional fiber alignment and was determined experimentally from the measured fiber orientation state of the injection-molded specimens. The individual length efficiency factor
describes the reduced reinforcing effect of a discontinuous fiber of length
. For model evaluation, the experimentally measured fiber population was represented by the effective global factor
, obtained by length-weighted averaging of the individual Cox factors calculated for the measured fiber lengths. Although this model has been widely applied to short-fiber composites, it does not explicitly account for differences in fiber–matrix adhesion. In its conventional form, interfacial load transfer is only considered implicitly through the geometric efficiency terms. In different forms, this model framework has been widely used for stiffness estimation in discontinuous fiber composites [
3,
4,
5,
7,
8,
9,
11,
43]. The experimentally determined orientation and length descriptors were inserted into Equations (2)–(6) and subsequently used in the stiffness prediction according to Equation (1).
3.2. Adhesion-Based Extension of the Cox–Krenchel Model
To account for differences in interfacial compatibility between the investigated fiber–polymer systems, the classical Cox–Krenchel model was extended by introducing an additional adhesion efficiency factor, .
In the present context, the term adhesion is not used in a fracture-mechanical sense of interfacial debonding, sliding, or pull-out, which are more directly related to composite strength and failure. Instead, the proposed interface-related factor is intended to represent differences in the efficiency of elastic stress transfer in the small-strain regime while the interface is still macroscopically intact. Such differences may arise, for example, from incomplete molecular-scale contact established during wetting and solidification, interfacial microvoids or poorly wetted regions, a compliant interphase of altered local structure, or relaxation effects associated with residual thermal stresses. Any of these effects can reduce the effective stiffness contribution of the fibers without requiring visible interfacial failure. Within this interpretation, surface-energy-based interfacial compatibility is not treated as a direct mechanical strength parameter, but as a physically motivated descriptor of interface states that may influence the elastic load-transfer efficiency.
The conceptual basis for such an interface-related efficiency term can be linked to established adhesion theories emphasizing the role of intermolecular interactions, wetting, and interfacial energetics in load transfer across bonded material combinations [
21,
22,
23,
24,
25,
32,
33,
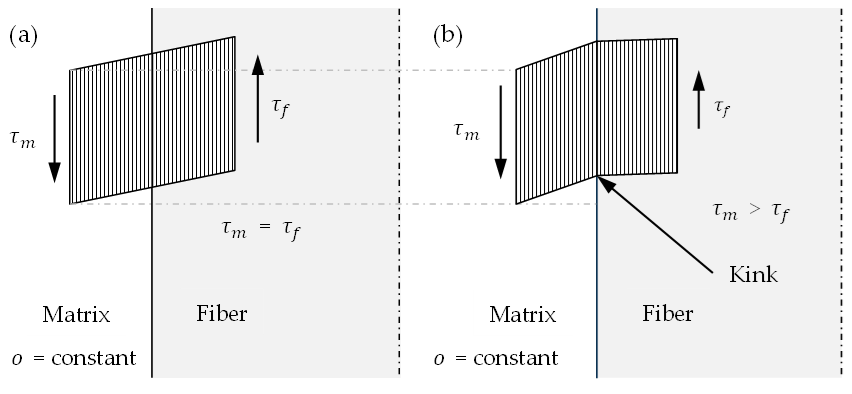
41]. The physical motivation for the additional adhesion efficiency factor is illustrated schematically in
Figure 3.
The schematic emphasizes that non-ideal interfacial compatibility does not change the intrinsic fiber stiffness but reduces the effectively transferable elastic contribution. This reduction is conceived here as an interphase- or contact-quality effect in the intact elastic regime, not because of fully developed interfacial failure. The introduction of does not replace the geometric efficiency factors but complements them by incorporating an interface-related contribution. In this way, fiber orientation, fiber length, and interfacial compatibility are treated as distinct but interacting influences on stiffness development.
3.3. Calculation of the Adhesion Efficiency Factor
In the present study, the adhesion efficiency factor was related to the thermodynamic compatibility of the fiber and matrix as described by their interfacial tension
.
Interfacial tension was chosen as the descriptor because it combines the polar and dispersive surface-tension contributions of both constituents into a single physically interpretable measure of compatibility. Lower interfacial tension was interpreted as indicating more favorable interaction between the fiber and matrix, and consequently, a higher efficiency of elastic load transfer.
To obtain the functional form of the adhesion efficiency factor, an incremental attenuation assumption was adopted. Specifically, it was assumed that an incremental increase in normalized interfacial incompatibility reduces a constant fraction of the remaining transferable elastic fiber contribution. This assumption can be written as:
where
denotes the remaining effective elastic contribution of the fiber phase under non-ideal interfacial conditions,
is the interfacial tension between the fiber and matrix,
is the total surface tension of the polymer phase, and
is a proportionality constant. Integration of Equation (8) from the idealized reference state (
at
) to the actual state (
at
) gives Equation (9):
and therefore
An alternative first-order assumption would lead to the linear relation given in Equation (11):
Over the comparatively narrow range of normalized interfacial-tension values covered by the present dataset, the linear and exponential forms differed only modestly. The exponential form was retained because it ensures positive efficiency factors, provides a compact attenuation law, and is consistent with the above incremental interpretation. The present dataset, however, does not yet allow for strong discrimination between these alternative functional forms.
Normalization by the polymer surface tension was introduced because within the present micromechanical interpretation, the matrix phase is the phase from which load is transferred into the reinforcement. The normalization therefore provides a matrix-referenced dimensionless compatibility measure that remains comparable across the investigated polymer systems. This choice is physically motivated but not unique; alternative normalizations based on other interfacial energy measures may also be considered in future work. In this interpretation, the attenuation law does not imply interfacial failure in the modulus-determination regime. Rather, it represents an effective reduction in elastic stress-transfer efficiency associated with interfacial contact quality and interphase-related effects.
By introducing the adhesion efficiency factor from Equation (10) into the classical Cox–Krenchel framework of Equation (1), the extended stiffness model becomes Equation (12):
This formulation retains the established contributions of fiber volume fraction, fiber length, and fiber orientation while additionally accounting for reduced elastic load transfer due to incomplete physical adhesion at the fiber–matrix interface. Interfacial tension is thus used as a comparative descriptor of relative interfacial quality within a unified modeling framework.
Equation (10) shows the expected limiting behavior of the proposed adhesion efficiency factor. For an idealized interface with , , so that the classical Cox–Krenchel model is recovered. With increasing interfacial tension, decreases monotonically and correspondingly reduces the transferable fiber-related stiffness contribution. In the limiting case , Equation (12) approaches , meaning that the fiber phase no longer contributes effectively to elastic reinforcement. This limiting case should be interpreted as a mathematical boundary of the model rather than as a literal physical description of real composites.
3.4. Evaluation of Model Accuracy
The predictive performance of the classical formulation given by Equation (1) and of the adhesion-extended formulation given by Equation (12) was assessed by comparison with the experimental tensile-test results. For each investigated material system, the same constituent and morphology inputs were used in both model variants, while the adhesion efficiency factor was included only in the extended formulation. This procedure enabled the isolated effect of the interface-related model extension to be evaluated without changing the geometric basis of the Cox–Krenchel description. Model performance was assessed using absolute and relative prediction errors between the predicted and measured Young’s modulus values. In addition, averaged error measures across all condition-specific data points were used where appropriate to compare the overall predictive quality of the two model formulations. The comparison was intended to determine whether the inclusion of interfacial tension as an additional descriptor improves stiffness prediction for short-fiber-reinforced thermoplastics with different fiber–matrix combinations. Both model variants were evaluated using identical constituent and morphology inputs.
4. Results
4.1. Mechanical Properties of Neat Polymers and Composites
Tensile testing according to DIN EN ISO 527-1 [
48] and DIN EN ISO 527-2 [
47] provided the experimental Young’s moduli used for subsequent model evaluation. The moduli of the neat polymers served as matrix input parameters for the analytical calculations, whereas the composite moduli were used as reference values for validating the classical and adhesion-extended Cox–Krenchel models. The experimentally determined matrix properties, together with the fiber properties used in the analytical calculations, are compiled in
Table 1.
Table 1.
Mechanical properties of the neat polymers and reinforcing fibers used as constituent input parameters for the stiffness prediction.
Table 1.
Mechanical properties of the neat polymers and reinforcing fibers used as constituent input parameters for the stiffness prediction.
| Material | Density
[g cm−3] | Tensile Strength [MPa] | Young’s Modulus [MPa] |
|---|
| PP (Borealis BC612WG) | 0.90 | 24.0 | 1093 |
PA 6.6
(Durethan A 30 S, dry) | 1.14 | 81.0 | 3782 |
| Basalt fiber | 2.67 | 3200 | 80,000 |
| E-glass fiber | 2.63 | 1803 | 72,200 |
The neat polymers showed markedly different stiffness levels. Polypropylene (PP, Borealis BC612WG) exhibited a Young’s modulus of 1093 MPa, while polyamide 6.6 (PA 6.6, Durethan A 30 S) reached 3782 MPa in the dry-conditioned state [
44]. Thus, PA 6.6 was approximately 3.5 times stiffer than PP. The reinforcing fibers showed substantially higher stiffness than both matrices. Basalt fibers exhibited a Young’s modulus of 80.0 GPa [
50] and E-glass fibers 72.2 GPa [
51], confirming their suitability as effective reinforcement phases for stiffness enhancement.
Table 2 summarizes the descriptive system-level mean Young’s moduli and the number of condition-specific mean values for each material system. The underlying condition-specific values are reported in
Supplementary Table S2. The reported system-level mean values are included for descriptive purposes only and were not used as the primary basis for model calibration or global error evaluation.
As shown in
Table 2, all investigated composites exhibited a clear stiffness increase relative to the respective neat polymer. For PP–BF at a target fiber volume fraction of 2.5%, the condition-specific mean modulus values ranged from 1927 to 2329 MPa. At a target fiber volume fraction of 7.5%, the corresponding range was 3370–3724 MPa. The PP–GF composites at 8.5 vol.% fiber content exhibited mean modulus values between 3454 and 3546 MPa. The highest stiffness values were obtained for PA–BF at 7.5 vol.% fiber content, with condition-specific mean values between 4760 and 4948 MPa.
The experimental scatter remained low for all investigated systems. The coefficient of variation ranged from 2.48% to 3.30% for PP–BF at 2.5 vol.%, from 1.23% to 1.28% for PP–BF at 7.5 vol.%, from 0.30% to 0.40% for PP–GF, and from 1.00% to 1.10% for PA–BF. This good reproducibility is important for the subsequent model assessment, as it allows deviations between the prediction and experiment to be attributed primarily to model limitations rather than to experimental uncertainty.
Overall, the measured stiffness values confirm the expected reinforcing effect of short fibers and reveal clear differences between the investigated material systems. These results provide the experimental basis for the following analysis of morphology-dependent reinforcement effects and for an evaluation of the proposed surface-energy-based model extension.
4.2. Fiber Morphology After Processing
Since the predictive capability of the Cox–Krenchel model depends strongly on the actual reinforcement morphology, the fiber volume fraction, fiber length, and fiber orientation were determined for the investigated composite systems after processing. These parameters were subsequently used as direct input variables for the stiffness calculations.
4.2.1. Fiber Volume Fraction
The fiber volume fractions determined by calcination partly deviated from the nominal target values and were therefore used in the model calculations instead of nominal contents. In particular, the PP–BF systems showed noticeable deviations from their nominal target values, whereas PP–GF and PA–BF were much closer to the intended reinforcement level (
Table 3).
For the PP–GF composites, the measured fiber volume fraction was 8.511 ± 0.09 vol.% based on 16 measurements and thus in very close agreement with the nominal value of 8.5 vol.%. Likewise, the PA–BF composites showed an average fiber volume fraction of 7.644 ± 0.03 vol.% based on 12 measurements, which was also close to the target value of 7.5 vol.%.
These results demonstrate that the actual reinforcement contents were sufficiently reproducible for model validation. At the same time, the deviations between nominal and measured fiber volume fraction confirm that experimentally determined values should be used in the analytical calculations rather than nominal target values.
4.2.2. Fiber Length
The fiber-length results obtained after compounding and injection molding are summarized in
Table 4. Since the model evaluation was based directly on the experimentally measured individual fiber lengths rather than on a single representative fiber length,
Table 4 reports the mean weight-average fiber length as a descriptive morphology parameter together with the corresponding effective Cox length efficiency factor
calculated from the measured fiber population by length-weighted averaging. As shown, the PP–BF composites retained the largest residual fiber lengths, whereas the shortest values were found for PA–BF. The reported weight-average fiber lengths serve only as descriptive morphology parameters, whereas the stiffness calculations were based on the effective length efficiency factor
derived from the individual measured fiber lengths by length-weighted averaging.
The longest weight-average fiber length was observed for PP–BF at 2.5 vol.%, with 1034 ± 142 µm, whereas the shortest value was measured for PA–BF at 7.5 vol.%, with 413 ± 40 µm. Despite these pronounced differences in residual fiber length, the resulting effective Cox factors lay within a comparatively narrow range. This reflects the fact that the Cox length efficiency factor is not determined by fiber length alone but also depends on the shear-lag parameter and thus on constituent and geometric model parameters.
The comparison of the two PP–BF compounds suggests that higher fiber content is associated with reduced residual fiber length, which can plausibly be attributed to intensified fiber–fiber interactions and increased fiber breakage during melt processing. Such a reduction in residual fiber length with increasing fiber content is consistent with earlier observations for compounded and injection-molded short-fiber thermoplastics [
1,
3]. Since fiber length directly affects the load transfer efficiency in short-fiber composites, these differences are expected to contribute to the observed variation in composite stiffness.
4.2.3. Fiber Orientation
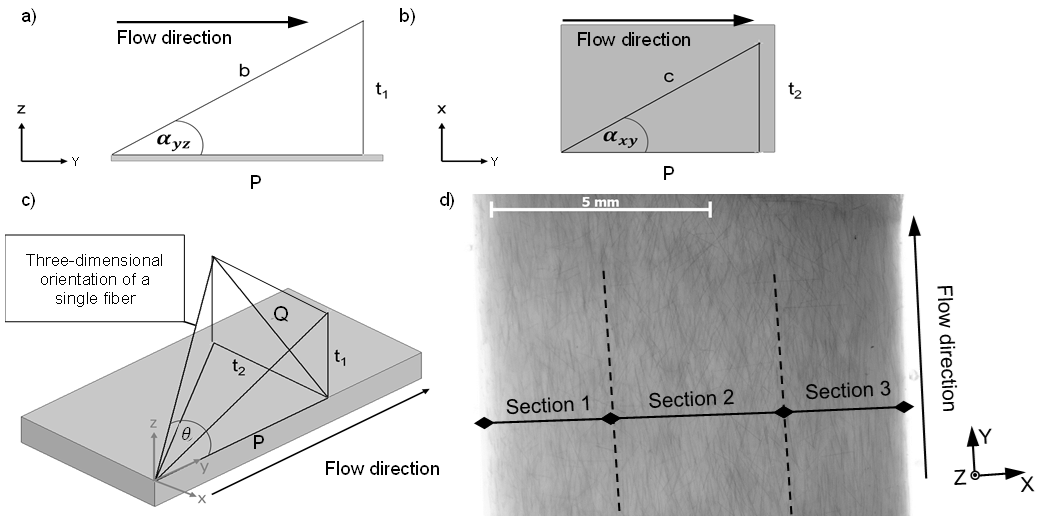
The fiber orientation factors were determined from at least 70 fibers per subsection and revealed clear differences between the investigated material systems (
Table 5).
PP–BF at 2.5 vol.% exhibited the highest orientation factor, whereas PA–BF showed the least favorable orientation state with respect to tensile loading. This difference is not attributed to mold geometry, which was identical for all materials, but to process-specific flow conditions during injection molding. In the PA–BF system, a spring-loaded shut-off nozzle was used. This nozzle configuration likely promoted stronger melt mixing and a more disturbed flow state immediately before entry into the mold cavity, thereby reducing the preferred alignment of fibers in the loading direction. At the same time, the altered flow history was associated with substantially shorter residual fiber lengths. The comparatively low global orientation factor of PA–BF should therefore be interpreted as a process- and morphology-related outcome rather than as an anomalous measurement. Such differences are highly relevant for stiffness prediction because the orientation factor directly scales the effective reinforcing contribution of the fibers within the Cox–Krenchel approach.
4.2.4. Fiber Dispersion
Microscopic inspection did not reveal pronounced fiber agglomeration or fiber-free regions in the investigated compounds. The fiber distribution was therefore considered sufficiently homogeneous for application of the analytical model. This observation is relevant because significant dispersion defects could reduce the measured stiffness independently of fiber length, orientation, or interfacial adhesion.
Overall, the morphological characterization shows that the investigated composite systems differed not only in constituent properties, but also in their effective reinforcement state after processing. Fiber volume fraction, fiber length, and fiber orientation all varied systematically between the materials and therefore had to be considered explicitly in the subsequent stiffness prediction. At the same time, the absence of major dispersion defects supports the interpretation that remaining deviations between the calculated and experimental Young’s moduli are mainly related to model limitations, including the description of interfacial load transfer.
4.3. Surface-Tension Components and Interfacial Tension
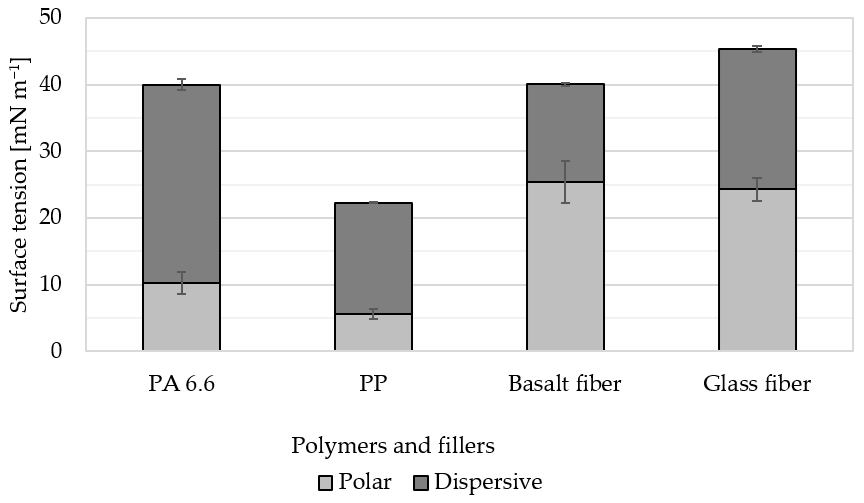
To assess the thermodynamic compatibility between the matrix and fiber, the polar and dispersive components of surface tension were determined at 23 °C for all investigated constituents and subsequently used to calculate the interfacial tension according to the Owens–Wendt approach. Exact numerical values of the measured surface-tension components are provided in
Table 6, while the comparative trends are illustrated in
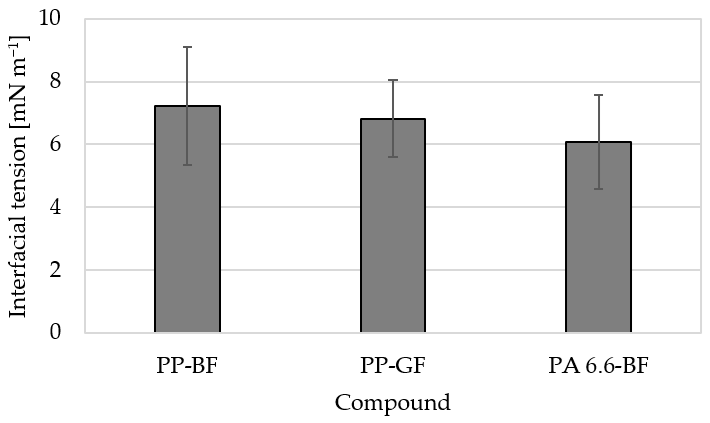
Figure 4.
As shown in
Table 6, PA 6.6 exhibited substantially higher polar and dispersive contributions than PP, while both mineral fibers showed pronounced polar surface character. These differences indicate marked variation in the interaction potential of the investigated constituents.
These results provide the basis for the subsequent calculation of interfacial tension.
Based on the measured surface-tension components, the corresponding interfacial tension values were calculated using Equation (7). The resulting values are listed in
Table 7 and compared graphically in
Figure 5.
As shown in
Table 7, the PP-based systems exhibited higher interfacial tension than the PA-based system. Among the investigated combinations, PP–BF showed the highest interfacial tension, whereas PA–BF showed the lowest value. Because both approaches yielded the same ranking of material systems, and because the OWRK-based values showed lower standard deviations, the following analysis focused on the OWRK parameter set. Additionally, the OWRK combining rule was retained as the primary basis of the present analysis because the surface characterization of all constituents was consistently performed within the Owens–Wendt–Rabel–Kaelble framework, in which the total surface tension is decomposed into dispersive and polar components and interfacial tension is derived from the same component set. Using the OWRK relation for both component determination and interfacial-tension calculation therefore provides a methodologically consistent description. The harmonic-mean rule according to Wu was evaluated additionally as a robustness check.
Figure 5 shows the calculated OWRK-interfacial tension
for the three fiber–polymer combinations. On average, the PP-based systems lay at higher
than the PA-based system, which would be consistent with less favorable wettability and potentially reduced elastic load transfer. However, the observed differences were small relative to their propagated uncertainty. The
values should therefore not be interpreted as sharply separated deterministic quantities, but rather as trend-level descriptors of relative interfacial compatibility within the present dataset.
Despite this limited statistical separation, the surface-energy-based descriptor remains a physically motivated, independently measurable quantity that supplements the classical morphology parameters. It therefore provides the rationale for introducing an adhesion efficiency factor into the Cox–Krenchel framework, as developed in the following sections.
4.4. Prediction of Young’s Modulus by the Classical Cox–Krenchel Model
The Young’s modulus of the investigated short-fiber-reinforced composites was first predicted using the classical Cox–Krenchel model. A key methodological aspect of the present study is that all morphology-dependent model inputs were determined experimentally from the processed specimens rather than being assumed from nominal or idealized values. The model combines the rule of mixtures with efficiency factors that account for finite fiber length and non-ideal fiber orientation in the composite. Accordingly, the predictions were based on experimentally determined material and morphology data, including matrix modulus, fiber modulus, fiber volume fraction, experimentally determined individual fiber lengths incorporated through the effective length efficiency factor
, and orientation factor, so that the calculated values reflect the actual microstructural characteristics of the investigated injection-molded composites. This pattern is consistent with previous reports showing that Cox–Krenchel-type approaches can provide good agreement for some systems but substantial overestimation for others, depending on morphology and interface quality [
3,
6,
8,
9,
11,
43]. The Young’s moduli shown in
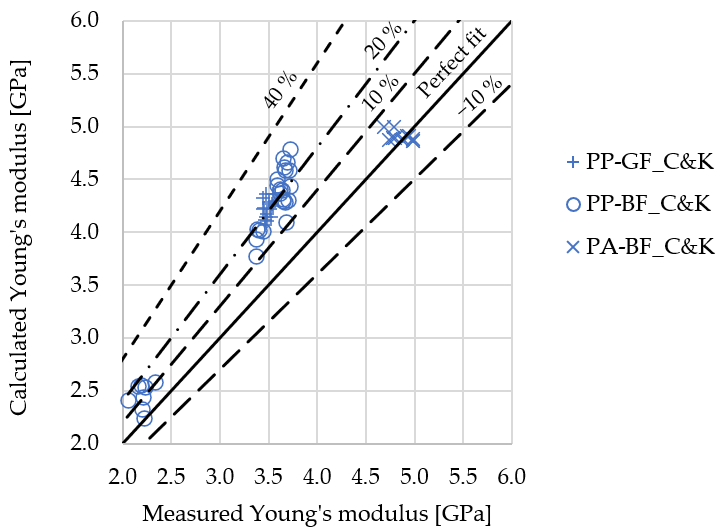
Figure 6 were predicted using the classical Cox–Krenchel formulation given by Equation (1), together with the experimentally determined efficiency factors from Equations (2)–(6).
As shown in
Figure 6, the classical Cox–Krenchel model reproduced the stiffness of the PA-based composite with high accuracy but showed noticeable deviations for the PP-based systems. For the PA–BF material, the experimentally measured Young’s modulus amounted to 4.86 GPa on average, whereas the model predicted a mean value of 4.87 GPa. This corresponded to a slight overestimation of only about 0.1%, indicating that the classical model was well-suited to describe the reinforcing effect in this material system.
A different trend was observed for the PP-based compounds. For PP–BF at a fiber content of 7.5 vol.%, the measured modulus averaged 3.60 GPa, while the Cox–Krenchel model predicted 4.35 GPa. The resulting overestimation of approximately 20.8% indicates that the classical formulation considerably overpredicted the effective reinforcement contribution in this case. A similarly pronounced deviation was obtained for PP–GF, for which the measured mean modulus was 3.49 GPa and the predicted mean modulus was 4.22 GPa, corresponding to an overestimation of about 20.9%.
For PP–BF at the lower fiber content of 2.5 vol.%, the agreement between the experiment and model was better, although the predicted stiffness remained above the measured value. Here, the experimental modulus averaged 2.13 GPa, whereas the model yielded 2.38 GPa, corresponding to an overestimation of approximately 11.7%. This suggests that the prediction deviation of the classical model became more pronounced with increasing reinforcement content in the PP-based systems.
These results indicate that the classical Cox–Krenchel model captured the fundamental reinforcing effect of short fibers but did not describe all stiffness-relevant mechanisms equally well for all matrix–fiber combinations. Since the model explicitly considers fiber content, fiber stiffness, fiber length, and fiber orientation, the remaining discrepancies must be attributed to factors beyond purely geometric and morphological reinforcement. In particular, the model assumes ideal stress transfer between the matrix and fiber and therefore does not explicitly account for differences in interfacial adhesion.
This interpretation is consistent with the surface-tension analysis presented in the previous section. The PP-based systems showed higher interfacial tensions than the PA-based systems, indicating less favorable thermodynamic compatibility between the matrix and reinforcement. Under such conditions, the actual load transfer from the matrix to fiber may be less efficient than assumed by the classical Cox–Krenchel model, leading to an overestimation of composite stiffness. In contrast, the comparatively low interfacial tension of the PA–BF system agrees with the good predictive accuracy obtained for this material combination.
Overall, the classical Cox–Krenchel model can be regarded as a suitable first-order approximation for predicting the Young’s modulus of short-fiber-reinforced thermoplastics. However, the systematic overestimation observed for the PP-based systems shows that morphology-related parameters alone are not sufficient to fully describe the effective reinforcement. This provides the rationale for introducing an additional adhesion-related correction term in the following section to improve modulus prediction across different matrix–fiber combinations.
4.5. Sensitivity Analysis of the Classical and Adhesion-Extended Model
A sensitivity analysis was performed primarily for the classical Cox–Krenchel model to assess whether the remaining deviations between the experiment and model could be explained solely by uncertainty in the input parameters. For the adhesion-extended model, the role of the additional interface-related term was assessed separately in terms of its effect on the predicted modulus.
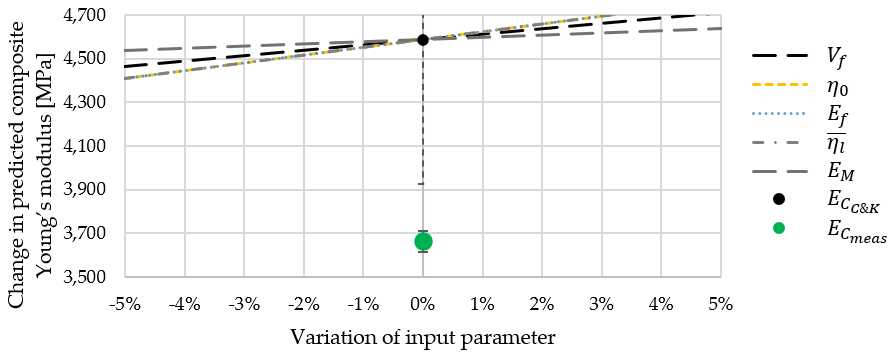
As a representative case, a PP–BF composite condition from the 7.5% content dataset (condition: PP–BF–7.5–2) was selected, for which the experimentally measured Young’s modulus was 3663 MPa and the corresponding classical Cox–Krenchel prediction was 4587 MPa. Each input parameter was then varied individually by ±5% around its reference value while all other parameters were kept constant. The resulting change in predicted Young’s modulus was used to compare the relative influence of the different inputs. This approach provides a first-order estimate of model sensitivity and allows the dominant parameters to be identified transparently. In addition, it allows for an assessment of whether plausible uncertainty in the experimentally determined inputs is sufficient to account for the discrepancy between the measured and predicted modulus.
The results showed that the prediction was most sensitive to fiber orientation factor, fiber modulus, and the effective length efficiency factor
, followed by fiber volume content and matrix modulus. The ±5% variation was not intended as a formal uncertainty quantification, but as a simple local sensitivity test using a common perturbation magnitude for a comparative ranking of parameter influence. The predicted modulus changed by at most 3.89% for the length efficiency factor and by at least 1.11% for polymer modulus. Thus, even the most influential individual input parameter did not account for the full discrepancy between the measured and classically predicted modulus. The relative influence of the individual parameters is summarized in
Figure 7.
Importantly, the analysis indicated that realistic variation of the classical input parameters alone was not sufficient to explain the systematic overestimation observed for the PP-based systems. In the representative case considered here, the minimum predicted modulus obtained within the estimated uncertainty range of one parameter was 4408 MPa, which remained about 17% above the measured value. Even when all input parameters were shifted simultaneously in the direction of lower predicted stiffness, the predicted modulus remained 3926 MPa, and thus exceeded the experimental value by 7.7%. The deviations are therefore not plausibly explained by measurement scatter alone. Instead, the results indicate that at least one additional systematic influence is not captured by the classical formulation and are consistent with an interface-related contribution.
For the adhesion-extended model, the additional interface-related term modified the prediction only moderately because the calculated adhesion efficiency factors remained within a relatively narrow range. Nevertheless, its inclusion systematically reduced the material-dependent bias of the classical model, especially for the PP-based systems. Overall, the sensitivity analysis confirms that morphology remains the dominant basis of stiffness prediction, while the remaining systematic deviation is consistent with an additional interface-related contribution.
4.6. Improvement by the Adhesion-Extended Model
To account for interfacial effects that are not captured by fiber content, fiber length, and fiber orientation alone, the Cox–Krenchel model was extended by the adhesion efficiency factor introduced in
Section 3. This factor was derived from the interfacial tension between the fiber and matrix and incorporated as an additional multiplicative term acting on the fiber-related stiffness contribution. The
values listed in
Table 7 were used directly to calculate the adhesion efficiency factors in
Table 8, the corresponding modulus predictions in
Table 9. The lowest adhesion efficiency factors were obtained for the PP-based systems, whereas the PA-based system exhibited the highest value, in agreement with the surface-tension analysis. Accordingly, within the present dataset, the adhesion-related correction was strongest for those composites that also showed the largest overestimation by the classical Cox–Krenchel model.
Because the adhesion efficiency factor depends only on the matrix–fiber combination through , the same value was used for both PP–BF systems despite their different fiber volume fractions.
The standard deviations of the calculated interfacial tensions were additionally propagated through Equation (10) to estimate the uncertainty of the adhesion efficiency factor. The resulting propagated standard deviations of
are included in
Table 8. Because the differences in
were moderate relative to their uncertainty, the resulting
values should be interpreted primarily as trend-level descriptors of relative interfacial compatibility rather than as sharply separated deterministic quantities.
The inclusion of this additional factor reduced the predicted Young’s moduli of all investigated composites relative to the classical Cox–Krenchel predictions. As a result, the agreement between the prediction and experiment improved substantially, particularly for the PP-based compounds.
For descriptive comparison,
Table 9 summarizes the measured and predicted system-level mean Young’s moduli. Calibration of ω and all global error metrics, however, was performed on the full set of 55 condition-specific data points.
As shown in
Table 9, the improvement was most pronounced for the PP-based systems, for which the classical Cox–Krenchel model had produced the largest overestimations. For PP–BF at 7.5 vol.% and for PP–GF, the deviation was reduced from about 20–21% to values close to zero or only a few percent. In contrast, only a minor correction was required for PA–BF, where the classical prediction was already in close agreement with the experiment. For PP–BF at 2.5 vol.%, the extended model also improved agreement, although the absolute correction remained comparatively small. In the cases where the adhesion-extended model yielded a slight underprediction, the deviation remained modest relative to the previous overestimation of the classical model.
For additional reference, a one-parameter constant-factor null model was also evaluated, in which the fiber-related stiffness contribution of the classical Cox–Krenchel model was scaled by a global reduction factor c independent of the interfacial-tension data:
Thus, both the adhesion-extended model and the null model introduce one fitted parameter and can be compared directly on the same data basis.
To assess robustness with respect to material-system transferability, a grouped leave-one-material-system-out cross-validation was performed for both one-parameter model extensions on the same condition-specific dataset. In each fold, one complete material system was excluded from calibration, the corresponding parameter (
or
) was fitted on the remaining systems, and the held-out system was then predicted on condition level. Because this validation removes entire material-system groups from the training data, it provides a stricter robustness test than pointwise resampling. The corresponding results are summarized in
Table 10.
Because the cross-validation was carried out by excluding complete material-system groups rather than individual data points, the fold-specific values of ω and
reported in
Table 10 are not expected to be identical to the globally calibrated parameter. Instead, they indicate how sensitively the fitted correction depends on the inclusion of a given material system and how well the model transfers to previously unseen material-system classes on condition level. Given the limited number of distinct material systems, this grouped cross-validation should be regarded as a robustness check rather than as full external validation.
Table 10 shows that both one-parameter extensions were reasonably stable under grouped cross-validation. In most folds, the adhesion-extended model and the constant-factor null model gave similarly good predictions, whereas for the PA–BF hold-out case, the adhesion-extended model performed more accurately.
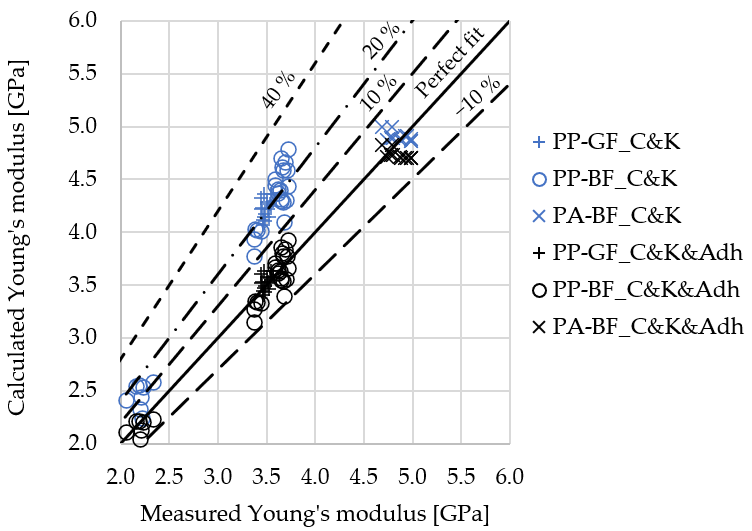
The corresponding improvement in predictive accuracy is also visualized in
Figure 8, which compares the measured Young’s moduli with the predictions of the classical and adhesion-extended Cox–Krenchel models.
In
Figure 8, the predictions of the classical Cox–Krenchel model lay systematically above the ideal parity line for the PP-based systems, whereas the adhesion-extended predictions shifted closer to the diagonal; only minor changes were observed for PA–BF. This behavior indicates that the proposed interfacial correction not only reduces the average error, but also improves the consistency of prediction across different material systems.
This overall improvement is also reflected in the global error metrics summarized in
Table 11.
Table 11.
Global prediction errors of the classical, constant-factor null, and adhesion-extended Cox–Krenchel models.
Table 11.
Global prediction errors of the classical, constant-factor null, and adhesion-extended Cox–Krenchel models.
Model
Formulation | MAE
[MPa] | RMSE
[MPa] | MAPE
[%] | Maximum Relative Deviation [%] |
|---|
| Classical Cox–Krenchel model | 573.8 | 640.6 | 14.16 | 28.92 |
| Constant-factor null model | 106.5 | 146.9 | 3.05 | 10.47 |
| Adhesion-extended Cox–Krenchel model | 94.0 | 121.2 | 2.74 | 10.96 |
Compared with the classical formulation, both one-parameter extensions substantially reduced MAE, RMSE, MAPE, and the maximum relative deviation on the full dataset of 55 condition-specific data points. The adhesion-extended model yielded the lowest MAE, RMSE, and MAPE overall, while the constant-factor null model showed a slightly lower maximum relative deviation. The comparison therefore indicates that part of the residual error of the classical Cox–Krenchel model can already be reduced by a simple global scaling of the fiber contribution, but that the interfacial-tension-based formulation provides the better overall description on the present dataset. At the same time, because both extensions were calibrated on the same dataset and only a limited number of material systems is available, this advantage should be interpreted as promising rather than definitive. Broader validation across additional matrix–fiber combinations will be required to determine whether the physically motivated adhesion-based formulation provides a robust predictive advantage beyond a purely empirical global reduction factor.
4.7. Exploratory Comparison with Independent Literature Data
To examine whether the proposed adhesion-based extension is at least qualitatively transferable beyond the present in-house dataset, an additional exploratory comparison was carried out using independent literature data reported by Liu [
43] for PA 6 composites reinforced with basalt fibers of different surface states. This literature-based comparison was kept separate from the calibration and condition-level validation performed on the in-house dataset and is intended as a limited plausibility check rather than as a formal external validation. The case was selected because it provides not only composite Young’s modulus values, but also the constituent, morphology, and surface-tension data required for application of the classical and adhesion-extended Cox–Krenchel formulations.
The dispersive and polar surface-tension components reported by Liu [
43] for the basalt-fiber surface states were combined with the literature surface-tension values for PA 6 from Milani [
44] to calculate the corresponding interfacial tensions and adhesion efficiency factors according to Equations (7) and (10). The resulting interface descriptors are summarized in
Table 12. Among the surface states reported by Liu [
43], complete modulus-related input data for the present comparison were available for the
-desized fibers and for the
-desized + APS/EP-treated fibers.
Using the constituent and morphology parameters reported by Liu [
43], namely fiber volume fraction, characteristic fiber length, orientation factor, fiber radius, and constituent moduli, the composite Young’s modulus was then calculated with both the classical and adhesion-extended Cox–Krenchel formulations. The corresponding predictions and prediction deviations from the literature-reported modulus values are listed in
Table 13.
As shown in
Table 13, both literature cases exhibited very low calculated interfacial tensions and correspondingly high adhesion efficiency factors close to unity. This is consistent with the expectation that PA-based systems with comparatively favorable thermodynamic compatibility require only a small interface-related correction. Accordingly, the adhesion-extended model changed the classical prediction only moderately.
For the -desized basalt-fiber case, the classical Cox–Krenchel model overpredicted the reported modulus by 14.5%, whereas inclusion of the adhesion efficiency factor reduced the relative prediction error to 12.2%. For the -desized + APS/EP-treated fibers, the relative prediction error was reduced from 6.7% to 4.5%. Thus, the adhesion-based correction improved agreement in both literature cases, although the improvement remained comparatively small because the calculated values were already close to one.
At the same time, the two literature cases showed only a small difference in calculated interfacial tension and adhesion efficiency factor, with
for the
-desized fibers and
for the
-desized + APS/EP-treated fibers. This is consistent with the comparatively small difference in the reported composite modulus between the two variants. In this sense, the external comparison reproduces the direction and magnitude of only a modest interface-related effect rather than a strong separation between surface states.
Overall, this independent literature comparison does not replace broader external validation across a larger and more diverse dataset. Nevertheless, it supports the plausibility of the proposed interface-related model extension in an external PA 6/basalt-fiber case and indicates that the surface-energy-based correction can be transferred consistently to independently reported composite systems when compatible constituent and morphology data are available.
5. Discussion
The present results show that the Young’s modulus of short-fiber-reinforced thermoplastics cannot always be described sufficiently by constituent stiffness, fiber volume fraction, fiber length, and fiber orientation alone. Although these morphology-related quantities remain the primary determinants of stiffness and were determined experimentally in the present study, the predictive quality of the classical Cox–Krenchel model still varied systematically between material systems. In particular, the model described the PA–BF system with high accuracy, whereas it overpredicted the stiffness of the PP-based systems. Because the mechanical tests showed low scatter, the morphology input parameters were measured rather than assumed, and no pronounced fiber agglomeration or fiber-free regions were observed, the remaining deviation is most plausibly interpreted as a systematic model limitation rather than random experimental variability.
Within the classical Cox–Krenchel framework, the reinforcement efficiency of the fibers is reduced by two established mechanisms, namely finite fiber length and non-ideal orientation. Both effects were accounted for here using experimentally derived descriptors. Nevertheless, the sensitivity analysis showed that realistic variation of these classical input parameters was not sufficient to explain the systematic overestimation observed for the PP-based compounds. This supports the conclusion that an additional system-dependent factor influences the effective elastic stress transfer. The surface-tension analysis provides a plausible basis for such an interpretation, because the PP-based systems exhibited higher interfacial tension than the PA-based system and therefore less favorable thermodynamic compatibility within the present descriptor framework.
The incorporation of the adhesion efficiency factor improved agreement between the predicted and measured Young’s moduli, particularly for the PP-based materials. This is conceptually important because the proposed correction does not replace the classical micromechanical description but complements it. Fiber volume fraction, the effective Cox length efficiency factor derived from the measured fiber lengths, and fiber orientation remain the dominant structural descriptors, whereas the adhesion-related term acts as a secondary correction for system-dependent differences in effective load-transfer quality. In this sense, the present approach should be understood as an interface-sensitive refinement of the Cox–Krenchel model rather than as an alternative to morphology-based micromechanics.
Application of the harmonic-mean rule according to Wu yielded substantially higher absolute interfacial-tension values than the OWRK relation for all investigated systems, and consequently lower adhesion efficiency factors when the same value of ω was inserted. However, the ranking of the investigated fiber–polymer combinations was preserved. This indicates that the proposed interface-related descriptor is qualitatively robust with respect to the combining rule, although the absolute scale of and is rule-dependent. Accordingly, ω is not a universal material constant but a calibration parameter linked to the selected interfacial-tension formalism. To obtain adhesion efficiencies of comparable magnitude, the proportionality constant would have to be reduced from 0.8 to approximately 0.43, further confirming that is not a universal material constant but depends on the selected interfacial-tension formalism.
At the same time, the interpretation of the adhesion factor requires caution. The quantity used here is derived from surface-tension-based interfacial tension and is therefore a thermodynamic descriptor of compatibility rather than a direct mechanical measure of interfacial strength. The model does not imply that interfacial failure occurs during modulus determination. Instead, it assumes that less favorable interfacial compatibility can reduce the transferable elastic fiber contribution in the small-strain regime, for example, through incomplete molecular-scale contact, poorly wetted regions, interphase effects, or residual-stress-related imperfections. The proposed adhesion efficiency factor should therefore be regarded as a physically motivated effective parameter rather than as a complete mechanistic description of the interface.
This restriction is also relevant because the experimentally characterized fiber surface was the as-supplied commercial fiber surface including the manufacturer-applied sizing. From the standpoint of practical composites, this is appropriate, since the matrix interacts with the sized fiber rather than with the bare mineral substrate. At the same time, the present approach does not separate substrate effects from sizing chemistry. The effective interface descriptor therefore reflects the real matrix-facing reinforcement surface of the investigated commercial systems, but matrix-dependent differences in compatibility may partly arise from the applied sizing rather than from intrinsic basalt-versus-glass or polymer-versus-fiber polarity alone.
A further point concerns the statistical separation of the interface descriptor. Although the calculated interfacial tensions followed a physically plausible ranking, the absolute differences between systems were relatively small compared with their propagated uncertainty. Accordingly, the present dataset supports the interpretation that interfacial compatibility contributes to the residual model error, but it does not yet allow for strong claims about the robust discrimination of closely spaced adhesion states. The adhesion-related correction should therefore presently be viewed as a semi-empirical but physically interpretable parameterization whose broader discriminating power remains to be demonstrated.
The structure of the dataset imposes an additional limitation on interpretation. Although two matrices and two mineral fiber types were considered, only three out of the four possible matrix–fiber combinations were investigated experimentally. In particular, the PA 6.6–GF combination was not available. As a result, matrix identity and interfacial-tension level are not fully disentangled in the present dataset: both PP-based systems showed comparatively higher interfacial tension and were overpredicted by the classical model, whereas the single PA-based system showed lower interfacial tension and was described accurately. This pattern is consistent with an interface-related explanation, but it does not yet exclude alternative matrix-specific contributions, such as differences in neat-polymer versus in-composite matrix stiffness, crystallization effects, residual thermal stresses, or moisture-related influences in PA 6.6. Inclusion of the missing PA 6.6–GF combination would therefore be especially valuable in future work.
The proposed correction must also be considered in relation to model form. The exponential adhesion factor introduced here is physically motivated by an attenuation assumption, but it is not unique. Other functional forms, including simpler linear or constant-factor corrections, can also reduce prediction error on a limited dataset. Indeed, the present comparison with a one-parameter constant-factor null model shows that part of the improvement may be attributable to the introduction of an additional calibratable degree of freedom itself. The relevance of the present formulation therefore lies less in claiming universal superiority at this stage than in providing a correction term with an independent physical interpretation linked to measurable interfacial properties.
The range of applicability of the present model is further limited by the scope of the investigated materials. The study focused on comparatively low to moderate fiber volume fractions and on Young’s modulus under small-strain elastic loading. The proposed formulation was not developed for strength, failure strain, impact behavior, creep, or fatigue, where interfacial effects may involve debonding, frictional sliding, crack deflection, or damage accumulation. Extension of the present adhesion-related concept to strength-oriented micromechanical models, for example, Kelly–Tyson-type approaches for unidirectional composites, would therefore be an interesting subject for future work. Likewise, the present dataset covers only a modest range of interfacial-tension values, so the resulting adhesion efficiency factors varied within a comparatively narrow interval. Broader validation across higher reinforcement contents, additional polymer classes, different sizing systems, coupling-agent-modified interfaces, and wider interfacial-compatibility ranges will be necessary to assess the generality of the concept.
Another simplification concerns the thermodynamic basis of the interface descriptor itself. The interfacial tensions were calculated from surface-tension components determined at or referenced to standard conditions, whereas actual wetting and interface formation during compounding and injection molding occur in the molten state and depend on temperature, viscosity, pressure, and processing history. The present approach therefore does not resolve the full thermo-rheological complexity of interface formation. Rather, it assumes that room-temperature or literature-based surface-energy relations provide a sufficiently meaningful comparative descriptor of the resulting interface state. This approximation appears useful within the present systems, but it should be interpreted as a simplifying engineering assumption rather than a full process-resolved interface model.
Despite these limitations, the present approach has practical advantages. Surface-energy characterization is experimentally less demanding than many direct interface tests, and the proposed correction can be incorporated into an established analytical model without sacrificing transparency. Direct mechanical methods such as pull-out, fragmentation, or microbond testing remain highly valuable for targeted interface characterization, but they often require dedicated specimen concepts and are not always readily transferable across different material systems or processing states. In this context, the use of an interfacial-tension-based descriptor may offer a pragmatic route for comparative material screening and for first-order interface-sensitive stiffness assessment when only constituent and morphology data are available.
The additional exploratory comparison with independent literature data supports this interpretation, although only in a limited sense. The literature-based cases were not part of model calibration and therefore provide a useful plausibility check beyond the in-house dataset. However, they do not substitute for broader external validation, especially because the number of distinct material systems remains small. The grouped leave-one-material-system-out cross-validation likewise provides only an initial robustness check rather than definitive evidence of general transferability.
Taken together, the present findings suggest that interfacial compatibility does not replace morphology as the dominant basis of stiffness prediction, but it can provide a meaningful second-order descriptor for residual system-dependent error. The main contribution of this work is therefore not the proposal of a fully general interface law, but the demonstration that a physically interpretable, surface-energy-based correction can improve an established Cox–Krenchel-type description of short-fiber-reinforced thermoplastics. Future work should examine broader material combinations, include the missing PA 6.6–GF system, test alternative forms of the adhesion factor, relate surface-energy-based predictions more directly to independent mechanical interface measurements, and evaluate the transferability of the present concept to thermosetting matrix systems such as epoxy or unsaturated polyester reinforced with glass or carbon fibers.