1. Introduction
Fiber-reinforced polymers (FRPs) have gained significant relevance due to their high specific strength and stiffness [
1,
2,
3,
4,
5]. Glass Fiber-Reinforced Polymers (GFRPs) and carbon fiber-reinforced polymers (CFRPs) are widely used in sectors such as aerospace, automotive, and energy.
In parallel with material development, manufacturing technologies have evolved to optimize material usage, improve structural performance, and reduce waste. Filament Winding (FW) stands out as a highly efficient and automated process for producing axisymmetric composite structures, such as pipes and composite overwrapped pressure vessels (COPVs) [
6,
7,
8]. In this process, continuous fibers impregnated with a polymeric resin are wound under controlled tension onto a rotating mandrel, allowing precise control of fiber orientation and thickness distribution. As a result, FW enables the manufacture of lightweight structures with superior mechanical performance compared to traditional metallic solutions.
However, despite its advantages, the filament winding process inherently introduces manufacturing-induced variability. Factors such as fiber misalignment, variations in winding tension, resin distribution, void formation, and local fiber accumulation can lead to significant heterogeneities in the final material. These local variations may result in non-uniform mechanical behavior, including strain concentrations and premature damage initiation, which are not captured by nominal design parameters [
9,
10,
11,
12,
13].
Conventional mechanical characterization techniques, such as uniaxial tensile testing combined with extensometers or strain gauges, provide global material properties assuming homogeneous behavior. However, these approaches are limited in their ability to capture local strain variations and damage evolution, particularly in anisotropic and heterogeneous materials such as FRPs. Moreover, strain gauges only provide localized measurements and may not be representative of the overall deformation field, while their use requires careful placement and may be affected by external factors [
14,
15,
16].
In this context, Digital Image Correlation (DIC) has emerged as a powerful full-field, non-contact optical technique for measuring displacement and strain fields [
17,
18,
19]. By tracking the movement of a stochastic surface pattern during mechanical testing, DIC enables the characterization of spatial strain distributions with high resolution [
20,
21]. This capability makes it particularly suitable for analyzing heterogeneous materials and identifying localized deformation mechanisms that precede macroscopic failure.
Although DIC has been widely applied in the characterization of composite materials [
22,
23,
24], its use in the analysis of filament–wound CFRP structures remains limited, particularly in terms of systematically assessing both intra-specimen strain heterogeneity and inter-specimen variability. Understanding these aspects is essential for linking manufacturing-induced features with mechanical performance and improving the reliability of composite structures.
The primary objective of this work is to demonstrate the potential of DIC and its full-field measurement capabilities for the analysis of inherently heterogeneous and anisotropic materials. While DIC has been widely applied to standard aerospace laminates, its application as a statistical filtering tool to characterize the raw mechanical variability of filament–wound components remains scarce. By utilizing a fundamental and clean tensile testing configuration, this study isolates material-specific features from external testing artifacts. Consequently, the main contribution of this research is the development of an experimental-statistical framework that combines DIC-based local strain measurements with intra- and inter-specimen variability analysis, providing a clearer description of strain heterogeneity in filament–wound carbon fiber structures.
2. Materials and Methods
For this study, the filament winding manufacturing method was employed, using a combination of carbon fibre and epoxy resin. The resulting tube was then cut to produce longitudinal test specimens, enabling tensile tests to be carried out in conjunction with the DIC method to investigate their mechanical properties. A statistical analysis of the results obtained was subsequently performed.
2.1. Material and Manufacturing
The material selected was a combination of Toray© T300 3K (Toray Industries, Inc., Tokyo, Japan) carbon fibre, together with Sicomin© SR1500 (Sicomin America Inc., Torrance, CA, USA) resin and Sicomin© SD2505 (Sicomin America Inc., Torrance, CA, USA) hardener. The main characteristics of these components are shown in
Table 1. The specimens were allowed to gel at room temperature, followed by a controlled thermal post-curing cycle in an oven at 50 °C for 24 h to ensure full crosslink density, maximum glass transition temperature, and stable mechanical properties prior to testing.
It should be noted that the thickness of the fibre is 1 mm, and a 33% hardener was used. The process involved manufacturing 140 mm long tubes using a mandrel with a diameter of 93 mm. The rotation speed was 20 rpm, with an orientation of 45°. Two layers were applied and the curing time was 1 day at 25 °C. The resulting carbon fiber composite tube features a 2-layer symmetric layup with a nominal single-wall thickness of approximately 2 mm. Specimens extracted from these tubes maintained this 2 mm thickness, ensuring a standard fiber volume fraction without excessive resin accumulation.
2.2. Specimen Preparation
Before specimen extraction, the filament–wound tube was subjected to dimensional quality control in order to verify its global geometrical conformity. Cylindricity and curvature were evaluated with respect to the standard, ASTM D3567 [
25]. Therefore, the tested specimens were extracted from a tube without relevant macroscopic geometrical deviations. These dimensional checks do not characterize local fibre architecture or resin distribution, but they reduce the likelihood that the observed differences in strain fields arise from global geometrical non-conformity of the original component.
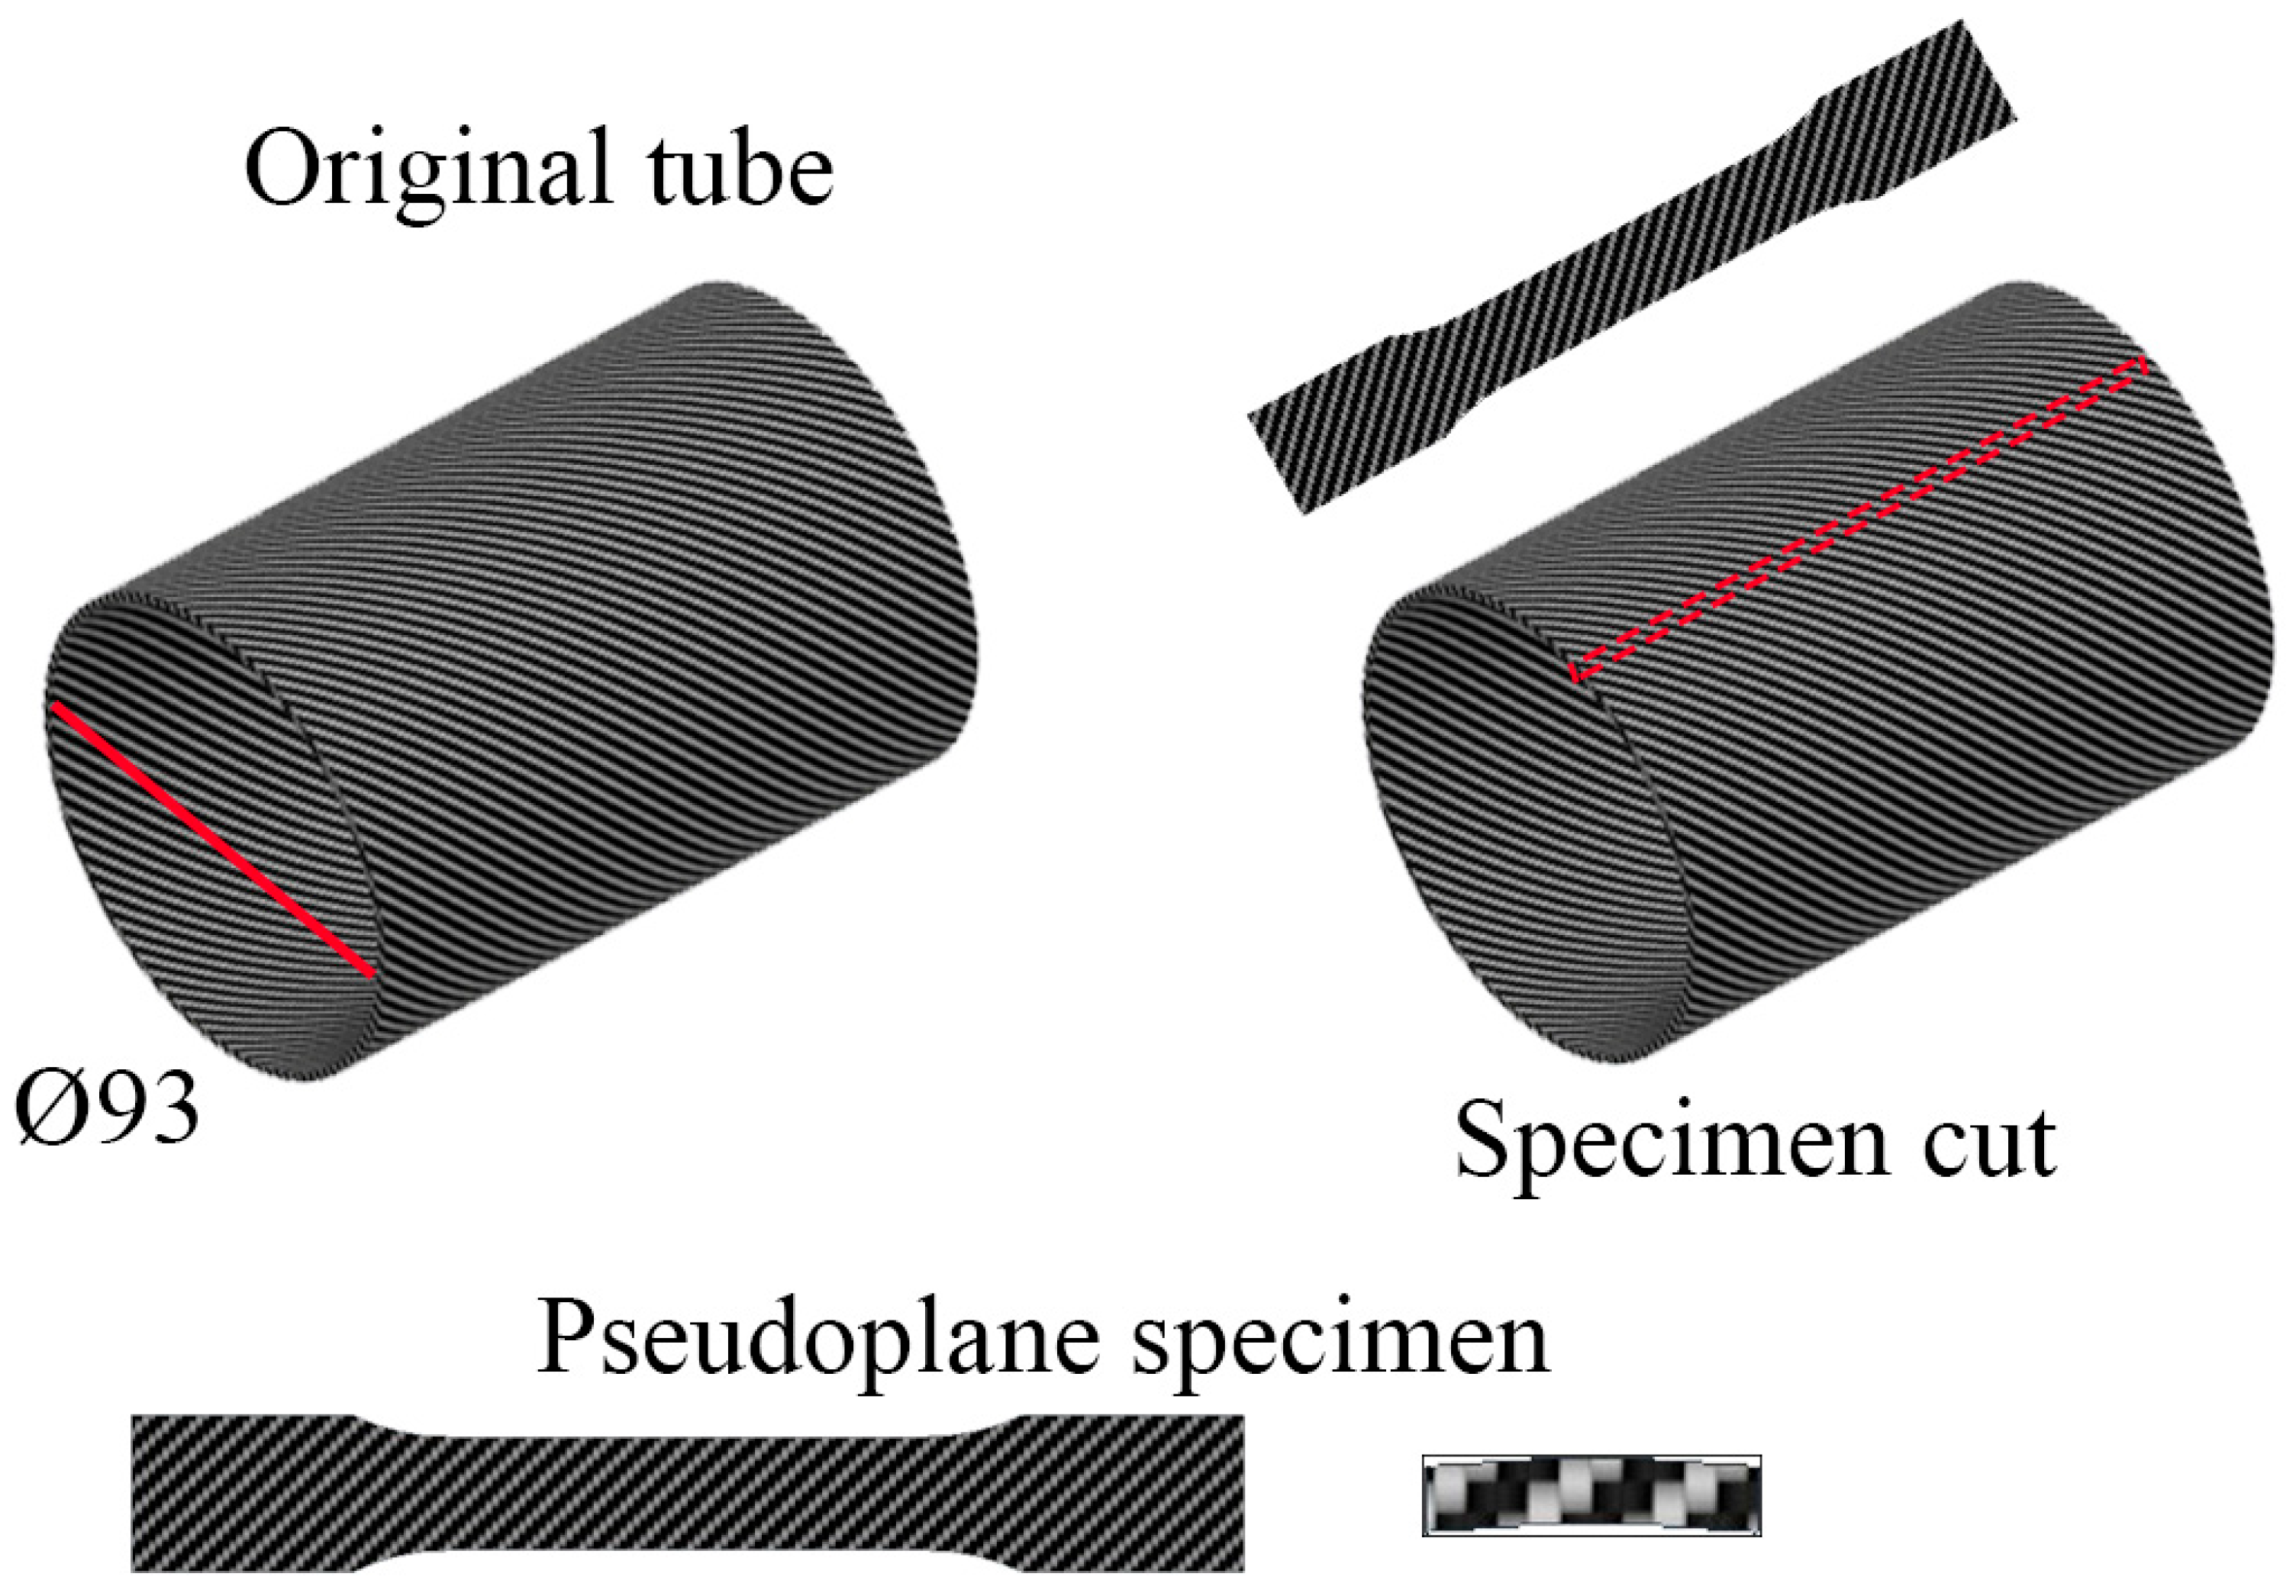
A total of 16 test specimens were produced by making a longitudinal cut in the tube, resulting in dog-bone-shaped specimens 10 mm wide at their widest point and 5 mm wide at their centre, with a length of 170 mm. The original tube has an internal diameter of 93 mm, but as the test specimens are so narrow in relation to this, this curvature is practically imperceptible, and the test specimens obtained by this manufacturing process can be considered pseudo-flat. This process is shown in
Figure 1.
All the specimens have been prepared so that the speckle pattern can be applied to each one, enabling the use of the DIC technique. This pattern is explained in a later section, but it should be noted that the surface treatment was minimal, consisting simply of painting the specimens white to prevent glare and standardise the colour in order to improve contrast.
Specimens were extracted from the original filament–wound tubes using a precision CNC laser cutting system. This method minimizes edge defects, such as local delamination or fiber fraying, which are common when using traditional mechanical cutting discs. Due to the curved profile of the tube segments, straight-sided rectangular specimens were used. Prior to testing, the width and thickness of each specimen were measured using a digital metrological caliper with a resolution of 0.01 mm and a manufacturer-specified accuracy of ±0.02 mm. To reduce the influence of local surface irregularities and manual positioning, each dimensional measurement was repeated three times at the gauge section, and the average value was used to calculate the cross-sectional area employed in the stress calculation. The standard deviation of the three repeated measurements was retained as an estimate of dimensional repeatability and considered when interpreting the scatter in the mechanical properties.
Tensile tests were performed using a universal testing machine equipped with hydraulic grips that mechanically guaranteed strict coaxial alignment. Catastrophic failure occurred within the free gauge length between the grips for all validated specimens.
2.3. Tensile Testing Set Up
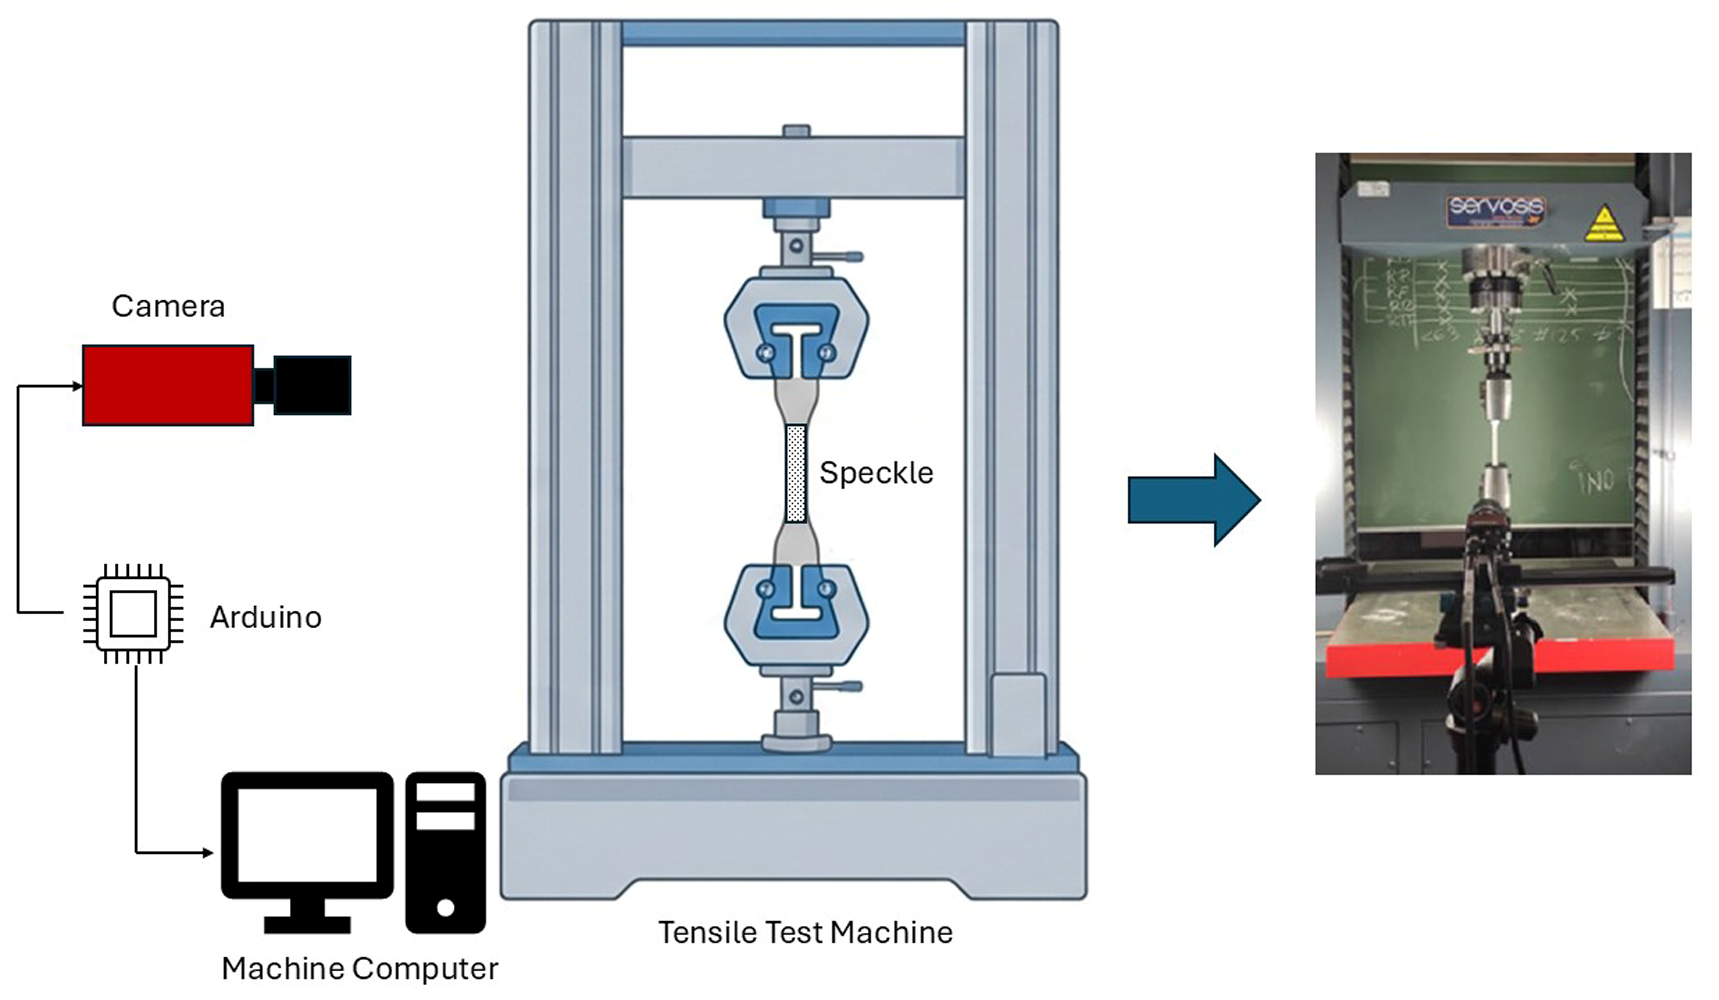
The machine used to carry out the tests was a Servosis© ME-405/50/5 electromechanical tensile testing machine, whose main technical specifications are as follows: maximum load of 500 kN, REP Transducer Type TC4 50 kN (REP S.r.l. Brescia, Italy) load cell, and MTS Model XSA304A (MTS Systems Corporation, Eden Prairie, MN, USA) grips. The test conditions were set at a constant displacement of 2 mm/min. In order to capture images for subsequent DIC processing, a system controlled by an Arduino© Uno (Arduino S.r.l., Turin, Italy) was used, which sends a signal to the camera as well as to the software controlling the machine, allowing the camera shutter to be synchronised at all times with the force and displacement readings from the test. The camera used is the Manta© G-504 (Manta Test Systems, Dayton, OH, USA), equipped with a Sony ICX 665 (Sony Semiconductor Solutions Corporation, Kanagawa, Japan) progressive monochrome CCD sensor, offering a resolution of 2452 × 2056 pixels, a pixel size of 3.45 × 3.45 μm, and a maximum frame rate of 9.2 frames per second at full resolution. The lens coupled to the camera has a focal length of 50 mm. In order to reduce image distortions, including radial and tangential effects, a self-calibration procedure based on the Brown–Conrady (Bendix Corporation, Southfield, MI, USA) model is implemented in the software. Image acquisition was set to one image every 2 s. The configuration diagram is shown in
Figure 2.
2.4. Digital Image Correlation (DIC)
This methodology is based on capturing a sequence of images in which an initial reference image—corresponding to the undeformed state of the specimen—is compared with subsequent images recorded during the test. This reference image serves as the baseline to directly quantify the displacements that occur throughout the experiment. Advances proposed by various authors, such as those reported by Blaber [
26], enable these comparisons to achieve subpixel accuracy, which, when combined with an appropriate camera–lens system, allows displacement measurements at near submicron resolution. However, the performance of Digital Image Correlation (DIC) algorithms strongly depends on the quality of the initial estimates obtained from whole-pixel search procedures. When displacements are excessively large or fall outside the predefined search domain, computational cost increases significantly and may even lead to convergence failure. In addition, measurement accuracy is influenced by experimental factors such as camera positioning, lighting conditions, colour temperature, the size of the Region of Interest (RoI), and the type of imaging device used.
The procedure begins by defining an RoI fully covered by a speckle pattern, which is then subdivided into smaller square subsets for analysis. The comparison between two consecutive images (i and i + 1) starts by locating the centroid of each subset in the reference image. A correlation criterion is then applied to identify the corresponding subset in the deformed image. Among the various correlation formulations available, this work employs the Zero-Mean Normalized Sum of Squared Differences (ZNSSD), defined in Equation (1), due to its robustness under non-uniform illumination. In this formulation, the correlation parameter depends on the pixel intensities of both the reference and deformed subsets, along with their respective mean values and standard deviations.
Displacements between consecutive images can initially be determined with pixel-level accuracy, while subpixel precision is achieved through grayscale interpolation. In this study, a Quintic B-spline interpolation scheme is adopted, as it has demonstrated superior performance in previous works. The optimization process is carried out using the Inverse-Compositional Gauss–Newton (IC-GN) algorithm, applied over the entire RoI. To reduce error propagation and improve computational efficiency, a reliability-guided DIC (RG-DIC) approach is implemented. This method searches for the minimum value of the correlation coefficient (CLS), defined in Equation (2), which represents a modified form of the ZNSSD criterion. All computations were performed using the open-source Ncorr toolbox within the Matlab
® (The MathWorks, Inc., Natick, MA, USA) environment.
For the experimental implementation, a speckle pattern was printed on paper using a high-resolution (1200 dpi) laser printer and subsequently transferred onto the specimen surface using a gel transfer technique (Medium Gel 190 Vallejo© (Vallejo, S.A., Barcelona, Spain)). The pattern was specifically designed to meet key requirements, including randomness, circular speckle geometry, and a coverage ratio between 40% and 70% of the surface. To evaluate its quality, the Mean Intensity Gradient (MIG) was used, resulting in a value of 5639. The pattern consists of a regular distribution of circular speckles characterized by two main parameters: the speckle diameter (0.324 mm) and the center-to-center spacing (0.432 mm), both selected based on prior studies. A Gaussian random factor was introduced to enhance randomness. The pattern was generated using a Matlab R2023a® script to ensure strict control of these characteristics. Finally, to optimize the Ground Sampling Distance (GSD), the camera was positioned at the minimum focusing distance of 100 cm, yielding a spatial resolution of 0.07 mm per pixel with the selected camera–lens configuration.
The accuracy, rigid-body motion compensation, and overall measurement reliability of this specific optical setup and correlation pipeline have been extensively validated in previous works across various structural testing applications [
27,
28,
29]. To guarantee the reliability of the reported strain fields, the static noise floor of the system was evaluated prior to testing under zero-load conditions. The baseline strain resolution was determined to be below ±0.005%, ensuring that the instrumental noise floor was negligible relative to the macroscopic and local strain levels recorded during the tensile tests up to catastrophic failure.
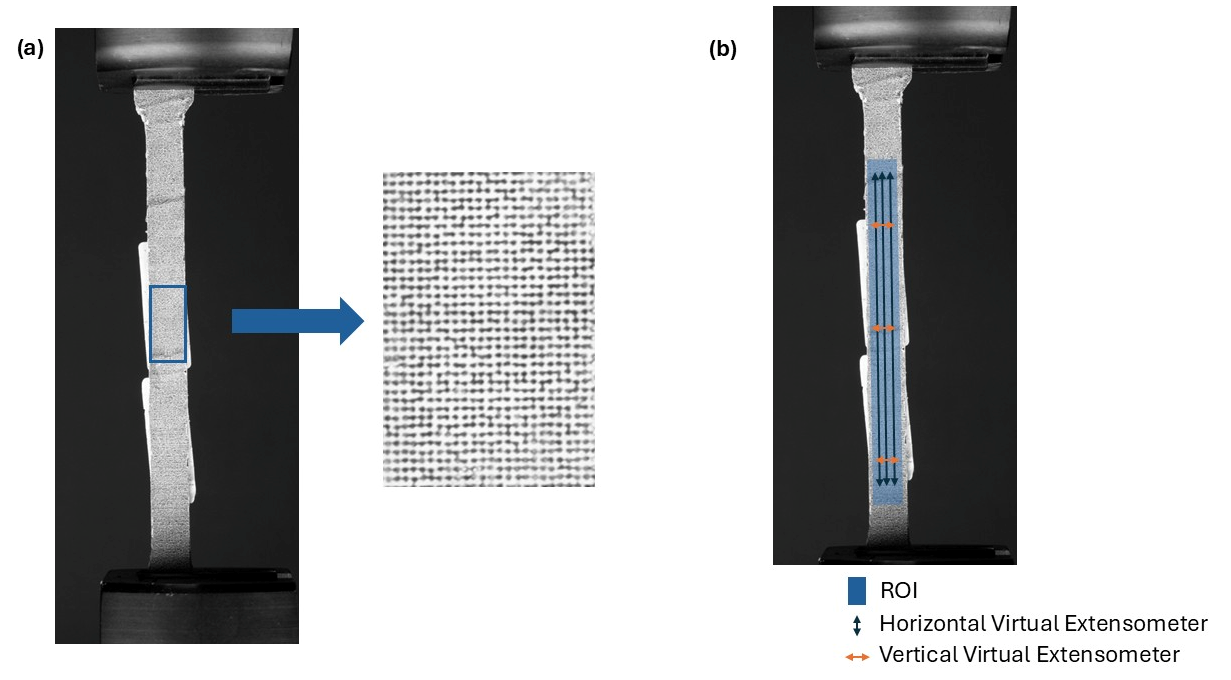
In this regard, it should be noted that, once the processing was completed, a post-processing step was carried out in which three virtual extensometers were positioned longitudinally and three horizontally; this allows displacements and deformations to be calculated more precisely, enabling the mechanical calculations of Young’s modulus and Poisson’s ratio to be performed, as shown in
Figure 3. This will enable the variation in each property to be assessed internally for each specimen, and three Young’s moduli and three Poisson’s ratios will be obtained for each one.
2.5. Data Processing and Statistical Validation
Raw data from the 3 extensometers per specimen were processed to ensure kinematic consistency. Due to the inherent heterogeneity of the filament–wound structure (local resin-rich zones, fiber cross-over friction), local outlier readings were expected. An intra-specimen validation protocol was implemented: for each specimen, the Coefficient of Variation (CV) among the 3 sensors was monitored. A threshold of 25% for the coefficient of variation (CV) was selected as a conservative criterion to identify significant intra-specimen dispersion, ensuring that only measurements affected by pronounced local heterogeneity or kinematic inconsistency were filtered out. A median-based outlier filtering technique was applied. This approach uses the median of the 3 readings (robust to outliers) as a reference; the sensor showing the maximum absolute distance to the median was discarded and flagged as spurious. Property calculation and One-Way ANOVA (analysis of variance) tests were performed both pre- and post-filtering to quantify the impact of local noise on inter-specimen mechanical properties (E, ν). p-values below 0.05 were considered statistically significant, indicating real differences between specimens.
3. Results
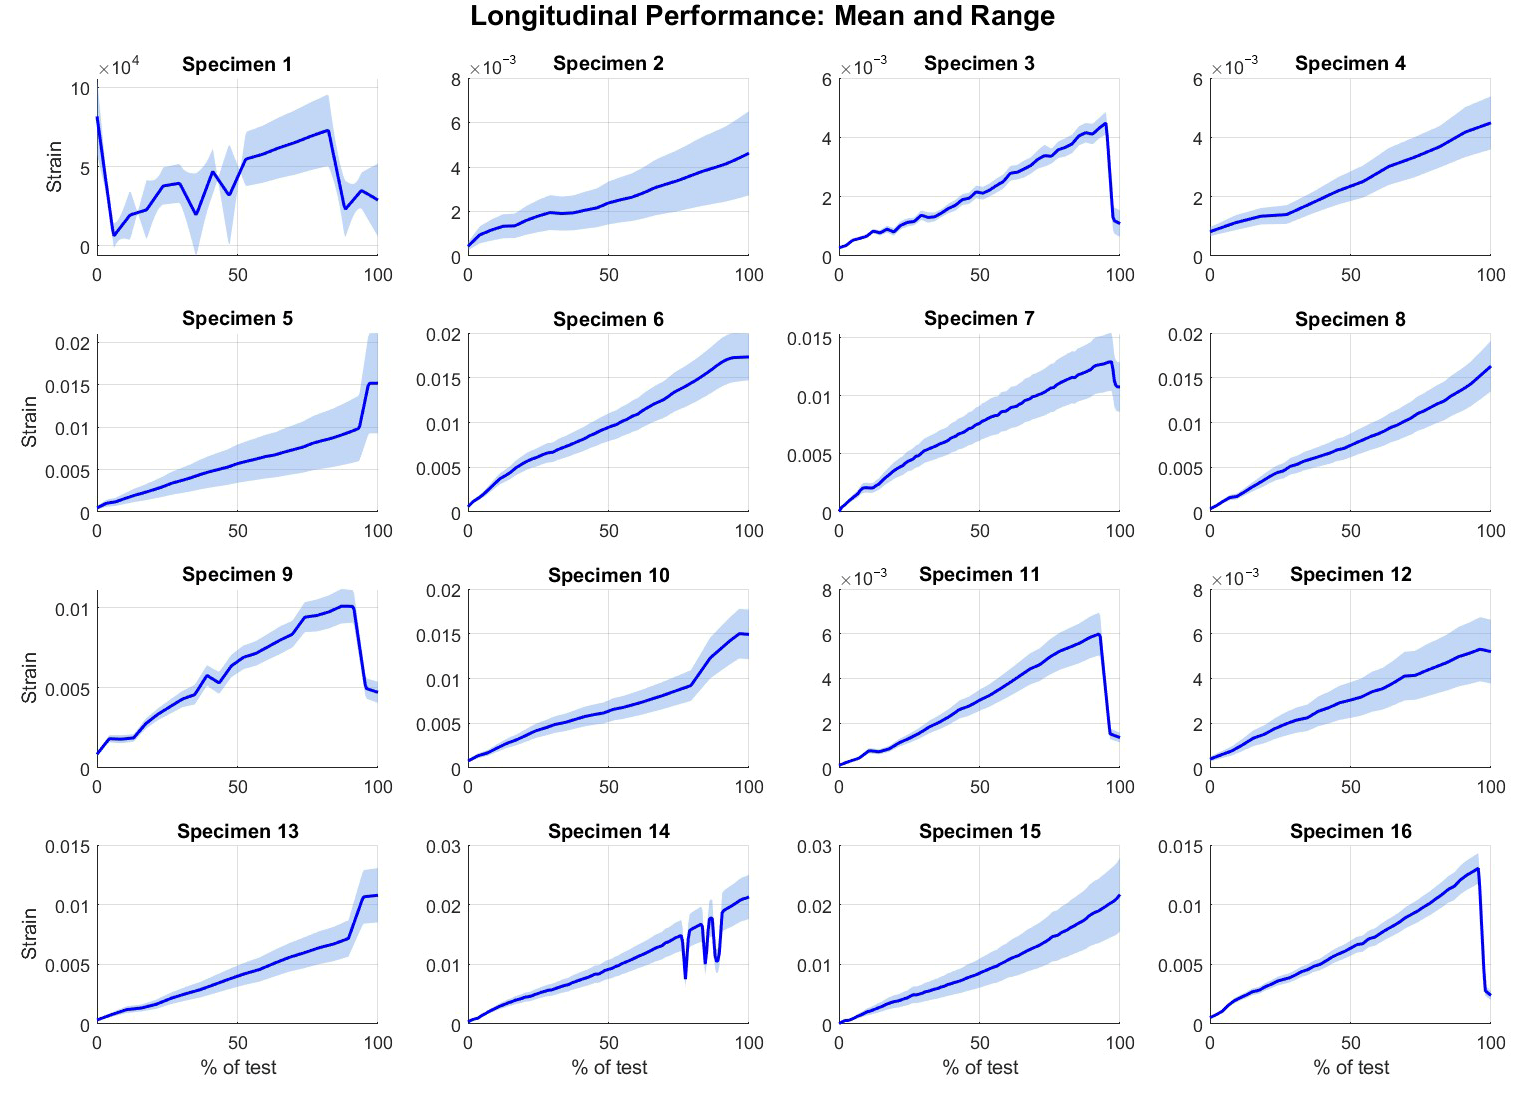
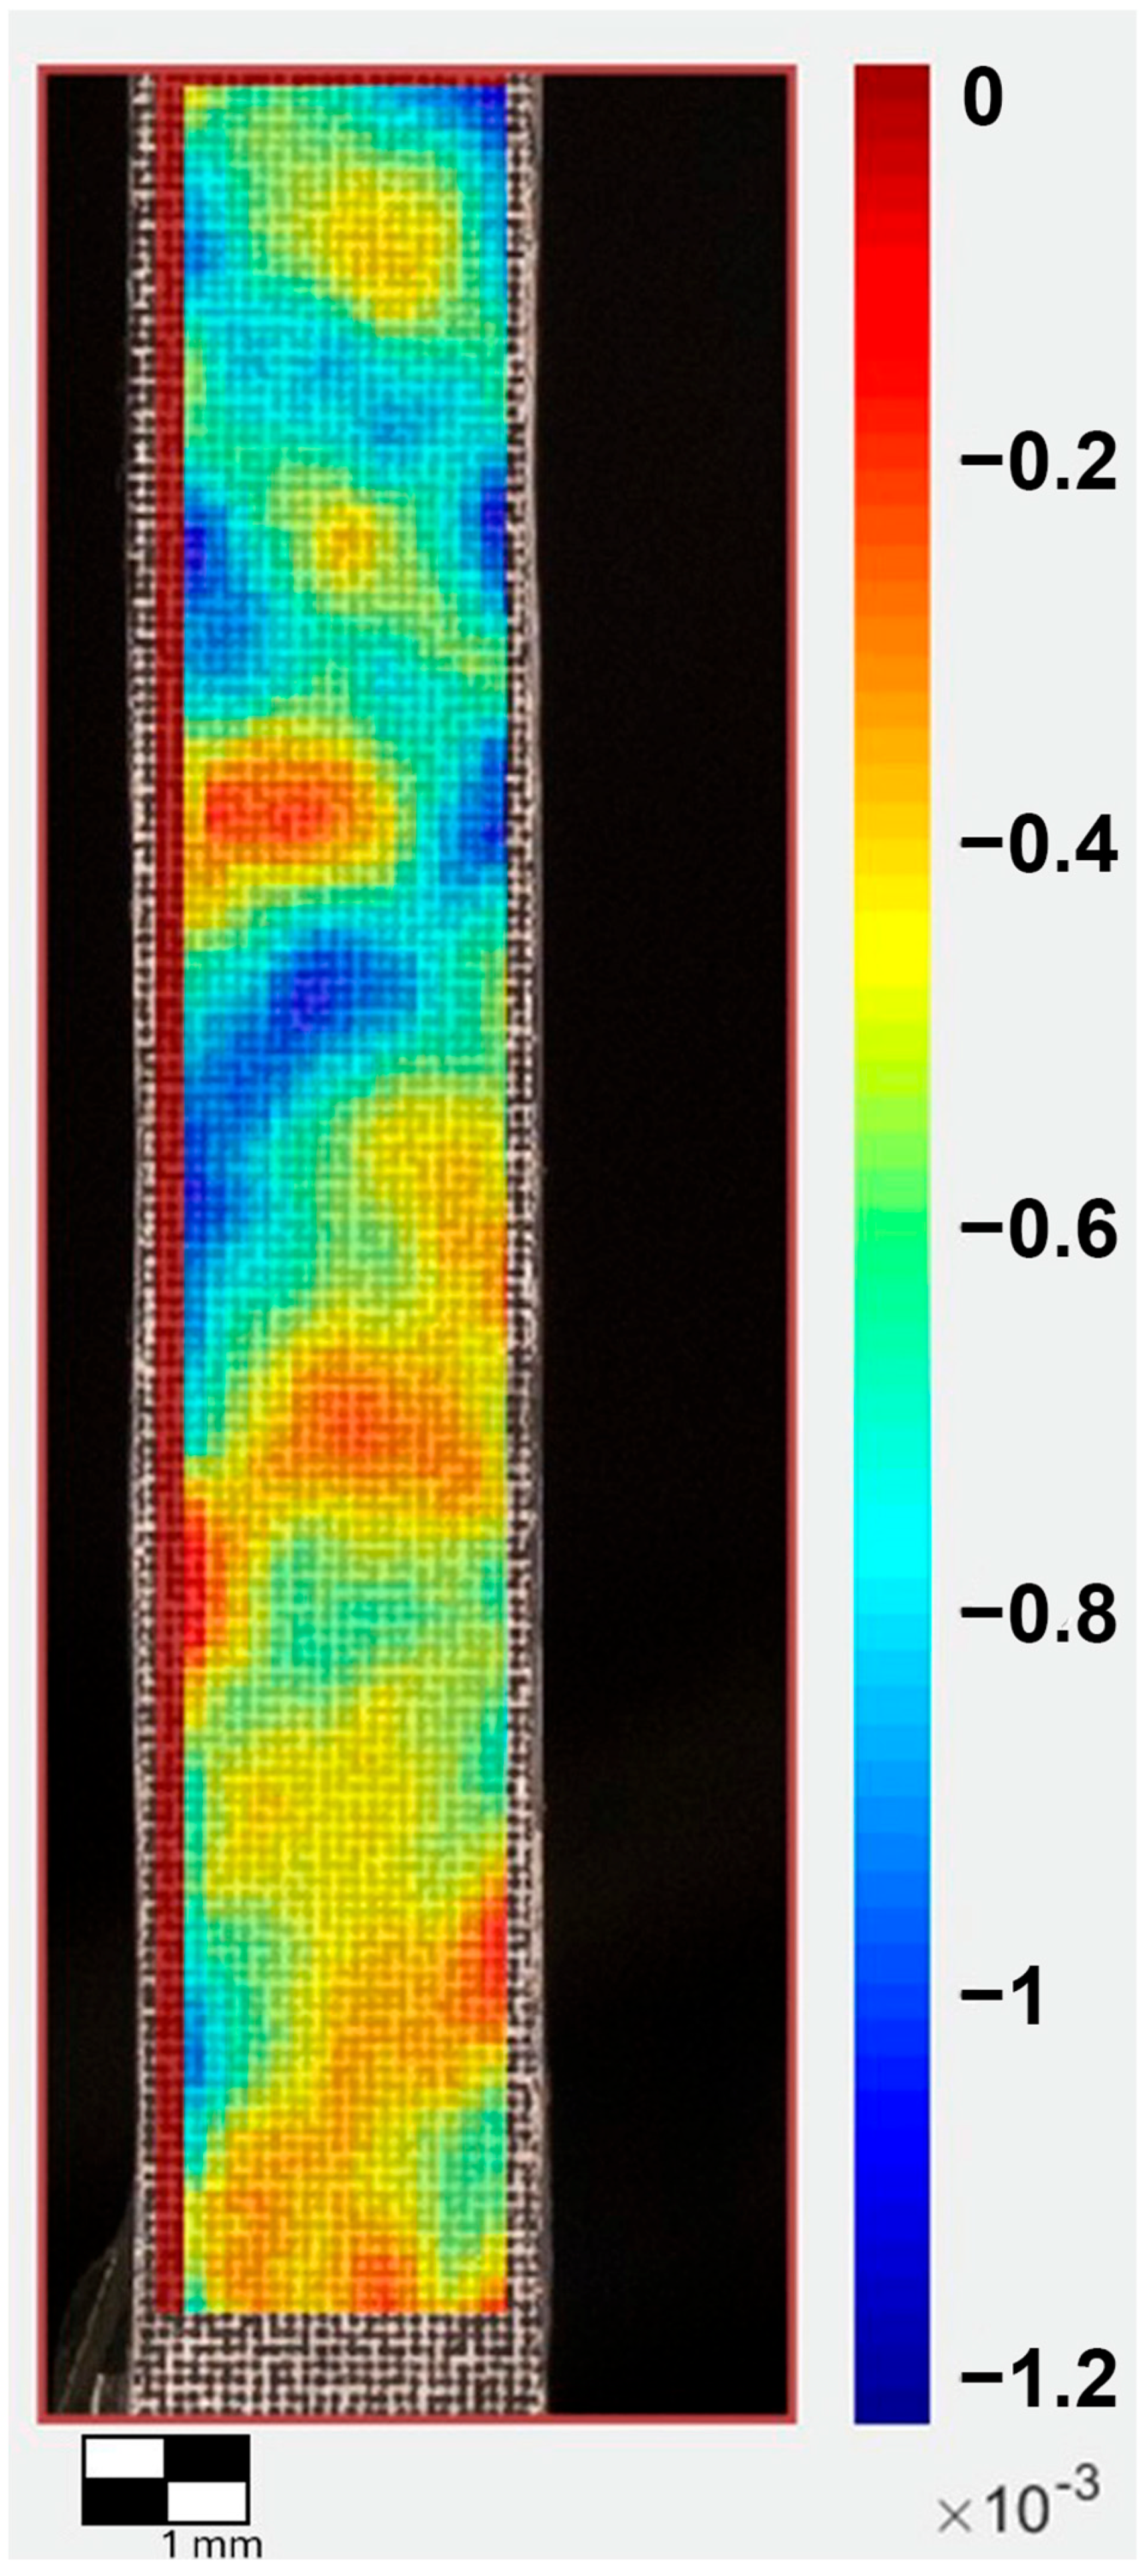
This section evaluates the longitudinal mechanical behaviour of composite tubes manufactured using filament winding. Of the initial sample of 16 specimens, Specimen 1 was excluded from the kinematic analysis due to a data acquisition failure that recorded anomalous displacements. Due to the inherently anisotropic and heterogeneous nature of the manufacturing process, a statistical validation filter based on the Coefficient of Variation (CV) was applied. Local virtual extensometers readings showing a dispersion of more than 25% relative to the specimen’s mean were considered spurious (associated with slippage or local resin concentrations) and filtered out, significantly improving the reliability of the macroscopic metrics. In this regard, the heterogeneity of the material under deformation is noteworthy, as observed in
Figure 4.
3.1. Global Mechanical Response
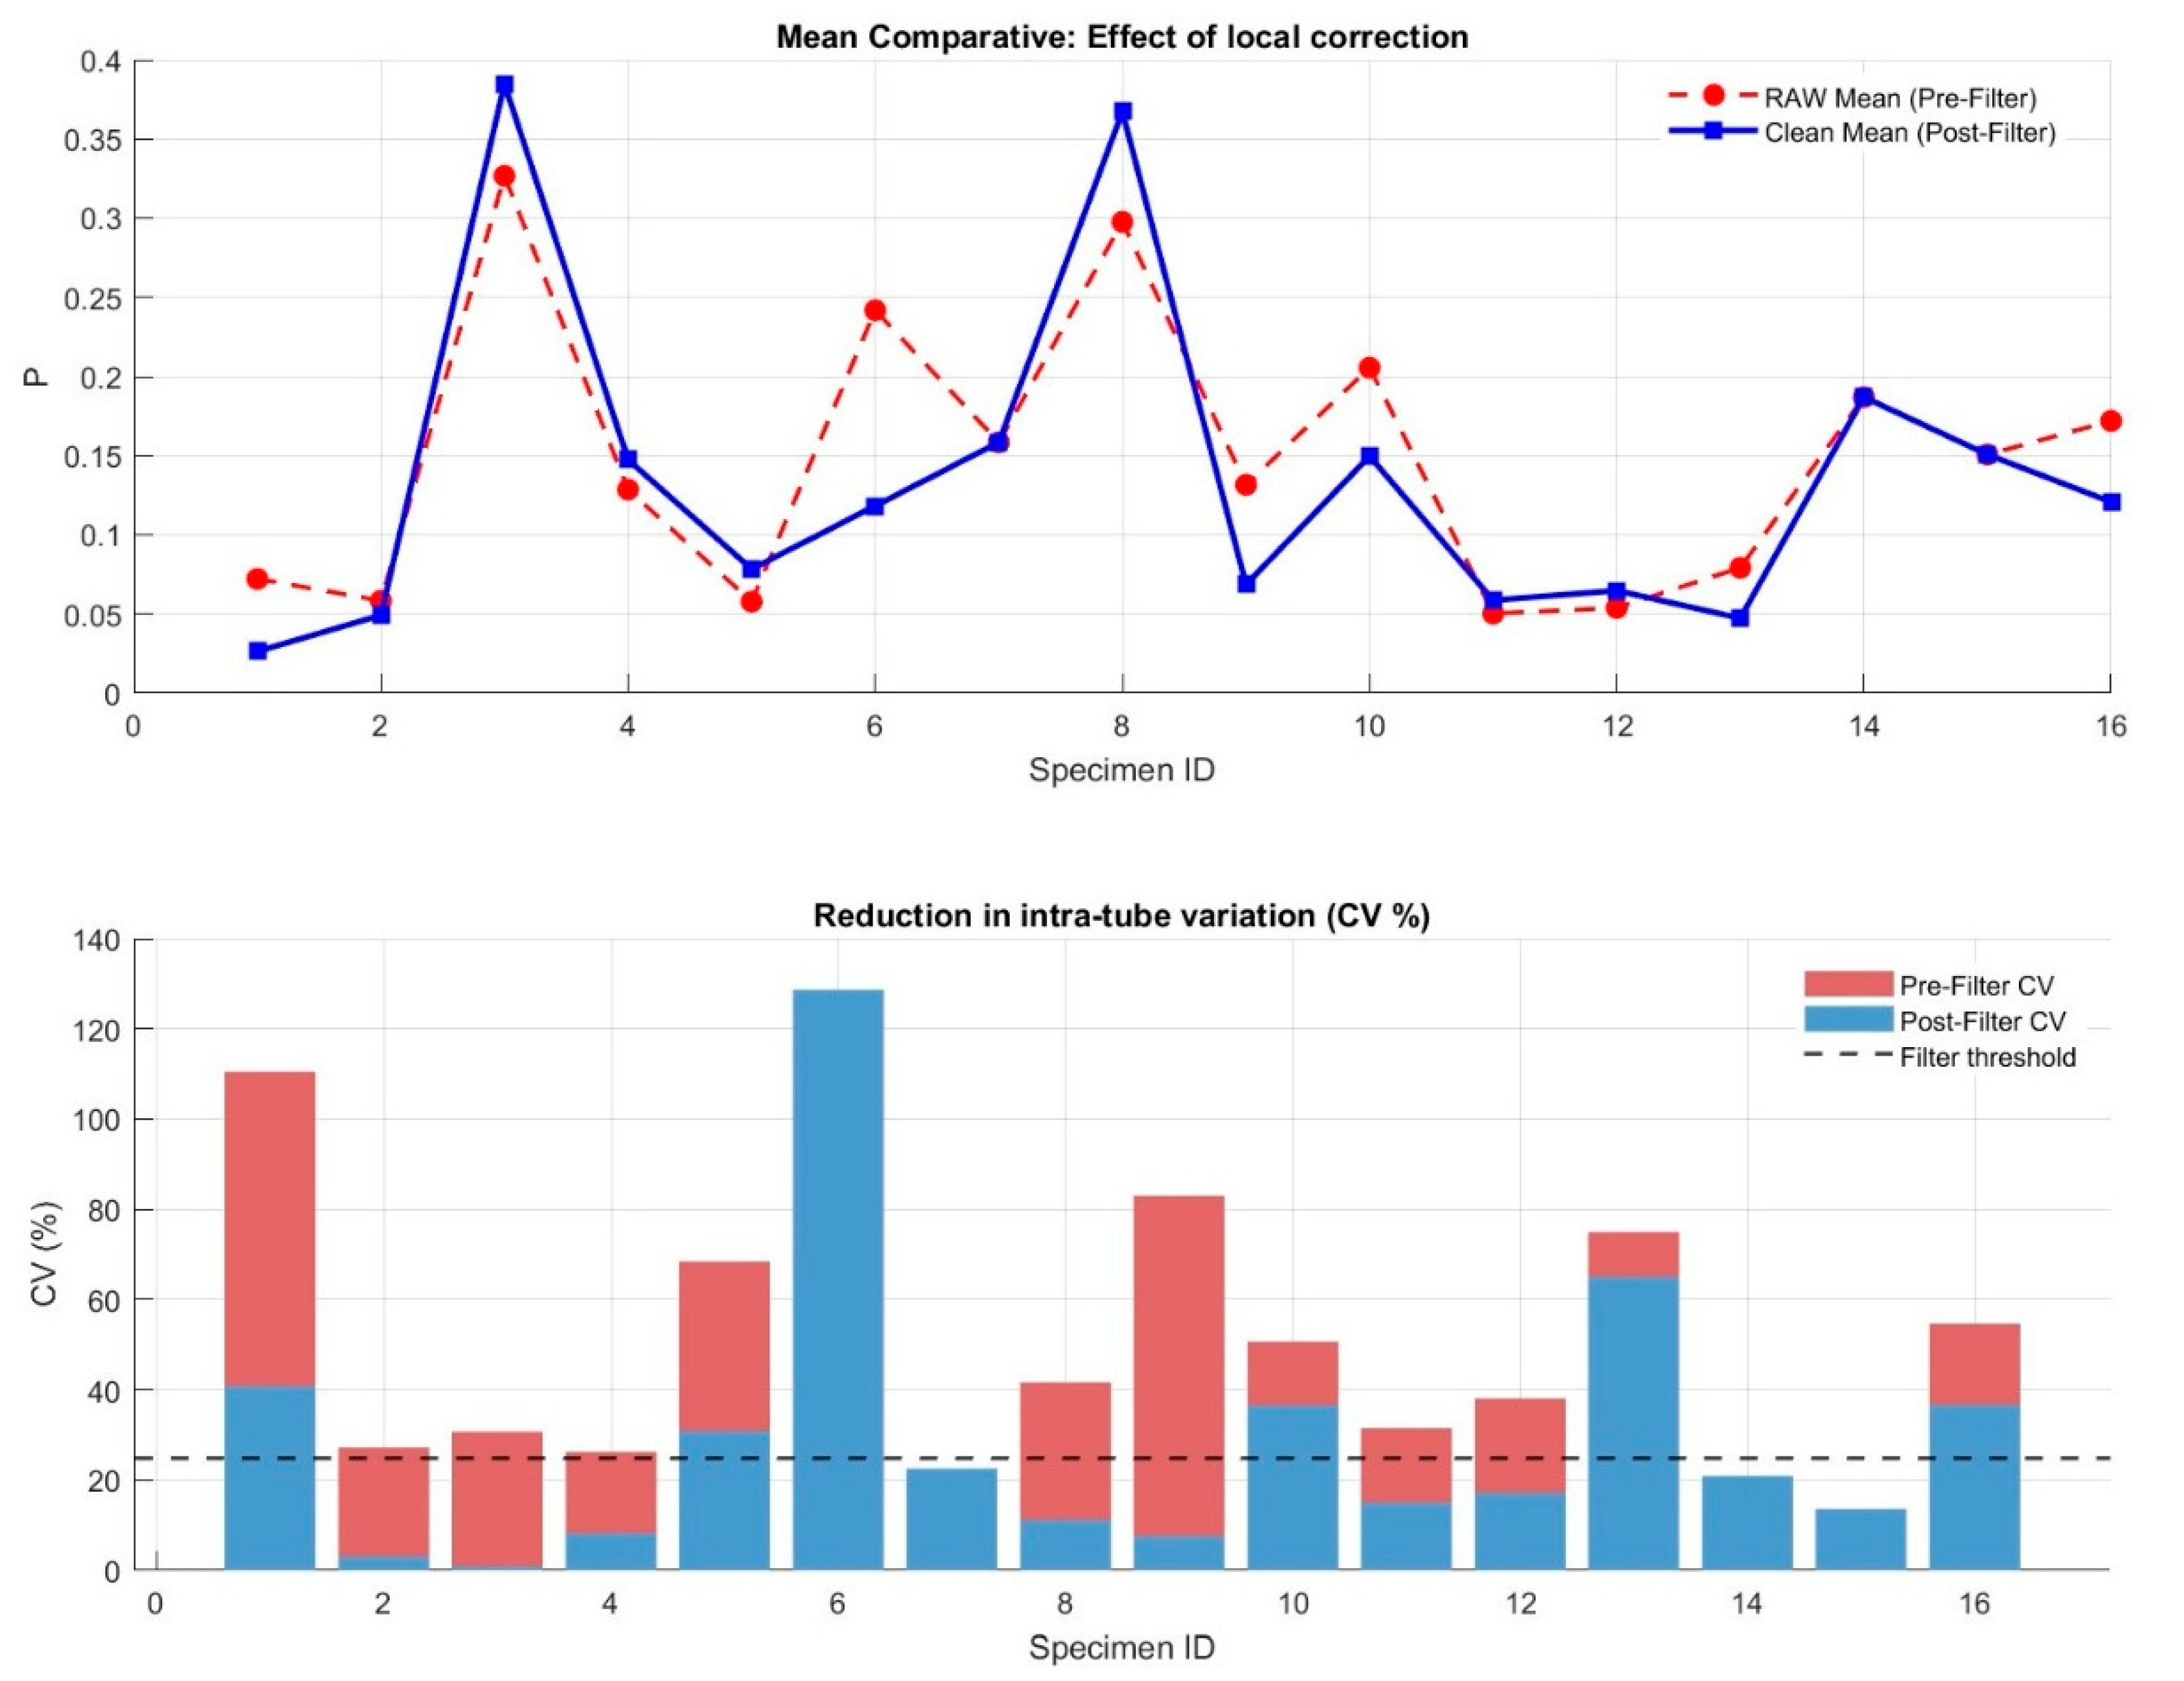
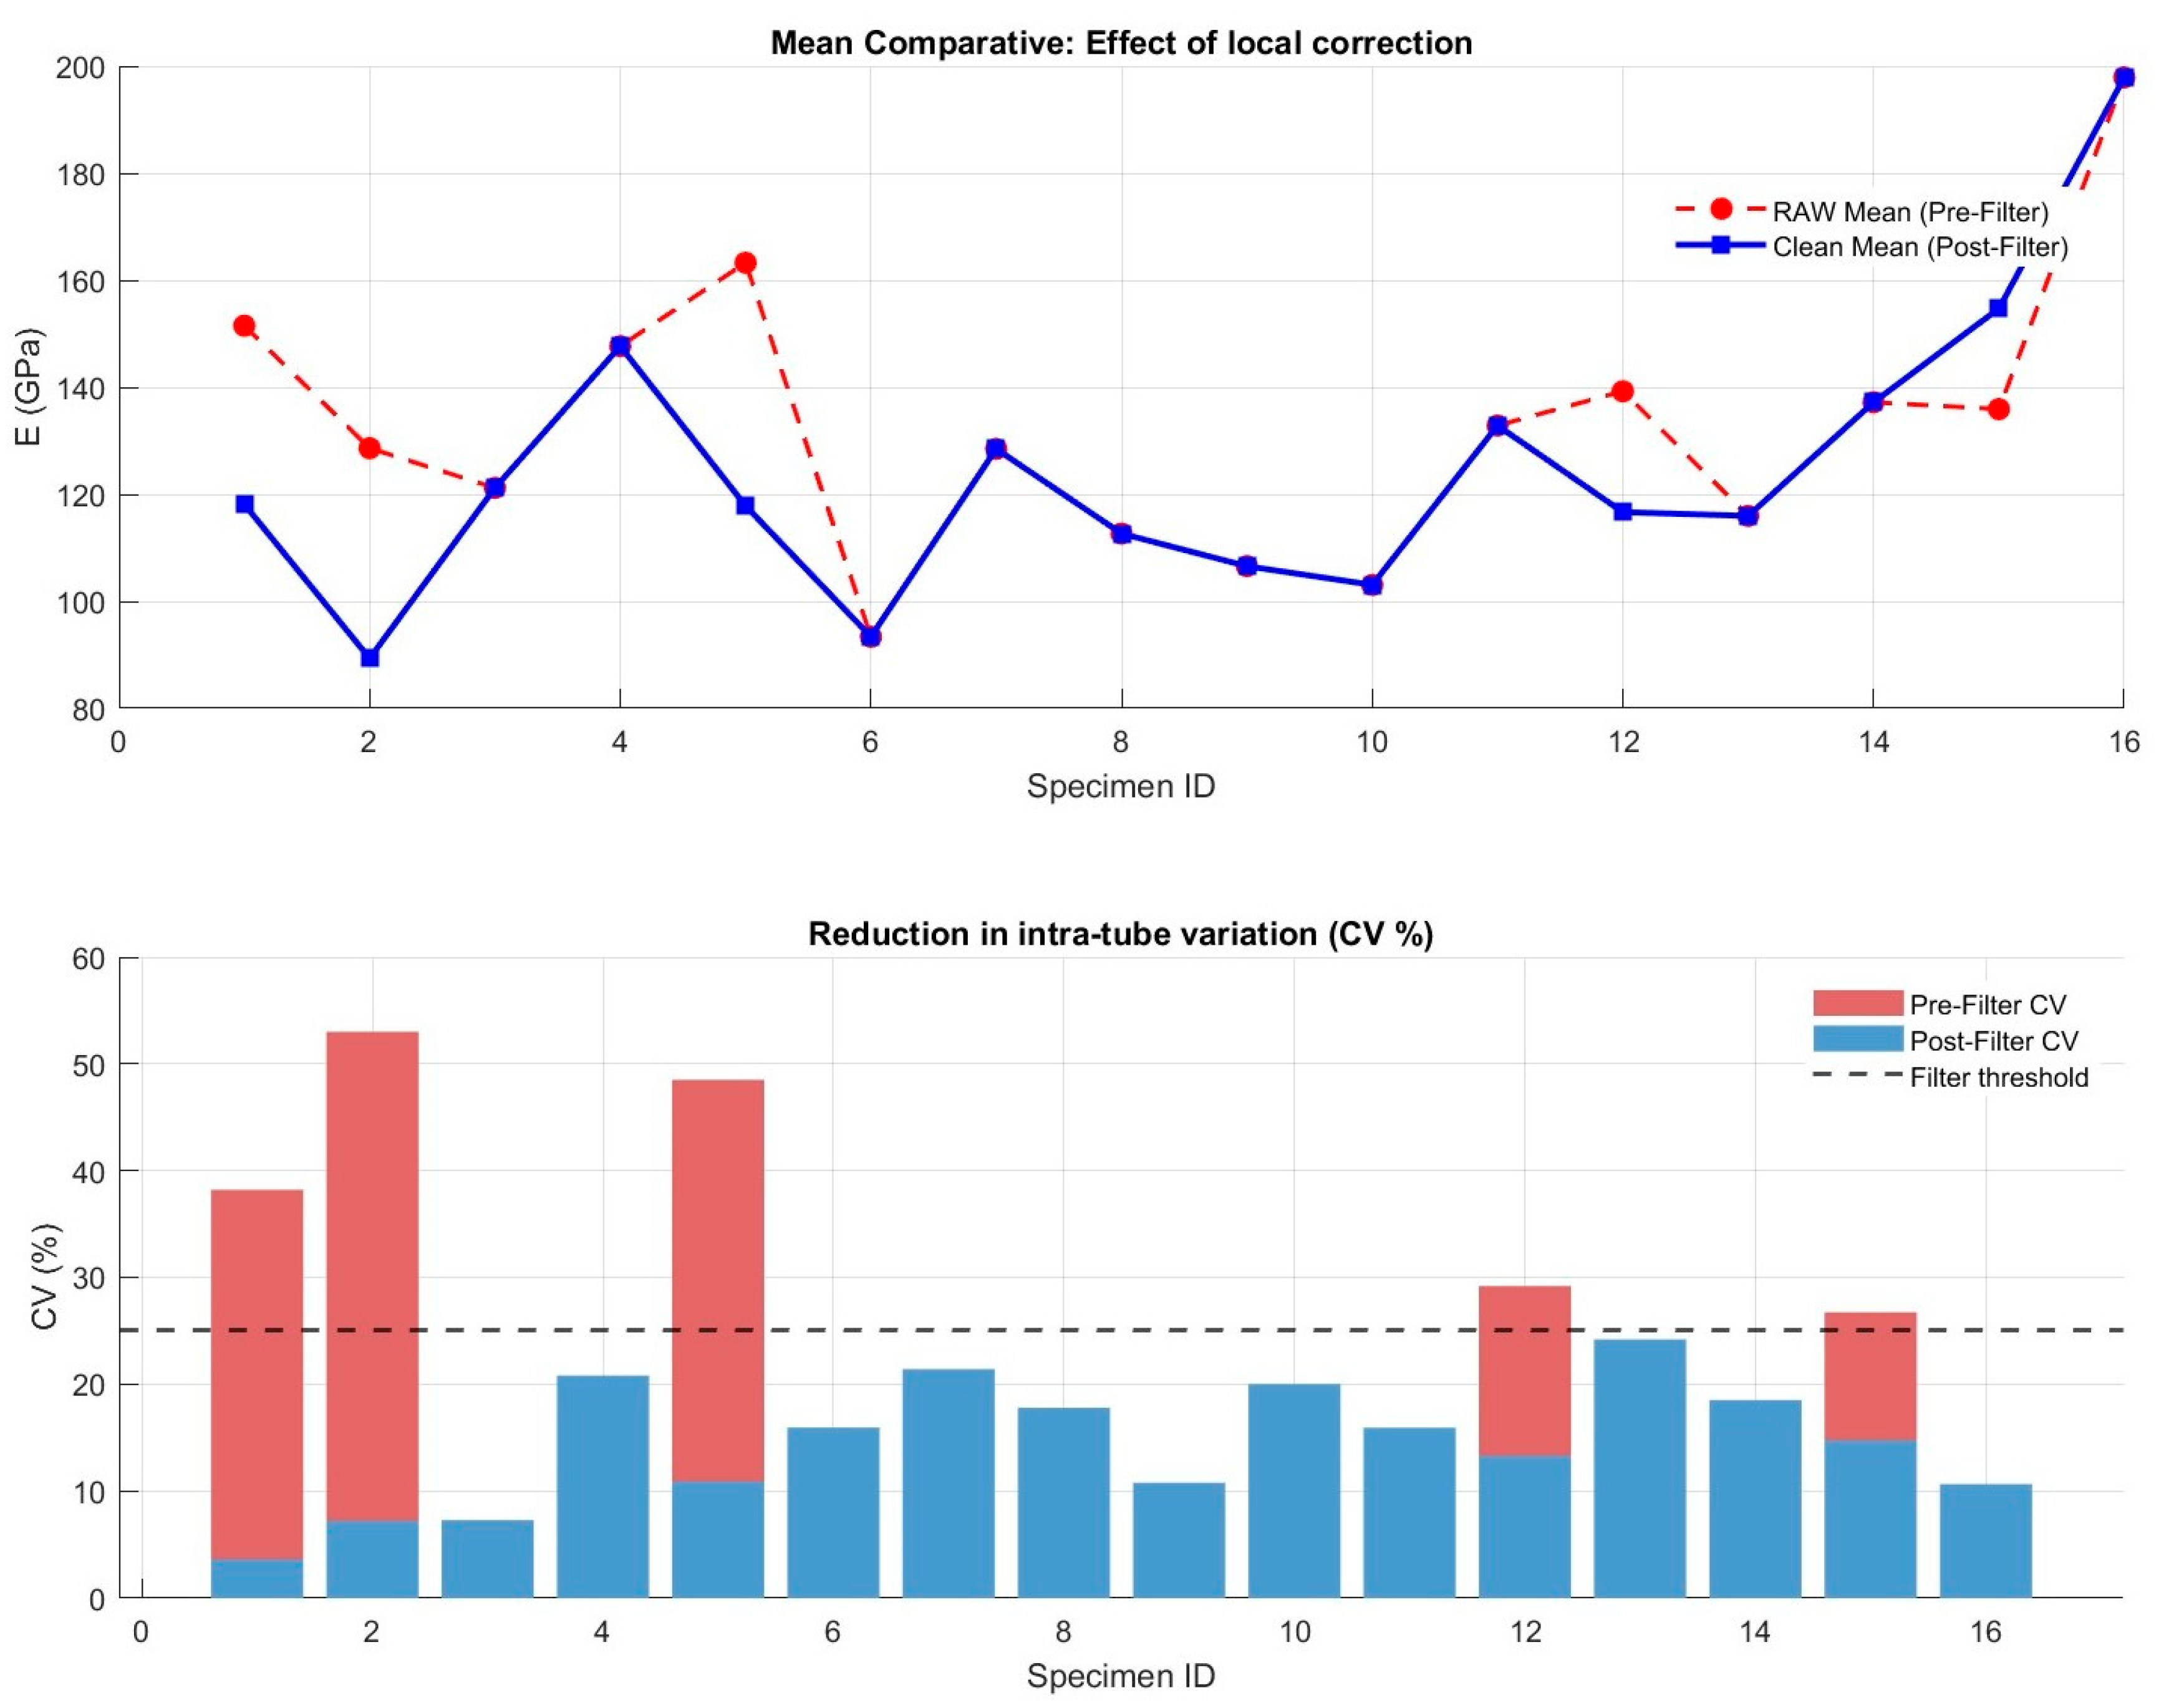
The macroscopic mechanical properties and statistical validation of the batch are summarised in
Table 2 and
Figure 5 and
Figure 6. The initial one-way ANOVA with Matlab R2023a analysis of the raw data (pre-filtered) for Modulus E yielded a
p-value of 0.2109, distorted by noise, suggesting homogeneity among the 16 specimens. This lack of statistical significance was due to high intra-specimen instrumental noise (SEM = 37.52), revealed by local CVs exceeding 50% in specimens such as ID 2. SEM is calculated through
where
s is the standard deviation and
n is the sample size.
Applying the filtering protocol successfully corrected severe local deviation, e.g., specimens 1, 2, 5, 12, 15 (
Figure 5). This reduced the assay noise (SEM), to 20.68, and the post-filtering ANOVA revealed a highly significant
p-value of 0.0003. This critical change demonstrates that the filter eliminated spurious local readings and brought to light genuine mechanical differences between specimens, inherent to the winding process.
A similar effect was observed in the Poisson’s ratio,
Figure 6. The raw cross-sectional readings showed extreme dispersion, with a CV > 100% in Test Specimen 1, associated with deformations in resin-rich areas. The Pre-Filter ANOVA (
p = 0.0073), although significant, was heavily affected by noise (SEM = 0.09). Filtering managed to halve the error (SEM = 0.04) and the Post-Filter ANOVA yielded a
p-value of 0.0000, validating robust inter-specimen consistency (ICC = 82.14%) for such a sensitive property. ICC is calculated by
.
3.2. Threshold Results
To quantitatively evaluate the impact and validity of the proposed intra-specimen coefficient of variation (CV) filtering protocol, a comprehensive global statistical analysis was performed.
Table 3 contrasts the macro-mechanical metrics of the elastic modulus (E) before and after applying the statistical filter. Three complementary indicators were utilized to track data quality: the Standard Error of Measurement (SEM) to quantify intra-specimen kinematic noise, the Intraclass Correlation Coefficient (ICC) to quantify the proportion of total variance attributable to differences between specimens rather than to intra-specimen dispersion among virtual extensometers, and a one-way Analysis of Variance (ANOVA) to assess the discriminative power between different tested samples.
In the pre-filtered state, the experimental dataset is highly dominated by localized kinematic artifacts and structural noise, as evidenced by a high SEM value (37.52 GPa) and a critically low ICC (11.51%). This low ICC indicates that only a minor fraction of the total variance can be attributed to genuine differences between the manufactured specimens, while the vast majority is masked by the severe local strain variations captured by the individual virtual extensometers. Consequently, the pre-filtered ANOVA yields a non-significant p-value (p = 0.2109), meaning that standard raw metrics fail to statistically distinguish the mechanical behavior among different specimens due to the overriding internal scatter.
Conversely, the application of the statistical filter drastically alters the consistency of the mechanical parameters. By purging the local non-physical outliers hypothetically induced by microstructural defects (such as resin pockets or local fiber misalignment, etc.), the intra-specimen noise is suppressed, causing the SEM to drop significantly to 12.28 GPa. More importantly, the ICC undergoes a remarkable surge, reaching 84.00%. This high reliability index demonstrates that once the localized noise is filtered out, the remaining variance represents true, macroscopic structural variability between the pieces. This is further validated by the post-filtered ANOVA, which becomes highly significant (p < 0.001), successfully resolving the distinct mechanical signatures of the specimens. These results justify the necessity of the proposed DIC-filtering pipeline to obtain realistic and dependable constitutive properties in heterogeneous filament–wound structures.
3.3. Intra-Specimen Strain Heterogeneity
To understand the origin of the dispersion in the elastic properties, the internal kinematic consistency of each specimen was assessed by analysing the readings from the three extensometers.
Figure 7 shows the evolution of the displacements, illustrating how the intra-specimen dispersion band (shaded in blue) widens as the load increases.
When assessing the asymmetry at the 90% test point,
Table 4, just prior to catastrophic failure, three distinct behaviours are observed: a group exhibiting high kinematic symmetry equivalent to quasi-isotropic behaviour (CV < 12%, in specimens 3, 9, 16); a standard group dictated by the normal friction of the interlaced strands (CV 15–25%); and a group with marked severe stiffness gradients in the tube wall (CV > 25%, notably specimen 2 with 40.83%).
3.4. Inter-Specimen Variability
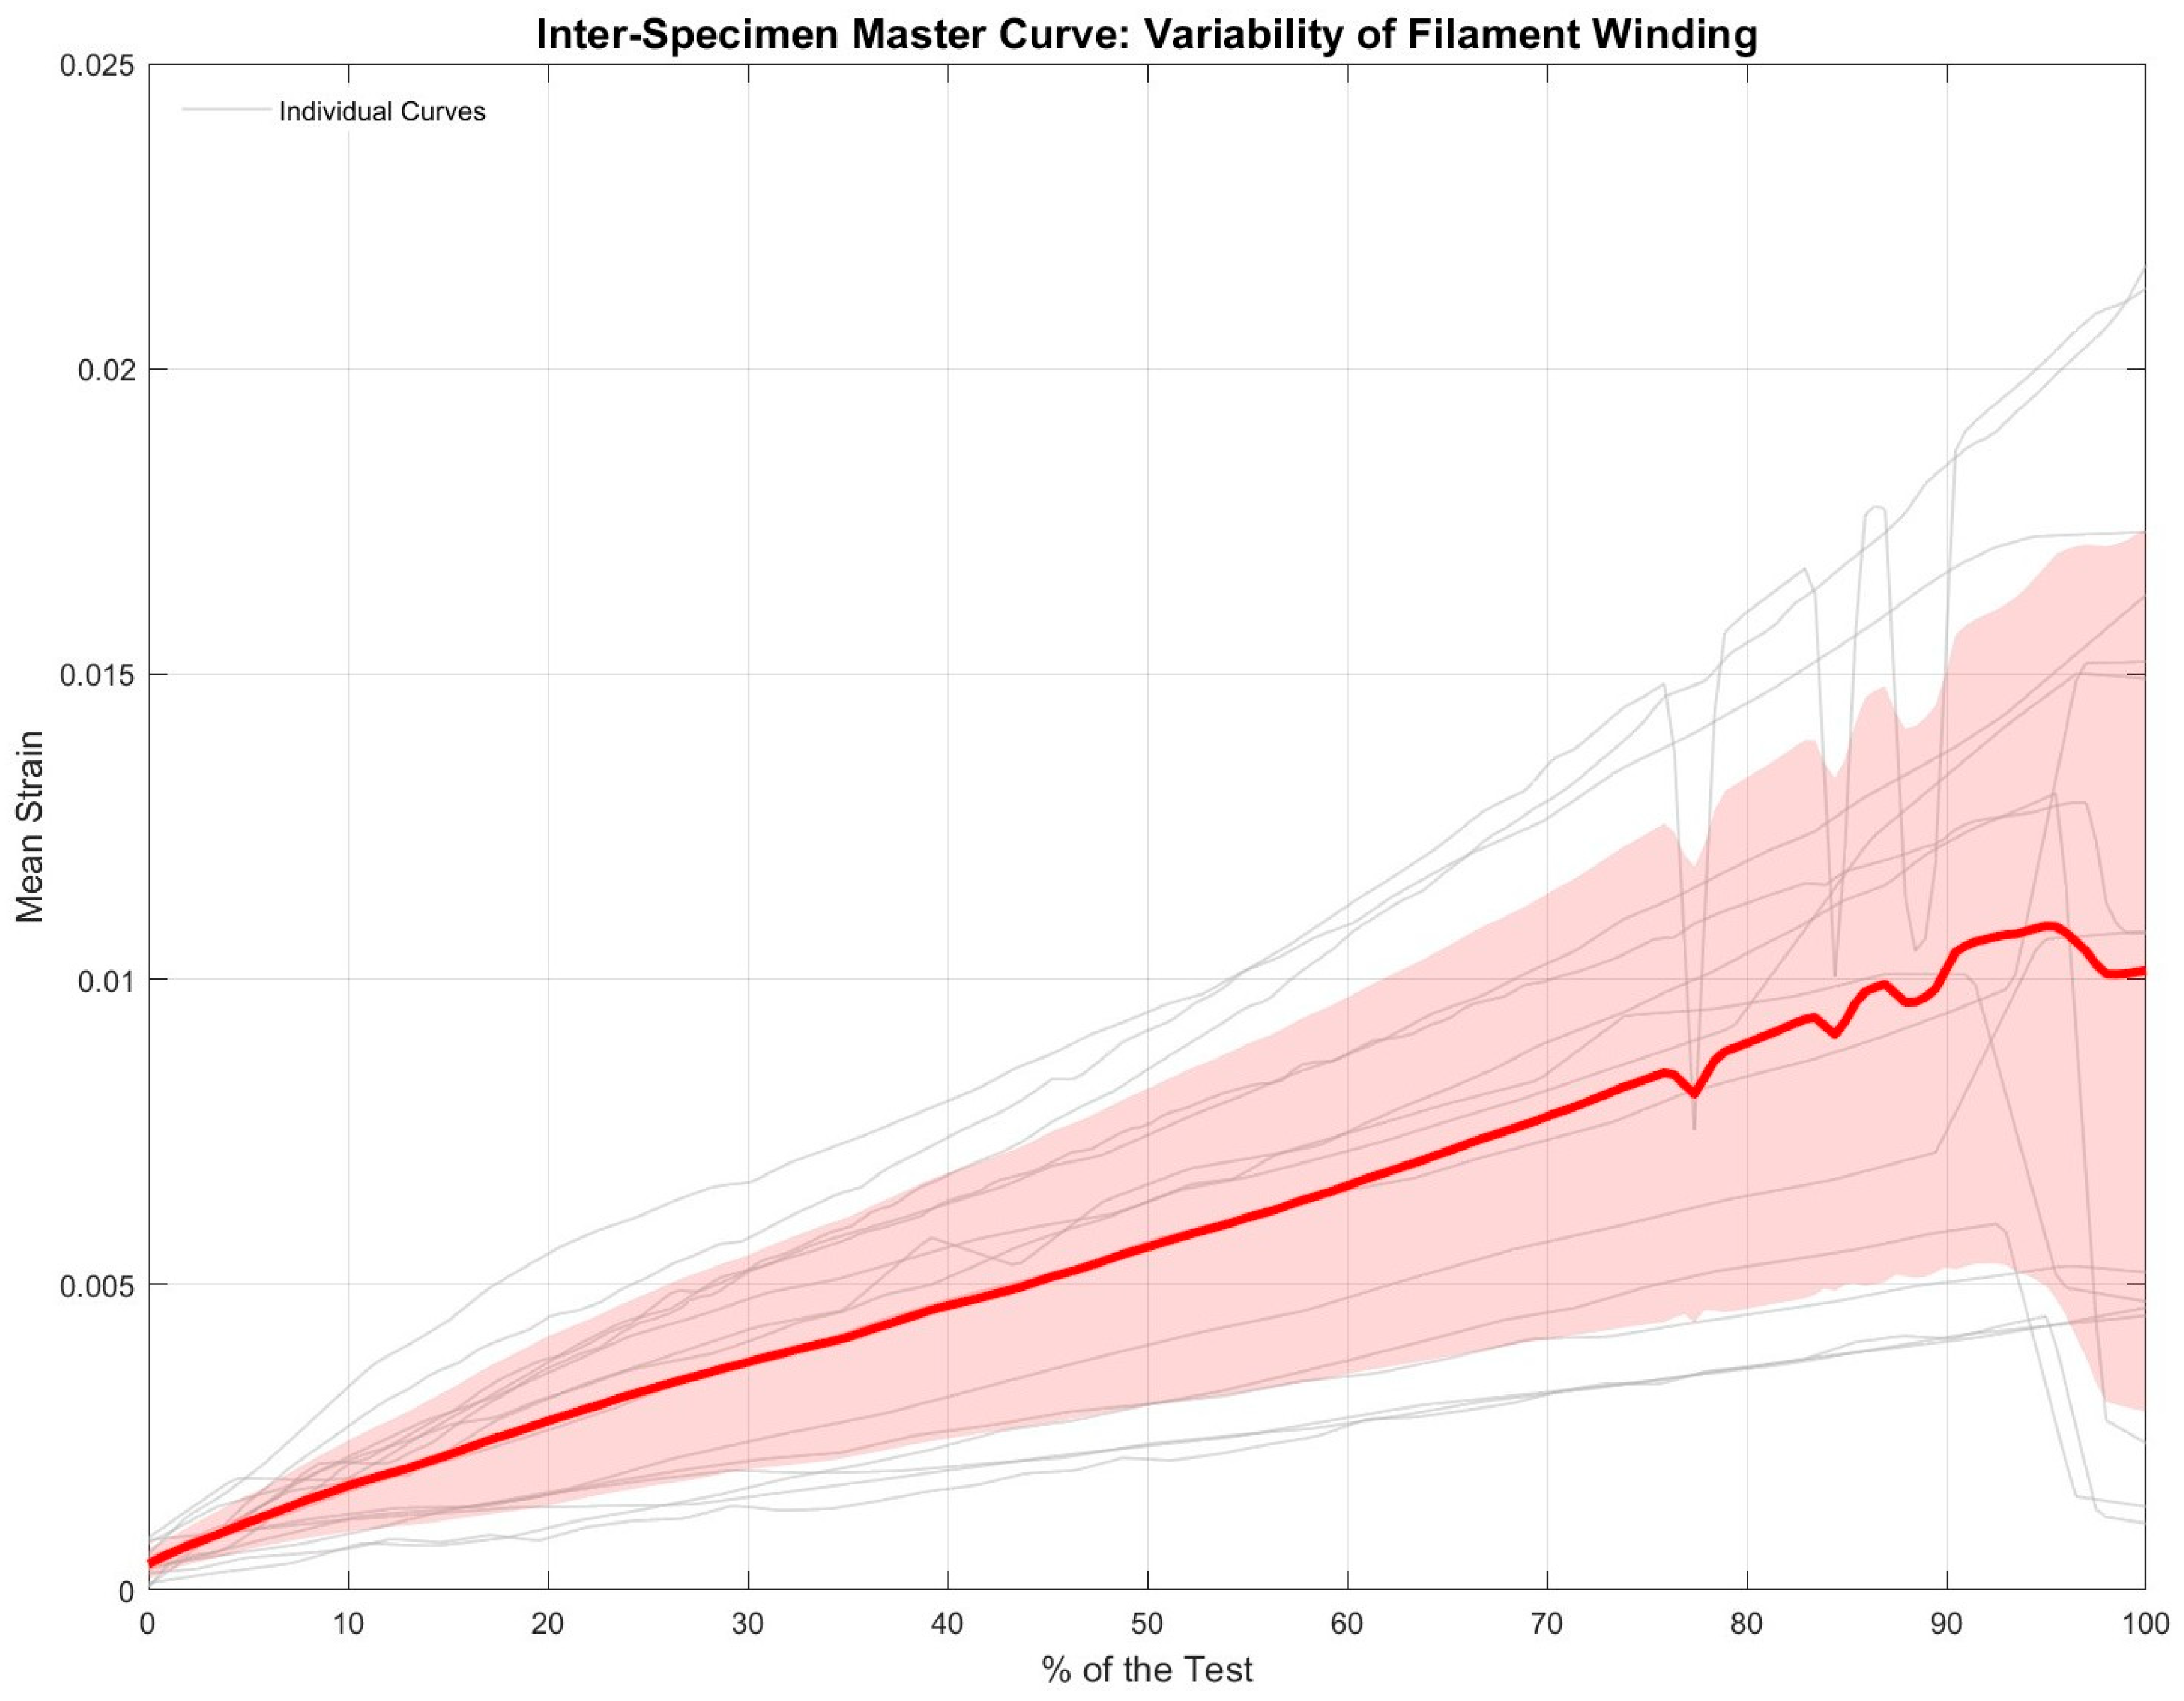
At the batch level, the average curves for each specimen were aggregated to generate an overall process tolerance corridor,
Figure 8. During the initial elastic regime (0–20% of the load), the behaviour of the series is highly consistent. However, as the load increases, the strain trajectories diverge markedly. This fan-shaped spread confirms that the final collapse is governed by microstructural defects unique to each tube, such as slight variations in the local fibre volume fraction or the resin’s curing history.
3.5. Quantification of Strain Heterogeneity
To determine whether the variability observed in the Mean Curve is the result of a chaotic accumulation of damage under load or a constitutive property of the specimens, the evolutionary dispersion of the batch was quantified. As shown in
Table 5, the overall inter-specimen coefficient of variation remains surprisingly constant (around 46–48%) throughout the loading cycle. This finding demonstrates that the mechanical dispersion is not caused by unpredictable micro-cracks appearing abruptly, but rather represents a pre-existing variability in stiffness inherent to the manufacturing tolerances of the batch under evaluation.
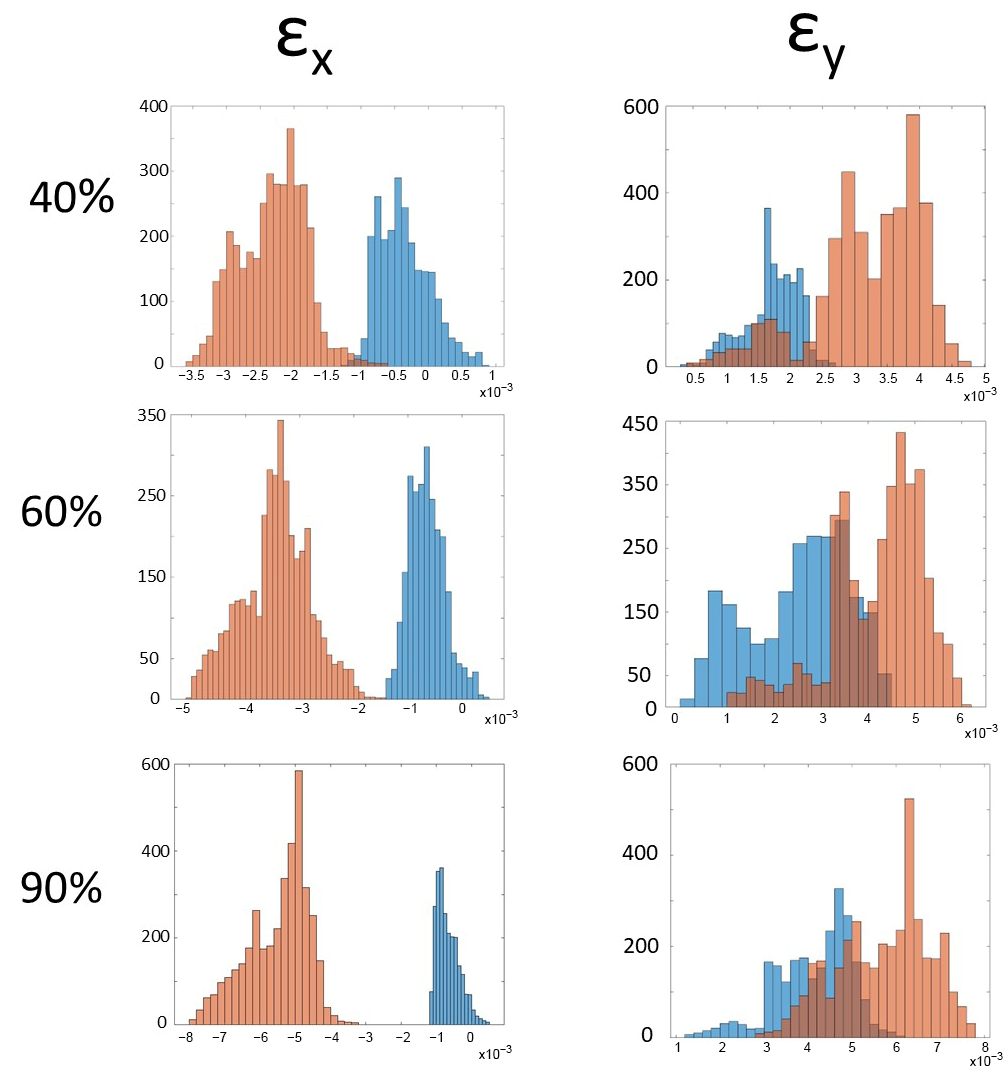
To complement the standardized analysis performed with the discrete virtual extensometer array and to quantitatively capture the full spatial heterogeneity of the strain fields, a quantitative analysis of the longitudinal strain frequency distribution was conducted across the entire evaluated surface area.
Figure 9 contrasts the full-field strain histograms computed from every correlation pixel for two representative specimens: a kinematically symmetric case (Specimen 3) and a highly asymmetric case (Specimen 2), at three different load stages relative to their ultimate failure load (40%, 60%, and 90%).
At lower load levels (40%), both specimens display very similar, narrow, quasi-Gaussian strain distributions, with mean values hovering around 0.15% strain and low spatial standard deviations. This indicates a relatively consistent and uniform initial mechanical response across the structure. However, as the tensile load approaches collapse (90%), the evolution of the full-field strain dispersion differs dramatically between the two cases. While Specimen 3 maintains a relatively narrow distribution (reflecting a more homogeneous deformation state), the histogram for Specimen 2 undergoes extreme broadening, with its probability density function becoming markedly flattened and right-skewed.
This widening of the histogram for Specimen 2 is a direct quantitative metric of severe strain localization. The broader and more asymmetric strain distribution suggests that, as the load approaches failure, the deformation field becomes increasingly non-uniform, with some regions experiencing strains significantly higher than the spatial average. This full-field evidence supports the interpretation that local kinematic asymmetries play an important role in the tensile response of the filament–wound specimens. However, the present data do not allow the specific physical origin of these asymmetries to be unambiguously attributed to microstructural defects, fibre architecture, or local thickness variations.
4. Discussion
The mechanical characterisation of cylindrical structures manufactured using filament winding presents inherent challenges due to the material’s heterogeneous microstructure. Unlike metals or autoclave-cured prepregs, the winding process inevitably results in filament crossovers, variations in the thickness of the resin-rich layer, and surface microporosity [
30,
31,
32].
The results of this study, shown in
Figure 5 and
Figure 6, demonstrate that these local anomalies severely distort the readings from the contact extensometers. Before applying the intra-specimen filter, the high local variability (SEM = 37.52 for the E-modulus) masked the material’s true behaviour, leading to a false negative in the analysis of variance (pre-filter ANOVA
p > 0.05). By isolating and eliminating spurious kinematics driven by local effects (such as microscopic slippage in resin-rich zones), not only was a highly robust consistency index recovered (ICC > 80% for Poisson’s ratio), but the true constitutive differences between the tubes in the batch were revealed (
p < 0.001). This highlights the critical need to implement robust local filtering protocols before deriving macroscopic elastic properties in wound components, a practice often overlooked in standard testing protocols.
It is important to note that the exceptionally wide range observed in the pre-filtered local readings—spanning from 78.5 GPa to 254.1 GPa—does not represent the true macroscopic elastic modulus of the composite. Statistically, a value of 254.1 GPa is physically anomalous for a T300 CFRP system, as it exceeds the theoretical stiffness of the pristine carbon fiber itself. Within the context of full-field Digital Image Correlation (DIC), these extreme outliers represent localized kinematic artifacts rather than actual constitutive material properties. Physical phenomena inherent to the filament winding architecture, such as localized resin pockets undergoing micro-cracking or localized parasitic bending at fiber crossovers, can severely distort the local displacement fields. If a virtual extensometer happens to span one of these high-gradient defect zones, the mathematical correlation artificially registers an underestimation of local strain, resulting in an unphysically high apparent stiffness. Consequently, these extreme values highlight the susceptibility of discrete local measurements to manufacturing-induced noise and underscore the necessity of the proposed statistical filtering protocol, which successfully purges these non-physical anomalies to recover a realistic and cohesive macroscopic Young’s modulus.
The analysis of the displacement curves shown in
Figure 4 revealed a kinematic asymmetry that increases exponentially as the load approaches failure. At 90% of the mechanical test, the specimen exhibited three distinct behaviours, as shown in
Table 4. Specimens with intra-sensor variations of less than 12% exhibited quasi-isotropic deformation, suggesting a perfectly symmetrical stress distribution in the grips and a tube wall free of thickness gradients.
However, specimens with asymmetries exceeding 25% (e.g., Specimens 2 and 5) exhibited a clear phenomenon of parasitic bending. In thin-walled cylindrical structures, this pre-failure asymmetric bending is not necessarily an artefact of the clamping, but rather a structural response to stiffness mismatches in the tube’s cross-section, caused by variations in the fibre volume fraction,
, during the curing process [
33,
34]. The sharp drops in stiffness observed in the curves of certain specimens (e.g., Specimens 9 and 14) prior to complete collapse are typically associated with premature local delamination or the sequential failure of the most stressed fibre bundles in the outer layer [
35,
36].
A key finding of this study is the quantification of inter-specimen variability throughout the loading cycle. Traditionally, dispersion in composite materials is attributed to a stochastic accumulation of damage under load (matrix microcracking, fibre-matrix delamination), which theoretically should result in a progressive increase in the relative coefficient of variation as the material degrades [
37,
38].
However, the data obtained show that the overall coefficient of variation for the batch remains remarkably constant (between 46% and 48%) from the early elastic regime (25% of the load) right up to the moments immediately prior to fracture (90% of the load). This consistency indicates that the observed kinematic dispersion is not a cumulative phenomenon dominated by stochastic fracture mechanics during the test, but rather a constitutive property inherent to the manufacturing batch tolerances. Differences in stiffness are already predefined from the post-cured state (due to thermal history, residual winding stresses or small variations in fibre angle), and simply scale linearly with the applied load. This behaviour suggests that industrial optimisation efforts to minimise dispersion in these tubes should not focus on improving the fracture toughness of the matrix, but rather on stricter dimensional and thermal control during the winding and curing phase.
Specimens presenting marked differences among local strain measurements exhibited more pronounced non-uniform deformation fields as the load approached failure. Such behaviour may be compatible with local stiffness variations within the specimen. In filament–wound composites, possible sources of such variability include local changes in fibre architecture, resin distribution, thickness, residual stresses, or fibre alignment. However, the present study does not include direct microstructural or geometrical characterization, and therefore, the specific physical origin of the measured strain heterogeneity cannot be established. Accordingly, the DIC results should be interpreted as evidence of non-uniform deformation rather than as direct proof of any particular manufacturing defect or damage mechanism.
The approximately stable inter-specimen coefficient of variation observed at different load levels suggests that a relevant part of the measured dispersion is already present during the early stages of loading, rather than appearing exclusively immediately before failure. This result is compatible with pre-existing specimen-to-specimen variability. Nevertheless, the present measurements do not allow its origin to be attributed unambiguously to manufacturing parameters, curing conditions, local fibre-volume fraction, thickness variation, or damage evolution. Complementary microstructural and geometrical characterization would be required to establish these relationships.
It is important to note that the exceptionally wide range observed in the pre-filtered local readings, spanning from 78.5 GPa to 254.1 GPa, could not represent the true macroscopic elastic modulus of the composite. Statistically, a value of 254.1 GPa is physically anomalous for a T300 CFRP system, as it exceeds the nominal tensile modulus reported. Within the context of full-field Digital Image Correlation (DIC), these extreme outliers may apparent stiffness values affected by strain-extraction limitations. Physical phenomena inherent to the filament winding architecture, such as localized resin pockets undergoing micro-cracking or localized parasitic bending at fiber crossovers, could hypothetically distort the local displacement fields. If a virtual extensometer could happen to span one of these high-gradient defect zones, the mathematical correlation artificially registers an underestimation of local strain, resulting in an unphysically high apparent stiffness. Consequently, these extreme values highlight the susceptibility of discrete local measurements to manufacturing-induced noise and underscore the necessity of the proposed statistical filtering protocol, which successfully could reduce the effect of these non-physical anomalies to recover a realistic and cohesive macroscopic Young’s modulus.
To conclusively validate the hypotheses regarding the physical origin of this localized kinematic noise, future research must incorporate multi-scale quality assessment directly from the manufacturing stage. Specifically, upcoming works will focus on correlating these full-field DIC measurements with advanced microstructural characterization and non-destructive testing. This comprehensive approach will definitively ascertain whether the observed strain variability is strictly driven by the aforementioned inherent meso-structural defects of the filament winding process or influenced by localized optical limitations.




 ,
,