Abstract
The ACI 544-2R repeated impact test is known as a low-cost and simple qualitative test to evaluate the impact strength of concrete. However, the test’s main deficiency is the high variability in its results. The effect of steel fibers and the compressive strength of concrete on the variability in repeated impact test results was investigated experimentally and statically in this study. Two batches from four mixtures were prepared and tested for this purpose. Hooked-end steel fibers were utilized in the fibrous mixtures. The mixtures NC, NC-SF0.5 and NC-SF1.0 were normal strength mixtures with 0, 0.5 and 1.0% of steel fibers, respectively, while HC was a plain high-strength mixture. The impact tests were conducted using an automatic testing machine following the setup of the ACI 544-2R repeated impact test. The impact numbers at cracking (N1) and at failure (N2) were recorded for both batches of the four mixtures. The results were also analyzed using the normal probability and Weibull distribution tests. The test results showed that the fibers increased the impact results at the cracking stage and significantly increased the failure impact resistance. Adding 0.5 and 1.0% of steel fibers increased the N1 by up to 66 and 111%, respectively, and increased the N2 by 114 and 374%, respectively. The test results also showed that duplicating the design compressive strength from 40 to 80 MPa increased the impact resistance by up to approximately 190%. The test results revealed no clear trend of an effect of steel fibers and compressive strength on the variability in the test results.
1. Introduction
Steel fiber is a proven reinforcing material that provides an adequate crack bridging capacity at the material scale, which extends post-cracking resistance to external loads, delays crack widening and propagation and hence postpones structural failure. Steel fibers are superior to other types of fibers, such as synthetic and natural fibers, in enhancing the stiffness of the cement matrix and enabling it to absorb higher energy under the effect of different types of loads. Previous studies showed that using steel fibers at volumetric contents not less than 1.0% was found to significantly increase the tensile strength of concrete [1,2,3], improve its flexural behavior and noticeably enhance its toughness and ductility [4,5,6], increase the one-way shear strength [7,8,9] and two-way punching shear capacity [10,11,12] of beams and slabs, and was found to have a positive impact on the durability and abrasion resistance of concrete surfaces subjected to parallel or normal forces [13,14,15]. On the other hand, others showed that adding steel fibers at low volumetric contents of less than 1.0% can improve the mechanical behavior of concrete under compressive, tensile, flexural and shearing stresses [2,5,6]. Another proven feature of steel fibers is their ability to boost the impact resistance of the different concrete types and alter their structural behavior to assure a more ductile failure under accidental impacts.
Impact forces mostly attack the structure or a part of the structure accidentally, while in a few other cases, the structure is already designed for such types of loads as in the case of airport runways, where the concrete surfaces are subjected to frequent impacts from airplane tires [16,17,18], or chute blocks in stilling basins, where the elements are designed to slow down the hydraulic jump by receiving normal impacts from the high-velocity moving water and water-borne materials [19,20,21]. On the other hand, the falling of construction materials from upper stories and altitudes, the explosive impact of projectiles in conflict areas or the collision of vehicles by the vertical structural elements in car parking garages are typical examples of accidental impacts [22,23]. Impact resistance is typically evaluated by a few tests that are used to investigate the impact energy absorption capacity of different types of materials including concrete. Projectile impact tests [24,25,26,27,28] and blast or explosive impact tests [29,30] are experimental simulations of military application impacts, which are very expensive and very difficult to perform in traditional university laboratories. The instrumented drop-weight impact test is the most commonly used test to evaluate the structural impact performance of structural members such as slabs or beams, where mostly large-scale structural specimens are tested under heavy impact loads. This test is too expensive and requires great effort for the specimens’ production and test setup in addition to the sophisticated data acquisition systems. Several previous studies were conducted using the instrumented drop-weight impact test to evaluate the effect of steel fibers on the response of concrete elements to impact loads [31,32,33,34]. The Charpy pendulum test is the second most typical impact test. This test is less expensive and less sophisticated compared to the former one and was also adopted by many previous researchers [35,36] to explore the role of steel fibers in enhancing concrete impact resistance. As a low-cost easy-to-perform alternative, the ACI 544-2R [37] introduced the repeated drop-weight impact test. This test is performed on small sized cylindrical specimens and does not require any sensors, measurement tools or sophisticated data loggers, which makes it a simple and cheap impact test [38,39]. However, the test was designed for comparison purposes between the impact resistances of different types of concrete or to investigate the effect of specific material parameters on the impact performance of concrete. Hence, it can be considered as a qualitative testing tool rather than being a standard quantitative impact test [37]. Therefore, this test was utilized by many former and recent studies to explore the effect of different types of fibers including polypropylene fibers [40,41,42,43,44], polyvinyl alcohol fibers [45], hybrid synthetic fibers [46,47], recycled synthetic fibers [48,49,50], steel fibers [51,52,53,54,55] and natural fibers [56]. The effects of other additives that influence impact energy were also investigated by other researchers, including crumb rubber [57,58,59,60], asphalt-coated aggregates [61] and nanocarbon tubes [62].
While the repeated impact test of the ACI 544-2R has the strengths of ease of use and low cost, its major weakness is represented by the high scattering of its obtained results [63,64,65,66]. The test relies on counting the number of impact blows on the central point of the specimen’s top surface until cracking and failure. The test setup and the definition of cracking and failure are sources of some deficiency points that increase the variability in the recorded cracking and failure impact numbers [65,67]. This weakness was identified by previous researchers [64,65], while others gave suggestions to reduce the obtained scattering of test results [64,68,69,70,71]. Meanwhile, other studies implied statistical analyses to study the scattering of the repeated impact test results. Weibull distribution was utilized by many previous studies where it was introduced as a successful tool to describe the results’ variation, while other studies adopted the normality test or the normal distribution test to explore its applicability on the recorded cracking and impact numbers.
Nataraja et al. [72] used the normal distribution test to study the scattering of normal-strength concrete specimens incorporating 0.5% of crimped steel fibers. Two batches of specimens were investigated and tested using the normal distribution. The result variations were high within and between the two batches where the cracking and failure impact records did not follow the normal distribution. Song et al. [73] tested the variability in the ACI 544-2R impact results using the normal distribution. The compressive strength of the tested specimens was approximately 24 MPa, while the specimens were reinforced with 0.5% of hooked-end steel fibers. The results of this study and another study [74] by the authors on high-strength concrete showed that the normal distribution was not suitable to describe the result scattering. It should be mentioned that the recorded coefficients of variations (COVs) of Nataraja et al. [72] and Song et al. [73,74] were in general higher than 40%. Rahmani et al. [75] used 50 mm long hooked-end steel fibers with a normal-strength concrete mixture and reported weak normal distributions. Abid et al. [65] conducted ACI 544-2R tests on high-performance concrete mixtures reinforced with micro-steel fibers. Both researchers reported a low tendency of the cracking and failure impact results to follow the normal distribution.
As disclosed in the introductory paragraphs, the variation in the impact test results of steel fiber-reinforced concrete mixtures has been investigated using the fixed fiber volumetric contents of fibers and using a specific level of compressive strength. Therefore, this study was directed at investigating the effect of the fiber content and strength grade on the scattering of the cracking and failure impact results of specimens tested using the ACI 544-2R repeated impact test. Therefore, cylindrical impact specimens from four concrete mixtures were prepared and tested using the repeated impact test procedure. The first three mixtures were designed to have a normal compressive strength with three steel fiber contents of 0, 0.5 and 1.0%, respectively, to investigate the influence of the fiber content, while the fourth was designed to be a high-strength mixture with a design compressive strength of 80 MPa to study the effect of the concrete grade of the results’ variation. The Anderson–Darling normality test was used in this study to analyze the normality of the obtained impact results.
2. The Experimental Work
2.1. Materials and Mixture Details
Normal-strength and high-strength concrete mixtures and normal-strength steel fiber-reinforced mixtures were prepared in this study to examine their performance under repeated impact loading. Ordinary Portland cement of the type 42.5 was used in this study from the local cement factory (Mass, Sulaymaniyah, Iraq). The used cement had a specific surface area of 368 m2/kg, while its specific gravity equaled 3.15. Natural aggregates were used from the eastern area of Wasit Province in Iraq. The coarse aggregate was crushed gravel that had a maximum particle size of 12.5 mm, while the fine aggregate was natural sand with a fineness modulus of 2.46. The sieve analysis of the used gravel and sand is depicted in Figure 1. The Sika® ViscoCrete 5930-L superplasticizer was adopted in this study as the only chemical additive, which was essential to achieve the required workability, while tap water was used in all mixtures. To assure the required bonding with the surrounding concrete, hooked-end steel fibers as shown in Figure 2 were used in the fibrous mixtures. The adopted type had a geometry with an aspect ratio of 70, a fiber length and diameter of 35 mm and 0.5 mm, respectively, and a tensile strength of 1200 MPa.
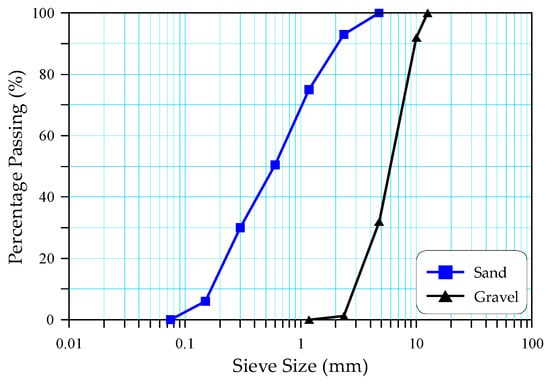
Figure 1.
Particle grading of the used crushed gravel and sand.
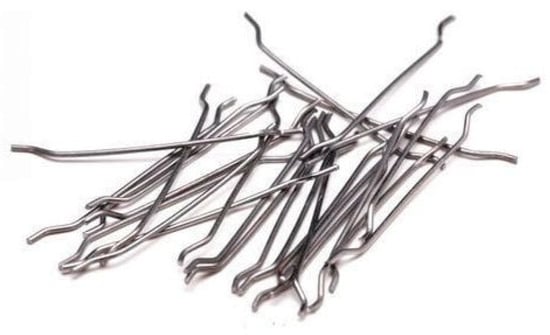
Figure 2.
Hooked-end steel fibers.
Four concrete mixtures were used in this study to explore the effect of the concrete strength and steel fiber content on the repeated impact resistance. Three normal-strength (NC) concrete mixtures and one high-strength mixture (HC) were adopted as shown in Table 1. The reference concrete mixture was NC and included no steel fiber, while similar mixtures were prepared with 0.5% of the volumetric content of steel fiber (NC-SF0.5) and 1.0% of the steel fiber (NC-SF1.0). Comparing the three NC mixtures gave a picture about the effect of the fiber content, while comparing the NC with the HC evaluated the effect of the original concrete strength. As shown in Table 1, there was a need to use a superplasticizer (SP) to enhance the workability of the fibrous mixtures, where it is known that fibers negatively influence the workability, while no super plasticizer was used with the NC.

Table 1.
Materials of the three mixtures (kg/m3).
Two batches were cast from each mixture using the same materials and mix proportions. The first batch (Batch 1) was cast in February, while the second (Batch 2) was cast in March. From each batch, six repeated impact cylindrical specimens were cast for each mixture. Thus, 12 cylinders were cast to evaluate the repeated impact of each mixture. All specimens from both batches were water cured in temperature-controlled curing tanks until the testing age at 28 days at a curing temperature of approximately 20 ± 2 °C. To evaluate the compressive strength, three 100 mm cubes were cast with each batch of each mixture. The compressive strength and repeated impact specimens were tested at the same age.
2.2. Repeated Impact Test
The repeated impact procedure introduced by the ACI 544-2R [37] was used in this study as an evaluation tool to compare the impact resistance of four concrete mixtures. This test was first suggested by Schrader [76] as a qualitative comparison test and not as a standard procedure to quantitatively determine the impact strength of concrete. The test is simple and easy to perform by hand, where a steel frame is required to hold a dropping weight of 4.54 kg that freely falls on a concrete specimen from a height of 457 mm. The load in the ACI 544-2R smoothly drops using two standing stainless steel shafts that are fixed on a stiff steel plate. The test specimen is set on the steel plate and fixed in place using four steel lugs that prevent rebound under loading. The test specimen is a cylindrical disk that has an approximate diameter of 150 mm and an approximate thickness of 64 mm. The impact load does not fall directly on the specimen, where it should be transferred through a 64 mm steel ball that rests on the center of the specimen’s top surface. The steel ball is fixed in place using a steel ring that is attached to the specimen’s holding frame. The procedure of the test requires counting the number of repeated impacts to cause the first visible surface crack (N1) and the number of impacts to fail the specimen (N2), which is defined by the widening of the cracks so that the specimen splits into parts that at least touch three of the four holding lugs.
The test was performed in this study using the automatic testing machine shown in Figure 3. Compared to the ACI 544-2R manual apparatus, this testing machine better controls the test parameters, allows for a clearer observation for cracking and failure than visual inspection, reduces the effort and time required to perform the test and significantly reduces the impact noise using a special external container. This testing machine was designed and fabricated by the research team at Wasit University in Iraq.
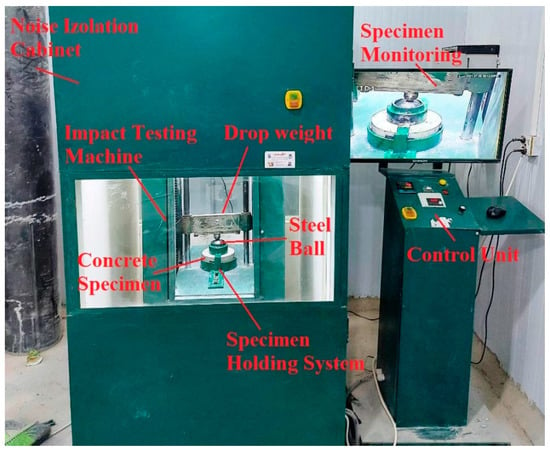
Figure 3.
The repeated impact testing machine.
3. Results and Discussion
The impact results obtained in this study are analyzed and discussed in this section. As described in the previous sections, two batches of the same concrete mixtures were cast and tested. The results are presented in this section for each of the two batches and the sum of both batches. The results of the cracking and failure impact numbers were investigated in terms of the variability among and between the batches to show the influence of the investigated parameters, which were the fiber content and the concrete strength.
3.1. Compressive Strength
The compressive strength records of both batches for the four mixtures are shown in Figure 4. As disclosed in the previous section, the NC mixture was designed to have a compressive strength of 40, while the high-strength mixture HC was designed to have a compressive strength of 80 MPa. The recorded strengths of the NC of both batches was close to the design strength, which were 40.3 and 42.4 MPa for Batches 1 and 2, respectively. Similarly, the obtained compressive strengths of the HC of both batches were 73.1 and 83.1 MPa, respectively, which are also close to the designed high strength. Figure 4 shows that incorporating steel fibers increased the compressive strength and the percentage increase was higher as the fiber content increased. The compressive strength of the NC-SF0.5 mixture was higher than that of the NC by 2.9 to 5.2%, while adding 1.0% of steel fibers (NC-SF1.0) increased the compressive strength by 16.8 to 27.1%. The addition of steel fibers increases the stiffness of the cement matrix and reinforces its bond with the surrounding aggregate. Hence, a better resistance to crushing and fracturing is maintained by adding steel fibers, which delays the failure under compression loads and increases the compressive strength. Although some previous studies [15,58] reported an insignificant effect of steel fibers on the compressive strength, the increase in compressive strength due to the incorporation of steel fibers was also reported in several previous studies [22,72,74,77,78,79,80]. Murali et al. [81] attributed the increase in compressive strength to the stress distribution which occurred due to the crack arresting activity of steel fibers.
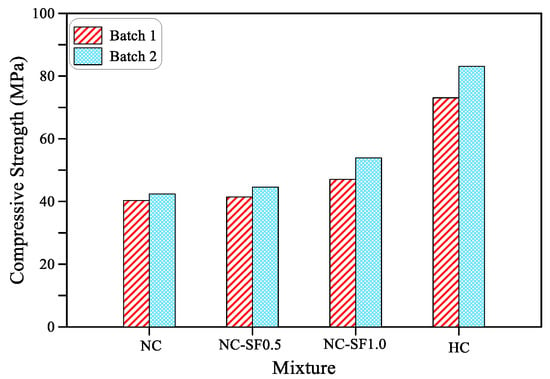
Figure 4.
Compressive strength of all mixtures.
3.2. Influence of Investigated Parameters on Impact Number Results
For each of the four mixtures, the cracking N1 and failure N2 impact numbers are listed for Batch 1 and Batch 2 in Table 2 and Table 3, respectively, while Table 4 lists the results of all specimens in the two batches.

Table 2.
Cracking and failure impact numbers of Batch 1.

Table 3.
Cracking and failure impact numbers of Batch 2.

Table 4.
Cracking and failure impact numbers of the two batches.
3.2.1. Influence of Steel Fibers
Comparing the results of the NC, NC-SF0.5 and NC-SF1.0 provides a better picture about the influence of steel fiber content on the impact performance of the normal strength specimens. The recorded cracking number N1 for the reference plain normal-strength mixture (NC) from the two batches ranged from 76.5 to 108.7 blows with an overall average of 92.6 blows. On the other hand, the N1 of the fibrous mixture NC-SF0.5 was in the range of 119.3 to 137.2, with an overall average of 128.3 blows, as shown in Figure 5a. This means that the cracking impact strength increased by 26.2 to 66.0% when 0.5% of steel fiber was incorporated. The addition of 1.0% of steel fibers to the mixture NC-SF1.0 increased the N1 to 161.2 and 218 blows, which reflects a percentage increase in the N1 of 100.6 to 110.7% compared to the reference NC specimens, as shown in Figure 5b. The increase in the cracking number under impact loads is attributed to the ability of steel fibers to cross the internal microcracks and arrest their propagation to visual surface cracks. The crack arresting capability of steel fibers allows the specimen to absorb higher impact energy before cracking, which is translated in terms of higher N1 records. Increasing the fiber content from 0.5 to 1.0% means that the crack arresting activity is duplicated by providing more fibers across each internal crack, which further increases the recorded impact number as shown in Figure 5.
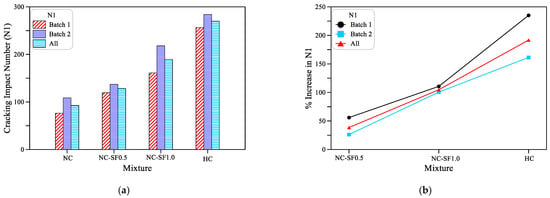
Figure 5.
Impact results at cracking stage (a) N1 records of all mixtures (b) percentage increase in N1 of the fibrous and HC mixtures compared to the NC mixture.
Figure 6 shows the effect of the incorporated steel fibers on the failure impact number. The NC-SF0.5 specimens retained N2 values of 201 and 203 for the two batches with an average of 202, while the specimens with 1.0% SF (NC-SF1.0) retained much higher N2 records of 414 and 484 with an average of 449 blows until failure as shown in Figure 6a. Based on the failure impact number records of the reference plain NC specimens, which were 80 and 110 with an average of 95, a percentage increase of approximately 114% was attained in the N2 when 0.5% of SF was used in the mixture. On the other hand, the percentage increase in N2 based on the average records was approximately 374% for a fiber content of 1.0%. Hence, it can be said that using 0.5% SF duplicated the failure impact number, while incorporating 1.0% of SF increased the failure impact resistance to approximately four times that of the plain specimens. It is obvious that the percentage increase in the N2 due to fiber incorporation was much higher than that of the N1. A similar result was also highlighted by previous studies [59,82,83] and was attributed to the functional sequence of SF as crack bridging elements. Before cracking, a few tiny internal cracks are formed under the effect of the first few impact blows. These cracks are small in size compared to the dimensions of the mixture’s steel fiber. Steel fibers cross these cracks and arrest their widening when their size becomes within the fibers’ capability, which limits the fibers’ activity to its minimum. On the other hand, after the surface cracks become visible, the matrix is already full of irregular grids of internal cracks, where fibers are crossing and bridging these cracks at their full capacity until failure. Hence, fibers are fully functional at the post-cracking loading phase, which increases N2 records hugely compared to plain specimens.
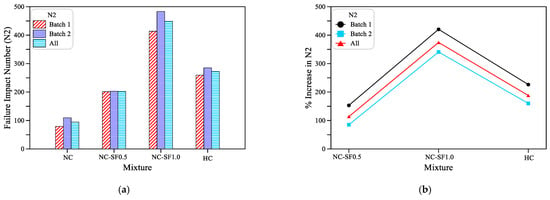
Figure 6.
Impact results at failure stage (a) N2 records of all mixtures (b) percentage increase in N2 of the fibrous and HC mixtures compared to the NC mixture.
3.2.2. Influence of Compressive Strength
Figure 5 and Figure 6 also show the effect of the mixture’s compressive strength on the retained cracking and failure impact numbers, which was achieved by the comparison between the results of the NC and HC mixtures. As discussed in Section 3.1, the NC was designed as a normal-strength mixture with a 28-day design strength of 40 MPa, while the HC was designed as a high-strength mixture with a 28-day design strength of 80 MPa. It is obvious in Figure 5a and Table 2, Table 3 and Table 4 that the N1 of the HC was several times higher than that of the NC and was the highest among the four mixtures. Considering the average records of both batches, NC specimens could withstand approximately 93 blows before cracking, while the N1 of the HC was as high as 270 blows. Hence, the N1 of the HC was approximately three times that of the NC or more precisely, the percentage increase in the N1 of the HC over the NC was 192%. A similar trend of an increase in impact strength due to an increase in compressive strength was also recorded in a previous study [39]. The development in strength of the HC is attributable to the denser and less porous matrix due to the increase in cement content and decrease in the water–cement ratio, which reduced the voids and internal cracking of the cement matrix resulting in a stiffer cement matrix and a better bond with the aggregate particles. This microstructural scale material enhancement improved the capability of the specimens to absorb higher impact energies and thus record higher impact numbers.
Similar results were also recorded at the failure stage, where the recorded N2 blows of the two batches were approximately 260 and 285 with an average of approximately 272 as shown in Figure 6a, which means that the percentage increase over the N2 of the NC specimens was ranging from 160 to 226% with an average of 188% as shown in Figure 6b. It should be noted that the percentage increase in HC was superior at the cracking stage, which was even higher than in the fibrous mixtures, while the fibrous mixtures could better resist failure impacts compared to the HC. This is because the majority of the fiber crack bridging action occurs after cracking and until failure; hence, fibers improve the failure impact much more significantly than the cracking impact. On the other hand, the improvement of the original strength is built on the basis of the overall development of the cement matrix stiffness and its bond with the aggregate, which is not connected with the loading stage or the crack propagation.
3.3. Variation Analysis of Impact Number Results
The variation in the test results are depicted in the form of the coefficient of variation (COV) for the cracking stage in Figure 7a and for the failure stage in Figure 7b. It is obvious that the differences between the COV in the two batches of the normal strength mixtures are minimal both at the cracking and failure stages. For instance, the N1 COVs of Batch 1 and Batch 2 of the NC were 36.7 and 40.0%, respectively, with an average of 39.2% for the 12 specimens of the two batches. Hence, the maximum difference in the COV of the two batches from the COV of all specimens was 6.4%. Similarly, for the same mixture, the maximum difference between the COV of the two batches at the failure stage from that of both batches was 7.8%. For the NC-SF0.5 and NC-SF1.0 mixtures, the differences of the COV in N1 and N2 were 9.9 and 22.2% and 6.1 and 10.0%, respectively. On the other hand, the high-strength HC mixture exhibited a wider range of COV differences both at the cracking and failure stages as shown in Figure 7, where the COV at both stages ranged from slightly less than 28% to slightly higher than 48%. The increase in COV can be attributed to different factors that are related to the material itself or the test setup [65,84]. The differences between the COV between the two batches reflect the effects of these influential factors and were also reported by previous studies [65].
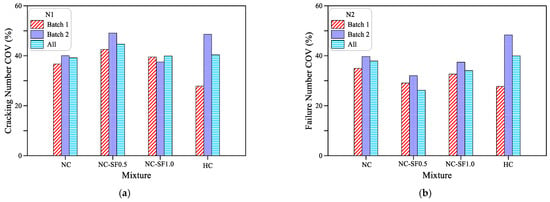
Figure 7.
Coefficients of variation in the impact numbers for (a) N1 and (b) N2.
Figure 7b shows that steel fiber-reinforced mixtures exhibited slightly lower COVs at the failure stage compared to the plain mixture, while such behavior was not clear at the cracking stage with slightly higher COVs for fibrous specimens as shown in Figure 7a. Impact test results reported by Nataraja et al. [72] support the obtained results in this study, where the cracking stage COVs of plain and steel fiber-reinforced mixtures were 53.7 and 57.3%, respectively, while at the failure stage, the fibrous specimens recorded a lower COV of 46.5% compared to a 50.6% COV of the plain specimens. However, Song et al. [74] reported very close COV values for both plain and fibrous specimens. Ding et al. [85] agree with the results of this study that at the cracking stage, fibrous specimens exhibit higher COVs, while the failure impact results of fibrous specimens showed fluctuating COVs that were either lower or higher than those of the plain specimens. An explanation of the higher COVs at the cracking stage of the fibrous specimens may be due to the uncertainty of the degree of functionality of steel fibers between the specimens owing to the different numbers and combinations of internal microcracks in these specimens. Hence, the different percentage developments in the N1 due to steel fibers increase the variability in test results at this stage. For the case of compressive strength effects, considering the 12 specimen records, the COVs of the NC and HC were very close with slightly higher records for the HC both for N1 and N2 as shown in Figure 7.
4. Normality Analysis of Impact Number Results
The Anderson–Darling normality test was adopted in this study to evaluate the distributions of the N1 and N2 results of both batches (12 records of Batch 1 and Batch 2) for each of the four mixtures. The Anderson–Darling test was used due to the limited number of tested samples for each impact test. The null hypothesis assumes that data are different, which is evaluated using this test and visualized in terms of a probability plot. Before exploring the results of the normality test, the data histogram distributions are shown for the four mixtures in Figure 8 for N1 and in Figure 9 for N2. The histograms show that none of the N1 and N2 result distributions of the four mixtures has the tendency to follow the typical histogram of normal distribution, while as shown in Figure 10 and Figure 11, the p-values of all mixtures were more than 0.05, which means that the null hypothesis was accepted and there was no significant departure from the normal distribution. However, it is visually presented in Figure 10 and Figure 11 that except for the HC mixture, all data of the other mixtures widely fluctuate around the linear fit and do not lie along this fit, which reflects some departure from the normal distribution reinforcing the histograms. As a result, it can be said that according to the null hypothesis and Anderson–Darling normality test, the N1 and N2 results show no significant departure from normal distribution. On the other hand, significant departures from the normal distribution can be addressed according to the histogram distribution and the probability distribution plots.
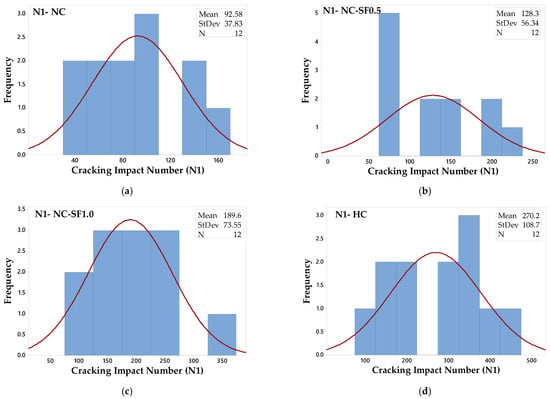
Figure 8.
Distributions of results at the cracking stage for mixtures (a) NC (b) NC-SF0.5 (c) NC-SF1.0 and (d) HC.
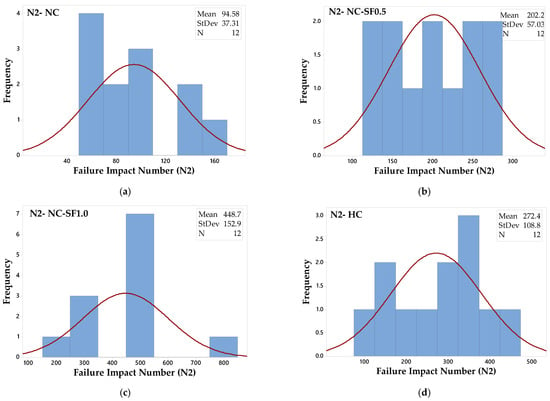
Figure 9.
Distribution of results at the failure stage for mixtures (a) NC (b) NC-SF0.5 (c) NC-SF1.0 and (d) HC.
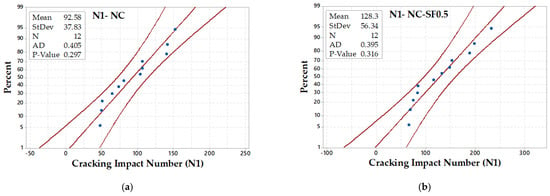
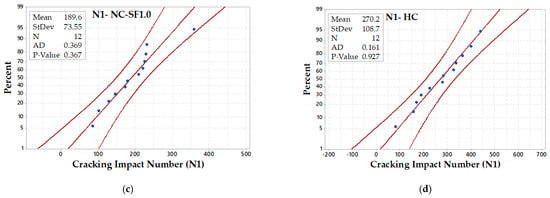
Figure 10.
Normal probability plots of the results at the cracking stage for mixtures (a) NC (b) NC-SF0.5 (c) NC-SF1.0 and (d) HC.
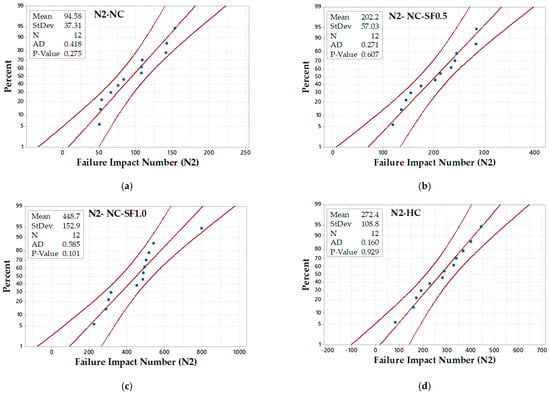
Figure 11.
Normal probability plots of the results at the failure stage for mixtures (a) NC (b) NC-SF0.5 (c) NC-SF1.0 and (d) HC.
5. Weibull Distribution
During the preliminary phases of the investigation into the impact strength of concrete, scientists discovered that the ACI 544-2R repeated drop-weight test was distinct. Despite the significant amount of work put into creating equal testing settings, the findings of the tests were clearly distinguishable. As a result, statistical analysis seemed necessary to make sense of the findings. Scientific investigation has determined that the impact strength of concrete follows the Weibull distribution [86]. The Weibull distribution can be used to produce the minimal safety impact strength of concrete, which is reasonable enough according to actual design applications. Recently, the Weibull distribution has become increasingly popular when describing the impact strength of concrete [86]. In this study, the impact strength of concrete was evaluated statistically using a two-parameter Weibull distribution. Weibull’s function could be used under this working hypothesis to characterize the distribution of impact strength: function based on two parameters. Specifically, the Weibull distribution’s density function of probabilities is expressed as Equation (1) [87].
where b is the shape parameter, Na is the scale parameter and N is the minimal amount of impact strength safety. Weibull distributions depend on the impact strength Nf. The intensity of the impact strength to the chance of survival is defined as P = N. The distribution function F(N) was derived from Equation (1) and written as an expression in Equation (2) [88].
The probability of failure is denoted by the symbol P (Nf < N). So,
Based on Equation (3), it is possible to determine N if the values for b, Na and N0 are all established to be within a certain rate of survival P. Since the impact resistance of concrete is unique, the N0 of both regular and fibrous concrete is considered to be 0. In light of this, we could reduce Equation (3) to a Weibull function with only two parameters as follows:
The formulas for the survival probability P and the failure probability are as follows:
The following equation could be obtained by taking the natural logarithm of the two sides of Equation (6):
Equation (7) could then be converted into a linear form:
Define Y . The following is a valid form of Equation (7):
The aforementioned Equation (8) gives the impact strength, often known as the impact numbers specified by the Weibull function’s two parameters. Equation (8) is a linear function that can be used to check if the impact testing results fit the Weibull distribution, which has two parameters. The results of the impact strength were subjected to linear regression analysis. The test data are shown to be consistent with the Weibull two-parameter distribution if the best linear correlation can be found between Y and X. According to Equation (9), the relationship between Nf and p is as follows:
where i represents an ascending order of specimen numbers and k represents the complete results of the impact tests. To visualize this, we looked at Figure 12, which depicts the relationship between the ln[ln(1/p)] and ln(impact numbers) for all possible impact strengths. Impact strength results can be considered to follow a Weibull distribution with two parameters if the points are linearly correlated. The value for the shape parameter could be found by calculating the slope of the line resulting from the linear equation, while the value for the scale parameter could be found using Equation (10).
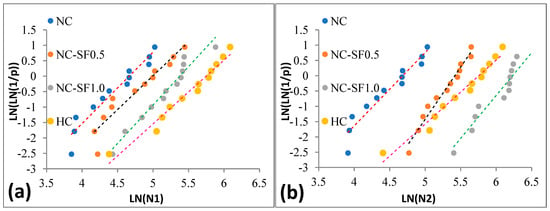
Figure 12.
Regression lines from the Weibull analysis. (a) LN(N1), (b) LN(N2).
The scale and shape parameters calculated were used in the evaluation that determined the impact strength (number of blows) corresponding to the predetermined reliability level. This evaluation can be written as Equation (11).
The obtained coefficient of determination from the linear regression, scale parameter, intercept and non-dimensional shape parameter for all four mixtures are demonstrated in Table 5. It is worth noting that all of the test samples followed a linear trend, indicating a high coefficient of determination (>0.90). It is also worth noting that the Weibull distribution provides solid proof for the N1 and N2.

Table 5.
Two parameters calculated from the Weibull analysis.
In order to estimate the N1 and N2, we used the parameters for the model’s shape and scale derived from the regression. Figure 13a–d illustrates the estimated impact numbers regarding the chance of survival and reliability for each specimen. By analyzing the degree of survival probability corresponding to 0.9, the N1 values for the NC, NC-SF0.5, NC-SF1.0 and HC specimens were 40, 53, 88 and 106, respectively. Similarly, the N2 values were 42, 117, 228 and 108, respectively. These depicted reliability curves may be considered an efficient method for quickly estimating the impact numbers without requiring costly and time-consuming additional impact testing. Other studies also found similar results [89]. This is also a tool for fibrous composite producers to capitalize on a user-driven market for increased impact resistance.
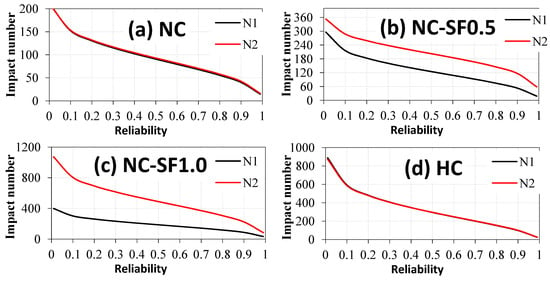
Figure 13.
Impact strengths at the required levels of reliability.
6. Conclusions
- The test results showed that the addition of 0.5% steel fibers to the NC mixture resulted in an increase of the cracking impact number (N1) by approximately 26 to 66%, while increasing the fiber percentage to 1.0% increased the N1 by approximately 101 to 111%. Moreover, incorporating 0.5% of steel fibers increased the failure impact number (N2) by approximately 114%, while adding 1.0% of steel fibers resulted in a significant jump in the N2 by approximately 374% compared to the NC reference specimens. The positive role of steel fibers becomes higher after cracking than before cracking due to the increase in crack numbers, width and length, which means that most of the steel fibers crossing the cracks become active in crack arresting.
- Duplicating the design compressive strength of the specimens from 40 to 80 MPa increased the impact strength by approximately three times. The percentage increase in N1 of the HC over the NC was approximately 192%, while it was approximately 188% at the failure stage (N2). The results also showed that the effect of compressive strength on the impact strength was higher than the effect of steel fibers at the cracking stage, while steel fibers were more effective at the failure stage.
- There was no specific fixed trend of an increase or decrease in result variability, represented by the COV, with the content of steel fibers. However, it was recorded that at the cracking stage, fibrous mixtures exhibited slightly higher COVs compared to plain specimens, while their COVs were lower at the failure stage. The normal distribution histograms showed that none of the four mixtures exhibited a clear tendency to follow the normal distribution, which was also confirmed by the probability plots, while the p-values of the Anderson–Darling normality test showed no significant departure from the normal distribution.
- The results of all of the specimens that were evaluated using the Weibull distribution showed a linear correlation, whereas the information showing impact strength approximated the Weibull distribution with two parameters. Therefore, a Weibull distribution with only two parameters can be considered as a good technique to save money and time by doing away with the need for an actual experiment. The designers can then use a determined reliability–impact strength curve to choose the suitable impact strength needed for engineering calculations.
Author Contributions
Conceptualization, S.R.A. and A.A.A.; methodology, S.R.A., A.I.A. and S.H.A.; software, S.R.A.; validation, A.A.A. and S.R.A.; formal analysis, A.A.A. and S.R.A.; investigation, S.R.A., A.I.A. and S.H.A.; resources, A.A.A. and S.R.A.; data curation, A.I.A. and S.H.A.; writing—original draft preparation, S.R.A. and A.A.A.; writing—review and editing, S.R.A. and A.A.A.; visualization, S.R.A.; supervision, A.A.A. and S.R.A.; project administration, S.R.A. All authors have read and agreed to the published version of the manuscript.
Funding
This research received no external funding.
Data Availability Statement
Not applicable.
Acknowledgments
The authors would like to express their thanks for the staff of the Construction Materials Laboratory of the College of Engineering of the University of Wasit in the Iraq and Al-Sharq Laboratory in Iraq for their support during the experimental work.
Conflicts of Interest
The authors declare no conflict of interest.
References
- Guo, H.; Tao, J.; Chen, Y.; Li, D.; Jia, B.; Zhai, Y. Effect of steel and polypropylene fibers on the quasi-static and dynamic splitting tensile properties of high-strength concrete. Constr. Build. Mater. 2019, 224, 504–514. [Google Scholar] [CrossRef]
- Larsen, I.L.; Thorstensen, R.T. The influence of steel fibres on compressive and tensile strength of ultra high performance concrete: A review. Constr. Build. Mater. 2020, 256, 119459. [Google Scholar] [CrossRef]
- Li, X.; Zhang, Y.; Shi, C.; Chen, X. Experimental and numerical study on tensile strength and failure pattern of high performance steel fiber reinforced concrete under dynamic splitting tension. Constr. Build. Mater. 2020, 259, 119796. [Google Scholar] [CrossRef]
- Yixin, C.; Jianye, Z.; Jicheng, M.; Shunli, Z.; Yongsheng, L.; Zhixuan, Z. Tensile strength and fracture toughness of steel fiber reinforced concrete measured from small notched beams. Case Stud. Constr. Mater. 2022, 17, e01401. [Google Scholar] [CrossRef]
- Chen, G.; Gao, D.; Zhu, H.; Yuan, J.S.; Xiao, X.; Wang, W. Effects of novel multiple hooked-end steel fibres on flexural tensile behaviour of notched concrete beams with various strength grades. Structures 2021, 33, 3644–3654. [Google Scholar] [CrossRef]
- Abbass, A.A.; Abid, S.R.; Özakça, M. Experimental investigation on the effect of steel fibers on the flexural behavior and ductility of high-strength concrete hollow beams. Adv. Civ. Eng. 2019, 2019, 8390345. [Google Scholar] [CrossRef]
- Sabetifar, H.; Nematzadeh, M. An evolutionary approach for formulation of ultimate shear strength of steel fiber-reinforced concrete beams using gene expression programming. Structures 2021, 34, 4965–4976. [Google Scholar] [CrossRef]
- Algassem, O.; Li, Y.; Aoude, H. Ability of steel fibers to enhance the shear and flexural behavior of high-strength concrete beams subjected to blast loads. Eng. Struct. 2019, 199, 109611. [Google Scholar] [CrossRef]
- Yaseen, Z.M.; Tran, M.T.; Kim, S.; Bakhshpoori, T.; Deo, R.C. Shear strength prediction of steel fiber reinforced concrete beam using hybrid intelligence models: A new approach. Eng. Struct. 2018, 177, 244–255. [Google Scholar] [CrossRef]
- Maya, L.F.; Ruiz, M.F.; Muttoni, A.; Foster, S.J. Punching shear strength of steel fibre reinforced concrete slabs. Eng. Struct. 2012, 40, 83–94. [Google Scholar] [CrossRef]
- Arna’ot, F.H.; Abbass, A.A.; Abualtemen, A.A.; Abid, S.R.; Özakça, M. Residual strength of high strength concentric column-SFRC flat plate exposed to high temperatures. Constr. Build. Mater. 2017, 154, 204–218. [Google Scholar] [CrossRef]
- Ju, M.; Ju, J.-W.W.; Sim, J. A new formula of punching shear strength for fiber reinforced polymer (FRP) or steel reinforced two-way concrete slabs. Compos. Struct. 2021, 259, 113471. [Google Scholar] [CrossRef]
- Ali, S.H.; Ayoob, N.S.; Abdul Hussein, M.L.; Abid, S.R. Water impact-abrasion erosion of hybrid fiber-reinforced high performance concrete. Nano Hybrids Compos. 2020, 30, 63–72. [Google Scholar]
- Liu, Y.-W.; Lin, Y.-Y.; Cho, S.-W. Abrasion behavior of steel-fiber-reinforced concrete in hydraulic structures. Appl. Sci. 2020, 10, 5562. [Google Scholar] [CrossRef]
- Ayoob, N.S.; Abid, S.R.; Hilo, A.N. Water-impact abrasion of self-compacting concrete. Mag. Civ. Eng. 2020, 96, 60–69. [Google Scholar]
- Zhang, W.; Chen, S.; Liu, Y. Effect of weight and drop height of hammer on the flexural impact performance of fiber-reinforced concrete. Constr. Build. Mater. 2017, 140, 31–35. [Google Scholar] [CrossRef]
- Pan, Y.; Wu, C.; Cheng, X.; Li, V.C.; He, L. Impact fatigue behaviour of GFRP mesh reinforced engineered cementitious composites for runway pavement. Constr. Build. Mater. 2020, 230, 116398. [Google Scholar] [CrossRef]
- Salaimanimagudam, M.P.; Suribabu, C.R.; Murali, G.; Abid, S.R. Impact response of hammerhead pier fibrous concrete beams designed with topology optimization. Period. Polytech. Civ. Eng. 2020, 64, 1244–1258. [Google Scholar] [CrossRef]
- Kryžanowski, A.; Mikoš, M.; Šušteršič, J.; Ukrainczyk, V.; Planinc, I. Abrasion resistance of concrete in hydraulic structures. ACI Mater. J. 2009, 106, 349–356. [Google Scholar]
- Abid, S.R.; Ali, S.H.; Murali, G.; Al-Gasham, T.S. A simple suggested approach to reduce the testing time of concrete surface abrasion using ASTM C1138. Case Studies Constr. Mater. 2021, 15, e00685. [Google Scholar] [CrossRef]
- Zarrabi, N.; Moghim, M.N.; Eftekhar, M.R. Effect of hydraulic parameters on abrasion erosion of fiber reinforced concrete in hydraulic structures. Constr. Build. Mater. 2021, 267, 120966. [Google Scholar] [CrossRef]
- Nili, M.; Afroughsabet, V. Combined effect of silica fume and steel fibers on the impact resistance and mechanical properties of concrete. Int. J. Impact Eng. 2010, 37, 879–886. [Google Scholar] [CrossRef]
- Zhang, W.; Chen, S.; Zhang, N.; Zhou, Y. Low-velocity flexural impact response of steel fiber reinforced concrete subjected to freeze-thaw cycles in NaCl solution. Constr. Build. Mater. 2015, 101, 522–526. [Google Scholar] [CrossRef]
- Liu, J.; Li, J.; Fang, J.; Su, Y.; Wu, C. Ultra-high performance concrete targets against high velocity projectile impact—A-state-of-the-art review. Int. J. Impact Eng. 2022, 160, 104080. [Google Scholar] [CrossRef]
- Feng, J.; Gao, X.; Li, J.; Dong, H.; He, Q.; Liang, J.; Sun, W. Penetration resistance of hybrid-fiber-reinforced high-strength concrete under projectile multi-impact. Constr. Build. Mater. 2019, 202, 341–352. [Google Scholar] [CrossRef]
- Lee, M.; Park, G.K.; Kim, S.W.; Kwak, H.G. Damage characteristics of high performance fiber-reinforced cement composites panels subjected to projectile impact. Int. J. Mech. Sci. 2022, 214, 106919. [Google Scholar] [CrossRef]
- Murali, G.; Abid, S.R.; Abdelgader, H.S.; Amran, Y.H.M.; Shekarchi, M.; Wilde, K. Repeated projectile impact tests on multi-layered fibrous cementitious composites. Int. J. Civ. Eng. 2021, 19, 635–651. [Google Scholar] [CrossRef]
- Mina, A.L.; Petrou, M.F.; Trezos, K.G. Resistance of an optimized ultra-high performance fiber reinforced concrete to projectile impact. Buildings 2021, 11, 63. [Google Scholar] [CrossRef]
- Ziada, M.; Erdem, S.; Tammam, Y.; Kara, S.; Lezcano, R.A.G. The effect of basalt fiber on mechanical, microstructural, and high-temperature properties of fly ash-based and basalt powder waste-filled sustainable geopolymer mortar. Sustainability 2021, 13, 12610. [Google Scholar] [CrossRef]
- Yoo, D.Y.; Banthia, N. Mechanical and structural behaviors of ultra-high-performance fiber-reinforced concrete subjected to impact and blast. Constr. Build. Mater. 2017, 149, 416–431. [Google Scholar] [CrossRef]
- Yılmaz, T.; Anil, Ö.; Tuğrul Erdem, R. Experimental and numerical investigation of impact behavior of RC slab with different opening size and layout. Structures 2022, 35, 818–832. [Google Scholar] [CrossRef]
- Batran, T.Z.; Ismail, M.K.; Hassan, A.A.A. Behavior of novel hybrid lightweight concrete composites under drop-weight impact loading. Structures 2021, 34, 2789–2800. [Google Scholar] [CrossRef]
- Huang, Z.; Chen, W.; Tran, T.T.; Pham, T.M.; Hao, H.; Chen, Z.; Elchalakani, M. Experimental and numerical study on concrete beams reinforced with Basalt FRP bars under static and impact loads. Compos. Struct. 2021, 263, 113648. [Google Scholar] [CrossRef]
- Ashraf, M.R.; Akmal, U.; Khurram, N.; Aslam, F.; Deifalla, A.F. Impact resistance of Styrene–Butadiene Rubber (SBR) latex-modified fiber-reinforced concrete: The Role of Aggregate Size. Materials 2022, 15, 1283. [Google Scholar] [CrossRef] [PubMed]
- Yu, R.; Van Beers, L.; Spiesz, P.; Brouwers, H.J.H. Impact resistance of a sustainable Ultra-High Performance Fibre Reinforced Concrete (UHPFRC) under pendulum impact loadings. Constr. Build. Mater. 2016, 107, 203–215. [Google Scholar] [CrossRef]
- Saleem, M.A.; Saleem, M.M.; Ahmad, Z.; Hayat, S. Predicting compressive strength of concrete using impact modulus of toughness. Case Stud. Constr. Mater. 2021, 14, e00518. [Google Scholar] [CrossRef]
- ACI 544.2R-89; Measurement of Properties of Fiber Reinforced Concrete. American Concrete Institute: Farmington Hills, MI, USA, 1999.
- Jabir, H.A.; Abid, S.R.; Murali, G.; Ali, S.H.; Klyuev, S.; Fediuk, R.; Vatin, N.; Promakhov, V.; Vasilev, Y. Experimental tests and reliability analysis of the cracking impact resistance of uhpfrc. Fibers 2020, 8, 74. [Google Scholar] [CrossRef]
- Abid, S.R.; Abbass, A.A.; Murali, G.; Al-Sarray, M.L.J.; Nader, I.A.; Ali, S.H. Repeated impact response of normal- and high-strength concrete subjected to temperatures up to 600 °C. Materials 2022, 15, 5283. [Google Scholar] [CrossRef]
- Nili, M.; Afroughsabet, V. The effects of silica fume and polypropylene fibers on the impact resistance and mechanical properties of concrete. Constr. Build. Mater. 2010, 24, 927–933. [Google Scholar] [CrossRef]
- Alavi Nia, A.; Hedayatian, M.; Nili, M.; Sabet, V.A. An experimental and numerical study on how steel and polypropylene fibers affect the impact resistance in fiber-reinforced concrete. Int. J. Impact Eng. 2012, 46, 62–73. [Google Scholar] [CrossRef]
- Fakharifar, M.; Dalvand, A.; Arezoumandi, M.; Sharbatdar, M.K.; Chen, G.; Kheyroddin, A. Mechanical properties of high performance fiber reinforced cementitious composites. Comput. Chem. Eng. 2014, 71, 510–520. [Google Scholar] [CrossRef]
- Al-Ameri, R.A.; Abid, S.R.; Murali, G.; Ali, S.H.; Özakça, M.; Vatin, N.I. Residual impact performance of ECC subjected to sub-high temperatures. Materials 2022, 15, 454. [Google Scholar] [CrossRef] [PubMed]
- Al-Ameri, R.A.; Abid, S.R.; Özakça, M. Mechanical and impact properties of engineered cementitious composites reinforced with PP fibers at elevated temperatures. Fire 2022, 5, 3. [Google Scholar] [CrossRef]
- Ismail, M.K.; Hassan, A.A.A.; Lachemi, M. Performance of Self-Consolidating Engineered Cementitious Composite under Drop-Weight Impact Loading. J. Mater. Civ. Eng. 2019, 31, 04018400. [Google Scholar] [CrossRef]
- Yildirim, S.T.; Ekinci, C.E.; Findik, F. Properties of hybrid fiber reinforced concrete under repeated impact loads 1. Russ. J. Nondestruct. Test. 2010, 46, 538–546. [Google Scholar] [CrossRef]
- Ali, M.A.E.M.; Soliman, A.M.; Nehdi, M.L. Hybrid-fiber reinforced engineered cementitious composite under tensile and impact loading. Mater. Des. 2017, 117, 139–149. [Google Scholar] [CrossRef]
- Mastali, M.; Dalvand, A. The impact resistance and mechanical properties of self-compacting concrete reinforced with recycled CFRP pieces. Compos. Part B Eng. 2016, 92, 360–376. [Google Scholar] [CrossRef]
- Mastali, M.; Dalvand, A.; Sattarifard, A. The impact resistance and mechanical properties of the reinforced self-compacting concrete incorporating recycled CFRP fiber with different lengths and dosages. Compos. Part B Eng. 2017, 112, 74–92. [Google Scholar] [CrossRef]
- Mastali, M.; Dalvand, A.; Sattarifard, A.R. The impact resistance and mechanical properties of reinforced self-compacting concrete with recycled glass fibre reinforced polymers. J. Clean. Prod. 2016, 124, 312–324. [Google Scholar] [CrossRef]
- Abid, S.R.; Gunasekaran, M.; Ali, S.H.; Kadhum, A.L.; Al-Gasham, T.S.; Fediuk, R.; Vatin, N.; Karelina, M. Impact performance of steel fiber-reinforced self-compacting concrete against repeated drop weight impact. Crystals 2021, 11, 91. [Google Scholar] [CrossRef]
- Murali, G.; Prasad, N.; Klyuev, S.; Fediuk, R.; Abid, S.R.; Amran, M.; Vatin, N. Impact resistance of functionally layered two-stage fibrous concrete. Fibers 2021, 9, 88. [Google Scholar] [CrossRef]
- Kathirvel, P.; Murali, G.; Vatin, N.I.; Abid, S.R. Experimental study on self compacting fibrous concrete comprising magnesium sulphate solution treated recycled aggregates. Materials 2022, 15, 340. [Google Scholar] [CrossRef] [PubMed]
- Murali, G.; Abid, S.R.; Amran, M.; Fediuk, R.; Vatin, N.; Karelina, M. Combined effect of multi-walled carbon nanotubes, steel fibre and glass fibre mesh on novel two-stage expanded clay aggregate concrete against impact loading. Crystals 2021, 11, 720. [Google Scholar] [CrossRef]
- Murali, G.; Abid, S.R.; Mugahed Amran, Y.H.; Abdelgader, H.S.; Fediuk, R.; Susrutha, A.; Poonguzhali, K. Impact performance of novel multi-layered prepacked aggregate fibrous composites under compression and bending. Structures 2020, 28, 1502–1515. [Google Scholar] [CrossRef]
- Wang, W.; Chouw, N. The behaviour of coconut fibre reinforced concrete (CFRC) under impact loading. Constr. Build. Mater. 2017, 134, 452–461. [Google Scholar] [CrossRef]
- Swaminathan, P.; Karthikeyan, K.; Subbaram, S.R.; Sudharsan, J.S.; Abid, S.R.; Murali, G.; Vatin, N.I. Experimental and statistical investigation to evaluate impact strength variability and reliability of preplaced aggregate concrete containing crumped rubber and fibres. Materials 2022, 15, 5156. [Google Scholar] [CrossRef]
- AbdelAleem, B.H.; Ismail, M.K.; Hassan, A.A.A. The combined effect of crumb rubber and synthetic fibers on impact resistance of self-consolidating concrete. Constr. Build. Mater. 2018, 162, 816–829. [Google Scholar] [CrossRef]
- Khalil, E.; Abd-Elmohsen, M.; Anwar, A.M. Impact resistance of rubberized self-compacting concrete. Water Sci. 2015, 29, 45–53. [Google Scholar] [CrossRef]
- Ismail, M.K.; Hassan, A.A.A. Impact resistance and mechanical properties of self-consolidating rubberized concrete reinforced with steel fibers. J. Mater. Civ. Eng. 2017, 29, 04016193. [Google Scholar] [CrossRef]
- Vatin, N.I.; Murali, G.; Abid, S.R.; de Azevedo, A.R.G.; Tayeh, B.; Dixit, S. Enhancing the impact strength of prepacked aggregate fibrous concrete using asphalt-coated aggregates. Materials 2022, 15, 2598. [Google Scholar] [CrossRef]
- Murali, G.; Abid, S.R.; Vatin, N.I.; Amran, M.; Fediuk, R. Influence of height and weight of drop hammer on impact strength and fracture toughness of two-stage fibrous concrete comprising nano carbon tubes. Constr. Build. Mater. 2022, 349, 128782. [Google Scholar] [CrossRef]
- Soroushian, P.; Nagi, M.; Alhozaimy, A. Statistical variations in the mechanical properties of carbon fiber reinforced cement composites. ACI Mater. J. 1992, 89, 131–138. [Google Scholar]
- Badr, A.; Ashour, A.F. Modified ACI drop-weight impact test for concrete. ACI Mater. J. 2005, 102, 249–255. [Google Scholar]
- Abid, S.R.; Abdul Hussein, M.L.; Ali, S.H.; Kazem, A.F. Suggested modified testing techniques to the ACI 544-R repeated drop-weight impact test. Constr. Build. Mater. 2020, 244, 118321. [Google Scholar] [CrossRef]
- Myers, J.J.; Tinsley, M. Impact resistance of blast mitigation material using modified ACI drop-weight impact test. ACI Mater. J. 2013, 110, 339–348. [Google Scholar] [CrossRef]
- Badr, A.; Ashour, A.F.; Platten, A.K. Statistical variations in impact resistance of polypropylene fibre-reinforced concrete. Int. J. Impact Eng. 2006, 32, 1907–1920. [Google Scholar] [CrossRef]
- Zhu, X.C.; Zhu, H.; Li, H.R. Drop-weight impact test on U-shape concrete specimens with statistical and regression analyses. Materials 2015, 8, 5877–5890. [Google Scholar] [CrossRef]
- Ibrahim Haruna, S.; Zhu, H.; Jiang, W.; Shao, J. Evaluation of impact resistance properties of polyurethane-based polymer concrete for the repair of runway subjected to repeated drop-weight impact test. Constr. Build. Mater. 2021, 309, 125152. [Google Scholar] [CrossRef]
- Ramakrishnan, K.; Depak, S.R.; Hariharan, K.R.; Abid, S.R.; Murali, G.; Cecchin, D.; Fediuk, R.; Mugahed Amran, Y.H.; Abdelgader, H.S.; Khatib, J.M. Standard and modified falling mass impact tests on preplaced aggregate fibrous concrete and slurry infiltrated fibrous concrete. Constr. Build. Mater. 2021, 298, 123857. [Google Scholar] [CrossRef]
- Murali, G.; Abid, S.R.; Amran, M.; Vatin, N.I.; Fediuk, R. Drop weight impact test on prepacked aggregate fibrous concrete—An experimental study. Materials 2022, 15, 3096. [Google Scholar] [CrossRef]
- Nataraja, M.C.; Dhang, N.; Gupta, A.P. Statistical variations in impact resistance of steel fiber-reinforced concrete subjected to drop weight test. Cem. Concr. Res. 1999, 29, 989–995. [Google Scholar] [CrossRef]
- Song, P.S.; Wu, J.C.; Hwang, S.; Sheu, B.C. Statistical analysis of impact strength and strength reliability of steel-polypropylene hybrid fiber-reinforced concrete. Constr. Build. Mater. 2005, 19, 1–9. [Google Scholar] [CrossRef]
- Song, P.S.; Wu, J.C.; Hwang, S.; Sheu, B.C. Assessment of statistical variations in impact resistance of high-strength concrete and high-strength steel fiber-reinforced concrete. Cem. Concr. Res. 2005, 35, 393–399. [Google Scholar] [CrossRef]
- Rahmani, T.; Kiani, B.; Shekarchi, M.; Safari, A. Statistical and experimental analysis on the behavior of fiber reinforced concretes subjected to drop weight test. Constr. Build. Mater. 2012, 37, 360–369. [Google Scholar] [CrossRef]
- Schrader, E.K. Impact Resistance and Test Procedure for Concrete. J. Am. Concr. Inst. 1981, 78, 141–146. [Google Scholar] [CrossRef]
- Li, P.P.; Cao, Y.Y.Y.; Sluijsmans, M.J.C.; Brouwers, H.J.H.; Yu, Q. Synergistic effect of steel fibres and coarse aggregates on impact properties of ultra-high performance fibre reinforced concrete. Cem. Concr. Compos. 2021, 115, 103866. [Google Scholar] [CrossRef]
- Chen, M.; Si, H.; Fan, X.; Xuan, Y.; Zhang, M. Dynamic compressive behaviour of recycled tyre steel fibre reinforced concrete. Constr. Build. Mater. 2022, 3, 125896. [Google Scholar] [CrossRef]
- Meesala, C.R. Influence of different types of fiber on the properties of recycled aggregate concrete. Struct. Concr. 2019, 20, 1656–1669. [Google Scholar] [CrossRef]
- Zhang, H.; Huang, Y.J.; Yang, Z.-J.; Guo, F.-Q.; Shen, L.-H. 3D meso-scale investigation of ultra high performance fibre reinforced concrete (UHPFRC) using cohesive crack model and Weibull random field. Constr. Build. Mater. 2022, 327, 127013. [Google Scholar] [CrossRef]
- Murali, G.; Abid, S.R.; Vatin, N.I. Experimental and analytical modeling of flexural impact strength of preplaced aggregate fibrous concrete beams. Materials 2022, 15, 3857. [Google Scholar] [CrossRef]
- Abid, S.R.; Ali, S.H.; Goaiz, H.A.; Al-Gasham, T.S.; Kadhim, A.L. Impact resistance of steel fiber-reinforced self-compacting concrete. Mag. Civ. Eng. 2021, 105, 2712–8172. [Google Scholar] [CrossRef]
- Murali, G.; Prasad, N.; Abid, S.R.; Vatin, N.I. Response of functionally graded preplaced aggregate fibrous concrete with superior impact strength. Buildings 2022, 12, 563. [Google Scholar] [CrossRef]
- Abid, S.R.; Murali, G.; Ahmad, J.; Al-Ghasham, T.S.; Vatin, N.I. Repeated drop-weight impact testing of fibrous concrete: State-of-the-art literature review, analysis of results variation and test improvement suggestions. Materials 2022, 15, 3948. [Google Scholar] [CrossRef] [PubMed]
- Ding, Y.; Li, D.; Zhang, Y.; Azevedo, C. Experimental investigation on the composite effect of steel rebars and macro fibers on the impact behavior of high performance self-compacting concrete. Constr. Build. Mater. 2017, 136, 495–505. [Google Scholar] [CrossRef]
- Prasad, N.; Murali, G. Exploring the impact performance of functionally-graded preplaced aggregate concrete incorporating steel and polypropylene fibres. J. Build. Eng. 2021, 35, 102077. [Google Scholar] [CrossRef]
- Lv, J.; Zhou, T.; Du, Q.; Li, K. Experimental and analytical study on uniaxial compressive fatigue behavior of self-compacting rubber lightweight aggregate concrete. Constr. Build. Mater. 2020, 237, 117623. [Google Scholar] [CrossRef]
- Chen, X.; Liu, Z.; Guo, S.; Huang, Y.; Xu, W. Experimental study on fatigue properties of normal and rubberized self-compacting concrete under bending. Constr. Build. Mater. 2019, 205, 10–20. [Google Scholar] [CrossRef]
- Murali, G.; Gayathri, R.; Ramkumar, V.R.; Karthikeyan, K. Two statistical scrutinize of impact strength and strength reliability of steel Fibre-Reinforced concrete. KSCE J. Civ. Eng. 2018, 22, 257–269. [Google Scholar] [CrossRef]
Disclaimer/Publisher’s Note: The statements, opinions and data contained in all publications are solely those of the individual author(s) and contributor(s) and not of MDPI and/or the editor(s). MDPI and/or the editor(s) disclaim responsibility for any injury to people or property resulting from any ideas, methods, instructions or products referred to in the content. |
© 2022 by the authors. Licensee MDPI, Basel, Switzerland. This article is an open access article distributed under the terms and conditions of the Creative Commons Attribution (CC BY) license (https://creativecommons.org/licenses/by/4.0/).