Article

Fibres as Replacement of Horizontal Ties in Compressed Reinforced Concrete Elements: Experimental Study

Faculty of Environment and Civil Engineering, Latvia University of Life Sciences and Technologies, Akademijas Street 19, LV-3001 Jelgava, Latvia
Fibers 2022, 10(8), 68; https://doi.org/10.3390/fib10080068
Submission received: 27 June 2022 / Revised: 15 July 2022 / Accepted: 1 August 2022 / Published: 10 August 2022

Abstract

:
Steel fibres provide ductility to concrete structures. This, in turn, gives possibility to replace or reduce conventional reinforcement in structural elements. In this study, the focus is on structural walls and the fibres as potential replacements for horizontal reinforcement in areas where vertical rebars are needed. An experimental study was conducted, in which prismatic specimens with longitudinal rebars were subjected to centric loading. Ten samples with 12 specimens in each were tested. The parameters considered were: fibre content, concrete cover for the longitudinal bars, and presence of stirrups. Self-compacting concrete with 30 and 60 kg/m 3 steel fibres was used. Relative and normalised values of the test results were calculated; correlation and analysis of variance was used to estimate the effect of fibres. The results show that the fibres eliminated brittle collapse and spalling of concrete at failure. A strong negative correlation (−0.72 to −0.92) between amount of fibres and load-bearing capacity was found. On average, the reduction of the capacity was 8% to 16% if compared to the specimens with no fibres. However, a positive effect of the fibres on the ductility was observed. Specimens with 30 kg/m 3 fibres showed the same post-peak behaviour as specimens with minimum horizontal reinforcement required by Eurocode 2. The study suggests that combination of steel fibres and conventional rebars can lead to less qualitative compactness of the self-compacting concrete, which in turn may reduce load-bearing capacity and stiffness of the structure. Special attention on concrete cover and distance between rebars should be paid if self-compacting concrete structures with steel fibres are designed.

1. Introduction

The present study is a part of a research project [1], in which the effect of steel fibre reinforced concrete (SFRC) in concrete wall structures is being investigated. The main objective of the project is to understand if it is possible to replace conventional reinforcement with short steel fibres in structural walls. As a result, reduced production costs of concrete walls due to simplified reinforcement arrangements could be achieved, even if the replacement can be done in part.
Simple concrete walls have comparatively high load-bearing capacity, and in many cases (e.g., low rise buildings or walls of upper floors) reinforcement bars are provided to prevent shrinkage cracking or add some ductility, but do not have any load-bearing function. However, walls can have complex geometry due to door or window openings. That can lead to heavily loaded areas, where longitudinal bars should be provided to ensure the necessary bearing capacity. In such areas, horizontal tie bars are needed to prevent longitudinal bars from buckling. The ties, if properly placed, increase the effectiveness of the concrete core between the longitudinal bars, acting as lateral confinement. If the tie bars are replaced by fibres, the arrangement of the conventional reinforcement would be simplified considerably.
The effect of fibres in compressed structural concrete elements is noticed by several researchers. Zhang et al. [2] have found that fibres improve the behaviour of hollow concrete bridge piers and suggest that transverse reinforcement can be partly substituted by fibres in seismic design. Fantilli et al. [3] have found that concrete columns with 0.9% steel fibres have a similar ductility measured in unreinforced concrete columns with 1.0 MPa lateral (confining) pressure. Similar results are obtained with other types of fibre reinforced cementitious composites [4]. Ganesan and Ramana Murthy [5] have suggested that some amount of confining reinforcement can be replaced by a certain amount of fibres. Their study showed that concrete columns with 0.6% confining stirrups and 1.5% steel fibres have the same effect as plain concrete with 1.6% stirrups. Aoude et al. [6] have come to similar conclusions. A significant increase in both compressive strength (up to 39%) and ductility of concrete specimens with and without conventional reinforcement was found by Ahmad and colleagues [7]. They used 75 mm long steel fibres extracted from scrap tyres with relatively high dosage (1.0% to 3.0% by volume) and found the fibre dosage 2.5% to be the optimum. Similarly, Balanji et al. [8] presented test results of high strength concrete short reinforced columns under four different loadings. Specimens with applied hybrid fibres (1% macro and 1.5% micro fibres) exhibited higher ductility and considerably higher maximum load in all loading scenarios. Different results are obtained by Mangat and Motamedi Azari [9]. These results do not show any significant increase in compressive strength or secant modulus of reinforced concrete columns due to fibres or stirrups. They concluded that the increased amount of fibres increases ductility, lateral strains, and Poisson’s ratio in concrete. Pereiro-Barceló and Bonet [10] measured strains on rebars subjected to buckling and found that strains, at which the reinforcement buckles, increasing with the increase of fibre content. There is a recent study [11] in which concrete columns confined by a layer of special fibre reinforced composite called Engineered Cementitious Composite (ECC) are investigated and a positive effect on the axial load-bearing capacity was found.
Although there have been several valuable experimental studies performed, and the effect of fibres in compressed structural elements have been described, it has not resulted in practical design rules. Design guidelines prepared by SFRC Consortium [12] state that “the effect of steel fibres may not be considered with respect to transverse reinforcement of columns”. No additional rules for walls are given in this standard. The Swedish standard SS 812310:2014 [13] does not provide for any design or detailing rules specific to SFRC walls or columns.
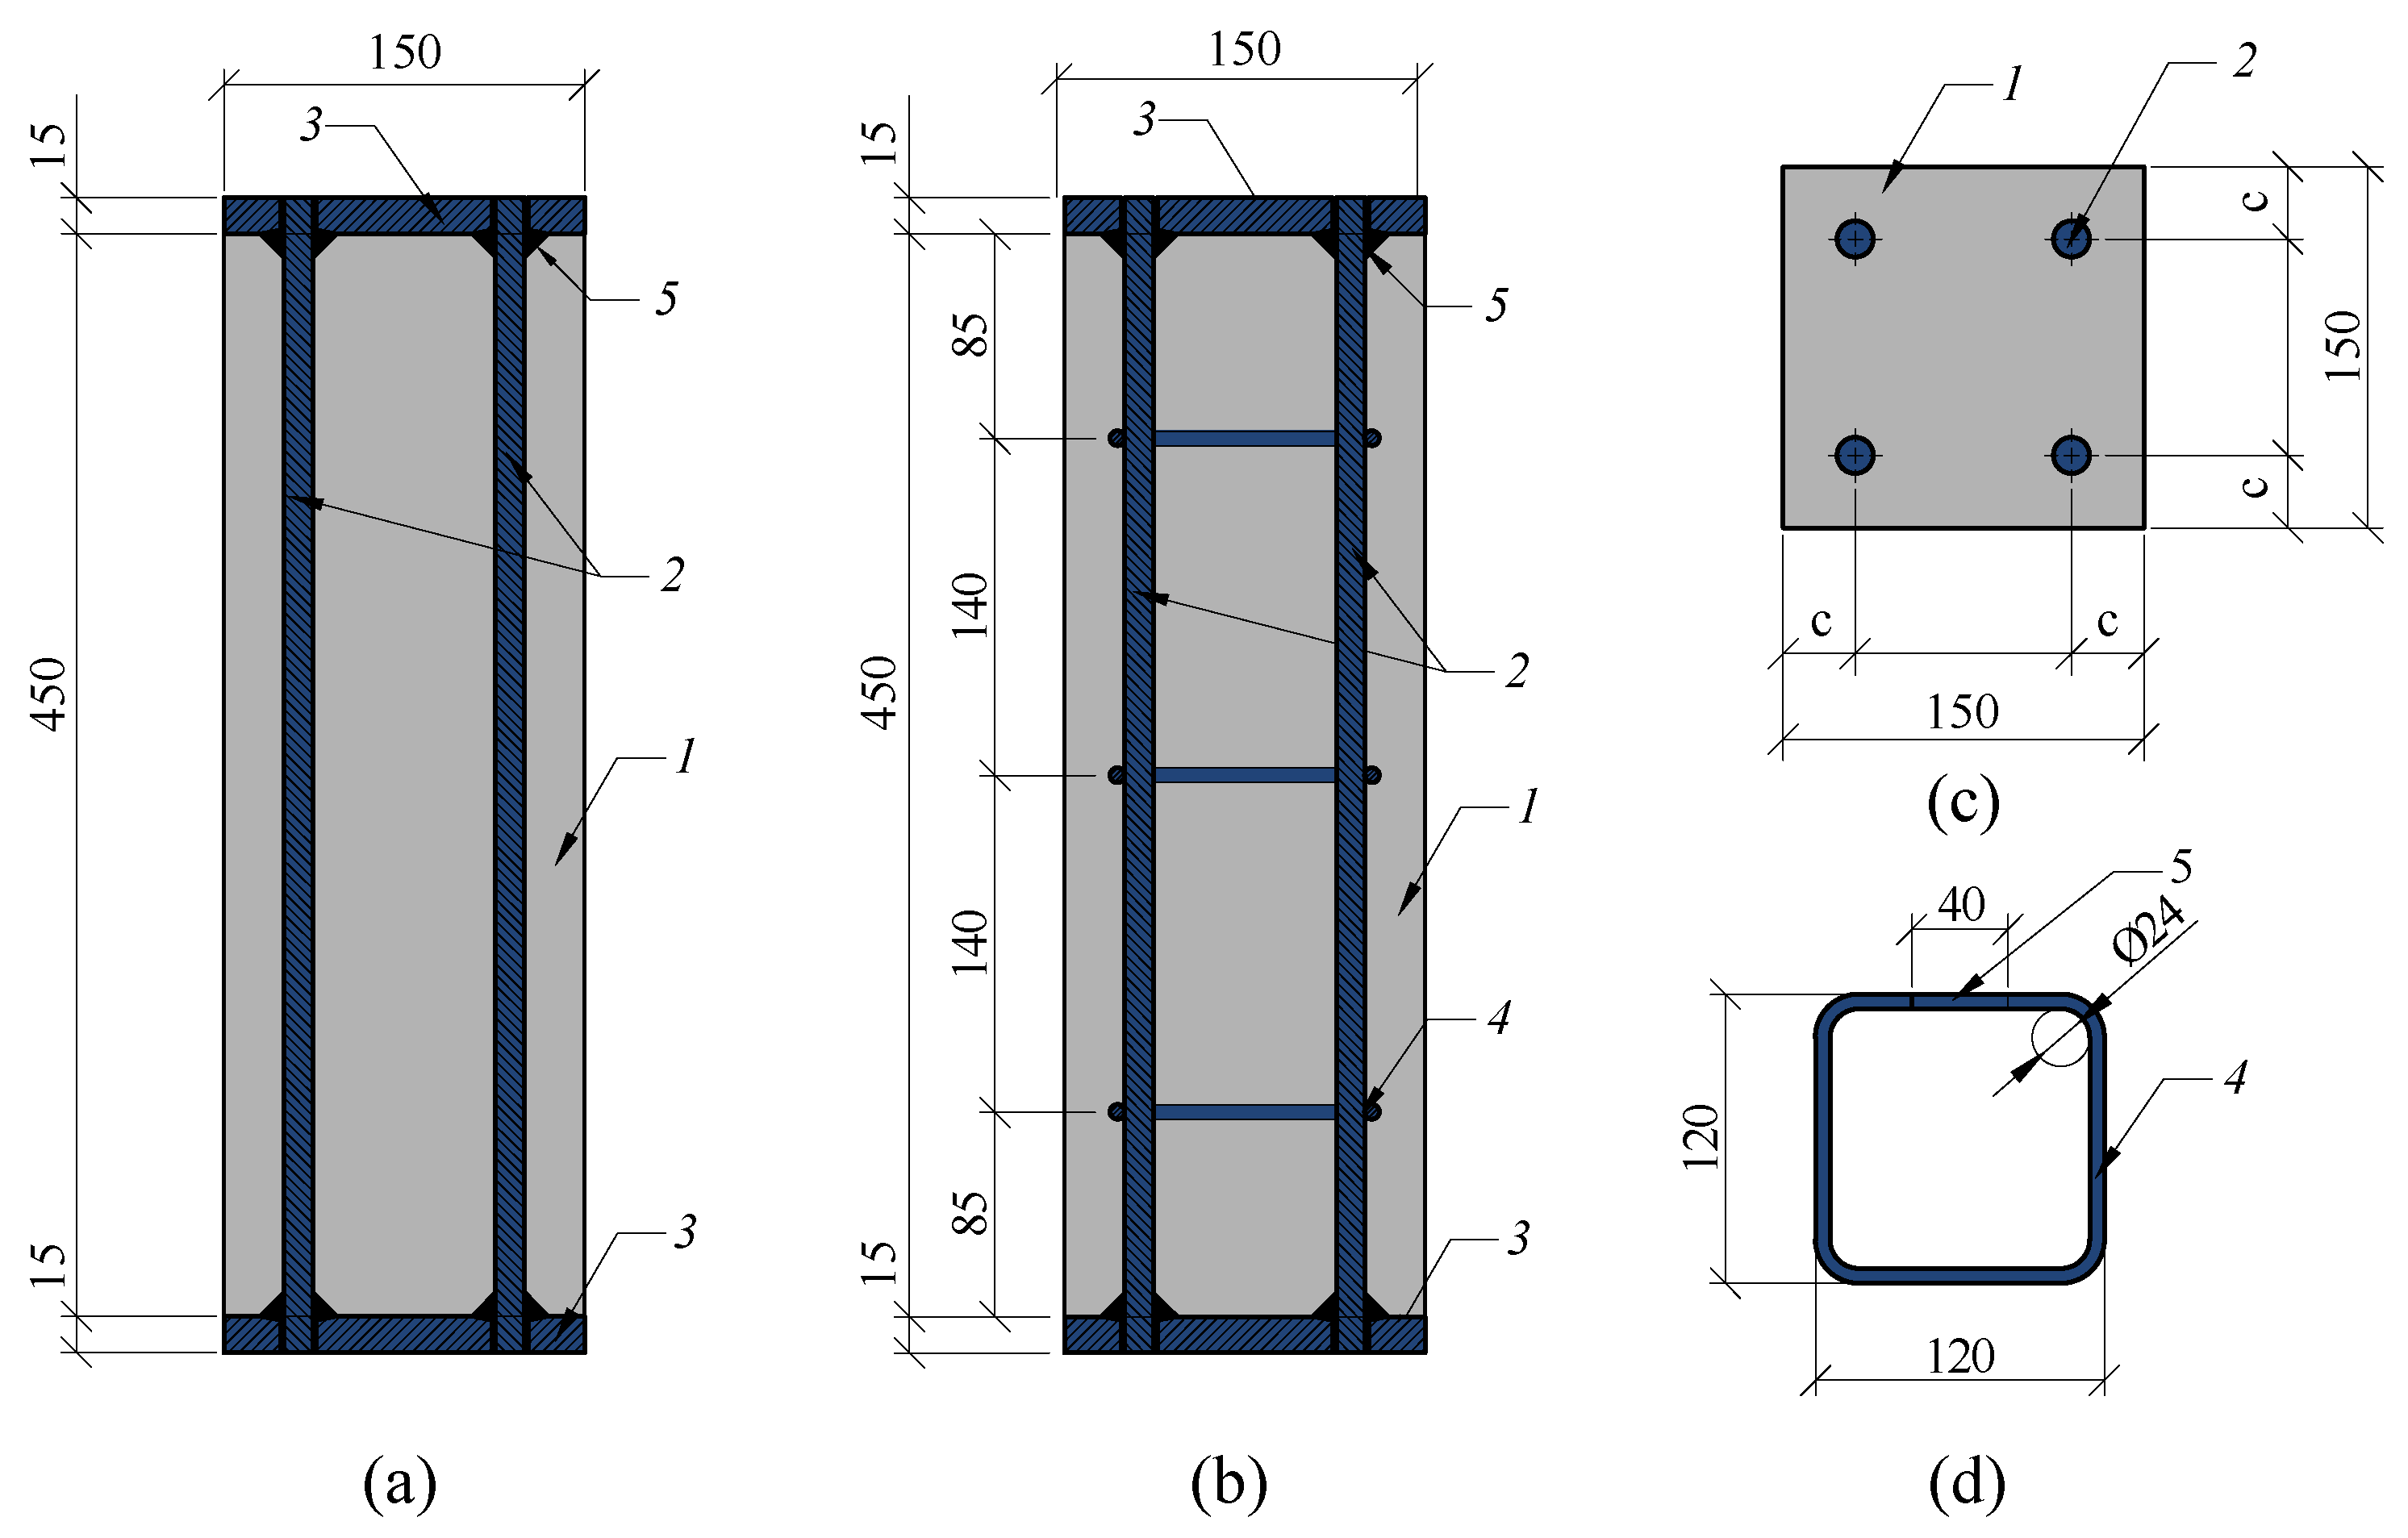
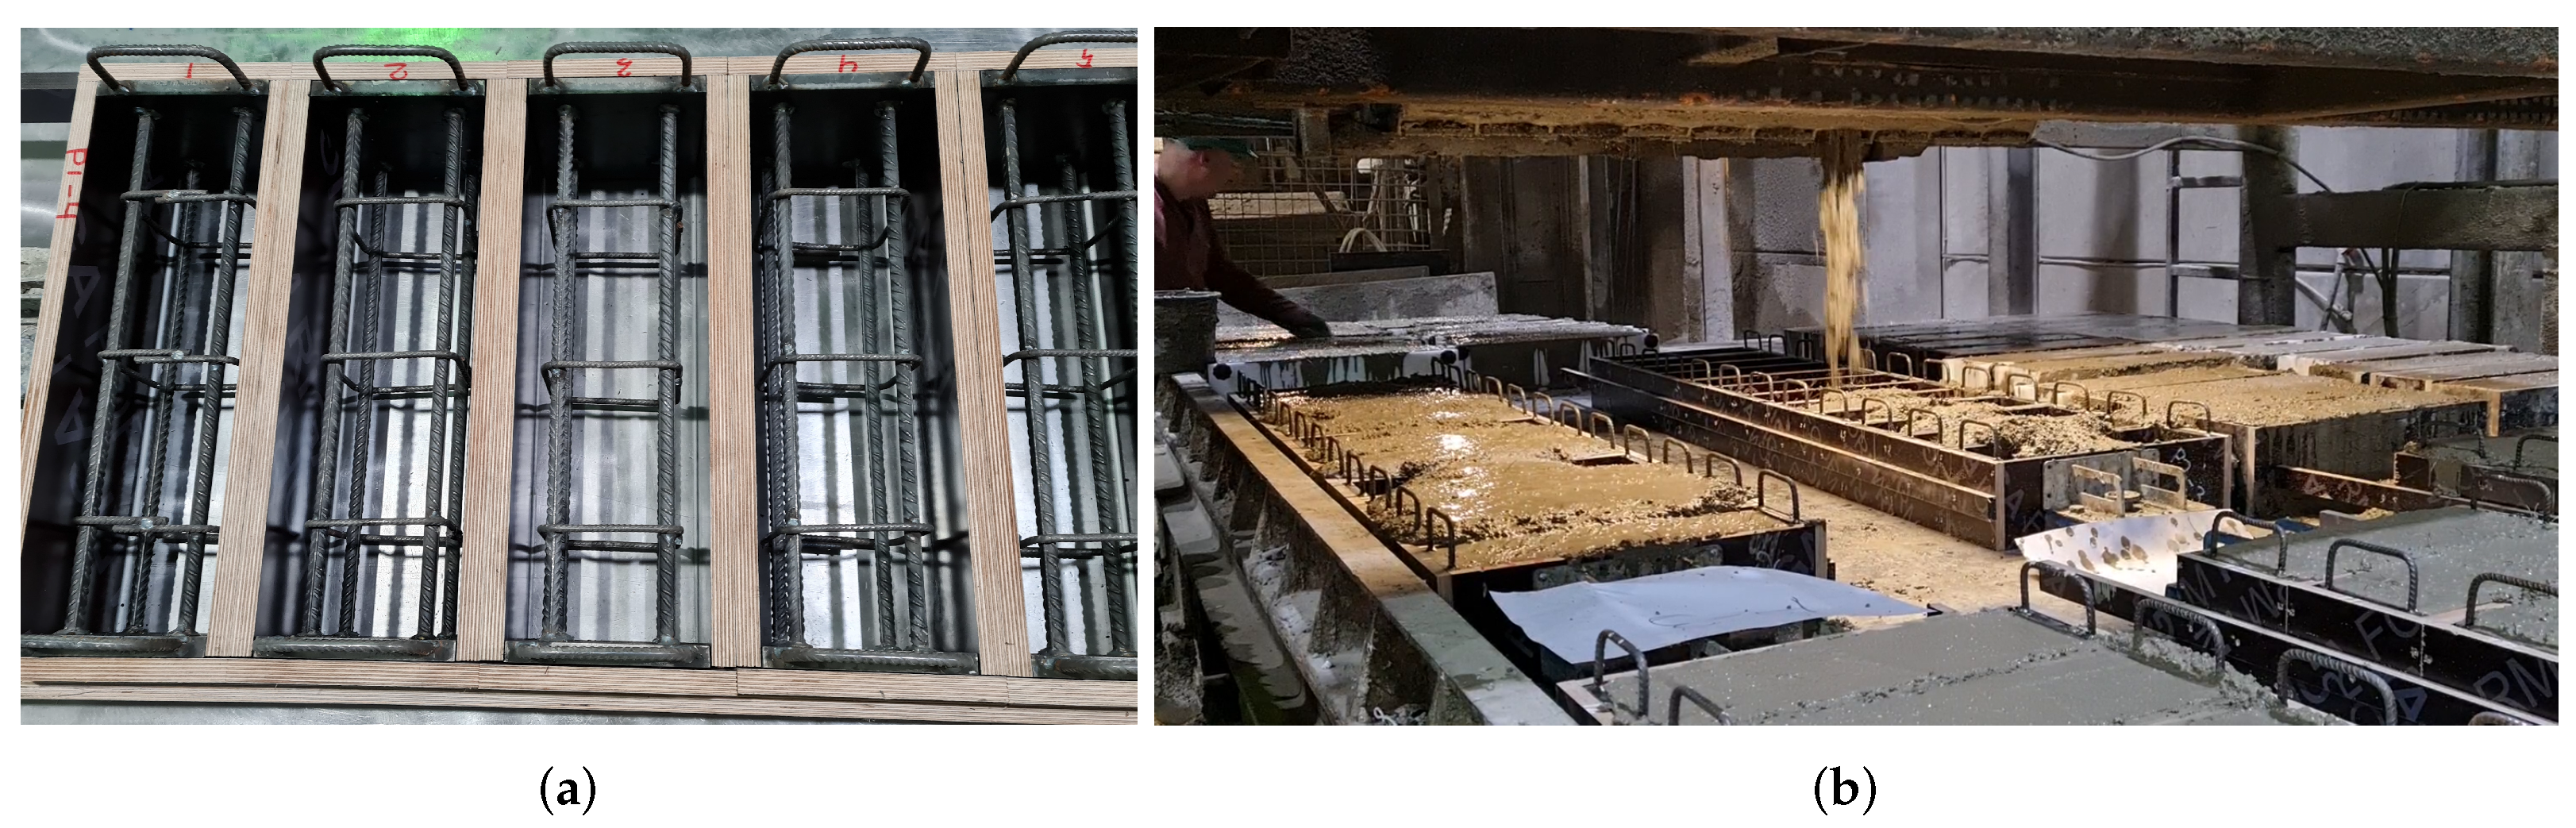
The aim of this study is to contribute to the current knowledge about the influence of steel fibres on the behaviour of concrete walls and columns under compressive loading and to compare the effect of fibres with the minimum required horizontal ties. There are several distinctive approaches used in this study if compared to other authors. First, a large number of specimens (120 prisms, 12 in each sample, while 1 to 3 specimens per sample are used in other studies) are tested to increase the statistical power of the results. The sufficient number of specimens is crucial because SFRC usually has a large scatter of results. Second, the specimens are manufactured in a concrete plant and not in a lab to capture issues related to real life production processes. Third, the effect of fibres on specimens with no stirrups are investigated here, while the combined effect of fibres and stirrups are studied in the papers mentioned above.

2. Materials and Methods

2.1. Types of Specimens

Prism-type specimens with four longitudinal rebars and steel end-plates were produced. The main parameters to be analysed are the amount of fibres and concrete cover of the longitudinal reinforcement bars. Two additional samples with conventional stirrups were manufactured. All together, 10 different samples with 12 specimens in each were produced. The samples are labelled with a capital letter “P” followed by numbers #-#, the first of which refers to material, while the other—to the arrangement of the conventional reinforcement, denoted as group. A summary of the samples is given in Table 1. Dimensions and arrangement of conventional reinforcement used in the specimens is shown in Figure 1.
All the specimens are grouped into on of 5 groups, depending on the arrangement of the conventional reinforcement. In groups 1, 2, and 3 there are specimens with longitudinal rebars only (see Figure 1a, having different distances of the bars from the side of the specimens c: 30 mm, 40 mm, and 50 mm, respectively. In groups 4 and 5, stirrups are included according to Figure 1b,d. Values of the distance c are 30 mm and 50 mm, respectively.
Two steel plates are welded to the longitudinal rebars at both ends of the specimen. This is done to ensure that the applied load is transferred to all four steel bars directly. It is also expected that in such a way the variation in test results caused by misplacement of reinforcement and unevenness of loading surfaces is minimised. In all of the samples, ribbed bars of diameter 12 mm are used as the longitudinal reinforcement. The correct position of the bars is ensured by the end plates with pre-drilled holes. The bars were fixed in the holes and welded to the plates. The outside of the plates was smooth to reduce undesirable effect of local imperfections. Nominal dimensions of the specimens were 150 × 150 × 480 mm, including the thickness of both end-plates 2 × 15 mm. Actual dimensions of each specimen were measured and used in the evaluation of the results. The measurements are available in an open-access database [1].

2.2. Materials

Self-compacting concrete and self-compacting fibre reinforced concrete with slump-flow 680–720 mm was used. Water/cement ratio was 0.65. Maximum size of the coarse aggregate was 8 mm. Steel fibres with hooked ends, 50 mm length, 0.75 mm in diameter, and nominal tensile strength of 1200 MPa were applied. All the specimens were made in the pre-cast concrete plant "Dzelzsbetons MB" in Liepaja, Latvia. Casting method was the same as for normal concrete—the concrete was falling in horizontal moulds on a casting table from a vertical distance of around 0.5 m as shown in Figure 2b. No vibration was applied. A detailed description of the materials used in this study is available in the project’s database [1].
Three types of materials were used in this study: (1) plain concrete (PC); (2) SFRC with fibre content 30 kg/m 3 (F30); (3) SFRC with fibre content 60 kg/m 3 (F60). The following properties of concrete and SFRC are determined by laboratory tests: (1) compressive strength of standard cube specimens according to EN 12390-3 [14]; (2) flexural tensile strength for plain concrete according to EN 12390-5 [15]; (3) flexural tensile strength at the limit of proportionality (LOP) and residual flexural strength of SFRC according to EN 14651 [16]. Concrete tensile strength is derived from the flexural tensile strength based on the formula given in Model Code 2010 [17].
f c t m = f c t m , f l α f l = 0.06 f c t m , f l h 0.7 1 + 0.06 h 0.7 ,
where f c t m , f l is flexural tensile strength or strength at LOP ( f R L ) of the tested prisms; h is the total depth of the member or the distance from the tip of the notch to the top of the specimen ( h s p ) for SFRC. Modulus of elasticity for concrete is calculated based on the compressive strength according to Eurocode 2 (EC2) [18]. The material properties are given in Table 2 and Table 3. The scatter of the concrete compressive and tensile strength test data is represented in the form of box-plots in Figure 3. The load–CMOD (Crack Mouth Opening Distance) curves of SFRC standard prisms are plotted in Figure 4.

2.3. Test Set-Up and Loading

All of the specimens were loaded in centric compression in a hydraulic testing machine ALPHA 10-3000 (Form+Test) with a closed-loop control system. The loading speed was set to 10 kN/s until a load level of 800 kN, after which the speed of piston displacement was controlled to 0.025 mm/s until failure of the specimen. For specimens in samples P3-1 and P3-2, the loading was controlled by force with speed 10 kN/s until failure. This resulted in loss of the test data after maximum force was reached. Therefore, the post-peak behaviour of these specimens is not included in further analysis.
Vertical and horizontal strains were measured for two specimens (P1-2-10 and P2-3-11) for control purposes. Strain gauges HBM 1-LY41-20/120 with grid length 20 mm were used at the middle of each vertical side of the specimens. The test set-up is shown in Figure 5.

2.4. Methods of Evaluation

The effect of fibres is evaluated by comparing the main mechanical properties of the specimens obtained from the testing: maximum load, axial stiffness, ductility. To compare the results of samples with different material and geometrical properties, relative and normalised values are used.

2.4.1. Maximum Load

The maximum load was compared by introducing relative force that is calculated considering actual geometrical properties of each specimen and material properties of the sample. Presence of the longitudinal reinforcement was also taken into account. The relative force for each specimen is calculated by the following equation:
F r e l , i = F m a x , i f c u b e . m , i A c m , i + f y A s ,
where F m a x , i is the maximum load bearing capacity of the specimen; f c u b e . m , i is the mean value of concrete cube compressive strength; A c m , i is the cross-section of the specimen measured at the middle of specimens; f y is the yield strength of the conventional reinforcement taken as 500 MPa; A s is the total cross-sectional area of vertical reinforcement bars. In all cases, A s = 452.4 mm 2 , corresponding to 4Ø12 mm, is assumed.

2.4.2. Axial Stiffness

The overall stiffness of a specimen was obtained using the procedure given in Figure 6. First the original force–piston displacement curves were converted by removing the effect of frame deformations. The stiffness of the machine frame was evaluated by recording force–piston displacement data while loading the frame without any specimen. To adjust the vertical deformations of the tested specimens, the following equation was derived:
u i = u i , i n i t F i A + B F i + C ,
where u i is vertical displacement of the specimen; u i , i n i t is the vertical displacement recorded during the test that includes the deformations of the frame; F i is load recorded at the corresponding displacement; A, B, and C are coefficients describing the stiffness of the machine frame: 0.000974, 0.2, and 260.0, respectively.
The stiffness of each specimen is evaluated as a secant going through two points on the force–displacement curve with a distance Δ F equal to 200 kN. The lowest point was obtained by iteration, for which the stiffness secant has the largest angle with the horizontal axis (Figure 6b). The iteration was done by steps equal to 50 kN, starting from zero and finishing at a level at which the upper point reaches 90% of the peak load. Other Δ F values (150, 250, 300, 350, 400) were also analysed. In all cases the tendencies of the results were the same, while the 150 kN range was more sensitive to the parameters in the procedure applied.
After defining the secant, the curves of each specimen were moved so that the secant would intersect the horizontal and vertical axis at zero point. All the data points before/above the secant were considered invalid, representing initial imperfections, and therefore removed (Figure 6c).
To compare the stiffness between different samples and specimens, a relative stiffness value D r e l was introduced. It was obtained by dividing the experimentally determined stiffness D e x p by a theoretical stiffness D t h e o r :
D r e l , i = D e x p , i D t h e o r , i = Δ F h i Δ u i ( E c m , i A c m , i + E s A s ) ,
where Δ u i —the difference of displacements between the points of the stiffness secant; h i —the height of the specimen considered; E c m , i —the concrete secant modulus of elasticity for the sample considered (see Table 2); E s —the modulus of elasticity for reinforcement steel taken equal to 200 GPa.

2.4.3. Ductility

To evaluate ductility, areas under force–displacement curves are calculated, as was done by other researchers [8,9]. It is assumed, that in case of more ductile failure, the post-peak tail of the force–displacement curve is higher and longer, thus giving larger area or energy absorption capacity. The comparison was done for all but samples S3-1 and S3-2. As mentioned before, the loading of the specimens in these samples was controlled only by force. Therefore, the post-peak behaviour is abrupt and cannot be compared to other samples, for which the post-peak loading was controlled by displacement.
To compare the ductility between specimens, the force–displacement curves were normalised by dividing each recorded load value by the maximum load of the specimen F i / F m a x and each displacement value by the displacement at the maximum load u i / u m a x (see Figure 7a).
The end of the force–displacement curve is assumed at the moment when a rapid drop of force begins. The measurements obtained in this phase are not reliable and therefore excluded (see Figure 7b). If residual load-bearing capacity of a specimen, after the first drop of force, was captured, then the range was extended until the second drop of force (Figure 7c).

3. Results and Discussion
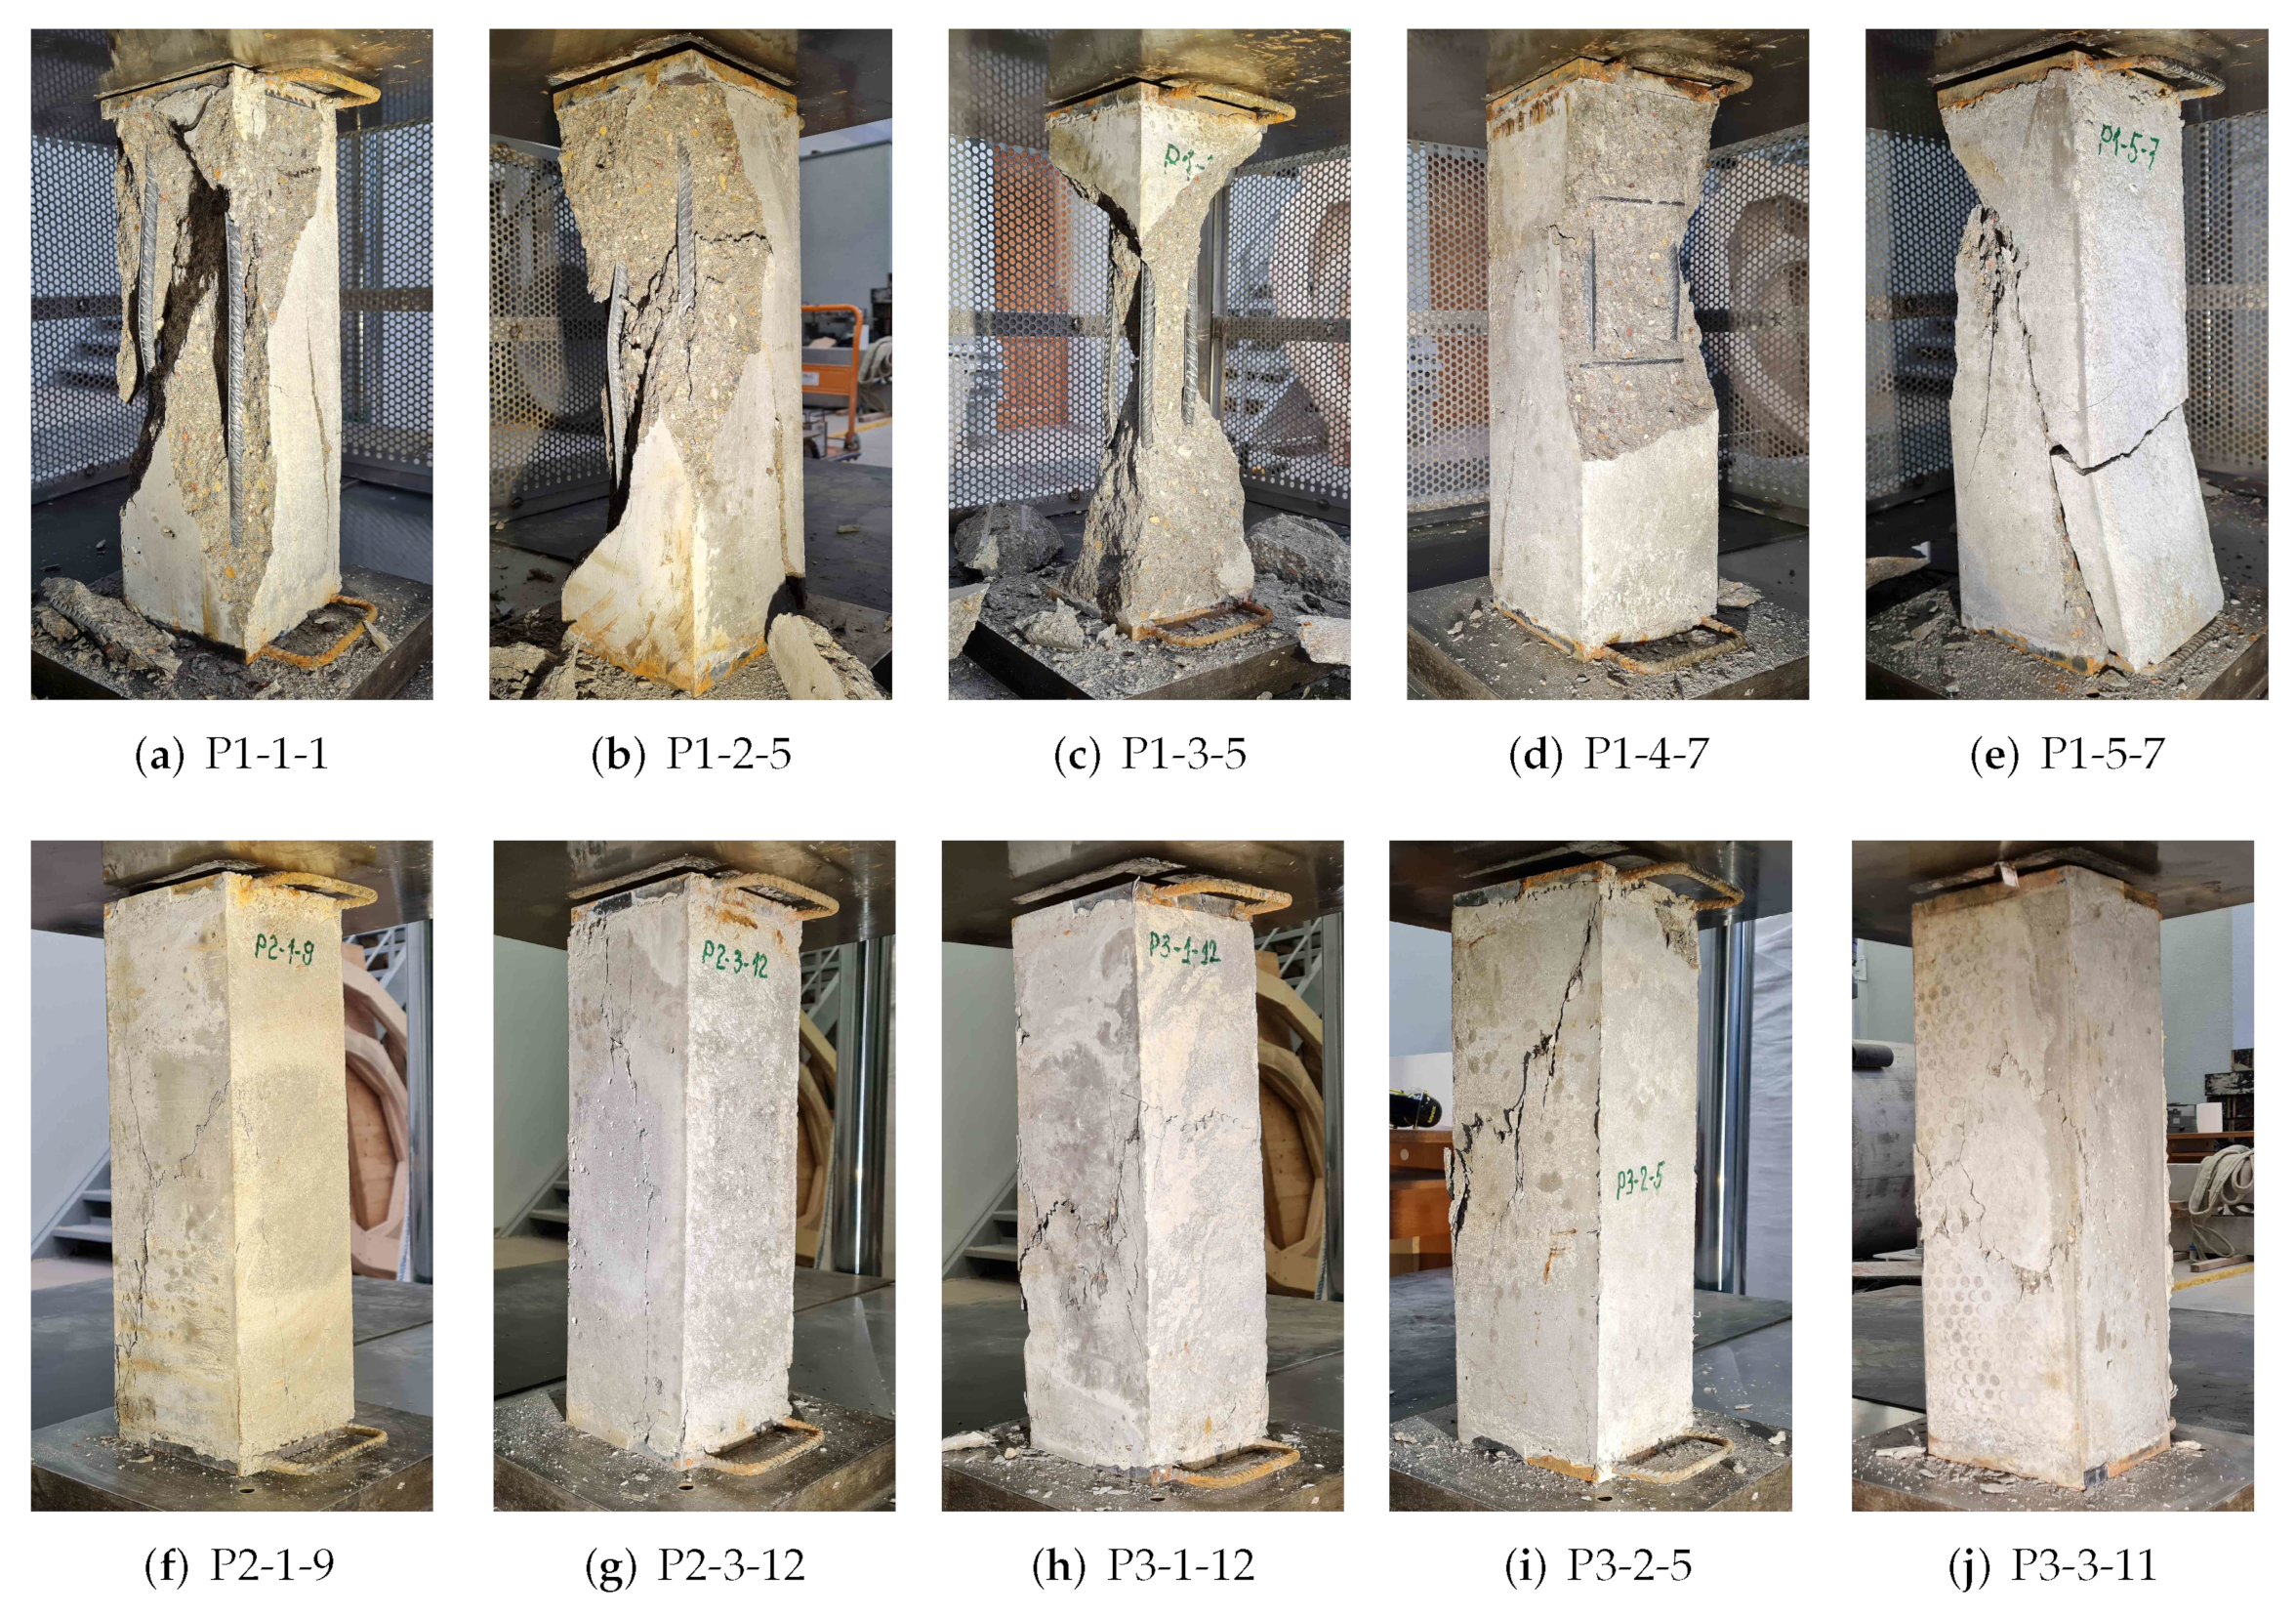
3.1. Failure Mode

The failure modes of the specimens from all the samples can be seen in Figure 8, in which one typical specimen of each sample is given. There are photos taken from each side of every specimen available in the project’s open-access database [1].
In all of the cases, the failure was very sudden. In contrast to other studies [6,9], no cracking before failure was observed. However, there were signs of micro cracking observed—appearance and widening of moisture spots due to increased loading. One of the possible reasons for the sudden failure could be the elastic potential energy stored in the deformed testing frame just before the failure. Possibly the failure mode would be different if stiffer testing frames were used.
Two main types of failure modes were observed during this investigation. Most of the specimens had inclined cracks defined as sliding surface by Fantilli et al. [4]. In this case, buckling of the longitudinal bars occurred at different heights on opposite sides of the specimen. The inclination angle between the cracked surface and the vertical axis observed by other researchers [4,19] is around 18 degrees. In the present study, cracks with different angles from 18 to 34 degrees were observed. The angle was 18 degrees if the height of the crack was the same as the height of the specimen.
The other part of the specimens had longitudinal and could have other types of additional cracks. In this case, the buckling of the longitudinal bars occurred on the same height for all of the bars. This failure was more or less similar to the failure observed in standard cylinder compression tests combined with spalling caused by buckling of the bars.
The effect of fibres was noticed at the failure of the specimens. The failure mode was very brittle and close to explosive for the specimens with no fibres and no stirrups. Specimens with conventional stirrups had less brittle failure, but there was spalling of concrete cover observed. Specimens containing fibres showed very soft failure and had almost no concrete spalling, which complies with findings by other researchers [5,6,7,8]. If loading of the SFRC specimens was continued, a gradual spalling of the cover would be expected [6].
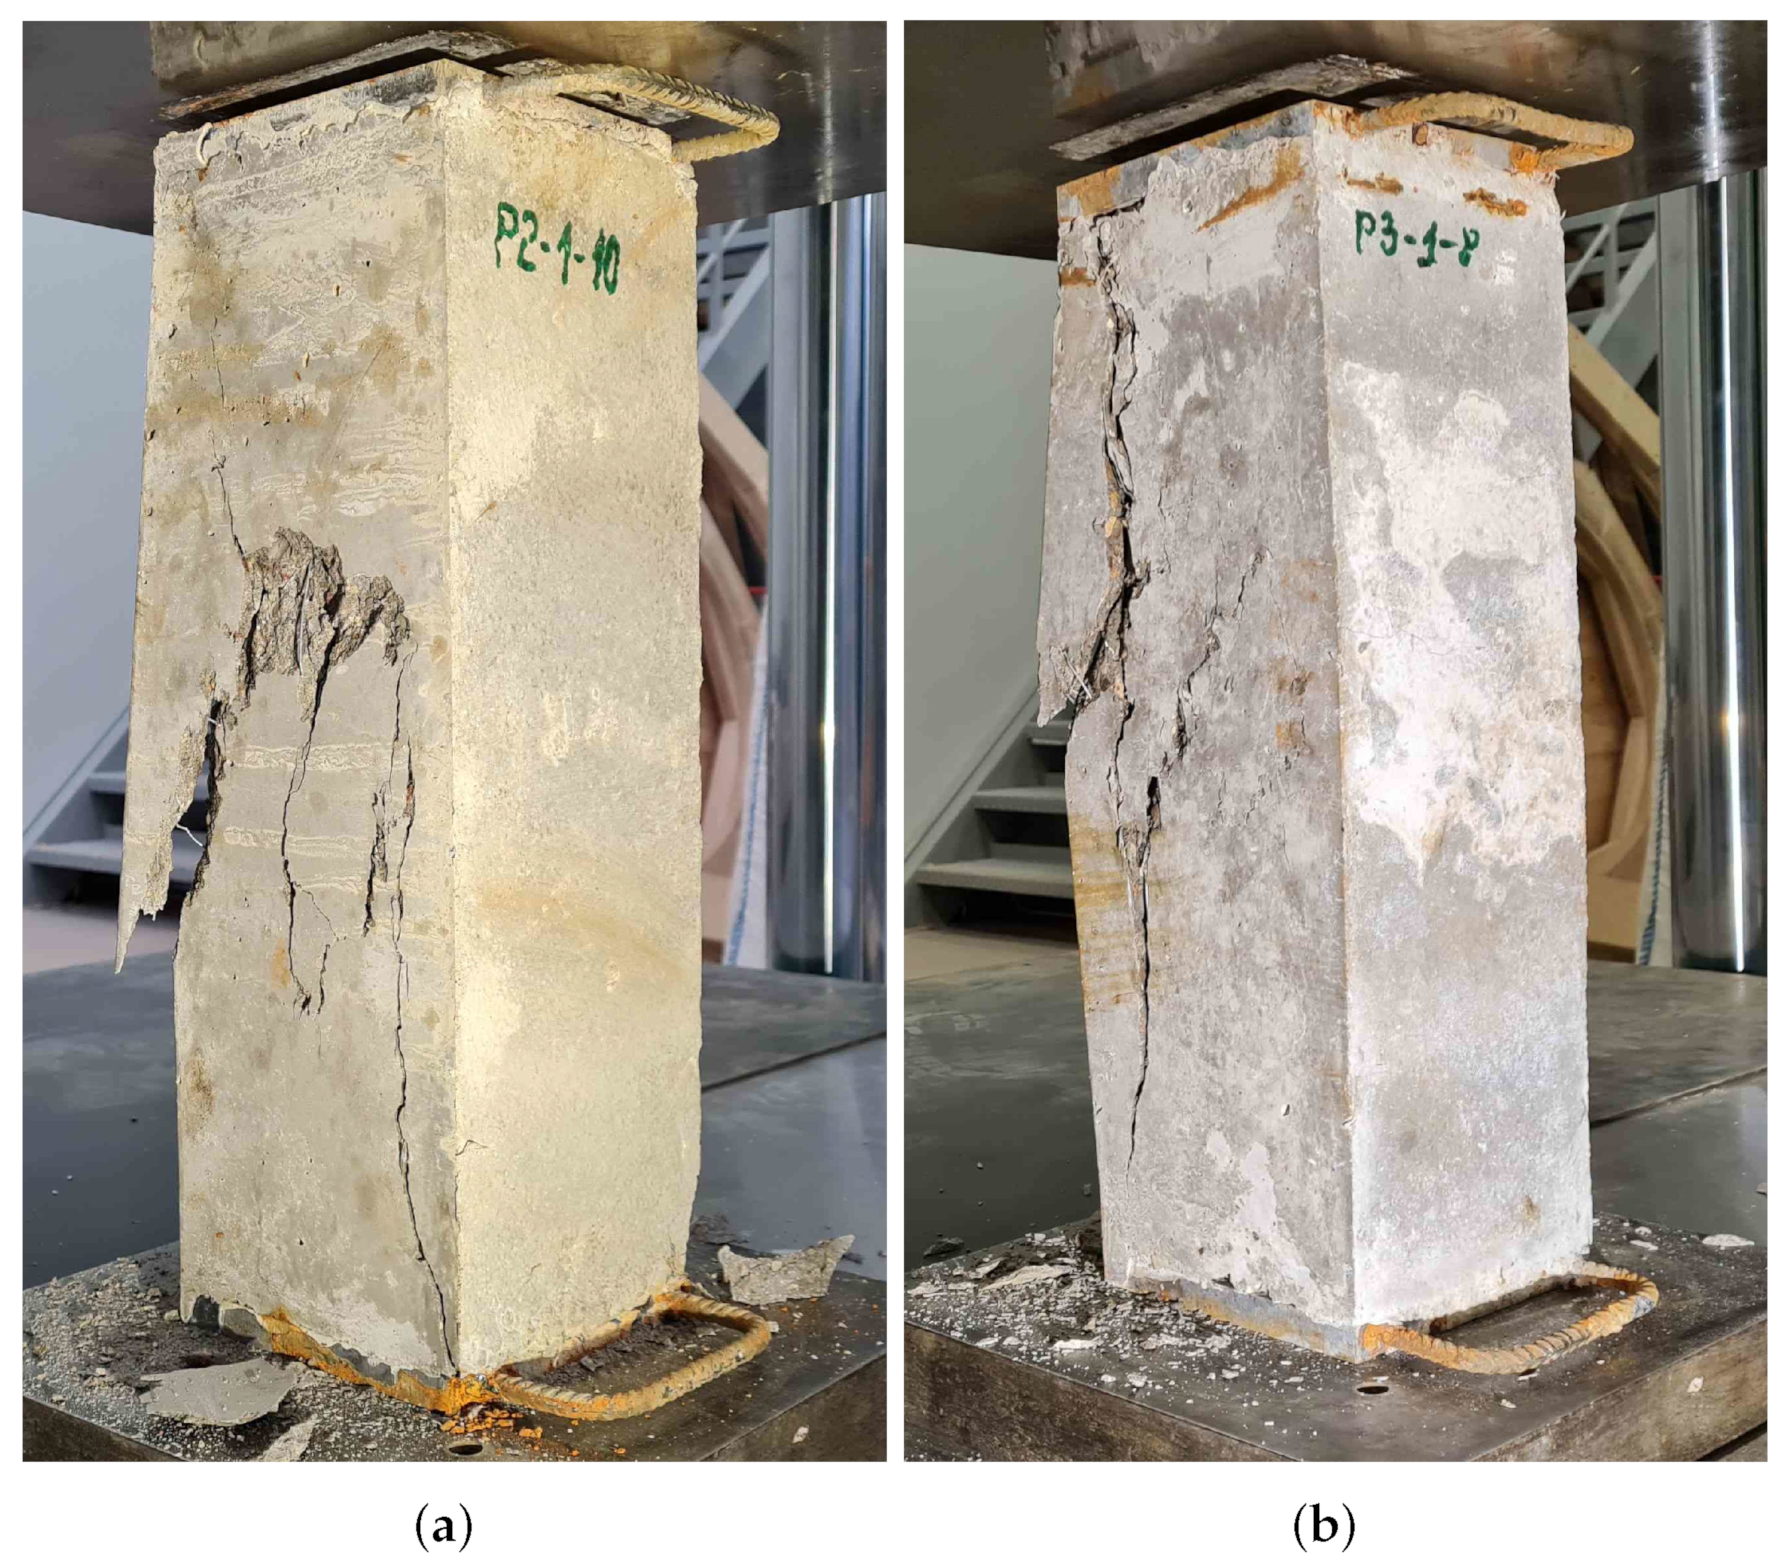
In the case of FRC specimens, the effect of thickness of concrete cover was noticed. Many of the specimens with the bar distance c = 30 mm (samples P2-1 and P3-1) had partial spalling of the concrete cover (see Figure 9), while almost all specimens in the samples with larger concrete covers had no spalling at all. This can be explained by the lesser amount of fibres in the volume of the cover. Due to the relatively narrow space between the bars and the surrounding moulds, the uniform distribution of the fibres was disturbed. A prolonged spalling behaviour in SFRC columns is observed by Ahmad et al. [7]. In their study, the specimen C-3 had almost no fibres visible in the areas of spalling. This observation suggests that minimum thickness of concrete cover should be limited based on the length and amount of fibres.

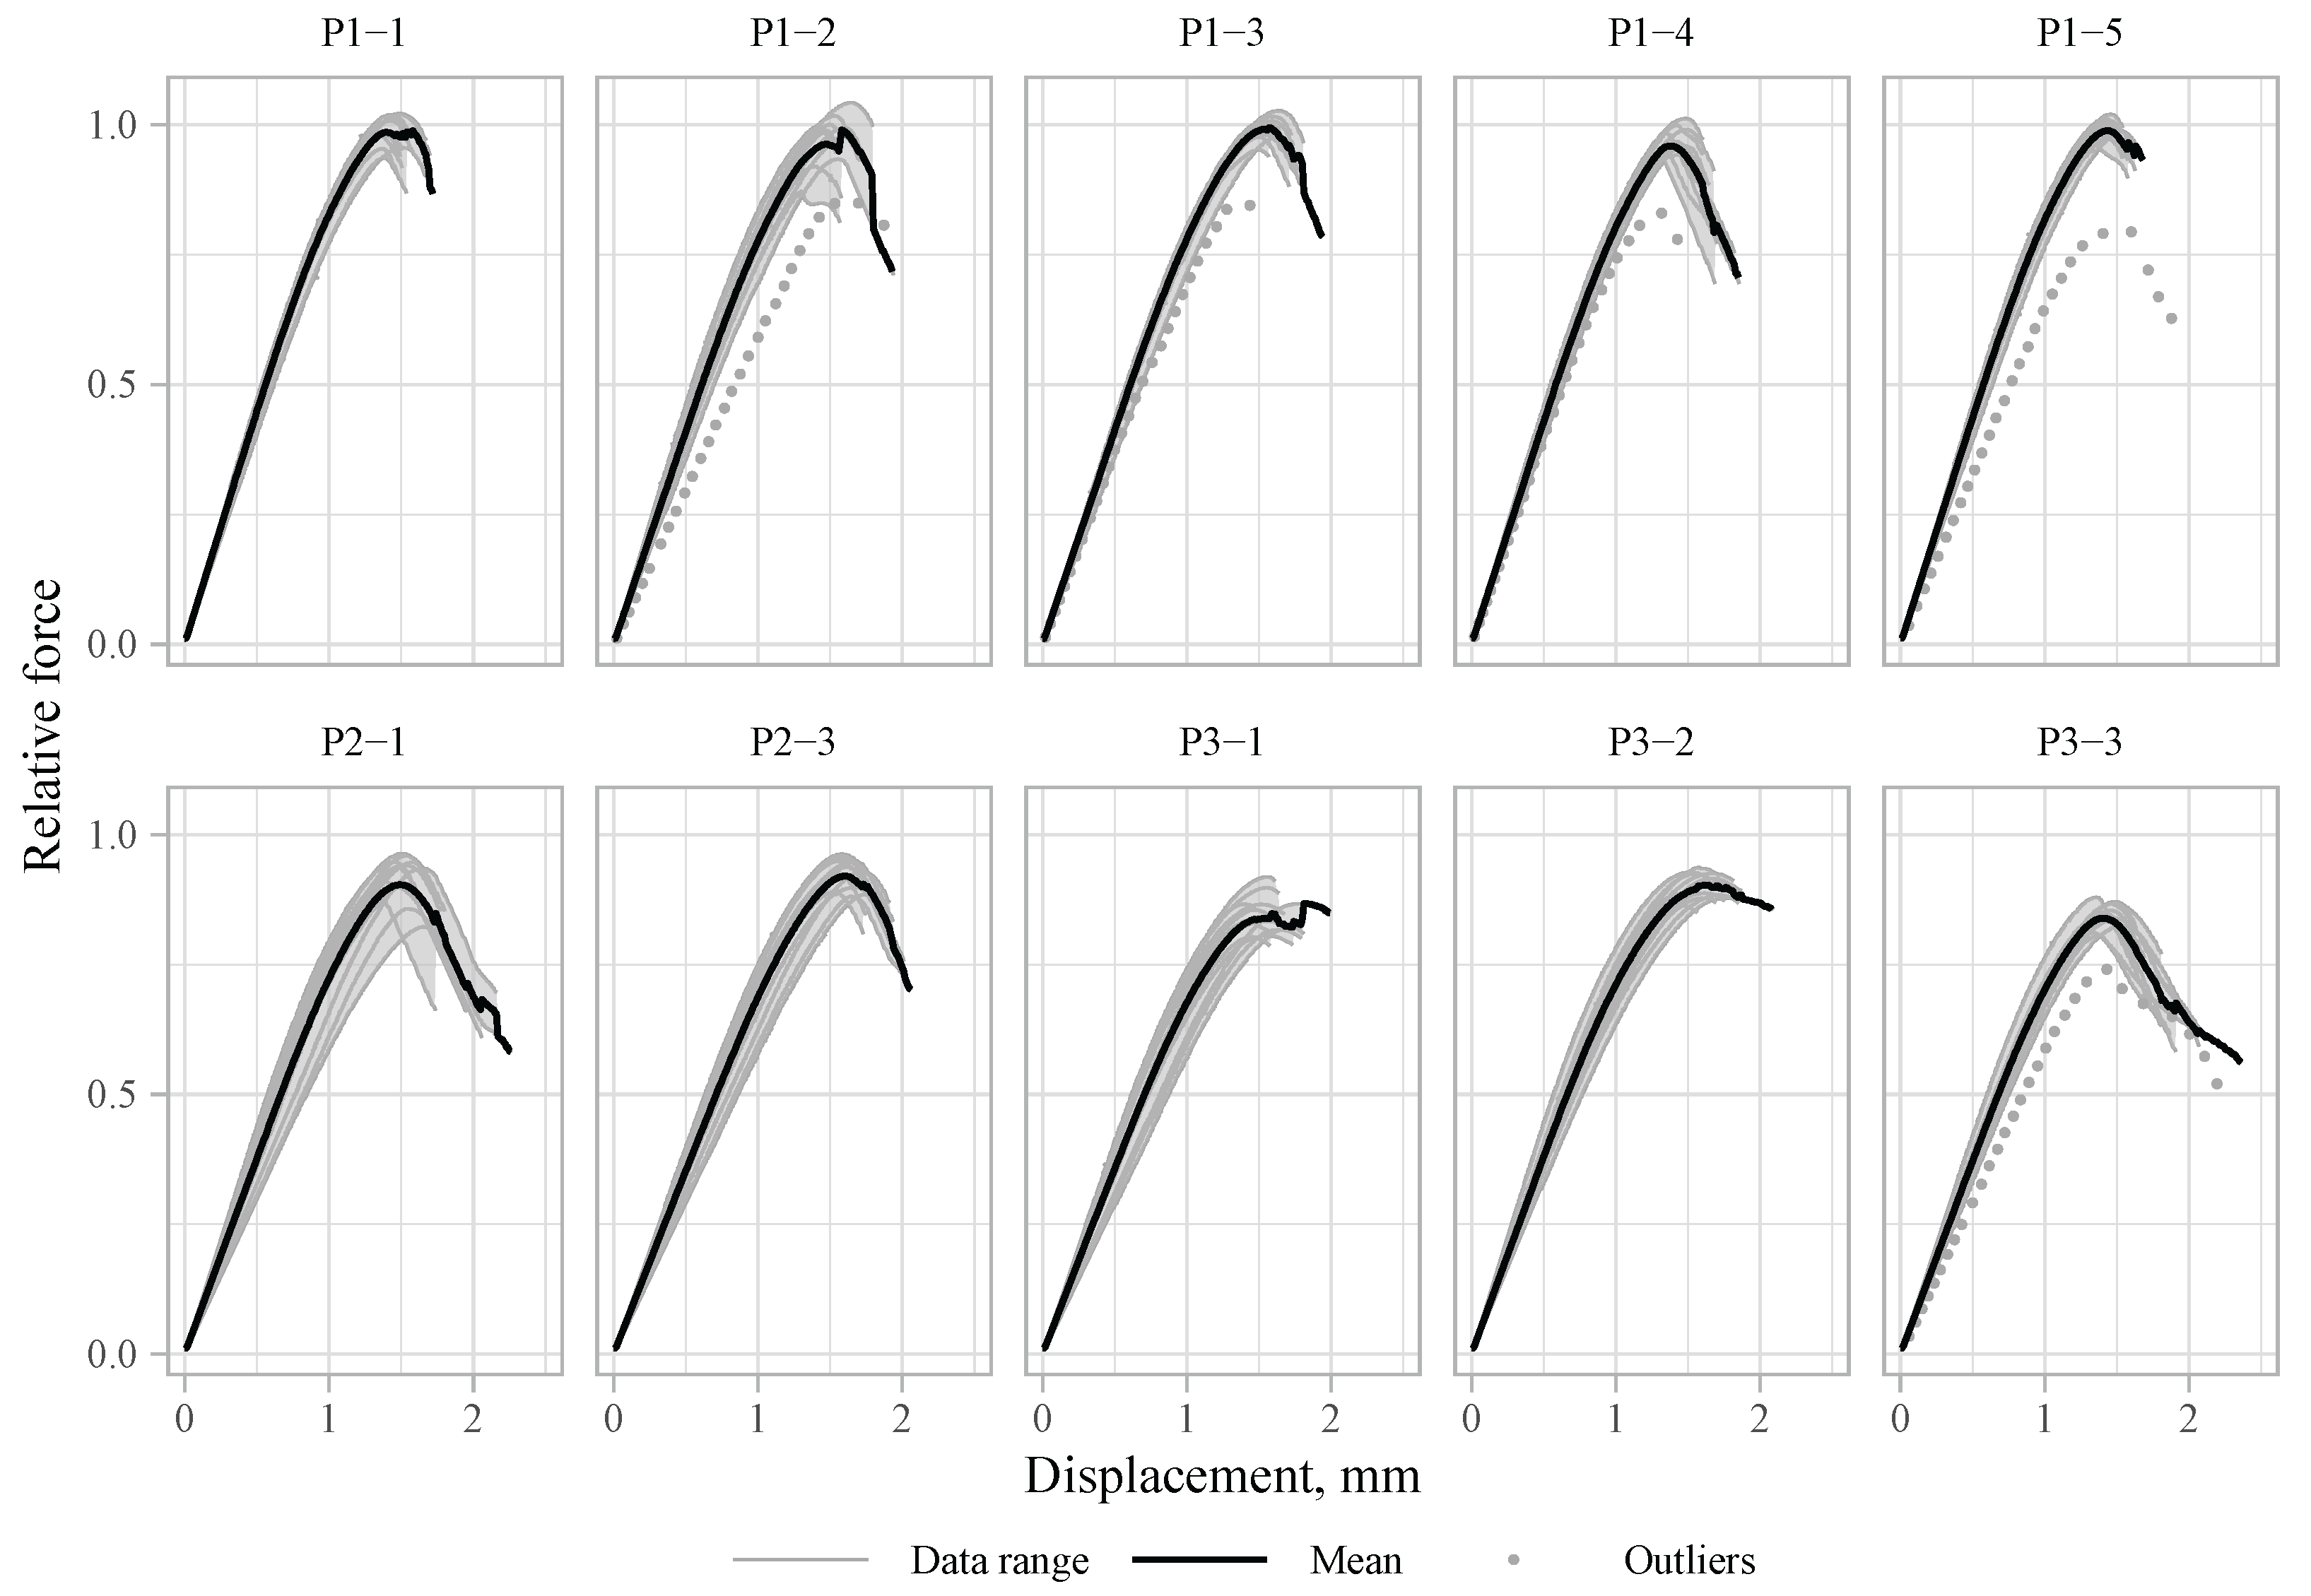
3.2. Force–Displacement Behaviour

Force–displacement behaviour was obtained for each specimen. Relative forces calculated by Equation (2) versus vertical displacement are plotted in Figure 10 for each sample. In the figure, data range (grey), mean curve (black), and outliers (grey dots) are shown. The mean 
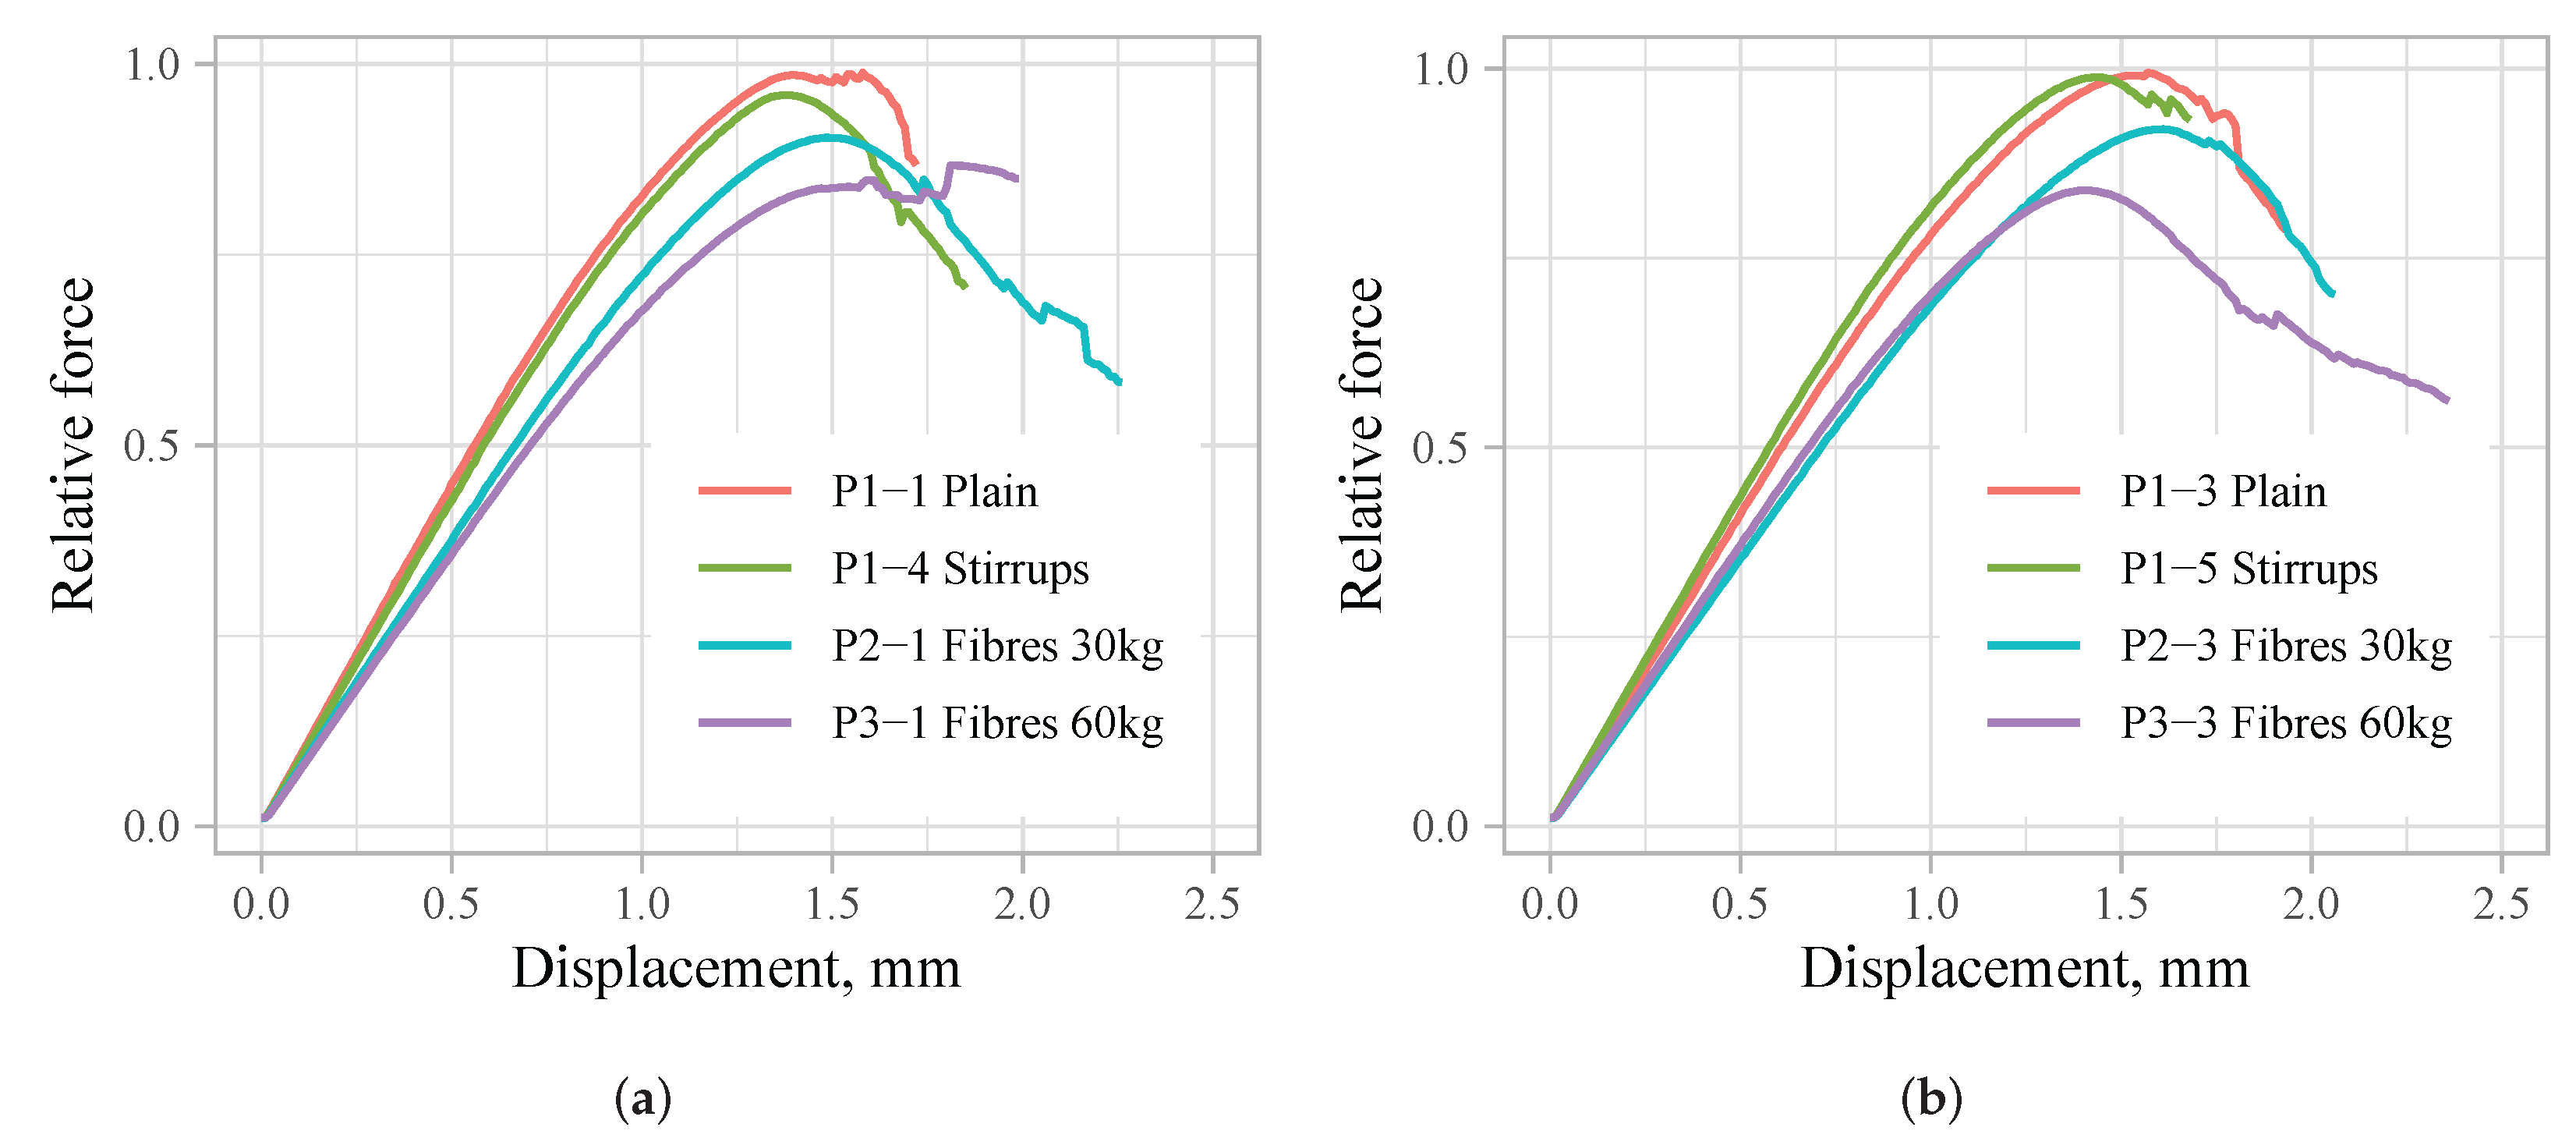
force–displacement curves are compared for samples with different concrete cover in 
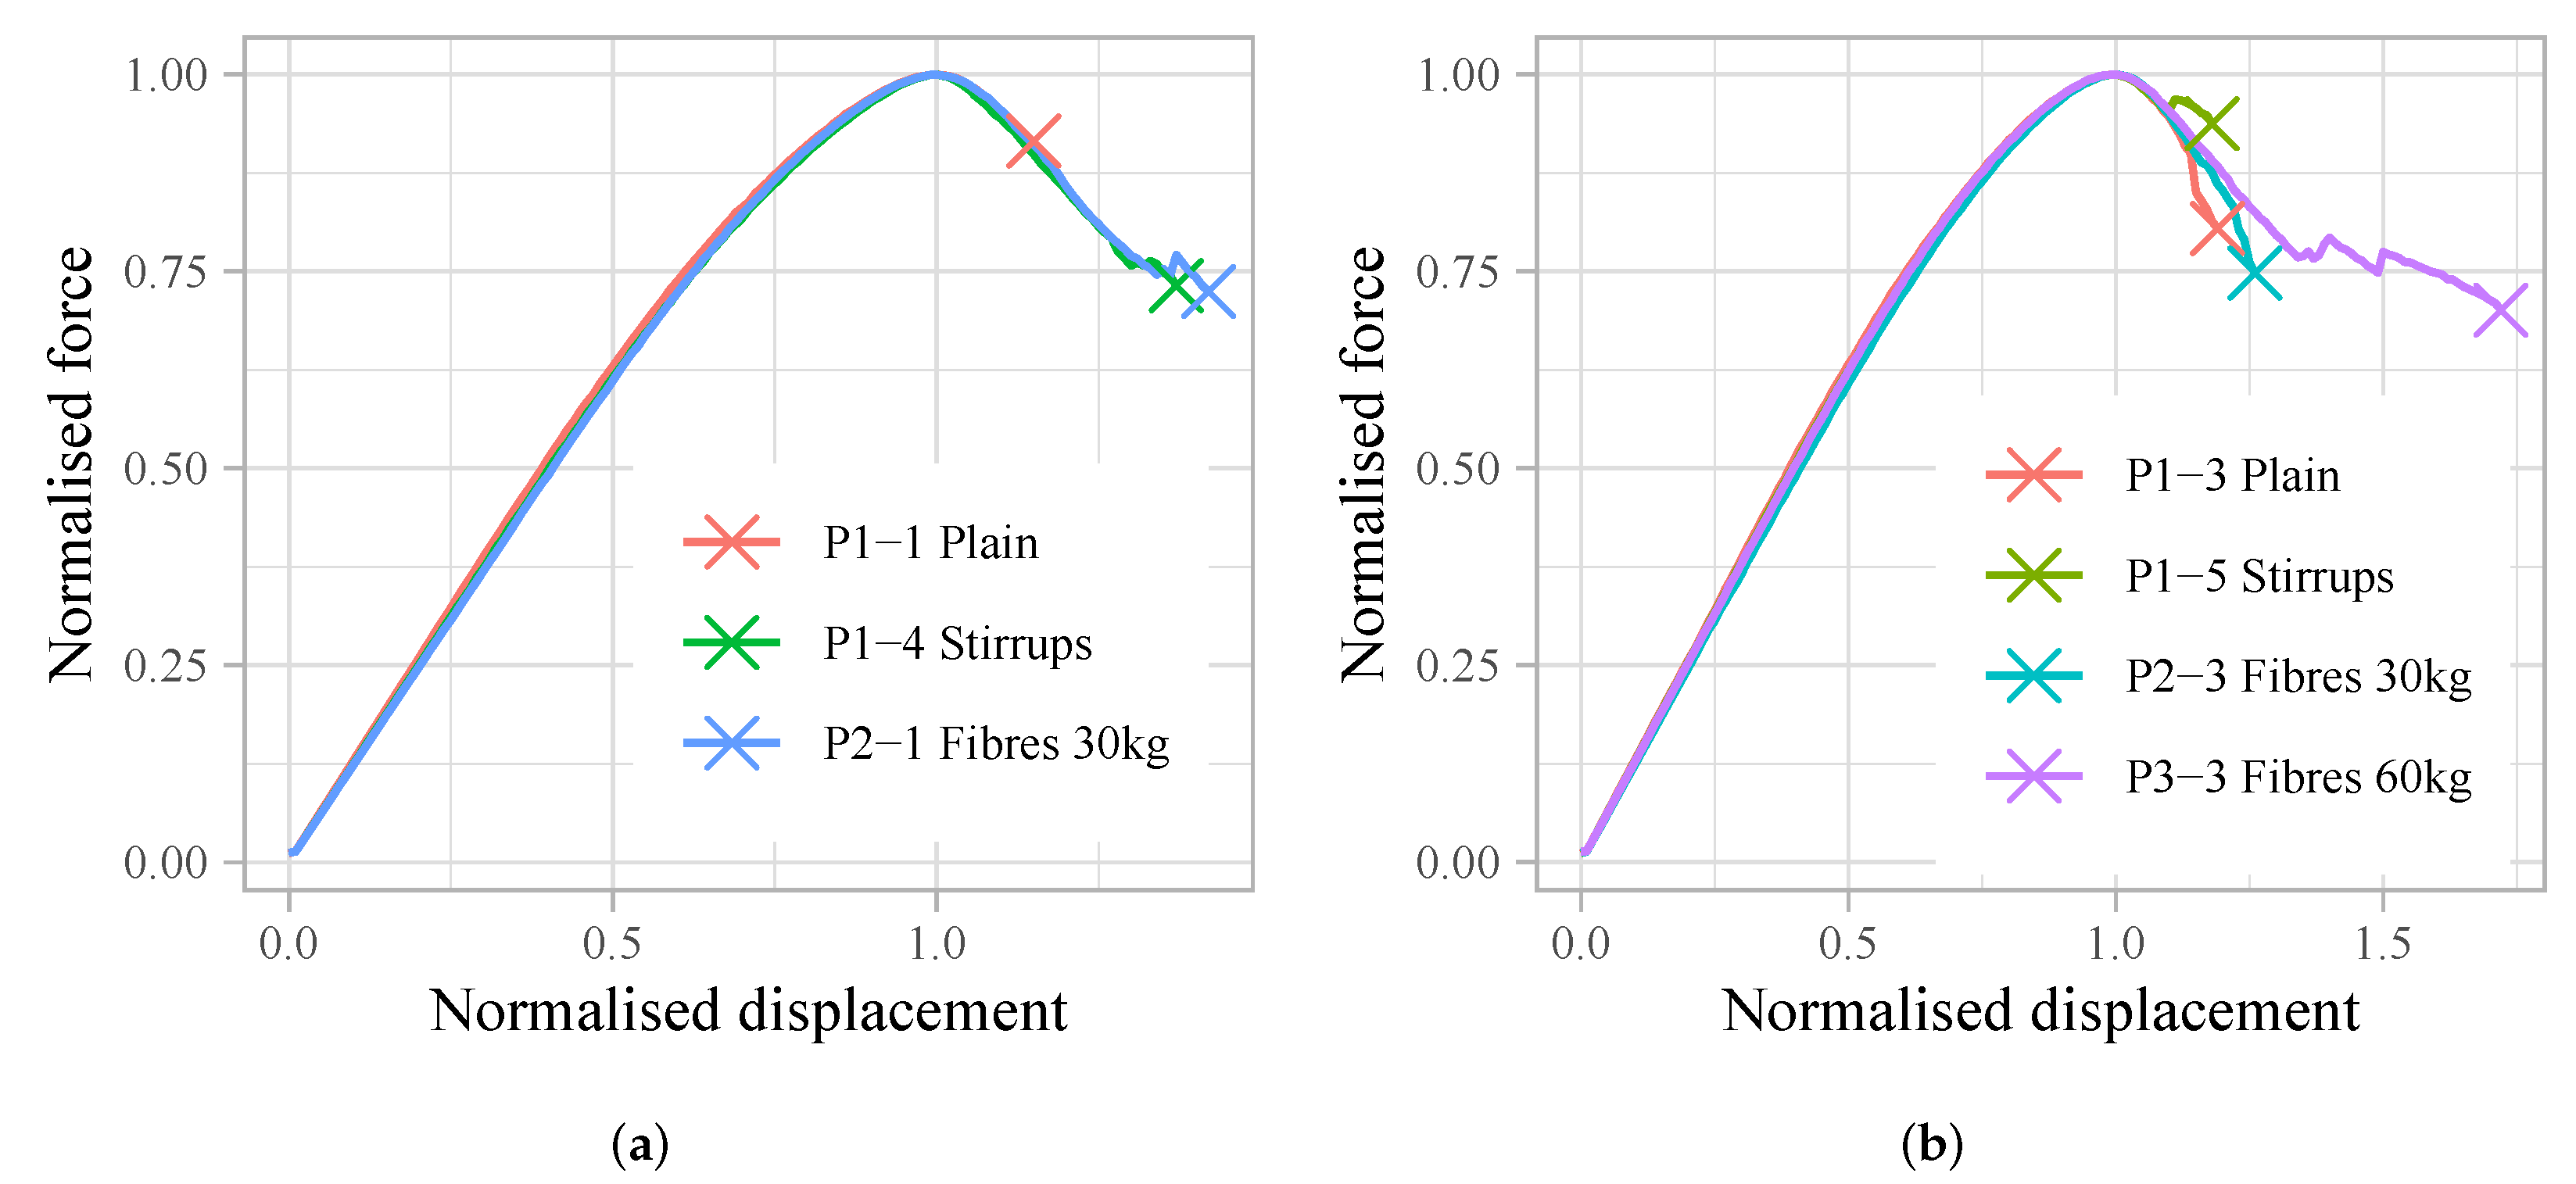
Figure 11. The mean values of the normalised force–displacement curves are compared in Figure 12.
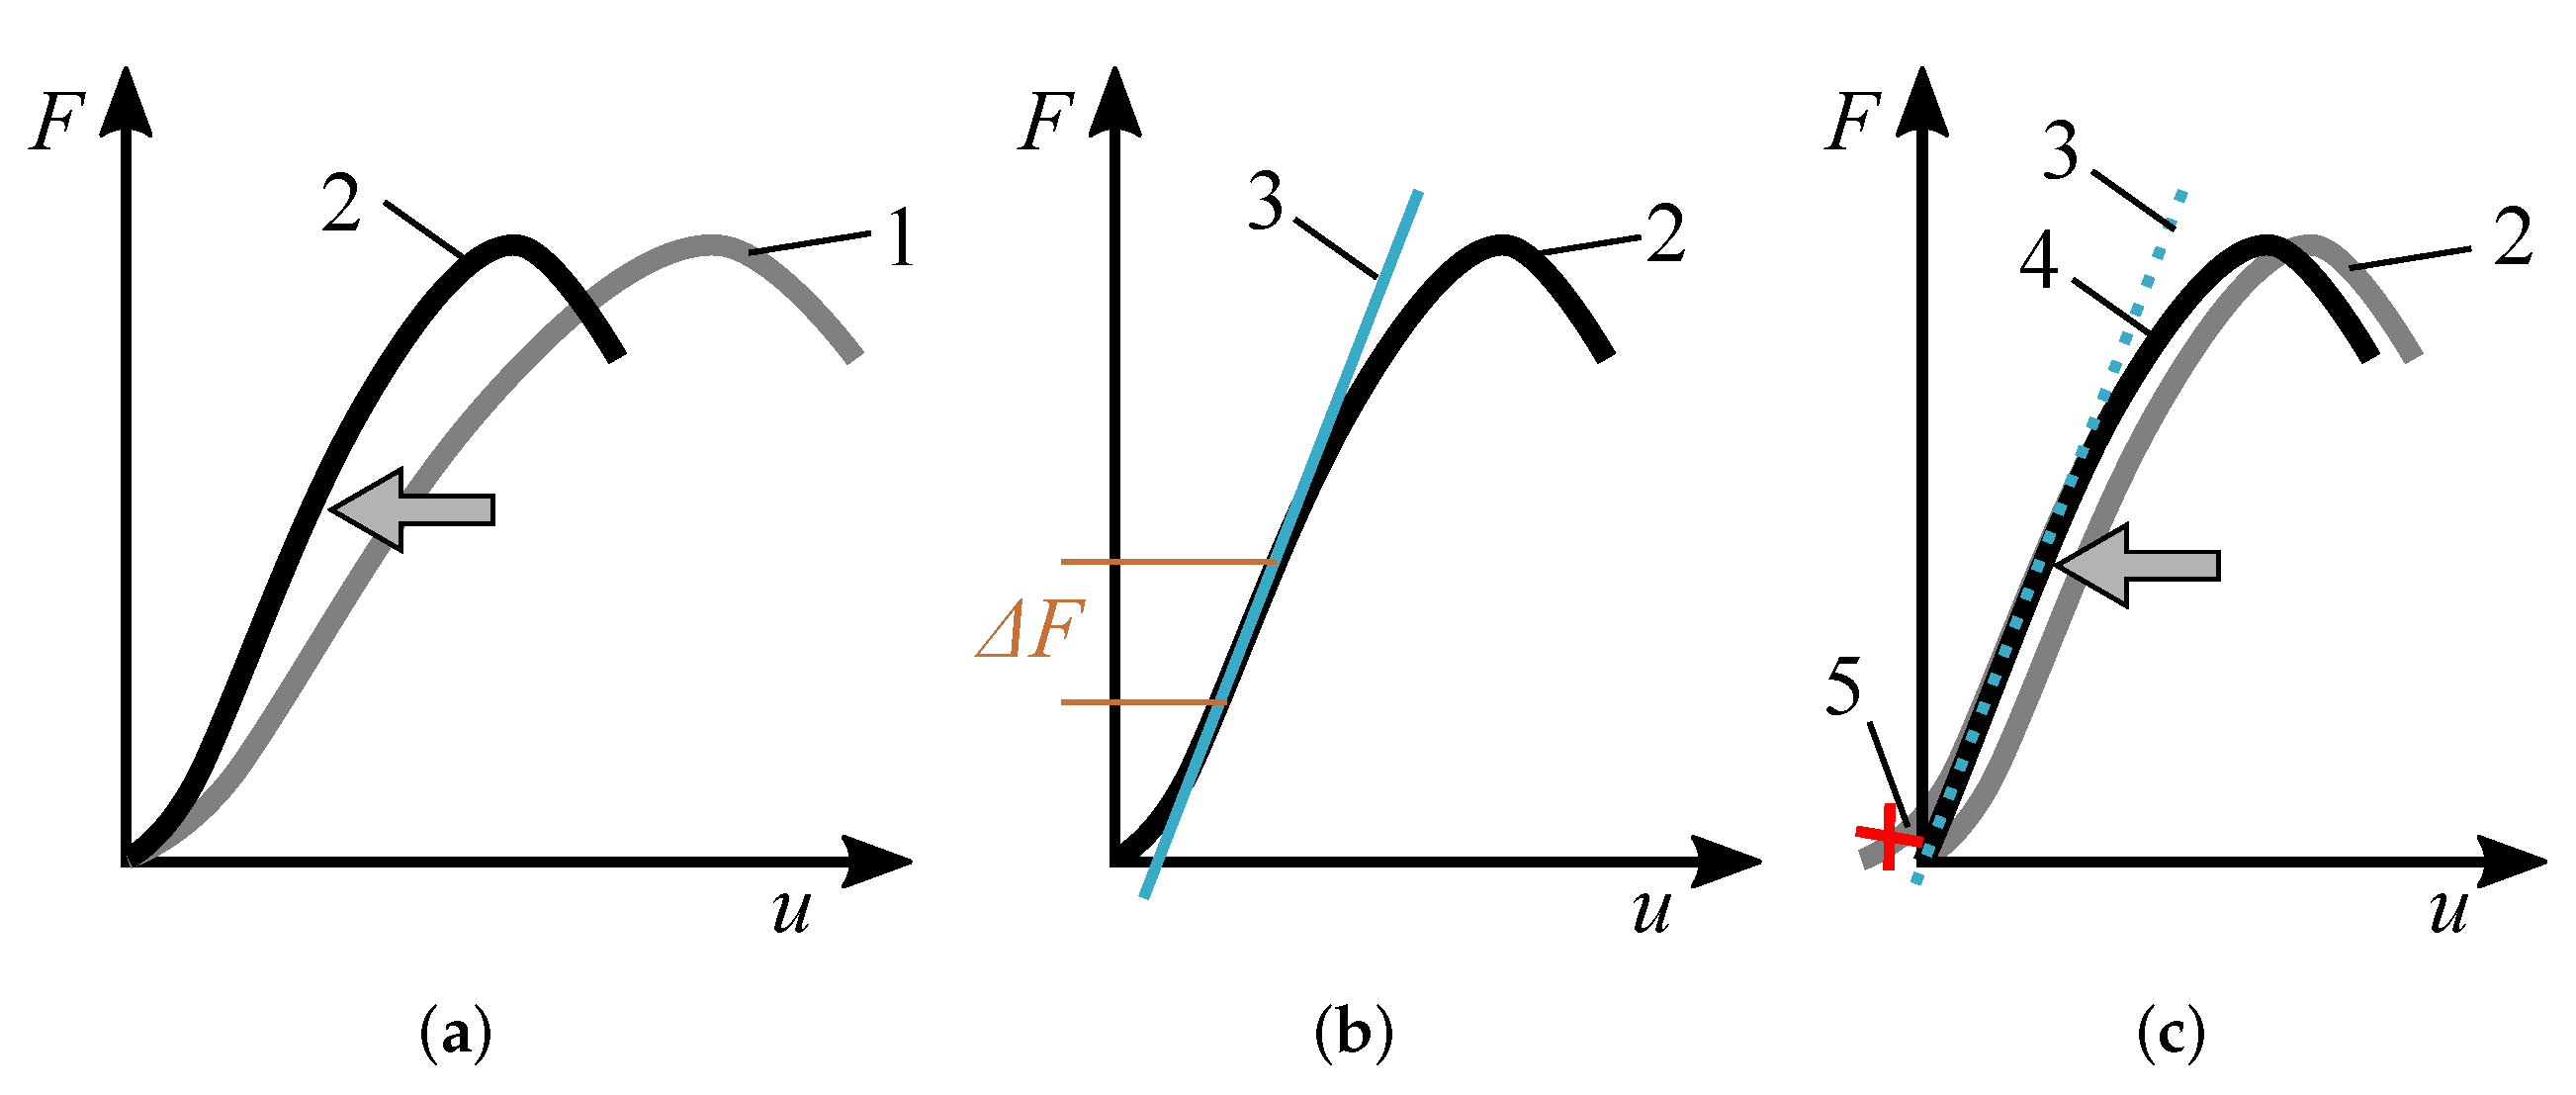
The outliers were defined by means of two properties: stiffness and maximum force, giving the values lower/greater than the first quartile minus/plus 1.5 times the inter quartile range. These specimens are excluded from further analysis. In case of stiffness, the specimens tagged as outliers varied depending on the value of Δ F (see Figure 6b). Only those specimens that fell into this category for all of the Δ F values were considered outliers.
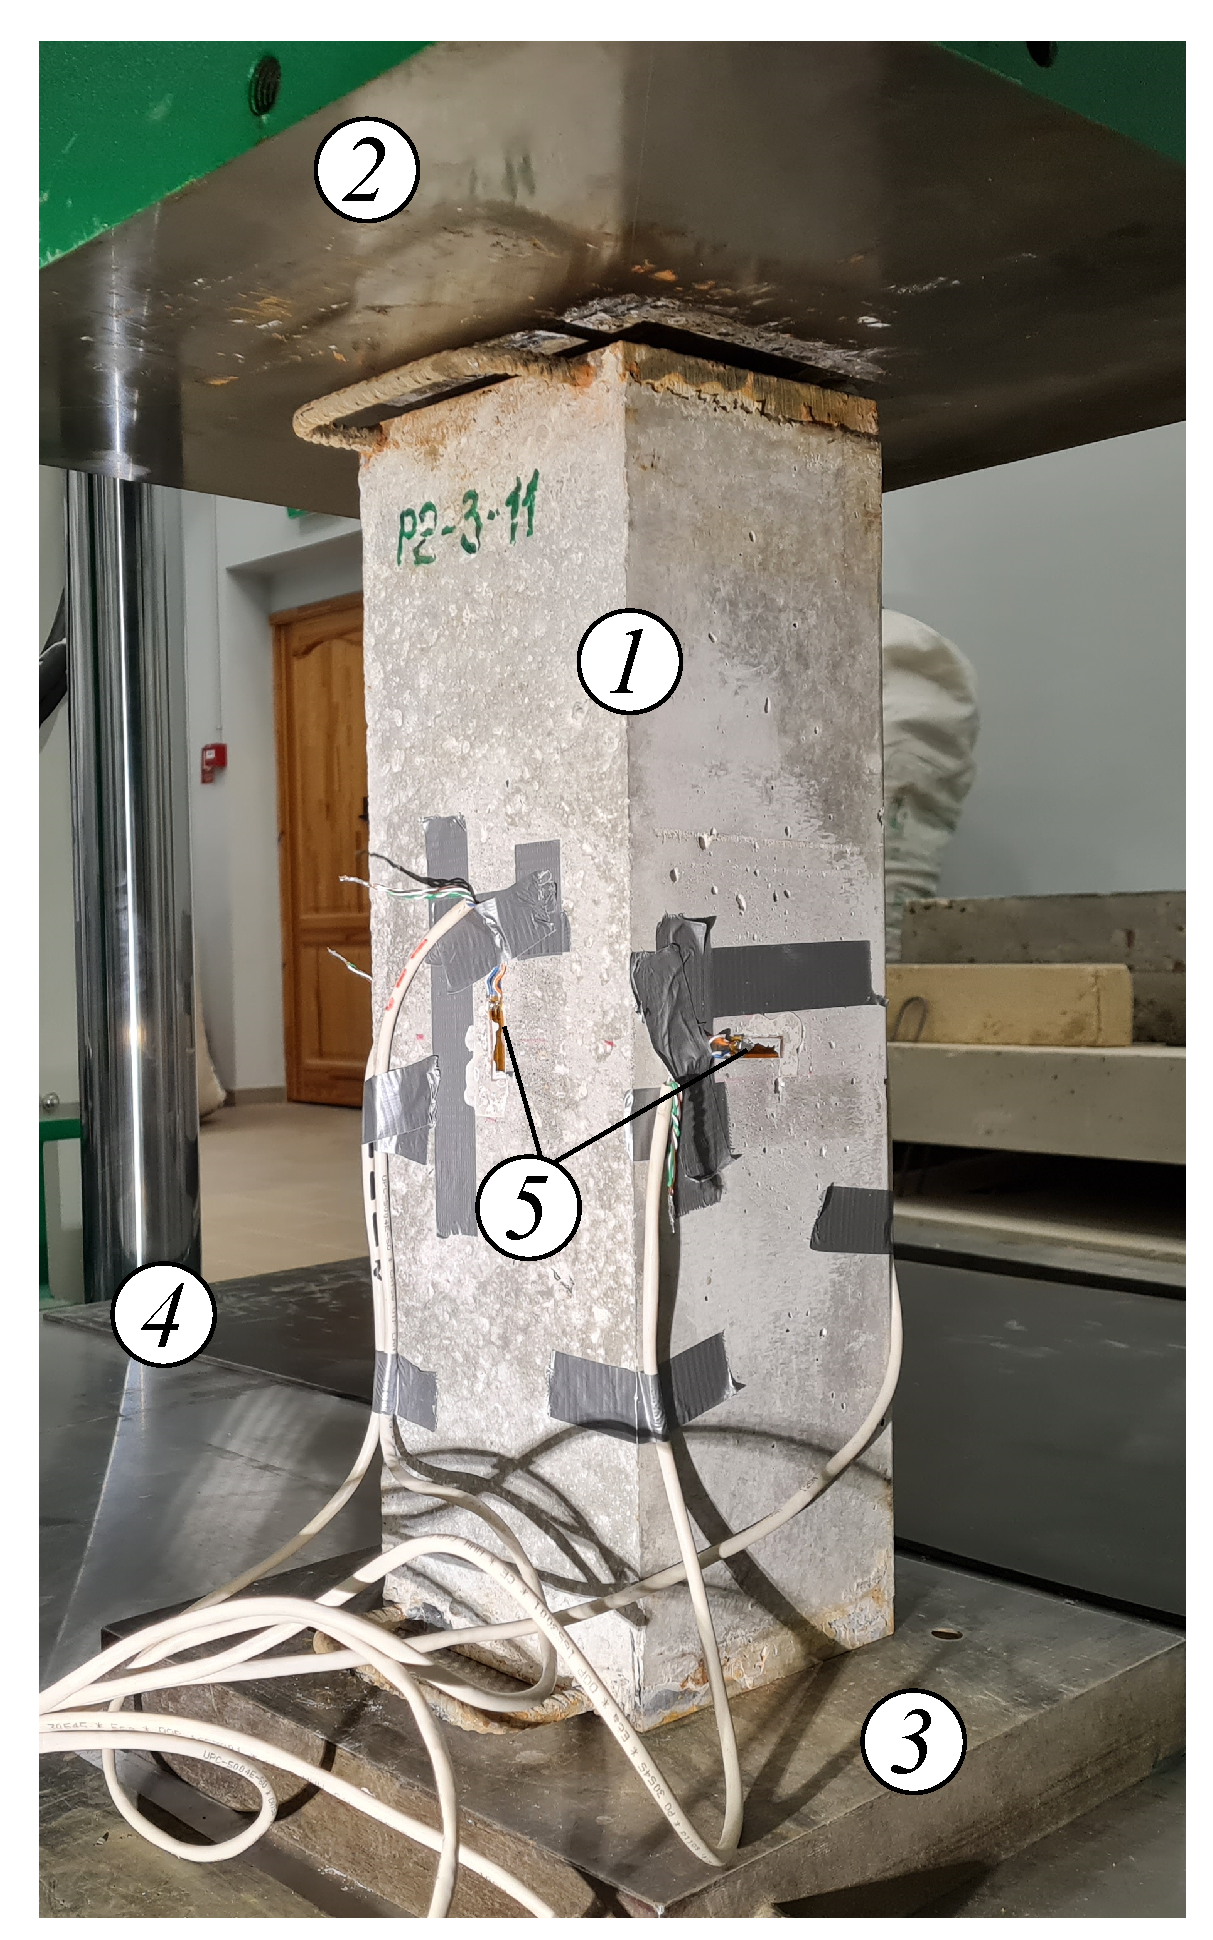
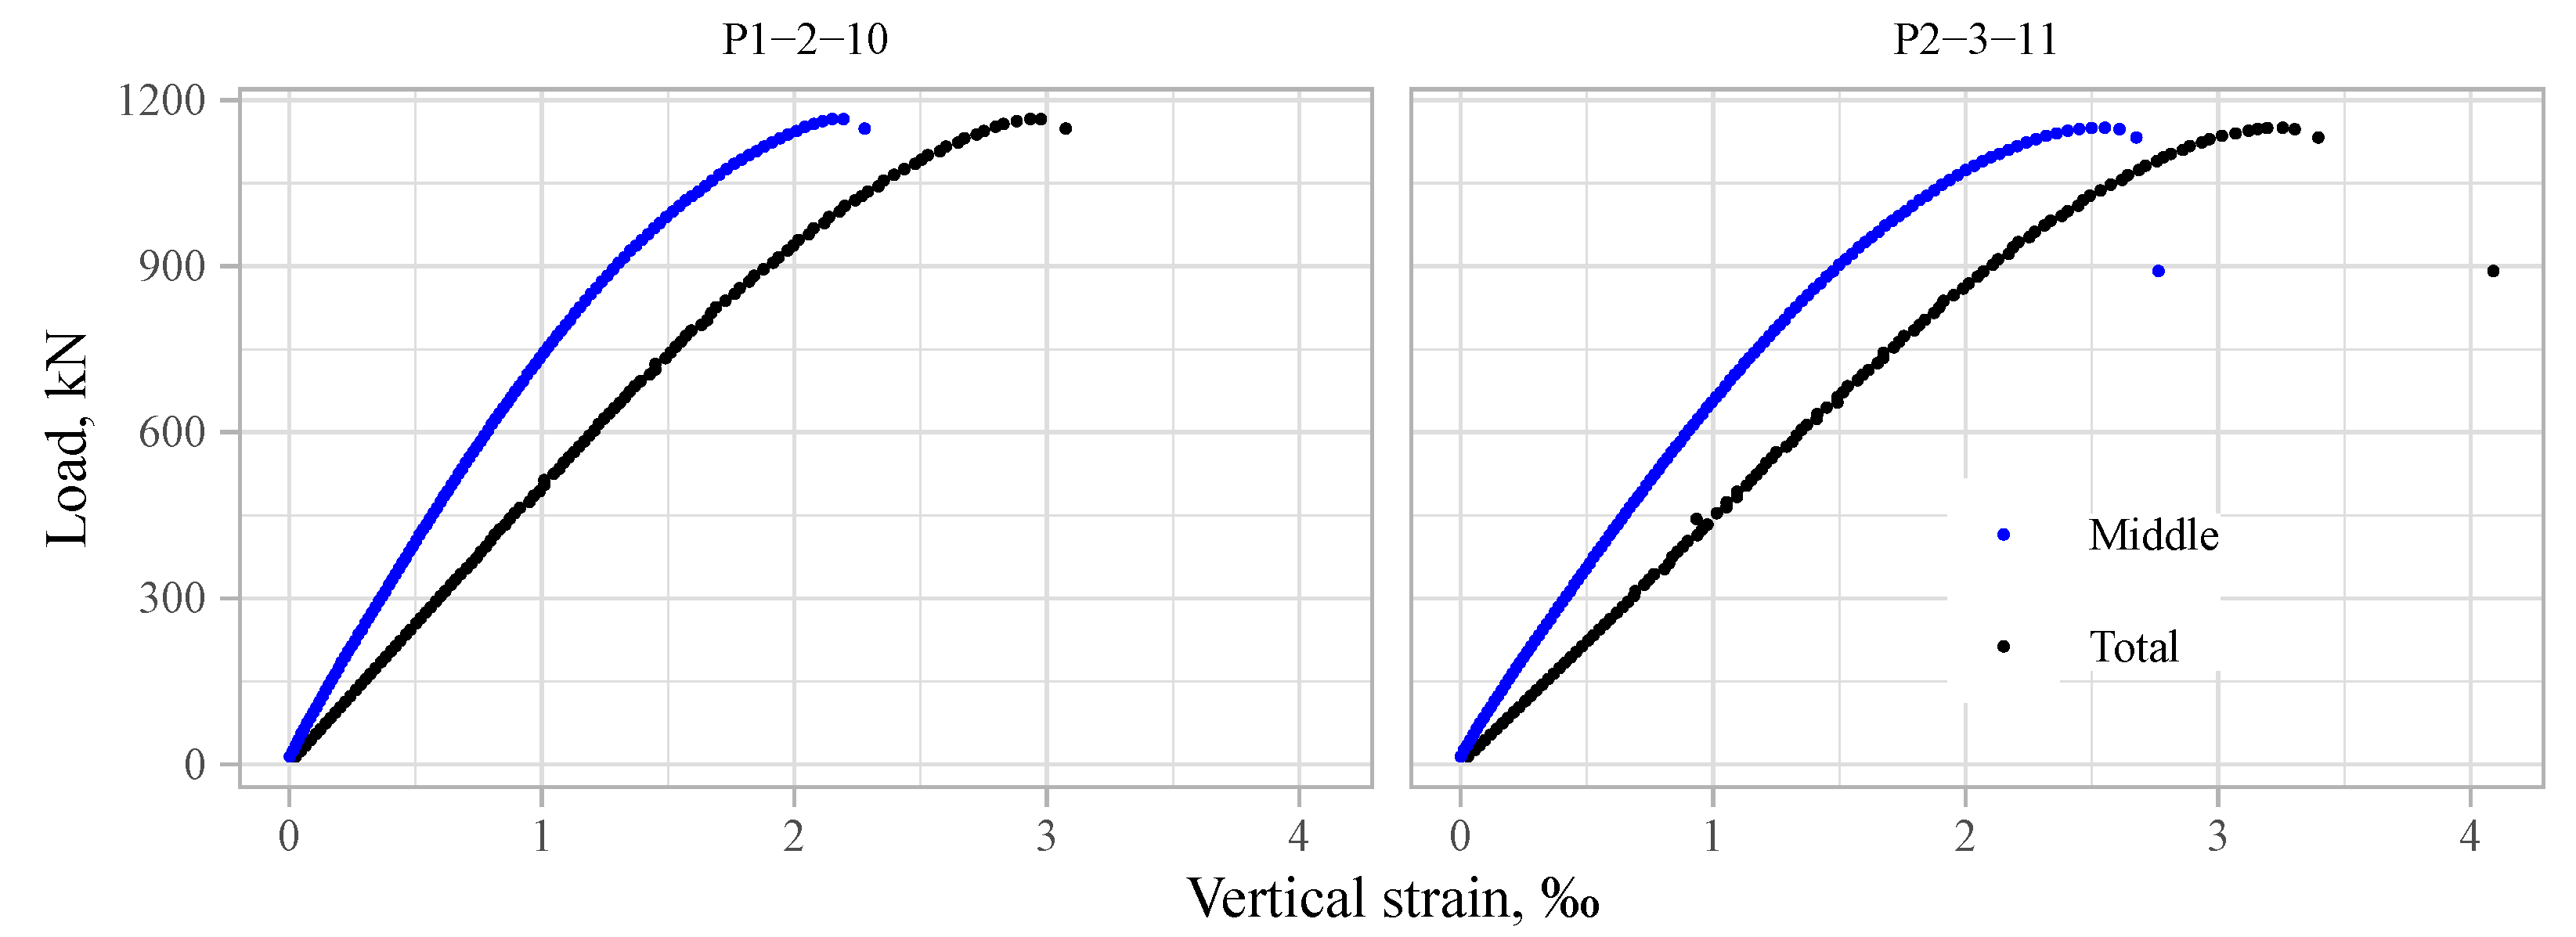
Two specimens (P1-2-10 and P2-3-11) were used to evaluate the overall stiffness used in this analysis. Load–strain diagrams obtained by two methods are plotted in Figure 13. The black data points represent “total strains” calculated as the overall vertical displacement obtained by the method described in Section 2.4.2 and divided by the overall height of the specimens. The blue data points show the strains measured by strain gauges at the middle of the specimen. The total strains are ≈1.5 times larger than the ones measured at the middle of the specimens.

3.3. Maximum Force

It can be seen from the force–displacement diagrams in Figure 11 that specimens with a minimum amount of stirrups can take practically the same maximum force as the specimens without stirrups—no increase was obtained. However, specimens with fibres tend to have smaller maximum forces.
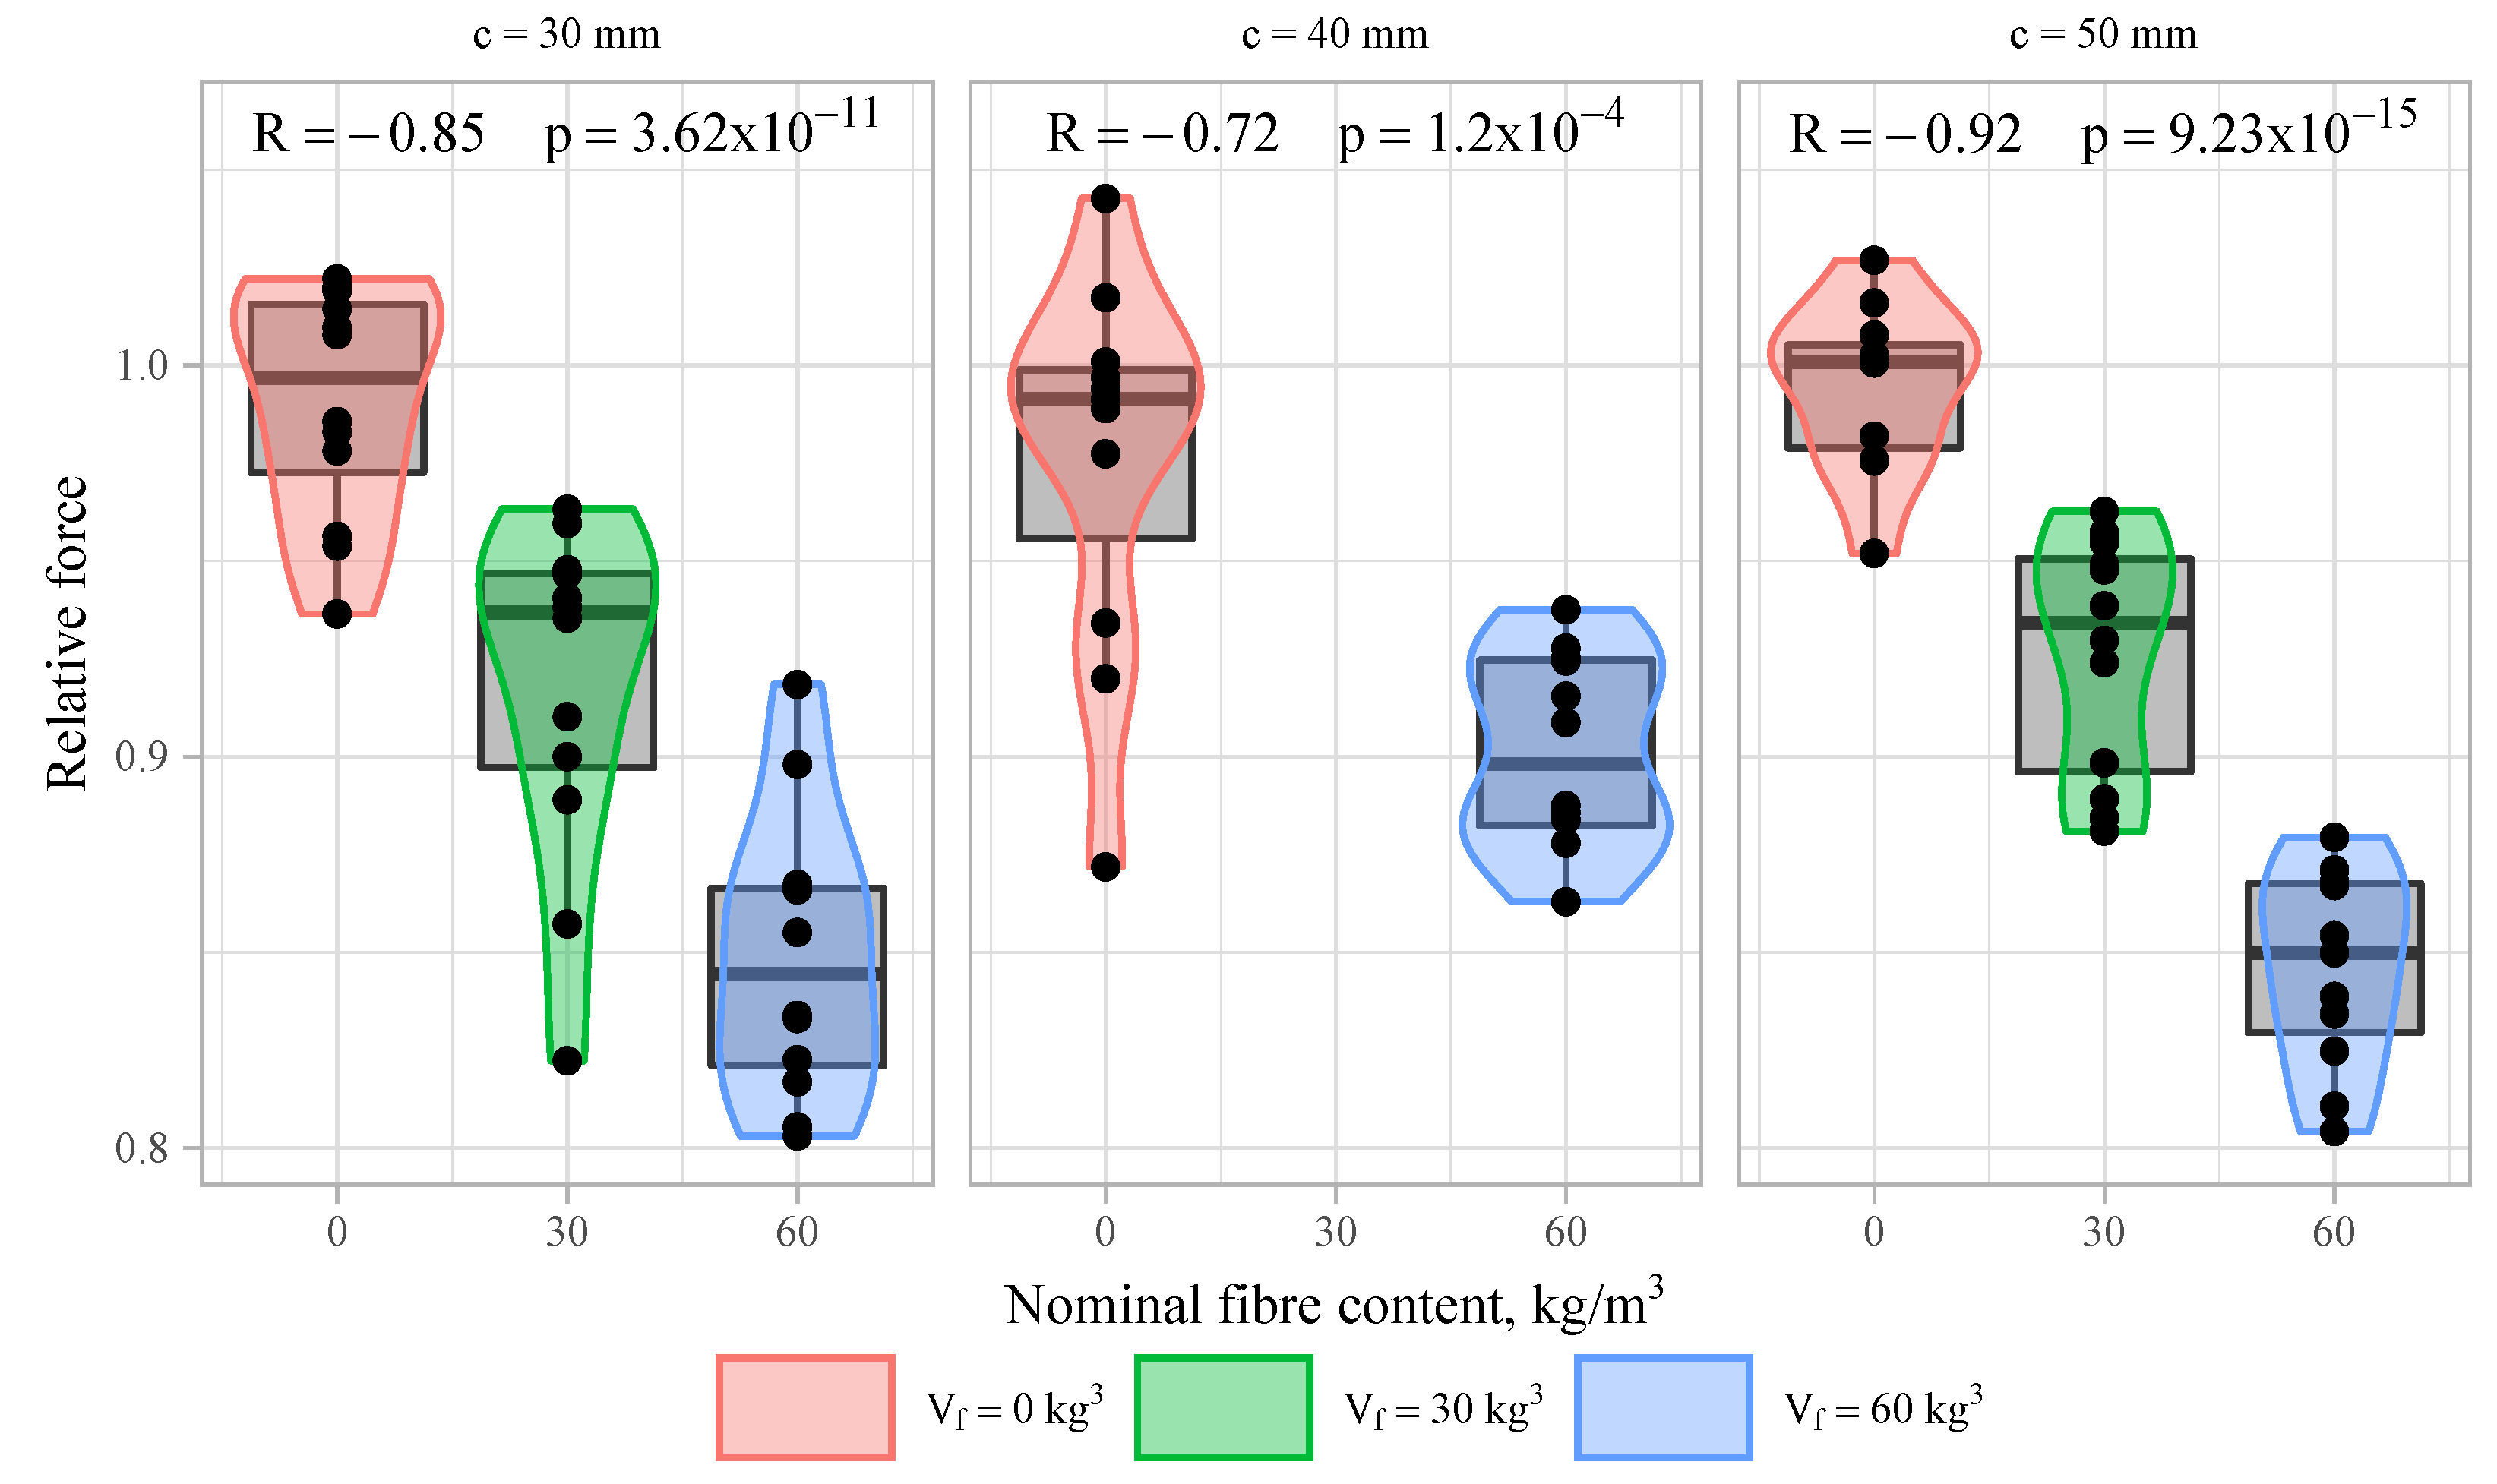
To evaluate the effect of fibres, correlation analysis between the fibre content V f and the relative value of the maximum force calculated by Equation (2) was performed. A profound negative correlation between nominal fibre content and relative maximum force was observed—the more fibres added, the smaller the maximum force. Correlation coefficients R vary from −0.72 to −0.92 with p-value strongly below 0.05 value (see Figure 14). The reduction of the average relative maximum force is around 7–9% for specimens with fibre amount of 30 kg/m 3 and 16% for specimens with fibre amount of 60 kg/m 3 if compared to specimens with no fibres.
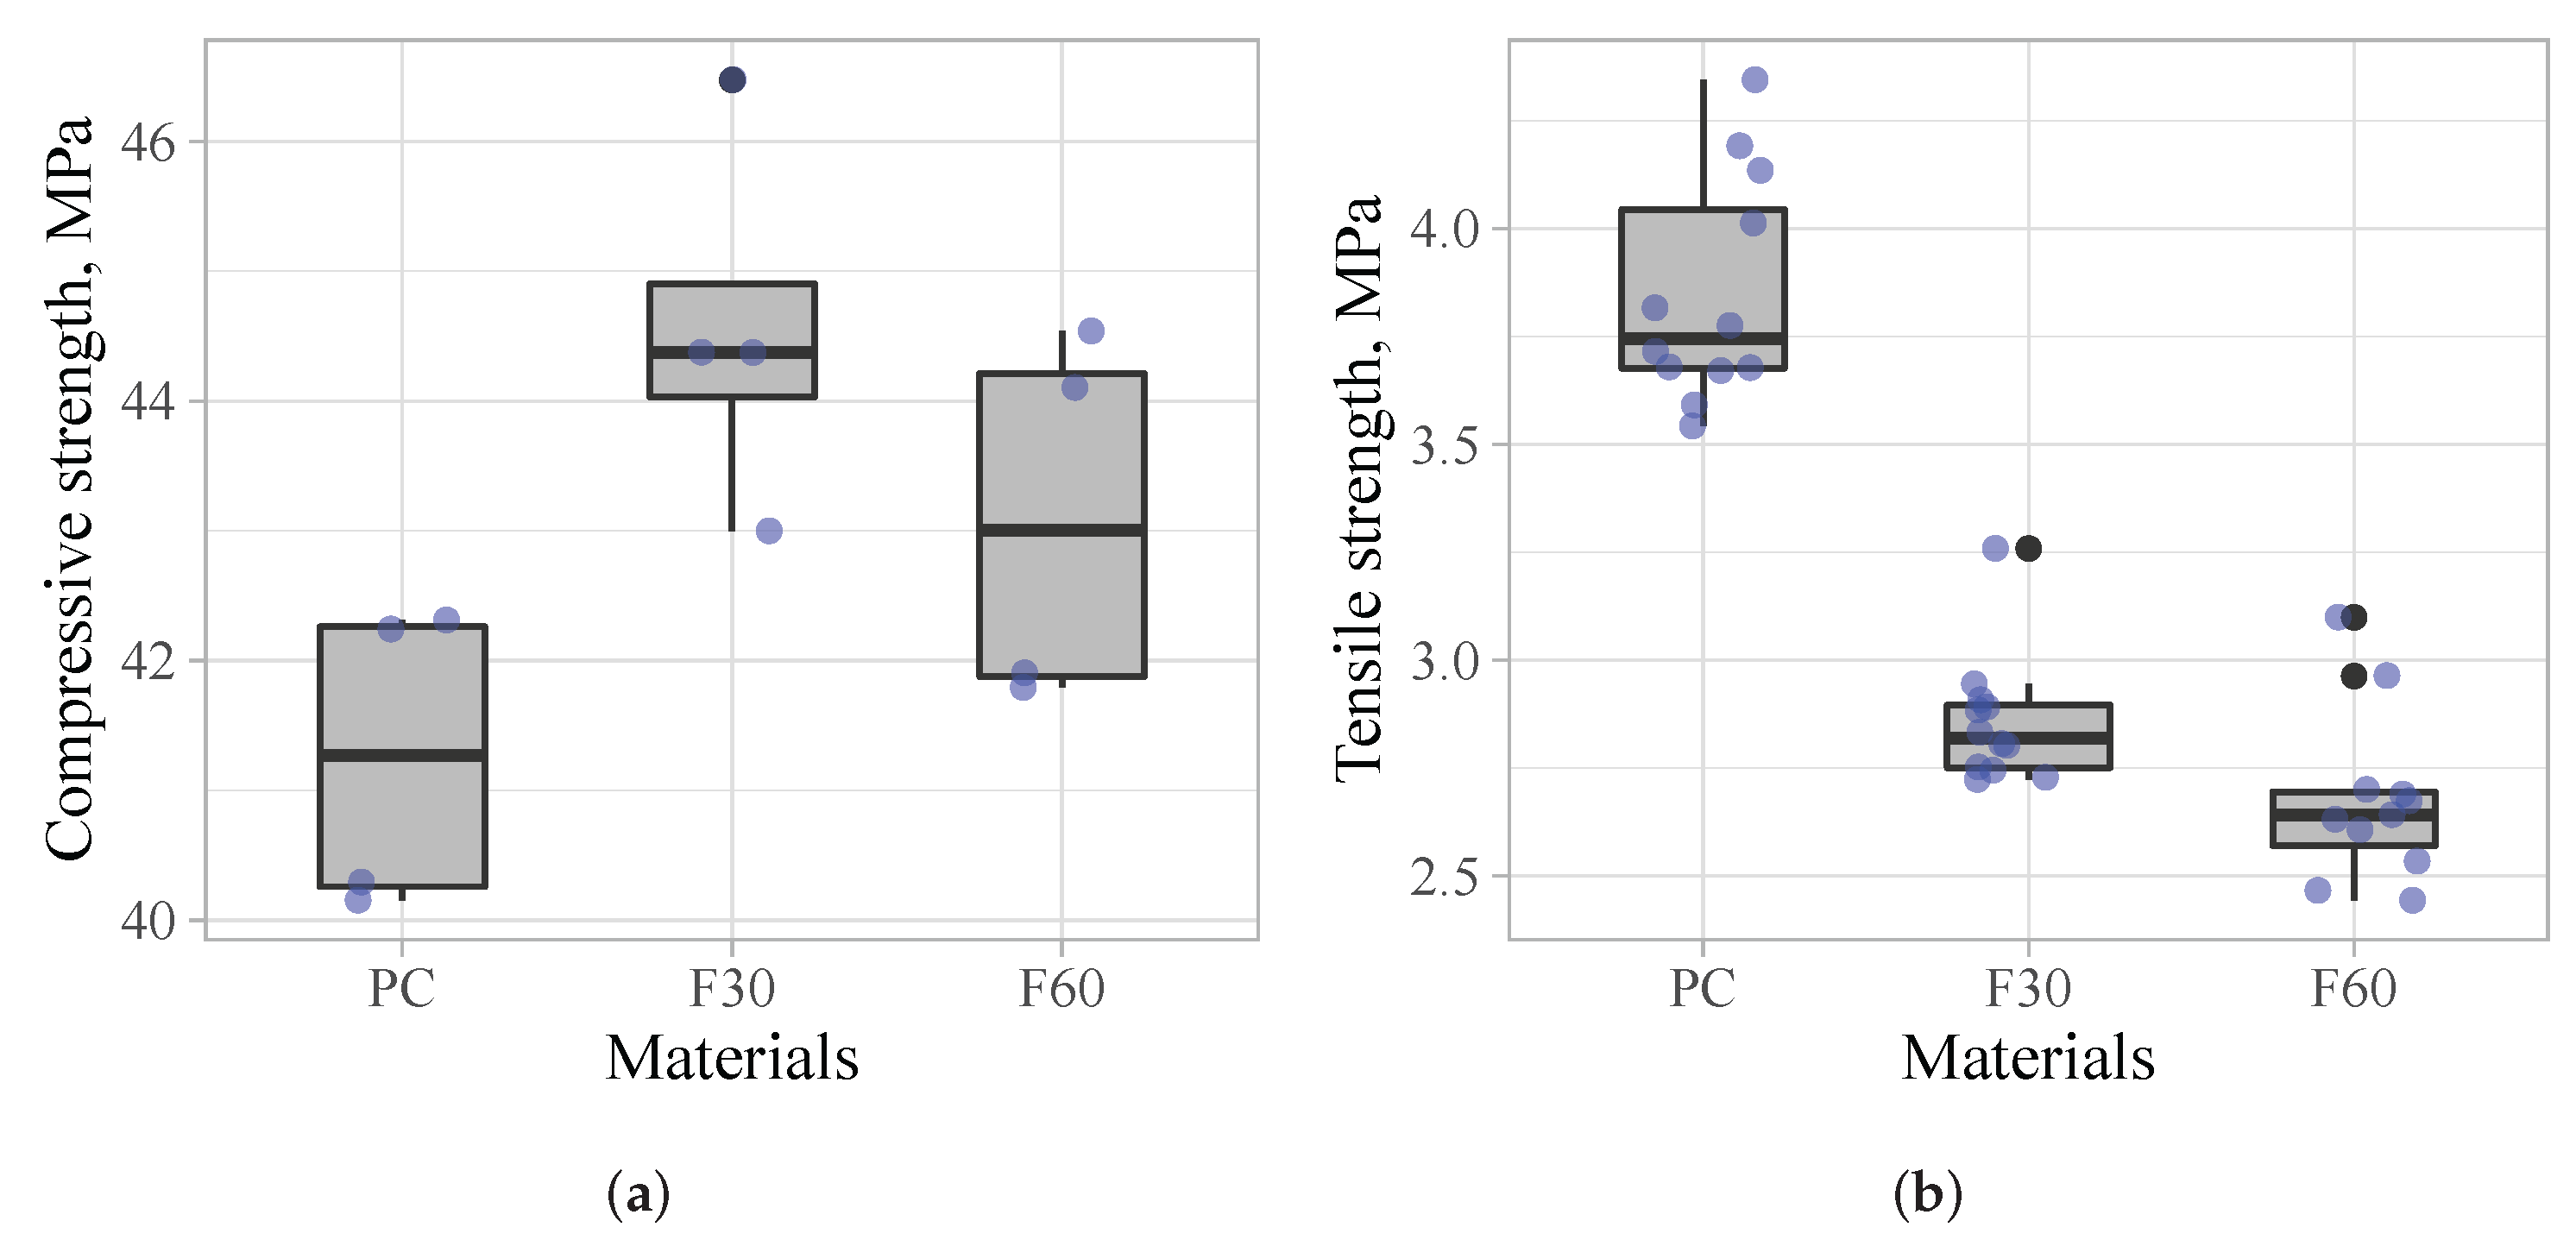
The negative effect of fibres on the load-bearing capacity is confusing, as it contradicts the obtained cube compressive strength, which in this case is higher for SFRC specimens (see Figure 3a). Investigations by other authors also show that by adding steel fibres to concrete, compressive strength increases [20,21,22,23].
There are contrasting findings regarding compressive strength of SFRC in reinforced columns in the literature. Some authors have found considerable increase of the load-bearing capacity (11–14% [5], 20% [8], and 55% [7]) in columns with steel fibres if compared to ones without fibres. The fibre content used in these studies is rather high: 1.5 and 2.5% by volume. The effect of fibres is more pronounced if a sufficient amount of confining reinforcement is supplied [5]. Other researchers have found no significant influence of fibres on the ultimate compressive strength [3,9,24]. Fibre content used in these studies was 1.5, 3.0, and below 1.0% by volume. There are some differences in the values of the maximum loads, but they are more likely a result of statistical variations in concrete mixes and other factors. Khayat et al. [25] have found that reinforced concrete columns made of self compacting concrete had lower load-carrying capacity compared to those made of normal concrete.
A possible explanation for the reduction of load-bearing capacity observed in the current study is the disturbed compactness of concrete mix during the casting process caused by the combination of rebars and fibres. The specimens were made from self-compacting concrete with no vibration applied. Longitudinal rebars create zones where the flow of concrete mix with 50 mm fibres is disrupted, leading to concrete sections with lower density. The discrepancy between the results of control cubes and the test specimens shows that the presence and arrangement of conventional reinforcement can affect the properties of SFRC considerably.
This complies with the detailing rules given in [12,13] providing for minimum spacing between rebars, which in the case of self-compacting concrete is suggested to be 1.5 to 2 times the fibre length. The current study suggests that additional rules for minimum concrete cover should also be included in the design of combined reinforced and fibre-reinforced concrete structures.

3.4. Stiffness

Figure 10 and 
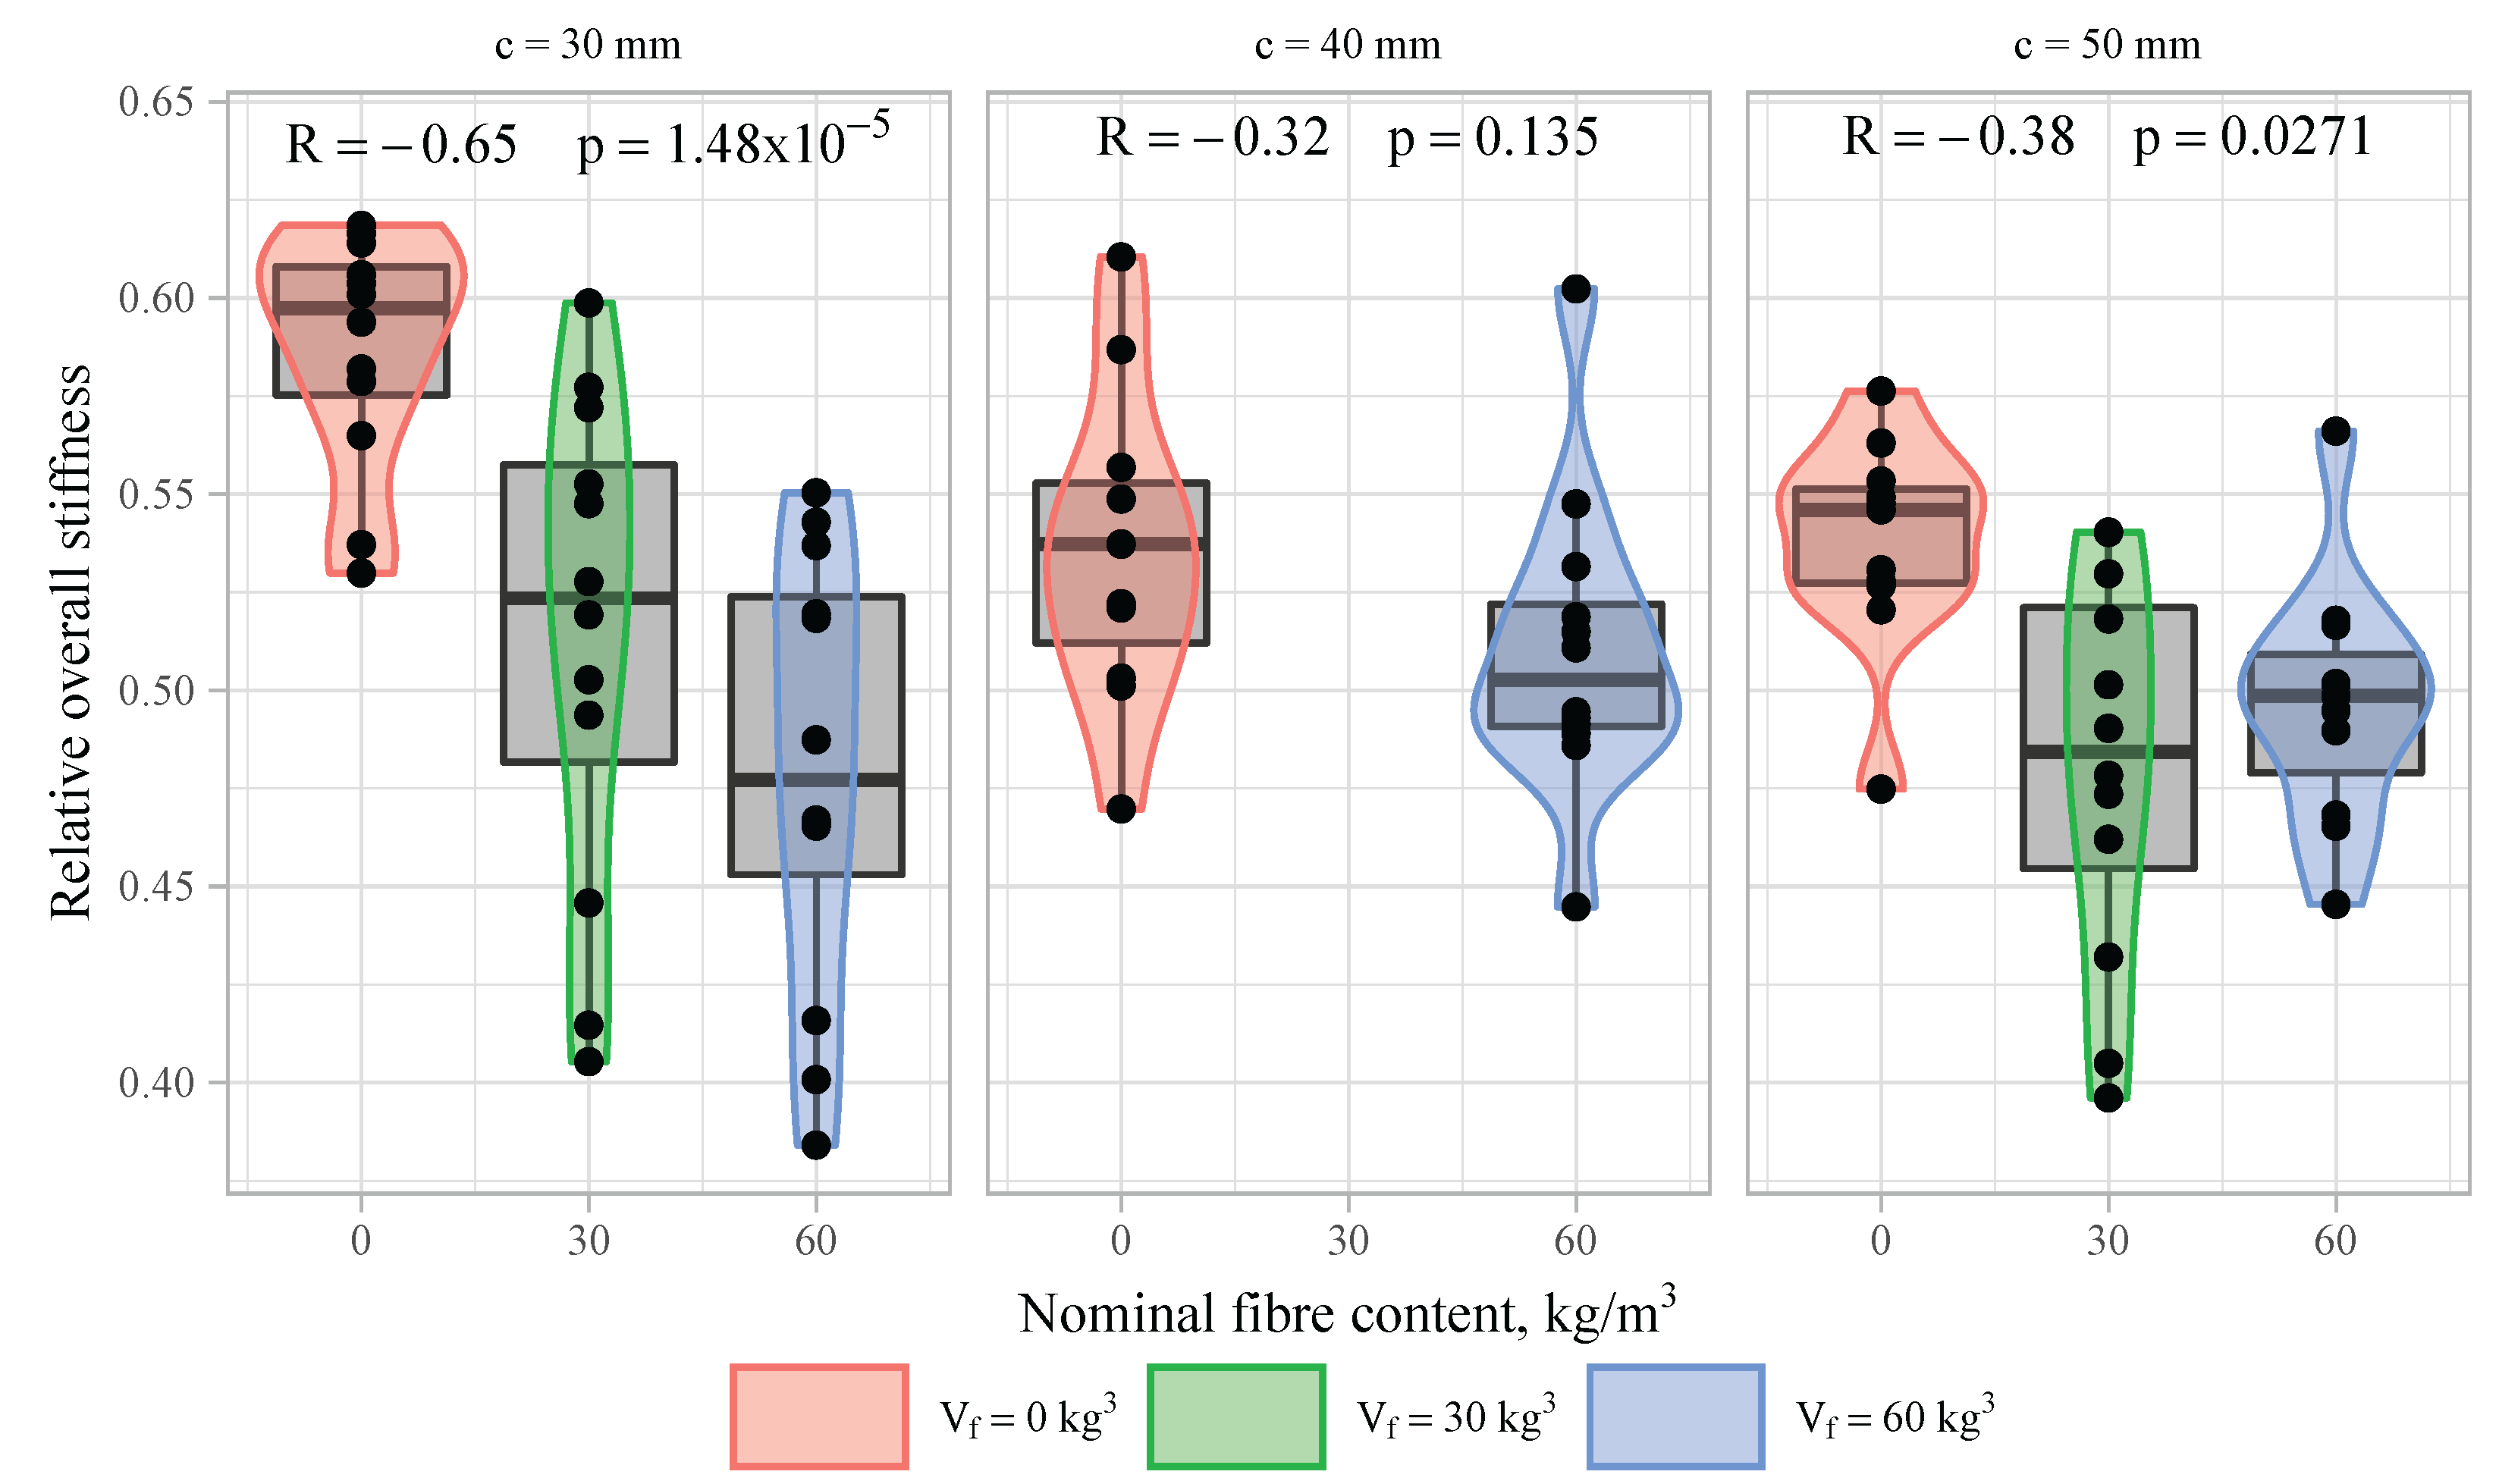
Figure 11 show that there is a negative influence of fibres on the axial stiffness of the tested specimens and also on the scatter of the results. The correlation between the fibre content and the relative overall stiffness calculated by (4) was analysed and the results are given in Figure 15. There is a very small or negligible correlation between the relative value of the overall stiffness and the amount of fibres observed. On average, the stiffness is smaller for specimens with fibres. The negative effect is more profound for samples with the smallest concrete cover (c = 30 mm), but in other cases the values of the correlation coefficients are small or have no statistical significance.
Judging from the test results of other authors, the stiffness of the compressed specimens is the same for both SFRC and normal concrete [3,8,9]. An interesting observation can be found in Ganesan’s study [5]. In contrast to normal reinforced concrete, there was a reduction of axial stiffness in the case of specimens with steel fibres, while confinement by stirrups was increased. The reduction in stiffness was despite the increase of the load-bearing capacity.
Analysis of variance (ANOVA) is used to estimate if fibres have had an influence on the scatter of the results. Variance between two parameters—coefficient of variation and presence of fibres—is evaluated. In the case of the overall stiffness, the F value is 11.67, which is greater than the critical value 5.317 (p-value: 0.0091 < 0.05). That suggests that the presence of fibres influences the scatter of the overall stiffness results. However, in the case of maximum force and ductility, no effect of the fibres on the coefficient of variation was found.
The reduction of the stiffness and the increase of the scatter of the stiffness values may be a result of the use of self-compacting fibre reinforced concrete combined with the arrangement of conventional reinforcement. As in the case of the strength properties, this factor can have its negative influence on the stiffness as well.

3.5. Ductility

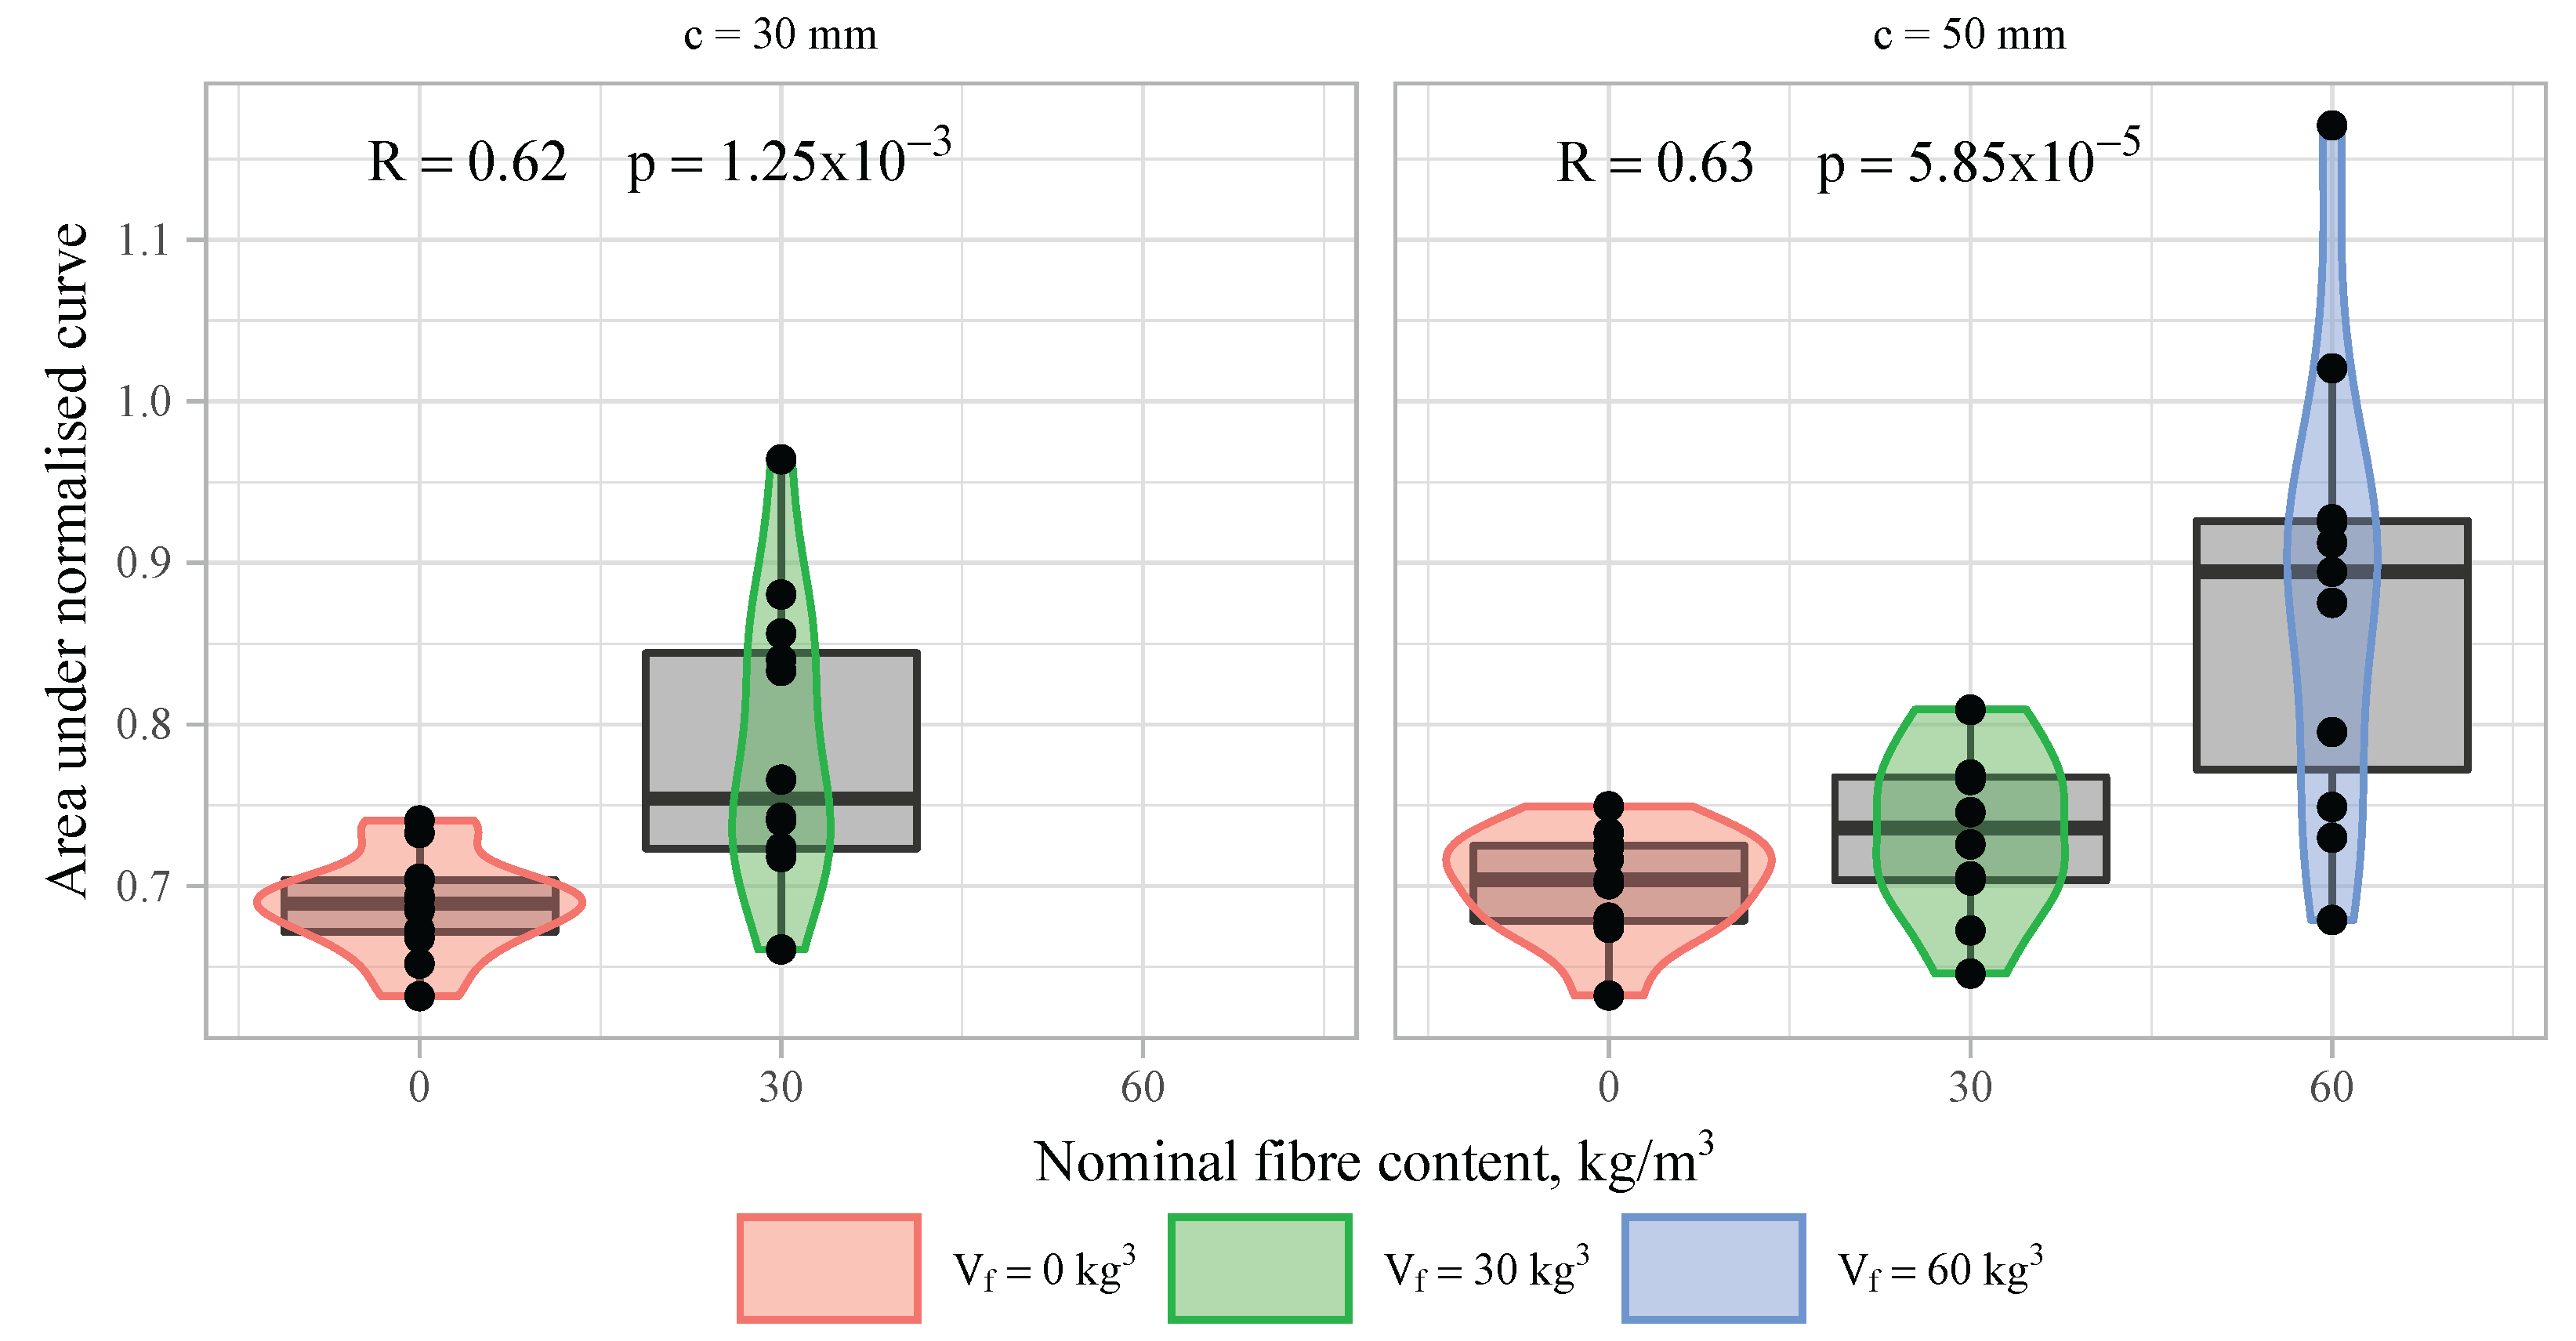
As it can be seen from the normalised curves in Figure 12, fibres increase ductility, or the residual strength of the reinforced concrete elements. This property was estimated by comparing the area under the normalised force–displacement curves. There is a positive correlation between the nominal amount of fibres and the area under the normalised curves among the specimens in this study (see Figure 16). The increase is more profound for the sample with the highest fibre content ( V f = 60 kg/m 3 ). Unfortunately, the other two samples with the highest fibre dosage cannot be included in this evaluation because of the different loading control approach used during the tests (see Section 2.4.3).
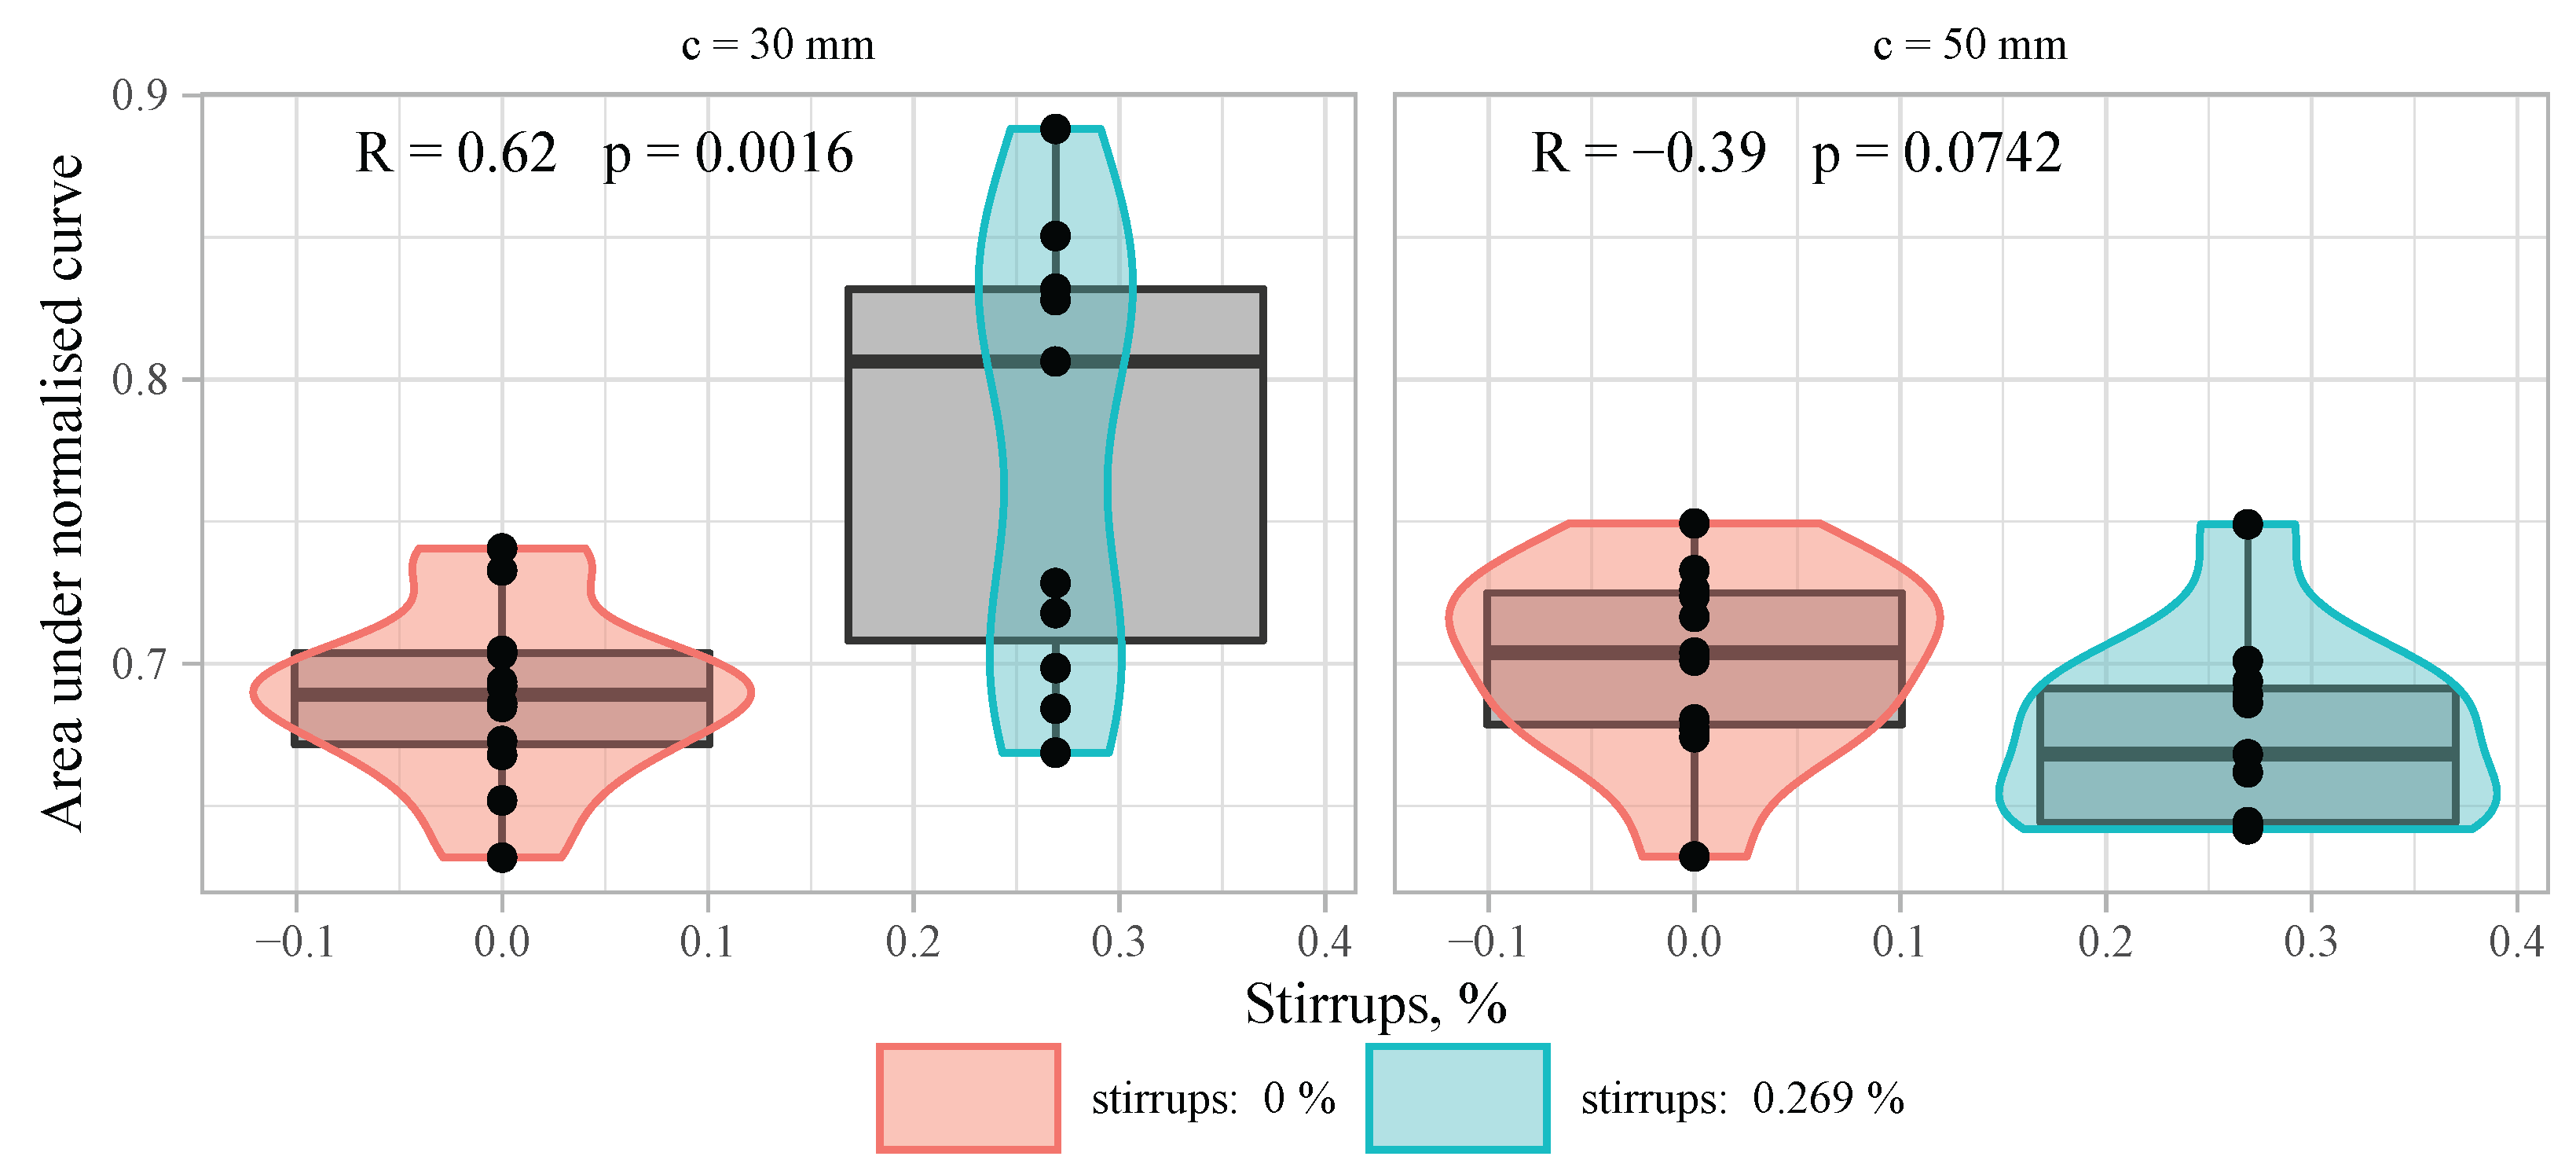
The specimens with conventional stirrups had increased ductility if concrete cover was rather small (Figure 17). The effect of the stirrups is equal to fibres with amount of 30 kg/m 3 . However, they had nearly the same ductility as the specimens with no fibres and no stirrups if the bar distance was c = 50 mm. A reason for that could be the small distance between the bars, which was equal to 50 mm, thus the concrete volume between the bars or the core of the specimens is significantly smaller than the unreinforced volume outside the bars. The negative value of the correlation coefficient −0.39 (see Figure 17, c = 50 mm) is most probably caused by the fluctuation of the results and does not represent actual tendencies because the p-value is larger than 0.05. On the other hand, fibres also increased ductility for specimens with the largest concrete cover.
The difference between the stirrups and fibres is that the ductility induced by stirrups depends on the volume enclosed by them, while this is not the case for SFRC. The ductility induced by fibres depends more on the distribution of fibres in the whole volume. Small concrete covers can disturb the distribution of fibres, thus affecting other aspects such as concrete spalling around the bars.
The increased ductility of reinforced concrete columns induced by fibres is also well-documented by other researchers [3,5,6]. They suggest that the amount of horizontal reinforcement can be significantly reduced if sufficient amount of fibres is provided. The fibre amount suggested by these authors ranges from 0.9% to 1.5% by volume. The results of the present study suggest that fibres can also be used to replace the minimum required horizontal reinforcement, if ductility requirements need to be met, and the necessary amount of fibres can be even smaller, e.g., 0.8% (60 kg/m 3 ). To confirm the findings, further studies are needed in which specimens with larger heights are included.

3.6. Design Considerations

Fantilli et al. [3] have given a theoretical example how a concrete column with steel fibres of 70 kg/m 3 (0.9% by volume) would have the same ductility as columns with a minimum amount of conventional stirrups. Their calculation is based on an assumption that the effect of fibres in cylindrical specimens is the same as in the columns with reinforcement bars. It can be true for the ductility of the cross-section, but one must be cautious considering strength properties. Although Aoude et al. [6] used self-compacting concrete with 1.0–1.5% fibres, registering an increase in load-bearing capacity due to fibres, the current study suggests that the arrangement of conventional reinforcement and thickness of concrete cover can have a negative influence on the effect of fibres if no vibration is applied.
If structural walls or columns are designed, it is very important to understand the effect of fibres and the factors that influence it. A structural designer may ignore a possible positive influence of fibres regarding compressive strength and have a conservative solution. However, if the strength of SFRC in a column is reduced due to unfavourable arrangement of conventional reinforcement, the load-bearing capacity of that column will be reduced as well.
In addition, casting technology can play a significant role. If higher fibre dosages with self-compacting concrete are used (1.0% and above), additional vibration may be needed [6]. To properly evaluate the intensity of the necessary vibration, more qualified working staff at the manufacturing plants are required, which is not possible in many plants. Therefore, simple casting methods should be considered when research on the effect of SFRC in structural members is performed.

4. Conclusions

In this experimental study, the effect of steel fibres in compressed reinforced concrete elements was evaluated and compared to the effect of the minimum required conventional horizontal ties. Ten different samples with 120 specimens in total were tested and the following conclusions were drawn:
1.
The failure of the specimens with fibres was soft and had no spalling if compared to the ones without fibres.
2.
In the case of small concrete cover, regions with no fibres were formed near outer corners and partial spalling was observed.
3.
Specimens with fibre amount of 30 kg/m 3 showed similar ductility as the specimens with the minimum amount of conventional stirrups.
4.
There was no effect of the confining stirrups on the ductility for the specimens with large concrete cover and small core between longitudinal bars, while the effect of fibres remained profound in such cases.
5.
There was a strong negative correlation (−0.72, −0.85, and −0.92) between nominal amount of fibres and the maximum compressive force carried by the test specimens. The capacity decreased by 16% for specimens with fibres of 60 kg/m 3 .
6.
Although no significant correlation was found, on average the specimens with fibres had smaller overall compressive stiffness if compared to those with no fibres. The presence of fibres also increased the scatter of the obtained stiffness values.
7.
Combination of self-compacting concrete with steel fibres and dense conventional reinforcement can lead to reduced stiffness and maximum load-bearing capacity of the structure if no vibration is applied.
The findings of this research are limited to relatively short columns with height to depth ratio equal to 3, which were produced using one specific casting technology. To confirm the results, further studies are needed, in which specimens with higher height to depth ratios and different casting methods are used.

Funding

The research received funding from the European Regional Development Fund, Post-doctoral Research Support Program (project No. 1.1.1.2/16/I/001) Research application “Efficiency of fibre reinforced cement composites in structural walls” (No. 1.1.1.2./VIAA/3/19/487). Test specimens were produced and supplied by the project partner JSC “MB Betons”.

Institutional Review Board Statement

Not applicable.

Informed Consent Statement

Not applicable.

Data Availability Statement

Publicly available datasets were analysed in this study. This data can be found here (accessed on 27 June 2022): https://www.llu.lv/lv/projektu_resursi/6274 under Work Package 1.

Conflicts of Interest

The funder had no role in the design of the study; in the collection, analyses, or interpretation of data; in the writing of the manuscript, or in the decision to publish the results.

References

  1. Skadiņš, U. Efficiency of Fibre Reinforced Cement Composites in Structural Walls. Available online: https://www.llu.lv/lv/projekti/apstiprinatie-projekti/2020/isskiedru-cementa-kompozitu-izmantosanas-efektivitate-nesoso (accessed on 27 June 2022). (In Latvian).
  2. Zhang, Y.; Harries, K.A.; Yuan, W. Experimental and numerical investigation of the seismic performance of hollow rectangular bridge piers constructed with and without steel fiber reinforced concrete. Eng. Str. 2013, 48, 255–265. [Google Scholar] [CrossRef]
  3. Fantilli, A.P.; Vallini, P.; Chiaia, B.M. Ductility of fiber-reinforced self-consolidating concrete under multi-axial compression. Cem. Concr. Compos. 2011, 33, 520–527. [Google Scholar] [CrossRef] [Green Version]
  4. Fantilli, A.P.; Mihashi, H.; Vallini, P.; Chiaia, B.M. Equivalent Confinement in HPFRCC Columns Measured by Triaxial Test. ACI Mater. J. 2011, 33, 520–527. [Google Scholar]
  5. Ganesan, N.; Ramana Murthy, J.V. Strength and behaviour of confined steel fiber reinforced concrete columns. ACI Mater. J. 1990, 87, 221–227. [Google Scholar]
  6. Aoude, H.; Cook, W.D.; Mitchell, D. Behavior of Columns Constructed with Fibers and Self-Consolidating Concrete. ACI Str. J. 2009, 106, 349–357. [Google Scholar]
  7. Ahmad, I.; Iqbal, M.; Abbas, A.; Badrashi, Y.I.; Jamal, A.; Ullah, S.; Yosri, A.M.; Hamad, M. Enhancement of Confinement in Scaled RC Columns using Steel Fibers Extracted from Scrap Tyres. Materials 2022, 15, 3219. [Google Scholar] [CrossRef] [PubMed]
  8. Balanji, E.K.Z.; Sheikh, M.N.; Hadi, M.N.S. Performance of high strength concrete columns reinforced with hybrid steel fiber under different loading conditions. Interaction Between Theory and Practice in Civil Engineering and Construction. In Proceedings of the First European and Mediterranean Structural Engineering and Construction Conference, Istanbul, Turkey, 24–29 May 2016; Komurlu, R., Gurgun, A., Singh, A., Yazdani, S., Eds.; ISEC Press: Fargo, ND, USA, 2016; pp. 35–40. [Google Scholar]
  9. Mangat, P.S.; Motamedi Azari, M. Influence of steel fibre and stirrup reinforcement on the properties of concrete in compression members. Int. J. Cem. Compos. Lightweight Concr. 1985, 7, 183–192. [Google Scholar] [CrossRef]
  10. Pereiro-Barceló, J.; Bonet, J.L. Mixed model for the analytical determination of critical buckling load of passive reinforcement in compressed RC and FRC elements under monotonic loading. Eng. Str. 2017, 150, 76–90. [Google Scholar] [CrossRef] [Green Version]
  11. Khandaker, M.A.H.; Sandeep, P.; Tanvir, M. Axial Behavior of Columns Confined with Engineered Cementitious Composite. ACI Str. J. 2022, 119, 67–76. [Google Scholar]
  12. SFRC Consortium. Design Guideline for Structural Applications of Steel Fibre Reinforced Concrete; SFRC Consortium. 2014. Available online: http://www.steelfibreconcrete.com/34429 (accessed on 13 May 2022).
  13. SS812310:2014SIS; Swedish Standard. Fibre Concrete–Design of Fibre Concrete Structures; Swedish Institute for Standards: Stockholm, Sweden, 2014.
  14. EN 12390–3:2019 E; CEN European Standard. Testing Hardened Concrete—Part 3: Compressive Strength of Test Specimens; CEN: Brussels, Belgium,, 2019.
  15. EN 12390–5:2019 E; CEN European Standard. Testing Hardened Concrete—Part 5: Flexural Strength of Test Specimens; CEN: Brussels, Belgium, 2019.
  16. EN 14651:2005+A1:2007: E; CEN European Standard. Test Method for Metallic Fibre Concrete–Measuring the Flexural Tensile Strength (Limit of Proportionality (LOP), Residual); CEN: Brussels, Belgium,, 2007.
  17. Fédération Internationale du Béton. Model Code 2010, Final Draft; fib Bulletin Nos. 65/66; Fédération Internationale du Béton: Lausanne, France, 2012. [Google Scholar]
  18. EN 1992-1-1:2004: E; CEN European Standard. Eurocode 2: Design of Concrete Structures–Part 1-1: General Rules and Rules for Buildings; CEN: Brussels, Belgium, 2004.
  19. Jansen, D.C.; Shah, S.P. Effect of Length on Compressive Strain Softening of Concrete. J. Eng. Mech. 1997, 123, 25–35. [Google Scholar] [CrossRef] [Green Version]
  20. Akbari, C.; Khalilpour, S.; Dehestani, M. Analysis of material size and shape effects for steel fiber reinforcement self-consolidating concrete. Eng. Fract. Mech. 2019, 206, 46–63. [Google Scholar] [CrossRef]
  21. Abbass, W.; Khan, M.I.; Mourad, S. Evaluation of mechanical properties of steel fiber reinforced concrete with different strengths of concrete. Constr. Build. Mater. 2018, 168, 556–569. [Google Scholar] [CrossRef]
  22. Zhang, L.; Zhao, J.; Fan, C.; Wang, Z. Effect of Surface Shape and Content of Steel Fiber on Mechanical Properties of Concrete. Adv. Civ. Eng. 2020, 2020, 8834507. [Google Scholar] [CrossRef]
  23. Abadel, A.; Abbas, H.; Almusallam, T.; Al-Salloum, Y.; Siddiqui, N. Mechanical properties of hybrid fibre-reinforced concrete–Analytical modelling and experimental behaviour. Mag. Concr. Res. 2015, 68, 823–843. [Google Scholar] [CrossRef]
  24. Campione, G.; Fossetti, M.; Maurizio, P. Behavior of Fiber-Reinforced Concrete Columns under Axially and Eccentrically Compressive Loads. Technical paper. ACI Str. J. 2010, 107, 272–281. [Google Scholar]
  25. Khayat, K.H.; Paultre, P.; Tremblay, S. Structural Performance and In-Place Properties of Self-Consolidating Concrete Used for Casting Highly Reinforced Columns. ACI Mater. J. 2001, 89, 371–378. [Google Scholar]
Figure 1. Specimens: (a) group 1 to 3; (b) group 4 and 5; (c) cross section; (d) geometry of stirrups; 1–concrete; 2–longitudinal reinforcement Ø12 mm; 3–steel end-plates; 4–stirrups Ø6 mm; 5–welded joint; c–distance 30 mm, 40 mm, and 50 mm.
Fibers 10 00068 g001
Figure 2. Manufacturing of the specimens in pre-cast concrete plant: (a) prepared moulds; (b) casting process.
Fibers 10 00068 g002
Figure 3. Material properties: (a) compressive strength; (b) flexural tensile strength.
Fibers 10 00068 g003
Figure 4. Load–CMOD curves of SFRC standard prisms.
Fibers 10 00068 g004
Figure 5. Test set-up: 1—test specimen; 2—loading head with ball-seat; 3—base plate; 4—machine frame; 5—strain gauges (for two specimens only).
Fibers 10 00068 g005
Figure 6. Stiffness evaluation procedure: (a) step one—deformations of the test frame removed; (b) step two—the stiffness secant determined; (c) step three—final force–displacement curve obtained; 1—original force–piston displacement curve; 2—curve with frame deformations removed; 3—stiffness secant giving maximum angle with horizontal axis; 4—converted force–displacement curve used in further analysis; 5—initial imperfections removed; Δ F –force difference between points of the stiffness secant.
Fibers 10 00068 g006
Figure 7. Ductility evaluation: (a) definition of the normalised curve and the area under the curve; (b,c) determination of the end margin of the area; 1—normalised force–displacement curve; 2—area under the curve; 3—boundary line for the area representing ductility; 4—unreliable data points excluded from the evaluation; 5—first drop of force; 6—residual capacity.
Fibers 10 00068 g007
Figure 8. Typical failure modes of the tested samples: one specimen from each sample.
Fibers 10 00068 g008
Figure 9. Partial spalling of concrete cover in case of SFRC specimens with bar to side distance 30 mm and fibre content: (a) 30 kg/m 3 ; (b) 60 kg/m 3 .
Fibers 10 00068 g009
Figure 10. Relative force versus vertical displacement.
Fibers 10 00068 g010
Figure 11. Mean values of relative force versus vertical displacement for samples with concrete covers: (a) 30 mm and (b) 50 mm.
Fibers 10 00068 g011
Figure 12. Mean values of normalised force–displacement diagrams for samples with concrete covers: (a) 30 mm and (b) 50 mm.
Fibers 10 00068 g012
Figure 13. Load–vertical strain behaviour measured by strain gauges at the middle of specimens and total strains in case of specimens P1-2-10 and P2-3-11.
Fibers 10 00068 g013
Figure 14. Correlation between maximum force (relative value) and fibre content.
Fibers 10 00068 g014
Figure 15. Correlation between stiffness (relative value) and fibre content.
Fibers 10 00068 g015
Figure 16. Correlation between area under normalised force–displacement curve and fibre content.
Fibers 10 00068 g016
Figure 17. Correlation between area under normalised force–displacement curve and amount of stirrups.
Fibers 10 00068 g017
Table 1. Test samples.
Sample NameMaterialReinf. GroupTest DateFibre Content kg/m 3 Distance to Rebars, mmStirrups
P1-1PC121 January 2021030
P1-2PC220 January 2021040
P1-3PC322 January 2021050
P1-4PC422 January 2021030+
P1-5PC521 January 2021050+
P2-1F30119 January 20213030
P2-3F30319 January 20213050
P3-1F60114 January 20216030
P3-2F60214 January 20216040
P3-3F60315 January 20216050
Table 2. Material properties.
MaterialLabelFibre Content, f cube . m , CoV E cm , f ctm , CoV
kg/m 3 %MPa GPaMPa
1PC0041.250.0333.6553.850.07
2F3030≈0.444.560.0334.4422.860.05
3F6060≈0.843.090.0334.0972.680.07
CoV—Coefficient of variance.
Table 3. Material properties of steel fibre reinforced concrete (SFRC).
Mat.LOP/Residual Strength, MPaCoefficients of Variance
Label f R L . m f R 1 . m f R 2 . m f R 3 . m f R 4 . m CoV L CoV 1 CoV 2 CoV 3 CoV 4
F304.493.383.763.803.790.050.240.240.240.22
F604.244.845.214.714.150.070.270.240.210.18
Publisher’s Note: MDPI stays neutral with regard to jurisdictional claims in published maps and institutional affiliations.

