Article

Continuous Composition Spread and Electrochemical Studies of Low Cobalt Content Li(Ni,Mn,Co)O2 Cathode Materials

1
Center for Electronic Materials, Korea Institute of Science and Technology, Seoul 02792, Korea
2
Department of Materials Science and Engineering, Korea University, Seoul 02841, Korea
3
Nano Materials and Engineering, University of Science and Technology (UST), Dae-Jeon 34113, Korea
*
Author to whom correspondence should be addressed.
Coatings 2019, 9(6), 366; https://doi.org/10.3390/coatings9060366
Submission received: 27 February 2019 / Revised: 29 May 2019 / Accepted: 30 May 2019 / Published: 4 June 2019

Abstract

:
Many scientific efforts have been undertaken toward reducing the Co content in LiMn1/3Ni1/3Co1/3O2 cathode materials for thin-film batteries. In this study, we present cathodes with a wide range of Li(Ni, Mn, Co)O2 compositions to determine the material with the best electrochemical performance by changing the ratio of Ni to Mn at a fixed 0.1 at.% of Co by the continuous composition spread sputtering method. The cathode composition measurements by Rutherford backscattering spectroscopy show that the best electrochemical performance is obtained for a composition of Ni:Mn:Co = 19:71:10. The reasons for this improved electrochemical performance are further investigated by X-ray diffraction, electrochemical impedance spectroscopy, Fourier-transform infrared spectroscopy, and X-ray absorption near edge spectroscopy.

1. Introduction

Lithium-ion batteries (LIBs) have revolutionized the use of portable devices and impacted our daily life since their creation in 1991 by Sony Inc. [1,2]. LIBs carry much more energy (ca. 180 Wh/kg) at a voltage of 3.8 V (five times higher) compared with lead-acid batteries [3,4]. The lead-acid free, high energy density, and compact nature of LIBs have given them a tremendous edge over their predecessor. It is now almost impossible to imagine daily life without LIBs. LIBs are used in countless applications, including mobile phones, portable computers, electric vehicles, and energy storage system for harvesting [5,6,7], due to their specific power and power density [8]. Nowadays, most devices tend toward miniaturization for the sake of improved portability. Thus, high stability, capacity, and power have become significant factors for batteries, and cost is also an important issue. As a result, new materials for positive and negative electrodes that can resolve these compelling issues have been studied extensively by researchers [9,10].
One battery component, the cathode, is highly important because the amount of electrical energy stored in a battery is determined by the number of ions that balance the charge neutrality. Generally, the theoretical capacity of cathode materials is much lower than that of anode materials. The specific energy densities among cathode materials, such as LiCoO2 [11], LiMn2O4 [12], and LiMn1/3Ni1/3Co1/3O2, (ca. 200 mAhg−1) are limited by electrode chemistry, which is approximately a few tens of times lower than the theoretical capacity (4200 mAhg−1) of Si anode materials [13].
Batteries with LiCoO2 electrodes have limited applications that demand more power; thus, other potential cathode materials have been investigated [14,15]. The LiMn1/3Ni1/3Co1/3O2 (NMC) cathode was introduced by Ohzuku’s group in 2001 in a bulkbattery [3,16,17] at a high C-rate. In Li(Ni, Mn, Co)O2, it is assumed that the valence states of the transition metals are Ni2+, Mn4+, and Co3+ in the voltage range of 2.5–4.7 V, and two-electron transfer reactions result in Ni2+/4+ at 3.6–3.8 V and Co3+/4+ at 4.55–4.65 V [18]. The Li(Ni, Mn, Co)O2 composition yields fascinating cathode materials due to its diverse possibilities, such as changing the composition ratio for selection regarding different applications [19]. Specifically, there are many reports on reducing the Co ratio in the Li(Ni, Mn, Co)O2 composition to minimize drawbacks, such as the high cost and toxicity [20,21].
The continuous composition spread (CCS) method is often used to explore compositions with two or more different elements. The CCS method has the advantage of being able to grow thin films with several dozens of compositions at a time as compared with conventional solid-state synthesis [22,23,24]. Compositional variations on a substrate can be produced by varying the distance between targets and substrates. Finding new and promising compositions is a widely pursued research goal because of the overall effect of composition on the electrochemical performance of batteries.
In this study, we explored a wide range of composition gradients to achieve the best electrochemical performance by changing the ratio of Ni to Mn at a fixed 0.1 at.% of Co by using CCS sputtering with LiMn0.9Co0.1O2 and LiNi0.9Co0.1O2 targets in order to minimize drawbacks from the high cost and toxicity of cobalt. In addition, we studied the changes in material characteristics with different compositions and showed that a large amount of Ni yields a higher capacity whereas Mn is more important for long cyclability.

2. Experimental Methods

2.1. Material Preparation

Li(Mn0.9−xNixCo0.1)O2 thin films were deposited on substrates with layers of Pt/Ti/SiO2/Si (111) by using CCS sputtering from 4-in LiMn0.9Co0.1O2 and LiNi0.9Co0.1O2 targets. Substrates with an area of 1.0 × 1.5 cm2 were placed on the substrate holder then covered with a hard mask with a thickness of 2.2 cm. Thin films were then grown on the substrates, where the active material was defined through the hard mask with a 1.0 × 1.0 cm2 area. As shown in Figure S1, the thin film was rich in Mn content when the substrate was close to the LiMn0.9Co0.1O2 target and vice versa. The substrate positions were denoted as P1 to P9 with respect to the LiMn0.9Co0.1O2 target. The active material was deposited on substrates to check the electrochemical performance of a wide range of composition gradients by changing the ratio of Ni to Mn at a fixed 0.1 at.% of Co. After pre-sputtering for 10 min to remove contaminants from the target surfaces, all specimens were deposited at 1.0 × 10⁻³ Torr using different gas ratios of Ar to O2 (40:0, 30:10, and 20:20). These experiments were performed at a base pressure of less than 2 × 10⁻⁶ Torr. RF powers of 160 and 80 W were applied to the LiMn0.9Co0.1O2 and LiNi0.9Co0.1O2 targets, respectively.
To crystallize the active materials, all deposited substrates were annealed in a tube furnace at a heating rate of 5 °C/min to 600 °C for 3 h in an oxygen atmosphere with a flow rate of 500 mL/min. This annealing step allowed for sufficient crystallization of the active materials.

2.2. Characterization

The structural properties of the deposited and annealed thin films with Pt/Ti/SiO2/Si (111) layers at different gas ratios of Ar to O2 were investigated by X-ray diffraction (XRD, ATX-G, Rigaku, Spring, TX, USA) using Cu Kα radiation at room temperature (RT). Each XRD pattern was acquired over a 2θ range of 15° to 80° with a step size of 0.04°. The recorded XRD patterns were compared to the reference for layered composites (PDF#00-056-0147). The morphologies of the thin films were investigated using a field emission scanning electron microscope (SEM, FEI Nova NanoSEM, Hillsboro, OR, USA) operated at 10 kV with a working distance of ca. 5 mm. The thickness of the NMC layer of all samples was determined by using cross-sectional SEM images of the thin films. The charge/discharge performances of samples at three positions (P1, P5, and P9) were measured by a beaker cell using Li metal as the anode and 1 M solution of LiPF6 in a 1:1 vol.% mixture of ethylene carbonate (EC) and diethyl carbonate (DEC) as the electrolyte at a rate of 1.0 C on a battery test station (WBCS3000, WonATech, Seoul, Korea).
The surface morphologies before and after cycling were characterized using a commercial atomic force microscope (AFM, Park XE-100 AFM, Park Systems, Suwon, Korea) at RT in noncontact mode. The scanning area of the AFM measurement was 10 × 10 μm2, and the scan rate was 0.6 Hz. For imaging, the AC frequency was 300–320 kHz, and cantilevers (PPP-NCHR, force constant = 10–130 Nm−1, Nanosensors Inc., Lady’s Island, SC, USA) were used to scan the annealed thin films.
To compare the structural stability of the two samples with the highest (P4) and lowest (P9) discharge capacities, electrochemical impedance spectra (EIS) were collected on a Zahner Electrik IM6ex electrochemical analyzer (Zahner, Germany) in the frequency range of 1 mHz to 10 MHz with a voltage of 5 mV. The thin films were also analyzed in the 500–700 cm−1 range by Fourier transform infrared (FT-IR) spectroscopy (Frontier, PerkinElmer, Waltham, MA, USA).
In order to study the electronic states of the transition metals, X-ray absorption spectroscopy (XAS) experiments were carried out on the extended X-ray absorption fine structure (EXAFS) facility (PAL, Pohang, Korea) installed at beam line 7C at the Pohang Accelerator Laboratory, Korea. Cobalt (II) acetate tetrahydrate, cobalt (III) acetylacetonate, cobalt (II,III) oxide, manganese (II) oxide, manganese (III) oxide, lithium nickel (III) oxide, and nickel (II) oxide were analyzed as references.
The composition of the thin film with the highest capacity was determined by Rutherford backscattering spectroscopy (RBS, 6SDH2, NEC, Tokyo, Japan) using a 2.0 MeV He2+ ion beam impinging on the 5° tilted surface at a backscattering angle of 170°. To avoid confusion between the oxygen contents of the active material and substrate, as well as unwanted signals from Ti or Pt, the RBS measurement was performed on a thin film that was grown on a Si3N4/Si substrate after annealing at 600 °C, whereas the charge/discharge test was performed on a thin film grown on a Pt/Ti/SiO2/Si substrate. The RBS spectra were simulated using the well-known computer code RUMP [25].

3. Results and Discussion

Samples were deposited and measured to investigate thickness profiles according to the gas ratio of Ar to O2. Figure S2a shows cross-sectional SEM images of three samples (P1, P5, and P9) acquired to optimize the gas ratio of Ar to O2. Figure S2b shows the thickness profile of the binary system deposited with LiMn0.9Co0.1O2 and LiNi0.9Co0.1O2 by off-axis CCS sputtering after annealing at 600 °C. At a gas ratio of 40:0, the deposition rate was nearly 2 times higher than the rates at the other gas ratios (30:10 and 20:20). The surfaces of all deposited samples appear to be dense and smooth.
The results of electrochemical testing are shown in Figure S3. Charge/discharge tests of three samples, which were deposited at different gas ratios (Ar:O2 = 40:0, 30:10, and 20:20), were carried out at a 1.0 C-rate. The sample deposited at Ar:O2 = 40:0 has the best initial discharge capacity (36 μAh/cm2∙μm) among the samples grown at other gas ratios. The optimum gas ratio was determined with the cell results, as shown in Figure S3.
Figure S4 displays the XRD crystal structure patterns of all samples. Aside from a few unknown peaks, the samples seem to be well-defined and somewhat impurity-free single-phase crystals with a hexagonal NaFeO2 type structure and rhombohedral R3-m; space group [26,27,28]. The intensity ratio of the (003) and (104) peaks, which indicates cation mixing between Li+ and Ni2+ in the Li layer, decreases as Mn content increases. Small peaks from cobalt oxide, nickel oxide, and manganese oxide are observed at approximately 18°, 43°, and 55°, respectively, due to oxidation of the thin film surfaces [29]. Table S1 shows the lattice parameters of the samples, where the loss of lithium ions increases when the lattice parameter c is low and a is high [30,31].
Figure S5a shows SEM images of all samples P1 to P9 for the optimized gas ratios of Ar to O2. Figure S5b shows the thickness profile of the binary system deposited with LiMn0.9Co0.1O2 and LiNi0.9Co0.1O2 targets at a gas ratio of Ar:O2 = 40:0 by off-axis CCS sputtering and subsequent annealing at 600 °C. The thin films grown at positions near the LiMn0.9Co0.1O2 target are Mn-rich and thicker due to the higher deposition rate of the target than that of the Ni-rich thin films grown near the other target. In the SEM images of the samples, the thickness variation was 46 and 20 nm across the length and breadth respectively, which will contribute to an increase in surface area, but the increase will be insignificant (~1 millionth%). Hence, considering an active surface area of 1.0 × 1.0 cm2 is a good assumption.
The volumetric capacity was calculated as: capacity/volume = capacity/(area × thickness), where thickness was calculated at the center of the films. If we consider the thickness change due to a shadowing effect, the mean thickness variation (decrease) will be ~10 nm (1%–2%), which will marginally increase the volumetric capacity. Thus, reported volumetric capacities can be considered as lower bounds.
The samples were deposited under the same optimized conditions but were tested in different voltage ranges because it was found that the discharge capacity commonly increased at a high upper voltage [32]. The discharge capacities and voltage profiles of all samples are shown in Figure 1a,b, respectively. The discharge capacities for samples P1 to P6 are not remarkably different, but they sharply decrease for P7 to P9. Moreover, the voltage profiles in Figure 1b indicate that samples with plateaus at approximately 2.5 V, where the Mn4+/Mn3+ reaction occurs [33,34,35], have higher discharge capacities.
Following the decreasing trend, P9 has the lowest discharge capacity, and P4 has the highest capacity at the 1st cycle. It was found that the active material with moderate Ni and Mn contents has a superior electrochemical performance compared with that of the material with an extremely high Ni content. This can be ascribed to the Mn ions, which substantially reduce the irreversible side reactions between the electrode surface and electrolyte and improve the surface structural stability.
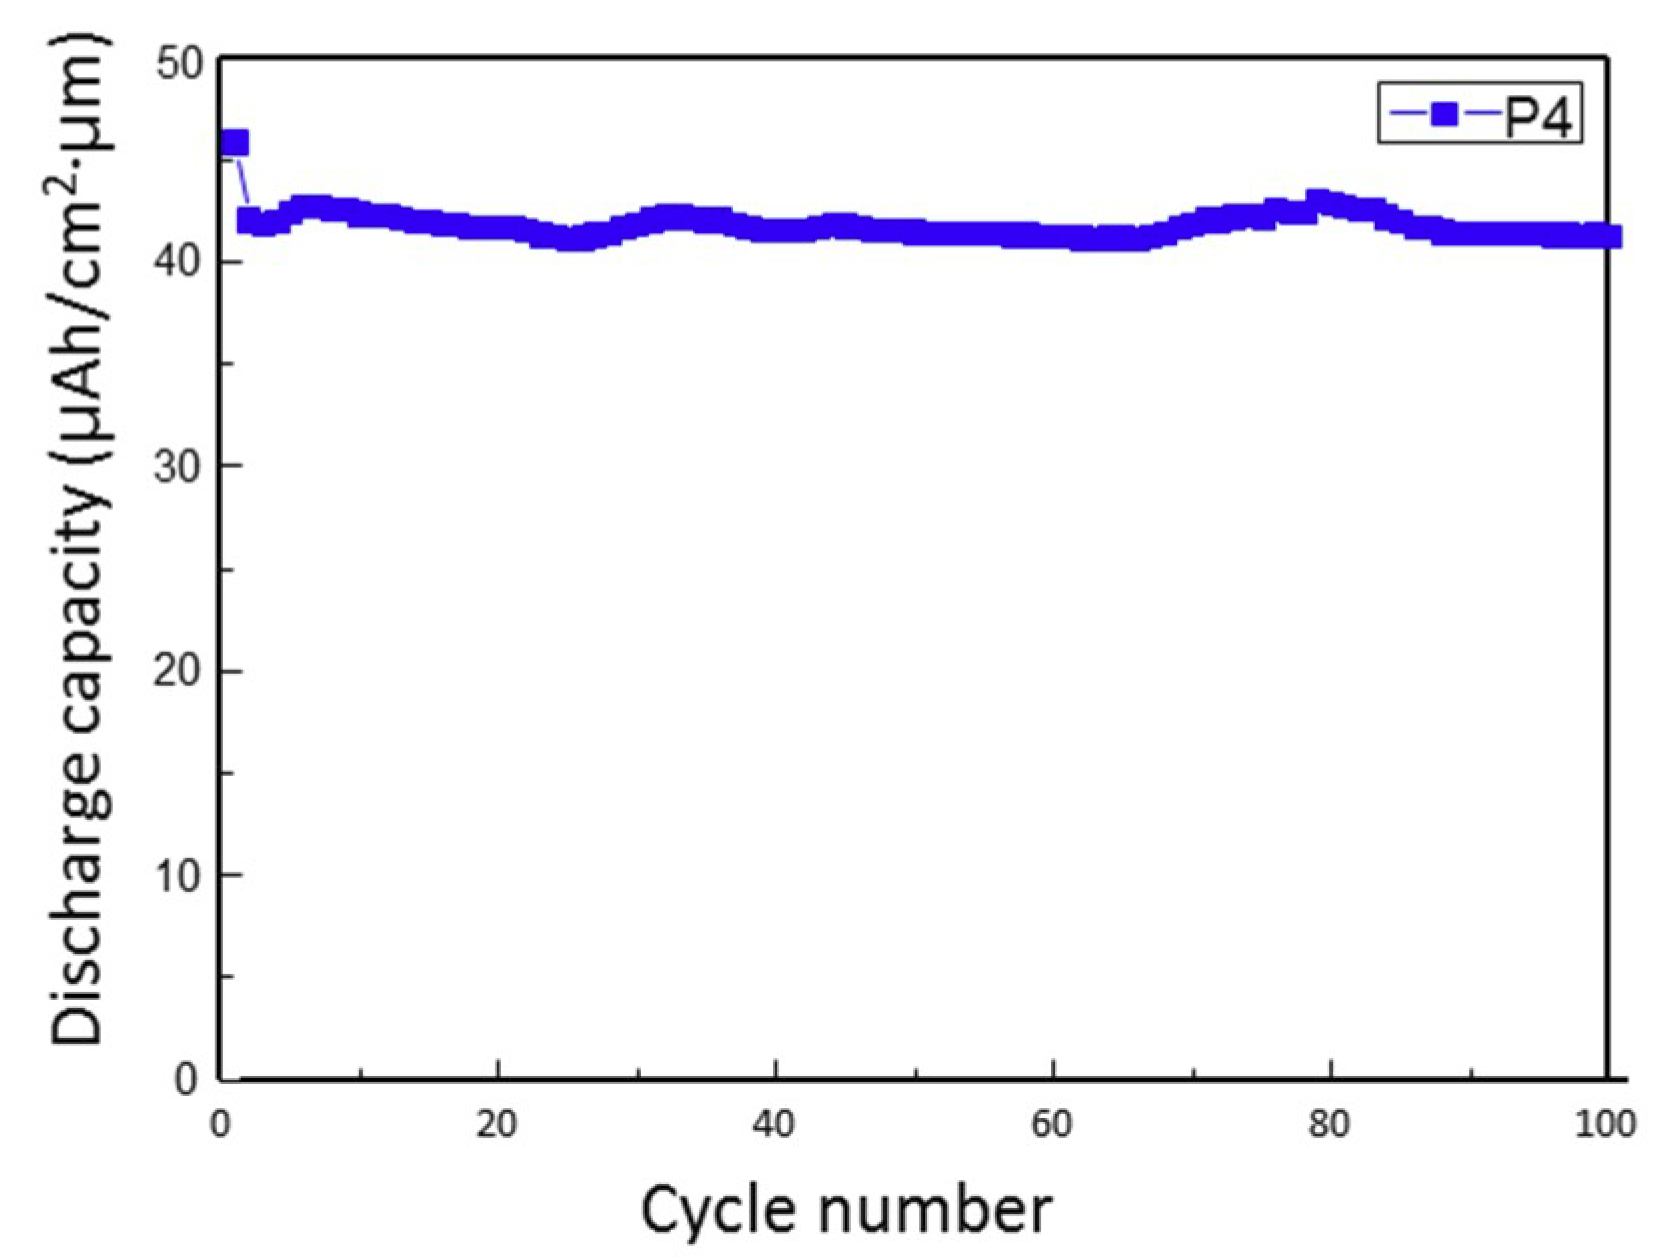
Figure 2a shows the results of the charge/discharge test of the best thin film (P4) in the voltage range from 2.2 to 4.7 V for the first five cycles. The irreversible capacity at the 1st cycle is ascribed to the fact that a few Ni3+ cannot be reduced to Ni2+ in the first cycle. These curves plateaued at three different voltages. The dQ/dV curves for the two samples at P4 and P9 in the 1st cycle are presented in Figure 2b. In the voltage range from 2.2 to 4.7 V, there is no peak for P9, which indicates that there was no redox reaction. On the other hand, three cathodic and anodic peaks existed for P4. The cathodic peaks at 4.66, 4.30, and 3.39 V indicate Co4+/Co3+, Ni4+/Ni3+/Ni2+, and Mn4+/Mn3+ reactions, respectively [18]. These three cathodic peaks match the plateaued voltages shown in Figure 2a. The dramatically different discharge capacities between P4 and P9 are attributed to these oxidation and reduction processes, which correspond to lithium ion extraction and insertion. Figure 3 shows the cycling performance of P4. The retention from the 1st cycle to the 100th cycle is 90.00%, showing its good stability.
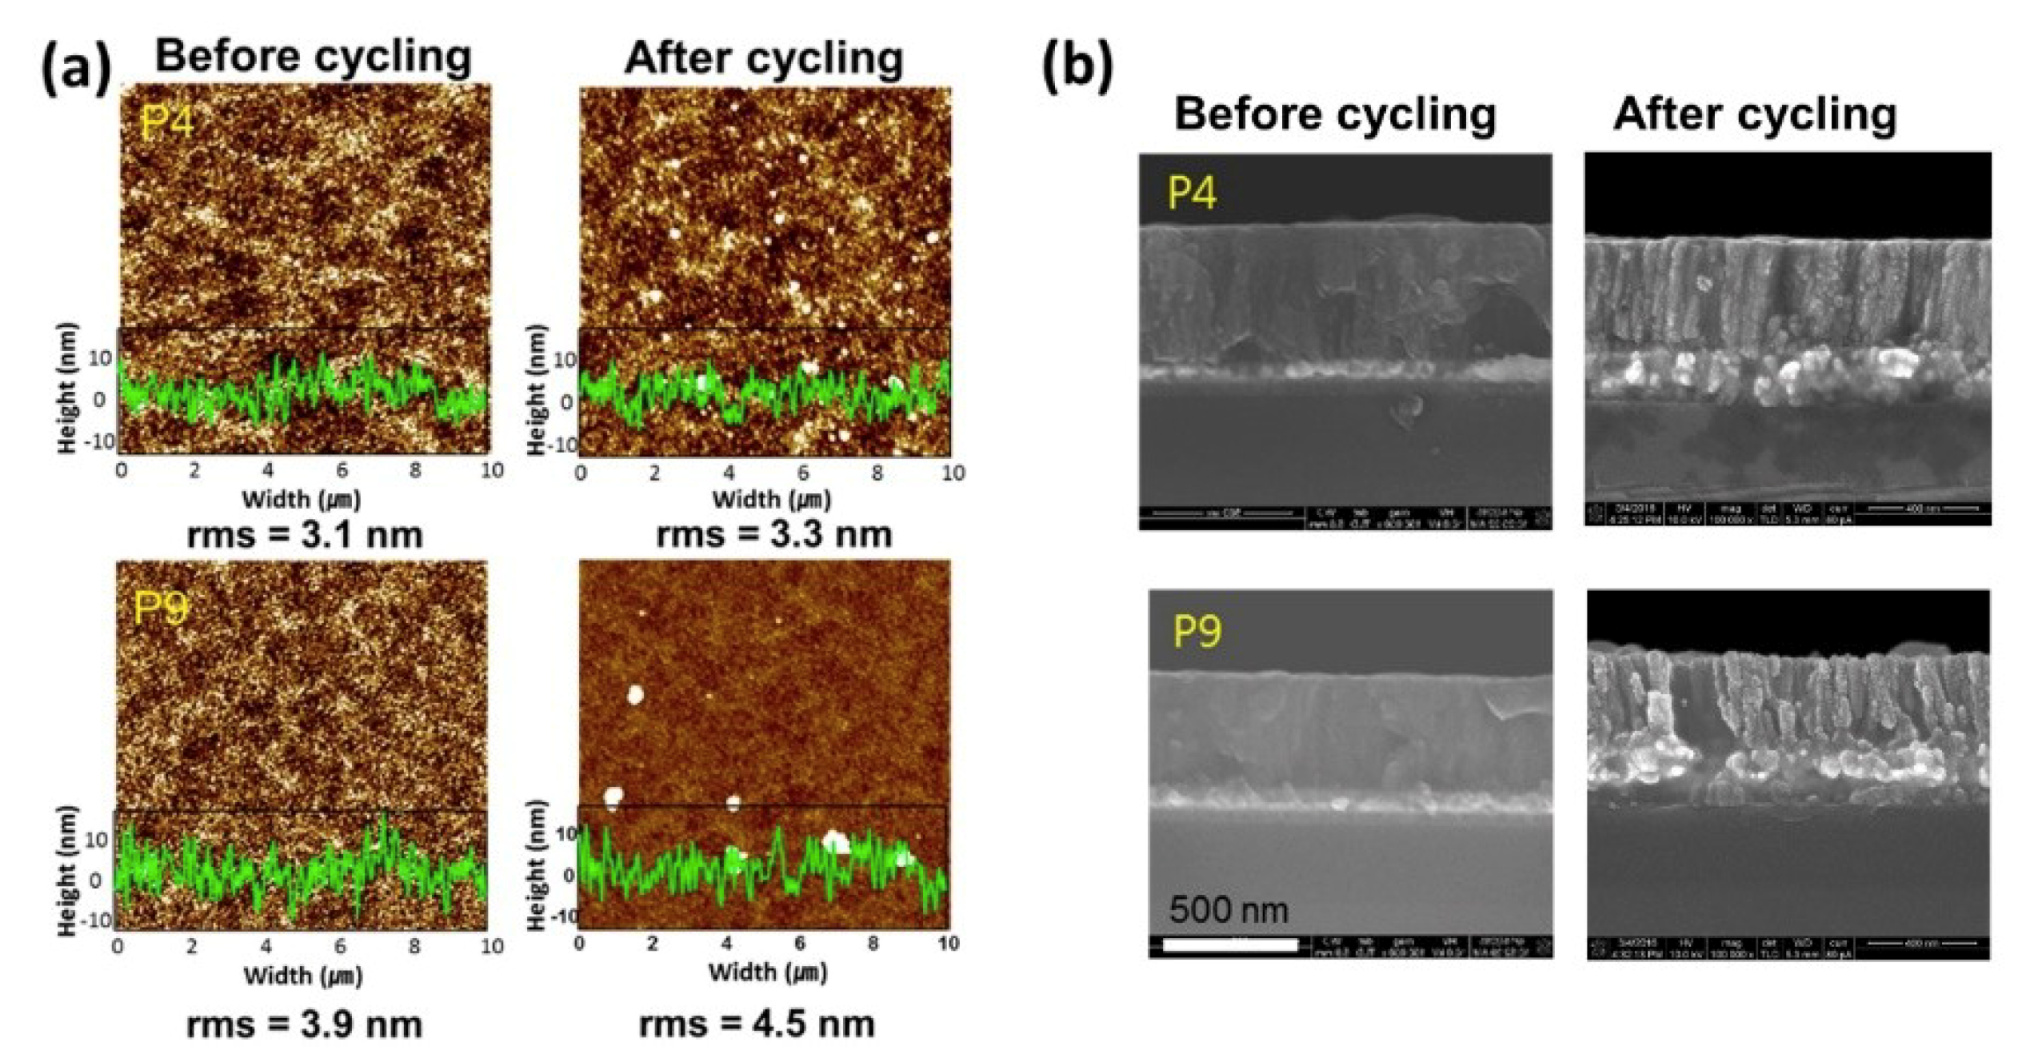
AFM measurements were performed on the annealed films (P1–P9) before cycling (Figure S6). Figure 4a shows the AFM topological surface images of P4 and P9/Pt (100 nm)/Ti (50 nm)/SiO2 (300 nm)/Si (111) surfaces before and after cycling. The scanning area of the AFM measurement was 10 × 10 μm2. The P4 and P9 thin films before and after cycling each have similar RMS values, respectively. Even after cycling, the topological surfaces of the thin films did not change. These films presented very smooth surfaces, which indicate a uniform layer of active material achieved by means of CCS sputtering. Figure 4b shows the cross-sectional SEM images of P4 and P9 before and after cycling. These results demonstrate the good mechanical integrity of the thin films after cycling.
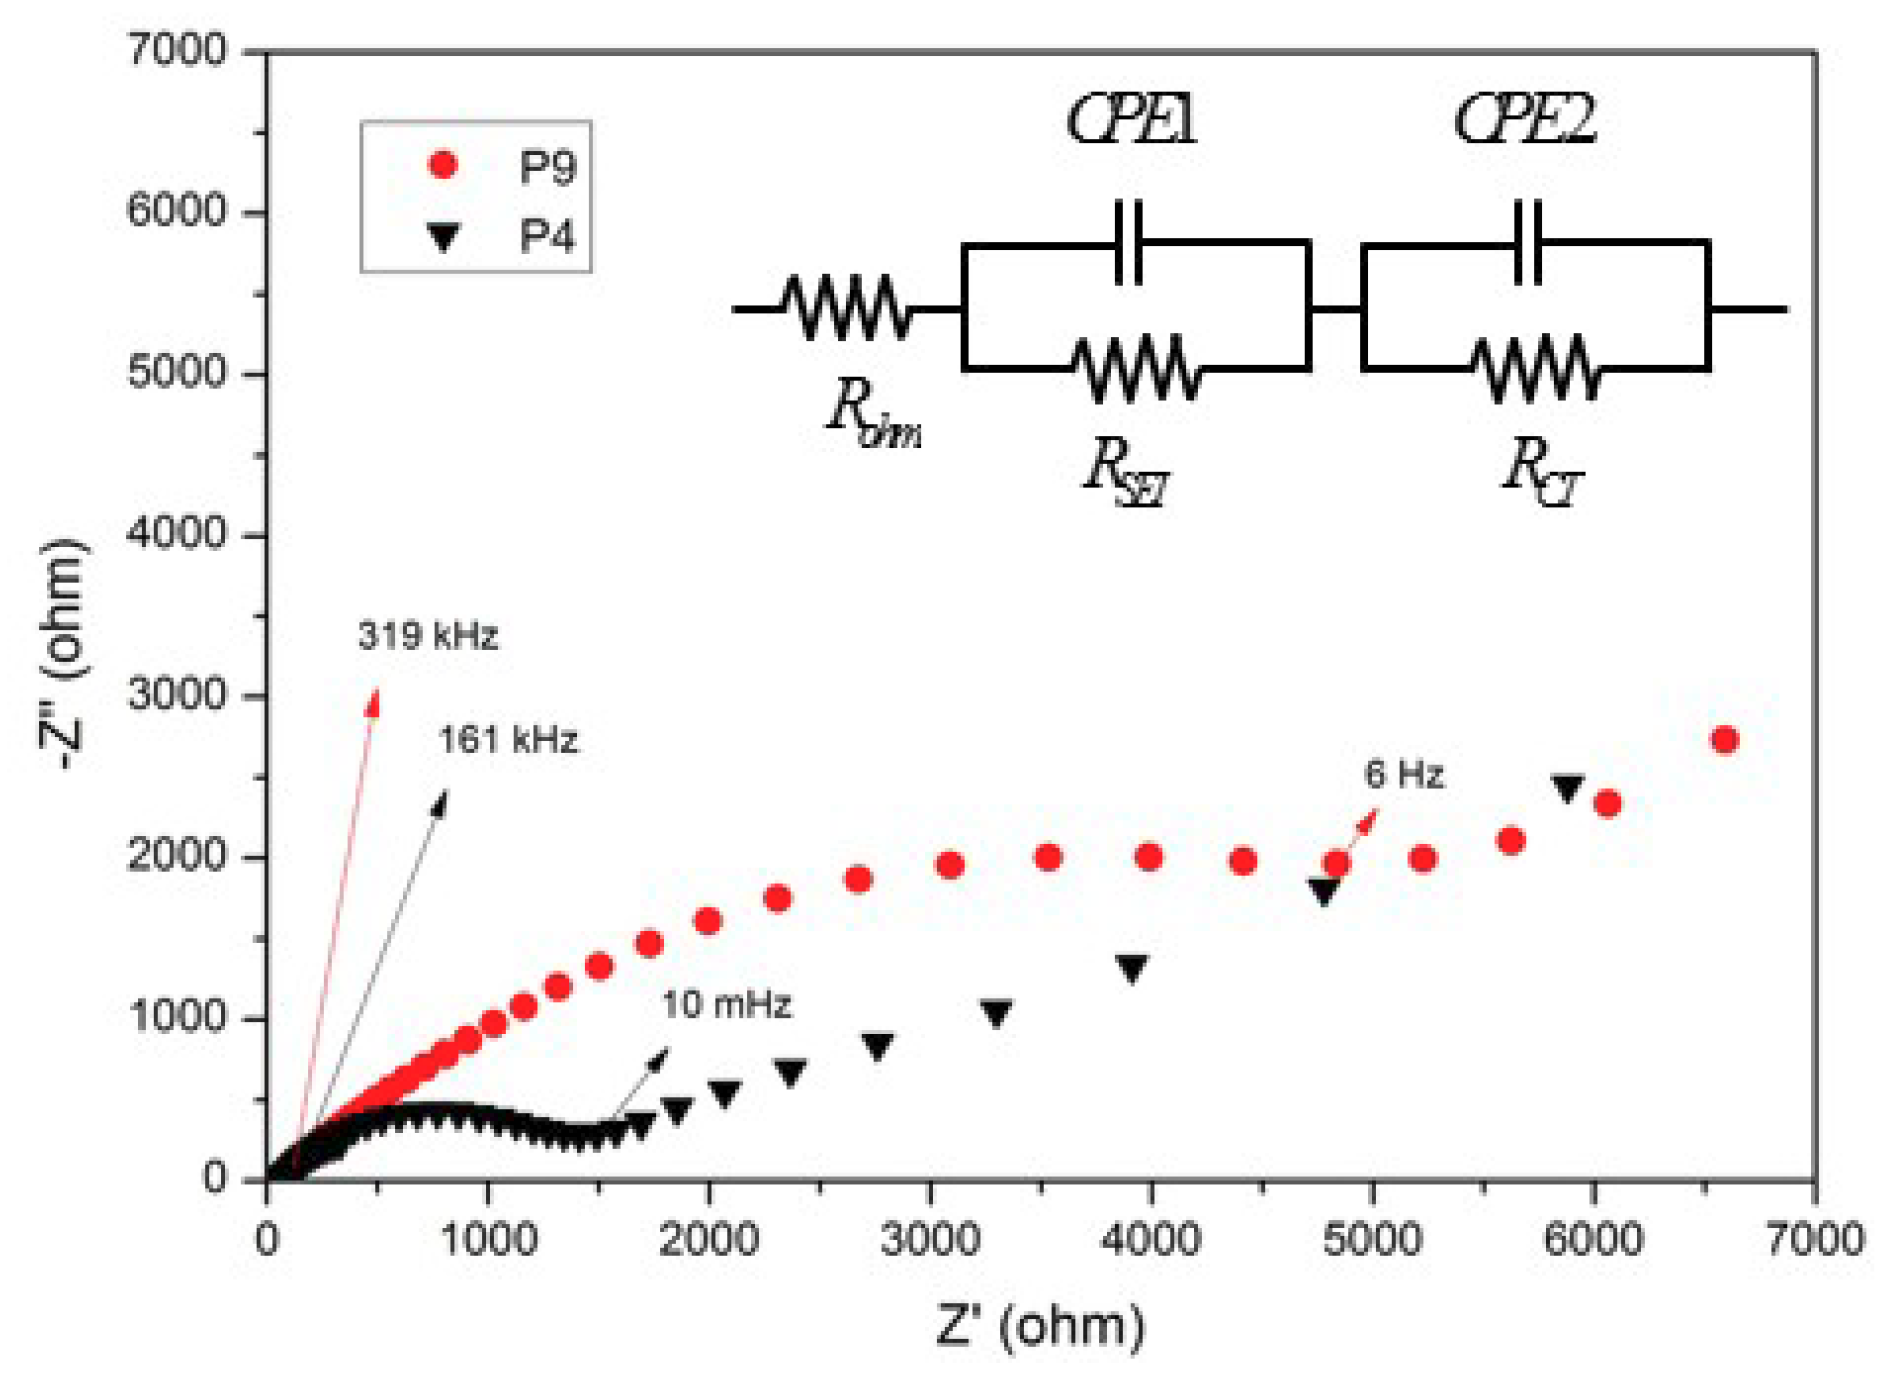
Figure 5 compares the EIS spectra of the samples with the highest (P4) and lowest (P9) capacities. The impedance plots show a high-frequency intercept at the Zre-axis and two broad depressed semicircles. The high-frequency intercept occurs due to Ohmic resistance (ohm). The first high-frequency arc has been ascribed to Li+ migration through the interface between the surface layer of material particles and electrolyte. The second, medium-frequency arc has been ascribed to the charge transfer process. The total resistance of P9 was much larger than that of P4, which was correlated with the poor electrochemical performance of P9.
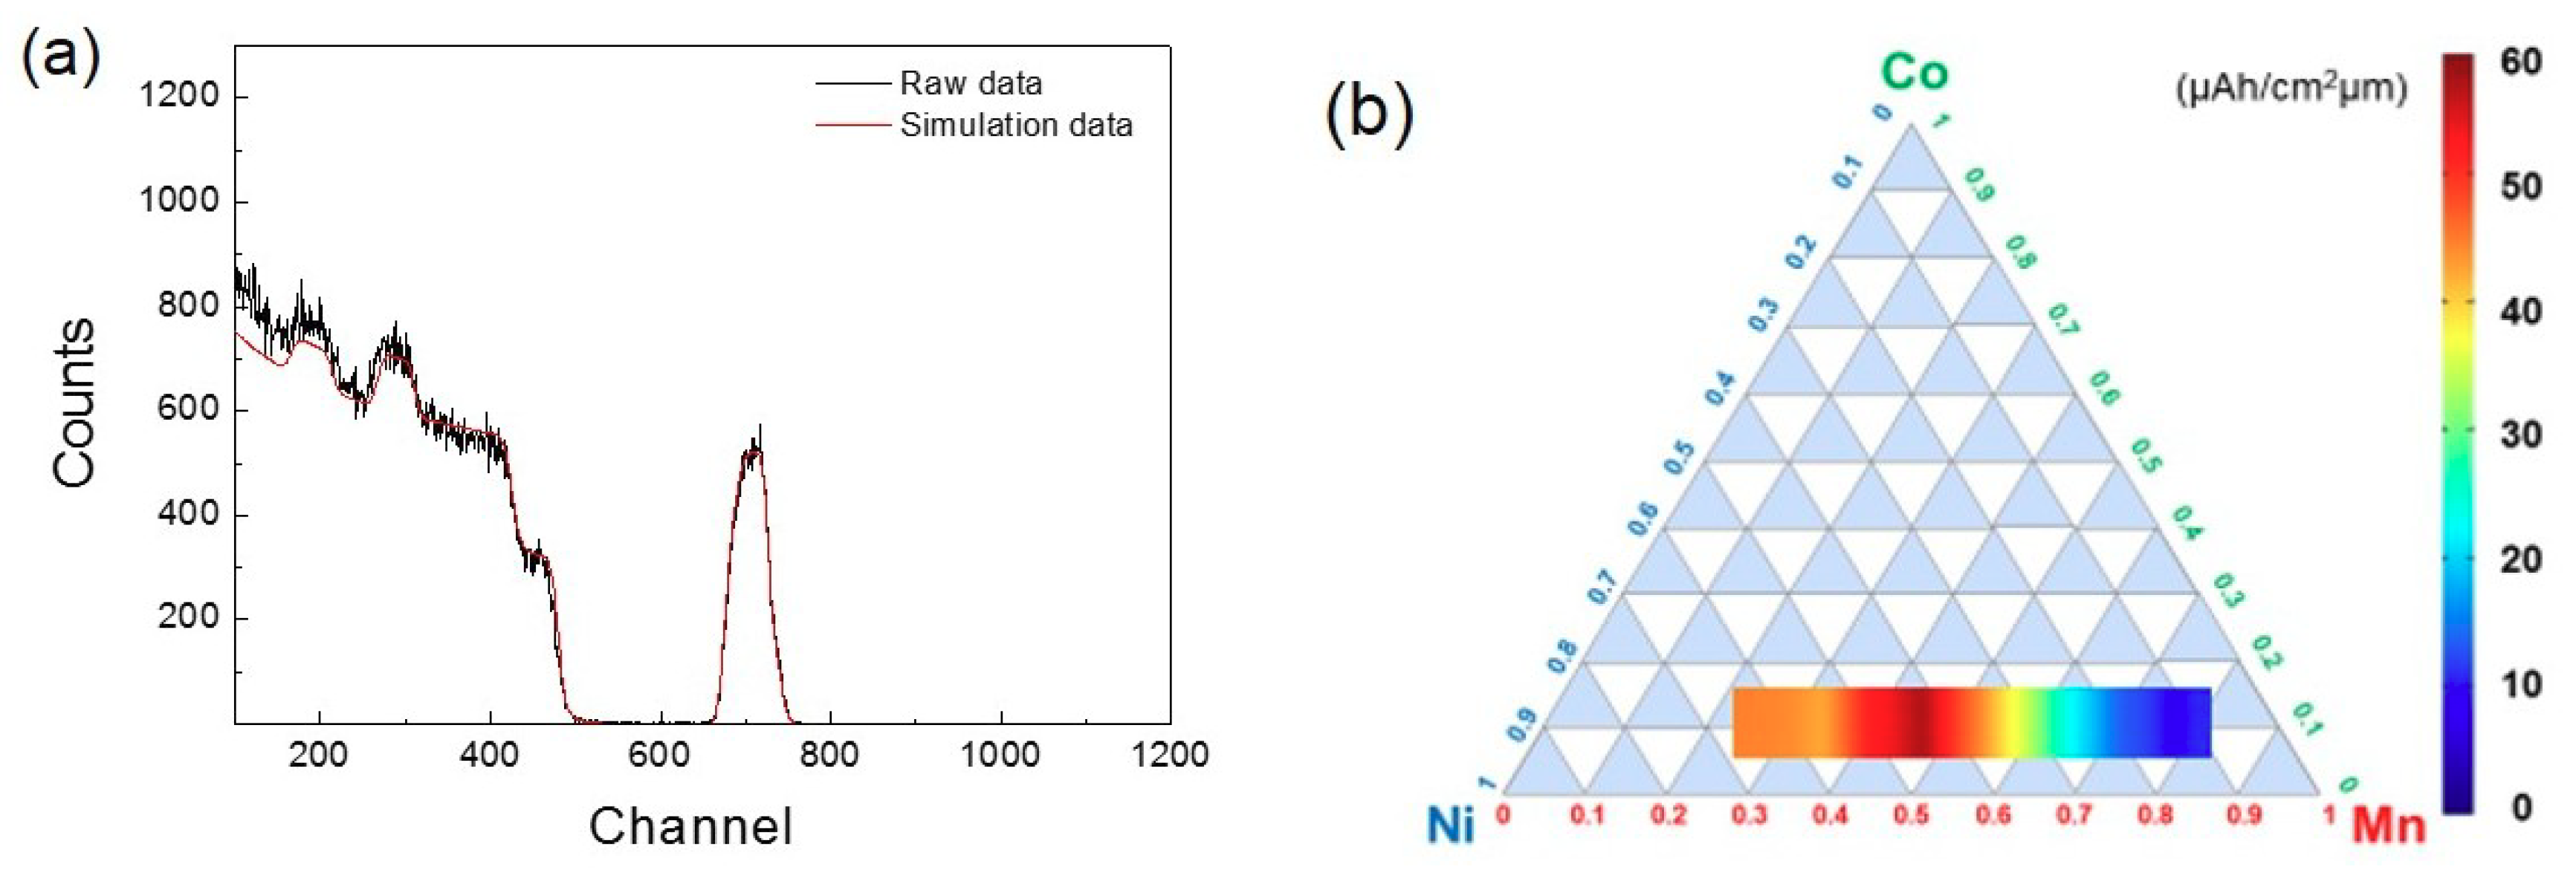
The depressed semicircles in the high- and low-frequency regions are related to the formation of an active material surface layer and the intercalation/deintercalation of lithium ions into/from the electrodes. An equivalent circuit was used to fit the spectra and is shown in the inset of Figure 5. The parameter RSEI and constant phase element of the solid electrolyte interface (SEI) film (CPE1) correspond to the surface layer resistance and capacitance, respectively, whereas Rct and the constant phase element of the electrode/electrolyte interface (CPE2) correspond to the lithium ion intercalation/deintercalation process and interfacial capacitance, respectively [35]. The calculated Rct for P4 and P9 are 1.8 and 9.9 kΩ, respectively. The lowest capacity of P9 is attributed to this large charge transfer resistance. RBS measurements show that the P9 sample (LiNi0.6Mn0.3Co0.1O2) has a higher Ni and lower Mn concentration than those of the P4 sample (Ni:Mn:Co = 19:71:10). The higher Ni and lower Mn contents in P9 are likely responsible for its much higher impedance than that of P4.
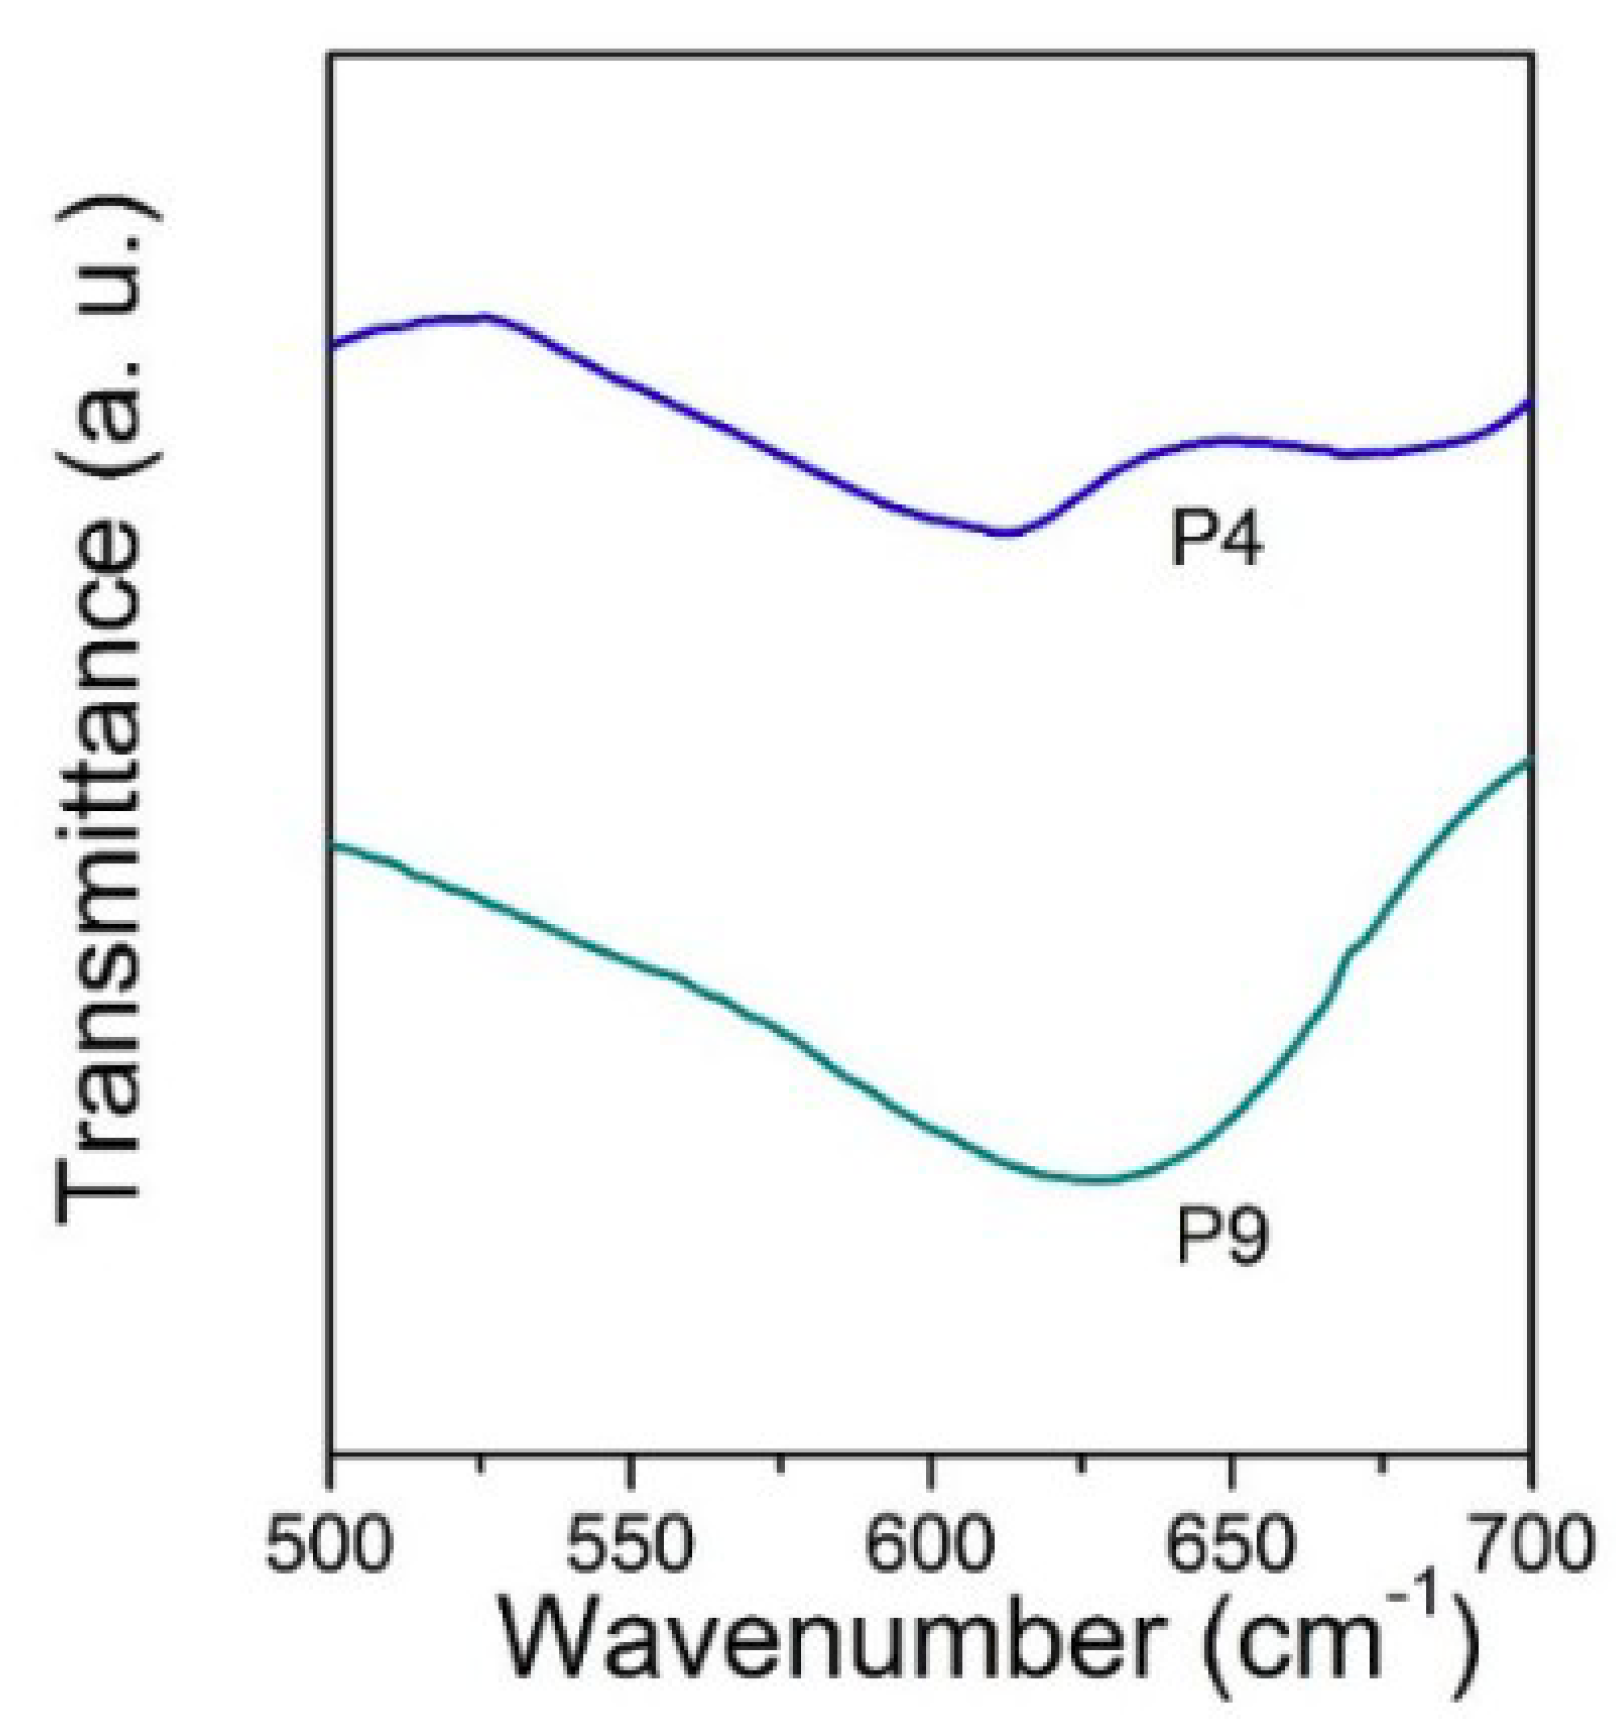
To elucidate the reasons for the improved performance of the P4 thin film despite the P9 thin film having a higher Ni content, FT-IR measurements were carried out in the 500–700 cm−1 range, where O-M-O layers can be detected. The FT-IR transmittance spectra of the discharged films are presented in Figure 6. The FT-IR spectrum of P4 shows two distinct peaks at 612 and 669 cm−1, whereas the spectrum of P9 has broader peaks at lower wavenumbers. The broadening of the FT-IR peaks may be due to cation mixing in the crystal layers, a change in the average oxidation states of transition metals, or a random distribution of Li+ ions in the interlayer space [36,37,38]. This can be interpreted as an increase in MO6 distortion. These results thus show that the structure of P4 is more stable than that of P9.
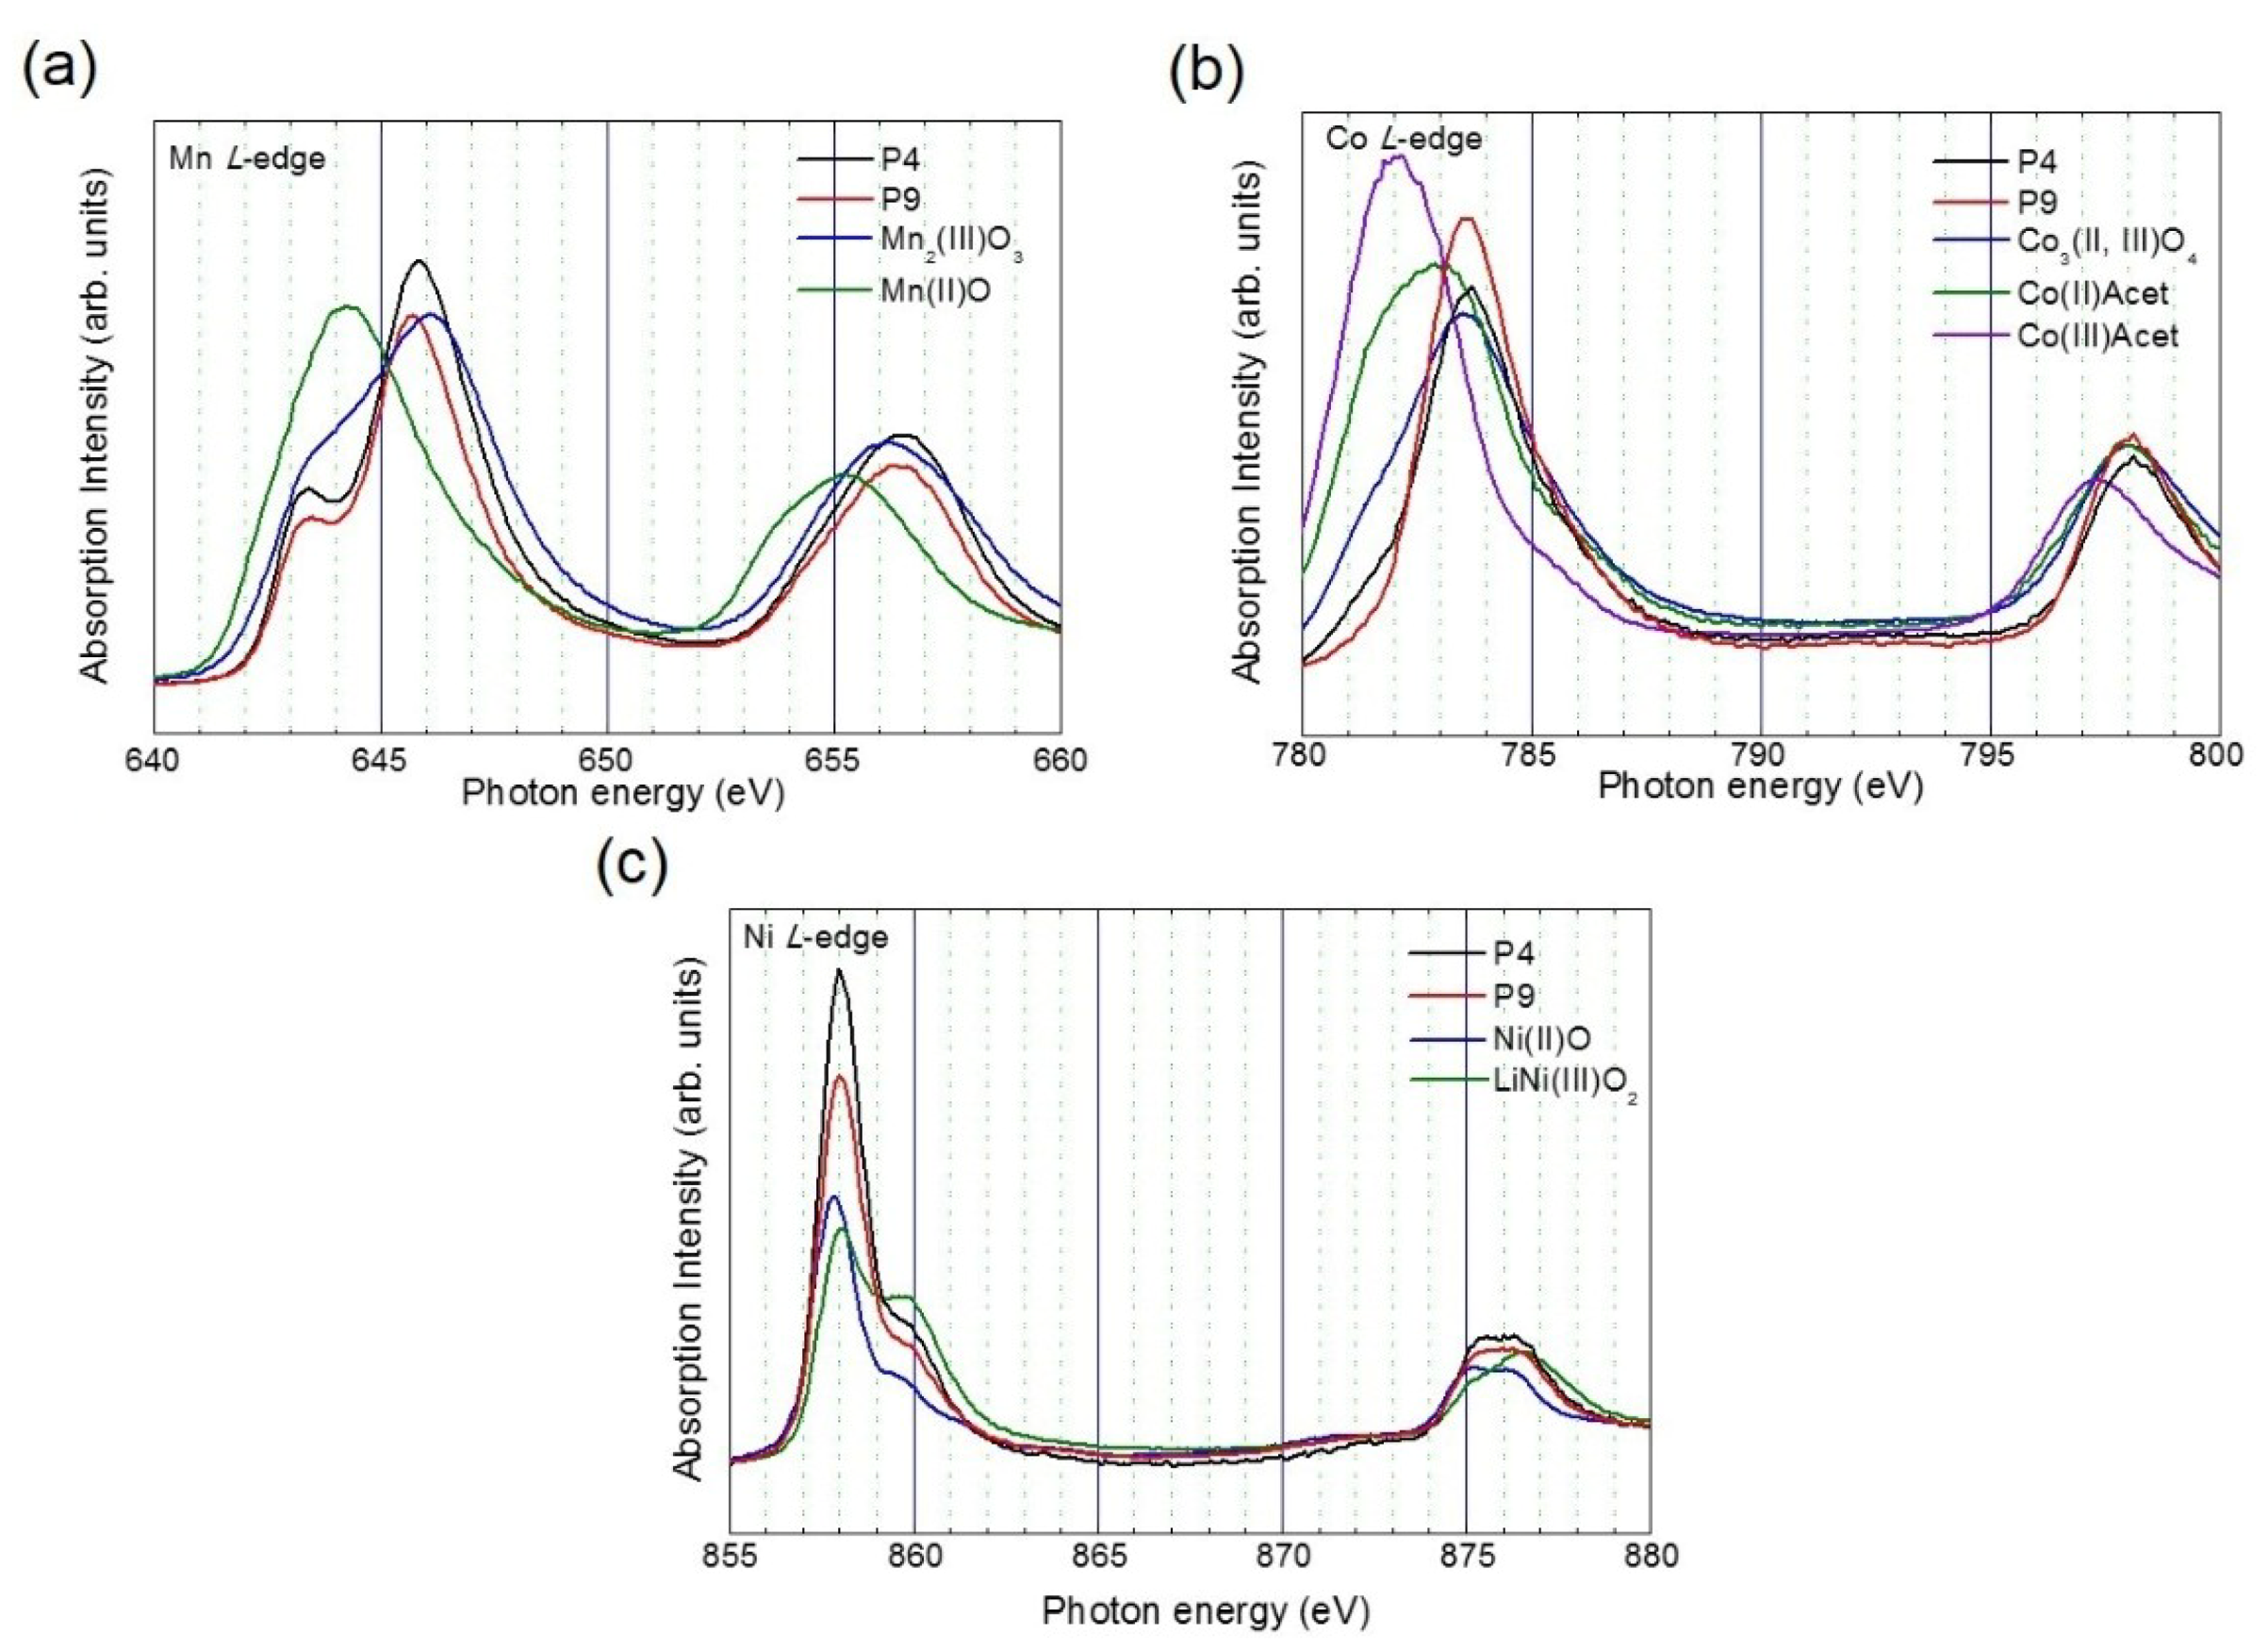
Figure 7 shows the Ni, Co, and Mn L-edge XANES spectra of P4 and P9 with the highest and lowest discharge capacities, respectively. According to the Co and Ni L-edge spectra, the oxidation states of cobalt and nickel in the two thin films are identical. However, in the Mn L-edge spectra, the oxidation number of Mn in P4 is close to Mn(III), whereas in P9 it is close to Mn(II) [38]. Lithium manganese oxide has an inherent drawback in its unexpected phase transition from cubic spinel to tetragonal, which results from the known Jahn–Teller distortions [39]. The average valence state of Mn can be increased if a voltage of >3.54 V is applied, which leads to suppression of the Jahn–Teller distortion effect [40]. This result may indicate that the P4 thin film is electrochemically superior to the P9 thin film.
RBS analysis is a powerful tool for determining compositions of unknown samples; it is a completely quantitative and non-destructive technique that does not require standards like other measurements. A target was bombarded with He2+ ions at MeV-energy (typically 1.6–3 MeV), and the energy of the backscattered projectiles at backscattering angles of ~170° was recorded with a solid-state Si detector. Data were fitted by computer simulation using the RUMP code, and the uncertainty in the RBS measurements is ~1%–5% [39,40,41]. The composition of P4 was characterized by RBS, and the results are shown in Figure 8a. As shown in the compositional diagram in Figure 8b, the thin film deposited at P4 has the highest discharge capacity. It was found that the molar ratios of elements in the P4 thin film are Ni:Mn:Co = 19:71:10.

4. Conclusions

In conclusion, we studied new and promising LIB electrode material compositions by means of CCS sputtering. The thin film with the highest capacity (Ni:Mn:Co = 19:71:10) is composed of well-defined and impurity-free single-phase crystals, and its surface is dense and smooth. Its electrochemical performance is much better that that of NMC materials containing harmonious compositions of Ni and Mn. The reasons for this improvement include a higher structural stability, transitional metal redox reactions during charge and discharge processes, and suppression of Jahn–Teller distortion effects. Therefore, the thin film with a composition of Ni:Mn:Co = 19:71:10 has the highest discharge capacity despite having less Ni content than that of a commercial cathode material (LiMn1/3Ni1/3Co1/3O2). As we now roughly know the optimized Mn/Ni ratio based on nine compositions, we will further explore it in detail in future work.

Supplementary Materials

The following are available online at https://www.mdpi.com/2079-6412/9/6/366/s1, Figure S1: Schematic diagram of CCS-sputtering, Figure S2: (a) SEM images and (b) thickness profile of thin films deposited at different gas ratios (Ar:O2 = 40:0, 30:10, and 20:20), Figure S3: Charge/discharge tests of thin films grown at the gas ratios (Ar:O2 = 40:0, 30:10, 20:20), Figure S4: XRD patterns of thin films deposited at the optimized gas ratio (Ar:O2 = 40:0) grown at different positions and were subsequently annealed at 600 °C in O2 atmosphere, Figure S5: (a) SEM images and (b) thickness profile of thin films deposited at the optimized gas ratio of Ar to O2 (40:0), Figure S6: AFM top-view morphology of thin films (P1–P9) after annealing, Table S1: Comparison of lattice parameters of samples from P1 to P9.

Author Contributions

Methodology, J.-W.C.; Investigation, J.J. and H.Y.; Writing—Original Draft Preparation, J.J.; Writing—Review and Editing, N.S.P. and J.S.L.; Project Administration, J.-W.C.; Funding Acquisition, J.-W.C.

Funding

This research was supported by the KIST Future Resource Program (2E29400), and the Brain Korea 21 Plus Project.

Conflicts of Interest

The authors declare no conflict of interest.

References

  1. Nagaura, T.; Tozawa, K. Lithium ion rechargeable battery. Prog. Batt. Solar Cells 1990, 9, 209–212. [Google Scholar]
  2. Yoshino, A.; Sanechika, K.; Nakajima, T. Secondary Battery. US Patent 4668595A, 26 May 1987. [Google Scholar]
  3. Armand, M.; Tarascon, J.M. Building better batteries. Nature 2008, 451, 652–657. [Google Scholar] [CrossRef] [PubMed]
  4. Van Noorden, R. The rechargeable revolution: A better battery. Nature 2014, 507, 26–28. [Google Scholar] [CrossRef] [PubMed] [Green Version]
  5. Kang, B.; Ceder, G. Battery materials for ultrafast charging and discharging. Nature 2009, 458, 190–193. [Google Scholar] [CrossRef] [PubMed]
  6. Gur, I.; Sawyer, K.; Prasher, R. Searching for a better thermal battery. Science 2012, 335, 1454–1455. [Google Scholar] [CrossRef] [PubMed]
  7. Kim, J.; Kim, H.; Kang, K. Surface-modified spinel LiNi0.5Mn1.5O4 for Li-ion batteries. J. Korean Ceram. Soc. 2018, 55, 21–35. [Google Scholar] [CrossRef]
  8. Choi, M.; Lee, S.-H.; Jung, Y.-I.; Choi, W.-K.; Moon, J.-K.; Choi, J.; Seo, B.-K.; Kim, S.B. The preparation of Fe3O4 thin film and its electrochemical characterization for Li-ion battery. Transit. Electr. Electron. Mater. 2018, 19, 417–422. [Google Scholar] [CrossRef]
  9. Mizushima, K.; Jones, P.C.; Wiseman, P.J.; Goodenough, J.B. LixCoO2 (0<x≤1): A new cathode material for batteries of high energy density. Solid State Ionics 1981, 3–4, 171–174. [Google Scholar] [CrossRef]
  10. Bruce, P.G.; Armstrong, A.R.; Gitzendanner, R.L. New intercalation compounds for lithium batteries: Layered LiMnO2. J. Mater. Chem. 1999, 9, 193–198. [Google Scholar] [CrossRef]
  11. Ramadass, P.; Haran, B.; White, R.; Popov, B.N. Performance study of commercial LiCoO2 and spinel-based Li-ion cells. J. Power Sources 2002, 111, 210–220. [Google Scholar] [CrossRef]
  12. Aurbach, D.; Gamolsky, K.; Markovsky, B.; Salitra, G.; Gofer, Y.; Heider, U.; Oesten, R.; Schmidt, M. The study of surface phenomena related to electrochemical lithium intercalation into LixMOy host materials (M = Ni, Mn). J. Electrochem. Soc. 2000, 147, 1322–1331. [Google Scholar] [CrossRef]
  13. Shaju, K.M.; Rao, G.V.S.; Chowdari, B.V.R. Performance of layered Li(Ni1/3Co1/3Mn1/3)O2 as cathode for Li-ion batteries. Electrochim. Acta 2002, 48, 145–151. [Google Scholar] [CrossRef]
  14. Li, Z.H.; Zhang, D.M.; Yang, F.X. Developments of lithium-ion batteries and challenges of LiFePO4 as one promising cathode material. J. Mater. Sci. 2009, 44, 2435–2443. [Google Scholar] [CrossRef]
  15. Li, W.; Currie, J.C. Morphology effects on the electrochemical performance of LiNi1−xCoxO2. J. Electrochem. Soc. 1997, 144, 2773–2779. [Google Scholar] [CrossRef]
  16. Goodenough, J.B.; Park, K.S. The Li-ion rechargeable battery: A perspective. J. Am. Chem. Soc. 2013, 135, 1167–1176. [Google Scholar] [CrossRef] [PubMed]
  17. Ohzuku, T.; Makimura, Y. Layered lithium insertion material of LiCo1/3Ni1/3Mn1/3O2 for lithium-ion batteries. Chem. Lett. 2001, 30, 642–643. [Google Scholar] [CrossRef]
  18. Tarascon, J.M.; Armand, M. Issues and challenges facing rechargeable lithium batteries. Nature 2001, 414, 359–367. [Google Scholar] [CrossRef]
  19. Lee, J.J.; Ha, J.Y.; Choi, W.K.; Cho, Y.S.; Choi, J.W. Doped SnO2 transparent conductive multilayer thin films explored by continuous composition spread. ACS Comb. Sci. 2015, 17, 247–252. [Google Scholar] [CrossRef]
  20. Chen, Y.; Wang, G.X.; Konstantinov, K.; Liu, H.K.; Dou, S.X. Synthesis and characterization of LiCoxMnyNi1−xyO2 as a cathode material for secondary lithium batteries. J. Power Sources 2003, 119, 184–188. [Google Scholar] [CrossRef]
  21. Mohammadi, F. Design and electrification of an electric vehicle using lithium-ion batteries. In Proceedings of the 3rd International Conference on Electrical Engineering, Zurich, Switzerland, 2–3 January 2018; pp. 1–13. [Google Scholar]
  22. Yue, B.; Wang, X.; Wang, J.; Yao, J.; Zhao, X.; Zhang, H.; Yu, W.; Liu, G.; Dong, X. Au-doped Li1.2Ni0.7Co0.1Mn0.2O2 electrospun nanofibers: Synthesis and enhanced capacity retention performance for lithium-ion batteries. RSC Adv. 2018, 8, 4112–4118. [Google Scholar] [CrossRef]
  23. Kang, H.M.; Baek, S.H.; Song, J.H.; Cho, Y.S.; Choi, J.W. Full range dielectric characteristics of calcium copper titanate thin films prepared by continuous composition-spread sputtering. ACS Comb. Sci. 2014, 16, 478–484. [Google Scholar] [CrossRef] [PubMed]
  24. Borhani-Haghighi, S.; Kieschnick, M.; Motemani, Y.; Savan, A.; Rogalla, D.; Becker, H.W.; Meijer, J.; Ludwig, A. High-throughput compositional and structural evaluation of a Lia(NixMnyCoz)Or thin film battery materials library. ACS Comb. Sci. 2013, 15, 401–409. [Google Scholar] [CrossRef] [PubMed]
  25. Nam, K.W.; Yoon, W.S.; Yang, X.Q. Structural changes and thermal stability of charged LiNi1/3Co1/3Mn1/3O2 cathode material for Li-ion batteries studied by time-resolved XRD. J. Power Sources 2009, 189, 515–518. [Google Scholar] [CrossRef]
  26. Doolittle, L.R. A semiautomatic algorithm for rutherford backscattering analysis. Nucl. Instrum. Methods Phys. Res. Sect. B 1986, 15, 227–231. [Google Scholar] [CrossRef]
  27. Garcia, B.; Barboux, P.; Ribot, F.; Kahn-Harari, A.; Mazerolles, L.; Baffier, N. The structure of low temperature crystallized LiCoO2. Solid State Ionics 1995, 80, 111–118. [Google Scholar] [CrossRef]
  28. Cho, Y.H.; Jang, D.; Yoon, J.; Kim, H.; Ahn, T.K.; Nam, K.W.; Sung, Y.E.; Kim, W.S.; Lee, Y.S.; Yang, X.Q.; et al. Thermal stability of charged LiNi0.5Co0.2Mn0.3O2 cathode for Li-ion batteries investigated by synchrotron based in situ X-ray diffraction. J. Alloy. Compd. 2013, 562, 219–223. [Google Scholar] [CrossRef]
  29. Sun, H.H.; Choi, W.; Lee, J.K.; Oh, I.H.; Jung, H.G. Control of Electrochemical properties of nickel-rich layered cathode materials for lithium ion batteries by variation of the manganese to cobalt ratio. J. Power Sources 2015, 275, 877–883. [Google Scholar] [CrossRef]
  30. Buchberger, I.; Seidlmayer, S.; Pokharel, A.; Piana, M.; Hattendorff, J.; Kudejova, P.; Gilles, R.; Gasteiger, H.A. Aging analysis of graphite/LiNi1/3Mn1/3Co1/3O2 cells using XRD, PGAA, and AC impedance. J. Electrochem. Soc. 2015, 162, A2737–A2746. [Google Scholar] [CrossRef]
  31. Sa, Q.; Heelan, J.A.; Lu, Y.; Apelian, D.; Wang, Y. Copper impurity effects on LiNi1/3Mn1/3Co1/3O2 cathode material. ACS Appl. Mater. Interfaces 2015, 7, 20585–20590. [Google Scholar] [CrossRef] [PubMed]
  32. Ates, M.N.; Mukerjee, S.; Abraham, K.M. A high rate Li-rich layered MNC cathode material for lithium-ion batteries. RSC Adv. 2015, 5, 27375–27386. [Google Scholar] [CrossRef]
  33. Gu, M.; Li, Y.; Li, X.L.; Hu, S.Y.; Zhang, X.W.; Xu, W.; Thevuthasan, S.; Baer, D.R.; Zhang, J.G.; Liu, J.; et al. In situ TEM study of lithiation behavior of silicon nanoparticles attached to and embedded in a carbon matrix. ACS Nano 2012, 6, 8439–8447. [Google Scholar] [CrossRef] [PubMed]
  34. Yan, B.G.; Liu, J.C.; Song, B.H.; Xiao, P.F.; Lu, L. Li-rich thin film cathode prepared by pulsed laser deposition. Sci. Rep. 2013, 3, 3332. [Google Scholar] [CrossRef] [PubMed]
  35. Liang, L.W.; Du, K.; Lu, W.; Peng, Z.D.; Cao, Y.B.; Hu, G.R. Synthesis and Characterization of concentration–gradient LiNi0.6Co0.2Mn0.2O2 cathode material for lithium ion batteries. J. Alloy. Compd. 2014, 613, 296–305. [Google Scholar] [CrossRef]
  36. Nithya, C.; Kumari, V.S.S.; Gopukumar, S. Synthesis of high voltage (4.9 V) cycling LiNixCoyMn1−xyO2 cathode materials for lithium rechargeable batteries. Phys. Chem. Chem. Phys. 2011, 13, 6125–6132. [Google Scholar] [CrossRef] [PubMed]
  37. Julien, C.; Massot, M. Spectroscopic studies of the local structure in positive electrodes for lithium batteries. Phys. Chem. Chem. Phys. 2002, 4, 4226–4235. [Google Scholar] [CrossRef]
  38. Hashem, A.M.; El-Taweel, R.S.; Abuzeid, H.M.; Abdel-Ghany, A.E.; Eid, A.E.; Groult, H.; Mauger, A.; Julien, C.M. Structural and electrochemical properties of LiNi1/3Co1/3Mn1/3O2 material prepared by a two-step synthesis via oxalate precursor. Ionics 2012, 18, 1–9. [Google Scholar] [CrossRef]
  39. Kobayashi, H.; Shikano, M.; Koike, S.; Sakaebe, H.; Tatsumi, K. Investigation of positive electrodes after cycle testing of high-power Li-ion battery cells: I. An approach to the power fading mechanism using XANES. J. Power Sources 2007, 174, 380–386. [Google Scholar] [CrossRef]
  40. Shin, D.W.; Choi, J.W.; Cho, Y.S.; Yoon, S.J. Phase evolution and Sn-substitution in LiMn2O4 thin films prepared by pulsed laser deposition. J. Electroceram. 2009, 23, 200–205. [Google Scholar] [CrossRef]
  41. Yim, H.; Kong, W.Y.; Yoon, S.J.; Nahm, S.; Jang, H.W.; Sung, Y.E.; Ha, J.Y.; Davydov, A.V.; Choi, J.W. Three-dimensional hemisphere-structured LiSn0.0125Mn1.975O4 thin-film cathodes. Electrochem. Commun. 2014, 43, 36–39. [Google Scholar] [CrossRef]
Figure 1. (a) Discharge capacities and (b) voltage profiles of all samples.
Coatings 09 00366 g001
Figure 2. (a) Charge/discharge curves of the thin film deposited at the best position (P4) from one to five cycles and (b) function of differential capacity of the thin films deposited at the best (P4) and worst (P9) positions.
Coatings 09 00366 g002
Figure 3. Cycling performance of the P4 thin film.
Coatings 09 00366 g003
Figure 4. (a) AFM top-view morphologies and (b) SEM cross-sectional images of P4 and P9 before and after cycling.
Coatings 09 00366 g004
Figure 5. Electrochemical impedance spectra (EIS) patterns of P4 and P9 and equivalent circuit (inset).
Coatings 09 00366 g005
Figure 6. FT-IR spectra of discharged P4 and P9 thin films.
Coatings 09 00366 g006
Figure 7. (a) Mn, (b) Co, and (c) Ni L-edge XANES spectra of thin films deposited at positions P4 and P9.
Coatings 09 00366 g007
Figure 8. (a) RBS spectrum of thin film deposited at P4 and (b) diagram of compositions of P1–P9 samples.
Coatings 09 00366 g008