Article

Crack-Growth Behavior in Thermal Barrier Coatings with Cyclic Thermal Exposure

1
Department of Energy Engineering, Hanyang University, Seoul 133-791, Korea
2
School of Materials Science and Engineering, Changwon National University, Changwon, Gyeongnam 641-773, Korea
3
High Temperature Materials Research Group, Korea Institute of Materials Science, 797 Changwondaero, Changwon, Gyeongnam 641-831, Korea
4
Department of Mechanical and Engineering, Indiana University–Purdue University Indianapolis, Indianapolis, IN 46202-5132, USA
*
Authors to whom correspondence should be addressed.
Coatings 2019, 9(6), 365; https://doi.org/10.3390/coatings9060365
Submission received: 3 May 2019 / Revised: 3 June 2019 / Accepted: 3 June 2019 / Published: 4 June 2019
(This article belongs to the Special Issue Science and Technology of Thermal Barrier Coatings)

Abstract

:
Crack-growth behavior in yttria-stabilized zirconia-based thermal barrier coatings (TBCs) is investigated through a cyclic thermal fatigue (CTF) test to understand TBCs’ failure mechanisms. Initial cracks were introduced on the coatings’ top surface and cross section using the micro-indentation technique. The results show that crack length in the surface-cracked TBCs grew parabolically with the number of cycles in the CTF test. Failure in the surface-cracked TBC was dependent on the initial crack length formed with different loading levels, suggesting the existence of a threshold surface crack length. For the cross section, the horizontal crack length increased in a similar manner as observed in the surface. By contrast, in the vertical direction, the crack did not grow very much with CTF testing. An analytical model is proposed to explain the experimentally-observed crack-growth behavior.

1. Introduction

Thermal barrier coatings (TBCs) are employed for the accommodation of the turbine-inlet temperature increase as well as protection of the hot components from severe operating conditions in gas turbine and jet engine systems [1,2,3,4]. A typical TBC system includes a thermal insulating ceramic top coat, metallic bond coat, and thermally-grown oxide (TGO), which results from oxidation of metallic elements diffused from the bond coat [5]. Yttria-stabilized zirconia (YSZ) with 7–8 wt.% yttria is commonly used for top-coat material because of its excellent thermomechanical properties, such as low thermal conductivity, relatively high coefficient of thermal expansion (CTE), and mechanical properties of fracture toughness and hardness [6,7]. In some cases, however, a bare metal substrate or metallic bond coat of rotational components is directly exposed to a flame when TBCs are delaminated or spalled because of crack propagation and coalescence during operation. This exposure can cause the fracture of rotational components as well as the other parts, which results in fatal problems. Some researchers have shown that the delamination of TBCs occurs just above the interface between the top coat and TGO layer [5,8,9,10]. Khan et al. [10] evaluated the thermal durability of an air-plasma-sprayed (APS) TBC through a thermal cyclic exposure test, indicating that the 8YSZ-based TBC is delaminated within the top coat around the interface between the top coat and the TGO layer. Accordingly, the investigation of crack propagation and its coalescence is essential for understanding the failure mechanism of TBCs, predicting the lifetime performance of TBCs, and designing reliable TBCs.
During actual operation, the TBC system is placed in severe circumstances [11,12]: (i) thermal stress from hot-gas exposure; (ii) mechanical stress caused by high-speed rotation; (iii) corrosive environment with Calcia–Magnesia–Alumina–Silica; (iv) erosion caused by direct flame and/or particles from outside; and (v) interaction through the diffusion between top and bond coats. Under these conditions, the failure of TBCs, especially plasma-sprayed TBCs, is explained by a complex mechanism with one or more combined phenomena [5,11,13,14,15,16,17,18,19,20,21]. (i) At the initial operation stage, the TGO layer is grown by oxidation of the bond coat. Further oxidation of the bond coat can be avoided owing to the uniformly grown TGO layer, which functions as a diffusion barrier. During thermal exposure, the TGO thickness increases with the undulating interface. As heating and cooling procedures continue; however, the TGO layer is cracked by interfacial stress resulting from CTE mismatch between the top and bond coats. Cracks can play a role in the oxygen path, so the bond coat suffers from further oxidation. (ii) As oxidation continues, Al is depleted and some other brittle oxides, such as chromia and spinel, can be formed by oxidation of Co, Ni, and Cr components around the TGO layer with volume change, which can cause crack nucleation and further oxidation, finally leading to TBC failure. On the other hand, (iii) high thermal stress, especially compressive stress in a hot area, is imposed on the surface of the coating during engine operation, and the surface area suffers deformation with stress relaxation. Then, a surface crack is initiated because of the tensile stress during cooling, resulting in delamination along the TBC to the bond coat interface.
Donohue et al. [22] suggested converting the energy release rate into toughness within dense vertically-cracked TBCs, indicating the positive impact of the segmented microstructure on long-crack toughness. The fracture toughness of plasma-sprayed TBC was investigated according to the aspects of processing, microstructure, and thermal aging [23]. Recently, there are extensive experimental work and analytical calculations on more complicated TBCs, such as multilayered structure [24,25,26], solution precursor plasma spray coating [27], and suspension plasma spray coating [28,29]. Their crack initiation and propagation under a thermal cyclic environment were investigated with analysis of mechanical and thermal properties.
In this study, crack-growth behavior just above the TGO layer was observed to understand the failure mechanism of TBCs. An initial crack was formed (i) on the TBC surface to simulate damage due to extrinsic factors (e.g., erosion or foreign object debris (FOD)) and (ii) within the top coat just above the interface between the top and bond coats in the cross section, which simulates the cracking initiation site due to bond coat oxidation and TGO growth in a typical APS coating. The crack growth behavior was investigated and described in detail through cyclic thermal fatigue (CTF) tests. An analytical model was employed to predict the residual stress distribution and fatigue crack-growth behavior. The results and analysis of this study can be helpful for further understanding of the TBC failure mechanism, resulting in the development of reliable TBC systems.

2. Experimental Procedure

2.1. Sample Preparation

In this study, typical 8YSZ TBC systems were prepared using commercial feedstock powders. The Ni-based superalloy (Nimonic 263, ThyssenKrupp VDM, Essen, Germany; nominal composition of Ni–20Cr–20Co–5.9Mo–0.5Al–2.1Ti–0.4Mn–0.3Si–0.06C, in wt.%) was used as a substrate in the shape of a disk and dimensions of 25 mm in diameter and 5 mm in thickness. Sandblasting using Al2O3 powder (particle size ≈ 420 μm) was performed before the deposition of the bond coat. A bond coat with a thickness of about 300 μm was formed on the substrate by the APS method, using AMDRY 9625 (Sulzer Metco Holding AG, Winterthur, Switzerland, the nominal composition of Ni–22Cr–10Al–1.0Y in wt.% and particle size 45–75 μm). After creating the bond coat, the top coat was deposited by the APS method with a thickness of about 600 μm, using METCO 204 C-NS (Sulzer Metco Holding AG, Switzerland, 8Y2O3–ZrO2) and particle size of 45–125 μm. The fabrication parameters employed for the bond and top coats were recommended by the manufacturer; see Table 1.

2.2. Crack Formation and Observation

To create the initial cracks on the surface, the selected TBC samples before crack formation were polished using silicon carbide paper and fine polished with a 1 μm diamond paste. On the other hand, the selected TBC samples for the cross-sectional cracks were sectioned and given a final polish with a 1 μm diamond paste. The initial surface crack was generated in the center of the polished top coat surface, while the cross-sectional crack was generated above the interface of top and bond coats within 100 μm. A micro-indenter (HM-114, Mitutoyo Corp., Kawasaki City, Japan) with a Vickers tip was used for the formation of cracks through the indentation load with loading levels of 30 and 50 N for the surface, but only 30 N of load was employed on the cross section because of the formation of large imprints (>100 μm).
CTF tests were performed for both the surface and cross-sectional-cracked TBCs to impose thermal fatigue conditions and observe the growth behavior of the induced cracks. The TBC samples were held in the furnace with a dwell time of 40 min at a temperature of 1121 °C and then naturally cooled for 20 min in air. The CTF tests were performed up to 640 cycles and the criterion of delamination was defined as about 25% spallation of the top coat. At least five specimens were tested for each crack formation condition, and each specimen had only one imprint to avoid interrelation of stresses and/or cracks between the imprints in different locations. The microstructure was observed by scanning electron microscope (SEM, JEOL Model JSM-5610, Tokyo, Japan) to investigate the crack-growth behavior. The samples after 10, 20, 40, 80, 160, and 320 cycles in the CTF tests were cleaned to observe the microstructure around the induced cracks and to measure the crack length grown after the CTF tests. The crack length was measured from the center of the indentation imprints. The surface crack length was measured regardless of the direction, while vertical and horizontal cracks were measured on the cross section.

3. Modeling of Residual Stress and Crack-Growth Behavior in TBC Samples

In cyclic thermal exposure environments, thermally-induced residual stress forms in the TBC multilayers because of differential coefficients of thermal expansion in each layer [30,31]. In this work, a linear elastic analytical model was employed to understand the residual stress distribution and resultant cracking phenomena, as in [30,31,32,33]. In the model, the interface between the substrate and the bond coat was defined as the origin line, where z = 0. The distance from layer i to the substrate was defined as hi [32,34,35]. The thermal residual stress in the substrate and the ith coating layer, which is related to the misfit strain εi and bending curvature K, can be expressed as [32,33]:
σ s = E s [ ε s + K ( z + δ ) ]   ( t s     z     0 )
σ i = E i [ ε i + K ( z + δ ) ]   ( 1     i     n ,   h i 1     z   <   h i )
where Es and Ei are Young’s moduli of the substrate and ith coating layer, respectively. δ is the distance from the bending axis, where the bending strain is zero. εi, εs, δ, and K can be individually expressed as [33]:
ε i = Δ α Δ T + k = 1 n E k t k E s t s ( α k α i ) Δ T
ε s = i = 1 n E i t i E s t s Δ α Δ T
δ = t s 2 i = 1 n E i t i E s t s ( 2 h i 1 + t i )
K = i = 1 n 6 E i t i Δ α Δ T E s t s 2
where α is the CTE, k is the coating layers range from 1 to n, and ti is the thickness of the ith layer.

4. Results

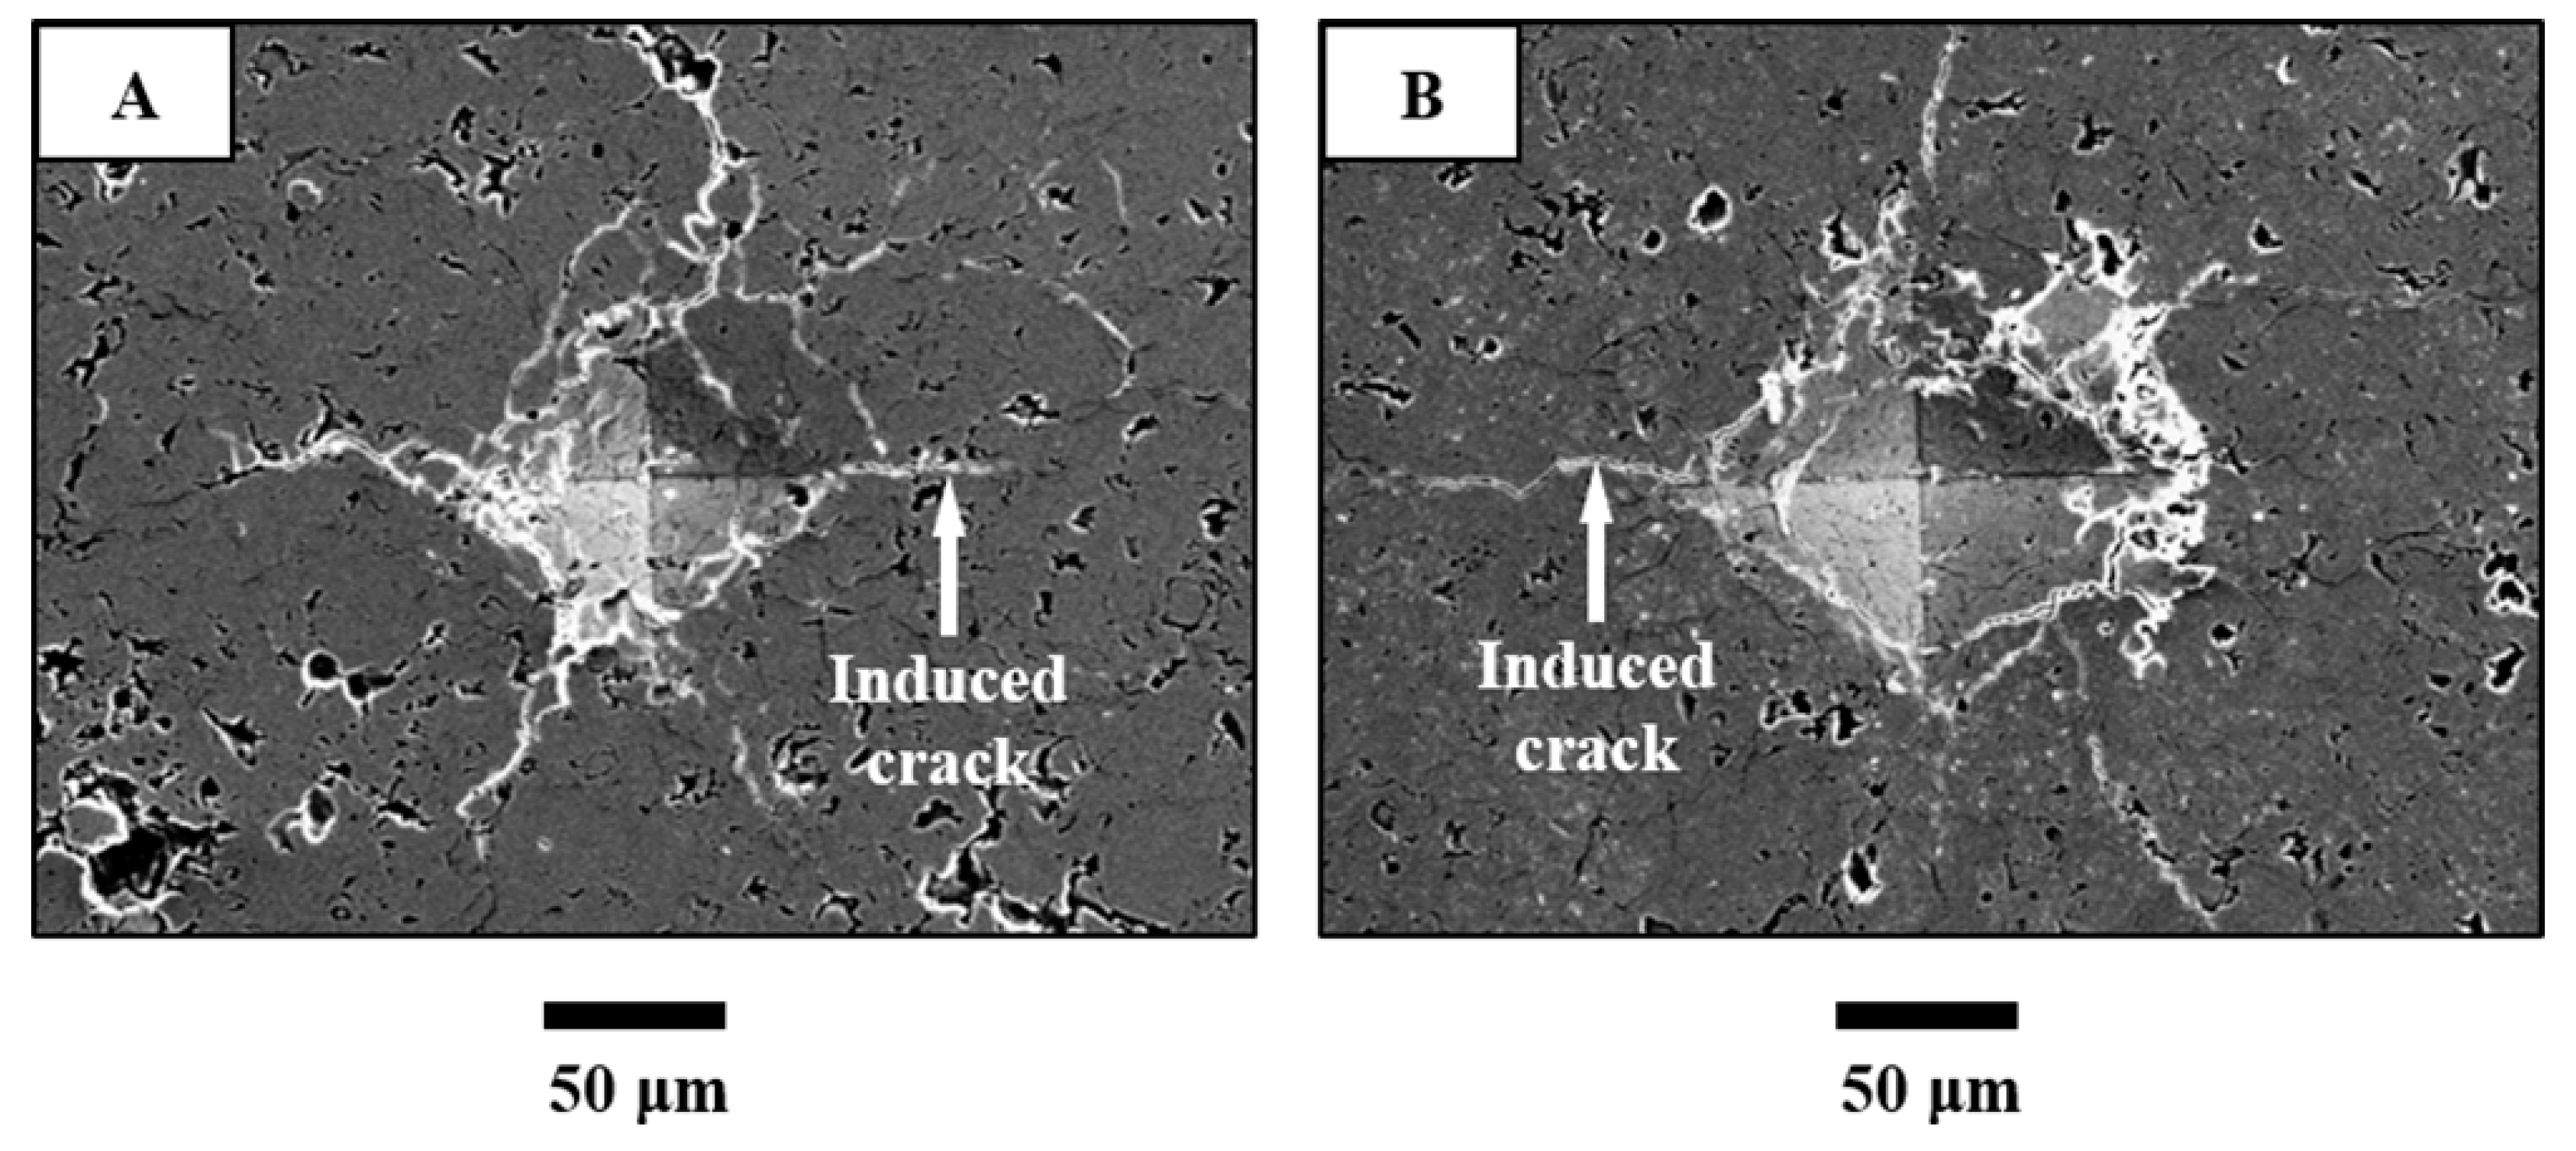
4.1. Crack Initiation

The images around the indentation imprints formed by different loading levels on the surface of the TBC are shown in Figure 1. Figure 1A,B is imprints generated by loading levels of 30 and 50 N, respectively, and the white arrows indicate induced cracks. Crack formation initiated from the center of the rhombus through the angular points and edges regardless of direction, and showed larger rhombus-shaped imprints as well as longer crack length in the indentation load of 50 N, compared to 30 N. The as-coated microstructure image and the induced cracks on the cross-sectional area are shown in Figure 2. The typical APS-coated microstructure was observed with some defects like pores and splat boundaries. The red-dotted line designates the interface between the top and bond coats, suggesting the imprint was formed just above the interface. The high-resolution back-scattering emission mode image of the white-dotted box from the normal SEM image of Figure 2B is shown in Figure 2C. The horizontal crack that was parallel to the interface was evidently formed longer than that in the vertical direction.
Figure 3 shows the initial crack lengths before the CTF test with the indented position, loading level, and crack direction. The surface crack length with different loads of 30 and 50 N were 101 ± 17 and 121 ± 30 μm, respectively. On the other hand, the cross-sectional crack lengths induced by 30 N were noticeably different depending on the direction. The vertical crack length was 50 ± 10 μm, while the horizontal crack length was 153 ± 7 μm, which was larger than the 50 N loaded on the surface.

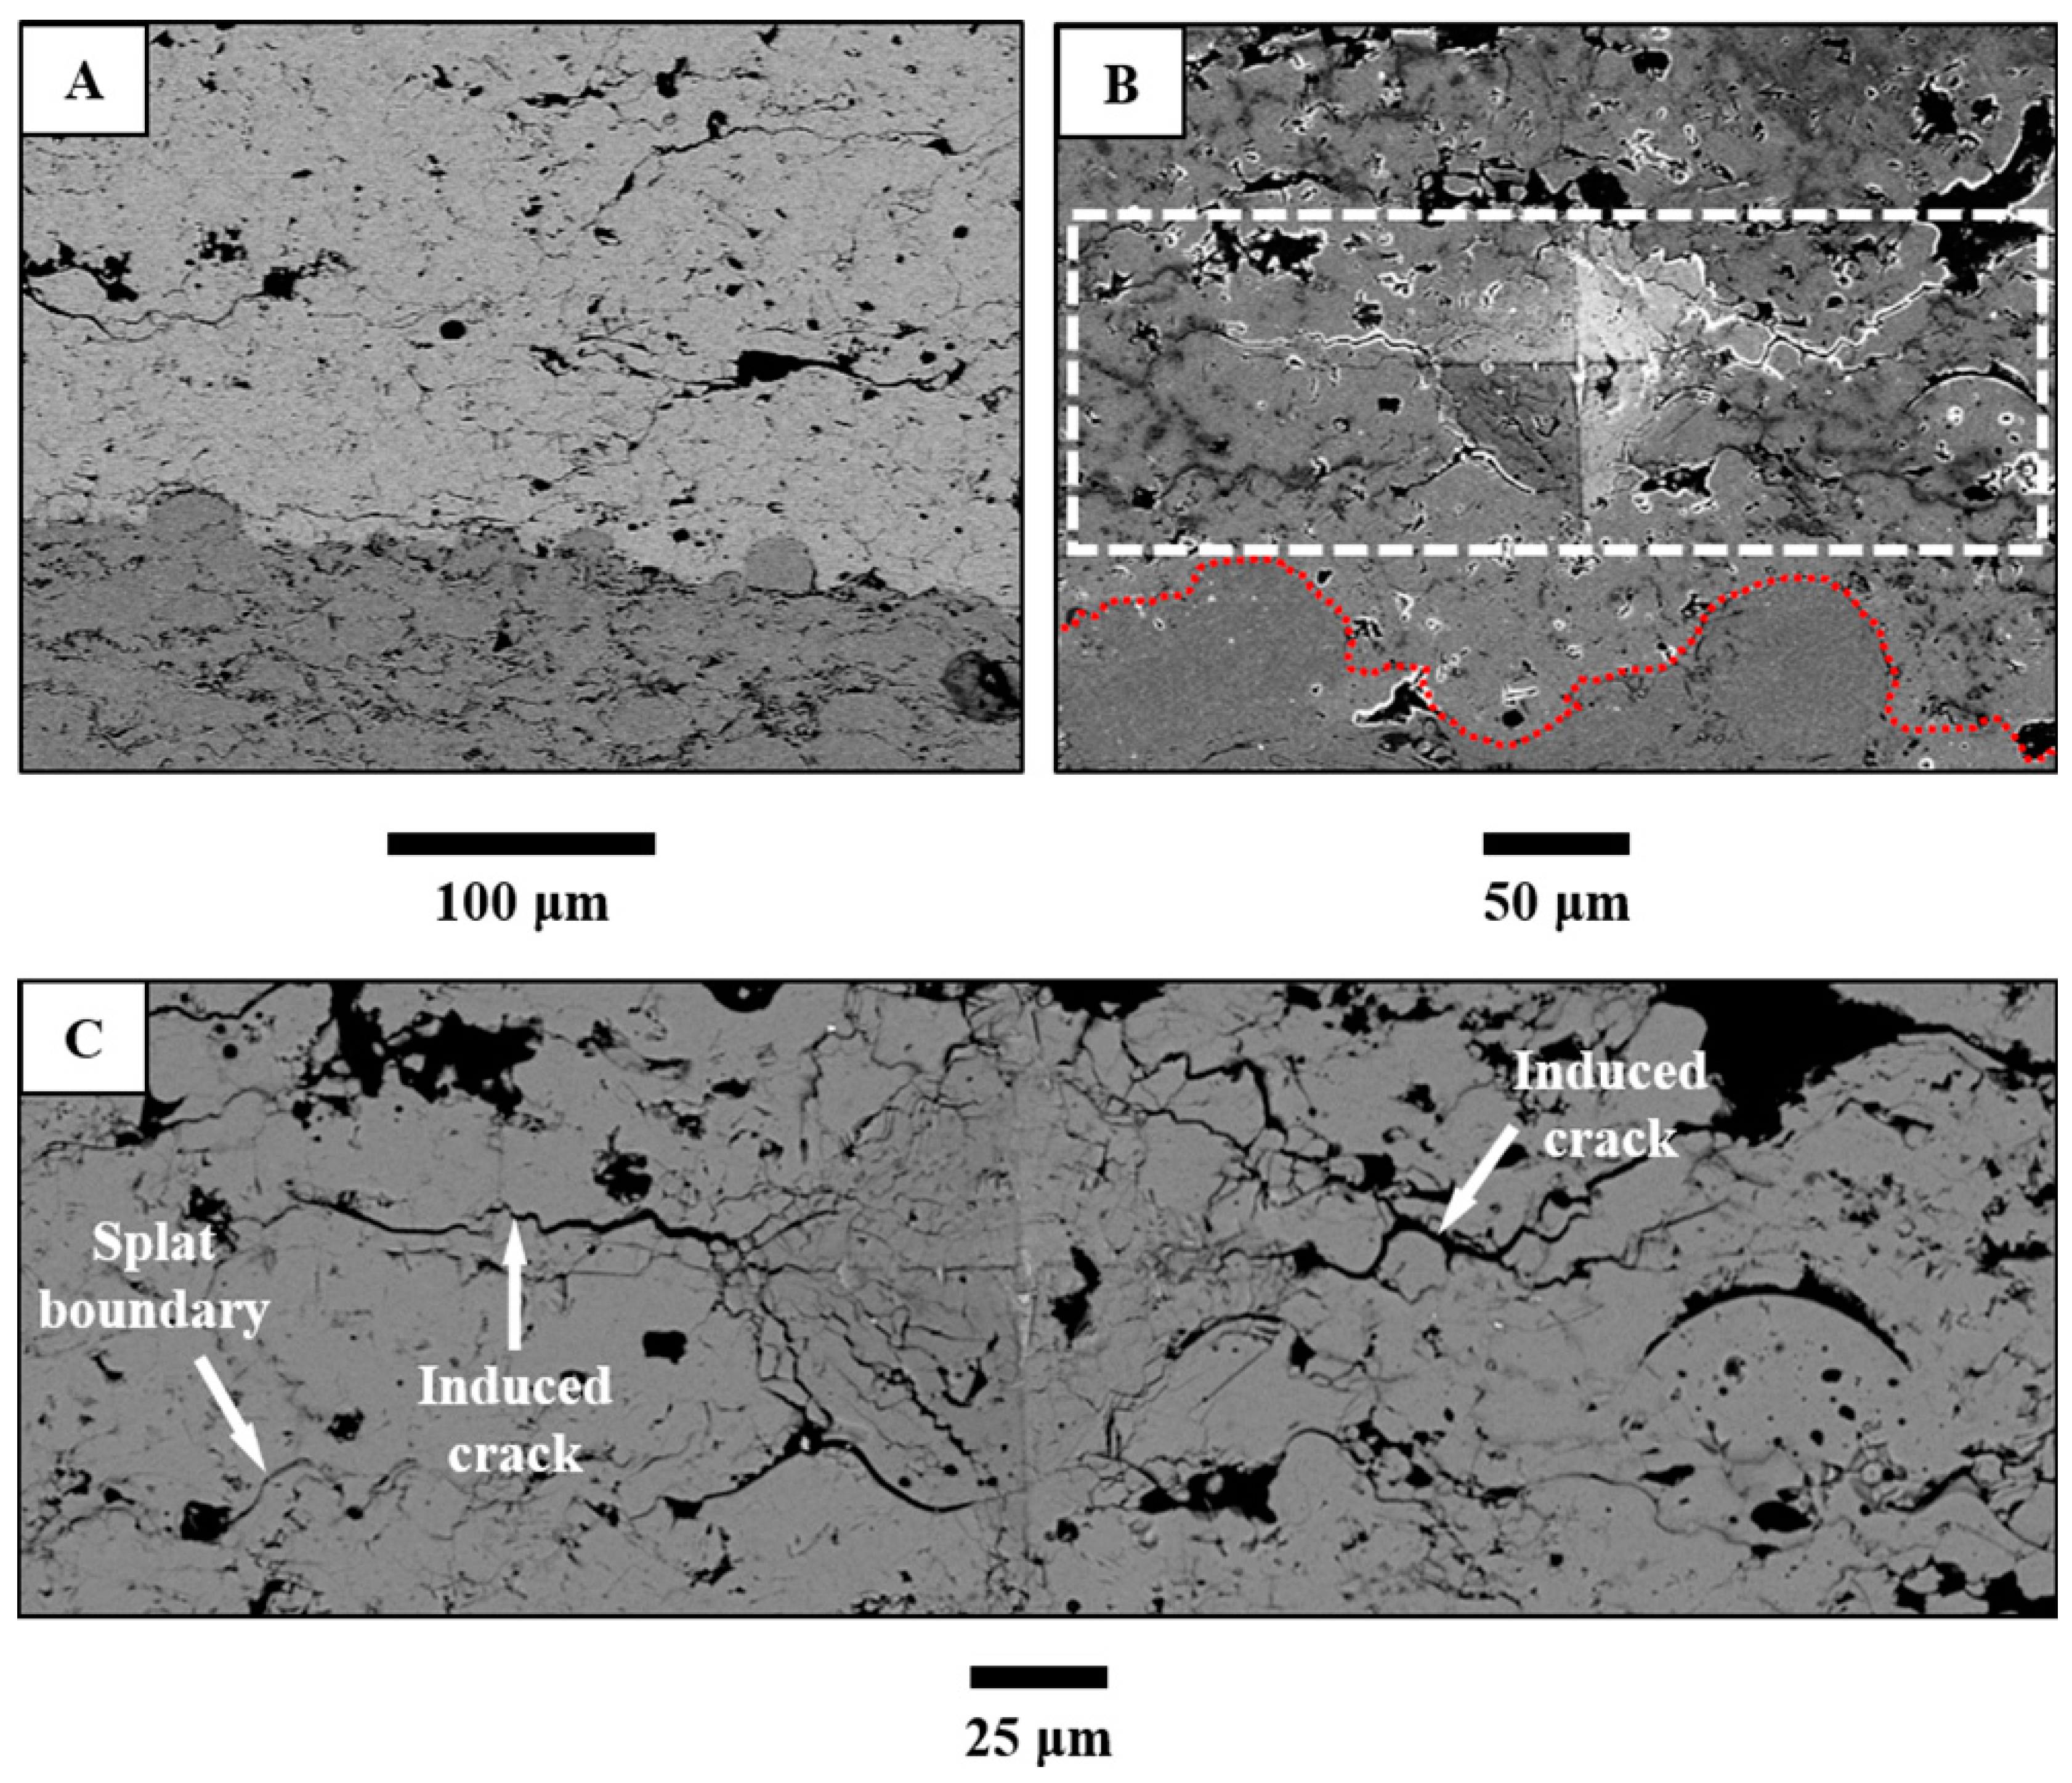
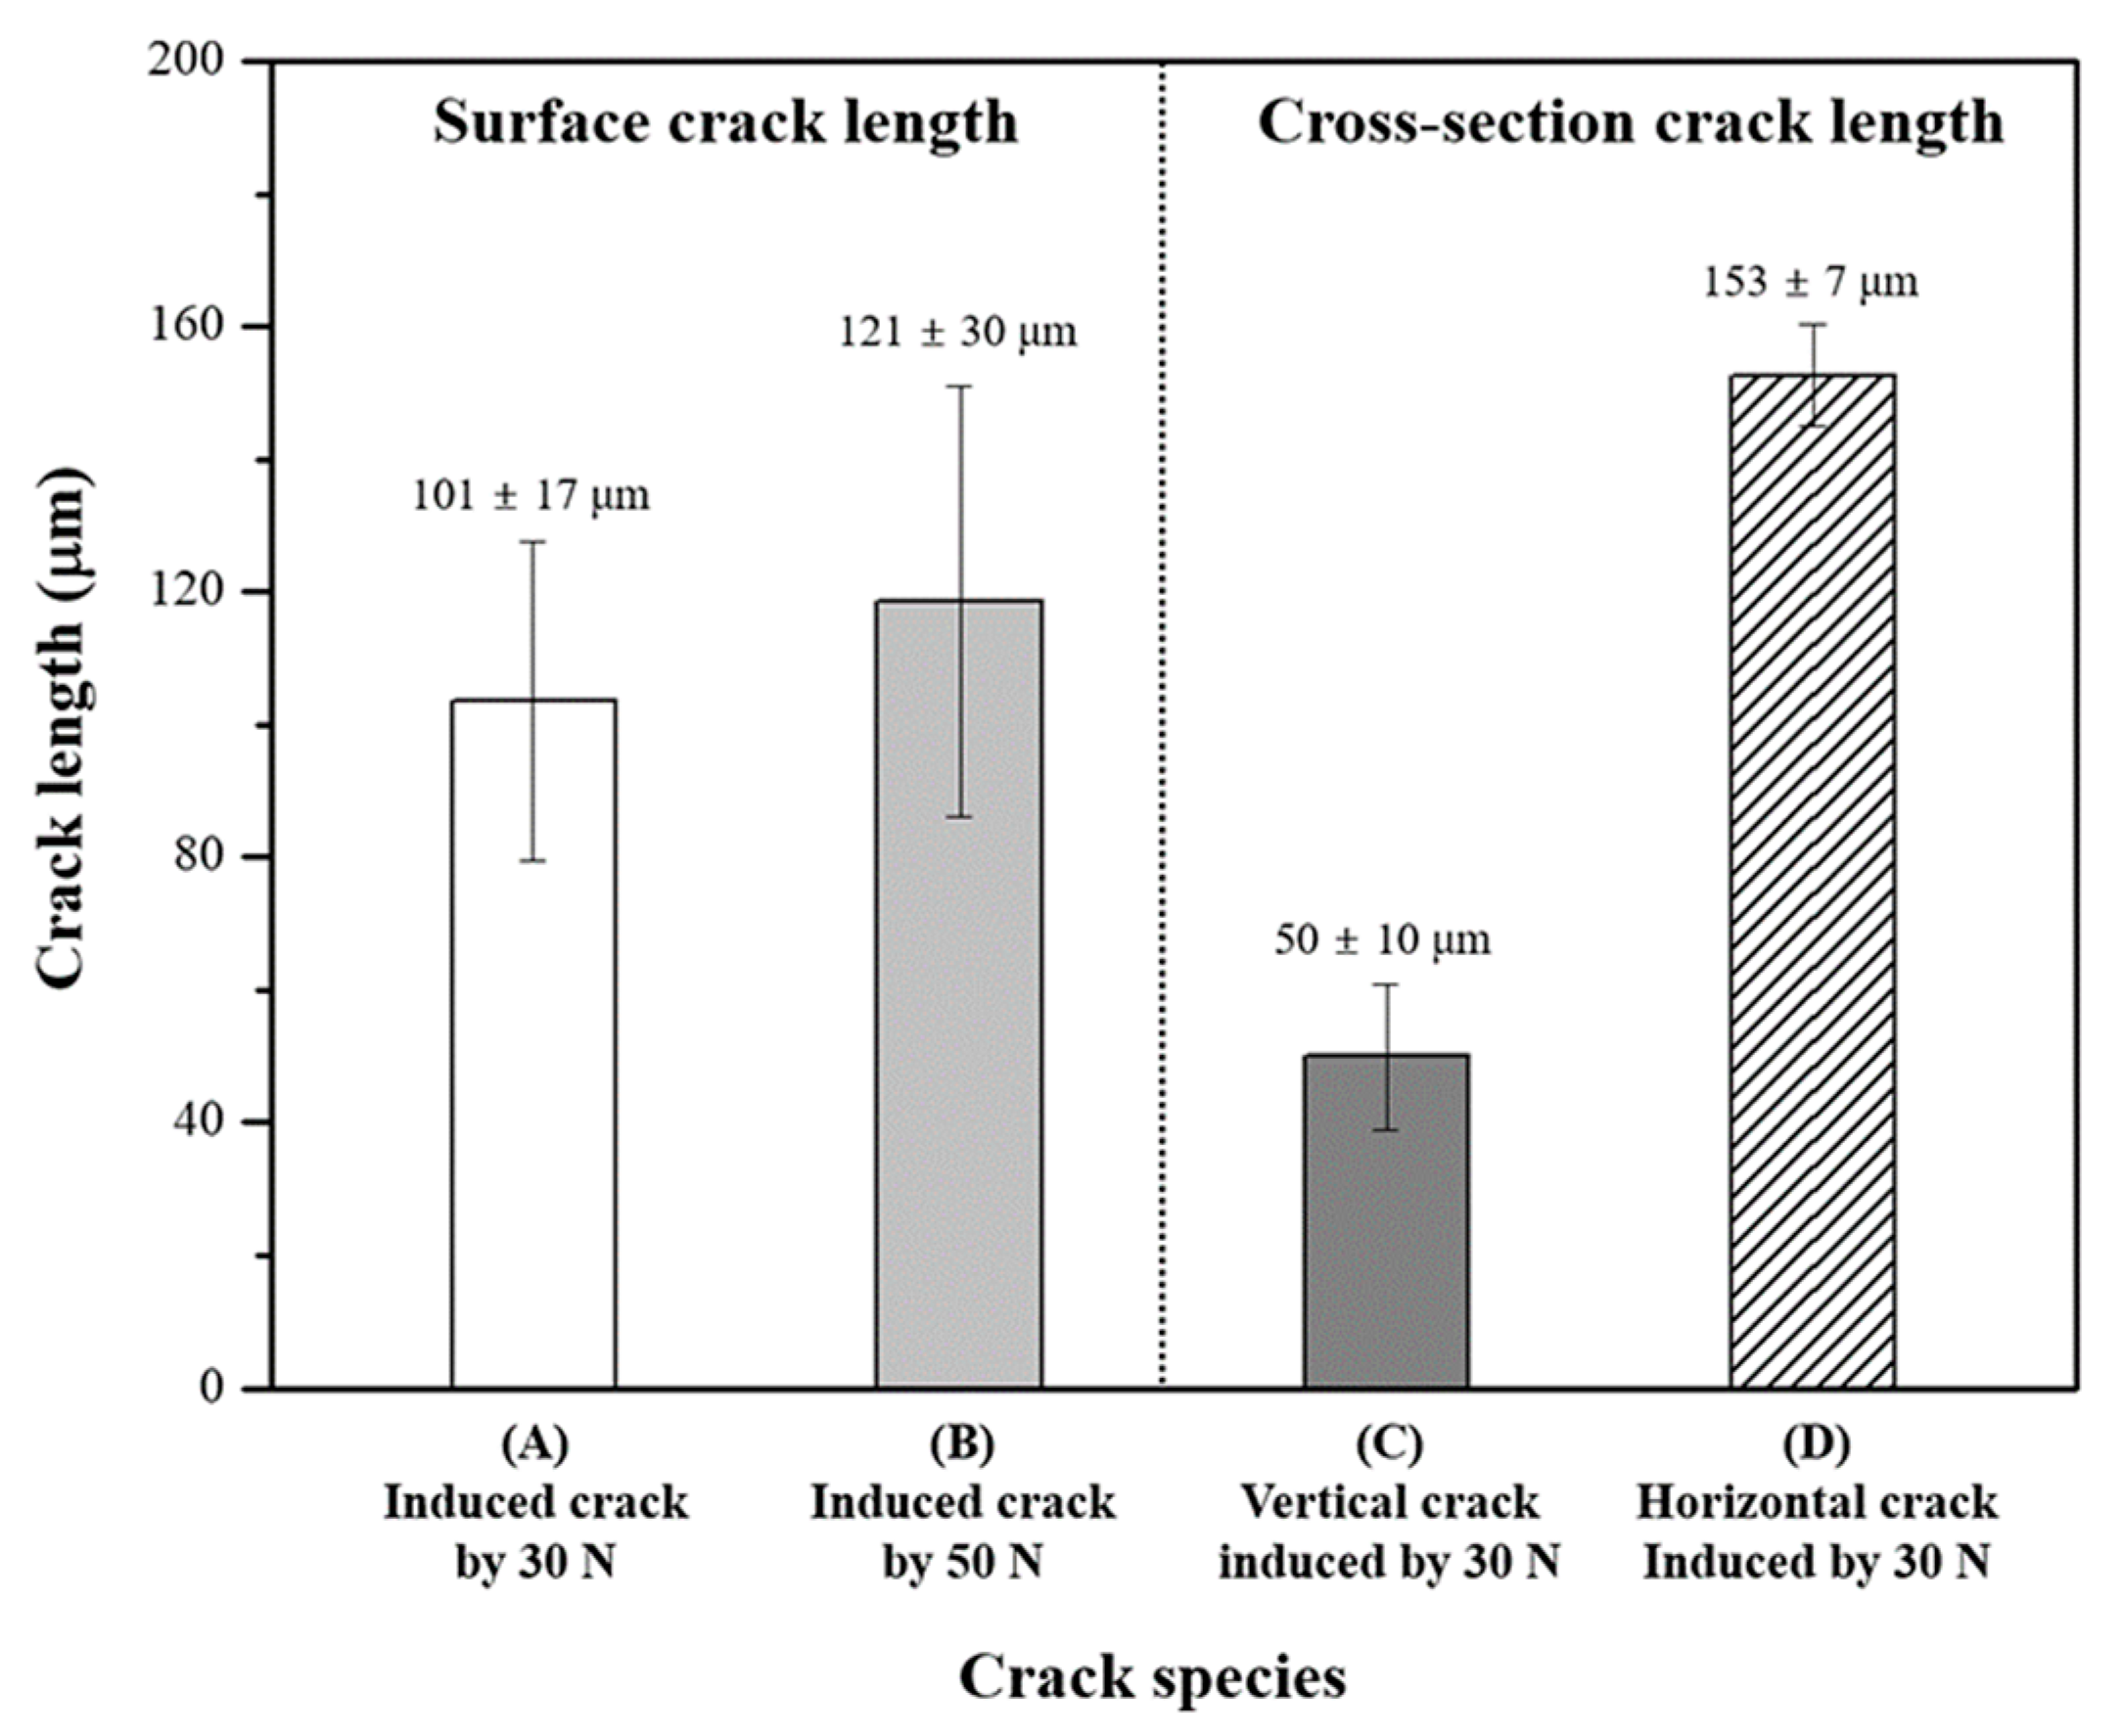
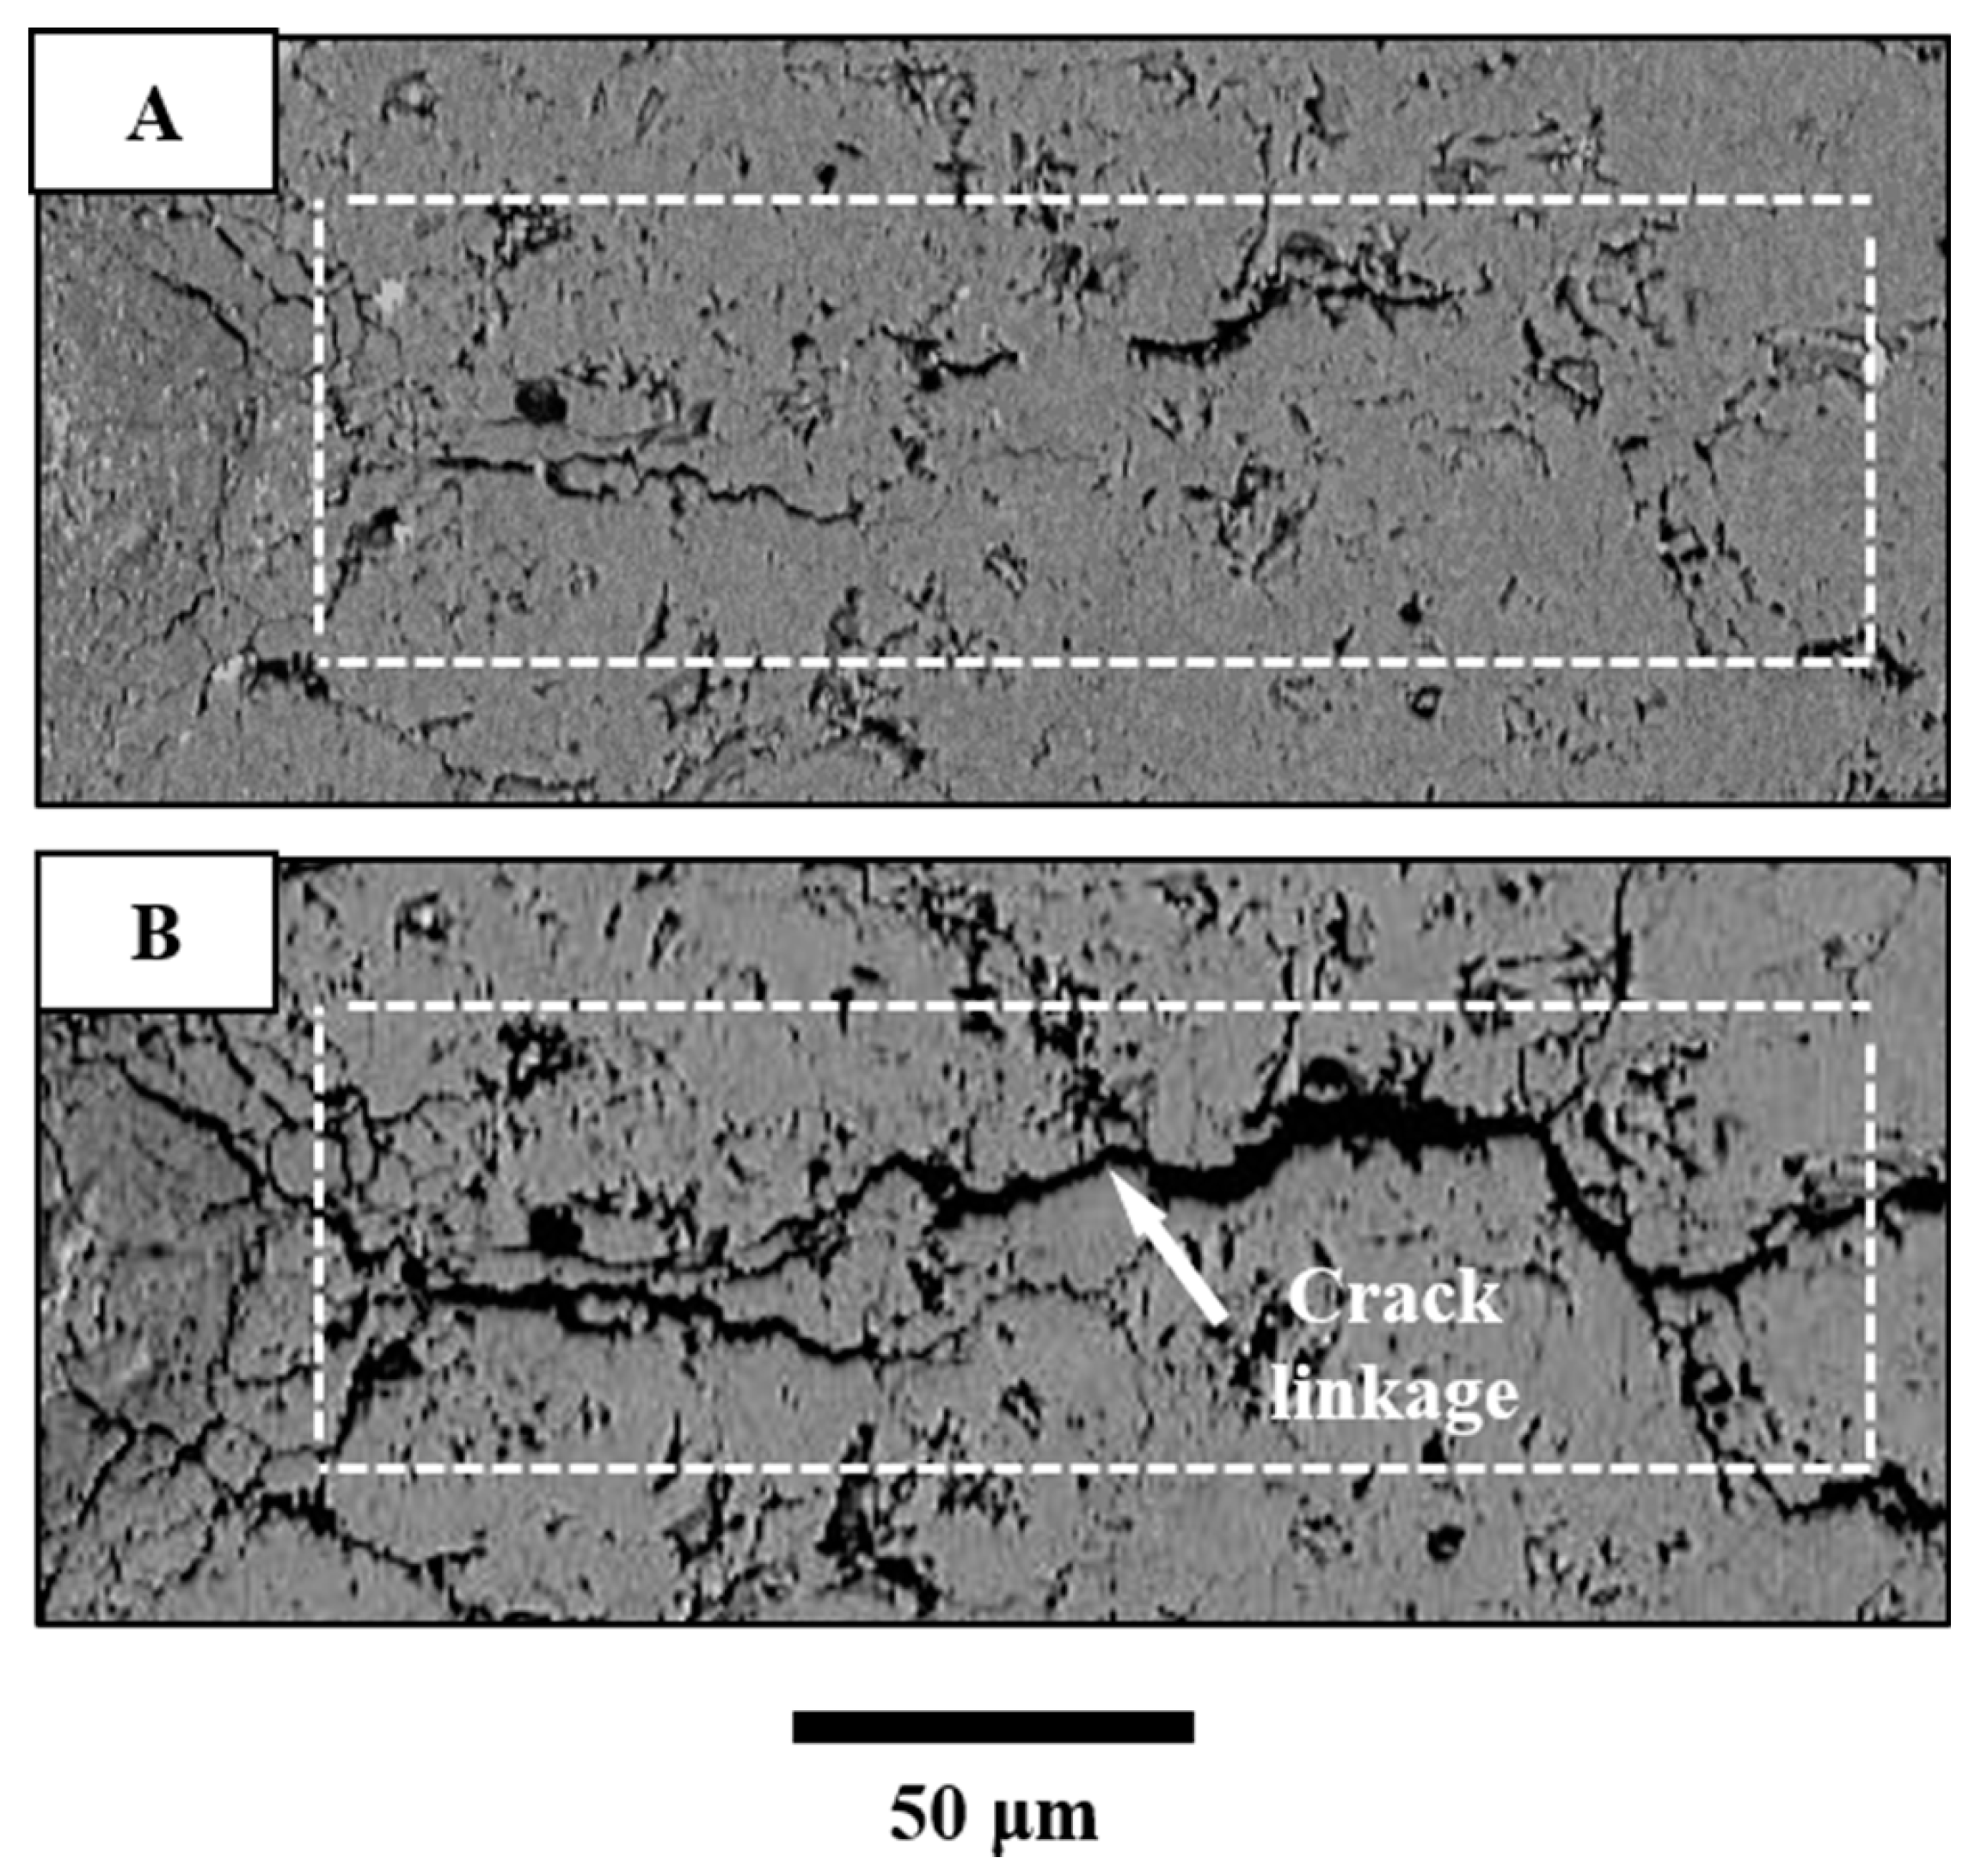
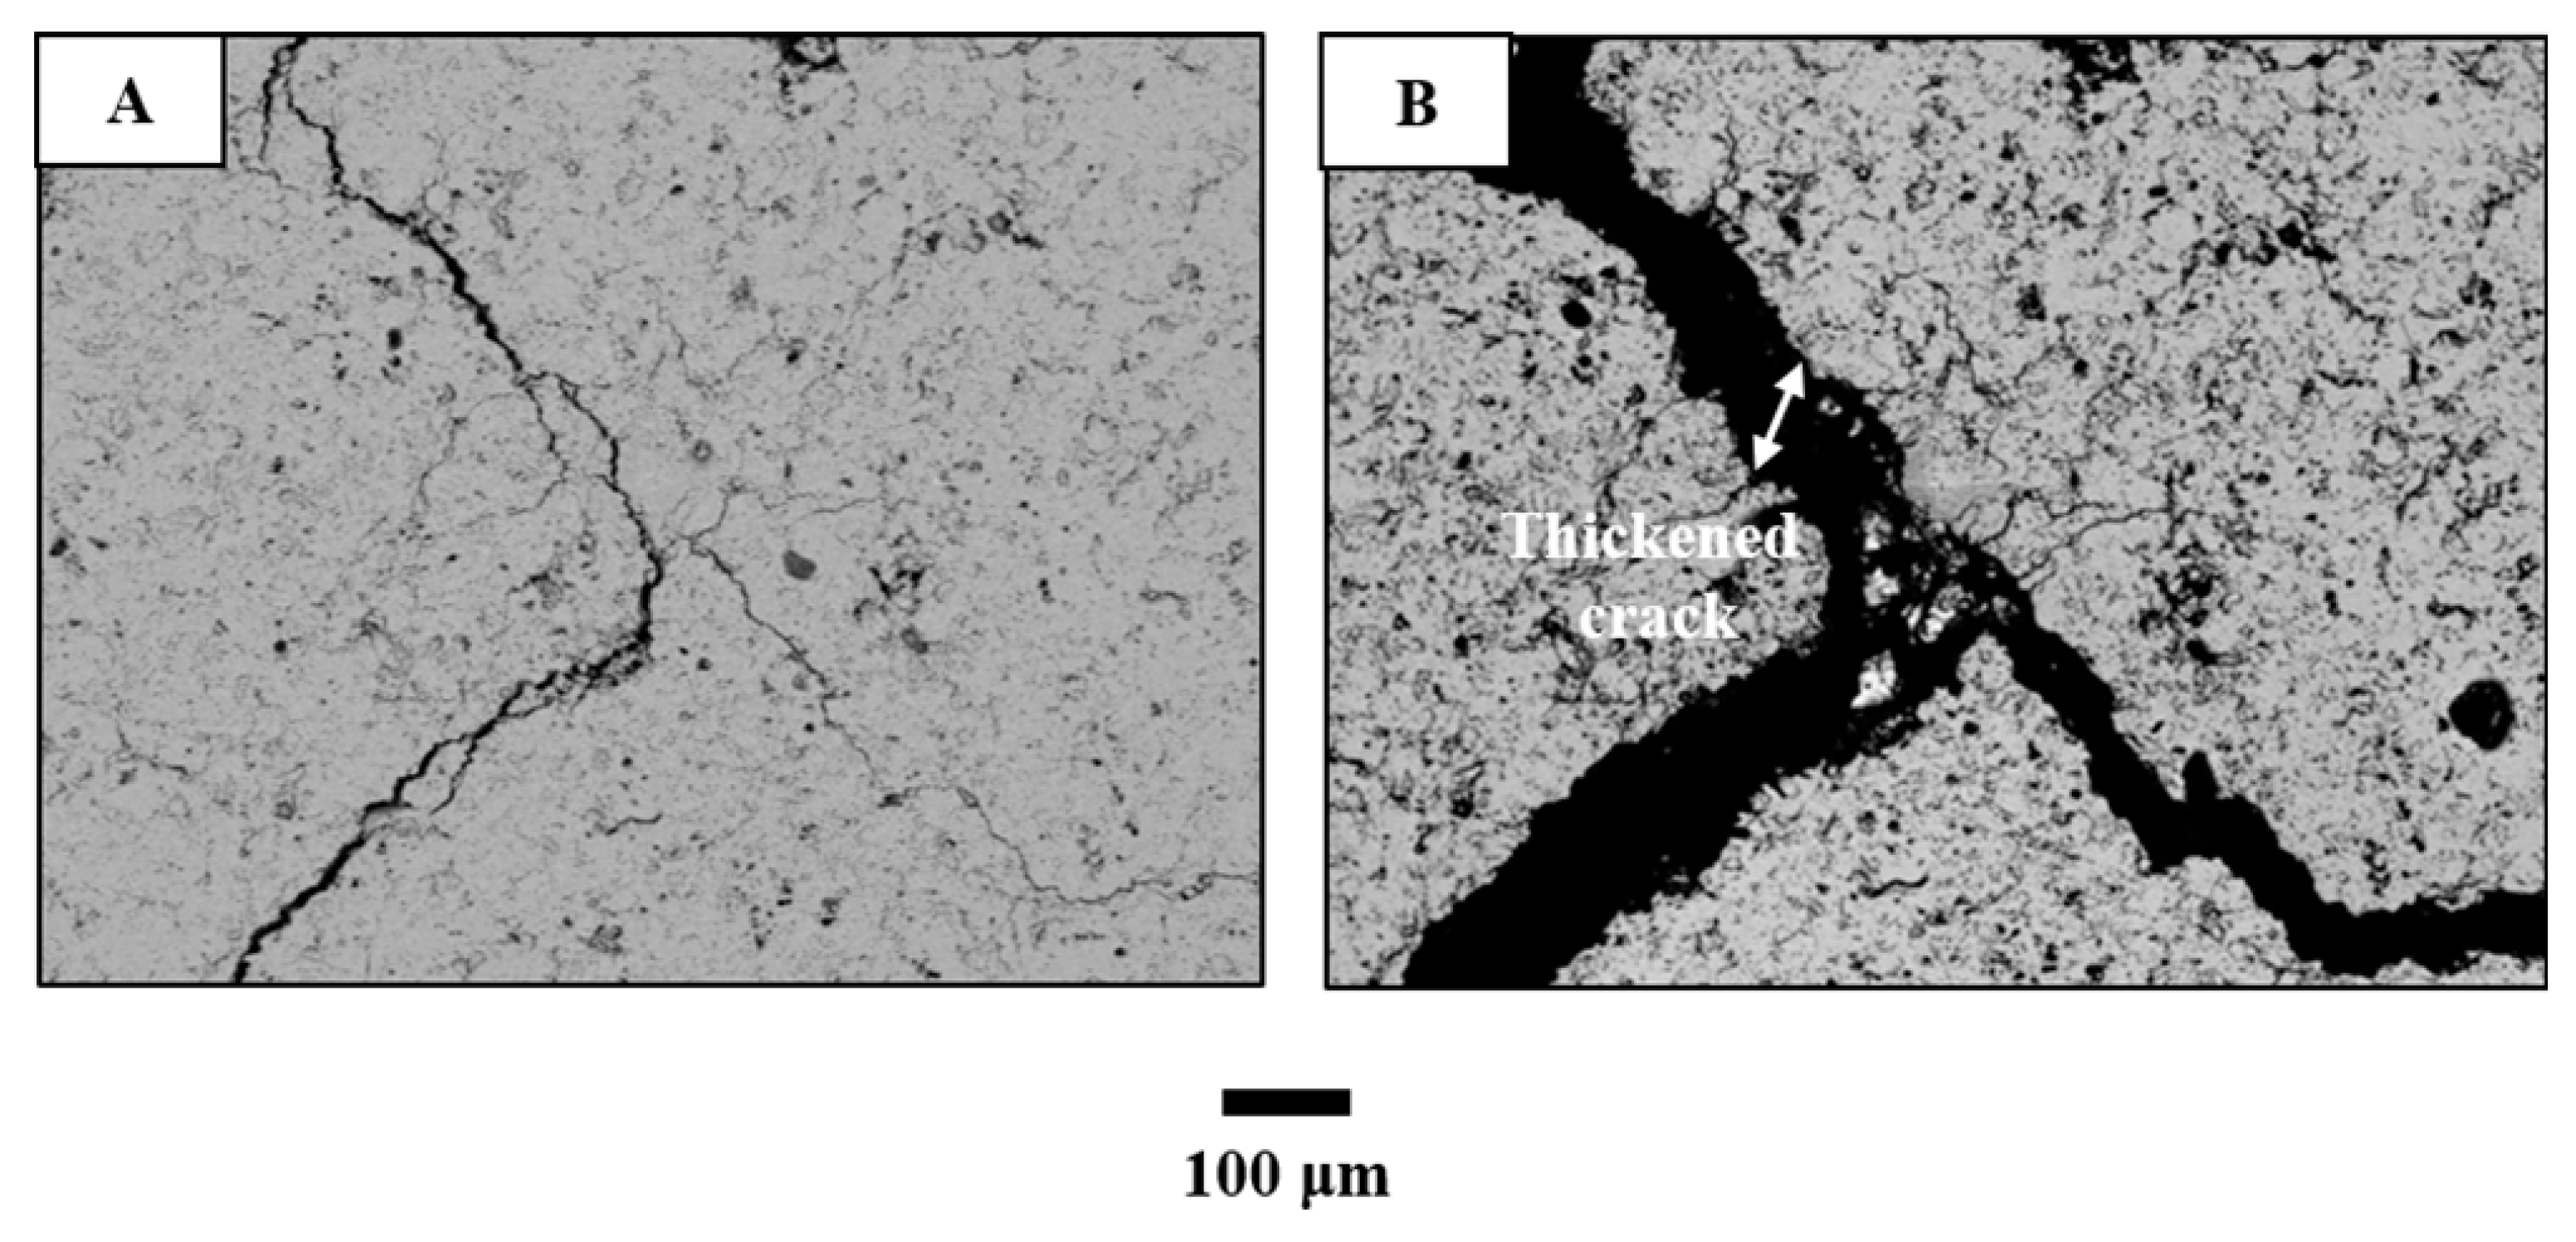
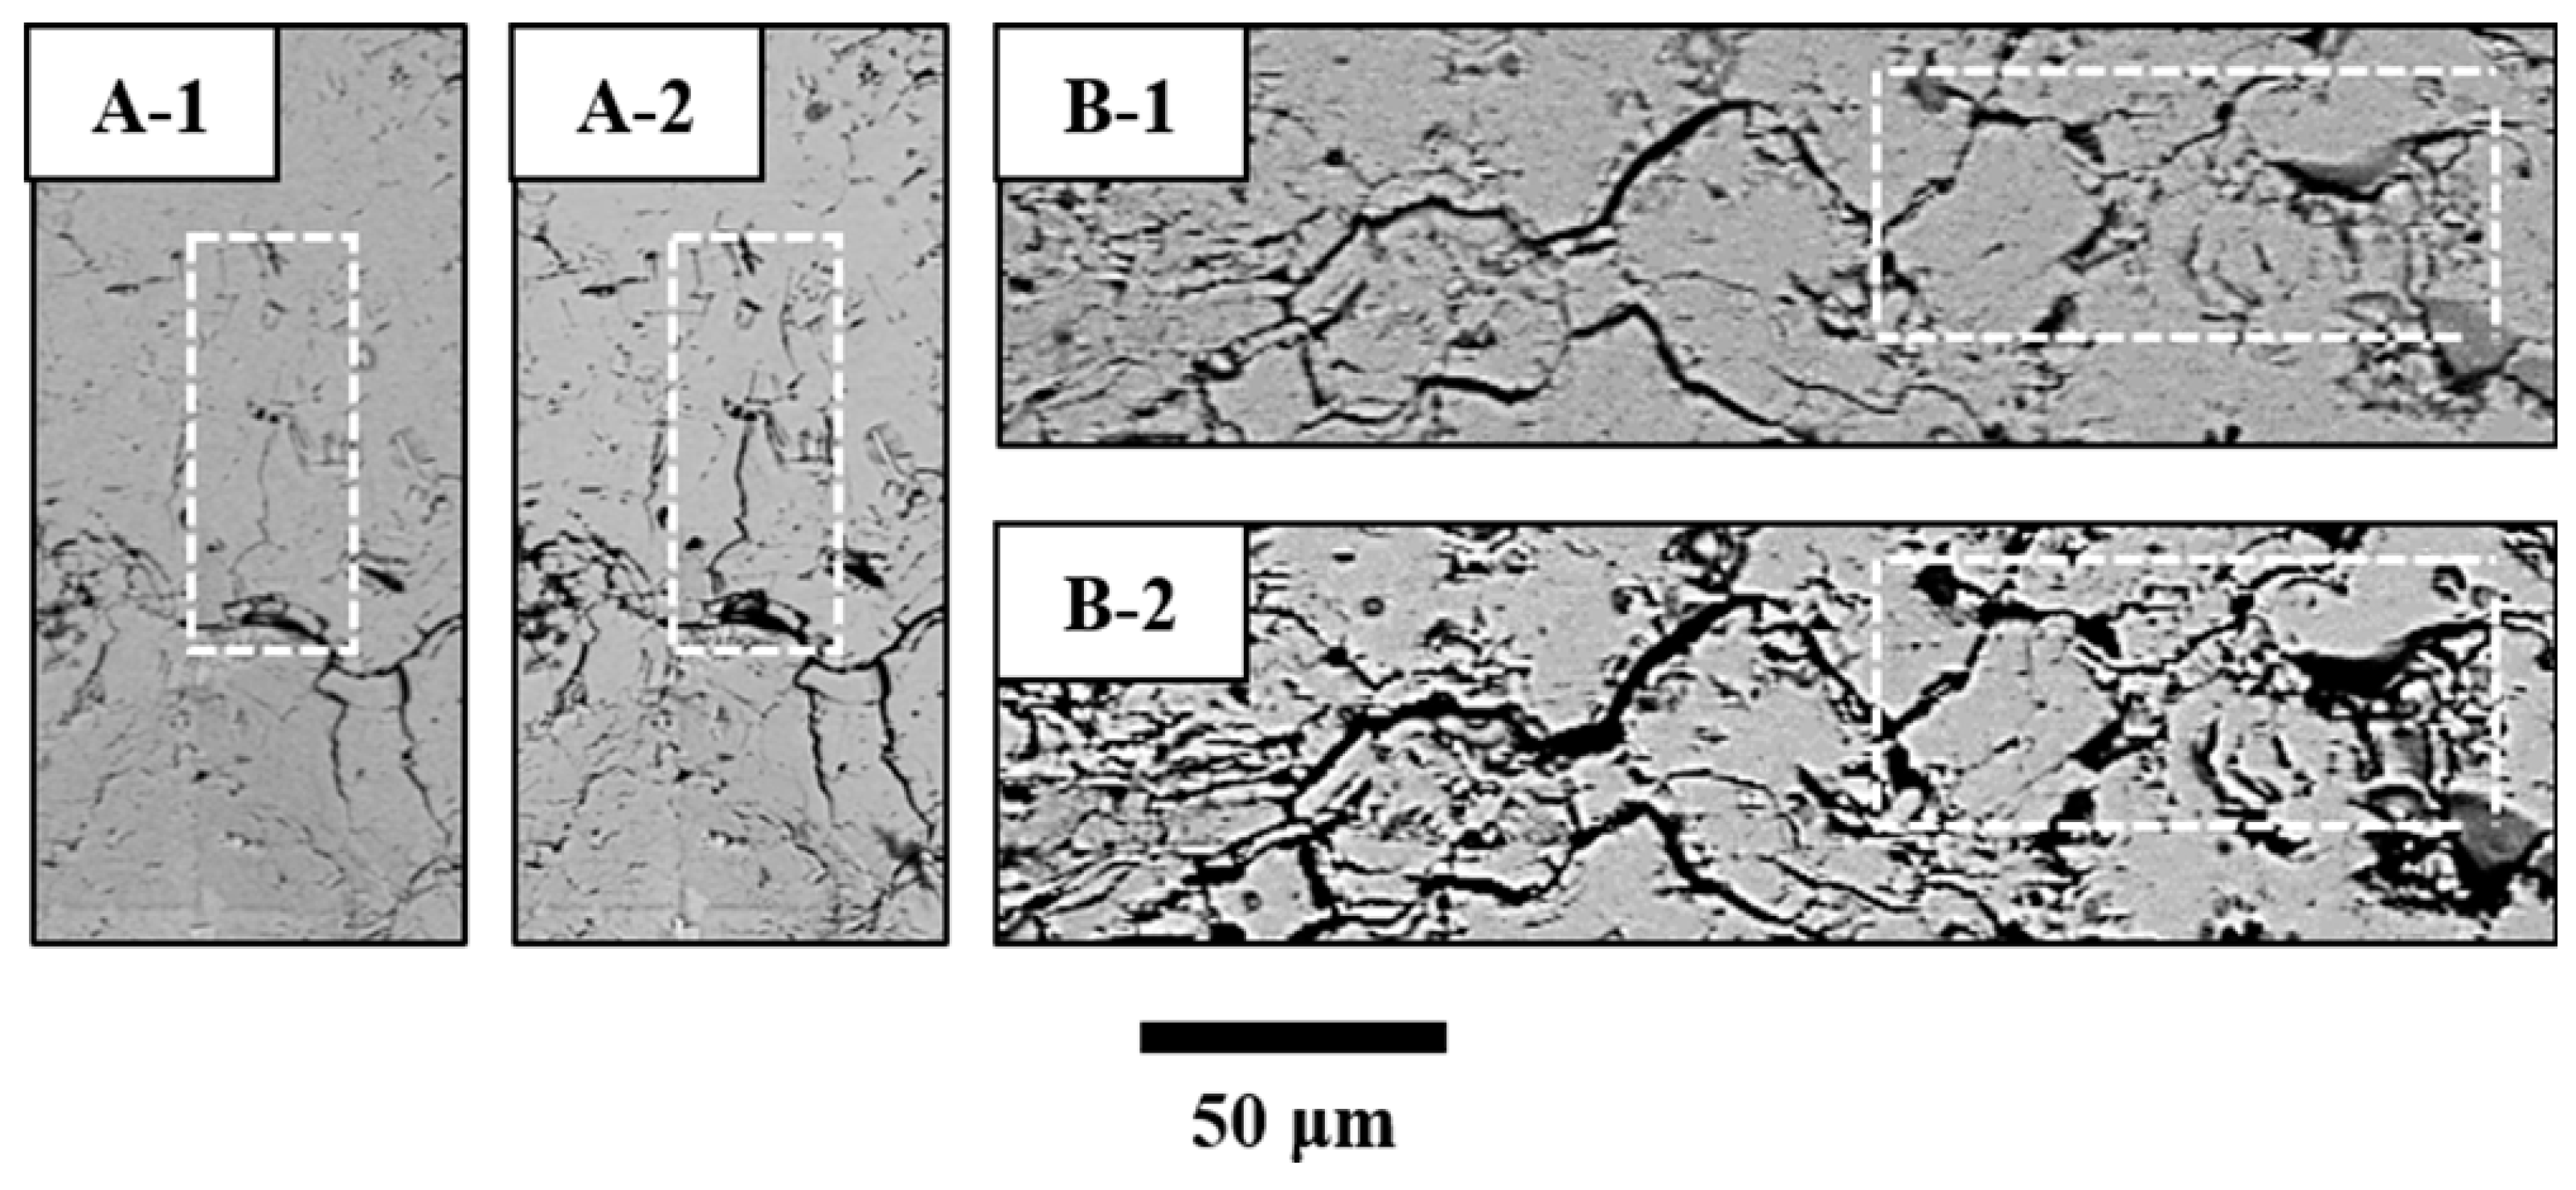
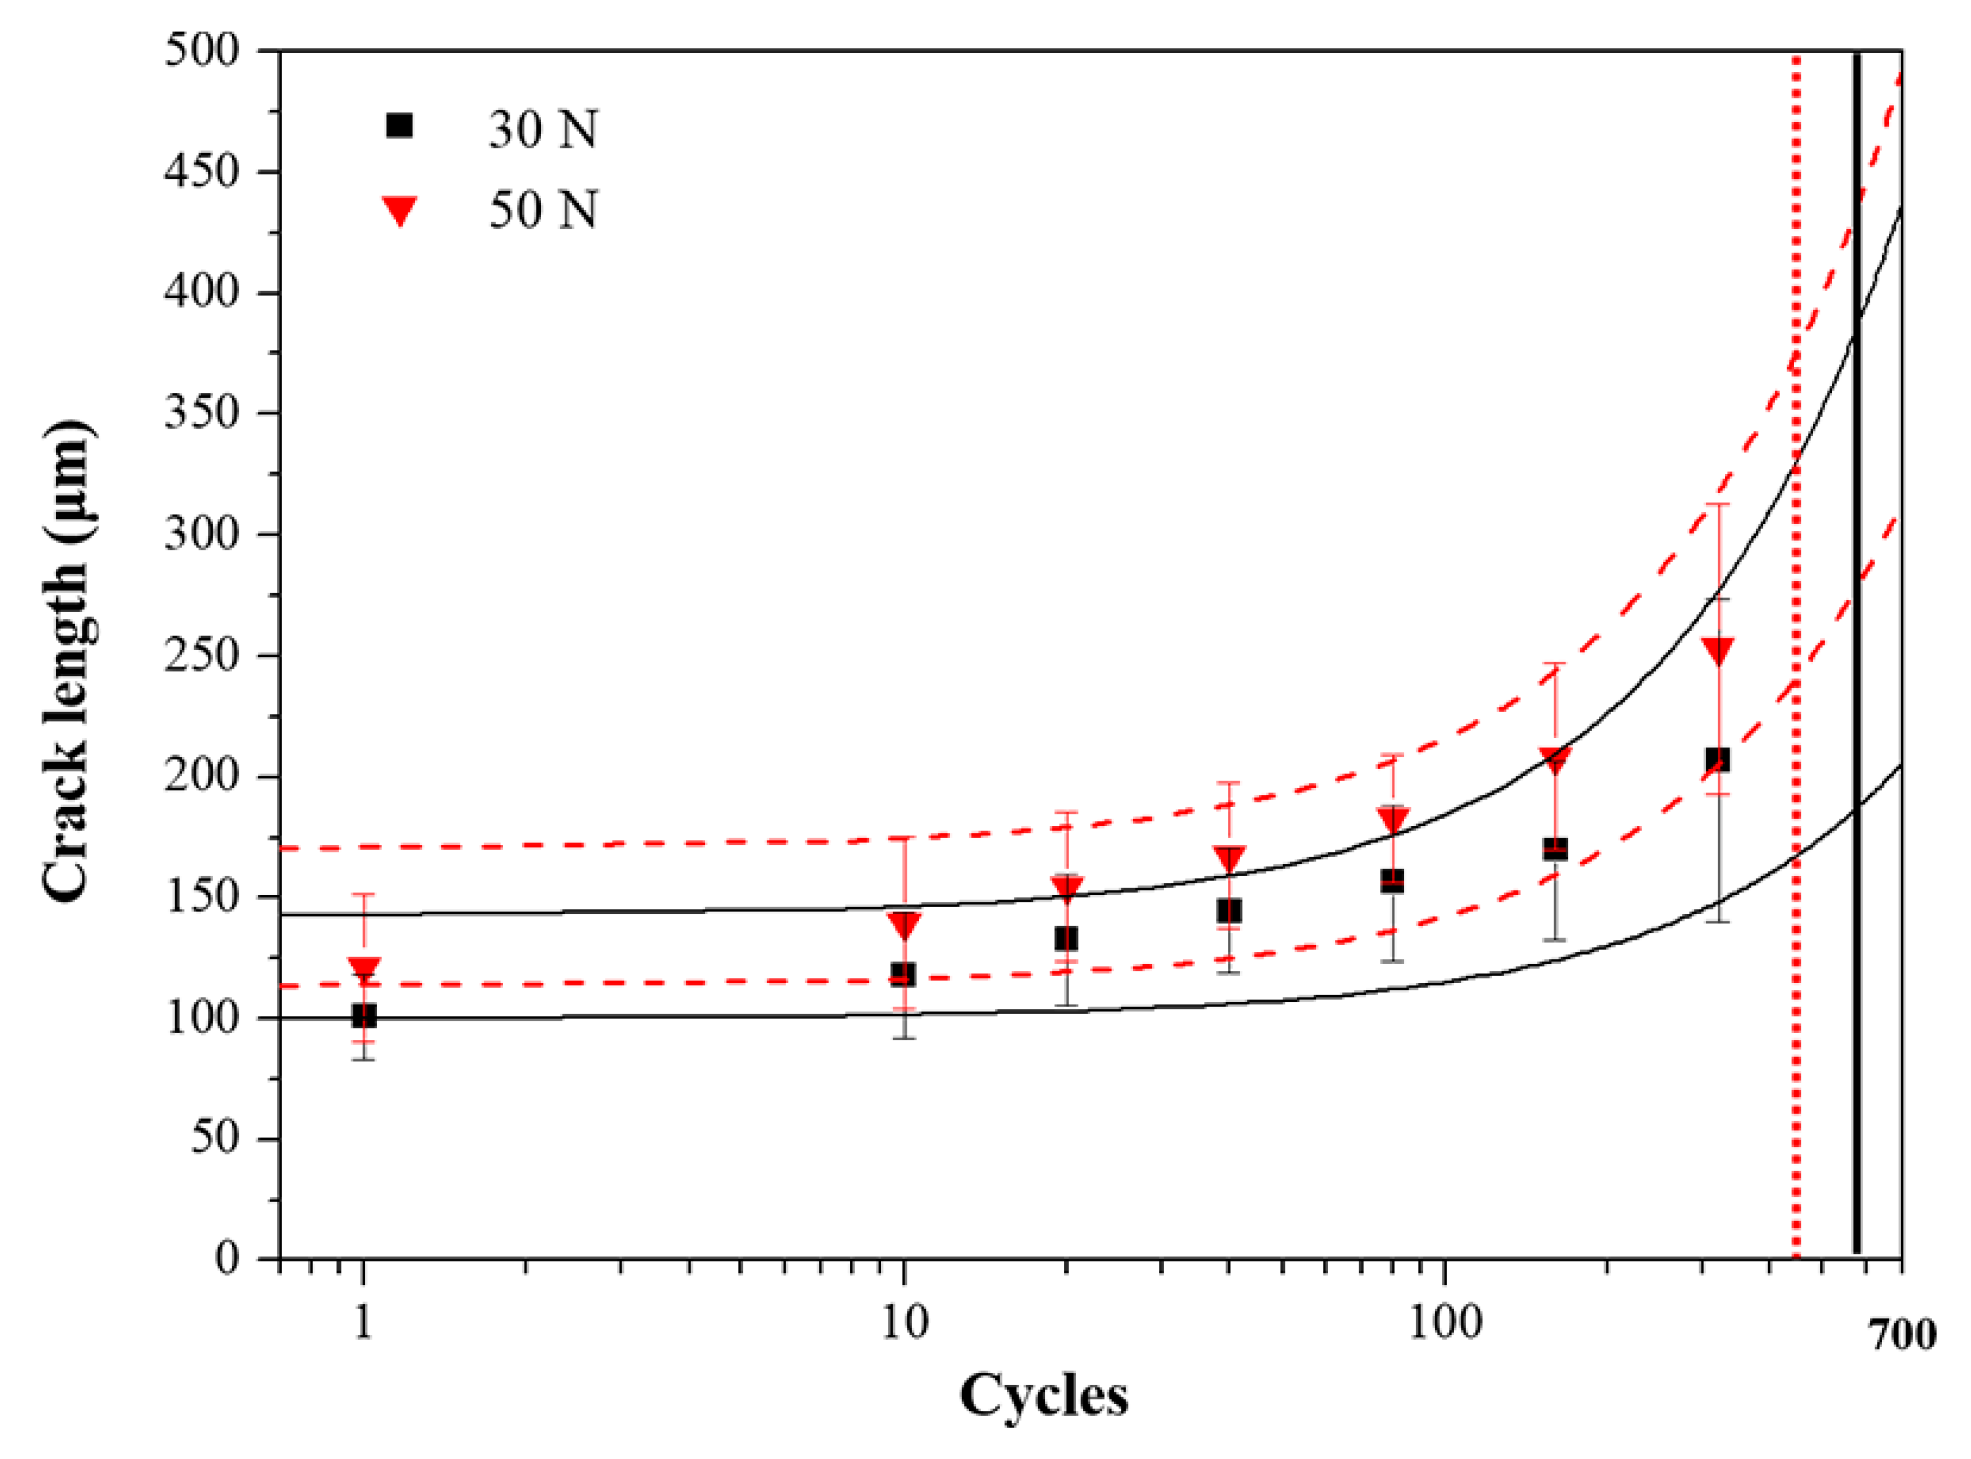
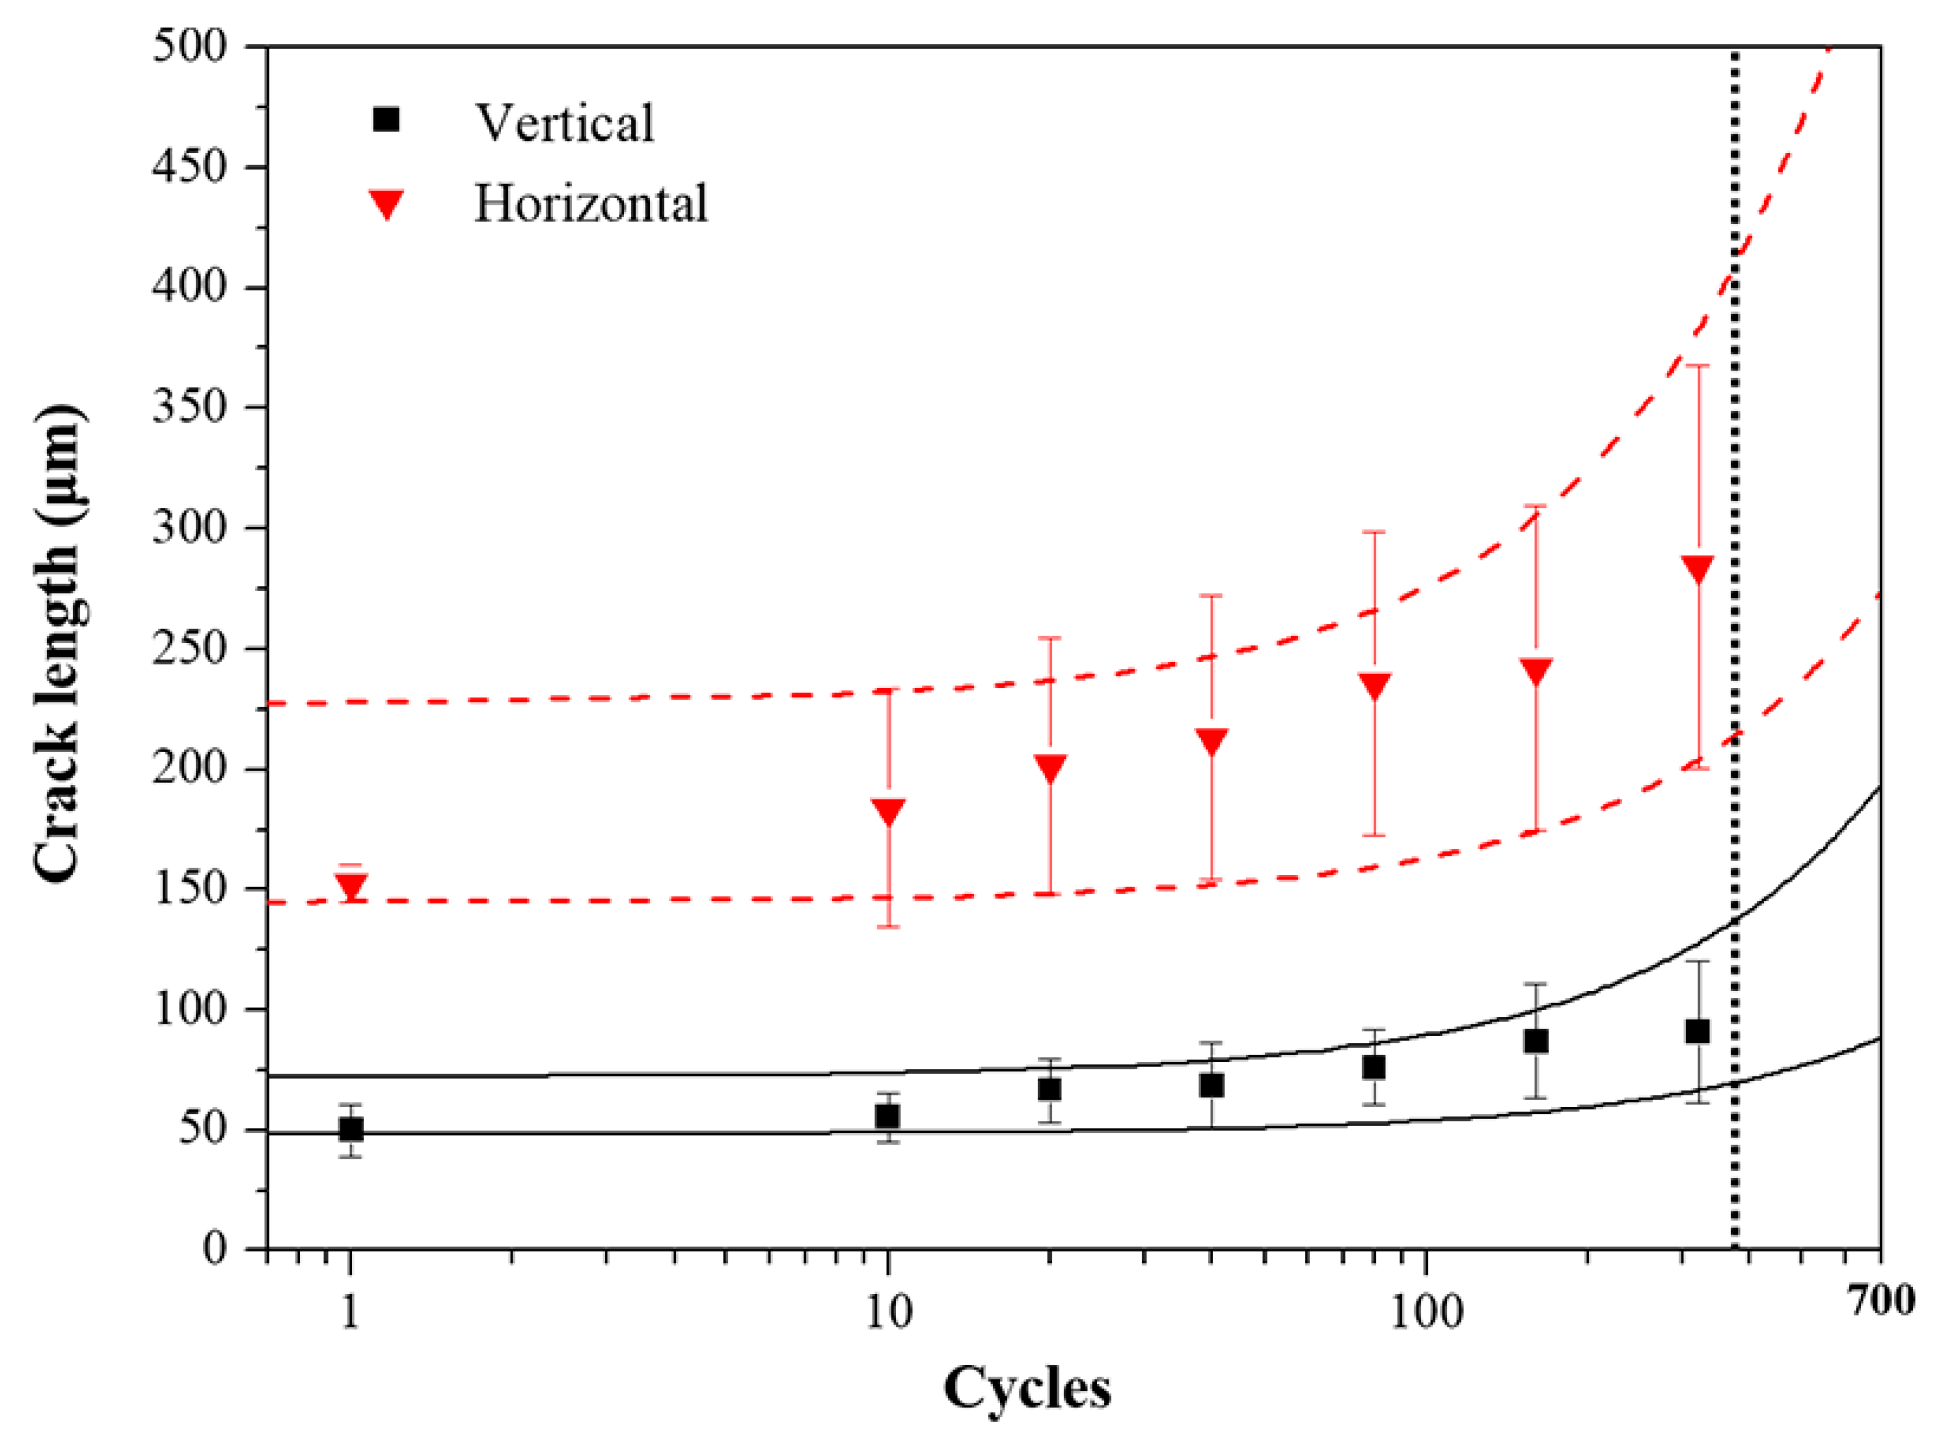
4.2. Crack Propagation

Crack coalescence and increase of crack dimension due to the damage accumulation from thermal stress were detected during CTF tests, as shown in Figure 4 and Figure 5, respectively, which were observed after 320 cycles. The crack length formed on the surface was increased through their linkage, and microstructural degradation was observed, including defects such as pores and small cracks. At the same time, the dimension of the surface crack was increased during the CTF tests about 20–100 μm, showing degraded surface microstructure.
The crack-growth behavior on the cross section during CTF tests is shown in Figure 6. The cracks formed in the direction vertical to the interface did not grow compared with the horizontal crack, while crack coalescence and thickening were observed in the horizontal crack with an undulating shape. Overall, the microstructure was degraded after the CTF tests, showing increased defects, such as pores and small cracks.

4.3. Crack Growth to Failure

The crack-growth behavior on the surface is shown in Figure 7 and Figure 8 with cycle during CTF tests. The crack lengths were measured through SEM images after 10, 20, 40, 80, 160, and 320 cycles. The dotted and solid curves are empirical data fits for each crack length grown during CTF tests for the initial cracks formed by 30 and 50 N, respectively. The vertical dotted and solid lines indicate the average failure cycle number in the CTF tests, respectively, indicating that the nominal numbers of cycles to failure for each TBC with cracks formed by 30 and 50 N were 593 and 460 cycles, respectively. The crack-growth behavior showed a similar trend with the number of cycles, independent of initial crack length. The nominal difference of crack length with applied load was changed from 20 μm in the initial stage to 50 μm after 320 cycles between 30 and 50 N, with linear slopes of 0.37 ± 0.16 and 0.41 ± 0.17, respectively. In the failure point, each of the computed crack lengths were about 189–392 and 244–381 μm for 30 and 50 N, respectively.
On the other hand, comparable crack-growth behavior for the initial cracks formed by 30 N on the cross section is shown in Figure 8, displaying longer crack lengths in the horizontal direction. The dotted and solid curves are empirical data fits for the horizontal and vertical cracks, respectively, grown during the CTF tests. The dotted vertical line indicates average cycles for TBC failure in CTF tests, with 396 cycles. The nominal difference in the initial lengths between the horizontal and vertical cracks gap was about 100 μm with linear slopes of 0.15 ± 0.08 and 0.52 ± 0.21, respectively, and the gap was increased to about 180 μm after 320 cycles. Each crack length in the failure could be expected to be about 217–419 and 70–141 μm on the cross section for the horizontal and vertical cracks, respectively.

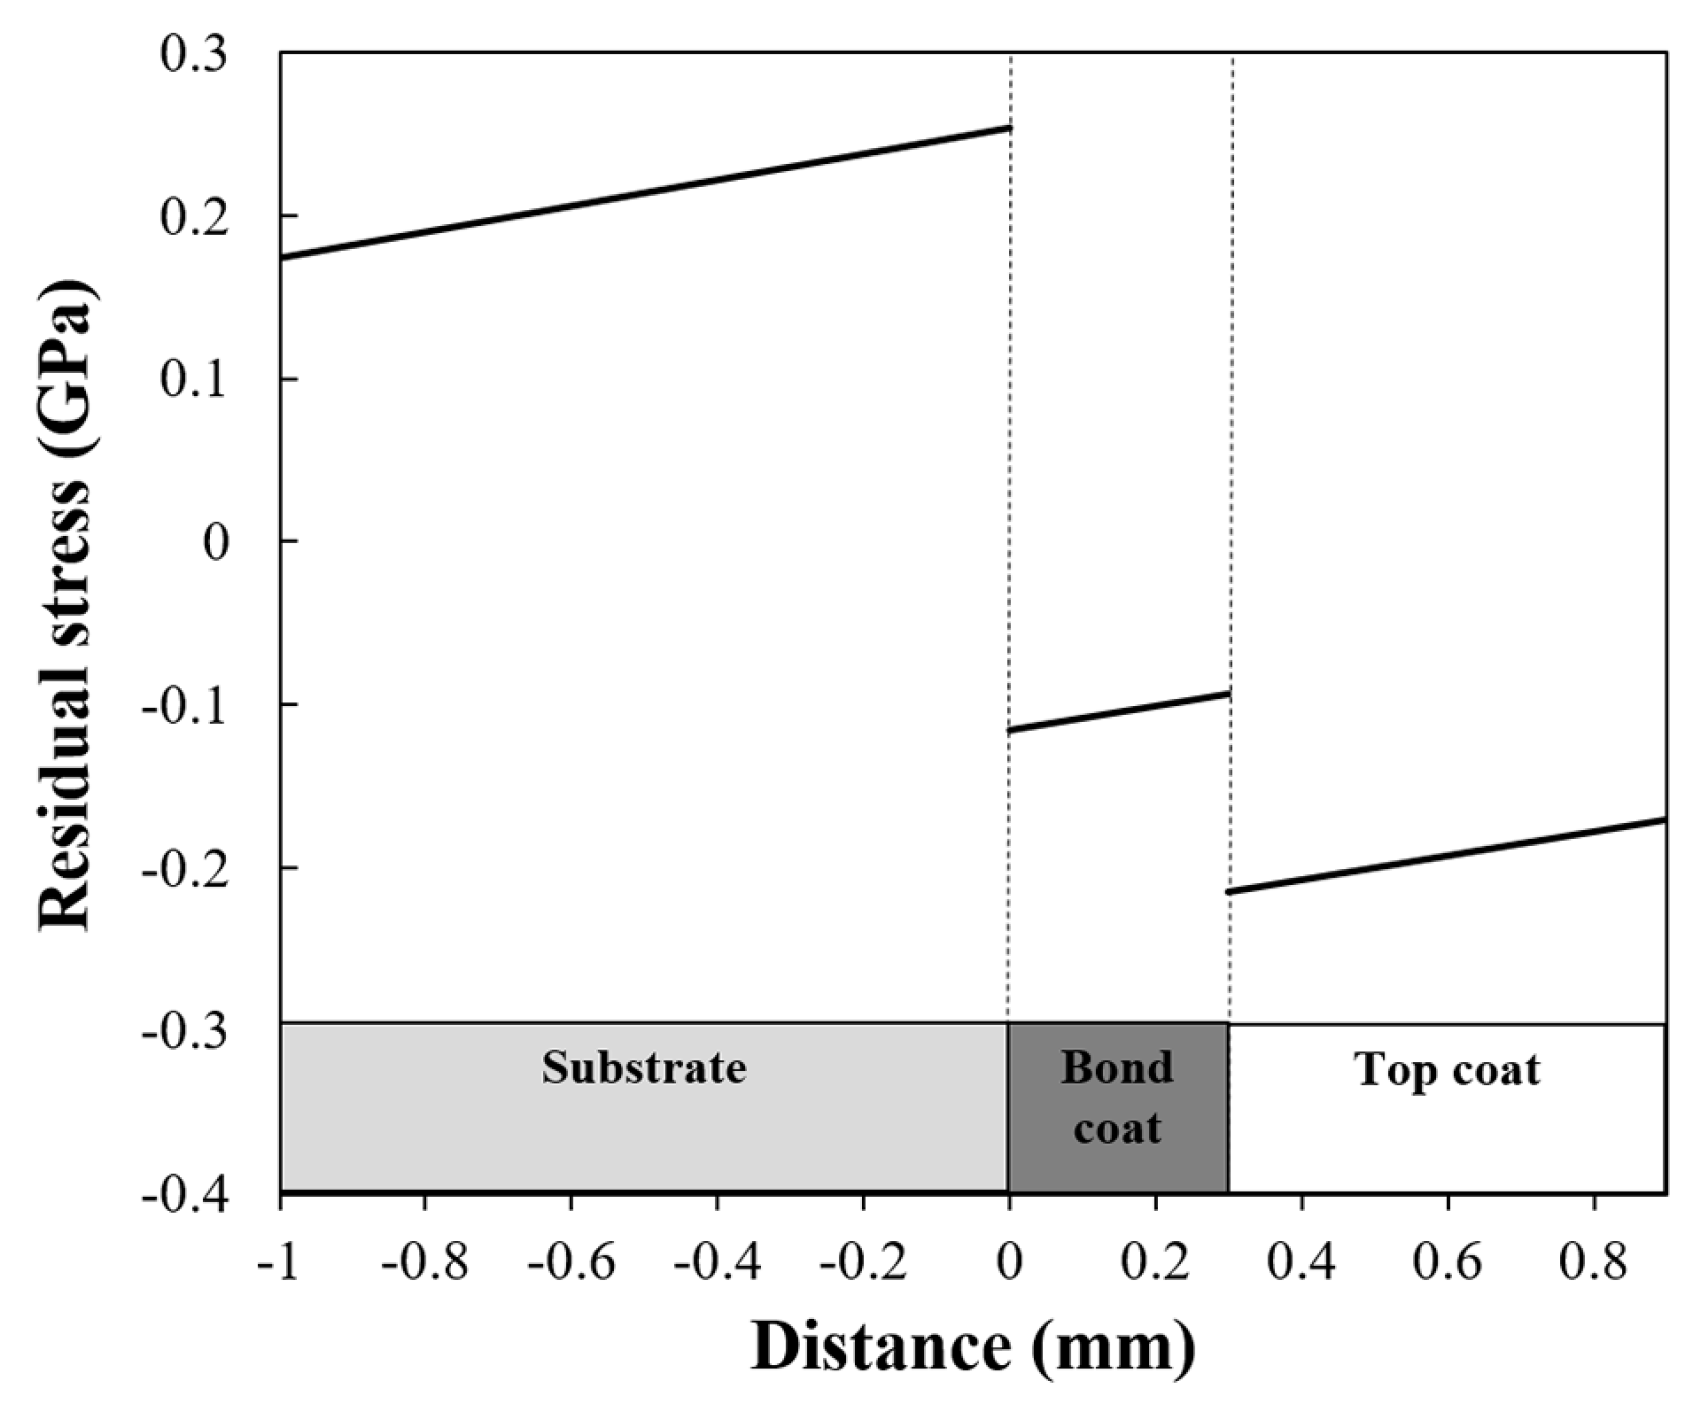
4.4. Modeling of Residual Stress Distribution and Fatigue Crack-Growth Behavior

The calculated residual stress distribution in the TBC sample is shown in Figure 9. As shown in the figure, in the top coat 8YSZ layer, there was extensive compressive residual stress, with maximum stress on the top coat interface. Similar to the results shown in Figure 7 and Figure 8, the crack lengths in decreasing order were 30 N in the horizontal direction of cross section > 50 N on surface > 30 N on surface > 30 N in the vertical direction of the cross section.

5. Discussion

5.1. Crack Initiation Behavior

Typical microstructures of YSZ-based APS-TBCs were observed on both the surface and cross section with some defects, such as pores, splat boundaries, and cracks, as shown in Figure 1 and Figure 2. The cracks connected with the rhombus-shaped imprints suggest that the induced crack formation was initiated from the angular points as well as the edge of the imprints during the indentation loading procedure. Moreover, the embedded defects, such as pores, can obstruct the formation of the cracks, but cracks beyond the defects were occasionally observed in both cases. However, the cracks on the surface and cross section are induced by different mechanisms, as it can be seen from microstructural images. On the surface, the imprint size and crack length were determined by the loading level regardless of the direction. However, the direction of the crack is a crucial factor in determining the crack length in the cross section. The vertical crack length was less than half of the horizontal crack length, indicating that the vertical crack is more difficult to form than the horizontal crack in cross section. This is because of the intrinsic characteristics of the APS deposition method. During APS deposition, the instantaneously-melted feedstock powder is sprayed onto the substrate from the perpendicular direction of the interface, resulting in horizontal splat boundaries, which are an obstacle to the formation of the vertical cracks. Meanwhile, the horizontal cracks are formed more easily along the horizontal splat boundaries as intergranular cracks. Consequently, three-times-longer crack length and undulating shape were observed in the horizontal direction on the cross section, as shown in Figure 3.
Basically, typical APS-TBCs contain some defects randomly, so a broad deviation of the initial crack length is observed in just one imprint. Moreover, a larger variation is obtained depending on the indented area, even when the same loading is imposed. However, on the cross section the crack lengths are almost identical regardless of the direction. In the case of surface cracks, the indentation load was imposed perpendicularly to the splat boundary surface. By contrast, the indentation load was parallel to the splat boundary surface on the cross section where in-plane tensile stress is included when the feedstock is cooled after splat [36]. This leads to a detachment of coatings through relatively easy crack growth in the horizontal direction during CTF tests.

5.2. Crack-Growth Behavior

In the APS-TBC system, the crack propagation is continued through linkage and coalescence of microcracks and discontinuities due to damage evolution during temperature change [9,37]. The surface crack-growth behavior was found to be similar regardless of the loading level. As shown in Figure 4, the surface cracks were coalesced because of thermal stresses and propagated through existing defects, such as pores, splat boundaries, and small cracks. Macroscopically, the crack thickness was enlarged because of repeating thermal expansion and contraction, resulting in partial spalling on the surface with the lengthened and thickened cracks. On the other hand, the crack-growth behavior on the cross section depended on the direction to the interface, as shown in Figure 6. Vertical cracks were almost never generated and grown up in the perpendicular direction to most of the splat boundaries, showing a slight increase in thickness. However, horizontal cracks grew through the linkage among existing splat boundaries and pores, which have stresses and low bonding energy, observed in the shape of undulations; this can be evidence of intergranular fracture [38]. In this study, the descriptive crack-growth behavior of conventional APS-TBCs was mainly investigated through thermal cycling tests. The crack-growth behavior based on the porosity and mechanical properties will be further studied as a future work.

5.3. Threshold Crack Length for Failure

The crack-growth behavior on the surface with the number of cycles in CTF tests was similar with loading level and direction, showing similar linear slope and calculated crack length ranges of 189–392 and 244–381 μm for 30 and 50 N at the failure point, respectively. On the other hand, the crack-growth behavior on the cross section was considerably different from that on the surface. As explained previously, the formation of vertical cracks was inhibited by the splat boundaries, while horizontal cracks were formed with relative ease. During CTF tests, the nominal difference of crack length starting at about 100 μm increased to about 180 μm after 320 cycles on the cross section, expecting calculated crack lengths of 70–141 and 217–419 μm for the vertical and horizontal cracks at the failure point, respectively. This is because of the originally imposed stresses during coating formation, paving a path along which cracks can grow more easily. Eventually, the threshold crack length can be considered as suggested above in cyclic thermal exposure conditions, especially in typical YSZ-based TBC systems. Thus, the probability of coating failure will be higher and coating reliability is reduced when cracks increase larger than the threshold crack length.
Even when the same load of 30 N was imposed on the surface and cross section, more rapid crack growth was observed in the horizontal crack on the cross section. This can be explained by the following argument. First, the inherent microstructure affects the crack propagation behavior, showing a kind of lamellar structure of splats. The other is thermal stresses during the CTF tests. During the CTF test, the stress is caused by CTE mismatch between the top and bond coats (CTEs of 8YSZ: 10.7 × 17.5 × 10−6 K−1, bond coat: 17.5 × 10⁻⁶ K−1) [7,39]. The surface cracks are positioned above the top coat with a thickness of 600 μm, while the cross-section cracks are located just above the interface between top and bond coats. Greater stresses are imposed on the horizontal crack of the cross section in the repeated heating and cooling, and the cracks on the surface suffer comparatively weak stresses.

5.4. Modeling of Residual Stress Distribution and Fatigue Crack-Growth Behavior

As shown in Figure 9, higher residual tensile stress existed on the surface of the 8YSZ top coat than in the middle of the coating. This stress distribution explains the experimentally-observed crack length sequence in Figure 7 and Figure 8 (i.e., 50 N on surface > 30 N on surface > 30 N in the vertical direction of the cross section). The crack length of 30 N in the horizontal direction of the cross-section case is higher than the above three cases; this is due to the unique splat microstructure formed in the APS process, which is not accounted for in the residual stress model. The residual stress model is isotropic and does not capture the anisotropic feature of TBCs. Tracking the crack-growth behavior within the isotropic dense microstructure shows clear observation rather than the anisotropic porous microstructure, due to the limited contents of defects in dense TBC, such as pores and splat boundaries [22]. TBCs can be reasonably approximated as transversely isotropic materials, where the properties are the same for all directions in the plane, such as along the coating surface, but different from the deposition direction. The horizontal direction in TBCs is the weakest because of splat and void formation during the APS process. This explains why the 30 N in the horizontal direction of the cross-section case has the highest crack-growth length among the four cases.

6. Conclusions

Cyclic thermal exposure tests were conducted for the TBCs with cracks induced by micro-indentation to investigate the crack-growth behavior of YSZ-based APS-TBCs as a function of initial crack position and length. The cracks on the surface grew in a similar trend independent of the loading level, while the cracks formed on the cross section showed a different growth behavior with respect to the direction to the interface between top and bond coats. Crack thickening and coalescence were observed together with crack growth during cyclic thermal exposure. The surface showed threshold crack lengths with ranges of 189–392 and 244–381 μm for the 30 and 50 N loads at the failure point, respectively, and the cross section with cracks formed by 30 N was 70–141 and 217–419 μm for the vertical and horizontal cracks, respectively. Therefore, failure criteria in the TBC systems can be proposed in view of crack length on both the surface and cross section.

Author Contributions

Conceptualization, D.S., T.S., and Y.-G.J.; Methodology, D.S., T.S., G.L., Y.-G.J., and J.Z.; Software, J.Z.; Formal Analysis, D.S., and G.L.; Investigation, D.S., T.S., G.L., Y.-G.J., B.-G.C., I.-S.K., and J.Z.; Writing—Original Draft Preparation, D.S.; Writing—Review and Editing, D.S., T.S., U.P., Y.-G.J., B.-G.C., I.-S.K., and J.Z.; Supervision, T.S., U.P., and Y.-G.J.; Project Administration, T.S., U.P., and Y.-G.J.; Funding Acquisition, T.S., U.P., and Y.-G.J.

Funding

This research was funded by “Human Resources Program in Energy Technology“ (No. 20194030202450) and “Power Generation and Electricity Delivery grant” (No. 20181110100310) of the Korea Institute of Energy Technology Evaluation and Planning (KETEP), a granted financial resource from the Ministry of Trade, Industry, and Energy, Korea, and by the Fundamental Research Program of the Korean Institute of Materials Science (KIMS, No. PNK5620).

Conflicts of Interest

The authors declare no conflicts of interest.

References

  1. Clarke, D.; Levi, C. Materials design for the next generation thermal barrier coatings. Annu. Rev. Mater. Res. 2003, 33, 383–417. [Google Scholar] [CrossRef]
  2. Evans, A.G.; Mumm, D.; Hutchinson, J.; Meier, G.; Pettit, F. Mechanisms controlling the durability of thermal barrier coatings. Prog. Mater. Sci. 2001, 46, 505–553. [Google Scholar] [CrossRef]
  3. Miller, R.A. Current status of thermal barrier coatings—An overview. Surf. Coat. Technol. 1987, 30, 1–11. [Google Scholar]
  4. Padture, N.P.; Gell, M.; Jordan, E.H. Thermal barrier coatings for gas-turbine engine applications. Science 2002, 296, 280–284. [Google Scholar] [CrossRef] [PubMed]
  5. Rabiei, A.; Evans, A. Failure mechanisms associated with the thermally grown oxide in plasma-sprayed thermal barrier coatings. Acta Mater. 2000, 48, 3963–3976. [Google Scholar] [CrossRef]
  6. Beshish, G.; Florey, C.; Worzala, F.; Lenling, W. Fracture toughness of thermal spray ceramic coatings determined by the indentation technique. JTST 1993, 2, 35–38. [Google Scholar] [CrossRef]
  7. Cao, X.; Vassen, R.; Stoever, D. Ceramic materials for thermal barrier coatings. J. Eur. Ceram. Soc. 2004, 24, 1–10. [Google Scholar] [CrossRef]
  8. Zhou, Y.; Hashida, T. Thermal fatigue failure induced by delamination in thermal barrier coating. Int. J. Fatigue 2002, 24, 407–417. [Google Scholar] [CrossRef]
  9. Trunova, O.; Beck, T.; Herzog, R.; Steinbrech, R.; Singheiser, L. Damage mechanisms and lifetime behavior of plasma sprayed thermal barrier coating systems for gas turbines—Part I: Experiments. Surf. Coat. Technol. 2008, 202, 5027–5032. [Google Scholar] [CrossRef]
  10. Khan, A.N.; Lu, J. Behavior of air plasma sprayed thermal barrier coatings, subject to intense thermal cycling. Surf. Coat. Technol. 2003, 166, 37–43. [Google Scholar]
  11. Czech, N.; Esser, W.; Schmitz, F. Effect of environment on mechanical properties of coated superalloys and gas turbine blades. Mater. Sci. Technol. 1986, 2, 244–249. [Google Scholar] [CrossRef]
  12. Tamura, M.; Takahashi, M.; Ishii, J.; Suzuki, K.; Sato, M.; Shimomura, K. Multilayered thermal barrier coating for land-based gas turbines. J. Therm. Spray Technol. 1999, 8, 68–72. [Google Scholar]
  13. Wu, B.; Chang, E.; Chang, S.; Chao, C. Thermal cyclic response of yttria-stabilized zirconia/CoNiCrAlY thermal barrier coatings. Thin Solid Films 1989, 172, 185–196. [Google Scholar] [CrossRef]
  14. Miller, R.A.; Lowell, C.E. Failure mechanisms of thermal barrier coatings exposed to elevated temperatures. Thin Solid Films 1982, 95, 265–273. [Google Scholar] [CrossRef] [Green Version]
  15. Schlichting, K.W.; Padture, N.; Jordan, E.; Gell, M. Failure modes in plasma-sprayed thermal barrier coatings. Mater. Sci. Eng. A 2003, 342, 120–130. [Google Scholar]
  16. Tsipas, S.; Golosnoy, I.; Clyne, T.; Damani, R. The effect of a high thermal gradient on sintering and stiffening in the top coat of a thermal barrier coating system. JTST 2004, 13, 370–376. [Google Scholar] [CrossRef]
  17. Zhou, B.; Kokini, K. Effect of surface pre-crack morphology on the fracture of thermal barrier coatings under thermal shock. Acta Mater. 2004, 52, 4189–4197. [Google Scholar] [CrossRef]
  18. Kokini, K.; Takeuchi, Y.; Choules, B. Thermal crack initiation mechanisms on the surface of functionally graded ceramic thermal barrier coatings. Ceram. Int. 1996, 22, 397–401. [Google Scholar] [CrossRef]
  19. Choules, B.D.; Kokini, K.; Taylor, T.A. Thermal fracture of ceramic thermal barrier coatings under high heat flux with time-dependent behavior.: Part 1. Experimental results. Mater. Sci. Eng. A 2001, 299, 296–304. [Google Scholar]
  20. Choules, B.; Kokini, K.; Taylor, T. Thermal fracture of thermal barrier coatings in a high heat flux environment. Surf. Coat. Technol. 1998, 106, 23–29. [Google Scholar] [CrossRef]
  21. Hutchinson, J.; Evans, A. On the delamination of thermal barrier coatings in a thermal gradient. Surf. Coat. Technol. 2002, 149, 179–184. [Google Scholar]
  22. Donohue, E.M.; Philips, N.R.; Begley, M.R.; Levi, C.G. Thermal barrier coating toughness: Measurement and identification of a bridging mechanism enabled by segmented microstructure. Mater. Sci. Eng. A 2013, 564, 324–330. [Google Scholar] [CrossRef]
  23. Dwivedi, G.; Viswanathan, V.; Sampath, S.; Shyam, A.; Lara-Curzio, E. Fracture toughness of plasma-sprayed thermal barrier ceramics: Influence of processing, microstructure, and thermal aging. J. Am. Ceram. Soc. 2014, 97, 2736–2744. [Google Scholar]
  24. Viswanathan, V.; Dwivedi, G.; Sampath, S. Engineered multilayer thermal barrier coatings for enhanced durability and functional performance. J. Am. Ceram. Soc. 2014, 97, 2770–2778. [Google Scholar] [CrossRef]
  25. Viswanathan, V.; Dwivedi, G.; Sampath, S. Multilayer, multimaterial thermal barrier coating systems: Design, synthesis, and performance assessment. J. Am. Ceram. Soc. 2015, 98, 1769–1777. [Google Scholar] [CrossRef]
  26. Levi, C.G. Emerging materials and processes for thermal barrier systems. Curr. Opin. Solid State Mater. Sci. 2004, 8, 77–91. [Google Scholar] [CrossRef]
  27. Jordan, E.H.; Xie, L.; Gell, M.; Padture, N.; Cetegen, B.; Ozturk, A.; Ma, X.; Roth, J.; Xiao, T.; Bryant, P. Superior thermal barrier coatings using solution precursor plasma spray. J. Therm. Spray Technol. 2004, 13, 57–65. [Google Scholar]
  28. VanEvery, K.; Krane, M.J.; Trice, R.W.; Wang, H.; Porter, W.; Besser, M.; Sordelet, D.; Ilavsky, J.; Almer, J. Column formation in suspension plasma-sprayed coatings and resultant thermal properties. J. Therm. Spray Technol. 2011, 20, 817–828. [Google Scholar] [CrossRef]
  29. Seshadri, R.C.; Dwivedi, G.; Viswanathan, V.; Sampath, S. Characterizing suspension plasma spray coating formation dynamics through curvature measurements. J. Therm. Spray Technol. 2016, 25, 1666–1683. [Google Scholar]
  30. Guo, X.; Lu, Z.; Jung, Y.-G.; Li, L.; Knapp, J.; Zhang, J. Thermal property, thermal shock and thermal cycling behavior of lanthanum zirconate based thermal barrier coatings. Metall. Mater. Trans. E 2016, 3, 64–70. [Google Scholar] [CrossRef]
  31. Zhang, J.; Guo, X.; Jung, Y.-G.; Li, L.; Knapp, J. Lanthanum zirconate based thermal barrier coatings: A review. Surf. Coat. Technol. 2016, 323, 18–29. [Google Scholar] [CrossRef] [Green Version]
  32. Hsueh, C.H. Thermal stresses in elastic multilayer systems. Thin Solid Films 2002, 418, 182–188. [Google Scholar] [CrossRef]
  33. Zhang, X.; Xu, B.; Wang, H.; Wu, Y. An analytical model for predicting thermal residual stresses in multilayer coating systems. Thin Solid Films 2005, 488, 274–282. [Google Scholar] [CrossRef]
  34. Townsend, P.H.; Barnett, D.M.; Brunner, T.A. Elastic relationships in layered composite media with approximation for the case of thin films on a thick substrate. J. Appl. Phys. 1987, 62, 4438–4444. [Google Scholar] [CrossRef]
  35. Tsui, Y.C.; Clyne, T.W. An analytical model for predicting residual stresses in progressively deposited coatings Part 1: Planar geometry. Thin Solid Films 1997, 306, 23–33. [Google Scholar] [CrossRef]
  36. Xie, L.; Chen, D.; Jordan, E.H.; Ozturk, A.; Wu, F.; Ma, X.; Cetegen, B.M.; Gell, M. Formation of vertical cracks in solution-precursor plasma-sprayed thermal barrier coatings. Surf. Coat. Technol. 2006, 201, 1058–1064. [Google Scholar] [CrossRef]
  37. Chen, W.; Wu, X.; Dudzinski, D. Influence of thermal cycle frequency on the TGO growth and cracking behaviors of an APS-TBC. J. Therm. Spray Technol. 2012, 21, 1294–1299. [Google Scholar] [CrossRef]
  38. Liang, B.; Ding, C. Thermal shock resistances of nanostructured and conventional zirconia coatings deposited by atmospheric plasma spraying. Surf. Coat. Technol. 2005, 197, 185–192. [Google Scholar] [CrossRef]
  39. Vaßen, R.; Kerkhoff, G.; Stöver, D. Development of a micromechanical life prediction model for plasma sprayed thermal barrier coatings. Mater. Sci. Eng. A 2001, 303, 100–109. [Google Scholar] [CrossRef]
Figure 1. Surface images of Thermal Barrier Coatings (TBCs) with cracks induced by indentation: (A) 30 N and (B) 50 N.
Coatings 09 00365 g001
Figure 2. Cross-sectional images of TBCs with cracks induced by an indentation load of 30 N: (A) as-prepared image; (B) image of crack generation; and (C) highly-magnified image of the boxed area.
Coatings 09 00365 g002
Figure 3. Crack lengths measured on the surface and cross-sectional images before cyclic thermal fatigue (CTF) tests.
Coatings 09 00365 g003
Figure 4. Surface crack-growth behavior during CTF tests: (A) as-prepared crack and (B) crack grown after 320 cycles.
Coatings 09 00365 g004
Figure 5. Surface crack thickening during CTF tests: (A) as-prepared crack and (B) thickened crack after 320 cycles.
Coatings 09 00365 g005
Figure 6. Crack-growth behavior on the cross section during CTF tests: (A) vertical crack and (B) horizontal crack. Each number indicates crack images: (1) before test and (2) after 320 cycles.
Coatings 09 00365 g006
Figure 7. Variation of crack length on the surface during CTF tests. Dotted and solid curves indicate empirical data fits for 30 and 50 N, respectively. Dotted and solid vertical lines are the failure cycles of TBCs with cracks formed by 30 and 50 N, respectively.
Coatings 09 00365 g007
Figure 8. Variation of crack length on the cross section during CTF tests. Dotted and solid curves indicate empirical data fits for the horizontal and vertical cracks, respectively. The dotted vertical line is the failure cycles of TBCs with cracks formed by 30 N.
Coatings 09 00365 g008
Figure 9. Calculated residual stress distribution in the TBC sample.
Coatings 09 00365 g009
Table 1. Parameters of air plasma spraying.
ParameterGun TypeCurrent (A)Primary Gas, Ar (L/min)Secondary Gas, H2 (L/min)Powder Feed Rate (g/min)Spray Distance (mm)Gun Speed (mm/s)Turn Table Speed (mm/s)
Top coatMETCO-3MB48023.65.6408041300
Bond coatMETCO-3MB42028.35.6308041300

