Abstract
Amorphous TiO2 thin films were respectively annealed by 13.56 MHz radio frequency (RF) atmospheric pressure plasma at discharge powers of 40, 60, 80 W and thermal treatment at its corresponding substrate temperature (Ts). Ts was estimated through three measurement methods (thermocouple, Newton’s law of cooling and OH optical emission spectra simulation) and showed identically close results of 196, 264 and 322 °C, respectively. Comparing with thermal annealing, this RF atmospheric pressure plasma annealing process has obvious effects in improving crystallization of the amorphous films, based on the XRD and Raman analysis of the film. Amorphous TiO2 film can be changed to anatase film at about 264 °C of Ts for 30 min plasma treatment, while it almost remains amorphous after 322 °C thermal treatment for the same time.
1. Introduction
Titanium dioxide (TiO2) film has been extensively investigated in the last decades by many researchers. TiO2 is a kind of chemically stable and body-friendly semiconductor material with high refractive index [1], photocatalytic activity [2], and wide-band gap [3]. With these outstanding properties, TiO2 is widely used as a white pigment in paints, toothpastes [4], an antireflection coating [5], photocatalyst in environmental [6,7] and energy field [8,9], and a transport layer in dye-sensitized solar cell [10] and perovskite solar cells [11]. TiO2 has three naturally occurring polymorphs, anatase, brookite, and rutile [1]. Usually, anatase requires a substrate temperature over 450 °C and in excess of 550 °C to prepared rutile [12]. Anatase has larger band gap (3.2 eV) than that (3.0 eV) of rutile and the photocatalytic activity of anatase is obviously superior to that of rutile [13]. To reduce the crystallization temperature of anatase will broaden the application field of the TiO2.
RF plasma treatment has been developed to prepare anatase TiO2 film at low temperature [14,15,16]. The amorphous TiO2 film turn to anatase even at room temperature [14]. However, the treatment processes usually needs vacuum system.
Atmospheric pressure plasma is widely studied for a continuous process with reducing equipment and handling cost [17,18]. The synergistic effect of plasma deposition and substrate temperature in improving the crystallization of TiO2 film through atmospheric pressure kHz plasma has been found and studied in our previous work [19].
In this paper, we have investigated the crystallization process of amorphous TiO2 film annealed by RF atmospheric pressure plasma and its corresponding Ts thermal treatment. Amorphous TiO2 thin films were successfully crystallized through 30 min plasma annealing treatment of 60 W (Ts ~ 264 °C). However, it is found that the films thermally treated with higher temperatures were still amorphous.
2. Materials and Methods
2.1. Thin Films Deposition
The amorphous TiO2 thin films were prepared by atmospheric pressure dielectric barrier discharges (AP-DBD) chemical vapor deposition. The experiment details can be found in our previous work [19]. The flow rates were set as Ar:O2:TiCl4 (carrier gas) = 1000:10:25 (sccm). The temperature during deposition was not more than 50 °C. The deposition time was 30 min. Quartz were used as substrates in the thin film deposition. The deposited TiO2 thin films are amorphous and used as original samples. The thicknesses of the films are about 105 µm.
2.2. Plasma Treatment
A RF Generator (13.56 MHz, RF-10S/PWT, Advanced Energy, Fort Collins, CO, USA) was used as power source in plasma annealing. The discharge chamber was made by quartz and the chamber wall is 1 mm thick. The discharge gap is 2 mm. The films have been treated separately at three discharge power: 40, 60 and 80 W. Ar with the flow rate of 500 sccm was used as the treatment gas. The treatment time is 30 min. The waveforms of applied voltage and discharge current were measured by wideband voltage probes (Tektronix P5100, Beaverton, OR, USA) and wideband current probes (Pearson 2877, London, UK), and recorded on a digital oscilloscope (Tektronix DPO 4101). Optical emission spectra of the RF plasma were investigated by an optical emission spectrometry (OES, Avantes Avaspec-2048tec, Apeldoorn, The Netherlands). The schematic of the experimental setup is shown in Figure 1.
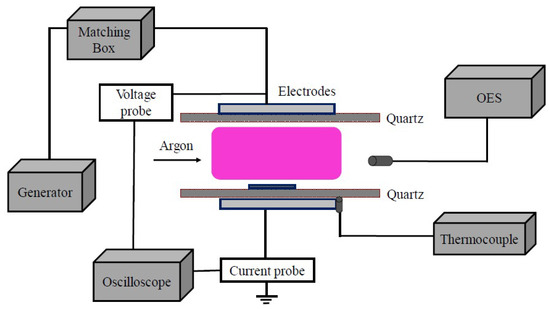
Figure 1.
Schematic RF plasma treatment experimental set up.
2.3. Temperature Measurement during Plasma Annealing
Three test methods were used to estimate the substrate temperature during the discharge. (a) As shown in Figure 1, a thermocouple (TES1310, Taipei, Taiwan) was set between the bottom electrode and the chamber, where it is assumed the temperature is close to the substrate temperature during the plasma treatment. (b) After plasma treating, the temperature of the bottom electrode will decrease with time. By recording this temperature decreasing with time and using Newton’s law of cooling, the original temperature of the electrode was calculated. (c) The gas temperature at different discharge powers is simulated by OH peak of the plasma OES.
2.4. Heating Treatment
The TiO2 films were heated in the same chamber with same Ar flow rate as plasma treatment. The heating temperatures were set following the temperatures of different power discharges. The treatment was 30 min as plasma treatment.
2.5. Thin Films Analysis
The samples were characterized by powder X-ray diffraction (XRD, Tokyo, Japan) measurements recorded with a Rigaku D/max-2550 PC X-ray diffractometer with a rotating anode and a Cu Ka radiation source (λ = 1.54056 Å). Raman measurement was carried out using a Raman spectroscopy (Renishaw inVia-Reflex, Wotton-under-Edge, UK). The power of the laser was 5 mW, and the laser excitation was 532 nm. Scans were taken on an extended range (100–800 cm−1). The morphology of the obtained samples (original and P3) were determined with a field emission scanning electron microscope (FESEM, Hitachi, S-4800, Tokyo, Japan).
Methylene blue (MB, Sigma-Aldrich, St. Louis, MO, USA) was employed as dye to evaluate the photocatalytic activity of the films. The samples were settled in 20 mL of 5 mg/L MB aqueous solution. The quartz container with the sample and solution was placed on a magnetic stirrer plate (Leici JB-1, Shanghai Leici Co., Ltd, Shanghai, China) and a stirrer bar placed in the solution. The photocatalytic reaction was conducted at room temperature under UV light (PLS-SXE300UV, Beijing Perfectlight Co., Ltd, Beijing, China). It provided 6.6 W ultraviolet light. The distance between the lamp and the base of the container was 1 m. The decomposition of MB was monitored by measuring the absorbance of the aliquot solution using the UV-vis spectrophotometer (Shimadzu UV-2600, Kyoto, Japan) in liquid cuvette with deionized water as reference. The concentration of the MB solution was measured every 30 min.
3. Results and Discussion
3.1. I-V Curve and OES Test of the Discharge
Figure 2a shows the voltage and current waveforms of argon RF discharge of 80 W. The input peak-to-peak voltage (Vp-p) is about 1800 V, and the input peak-to-peak current (Cp-p) is about 0.44 A. The Vp-p and Cp-p of different treatment powers are shown in Table 1.
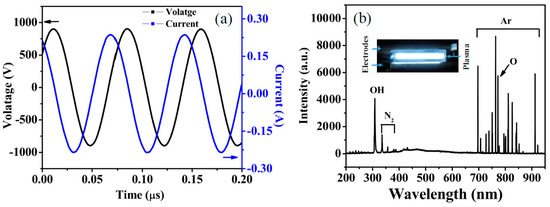
Figure 2.
(a) Voltage and current waveforms of argon RF discharge of 80 W; (b) OES spectrum of argon RF discharge.

Table 1.
The input voltage and current of different discharge powers.
The OES of the 80 W RF plasma is shown in Figure 2b. The inset is the discharge photograph. The Ar (671.8 nm), Ar (723 nm) and other typical emission lines are shown out. Since the discharge is in atmospheric pressure, OH (309 nm) [20], N2 (337.1, 357.7, 371.1 nm) [21] and O (777.1 nm) [22] are also shown out in the plasma.
3.2. Temperature Measured
Since temperature of discharge has great influence on crystallization and it is not easy to get the accurate substrate temperature during the plasma discharge. Three methods were employed to estimate the substrate temperature during plasma treatment at different discharge powers.
3.2.1. Thermocouple
By using thermocouple, the temperature of the bottom of chamber (Tc) is about 322 °C. And the temperatures measured at 40 and 60 W are 196 and 264 °C and shown in Table 2.
Table 2.
The temperature at different power tested by different methods.
3.2.2. OH Peak Simulation
The OH (309 nm) rotational temperature are usually used to estimate the gas temperature of plasma (Tg) [23]. By using LIFBASE software (version 2.1.1), the OH rotational temperatures at discharge were simulated and the result at 80 W is shown in Figure 3. The simulated result show that the gas temperature was 307 °C. The gas temperature simulated with OH peak by OES (To) at discharge power of 40 and 60 W are 207 and 277 °C and shown in Table 2.
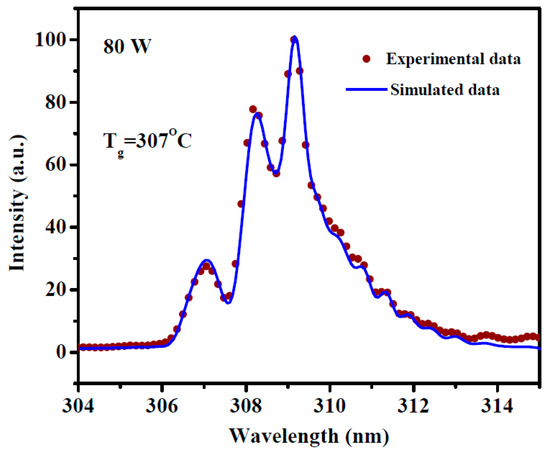
Figure 3.
The simulation of OH (309 nm) rotational temperature with OES of 80 W discharge.
3.2.3. Newton’s Law
Newton’s law of cooling demonstrates exponential cooling curve with time [24]. The electrode temperature changes with time are recorded and shown in Figure 4 until the temperature stabiles. The temperature changes from the beginning 2–39 s were inset in Figure 4 and fitted with Newton’s law of cooling. We got the formula as follows,
where, T is the temperature (°C) and t is time (s). So, extending the curve to t = 0 s, the plasma temperatures at different discharge powers (Tn) are calculated and shown in Table 2.
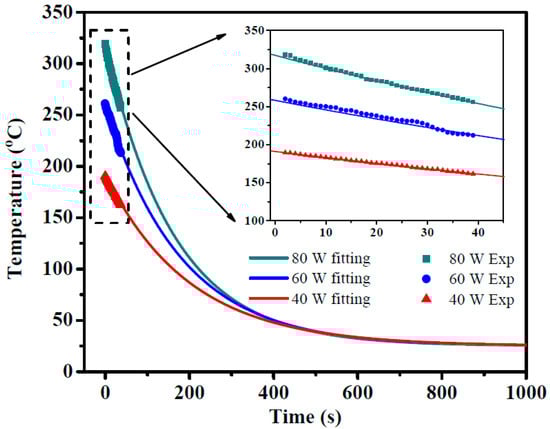
Figure 4.
The temperature of electrode decreasing with time and fitted by Newton’s law of cooling.
The thermocouple test temperature (Tc), gas temperature simulated by OH peak (To) and calculated temperature by Newton’s law of cooling (Tn) are summarized in Table 2. It is displayed Tc, To and Tn are identically close at the same discharge power. They all show increasing trends with the increasing of the discharge power. The highest temperature is assumed not above 322 °C at the highest discharge power of 80 W.
3.3. Thin Film Characterization
In order to compare the effects of thermal or plasma treatment in improving film crystallization, three amorphous films were respectively thermally treated at the same substrate temperature of 196, 264 and 322 °C as at three discharge powers. The same chamber and Ar gas flow rate are used to ensure the consistent treatment conditions, except the plasma discharge is off. The treated conditions and the sample names are given in Table 3.
Table 3.
The sample name and the treatment conditions.
The XRD spectra of samples treated by plasma and heating are respectively shown in Figure 5a,b. The original sample as deposition is amorphous. The XRD spectrum of sample P1 treated by 40 W plasma, in Figure 5a shows weak (101) peak at 2θ values of 25.4°. Sample P2 and P3 show similar XRD pattern. Peaks identified at 2θ values of 25.4°, 38.1°, 48.2° and 53.9°, corresponding to the crystal planes of (101), (004), (200), and (105) respectively, which confirms the crystal phase with the standard XRD pattern of anatase TiO2 (JCPDS files No. 21-1272). Sample H1 (196 °C) and H2 (264 °C) are amorphous, as the XRD spectra shown in Figure 5b. Sample H3 (322 °C) shows weak (101) peak. By comparing above XRD results of the samples respectively treated by plasma and heating, it is indicated that plasma annealing treatment is more effective in promoting the crystallization of amorphous TiO2 film than thermal treatment. Anatase TiO2 film can be obtained by atmospheric pressure RF plasma treatment for only 30 min at temperature of 264 °C.
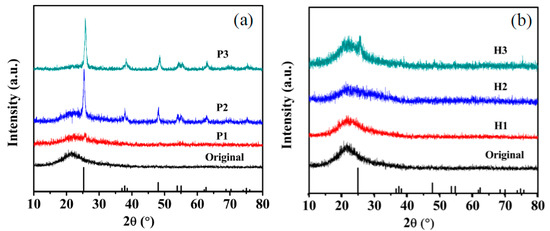
Figure 5.
XRD spectra of (a) plasma treated at different power, (b) heating treated at different temperature.
Raman shift spectra were performed and the results are shown in Figure 6. As shown in Figure 6a, original sample and P1 are amorphous. And P2 and P3 show anatase TiO2 major Raman bands at 144, 197, 399, 515, and 639 cm−1. These bands can be attributed to the five Raman-active modes of anatase phase corresponding to Eg, Eg, A1g, B1g, and Eg, respectively [25]. Figure 6b shows the Raman shift spectra of the samples with a different heating treatment. All the samples are amorphous. The Raman results are in well agreement with the above XRD results.
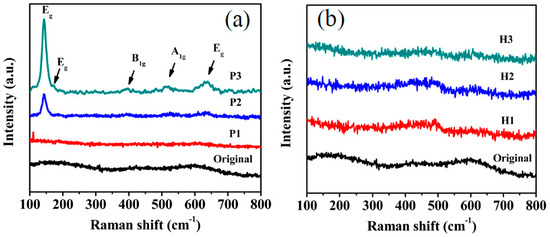
Figure 6.
Raman shift spectra of (a) plasma treated at different power, (b) heating treated at different temperature.
The surface morphology of the original sample and the sample treated by plasma at 80 W were characterized by FE-SEM and shown in Figure 7. The original sample is fluffy. The film is made of small TiO2 particles. No clear outline of the agglomerated particles is presented and the morphology indicates poor connection between the aggregated nanoparticles. Figure 7b,d show the morphology of TiO2 thin film treated by 80 W RF plasma. The surface has been etching by the plasma and columnar TiO2 stand on the substrate. The FE-SEM results show that, the plasma has strong etching effect on amorphous TiO2 thin film.
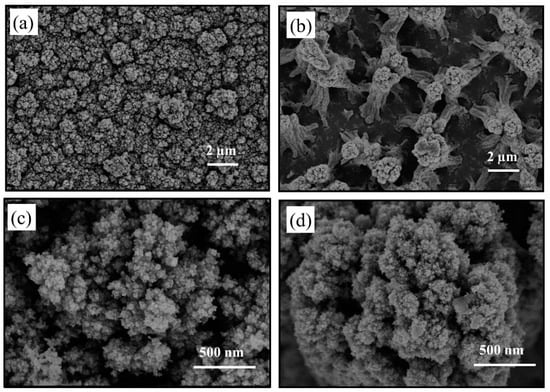
Figure 7.
SEM images of (a) and (c) original sample, (b) and (d) plasma treated sample at 80 W.
The promoting influence of RF atmospheric pressure plasma treatment on the crystallization of amorphous TiO2 film can be attributed to its obvious sheath structure. Plasma positive ions (such as Ar+) are accelerated through plasma sheath and will bombard the film surface directionally during the treatment [26,27]. Previous work has shown that energetic particles bombard the film and induce atomic movement. In general, amorphous phases have higher Gibb’s free energy than crystalline phases. In order to reach a crystalline phase, it must overcome an activation energy barrier. In conventional furnace annealing, this energy barrier is overcome by thermal energy externally supplied. In RF plasma irradiation, however, the initial energy state is activated to a higher energy level as a result of momentum transfer from the plasma, so the activation energy barrier is reduced, as illustrated, and the film is crystallized effectively by the RF plasma irradiation [28]. Both the XRD and Raman results show similar results that the RF plasma treatment enhanced the crystallization of TiO2 film. Anatase TiO2 film was prepared at about 264 °C, which is less than the usual phase change temperature (450 °C) from amorphous to anatase by thermal annealing. So, positive ions and their acceleration through RF plasma sheath is considered to be more effective than randomly moving neutral Ar molecules during only thermal treatment, which improves the plasma crystallization of the amorphous films possibly [29].
Figure 8 shows the photocatalytic activity of the P3 and H3. After 150 min irradiating by UV light, the MB concentration decreases to about 51% by sample P3. Sample H3 shows almost the result with no catalyst. As we know, the anatase shows higher photocatalytic activity than amorphous [30]. However, the photocatalytic is not outstanding comparing with well crystallized TiO2 film [19].
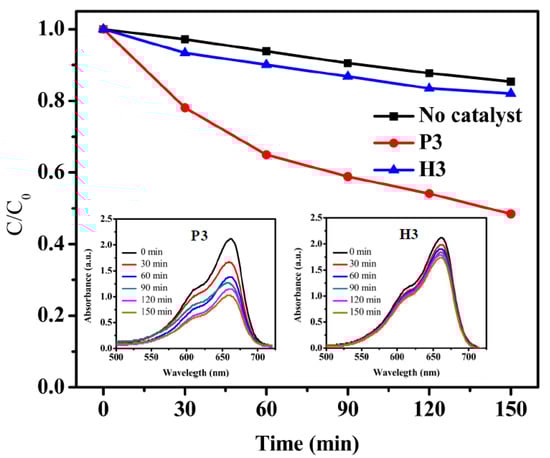
Figure 8.
Results of the photocatalytic degradation of MB under UV irradiation by P3 and H3.
4. Conclusions
This study shows the effects of RF atmospheric pressure plasma treatment and heating annealing in the crystallization of amorphous TiO2 film. Three methods are employed to estimate the substrate temperature Ts during plasma treatment and identically close Tc, To and Tn are obtained. The highest temperature is assumed not above 322 °C at the highest discharge power of 80 W. The amorphous TiO2 samples become to anatase after 60 and 80 W plasma treatment for 30 min (corresponding Ts is 264 and 322 °C). However, the samples remain amorphous after the heating treatment with the same time and temperature. However, the TiO2 film was etched by the plasma treatment and some TiO2 particles have been removed from the film. Atmospheric pressure RF plasma is a prospective method for promoting the crystallization of the amorphous films at low temperature and short time.
Author Contributions
Conceptualization, J.Z. and Y.G.; Methodology, Y.X. and T.H.; Software, Y.Z. and X.H.; Validation, Y.X., J.S. and H.L.; Formal Analysis, J.Z. and K.D.; Investigation, Y.X., and Y.Z.; Resources, Y.X. and Y.G.; Data Curation, Y.X.; Writing—Original Draft Preparation, Y.X.; Writing—Review and Editing, Y.X., Y.G. and J.Z.; Visualization, Y.X.; Supervision, J.Z.; Project Administration, J.Z.; Funding Acquisition, J.Z.
Funding
This research was financially supported by Natural Science Foundation of China (Nos. 11475043, 11875104, 10835004 and 11375042).
Conflicts of Interest
The authors declare no conflict of interest.
References
- Won, D.J.; Wang, C.H.; Jang, H.K.; Choi, D.J. Effects of thermally induced anatase-to-rutile phase transition in MOCVD-grown TiO2 films on structural and optical properties. Appl. Phys. A 2001, 73, 595–600. [Google Scholar] [CrossRef]
- Zarubica, A.; Vasić, M.; Antonijevic, M.D.; Ranpelović, M.; Momčilović, M.; Krstić, J.; Nedeljković, J. Design and photocatalytic ability of ordered mesoporous TiO2 thin films. Mater. Res. Bull. 2014, 57, 146–151. [Google Scholar] [CrossRef]
- Ullattila, S.G.; Periyat, P. A ‘one pot’ gel combustion strategy towards Ti3+ self-doped ‘black’ anatase TiO2−x solar photocatalyst. J. Mater. Chem. A 2016, 4, 5854–5858. [Google Scholar] [CrossRef]
- Yin, Z.F.; Wu, L.; Yang, H.G.; Su, Y.H. Recent progress in biomedical applications of titanium dioxide. Phys. Chem. Chem. Phys. 2013, 15, 4844–4858. [Google Scholar] [CrossRef]
- Gan, W.Y.; Lam, S.W.; Chiang, K.; Amal, R.; Zhao, H.; Brungs, M.P. Novel TiO2 thin film with non-UV activated superwetting and antifogging behaviours. J. Mater. Chem. 2007, 17, 952–954. [Google Scholar] [CrossRef]
- Lee, S.Y.; Park, S.J. TiO2 photocatalyst for water treatment applications. J. Ind. Eng. Chem. 2013, 19, 1761–1769. [Google Scholar] [CrossRef]
- Byrne, J.A.; Eggins, B.R.; Brown, N.M.D.; McKinney, B.; Rouse, M. Immobilisation of TiO2 powder for the treatment of polluted water. Appl. Catal. B Environ. 1998, 17, 25–36. [Google Scholar] [CrossRef]
- Meng, A.; Zhang, J.; Xu, D.; Cheng, B.; Yu, J. Enhanced photocatalytic H2-production activity of anatase TiO2 nanosheet by selectively depositing dual-cocatalysts on {101} and {001} facets. Appl. Catal. B Environ. 2016, 198, 286–294. [Google Scholar] [CrossRef]
- Wang, Z.; Yang, C.; Lin, T.; Yin, H.; Chen, P.; Wan, D.; Xu, F.; Huang, H.; Lin, J.; Xie, X.; et al. Visible-light photocatalytic, solar thermal and photoelectrochemical properties of aluminium-reduced black titania. Energy Environ. Sci. 2013, 6, 3007–3014. [Google Scholar] [CrossRef]
- Lee, K.E.; Gomez, M.A.; Elouatik, S.; Demopoulos, G.P. Further Understanding of the Adsorption Mechanism of N719 Sensitizer on Anatase TiO2 Films for DSSC Applications Using Vibrational Spectroscopy and Confocal Raman Imaging. Langmuir 2010, 26, 9575–9583. [Google Scholar]
- Liu, M.; Johnston, M.B.; Snaith, H.J. Efficient planar heterojunction perovskite solar cells by vapour deposition. Nature 2013, 5, 395–398. [Google Scholar] [CrossRef] [PubMed]
- Hodgkinson, J.L.; Sheel, D.W. Advances in atmospheric pressure PECVD: The influence of plasma parameters on film morphology. Surf. Coat. Technol. 2013, 230, 73–76. [Google Scholar] [CrossRef]
- Zhang, J.; Zhou, P.; Liu, J.; Yu, J. New understanding of the difference of photocatalytic activity among anatase, rutile and brookite TiO2. Phys. Chem. Chem. Phys. 2014, 16, 20382–20386. [Google Scholar] [CrossRef]
- Ohsaki, H.; Shibayama, Y.; Yoshida, N.; Watanabe, T.; Kanemaru, S. Room-temperature crystallization of amorphous films by RF plasma treatment. Thin Solid Films 2009, 517, 3092–3095. [Google Scholar] [CrossRef]
- Ohsaki, H.; Suzuki, M.; Shibayama, Y.; Kinbara, A.; Watanabe, T. Room temperature crystallization of indium tin oxide films on glass and polyethylene terephthalate substrates using rf plasma. J. Vac. Sci. Technol. A 2007, 25, 1052–1055. [Google Scholar] [CrossRef]
- Ohsaki, H.; Shibayama, Y.; Nakajim, A.; Kinbara, A.; Watanabe, T. Plasma treatment for crystallization of amorphous thin films. Thin Solid Films 2006, 502, 63–66. [Google Scholar] [CrossRef]
- Massines, F.; Sarra-Bournet, C.; Fanelli, F.; Naudé, N.; Gherardi, N. Atmospheric pressure low temperature direct plasma technology: Status and challenges for thin film deposition. Plasma Process. Polym. 2012, 9, 1041–1073. [Google Scholar] [CrossRef]
- Anand, V.; Nair, A.R.; Shivashankar, S.A.; Rao, G.M. Atmospheric pressure plasma chemical vapor deposition reactor for 100 mm wafers, optimized for minimum contamination at low gas flow rates. Appl. Phys. Lett. 2015, 107, 094103. [Google Scholar] [CrossRef]
- Xu, Y.; Zhang, Y.; Li, L.; Ding, K.; Guo, Y.; Shi, S.; Huang, X.; Zhang, J. Synergistic effect of plasma discharge and substrate temperature in improving the crystallization of TiO2 film by atmospheric pressure plasma enhanced chemical vapor deposition. Plasma Chem. Plasma Process. 2019, 1–11. [Google Scholar] [CrossRef]
- Zhu, W.C.; Li, Q.; Zhu, X.M.; Pu, Y.K. Characteristics of atmospheric pressure plasma jets emerging into ambient air and helium. J. Phys. D Appl. Phys. 2009, 42, 202002. [Google Scholar] [CrossRef]
- Sharma, M.K.; Saikia, B.K.; Phukan, A.; Ganguli, B. Plasma nitriding of austenitic stainless steel in N2 and N2–H2 dc pulsed discharge. Surf. Coat. Technol. 2006, 201, 2407–2413. [Google Scholar] [CrossRef]
- Saloum, S.; Naddaf, M.; Alkhaled, B. Active species characterization in RF remote oxygen plasma using actinometry OES and electrical probes. Vacuum 2010, 85, 439–442. [Google Scholar] [CrossRef]
- Moon, S.Y.; Choe, W. A comparative study of rotational temperatures using diatomic OH, O2 and N2+ molecular spectra emitted from atmospheric plasmas. Spectrochim. Acta Part B 2003, 58, 249–257. [Google Scholar] [CrossRef]
- Vollmer, M. Newton’s law of cooling revisited. Eur. J. Phys. 2009, 30, 1063–1084. [Google Scholar] [CrossRef]
- Choi, H.C.; Jung, Y.M.; Kim, S.B. Size effects in the Raman spectra of TiO2 nano-particles. Vib. Spectrosc. 2005, 37, 33–38. [Google Scholar] [CrossRef]
- Lieberman, M.A.; Lichtenberg, A.J. Principles of Plasma Discharge and Materials Processing; John Wiley & Sons, Inc.: Hoboken, NJ, USA, 2005. [Google Scholar]
- Han, J.; Wang, X.; Wang, N.; Wei, Z.; Yu, G.; Zhou, Z.; Wang, Q. Effect of plasma treatment on hydrophilic properties of TiO2 thin films. Surf. Coat. Technol. 2006, 200, 4876–4878. [Google Scholar] [CrossRef]
- Kang, Y.; Lee, H.; Kang, Y.; Lee, P.S.; Lee, J. Crystallization of lithium cobalt oxide thin films by radio-frequency plasma irradiation. J. Appl. Phys. 2001, 90, 5940. [Google Scholar] [CrossRef]
- Sarra-Bournet, C.; Charles, C.; Boswell, R. Low temperature growth of nanocrystalline TiO2 films with Ar/O2 low-field helicon plasma. Surf. Coat. Technol. 2011, 205, 3939–3946. [Google Scholar] [CrossRef]
- Ohtani, B.; Ogawa, Y.; Nishimoto, S. Photocatalytic activity of amorphous-anatase mixture of Titanium (IV) Oxide particles suspended in aqueous solutions. J. Phys. Chem. B 1997, 101, 3746–3752. [Google Scholar] [CrossRef]
© 2019 by the authors. Licensee MDPI, Basel, Switzerland. This article is an open access article distributed under the terms and conditions of the Creative Commons Attribution (CC BY) license (http://creativecommons.org/licenses/by/4.0/).