


Abstract
Multi-track laser cladding is the primary technology used in industrial applications for surface reinforcement and remanufacturing of broken parts. In this study, the influence of processing parameters on multi-track laser cladding was investigated using a Taguchi orthogonal experimental design. A multi-response grey relational analysis (GRA) was employed to identify laser cladding processing parameters that simultaneously optimize the flatness ratio of the coating and the cladding efficiency. The optimal parameters setting found by GRA were validated experimentally. Results showed that the flatness ratio and cladding efficiency were closely correlated to the overlap rate and laser power, where the overlap rate shows the most significant impact on the flatness ratio and the laser power shows the most significant impact on cladding efficiency. Results from the validation experiment were within one percent (0.97% error) of the predicted value. This demonstrates the benefits of utilizing GRA in laser cladding process optimization. The methods presented in this paper can be used to identify ideal processing parameters for multi-response multi-track laser cladding processes or other industrial applications.
1. Introduction
Laser cladding is an advanced technology used for surface reinforcement and restoration. It creates a condensed coating on the substrate surface, forming a metallurgical bond that improves the substrate properties, such as wear resistance, corrosion resistance, and oxidation resistance [1,2,3,4,5,6,7]. Laser cladding is a complex process, and the quality of the cladding coating is primarily affected by several parameters including laser power, gas flow, and powder feeding rate [7]. A long-term goal for researchers is to develop a system to predict and control the coating quality obtained by laser cladding through the manipulation of different processing parameters. Over the years, various methods have been developed to investigate and analyze these interrelations during the laser cladding process.
Nabhani et al. studied the influence of laser power, scanning rate, and powder feeding rate on the clad height, clad width, penetration depth, wetting angle, and dilution in single-track cladding of Ti-6Al-4V powder alloy deposited on Ti-6Al-4V substrate. The optimal processing parameter combination was obtained by a linear regression analysis of each response [8]. Liu et al. investigated how laser power, pre-placed powder depth, and scanning speed affected the clad width, height, area, and wetting angle using a full factorial design with single-track laser cladding. A mathematical model was proposed to explain the relationship between processing parameters and the aforementioned geometrical characteristics [9]. Kumar et al. researched the influence of laser power, scanning speed, and aluminum nitride composition percentage on the clad width and micro-hardness. A mathematical model was developed to relate the responses and processing parameters. Experimental results indicated that clad width increased with the increasing scanning speed [10]. Bourahima et al. utilized central composite design to study Ni-based powder laser cladding on a Cu–Ni–Al alloy substrate. They evaluated the influence of the processing parameters (laser power, scanning speed, powder feeding rate) on bonding quality and coating geometry (clad width and height). A mathematical model was developed to explain these interrelationships. Results illustrated that coating geometry was negatively correlated with scanning speed and bonding quality was improved with increased scanning speed and decreased powder feeding rate [11]. A high accuracy predictive model was developed by Alam et al. to explain how the clad characteristics (hardness, bead aspect ratio, and wetting angle) were affected by the processing parameters (powder feed rate, laser power, focal length of lens, laser speed, and contact tip to workpiece distance) [12].
Most of these studies were focusing on predicting the optimal processing parameters in single-track laser cladding, which limits the cladding area to a narrow track. Although single track cladding is useful in understanding properties that affect the cladding process, the ability to process a larger area is needed for actual industrial application such as restoration or remanufacturing. For these applications, multi-track cladding is necessary. In multi-track cladding, individual tracks are laid adjacent to one another covering the surface of a component with clads. This process forms an irregular surface with a high region in the center of each track and a lower region between track centers. The goal of this research is to understand the processing parameters that control surface irregularity and to finding processing parameters that produce a cladded surface with minimal irregularity while maintaining cladding efficiency, a crucial requirement for industrial application.
2. Materials and Methods
AISI/SAE 1045 steel was selected as the substrate with a size of 40 mm × 20 mm × 5 mm. The laser beam diameter was set to 3 mm during the cladding process. The cladding powder was high-speed steel powder (W6Mo5Cr4V2) produced by Chengdu Huayin Powder Technology CO., LTD (Chengdu, China) with a particle size ranging from 48 to 106 μm, which met the powder feed specifications in the laser cladding system. The elemental composition of W6Mo5Cr4V2 high-speed steel powder is listed in Table 1.
Table 1.
Elemental composition (wt.%) of W6Mo5Cr4V2 high-speed steel powder.
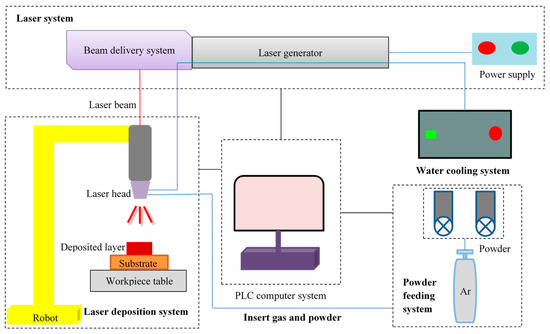
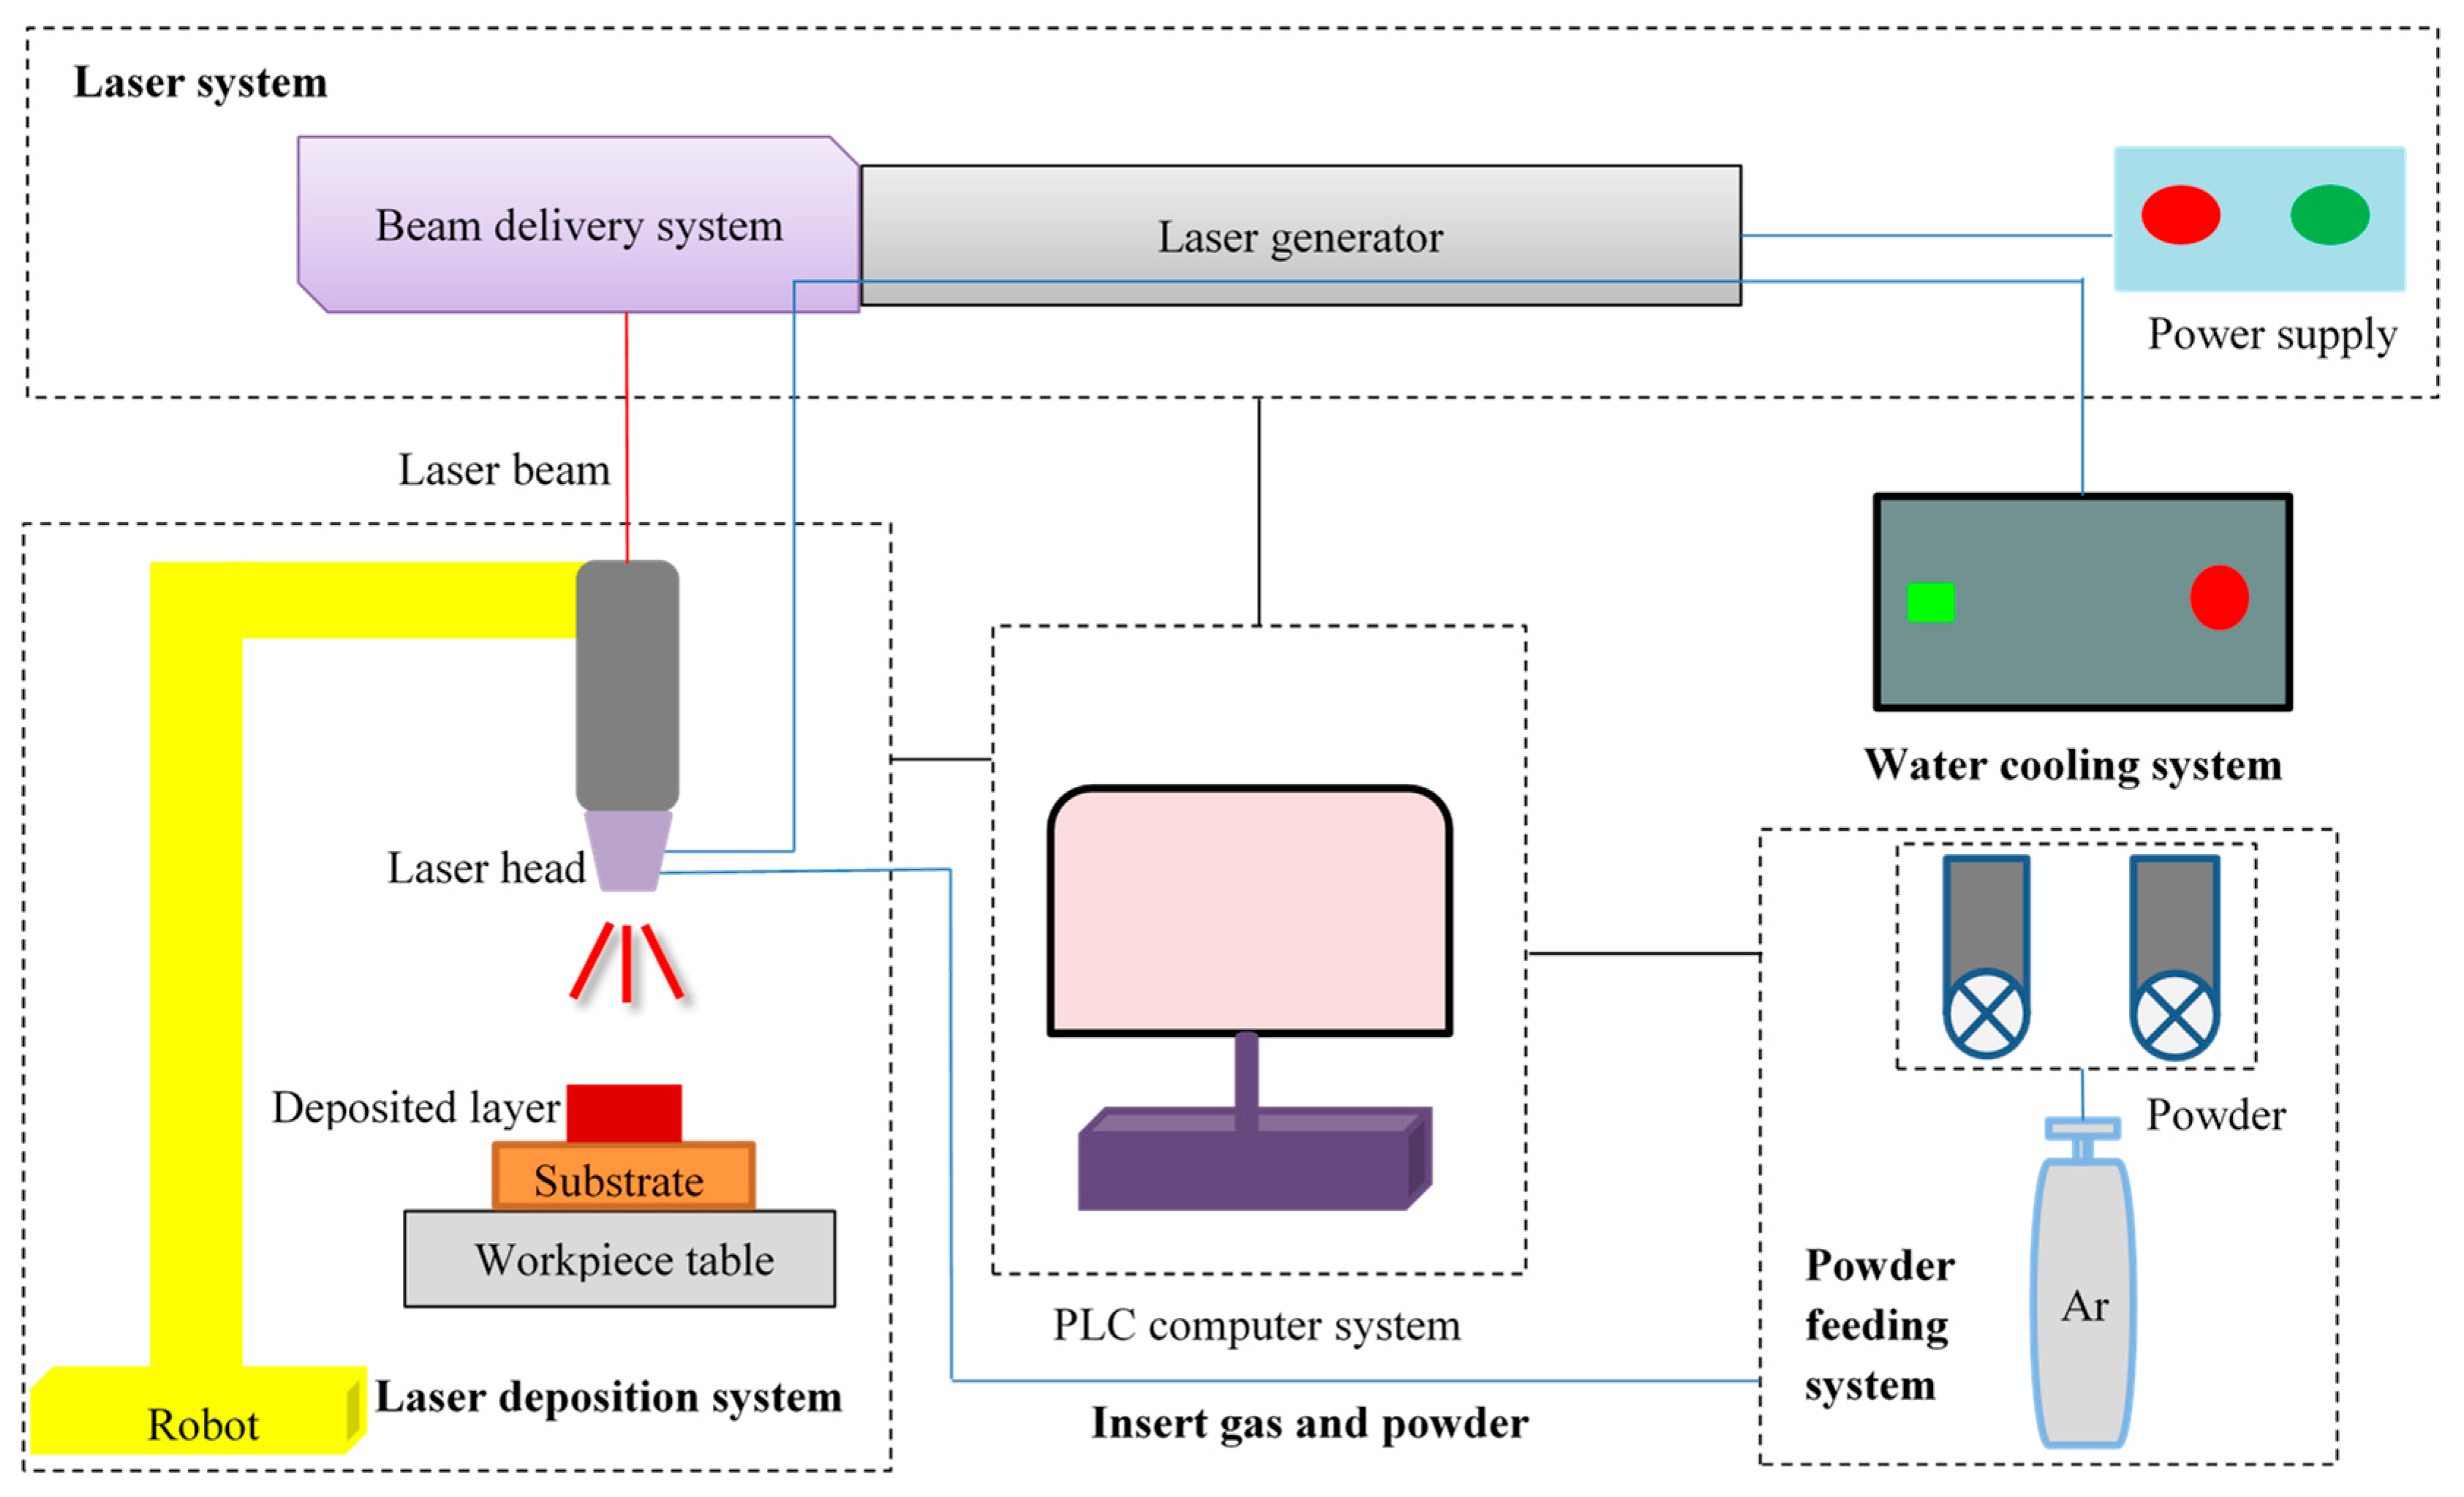
The laser cladding system is shown in Figure 1, which includes a laser system (YLS-3000, IPG, Burbach, Germany), laser cladding nozzle with 300 mm focal length (FDH0273, Lasermech, Novi, MI, USA), industrial robot (M-710iC/50, FANUC, Yamanashi, Japan), water cooling system (TFLW-4000WDR-01-3385, Sanhe Tongfei, Sanhe, China), powder feeding system (CR-PGF-D-2, Songxing, Fuzhou, China), control system (PLC, Mitsubishi, Japan), and laser pulse control system (SX14-012PULSE, IPG, Burbach, Germany). The material was protected by argon gas during the cladding process.
Figure 1.
Laser cladding system.
Before cladding, the surface of the 1045 steel substrate was cleaned with acetone, rinsed with alcohol, and dried. The cladding powder was dried in a vacuum dryer for 30 min at a temperature of 120 °C prior to use. After laser cladding, the sample was prepared for evaluation by cutting, setting, grinding, and polishing. The sample was immersed in a 4% nitric acid and alcohol mixture for 30 s. Geometric characteristics of the clad sample were measured with a KH-1300 3D microscope (Hirox Co Ltd., Tokyo, Japan).
This study utilized Taguchi orthogonal methodology to design the multi-track laser cladding experiment. Four factors were evaluated (laser power, scanning speed, gas flow, overlapping rate). A full factorial experiment would have required 44 = 256 different combinations since there were 4 levels for each factor. By using a Taguchi orthogonal L16 (44) design, only 16 runs were needed, substantially reducing the number of runs over a full factorial experiment [13]. The Taguchi orthogonal array is a balanced design with each factor level weighted equally, so each factor can be evaluated independently. Table 2 shows the factors and their corresponding levels in the Taguchi orthogonal experimental design.
Table 2.
Orthogonal experimental design.
Important responses in this study are the flatness ratio (θ) and cladding efficiency (η). These parameters are expressed by Equations (1) and (2), respectively [14].
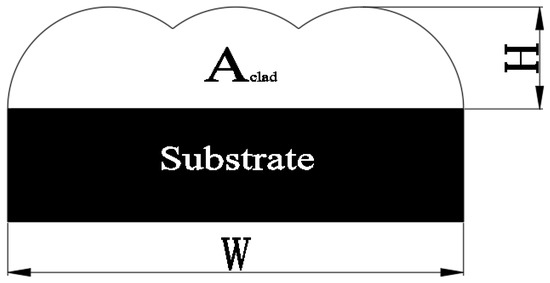
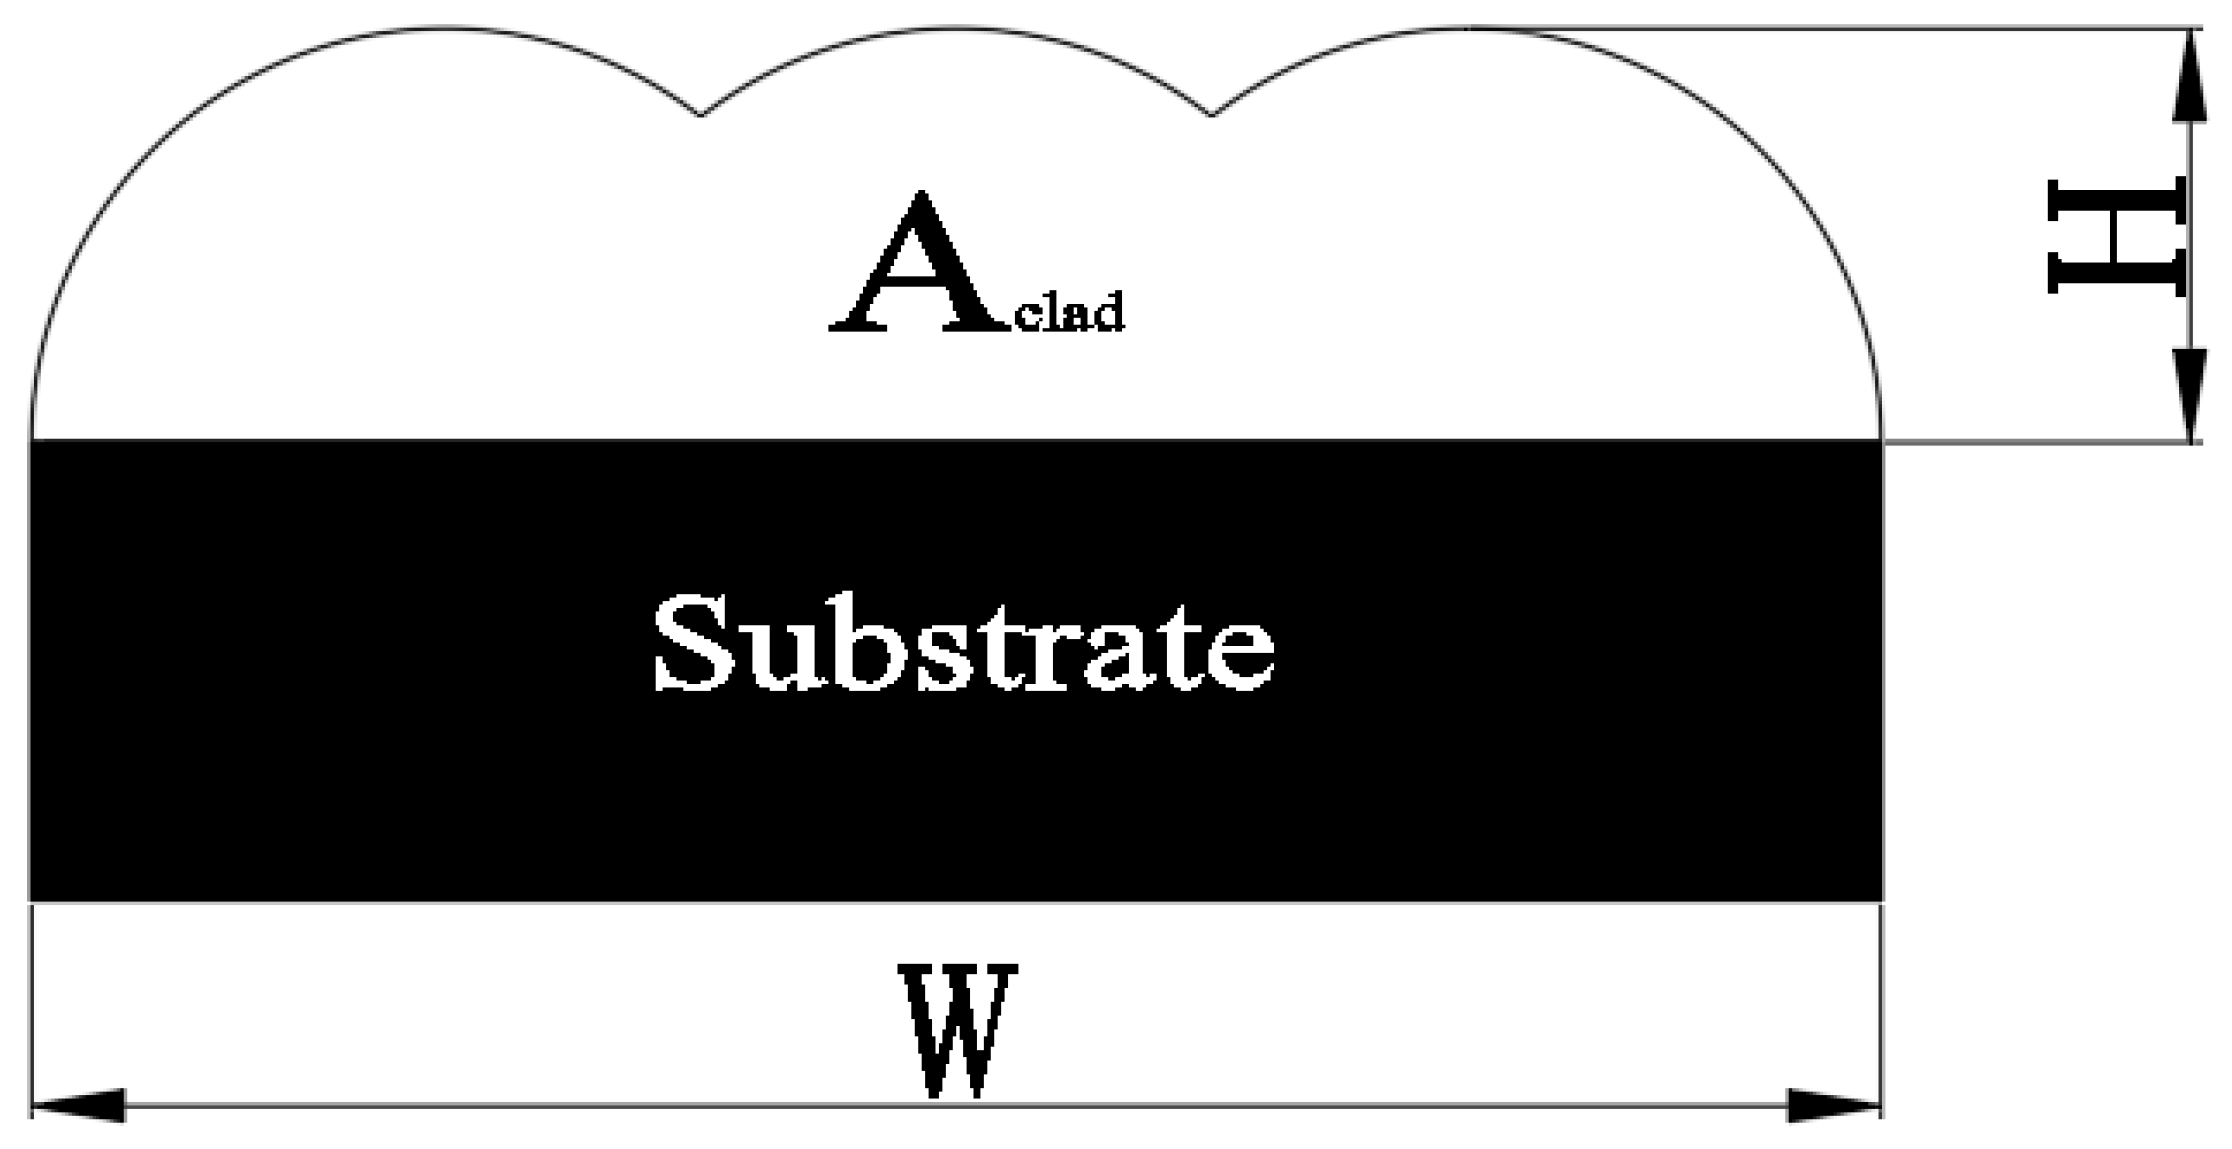
where Aclad is the cross-sectional area of clad on the substrate; W is the width of the total clad layer; H is the maximal height of the clad layer; B represents the scanning speed (Figure 2).
Figure 2.
Schematic cross-section diagram of multi-track clad.
Calculating the signal–to–noise ratio (S/N) is a useful technique in data analysis for predicting optimized results [13,15,16]. S/N is a measure of the error between the actual response and the expected value [17,18]. Because S/N quantifies the quality of response based on the interaction between the noise and the signal, S/N is a measurement that can be used to identify controllable factors. Through analysis of the S/N, the aimed parameters can be obtained [19].
Converting the experimental results to their corresponding S/N is an effective process to simultaneously improve the flatness ratio and cladding efficiency [17,18]. A larger S/N value indicates a better quality of flatness ratio and cladding efficiency. Equation (3) is used to conduct the S/N conversion for flatness ratio and cladding efficiency,
where n is the number of replicates in the experiment; Yi is the experimental result [16,20]. After the S/N conversion of flatness ratio and cladding efficiency, analysis of variance (ANOVA) was used to investigate the relation between processing parameters and responses. The significance level, α was set at 0.05.
3. Results and Discussion
Table 3 shows the 16 runs from the Taguchi orthogonal experimental design, with their corresponding processing parameter settings. The response of the flatness ratio (θ) and cladding efficiency (η) in this study is also shown in Table 3, as well as their corresponding signal–to–noise ratio conversion.
Table 3.
Parameter settings in orthogonal experimental design, responses, and corresponding signal–to–noise (S/N) conversion of each run.
3.1. Analysis of Flatness Ratio
Out of the 16 runs, the best result for flatness ratio occurred in the second run, whose processing parameter setting was A1B2C2D2 (1.2 kW laser power; 6 mm/s scanning speed; 1000 L/h gas flow; 20% overlapping rate). Table 4 shows the ANOVA analysis result of the flatness ratio S/N data in Table 3. As indicated by the p-value, laser power (A) and overlapping rate (D) had a significant impact on the flatness ratio, while scanning speed (B) and gas flow (C) were not statistically significant.
Table 4.
ANOVA on S/N of flatness ratio.
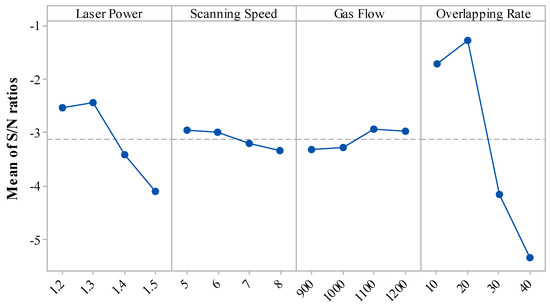
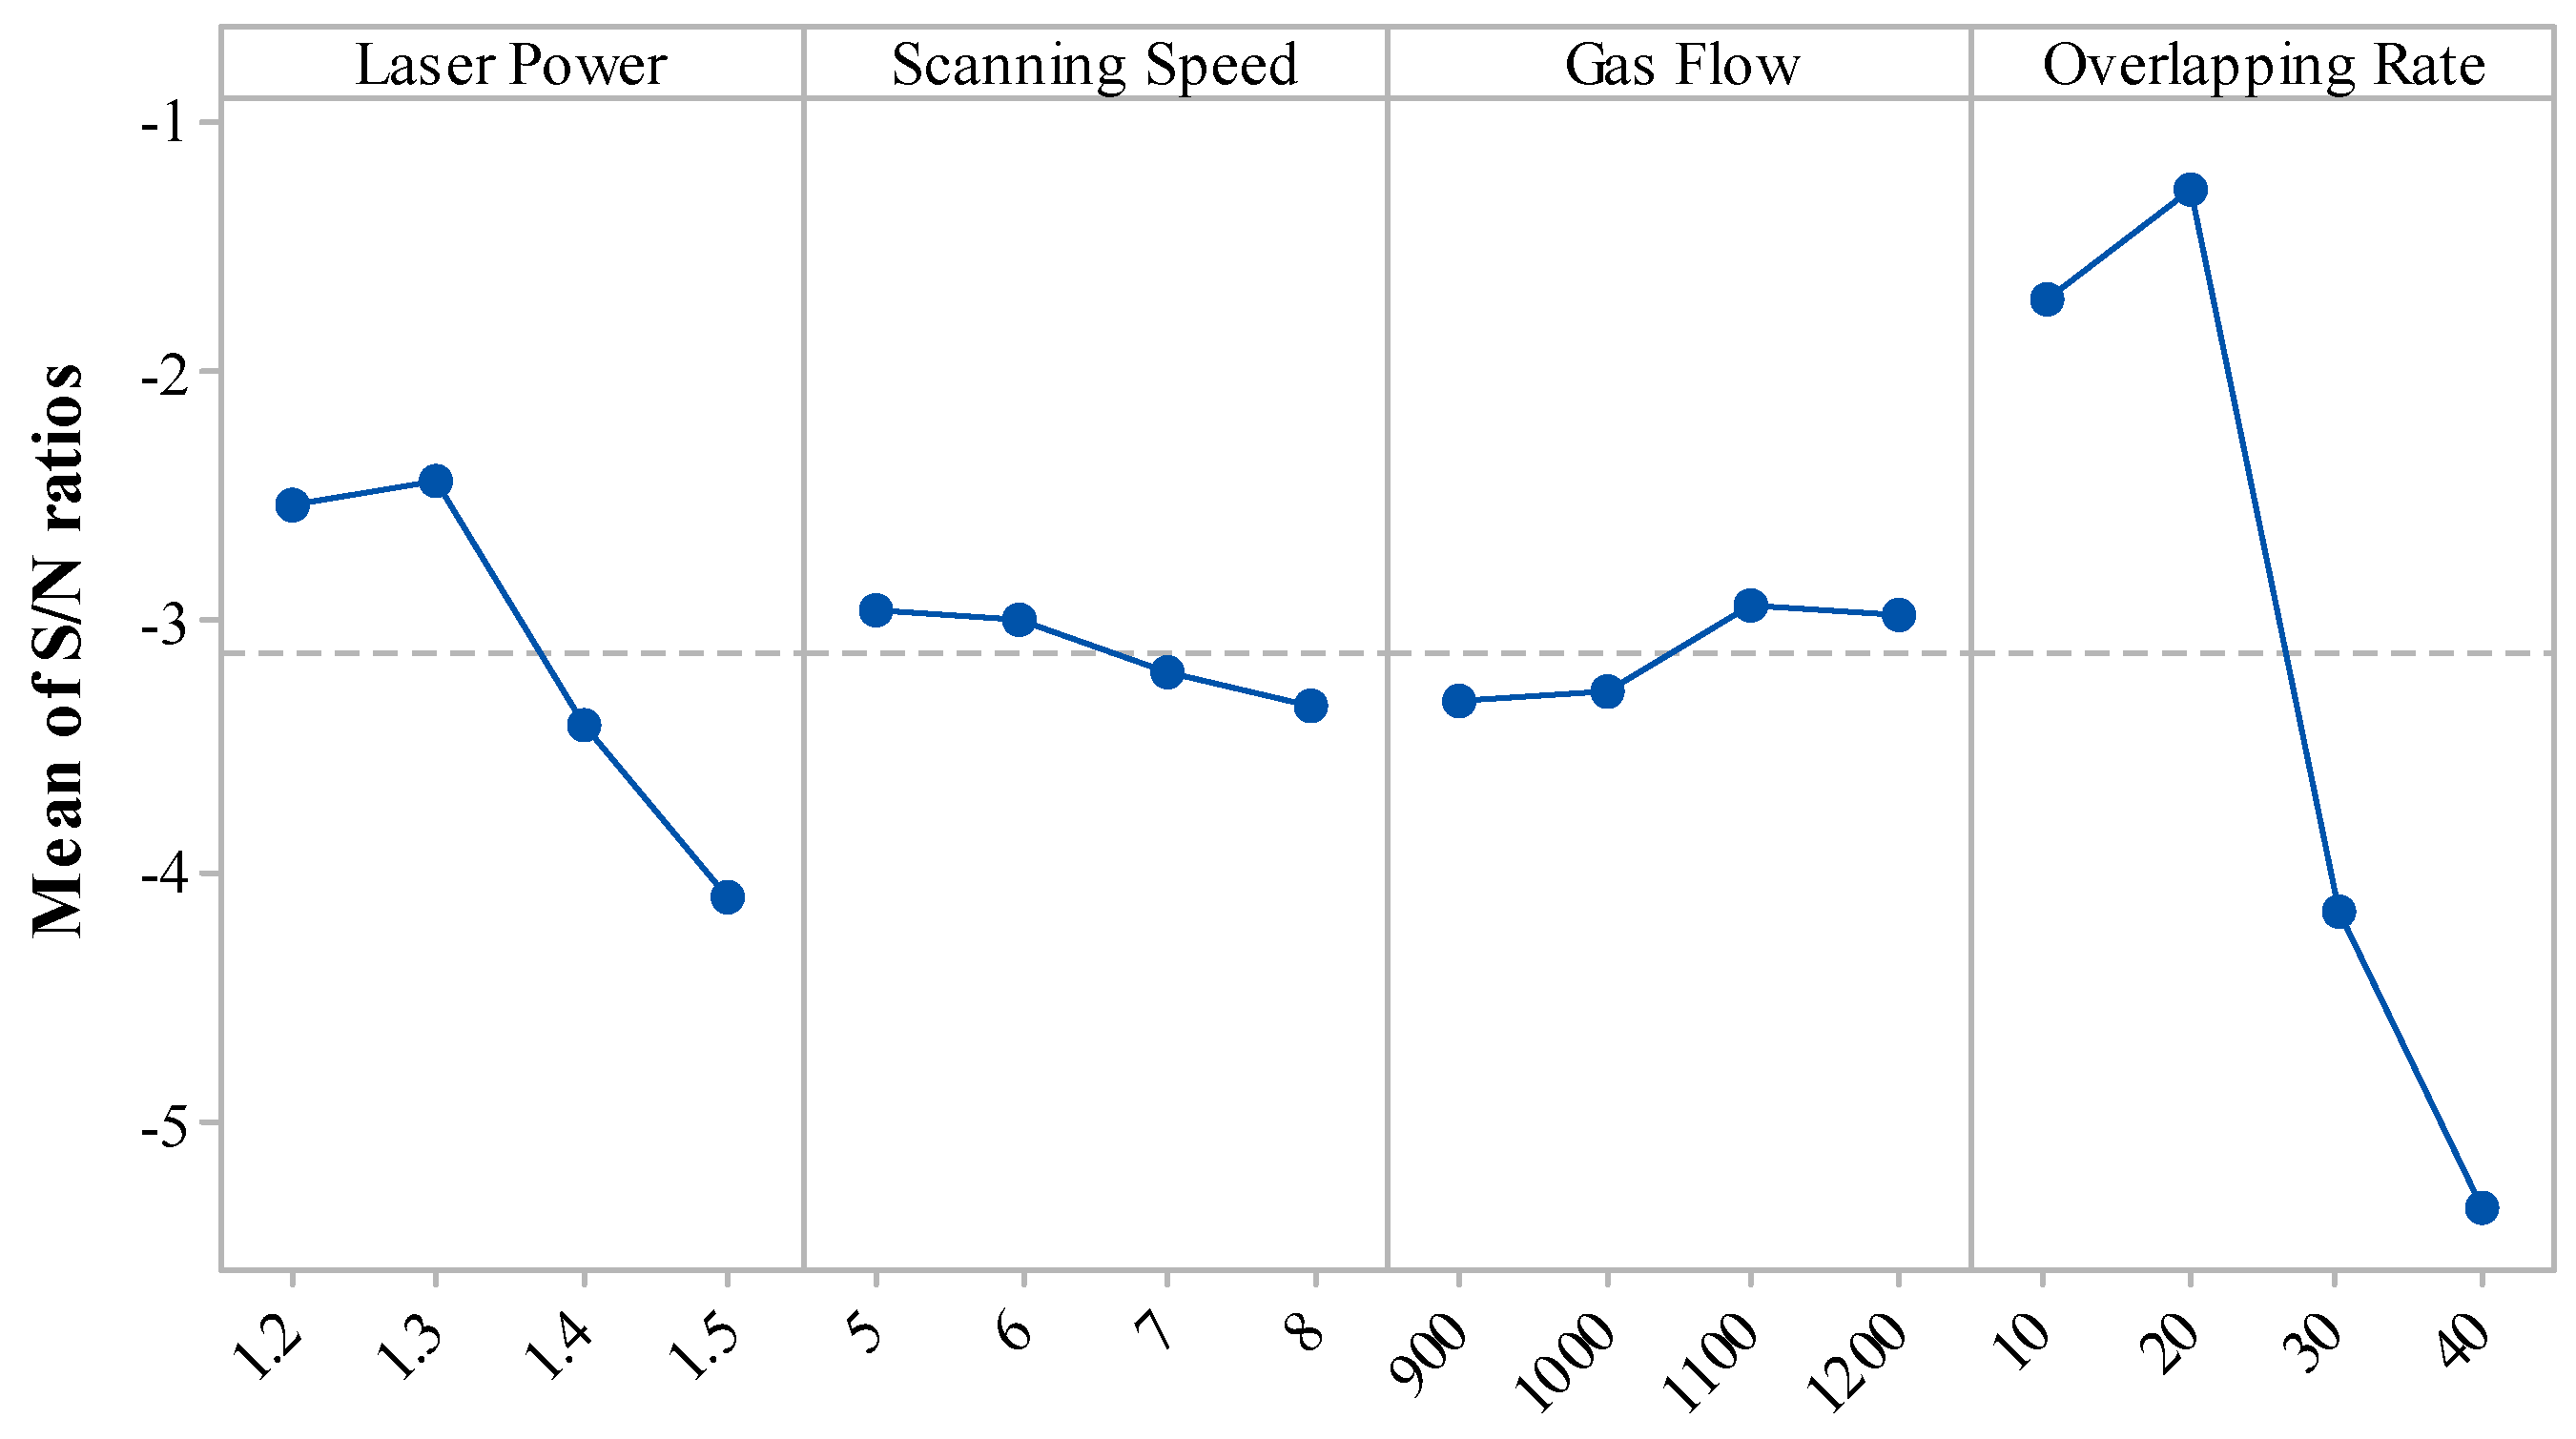
Figure 3 illustrates the main effects plot for S/N of θ. This plot was generated by plotting the means for each value of each categorical variable using Minitab software (17.1.0.0). Solid lines connect each mean value within each category and the dashed reference line indicates the overall mean. The main effect for each categorical variable is evaluated by comparing the solid plotted line to the dashed reference line. A horizontal solid line indicates that there is no main effect for this parameter. Otherwise, a main effect for the parameter exists. A steeper slope denotes that the parameter has a stronger influence on the results.
Figure 3.
Main effects plot for the S/N analysis of flatness ratio.
Figure 3 shows that the overlapping rate has the most significant influence on the flatness ratio, which is consistent with the results in Table 4. The best flatness ratio occurred at an overlapping rate of 20%. The flatness ratio was lower at an overlapping rate of 10%. This was because the shared area between overlapping tracks was smaller, causing a greater height difference than at a 20% overlapping rate. With overlapping rates higher than 20%, there was a buildup of cladding material in the area between the adjacent tracks, a phenomenon known as “slope cladding”. This also caused the flatness ratio to decrease. Similar results were observed for the laser power. The flatness ratio displayed a small increase then decrease with increasing laser power. Since the laser power determined the amount of energy received by the molten pool during laser cladding, a relatively low laser power limited the energy absorbed by the molten pool, leading to insufficient melting of the cladding powder. This resulted in a narrower cladding track on the substrate. As laser power increased, the convection effect in the molten pool increased, which increased the width of the total clad layer, resulting in an increase in the flatness ratio. A further increase in the laser power resulted in lower flatness ratios. This effect can be explained by Equation (1). Increasing laser power flattened the molten pool and increased the width at a faster rate than the total clad area was increased [21].
The main effects plot shows scanning speed and gas flow to be close to the reference dash line indicating that their impact on the flatness ratio is not significant. These results are consistent with the data presented in the ANOVA analysis in Table 4. Based on these results, when only the flatness ratio was considered, the best processing parameters were a 1.3 kW laser power and 20% overlapping rate.
3.2. Analysis of Cladding Efficiency
The best result of cladding efficiency was achieved in the 13th run, whose processing parameter setting was A4B1C2D3 (1.5 kW laser power; 5 mm/s scanning speed; 1000 L/h gas flow; 30% overlapping rate). An ANOVA analysis of the cladding efficiency S/N data in Table 3 is shown in Table 5. Laser power (A) and overlapping rate (D) had significant impact on the cladding efficiency, with p-values being 0.0009 and 0.0443, respectively. Scanning speed (B) and gas flow (C) were not statistically significant at the predetermined value of α equal to 0.05. Although not significant in this experiment, the scanning speed showed a trend toward significance (p = 0.0664) and should be investigated further.
Table 5.
ANOVA on S/N of cladding efficiency.
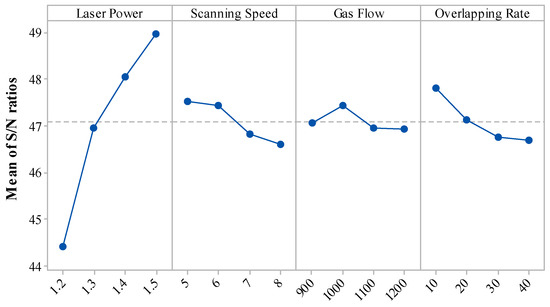
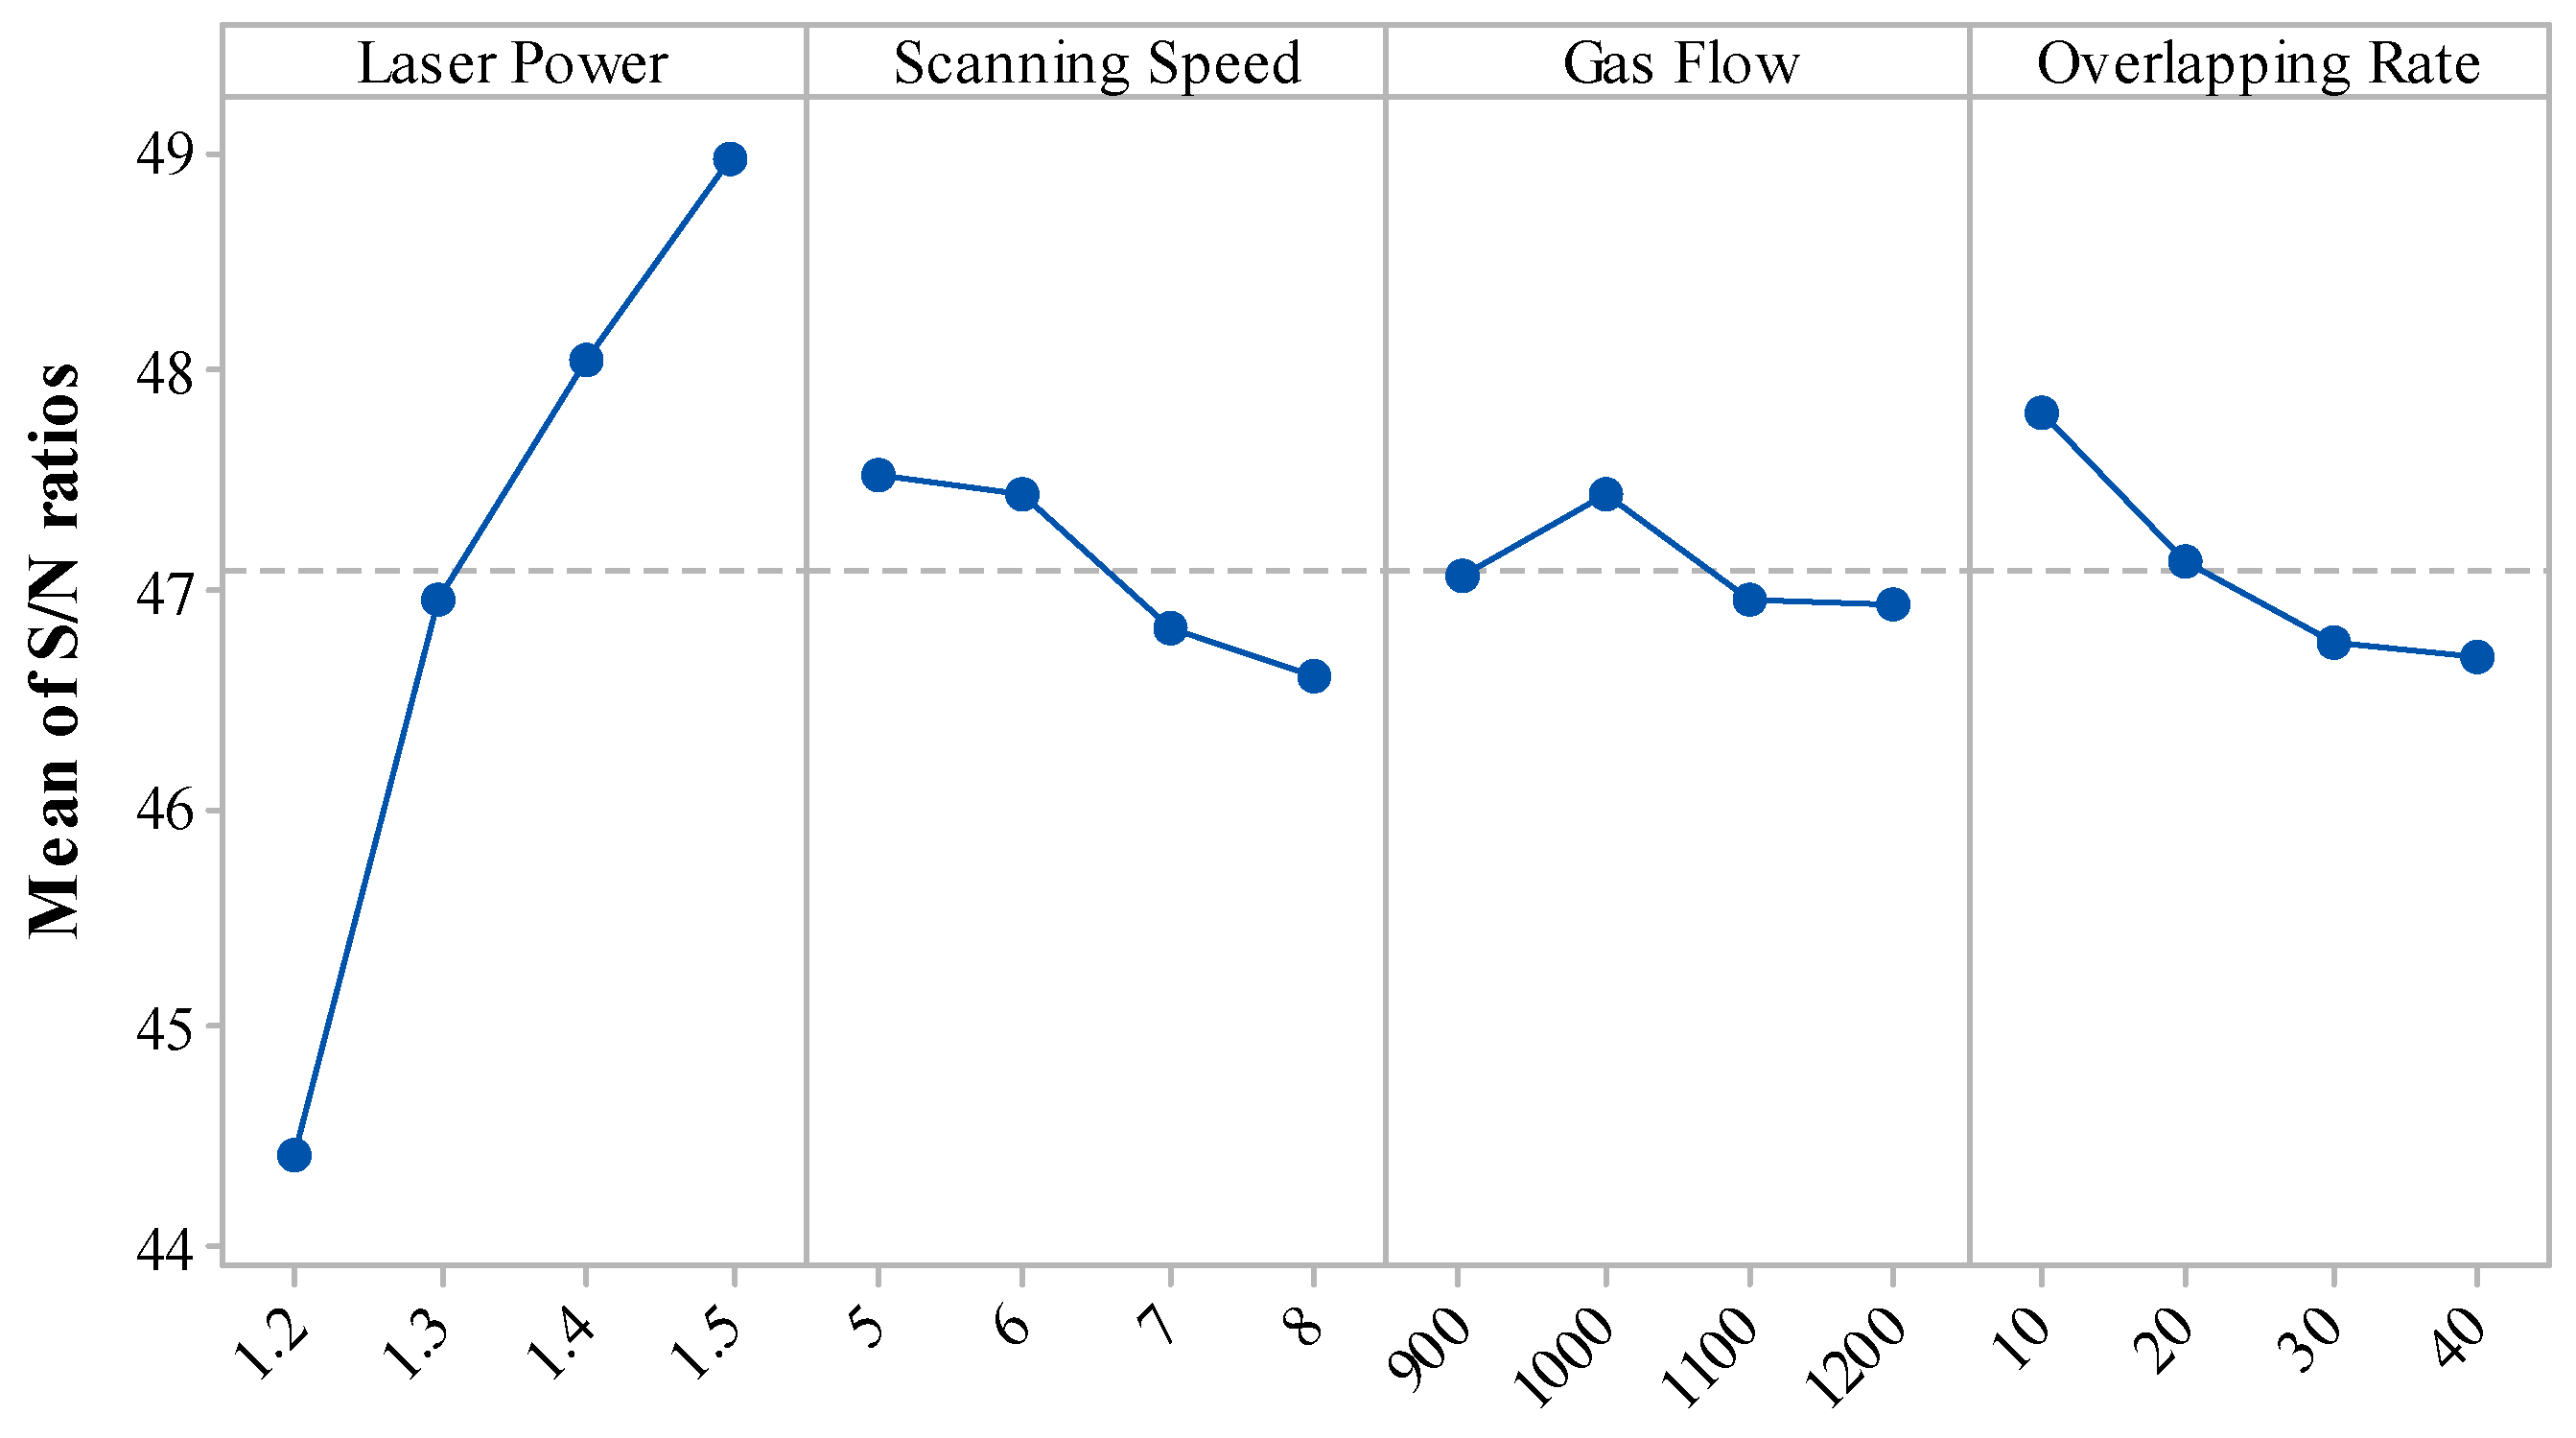
The main effects plot (Figure 4) showed that laser power had the most significant influence on cladding efficiency. Cladding efficiency increased dramatically with increasing laser power. Since laser power controlled the energy absorbed during the cladding process, higher laser power resulted in more energy being absorbed by the cladding powder. These higher energy levels increased the width of the cladding track and the cross-sectional area of clad (Aclad) [21]. As expected, increasing the overlapping rate decreased cladding efficiency. During multi-track laser cladding, a larger overlapping rate requires more passes to cover the same cladding area, thus reducing cladding efficiency.
Figure 4.
Main effects plot for the S/N analysis of cladding efficiency.
According to Equation (2), the cladding efficiency is directly proportional to the scanning speed, however, experimental results show the cladding efficiency to decrease with scanning speed. The reason for this behavior is that a faster scanning speed shortened the laser energy exposure duration on the cladding powder and the molten pool. This decrease in energy resulted in a smaller area of clad because the powder did not receive sufficient laser energy to melt during the cladding process [22,23]. From these data, the best processing parameters were a laser power of 1.5 kW, a 5 mm/s scanning speed, and a 10% overlapping rate when only cladding efficiency was considered.
3.3. Multi-Response Grey Relational Analysis
The goal of this study was to simultaneously achieve both a high flatness ratio and suitable cladding efficiency. Since the best result of the flatness ratio and cladding efficiency occurred on different runs (i.e., different processing parameter settings), additional investigation is needed to achieve a multi-response optimization. To determine the optimal processing parameters while taking both flatness ratio and cladding efficiency into consideration, this paper applied grey relational analysis to achieve multi-response optimization [17]. Grey relational analysis was conceived by Julong Deng in the 1980s. This theory effectively combines multiple objectives into a “single” objective, thus solving the complex multi-response question. Grey relational analysis provides an effective way to optimize multiple parameters to attain the optimal solution that satisfies multiple objectives [24,25].
There are three steps to complete the grey relational analysis [19,26,27,28]. The first step is to normalize the data. This process accounts for the differences in units and the range of the original data. Normalized data is expressed as a value between 0 and 1. In this study, Equation (4) was selected to conduct normalization,
where k is the kth response (k = 1,2) for the two responses in this paper; i is the ith experimental data (i = 1, 2, 3, …, 16); is the response data after normalization; stands for the original response data; and represent the minimum and maximum value of . The second step is to calculate the grey relational coefficient for each response using Equation (5).
where is the grey relational coefficient (GRC) of the kth response in the ith run; represents the deviation between the normalized value and the reference sequence . The deviation is obtained through ; and denote the minimum and maximum value of ; is the distinguishing coefficient with . Normally 0.5 is selected for since it gives a moderate distinguishing effect and stability [29]. After normalization of the original data for the flatness ratio and cladding efficiency, the result after grey relational generation (X) and their corresponding deviation (Δ) are shown in Table 6. The last step is to perform the grey relational calculation on multi-responses using Equation (6),
where GRGi is the grey relational grade (GRG) for the ith run; n is the number of responses, which is two in this study.
Table 6.
Original experimental data after normalization and the corresponding deviation.
In this paper, the goal of achieving a good flatness ratio and high cladding efficiency were determined to be equally important. Therefore, the same weight was given to both the flatness ratio and cladding efficiency for the grey relational grade (GRG) calculation. The GRCs, GRG, and S/N conversion of GRG for each run are shown in Table 7, with larger values being more desirable. The 9th run setting (A3B1C4D2) was determined to be the preferred processing parameters (1.4 kW laser power; 5 mm/s scanning speed; 1200 L/h gas flow; 20% overlapping rate), with a GRG value of 0.82423.
Table 7.
Grey relational coefficient (GRC) of flatness ratio and cladding efficiency, grey relational grade (GRG), S/N conversion of GRG for each run.
The results of ANOVA on the S/N of the grey relational grade are shown in Table 8. Based on the obtained p-values, the overlapping rate (D) and laser power (A) were statistically significant and had an impact on the flatness ratio and cladding efficiency. The scanning speed (B) showed a trend toward significance (p = 0.0628).
Table 8.
ANOVA on S/N of GRG.
Analysis of GRG S/N data in Table 9 shows the maximum absolute value difference to occur in the overlapping rate. This indicates that the overlapping rate had the most significant influence on both the flatness ratio and cladding efficiency. Table 9 was used to determine the optimal processing parameter settings by selecting the level in each category with the highest value. The optimal setpoint was determined to be A4B2C2D1 (1.5 kW laser power; 6 mm/s scanning speed; 1000 L/h gas flow; 10% overlapping rate). Since this processing parameter setting was not one of the settings in the 16 original runs, a validation experiment was needed to confirm this processing parameters prediction.
Table 9.
Mean of S/N (GRG) for each processing parameter.
3.4. Processing Parameters Optimization and Experimental Validation
The GRG prediction was used to estimate the outcome of the parameter setpoint (A4B2C2D1) prior to conducting the experiment. The GRG prediction was calculated by [26],
where is the predicted value of GRG from the selected set; represents the total mean of the GRG; q is the number of processing parameters, which is four in this study; stands for the average GRG value at the selected level for the jth processing parameter.
The best results from the 16 orthogonal runs, the grey relational analysis (GRA) prediction, and the validation experiment are compared in Table 10. When the best results from orthogonal experimental design (A3B1C4D2) were compared with the optimal parameters setting derived from GRA (A4B2C2D1), the flatness ratio increased from 0.881 to 0.889 and the cladding efficiency increased from 253.336 to 260.786 mm3/s. Although the increase of the flatness ratio was only 0.91%, the increase of the cladding efficiency was 2.94%. These differences may not seem significant, but even a small improvement in processing parameters can have a large impact on the overall quality of the product and substantial financial gains. In addition, the optimal parameters setting derived from GRA increased the two responses simultaneously, indicating that the optimal parameters setting was better than the best run in the Taguchi orthogonal array.
Table 10.
Optimization and experimental validation result comparison.
Furthermore, the grey relational grade prediction derived from Equation (7) and the experimental validation differed by less than one percent (0.97%). It shows the high accuracy of multi-response optimization using grey relational analysis. The methods developed in this paper can also be used to evaluate uneven weighting distributions for the flatness ratio and cladding efficiency, for example, if flatness ratio was deemed to be a higher priority, the weighing factor in the GRA could be set to 75% for the flatness ration and only 25% for the cladding efficiency. In addition, this multi-response optimization method with GRA could be used to guide the design of a large-scale experiment. This is important because actual experiments can be expensive and time-consuming. It could be used to evaluate different responses such as wetting angle, penetration depth, and dilution instead of flatness ratio and cladding efficiency. Moreover, because GRA was designed to optimize multiple responses, it could also be used to optimize three or four of the above responses simultaneously.
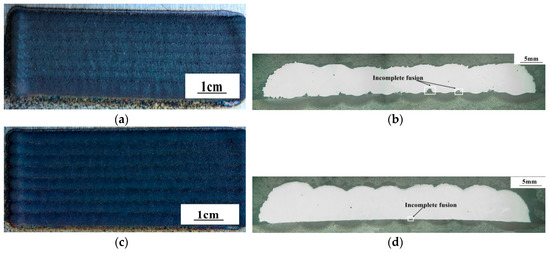
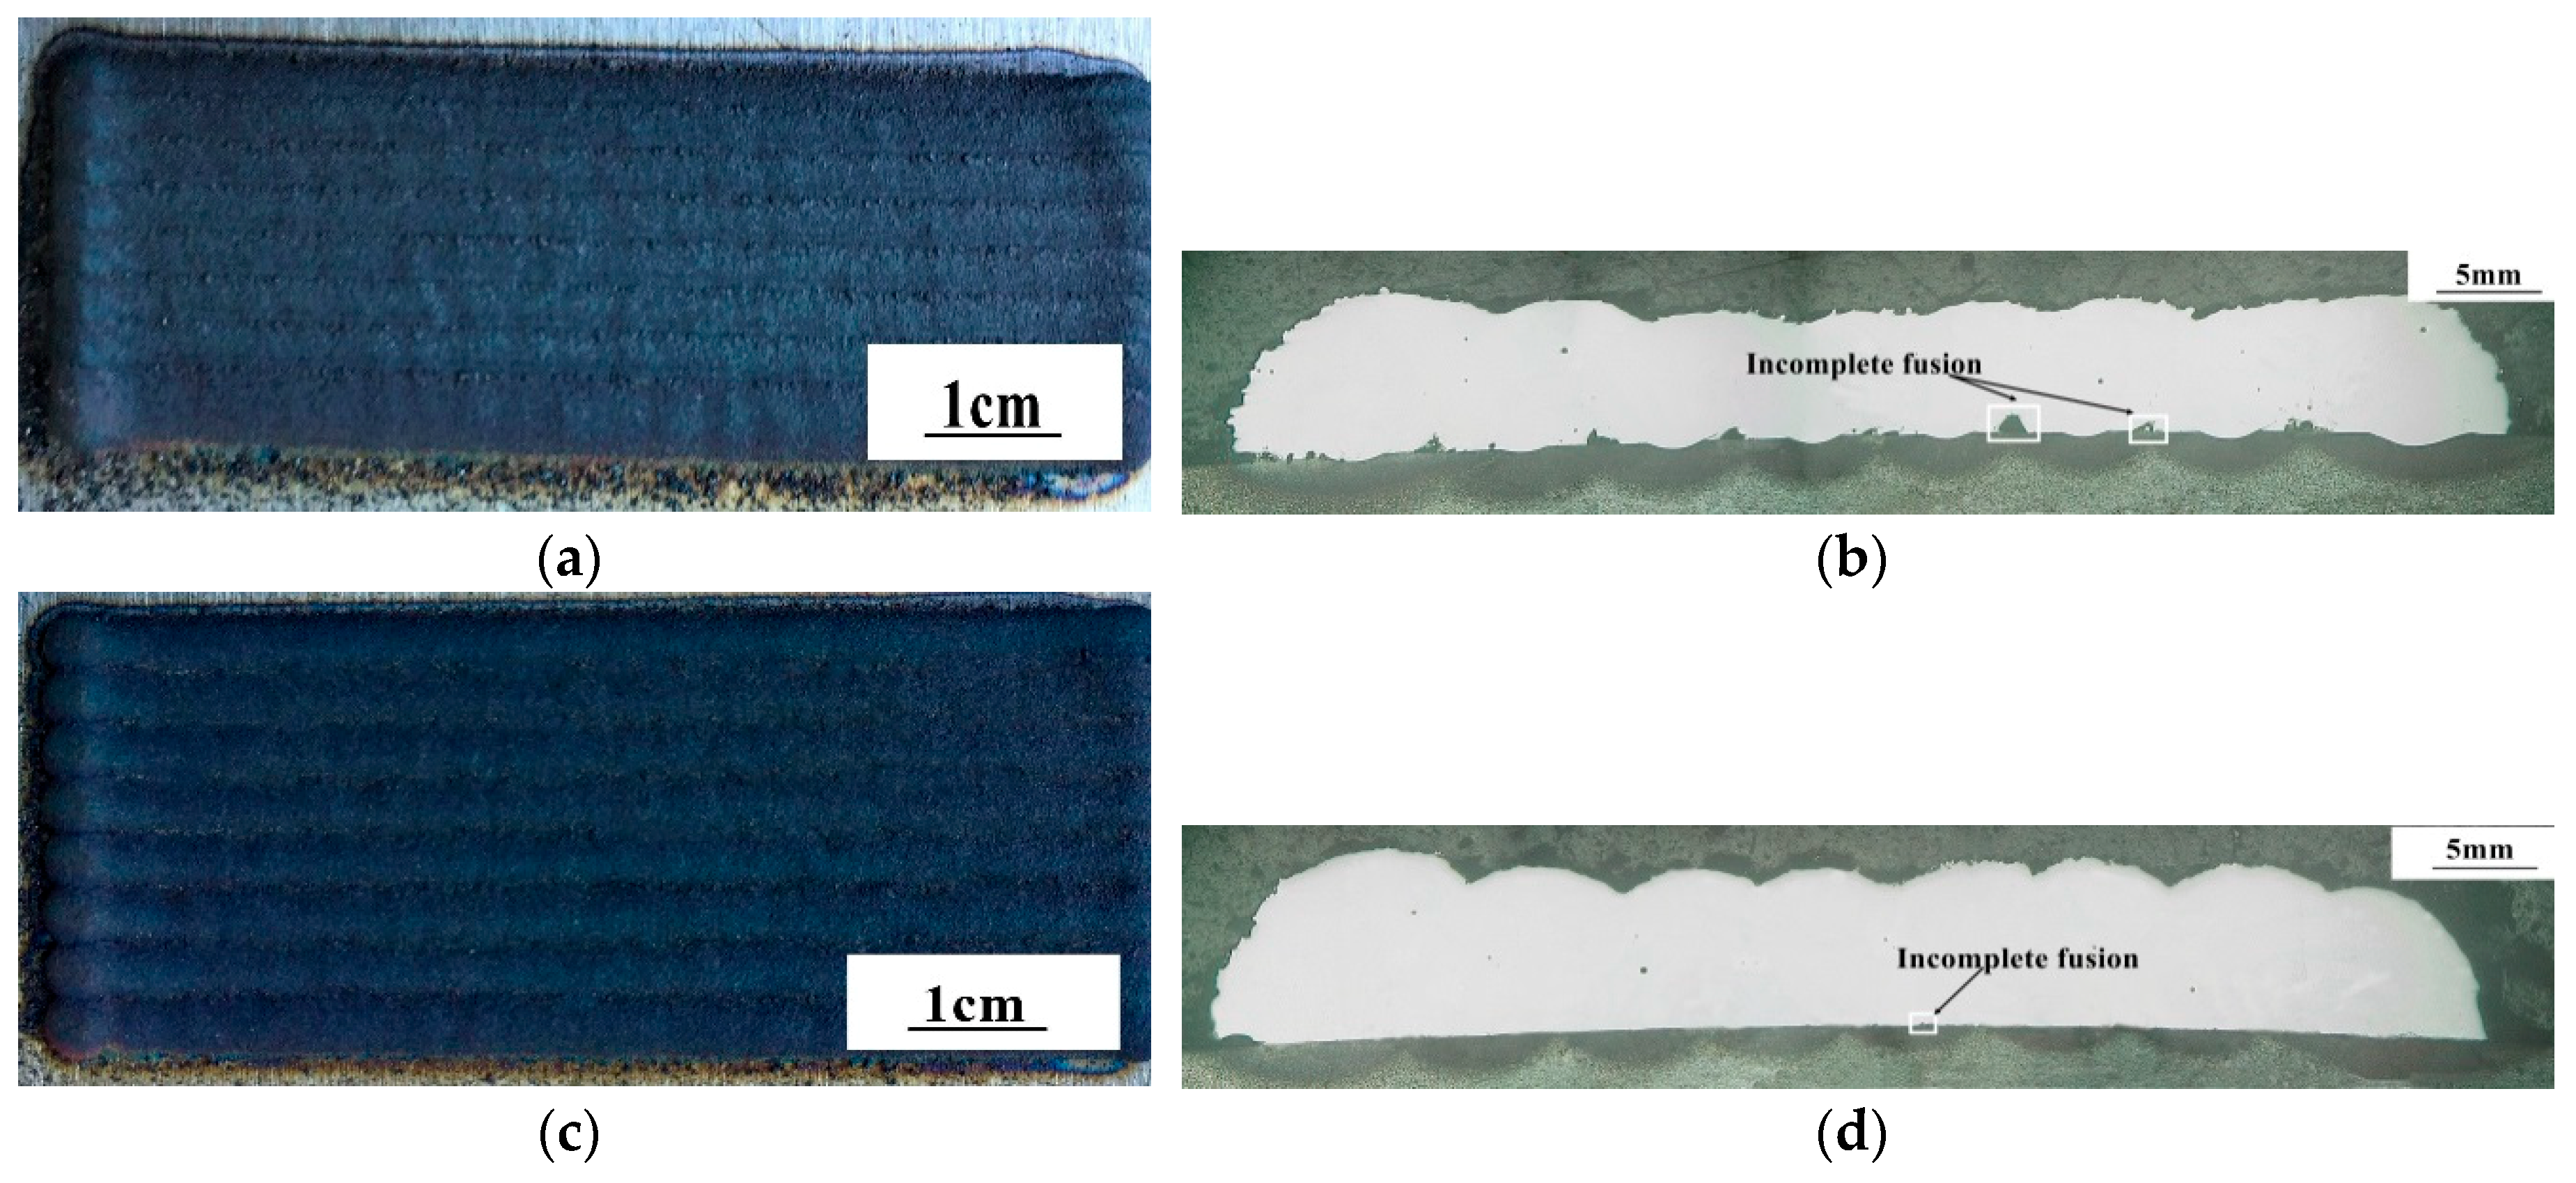
Figure 5 below shows the clad morphology and cross-section comparison of multi-track laser clad derived by the best parameter set from the orthogonal design experiment and the optimal GRA parameter set, respectively. Figure 5d elucidates that incomplete fusion was significantly avoided in the optimal GRA parameter set, compared with the best parameter set found in the orthogonal design experiment (Figure 5b). The morphology of the clad made with the optimal parameters (A4B2C2D1) found using the GRA is shown in Figure 5c. No excessive powder adhesion was observed, and it had better cladding efficiency than the best run in the orthogonal design experiment. These results demonstrate the remarkable quality of the cladding layer when produced using the optimal processing parameters obtained from grey relational analysis.
Figure 5.
Multi-track laser clad morphology and cross-section comparison between the best parameter set from the orthogonal design (a,b) and the optimal GRA parameter set (c,d).
4. Conclusions
This paper utilized an orthogonal experimental design to study the influence of laser power, scanning speed, gas flow, and overlapping rate on clad flatness ratio and cladding efficiency in multi-track laser cladding. Signal–to–noise ratio conversion and grey relational analysis was used to find the optimal processing parameters. Once the optimal processing parameters were determined, a validation experiment was conducted to verify the results. Based on this investigation, the following conclusions were made:
- Analysis of the flatness ratio as the single response showed that the overlapping rate and laser power affected the flatness ratio. The flatness ratio increased then decreased with increasing overlapping rate and laser power over the range of values studied.
- Analysis of the cladding efficiency as the single response revealed that the cladding efficiency was influenced by laser power, overlapping rate, and scanning speed. The cladding efficiency increased dramatically with the increased laser power. Increased scanning speed and overlapping rate caused a relatively small reduction in cladding efficiency.
- Grey relational analysis was effective in finding processing parameters that optimized the flatness ratio and cladding efficiency simultaneously. When these two objectives were weighted equally, the optimal processing parameters were determined to be 1.5 kW laser power, 6 mm/s scanning speed, 1000 L/h gas flow over, and 10% overlapping rate. This optimal parameter setting generated a better flatness ratio and cladding efficiency than best run in the orthogonal design experiment.
- The validation experiment using the optimal parameter setting found by grey relational analysis were within one percent (0.97% error) of the predicted value. This demonstrates the potential that GRA perform as a tool for identifying optimal laser cladding processing parameters. The methods presented in this paper can be used as a guide to developing optimal multi-track laser cladding processes for industrial applications.
Author Contributions
Methodology, G.L. and H.Z.; Experiment, H.Z.; Analysis, G.L., H.Z., Y.Z., M.L.T., C.C. and J.J.; Writing—Original Draft Preparation, G.L. and H.Z.; Writing—Review and Editing, Y.Z., and M.L.T.; Supervision, G.L. and Y.Z.
Funding
This research was funded by the National Natural Science Foundation of China, grant number 51575110.
Acknowledgments
The authors gratefully acknowledge the support from the Public Service Platform for Technical Innovation of Machine Tool Industry in Fujian Province at Fujian University of Technology.
Conflicts of Interest
The authors declare no conflicts of interest.
References
- Zhou, S.; Xu, Y.; Liao, B.; Sun, Y.; Dai, X.; Yang, J.; Li, Z. Effect of laser remelting on microstructure and properties of wc reinforced fe-based amorphous composite coatings by laser cladding. Opt. Laser Technol. 2018, 103, 8–16. [Google Scholar] [CrossRef] [Scilit]
- Zhai, L.; Ban, C.; Zhang, J.; Yao, X. Characteristics of dilution and microstructure in laser cladding Ni-Cr-B-Si coating assisted by electromagnetic compound field. Mater. Lett. 2019. [Google Scholar] [CrossRef] [Scilit]
- Chen, J.; Li, J.; Song, R.; Bai, L.; Shao, J.; Qu, C. Effect of the scanning speed on microstructural evolution and wear behaviors of laser cladding nicrbsi composite coatings. Opt. Laser Technol. 2015, 72, 86–99. [Google Scholar] [CrossRef] [Scilit]
- Li, Y.; Dong, S.; Yan, S.; Liu, X.; He, P.; Xu, B. Microstructure evolution during laser cladding Fe-Cr alloy coatings on ductile cast iron. Opt. Laser Technol. 2018, 108, 255–264. [Google Scholar] [CrossRef] [Scilit]
- Qu, C.; Li, J.; Juan, Y.; Shao, J.; Song, R.; Bai, L.; Chen, J. Effects of the content of MoS2 on microstructural evolution and wear behaviors of the laser-clad coatings. Surf. Coat. Technol. 2019, 357, 811–821. [Google Scholar] [CrossRef] [Scilit]
- Li, N.; Xiong, Y.; Xiong, H.; Shi, G.; Blackburn, J.; Liu, W.; Qin, R. Microstructure, formation mechanism and property characterization of Ti + SiC laser cladded coatings on Ti6Al4V alloy. Mater. Charact. 2019, 148, 43–51. [Google Scholar] [CrossRef] [Scilit]
- Khamidullin, B.; Tsivilskiy, I.; Gorunov, A.; Gilmutdinov, A.K. Modeling of the effect of powder parameters on laser cladding using coaxial nozzle. Surf. Coat. Technol. 2019. [Google Scholar] [CrossRef] [Scilit]
- Nabhani, M.; Razavi, R.S.; Barekat, M. An empirical-statistical model for laser cladding of Ti-6Al-4V powder on Ti-6Al-4V substrate. Opt. Laser Technol. 2018, 100, 265–271. [Google Scholar] [CrossRef] [Scilit]
- Liu, H.; Qin, X.; Huang, S.; Hu, Z.; Ni, M. Geometry modeling of single track cladding deposited by high power diode laser with rectangular beam spot. Opt. Lasers Eng. 2018, 100, 38–46. [Google Scholar] [CrossRef] [Scilit]
- Kumar, S.; Mandal, A.; Das, A.K.; Dixit, A.R. Parametric study and characterization of AlN-Ni-Ti6Al4V composite cladding on titanium alloy. Surf. Coat. Technol. 2018, 349, 37–49. [Google Scholar] [CrossRef] [Scilit]
- Bourahima, F.; Helbert, A.; Rege, M.; Ji, V.; Solas, D.; Baudin, T. Laser cladding of Ni based powder on a Cu-Ni-Al glassmold: Influence of the process parameters on bonding quality and coating geometry. J. Alloy. Compd. 2018, 771, 1018–1028. [Google Scholar] [CrossRef] [Scilit]
- Alam, M.K.; Urbanic, R.J.; Nazemi, N.; Edrisy, A. Predictive modeling and the effect of process parameters on the hardness and bead characteristics for laser-cladded stainless steel. Int. J. Adv. Manuf. Technol. 2018, 94, 397–413. [Google Scholar] [CrossRef] [Scilit]
- Liu, Y.; Liu, C.; Liu, W.; Ma, Y.; Tang, S.; Liang, C.; Cai, Q.; Zhang, C. Optimization of parameters in laser powder deposition AlSi10Mg alloy using Taguchi method. Opt. Laser Technol. 2019, 111, 470–480. [Google Scholar] [CrossRef] [Scilit]
- Wen, P.; Feng, Z.; Zheng, S. Formation quality optimization of laser hot wire cladding for repairing martensite precipitation hardening stainless steel. Opt. Laser Technol. 2015, 65, 180–188. [Google Scholar] [CrossRef] [Scilit]
- Vempati, S.R.; Raju, K.B.; Subbaiah, K.V. Optimization of welding parameters of Ti 6Al 4V cruciform shape weld joint to improve weld strength based on taguchi method. Mater. Today Proc. 2018, 5, 4948–4957. [Google Scholar]
- Naik, A.B.; Reddy, A.C. Optimization of tensile strength in TIG welding using the taguchi method and analysis of variance (ANOVA). Therm. Sci. Eng. Prog. 2018, 8, 327–339. [Google Scholar] [CrossRef] [Scilit]
- Ilo, S.; Just, C.; Xhiku, F. Optimisation of multiple quality characteristics of hardfacing using grey-based taguchi method. Mater. Des. 2012, 33, 459–468. [Google Scholar] [CrossRef] [Scilit]
- Kumar, S.R.; Kulkarni, S.K. Analysis of hard machining of titanium alloy by taguchi method. Mater. Today Proc. 2017, 4, 10729–10738. [Google Scholar]
- Wojciechowski, S.; Maruda, R.W.; Krolczyk, G.M.; Niesłony, P. Application of signal to noise ratio and grey relational analysis to minimize forces and vibrations during precise ball end milling. Precis. Eng. 2018, 51, 582–596. [Google Scholar] [CrossRef] [Scilit]
- Shi, Y.; Li, Y.; Liu, J.; Yuan, Z. Investigation on the parameter optimization and performance of laser cladding a gradient composite coating by a mixed powder of Co50 and Ni/WC on 20CrMnTi low carbon alloy steel. Opt. Laser Technol. 2018, 99, 256–270. [Google Scholar] [CrossRef] [Scilit]
- Shi, J.; Zhu, P.; Fu, G.; Shi, S. Geometry characteristics modeling and process optimization in coaxial laser inside wire cladding. Opt. Laser Technol. 2018, 101, 341–348. [Google Scholar] [CrossRef] [Scilit]
- Wang, D.; Hu, Q.; Zheng, Y.; Xie, Y.; Zeng, X. Study on deposition rate and laser energy efficiency of laser-induction hybrid cladding. Opt. Laser Technol. 2016, 77, 16–22. [Google Scholar] [CrossRef] [Scilit]
- Lee, H.-K. Effects of the cladding parameters on the deposition efficiency in pulsed Nd: YAG laser cladding. J. Mater. Process. Technol. 2008, 202, 321–327. [Google Scholar] [CrossRef] [Scilit]
- Hussain, M.Z.; Khan, S.; Sarmah, P. Optimization of powder metallurgy processing parameters of Al2O3/Cu composite through taguchi method with grey relational analysis. J. King Saud Univ. Eng. Sci. 2019. (In Press) [CrossRef] [Scilit]
- Yu, T.; Yang, L.; Zhao, Y.; Sun, J.; Li, B. Experimental research and multi-response multi-parameter optimization of laser cladding Fe313. Opt. Laser Technol. 2018, 108, 321–332. [Google Scholar] [CrossRef] [Scilit]
- Sahu, P.K.; Pal, S. Multi-response optimization of process parameters in friction stir welded AM20 magnesium alloy by Taguchi grey relational analysis. J. Magnes. Alloy. 2015, 3, 36–46. [Google Scholar] [CrossRef] [Scilit]
- Rajeswari, B.; Amirthagadeswaran, K. Experimental investigation of machinability characteristics and multi-response optimization of end milling in aluminium composites using RSM based grey relational analysis. Measurement 2017, 105, 78–86. [Google Scholar] [CrossRef] [Scilit]
- Xu, F.; Zhang, S.; Wu, K.; Dong, Z. Multi-response optimization design of tailor-welded blank (TWB) thin-walled structures using taguchi-based gray relational analysis. Thin-Walled Struct. 2018, 131, 286–296. [Google Scholar] [CrossRef] [Scilit]
- Lin, S.J.; Lu, I.; Lewis, C. Grey relation performance correlations among economics, energy use and carbon dioxide emission in taiwan. Energy Policy 2007, 35, 1948–1955. [Google Scholar] [CrossRef] [Scilit]

© 2019 by the authors. Licensee MDPI, Basel, Switzerland. This article is an open access article distributed under the terms and conditions of the Creative Commons Attribution (CC BY) license (http://creativecommons.org/licenses/by/4.0/).