Article

Flow Kinetics of Molten Silicates through Thermal Barrier Coating: A Numerical Study

by
Mohammad Rizviul Kabir
1,*,
Anil Kumar Sirigiri
2,
Ravisankar Naraparaju
2 and
Uwe Schulz
2
1
Experimental and Numerical Methods, Institute of Materials Research, German Aerospace Center (DLR), Linder Höhe, 51147 Cologne, Germany
2
High Temperature and Functional Coatings, Institute of Materials Research, German Aerospace Center (DLR), Linder Höhe, 51147 Cologne, Germany
*
Author to whom correspondence should be addressed.
Coatings 2019, 9(5), 332; https://doi.org/10.3390/coatings9050332
Submission received: 16 April 2019 / Revised: 20 May 2019 / Accepted: 21 May 2019 / Published: 23 May 2019
(This article belongs to the Special Issue Environmental Barrier Coatings)

Abstract

:
Infiltration of molten calcium–magnesium–alumina–silicates (CMAS) through thermal barrier coatings (TBCs) causes structural degradation of TBC layers. The infiltration kinetics can be altered by careful tailoring of the electron beam physical vapor deposition (EB-PVD) microstructure such as feather arm lengths and inter-columnar gaps, etc. Morphology of the feathery columns and their inherent porosities directly influences the infiltration kinetics of molten CMAS. To understand the influence of columnar morphology on the kinetics of the CAMS flow, a finite element based parametric model was developed for describing a variety of EB-PVD top coat microstructures. A detailed numerical study was performed considering fluid-solid interactions (FSI) between the CMAS and TBC top coat (TC). The CMAS flow characteristics through these microstructures were assessed quantitatively and qualitatively. Finally, correlations between the morphological parameters and CMAS flow kinetics were established. It was shown that the rate of longitudinal and lateral infiltration could be minimized by reducing the gap between columns and increasing the length of the feather arms. The results also show that the microstructures with long feather arms having a lower lateral inclination decrease the CMAS infiltration rate, therefore, reduce the CMAS infiltration depth. The analyses allow the identification of key morphological features that are important for mitigating the CMAS infiltration.

1. Introduction

Hot section engine components of gas turbines are insulated with thermal barrier coatings (TBCs) to protect them against excessive heat. The TBC layers fabricated by electron beam physical vapor deposition (EB-PVD) show superior structural stability and long-life compared to the TBCs produced by the atmospheric plasma spray (APS) method due to their feathery columnar microstructure [1,2,3,4,5,6]. However, state-of-the art standard 7YSZ (7 wt.% yttria stabilized zirconia) coatings are vulnerable against environmental attacks, i.e., sand, volcanic ash, etc., that comes from dusty air intake during engine operation. These silicate-based particles melt under high engine temperature forming calcium–magnesium–alumina–silicates (CMAS), deposit on coated parts, and infiltrates through the porous channels of the TBC layers [7,8]. The contamination of CMAS eventually degrades the structural properties of TBCs, causing spallation failure under thermal cycles [9,10,11,12,13].
In past years, considerable attempts were made on the improvement of TBC systems aiming at reducing the infiltration and contamination by molten silicates [14,15,16,17,18,19]. Several methodologies were suggested to enforce the mitigation mechanisms against CMAS, which fall under two broad categories. In the first approach, new TBC compositions were proposed that react with CMAS, and recrystallize into new stable phases, which restrict further CMAS infiltration [20,21,22,23]. A long-term resistance against the CMAS flow cannot be guaranteed due to the continuous reaction and recession of the TBC material. In the second approach, microstructures of the top coat were custom-tailored for distributed porosities, through which the deposition of CMAS occurs locally over the top coat. After solidification of CMAS inside these pores, further infiltration was restricted, thus, the total infiltration depth was reduced.
The latter approach was systematically analyzed in some previous experimental works [24,25,26], where the CMAS infiltration behavior was compared for different top coat microstructures. It was found out that by using the optimized columnar microstructure the CMAS infiltration kinetics could be changed, where infiltration mainly proceed due to the capillary forces. The results suggest that custom-tailored well-defined porosities of the TBC microstructure may potentially impede the infiltration of CMAS. However, the knowledge provided by the previous works is not sufficient for identifying such an optimized morphology of TBCs. A systematic analysis to understand the microstructure dependent infiltration behavior is highly required. This goal can be achieved by conducting additional experiments with a number of columnar structures obtained via EB-PVD, which involves many trial-and-error modifications of the top coat morphology. Additionally, advanced numerical analyses can be suggested to predict the microstructural influence on infiltration kinetics, which will obviously reduce the experimental efforts, and additionally, will provide an in-depth understanding of the infiltration processes.
In past decades, the numerical investigations of TBCs were performed focusing mostly on the problems of structural stability, life-cycle reduction, and failure [27,28,29,30]. The effects of deposited CMAS were investigated in terms of structural property degradation. The CMAS infiltration depth was assumed based on the experimental observation. As the infiltration depth is dependent on the morphological factors of the TBC, it is desirable to develop models that firstly describe the infiltration kinetics, and secondly, predict the infiltration depth considering the morphological obstacles.
In one of the recent works by the authors [24], the infiltration depth of CMAS through different porous EB-PVD top coats was modeled analytically, where the longitudinal porous channels were assumed as open or concentric pipes, through which CMAS infiltrated under the action of capillary forces. Microstructure obstacles imposed on the CMAS flow was considered by a parameter “tortuosity factor”. The model predicted the microstructure dependency of the infiltration depth by fitting tortuosity factors for different morphologies. A good approximation of the infiltration time compared to depth was obtained which closely predicts the experimental observation [31]. However, interest on direct microstructure modeling incorporating the flow behavior is growing tremendously, as this approach allows describing realistic models based on actual microstructural statistics, and also allows fluid structure interactions during liquid flow. Thus, no “tortuosity” assumptions are required to be imposed on the moving liquid.
Microstructure based models also give an opportunity to analyze a number of equivalent real microstructure numerically, which give an easy access to the details of molten CMAS flow kinetics that are not easily accessible by experimental means. The know-how may provide qualified information for custom-tailoring the morphology of the EB-PVD top coat that potentially acts as a barrier to the CMAS infiltration.
So far, no detailed modeling approach was found that captures microstructure-sensitivity of the CMAS flow kinetics, however, the demand of an advanced modeling framework is increasing. In the present work, an effort has been made to establish a preliminary computational and numerical framework for such analysis. The following main objectives are focused:
  • Developing the computational modeling approach for the CMAS infiltration simulation: The main focus is to develop parametric geometric models of EB-PVD top coats based on microstructural statistics. For the infiltration simulation a coupled Lagrangian–Eulerian modeling framework will be adopted.
  • Quantitative and qualitative assessment of the CMAS flow kinetics: Here, a detailed comparative study of the CMAS flow kinetics for different morphologies will be performed. Finally, a clear insight into the flow behavior with respect to the individual morphological parameter will be obtained.

2. Materials and Methods

2.1. Material and Microstructure

Thermal barrier coating (TBC) systems are generally comprised of three layers: (a) a bond coat layer (BC) of a Ni-rich nickel aluminide or MCrAlY on Ni-based superalloy substrate; (b) thermally grown alumina oxide layer (TGO); and (c) a top coat (TC) typically of 7YSZ. Figure 1 shows an EB-PVD fabricated 7YSZ-TBC on a Ni-based superalloy component. The top coat consists of a very fine feathery columnar microstructure. The thickness of the columns decreases from top to bottom, and the size of the porous channel reduces accordingly. At the bottom, very dense and fine thin columns are generated. Very fine nanopores can be identified at this zone.
Variation of top coat microstructures can be obtained by custom tailoring the columnar morphology with controlled EB-PVD process parameters [25,32]. Several tailored microstructures with different feathery columnar lengths are shown in Figure 2. The morphological details can be identified from the top and cross-sectional views.
Here, only three exemplary morphologies, named Fine, Course, and Feathery are shown, which vary with respect to the columnar microstructure. The cross-sectional views A2, B2, and C2 show numerous single crystalline columns and nano-sized feather arms along the complete column‘s periphery. The top views A1, B1, and C1 show different columnar tips, which also vary with respect to size and shape. The overall porosity of the top coat can be attributed to the gaps between columns, feathery arms, and gaps in the feather tips. Due to the morphological variations in Fine, Course, and Feathery columns, the overall porosity has been altered.

2.2. Microstructure Modeling of EB-PVD Top Coat

2.2.1. Microstructure Idealization

Geometries of the top coat columns and feathers are highly complex. Moreover, the microstructure of each column varies slightly with each other. For modeling purposes, the microstructure variations need to be idealized in a statistical manner providing that the main structural features remain consistent. Therefore, a statistically representative microstructure unit cell (MUC) needs to be defined with much flexibility to incorporate necessary geometrical details as found in different types of EB-PVD top coats. Details of the MUC are given in Section 2.2.2.
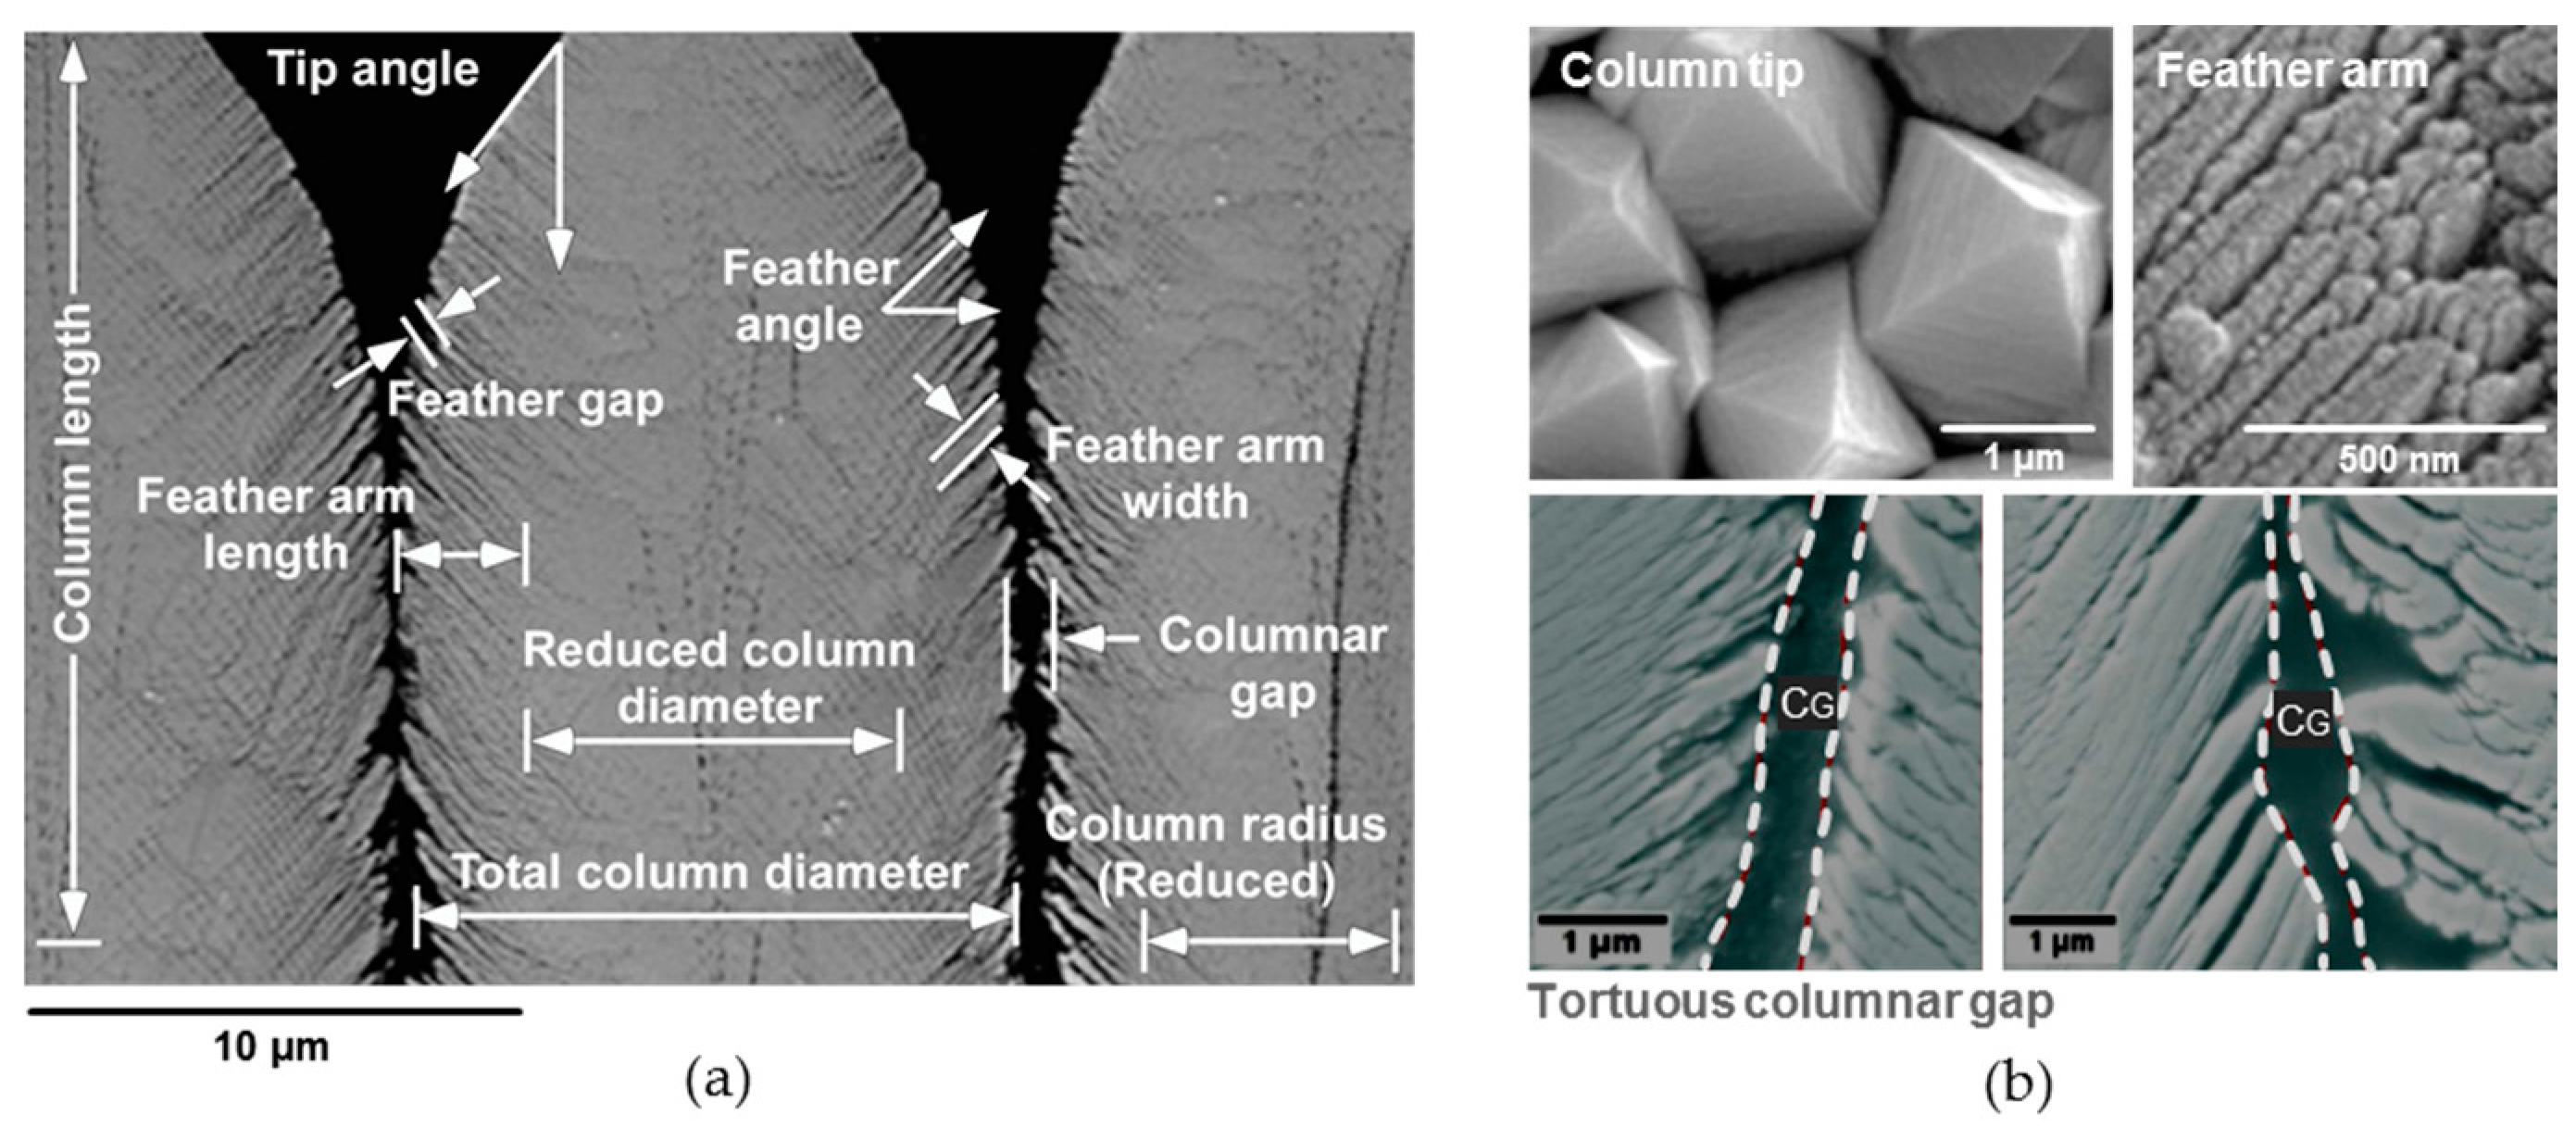
To generate such a MUC, the microstructure parameters are identified from a high magnification SEM micrograph of an EB-PVD TBC column as shown in Figure 3a. The total column diameter is DTC, and the columnar diameter excluding the feather arm length is the reduced column diameter, DC, as shown in the figure. The “reduced column diameter” will be termed simply as “column diameter” in the following sections unless otherwise stated. Similarly, for the sake of brevity, the reduced column radius, which is the half of the reduced column diameter, will be termed as “column radius”.
Other morphological parameters are total length of the column, the column length (LC), and gap between two columns, the columnar gap (GC). The thickness of each feather arm was named as the feather arm width or feather thickness (TF), the horizontal length of the feather arm along the column width is the feather arm length (LF), and the gap between individual feather arms is considered as void between feather arms (VF), and will be termed shortly the feather gap. Further, the inclination of feather arms with horizontal axis was considered as the feather inclination angle (θF), the vertical angle of the pyramidal tip is the feather tip angle (θT).
Figure 3b shows additional microstructural details with morphological variations of columnar tips, feather arms, and tortuosity due to feather arms. The pyramidal tip angle is around 30°–45°. The facets of the tips depict staggered arrangements causing gaps between pyramidal tips. The feather arms are inclined at a 40°–60° angle. The length of the feather arm depends on this angle of inclination.
Bottom pictures of the Figure 3b show two cross-sectional views of the tortuous columnar gaps due to uneven staggered arrangements of feathery arms. The feather arms and feather tips are irregular in shape and size along this columnar gap, i.e., they vary at left and right columnar edge as well as from top to bottom of a column. The degree of irregularities causes high or low tortuosity along columnar gaps. The columnar gaps may show almost regular width along the column length with a low tortuosity over the column height, or they might be highly irregular with high tortuosity contour along the column length. It must be noted that all microstructural features are three-dimensional, and they may vary along the circumference of each column considerably. The microstructures analyzed here are two-dimensional cuts; however, several orientations of cuts can be taken into account.
From the geometrical details stated above, the most relevant morphological parameters influencing the CMAS flow behavior were identified as illustrated in Figure 4a. A python code was written to handle these variables in a parametric way for generating a number of synthetic (virtual) columnar microstructures resembling real EB-PVD columnar structures. Several exemplary models generated by this code are shown in Figure 4b. A number of possible morphological variations can be obtained by cross-mixing these microstructure parameters.
In these models, the feather arm length (LF) can be made short or long with sharp or rounded feather tips to obtain irregularities in feather arrangements as observed in the microstructure picture of Figure 3a,b. A sharp feather tip was defined by an angular cut at the feather arm. The top of the column with pyramidal tip was idealized as a triangular shape keeping the width of the pyramid equal to the columnar diameter. According to the microstructure picture, the pyramidal width increases gradually from top to bottom. This geometry was obtained by defining two gradual angles along the pyramidal edges. The width of the pyramid bottom can be shortened to obtain a large CMAS entry area over the columnar gap and enlarged for obtaining a smaller CMAS entry area.
In this parametric model, the feather arm angle is taken either 40° or 60°. It should be noted that due to trigonometric functions in the parametric model, a higher feather inclination angle results in a thinner feather gap, and a lower inclination angle yields a wider father gap. In reality, the feather gaps are arbitrary, and are not directly correlated with feather inclination angles.
Total porosity of the model can be calculated adding the columnar gaps and voids between feather arms (feather gaps).

2.2.2. Microstructure Unit Cell (MUC) Model

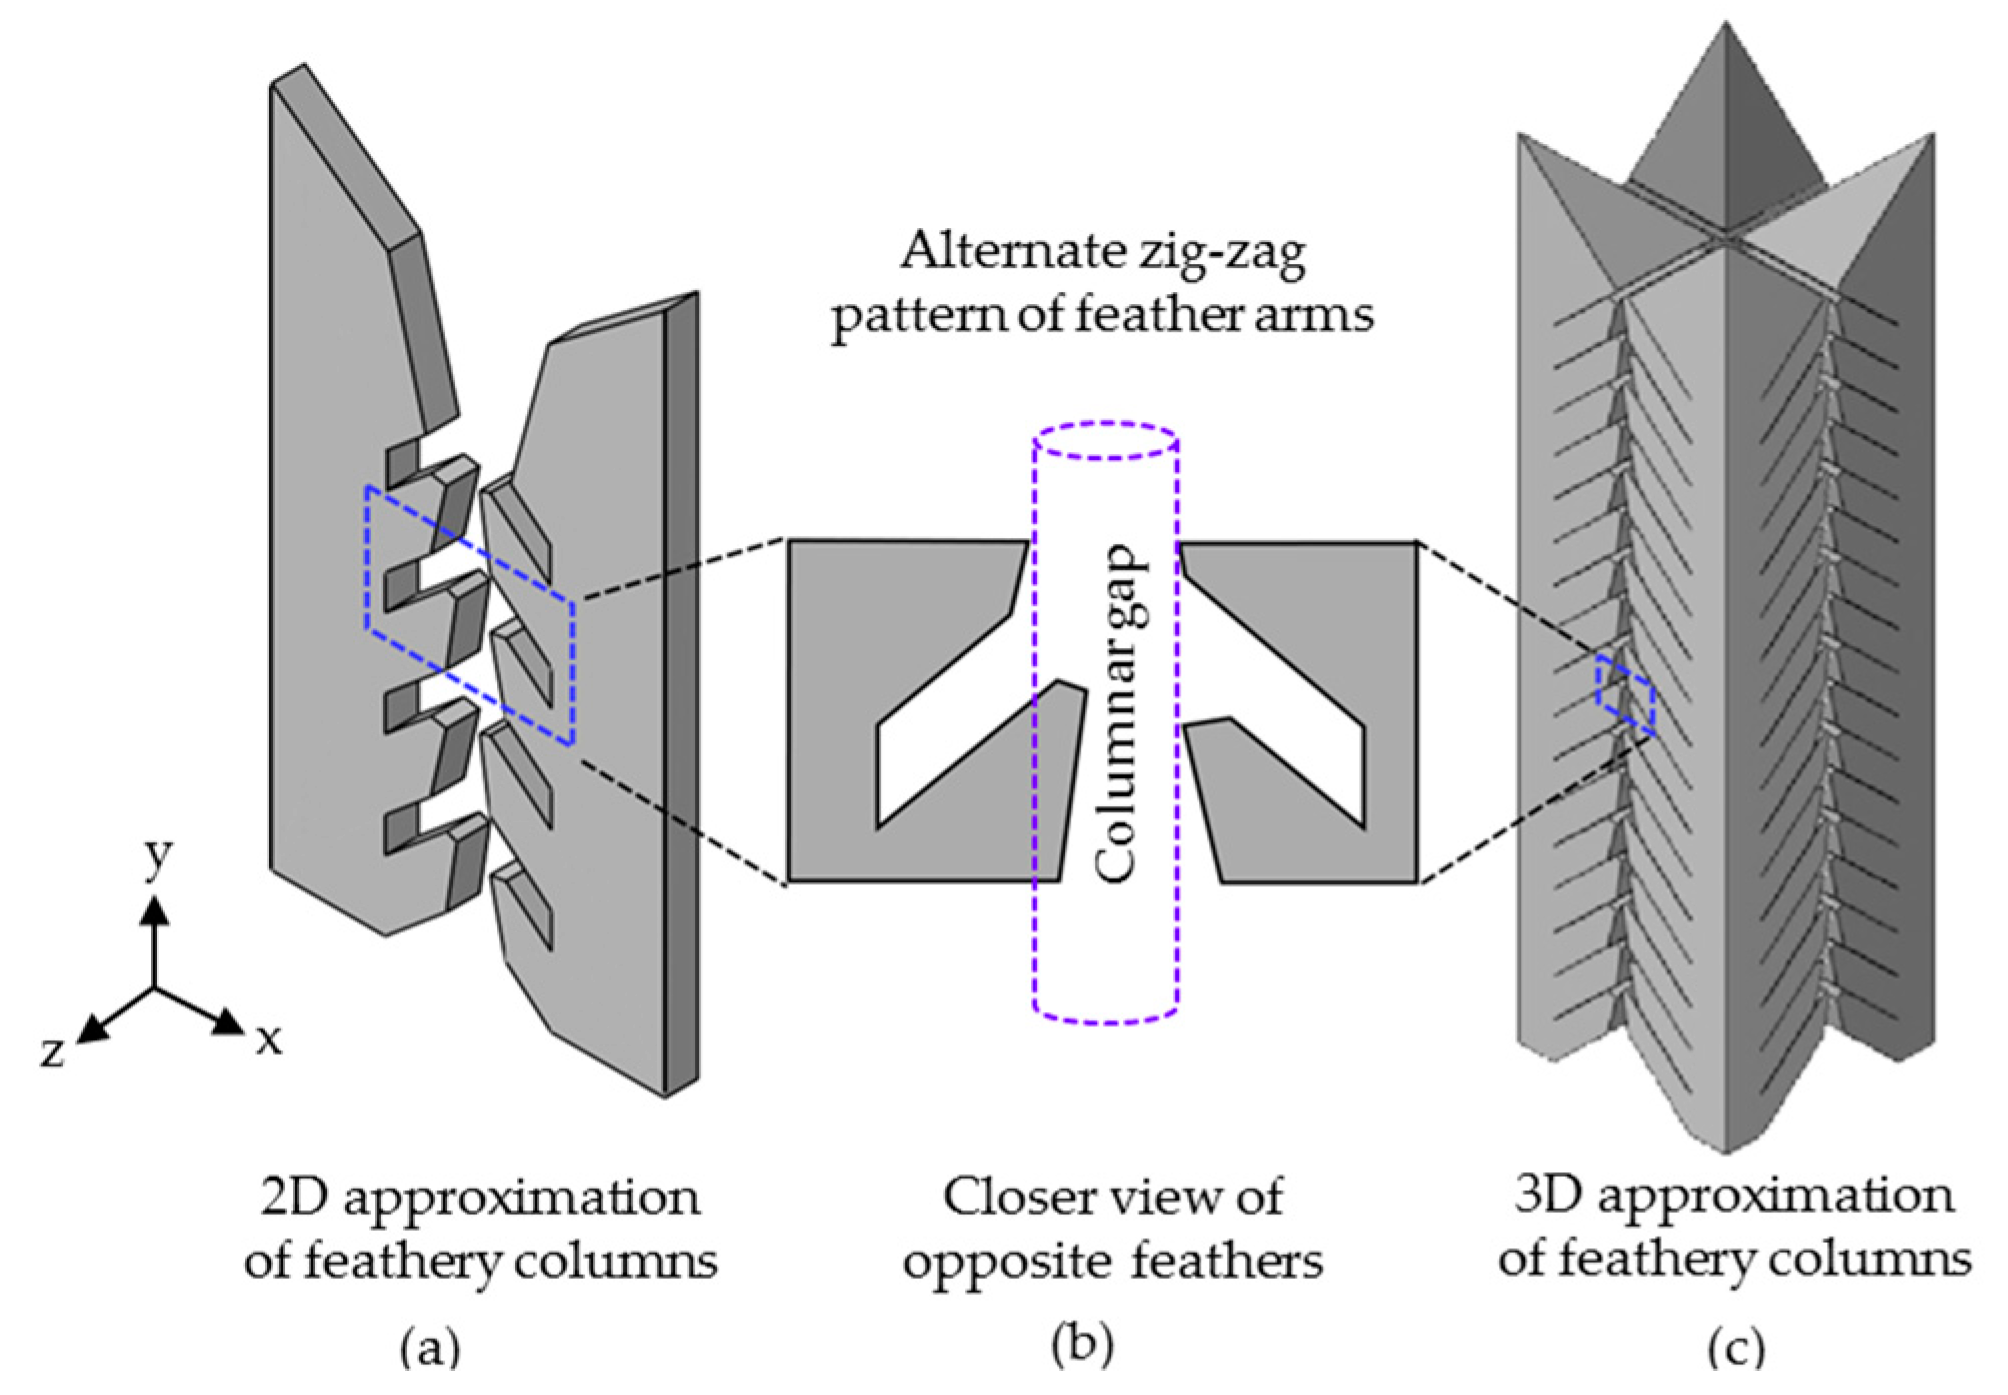
The columnar microstructural setting of the top coat was modeled by a periodic microstructure unit cell (MUC) consisting of symmetric parts of the columnar sub-structures arranged side-by-side, facing each other along the feathery arms (Figure 5). It was assumed that each microstructure is symmetric along the mid-axis of a column. This assumption conforms with our observation that the real EB-PVD TBC microstructure is also nearly symmetric at least along the two main directions, i.e., parallel to the rotational axis and perpendicular to it. For a 2D-simplification, only two EB-PVD columns having a particular columnar gap, CG, were considered as a statistical feathery unit of columns, as shown in Figure 5a. The 2D-MUC model can be arranged periodically in X-direction to obtain a complete EB-PVD top coat layer. In Z-direction, the columns are assumed to be infinite. For a 3D-simplification, four 1/8th symmetric parts of the feathery columns can be re-arranged in both X- and Z-directions, keeping the symmetry plane at the boundaries, and with a face-to-face setting of the feather arms separated by a columnar gap, CG. A more realistic EB-PVD top coat columnar microstructure can be obtained by this 3D-MUC model taking idealized symmetric microstructure in both X- and Z-directions, as shown in Figure 5c. In 3D-MUC, the tortuosity in the feathery structures can be modeled taking further geometrical complexity into account. For the present work, the investigations were done on 2D-MUCs only to obtain fundamental understanding of the flow behavior, however, advance analyses with 3D-MUC models are open for the future.
For modeling simplicity, the columnar gap was assumed to be vertically straight, and has a constant radius over the length (Figure 3b). The tortuosity along the columnar gap was obtained by defining a particular arrangement of feather arm and feather tip as described in the following.
At first, the feathery arm patterns with non-uniformities were idealized as periodic irregularities, as can be seen in Figure 5a,c along the columnar gaps. A single set of opposite feathers is shown in Figure 5b with enlargement. Here, the feather-tips of the left column were made slightly longer and the feather-tips of the right column were made shorter such that the tips of the longer feathers extend slightly into the columnar gap, and the tips of the shorter feathers stay at the columnar gap. In the left column, a periodic arrangement of longer and shorter feather-arms was done over the length of columnar gaps (from top to bottom) to obtain a realistic irregular (tortuous) feathery microstructure. For the right column, the arrangement is with an opposite order, one feather was made shorter, and the next was longer, and they are successively arranged along top to bottom. Note that the feathery structures of the opposite columns are not the mirror image along the columnar gap, which is further illustrated in the figures of the following sections.
For the numerical analysis of infiltration kinetics, only a 2D-MUC was used. The geometries of the top coat columns were varied in the MUC in order to obtain different types of EB-PVD morphologies.

2.3. Numerical Approach

2.3.1. Modeling Approach for Molten CMAS Flow

The molten CMAS flow through EB-PVD top coats involves multi-physics Fluid (Liquid)-Solid Interactions (FSI), which were modeled using a coupled Eulerian–Lagrangian (CEL) approach available in the commercial software ABAQUS [33]. The top coat was defined as a solid structure in the Lagrangian framework allowing structural deformation and rotation under the elastoplastic material behavior. On the other hand, the molten CMAS was assumed to be a highly dense, compressible, viscous fluid. To model the severe deformation and distortion of the molten CMAS, an Eulerian approach was adopted. Further, the flow of CMAS was assumed to be Newtonian, as the infiltration of the CMAS through TBC occurs only by capillary actions in the presence of the low strain-rate, i.e., strain rate effects on the viscous flow was neglected. Only the temperature dependency on viscosity was considered.
To capture multi-physics interactions along the solid-liquid domain boundaries (here, the domain between top coat and CMAS), the free surface evolution of the liquid CMAS flow was modeled using a volume-of-fluid (VOF) method. In this approach, the prescribed liquid material is contained within a defined domain of Eulerian elements bounded by a large domain. The amount of liquid material that is filled or emptied in an Eulerian element is defined by the Eulerian Volume Fraction (EVF) for that element. An element is fully filled with a material if EVF = 1.0, and this element is empty (void element) if EVF = 0. EVF ranges within 0.25, 0.5, and 0.75 for partially filled material. The free surface of a liquid flow is approximated from the boundaries of fully filled, partially filled or voided elements. During the material flow, the free surface of the moving material is tracked, and approximated as a continuous flow-front.
Interactions between Lagrangian solids, and Eulerian liquids were modeled by defining particular contact interactions among these two domain boundaries. During the liquid flow, the evolving Eulerian surface exerts pressure on the solid surfaces according to the flow density and pre-defined friction behavior, and both the liquid-solid interface share a common deformation behavior. However, this approach requires intensive computational power. For the present work, some computational efforts were reduced by assuming the EB-PVD columnar structures as rigid bodies with no translational and rotational degree of freedom. This assumption was acceptable for the proposed analysis, as the goal was primarily focused on the infiltration kinetics of the molten CMAS, but not the deformation and stress evolution in the TBCs.
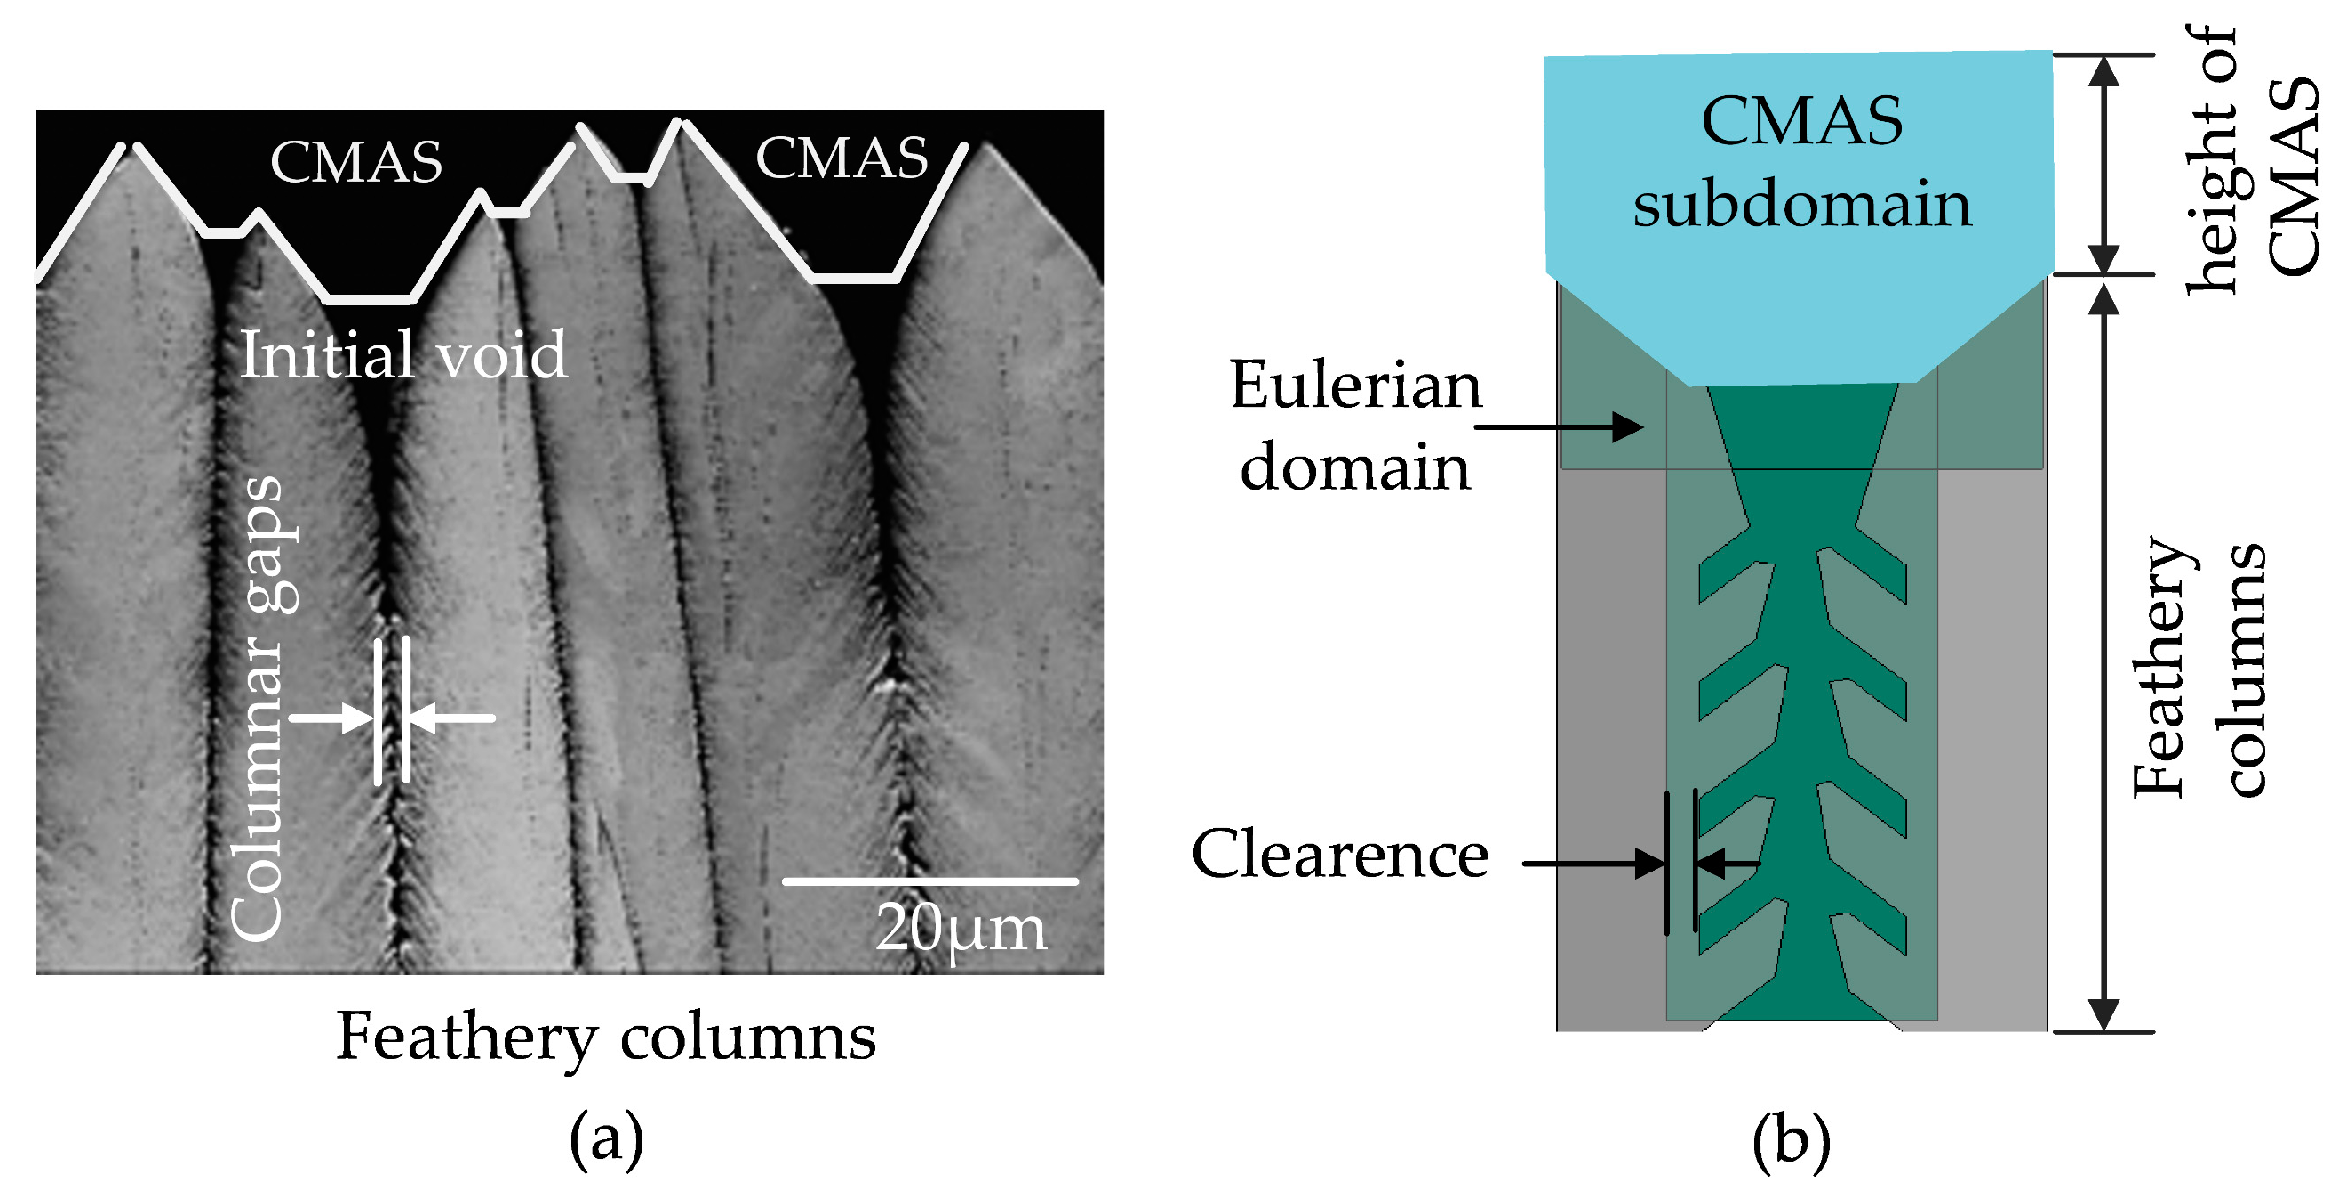
In Figure 6, the microstructure unit cell (MUC) was re-arranged for FSI modeling in a CEL framework. To define the Eulerian CMAS domain, an isosceles trapezoidal shape of the CMAS domain was identified according to the observation of the real microstructure (Figure 6a). Accordingly, an isosceles trapezoid sub-domain was defined over the void area of the MUC model as shown in Figure 6b. This CMAS sub-domain was assumed to be in the molten state, which has already been moved (or infiltrated) up to the column tips. To capture the primary effects of morphological influences on the infiltration behavior, it is sufficient to model the CMAS flow through the columnar gaps taking different feather morphologies.
For this simulation, an additional Eulerian domain with void elements need to be defined such that the domain occupies the columnar as well as feathery gaps, and it extends slightly beyond the Lagrangian domains by a small clearance. This clearance was required to ensure proper contacts in the fluid-solid interaction model. During simulations, the molten CMAS sub-domain flows through the Eulerian domain creating a moving free surface of the CMAS flow.

2.3.2. Boundary Conditions

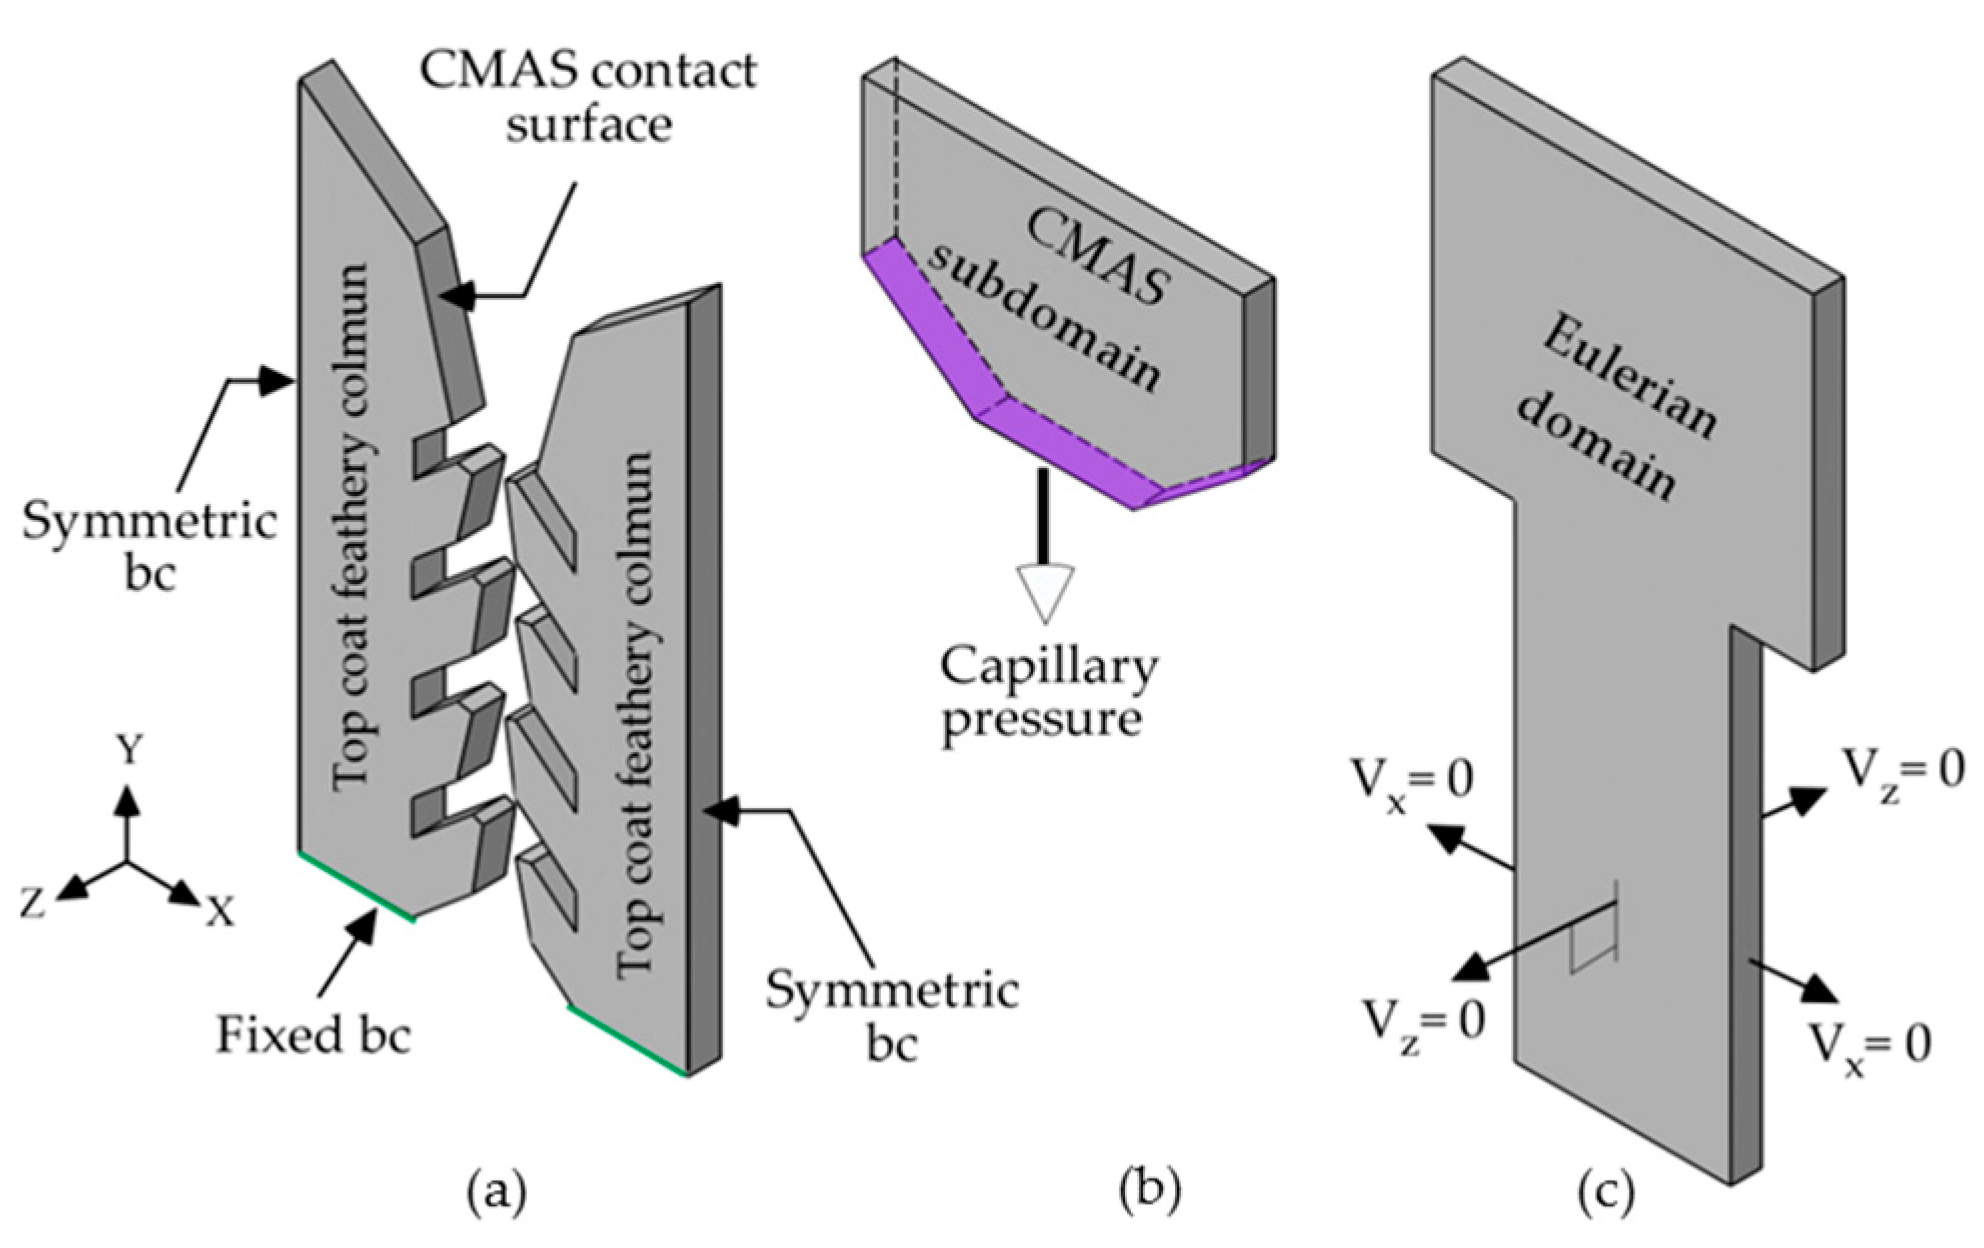
The applied boundary conditions are summarized in Figure 7. The columns are kept undeformed by applying rigid body constraints. The symmetric boundary condition was applied at the sides, and the fixed boundary condition at the bottom (Figure 7a).
To simulate the infiltration due to the capillary pressure along the feather gaps, a suction pressure (acting downwards) was imposed on the Eulerian subdomain (Figure 7b). An approximate value of the capillary pressure was calculated using Equation (1), as employed by [8] for an analytical infiltration analysis of the CMAS flow.
P = σ cos θ r eff
Here, θ is the wetting angle of the molten CMAS, σ is the surface tension of the liquid CMAS, and reff is the effective hollow radius between the columnar gaps. Assuming the fully wetted condition of CMAS, we obtained a zero wetting angle and cosθ = 1. The value of σ was taken as 0.438 N/m from the approximated value calculated for CMAS in [18], and reff was 18 µm from the microstructure analysis (Section 2.2.1).
Symmetry conditions of the Eulerian domain were implemented with velocity constraints in the required directions as follows: On X- and Z-planes the velocity is zero, i.e., VX = 0 and Vz = 0. In the Y-direction the velocity was kept unconstraint allowing an equilibrium liquid flow through the top (inlet) and bottom (outlet) surfaces (Figure 7c). The contact surfaces between the columns and Eulerian domains are assumed to be slightly rough where the interactions between these surfaces were defined by a Coulomb friction model taking a small friction coefficient 0.1. This assumption was taken due to the lack of sufficient knowledge that characterizes the CMAS-TBC contact surface interactions during the CMAS flow. As the friction coefficient is small, the flow behavior will be mainly controlled by the viscosity parameter of the CMAS liquid. For all the models the friction coefficient was kept the same, therefore, the results from these models were comparable.

2.3.3. Constitutive Behavior and Material Parameters of CMAS

  • Equation of State (EOS)
The properties of liquid silicate were described by an equation of state (EOS). With the EOS a quantitative functional relationship between the volumetric properties of a phase, and its specified composition, temperature (T) and pressure (P) can be established. In the present work, the EOS properties of the molten CMAS were approximated from the phase relationship of molten silicate: ‘Diopside (Ca2Mg2SiO6)–Anorthite (CaAl2Si2O8) eutectoid liquid’ due to the fundamental similarities of chemical compositions and physical behavior of CMAS [34,35].
For this particular molten CMAS, the complex relationships of their state variables, e.g., pressure, volume, and temperature were described by a Mie–Gruneisen type EOS material model as given in the ABAQUS software [33]. The constitutive model assumes the pressure as a function of the current density and internal energy per unit mass [p = ƒ(ρ,Em)], and takes the following form:
p = ρ c 0 2 η ( 1 s η ) 2 ( 1 Γ 0 η 2 ) + Γ 0 ρ E m
Here, p is the pressure, ρ is the reference density, η is the nominal volumetric compressive strain, Em is the specific energy, and Γ0 is the Grüneisen ratio. The parameter c0 is the bulk speed of sound in the material and s is a parameter determined from the shock compression test by relating the shock velocity (Us) and the particle velocity (Up). Plotting the Up in X-axis and Us in Y-axis, a linear relationship of c0 and s can be defined, which is known as the Hugoniot equation, and written as follows:
U s = c 0 + s U p
For the present work, the Hugoniot parameters for CMAS are approximated from the molten silicate data [36,37,38], which for the parameters c0, s, and Γ0 are: 3060 m/s, 1.36, and 1.52 respectively.
  • Density and Viscosity of Molten CMAS
The density and viscosity of CMAS vary with their chemical compositions and are temperature dependent [39]. The density of laboratory produced CMAS in this work has been taken from a similar CMAS composition [40], where the density is reported to be in the range of 2.6–2.8 g/cc at 1300 °C. The approximated value for the present work is 2.69 g/cc at 1260 °C.
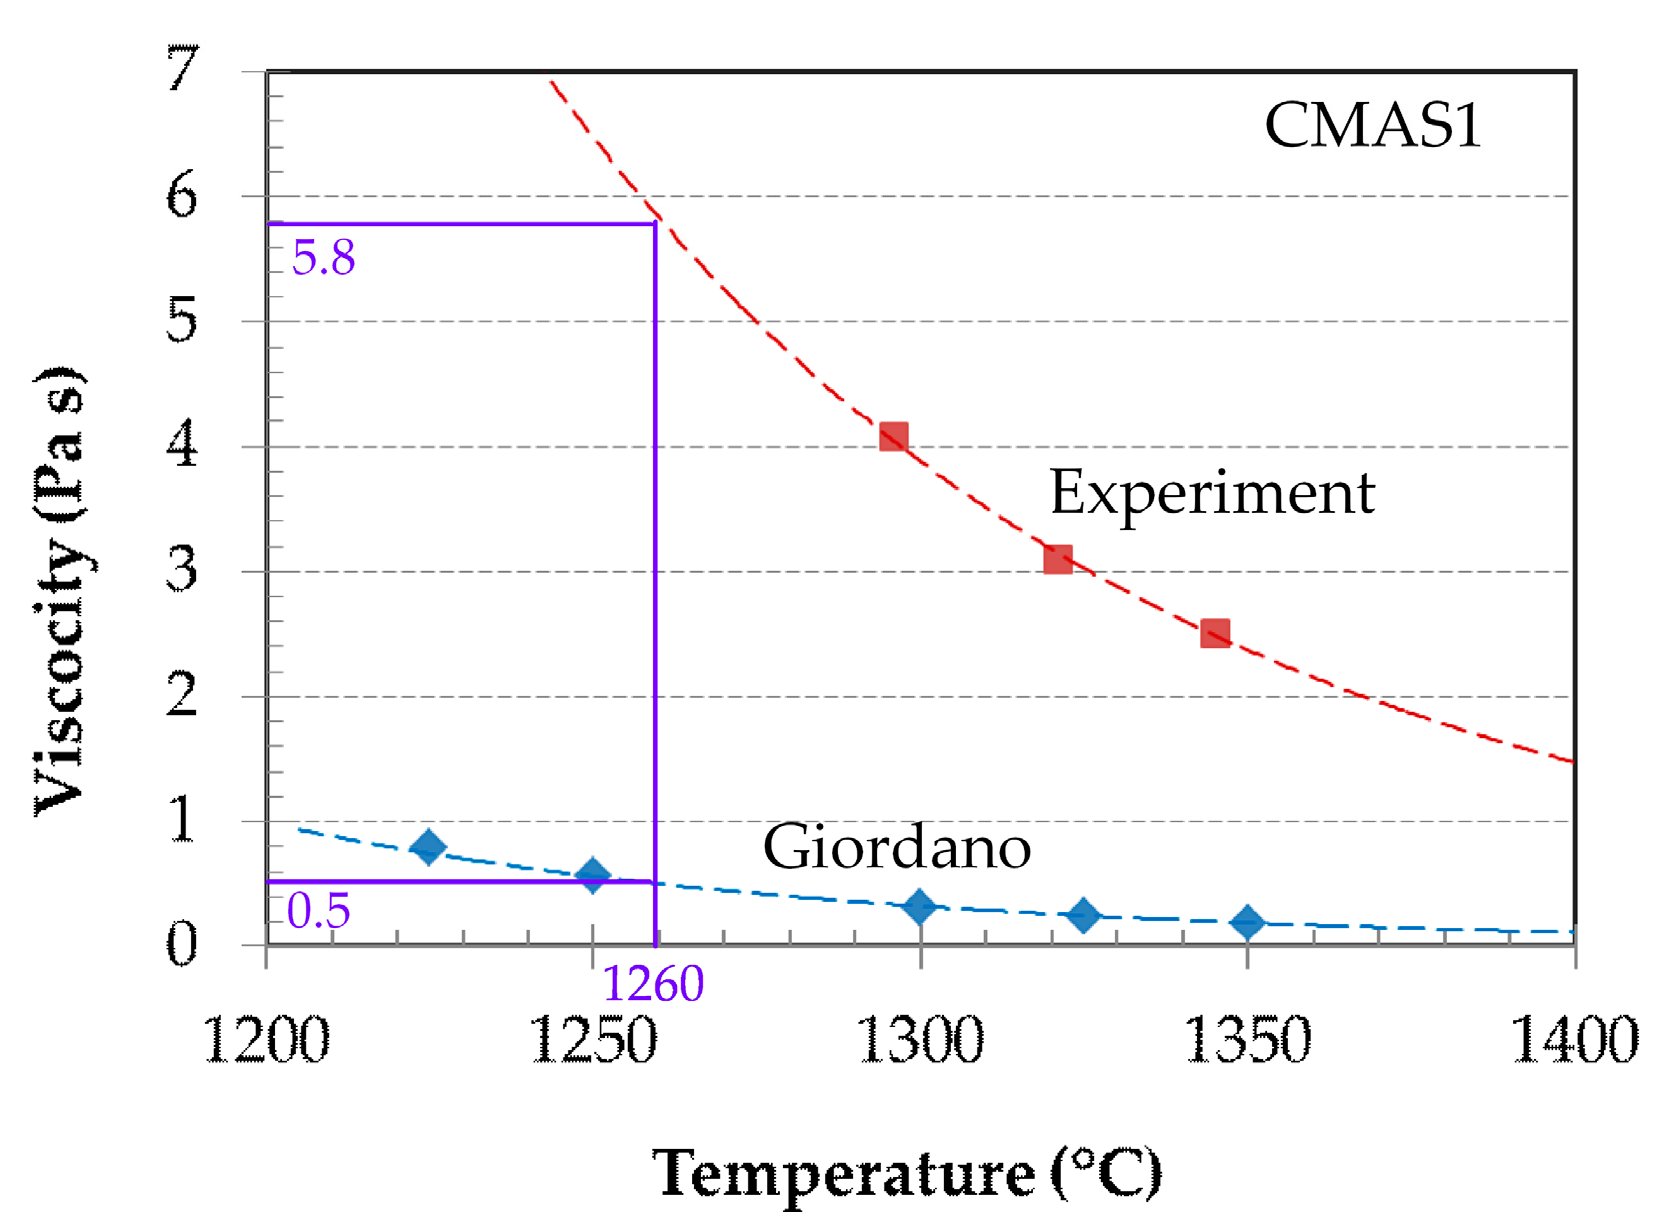
On the other hand, viscosity for the investigated CMAS was estimated by two methods: Experimental and theoretical. For a particular CMAS chemical composition (here, CMAS1: 41.68(SiO2)–24.56(CaO)–12.43(MgO)–11.05(Al2O3)–8.71(FeO)–1.57(TiO2)–0(SO3) at.%) in the temperature range of 1200–1400 °C, the obtained viscosity shows a rapid decrease with increased temperature [26]. Due to the complicated data measurement techniques at high temperature, only one data was taken at each temperature. In a second approach, the viscosity was estimated theoretically using a well-established Giordano (GRD) empirical viscosity model that takes into account the compositional variation of CMAS and temperature dependency [41]. This model was verified on a large database of chemical compositions of molten silicates that were experimentally obtained.
In literature, the Giordano viscosity model has been widely used to estimate the temperature dependent viscosity of CMAS for a wide range of chemical compositions [42,43,44,45]. For the present work, the estimated GRD viscosity for the CMAS1 shows a lower viscosity compared to the experimental obtained viscosity data [31]. In Figure 8 both the experimentally estimated, and GRD model based viscosity is plotted for different temperature ranges. One can find that the viscosity prediction of the GRD model for CMAS1 at 1260 °C is ~0.5 Pa s, and the experimental value is close to 5.8 Pa s [26], which is almost 11 times higher.
For the numerical simulations, we have considered two arbitrary viscosity parameters, representative to the GRD (lower) and experimental values (higher), to obtain a qualitative understating of the influence of viscosities on the infiltration behavior. Both the parameters are shown in Figure 8 at the vertical axis. Several preliminary studies of the infiltration behavior were performed. Calculations with the lower viscosity parameter were numerically faster. Therefore, most of the analyses were performed with the low viscosity parameter, from which a fundamental comparative understanding of infiltration kinetics with respect to the EB-PVD morphology was obtained.

2.3.4. EB-PVD Microstructure Model for Infiltration Analysis

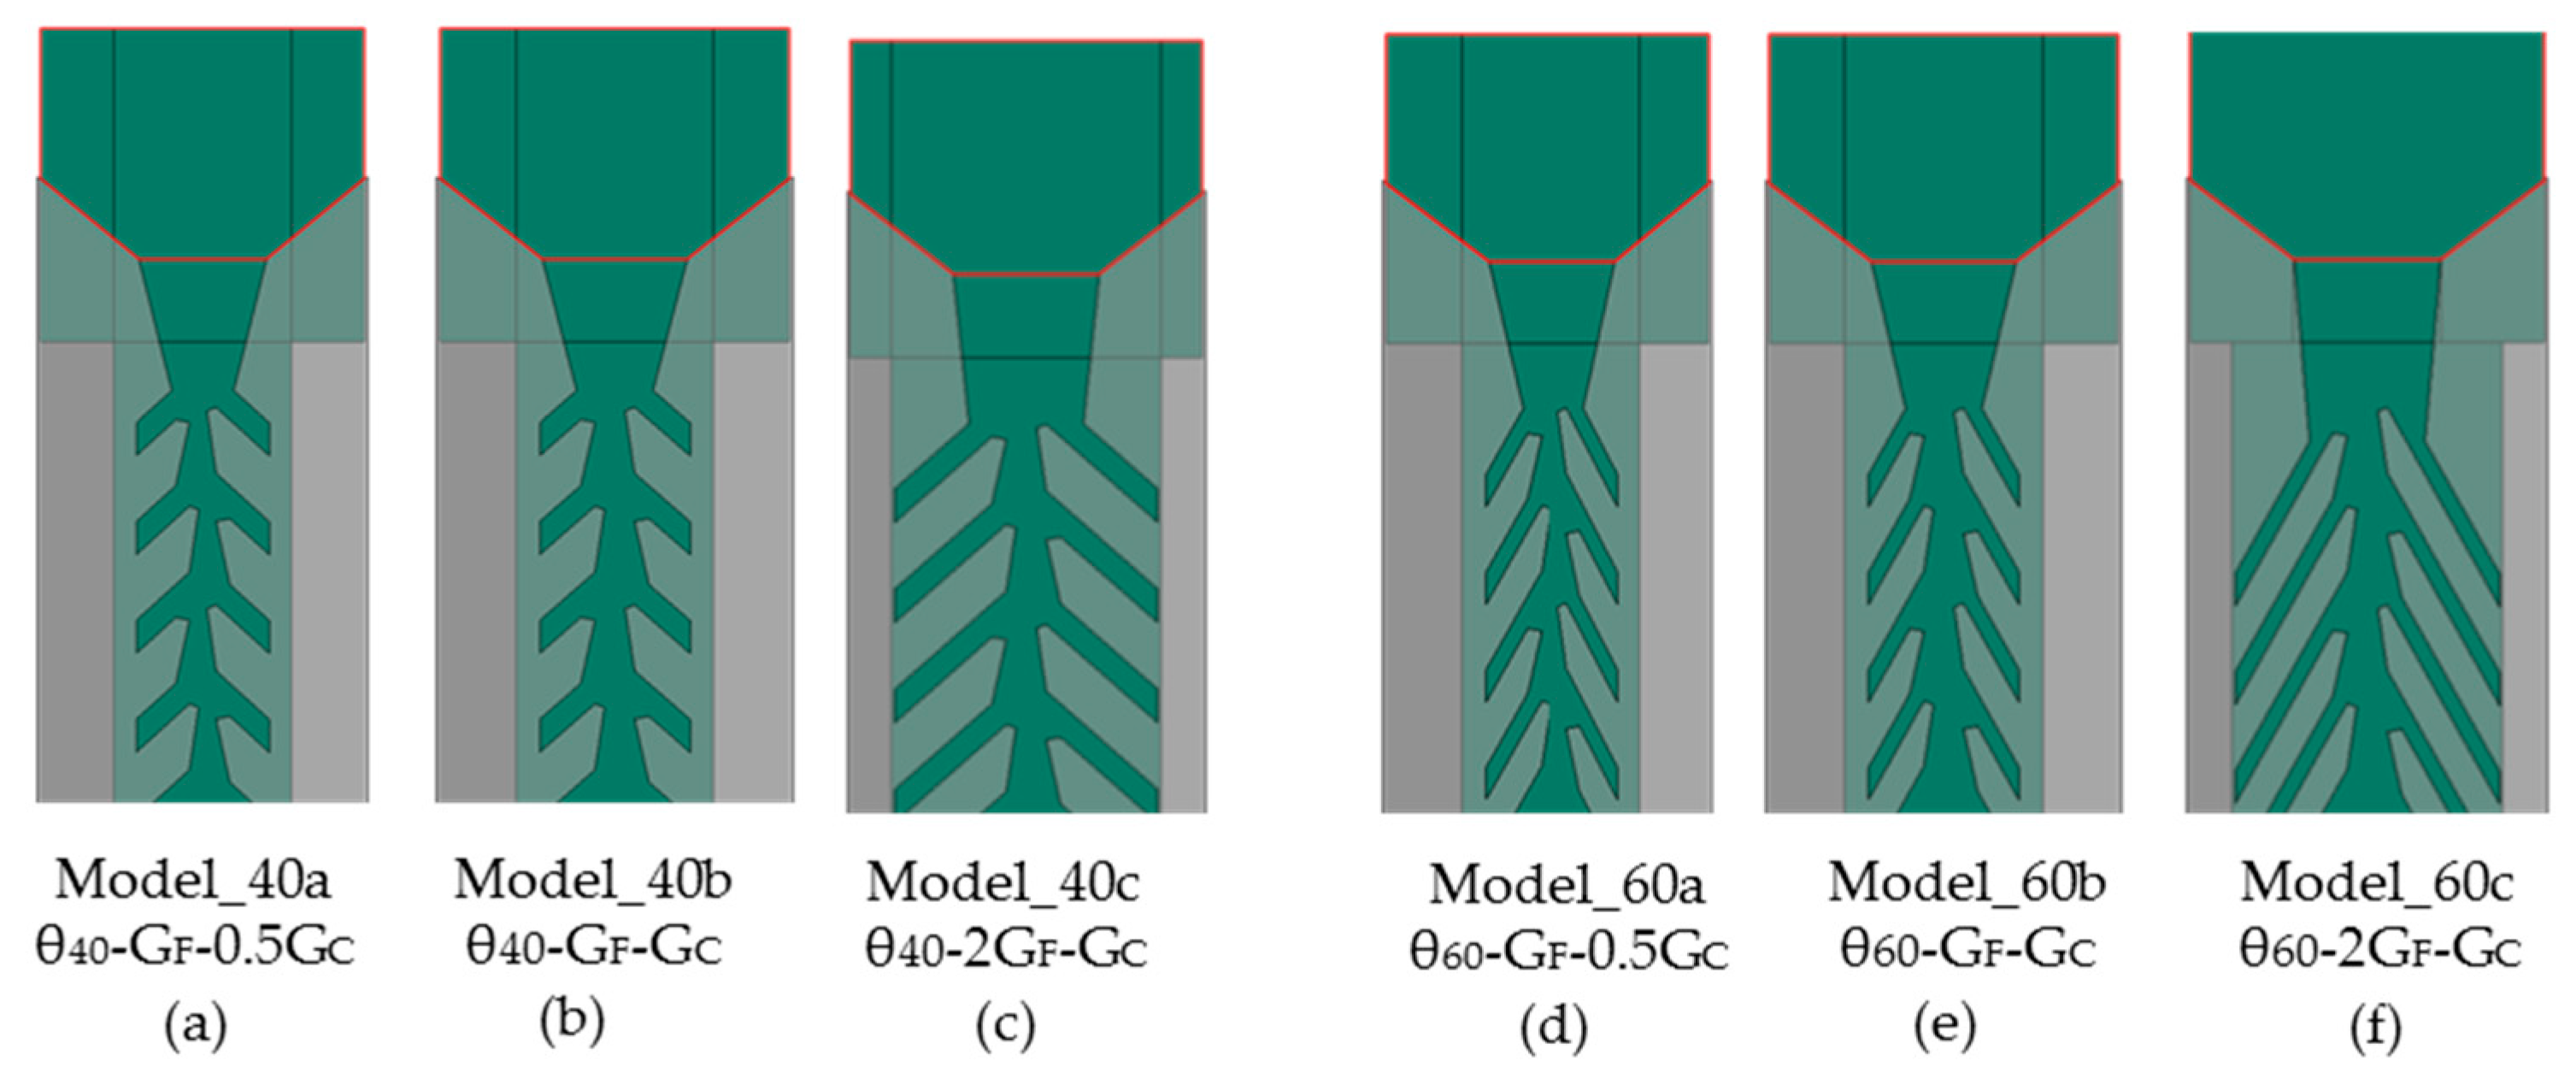
Geometric models having 40° and 60° feather inclinations with varying feather arm lengths (short and long), and columnar gaps (narrow and wide) were considered for the investigation of infiltration kinetics. For this purpose, six top coat model geometries were generated using a Python-based parametric model, where the morphological parameters were systematically varied. The models are shown in Figure 9. For each feather inclination angle (θF) two feather-arm gaps, GF, and two columnar gaps, GC were considered. Thus, changing the columnar gaps from narrow to wide and keeping the length of feather arms from short to long, the overall void vol.% (equivalent to porosity of the TBC) has been varied.
The six models are named according to the variables used for this analysis: θ(Feather angle)–(Feather gap/void)GF–(Columnar gap)GC. Thus, for the 40° feather inclination model with double length feather arm and half columnar gap is denoted as: θ40–2GF–0.5GC. Figure 9a–c shows the variants of 40° feather inclination models, and Figure 9c–e shows the variants of 60° feather inclination models.
It should be mentioned that the higher feather angle (60°) reduces the overall gaps between the feather arms, as can be seen in Figure 9b,e. During the model generation, the vertical gap parameter (VF) was kept the same for 40° and 60° inclinations. However, due to the angular decomposition of VF, the diameter of the feather gap for 60° inclined feathers (D60) was reduced to 0.94D40, where D40 is the feather gap diameter at 40° inclination.
To study the CMAS flow behavior, data were evaluated along the columnar gap, represented with I1, I2, I3, and I4 sections, and inside the void between feather arms, represented with 1, 2, 3, and 4 numbers, in Figure 10.
The time occupied by the molten CMAS to fill one Eulerian element with EVF = 1 located at the flow front was taken to be the infiltration time for that element. The distance from this element to the top surface was taken as the depth (or height) of infiltration. The total infiltration time is the time required for filling up the empty Eulerian elements along any direction, which includes longitudinal (vertical) infiltration in the columnar gaps and lateral (sideway) infiltration in the feather arm voids. It should be noted that the columnar height is the same for all the models but due to different feather morphology (e.g., feather inclination and length) the distance travelled by the molten CMAS within the feathery voids are not the same.
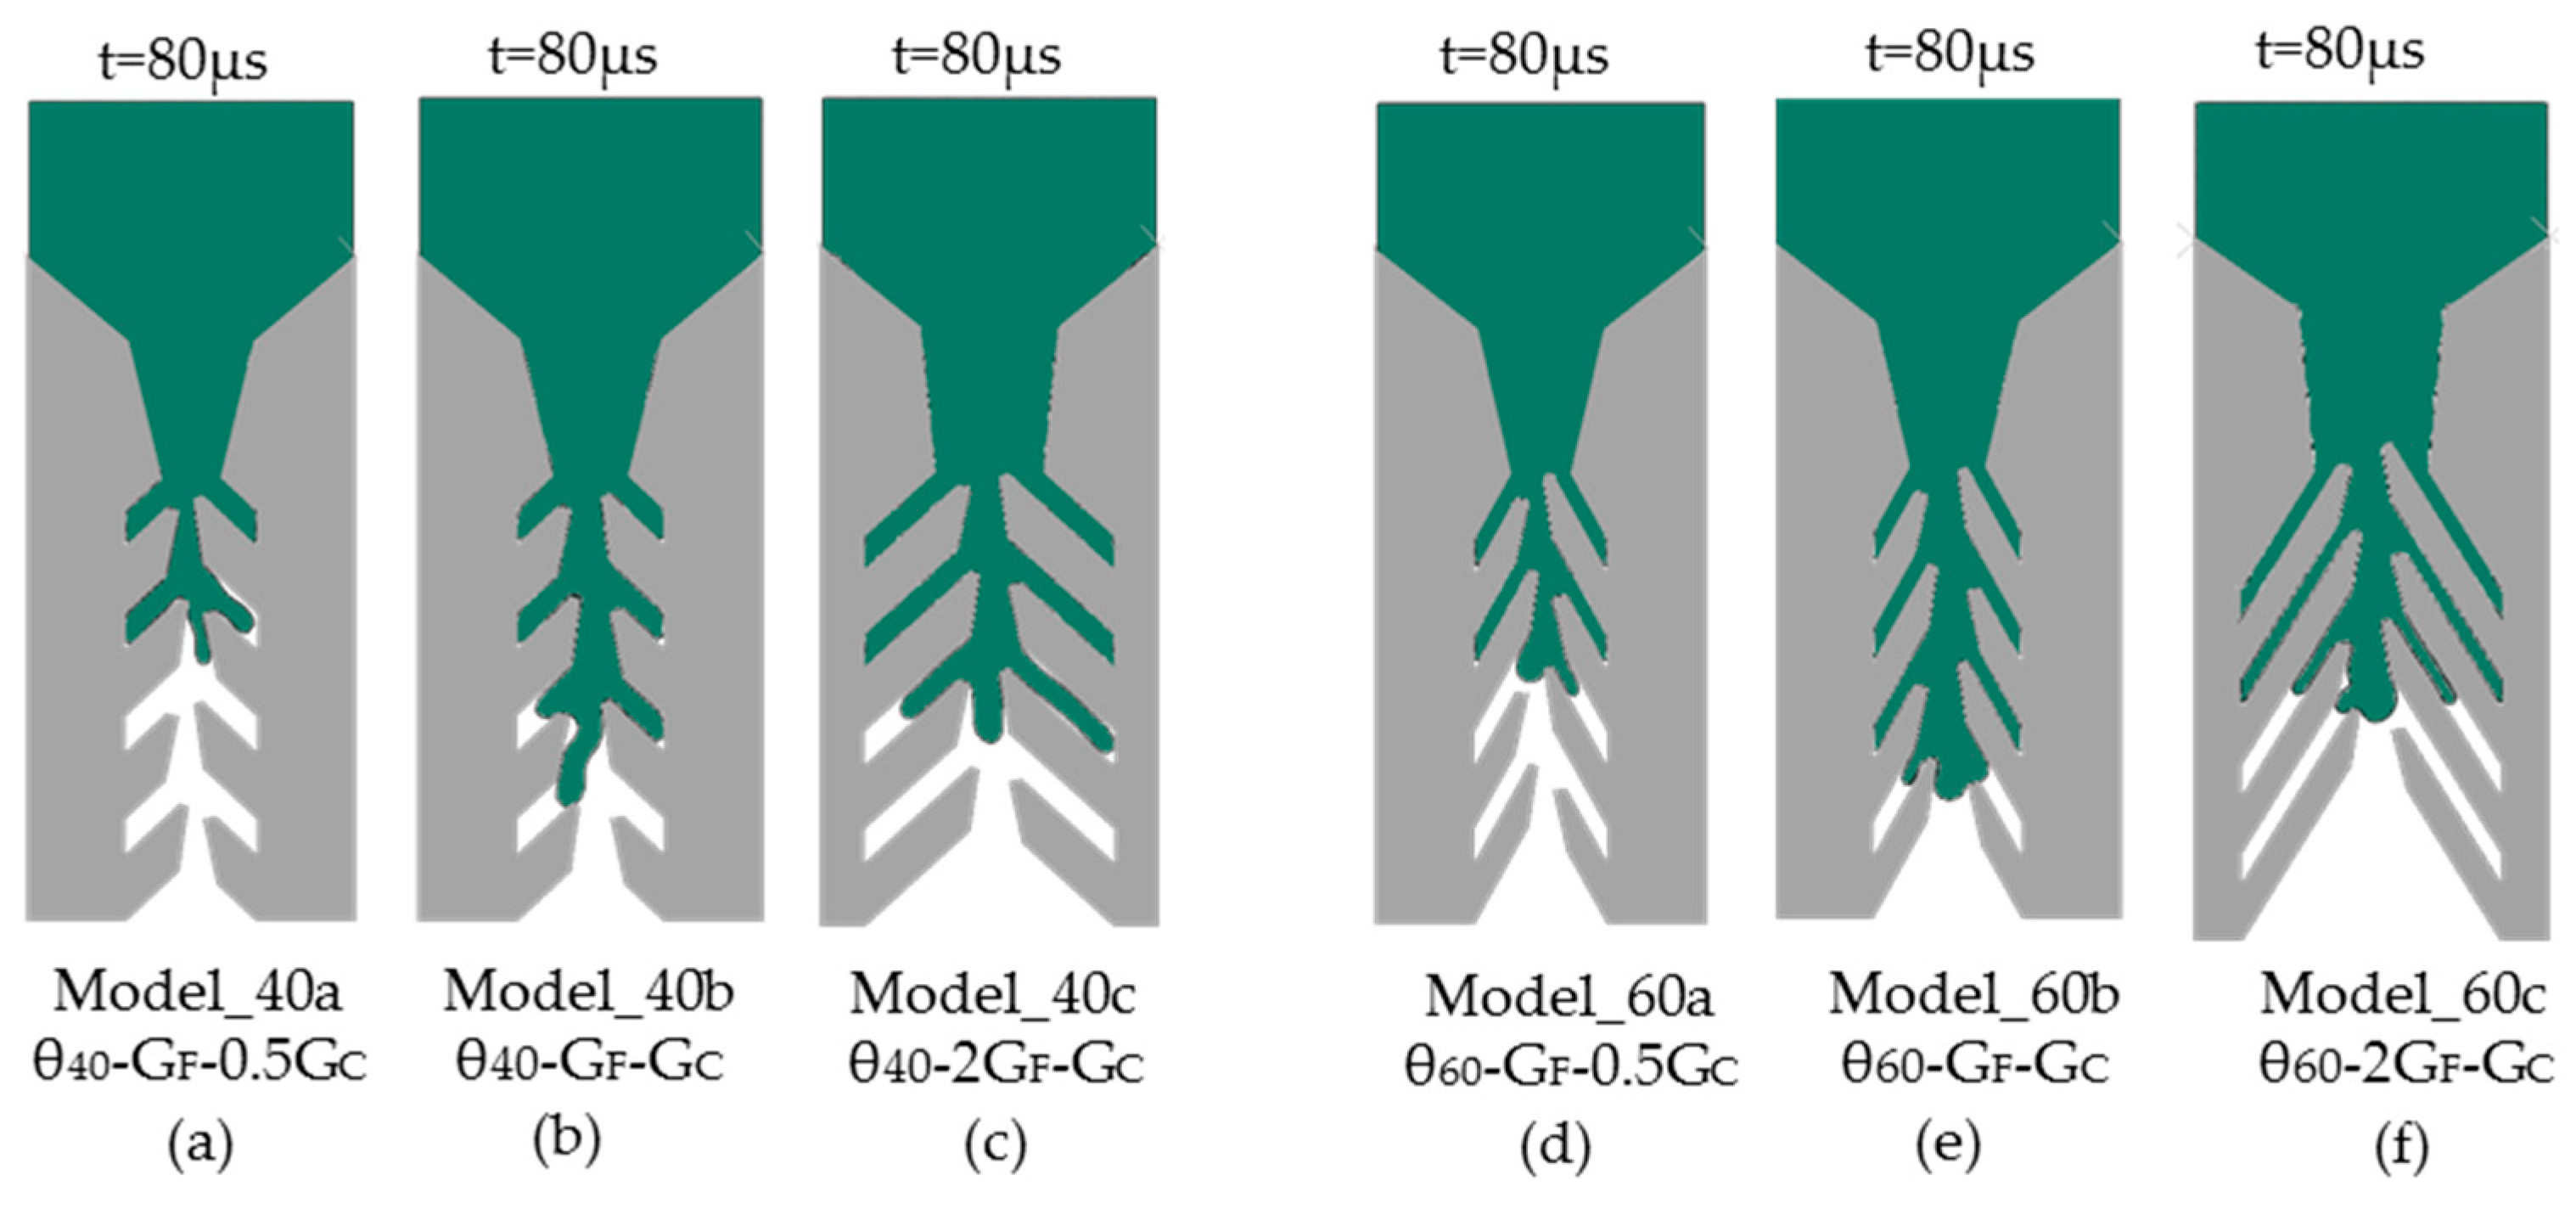
To obtain equivalent reliable numerical solutions from all the FE models, some pre-analyses were performed to optimize the mesh size, domain shape, and initial CMAS domain size. Only the optimized models were used for data evaluation and comparative analysis of the CMAS flow behavior. All simulations were performed using the low viscosity parameter until the CMAS infiltrated into the I4 section. For mutual comparison of infiltration depths, the data were evaluated after 80 µs of infiltration time.
In Figure 11, the infiltration along the longitudinal and lateral direction was shown for six models measured at 80 µs of infiltration time. Differences in the CMAS flow pattern can be well identified. The systematic analyses with the results are presented in the next section, where the infiltration kinetics with respect to the morphological variations is compared.

3. Results

3.1. Morphological Influences on Infiltration Kinetics of CMAS

3.1.1. Influence of Feather Inclination and Feather Arm Length on CMAS Infiltration

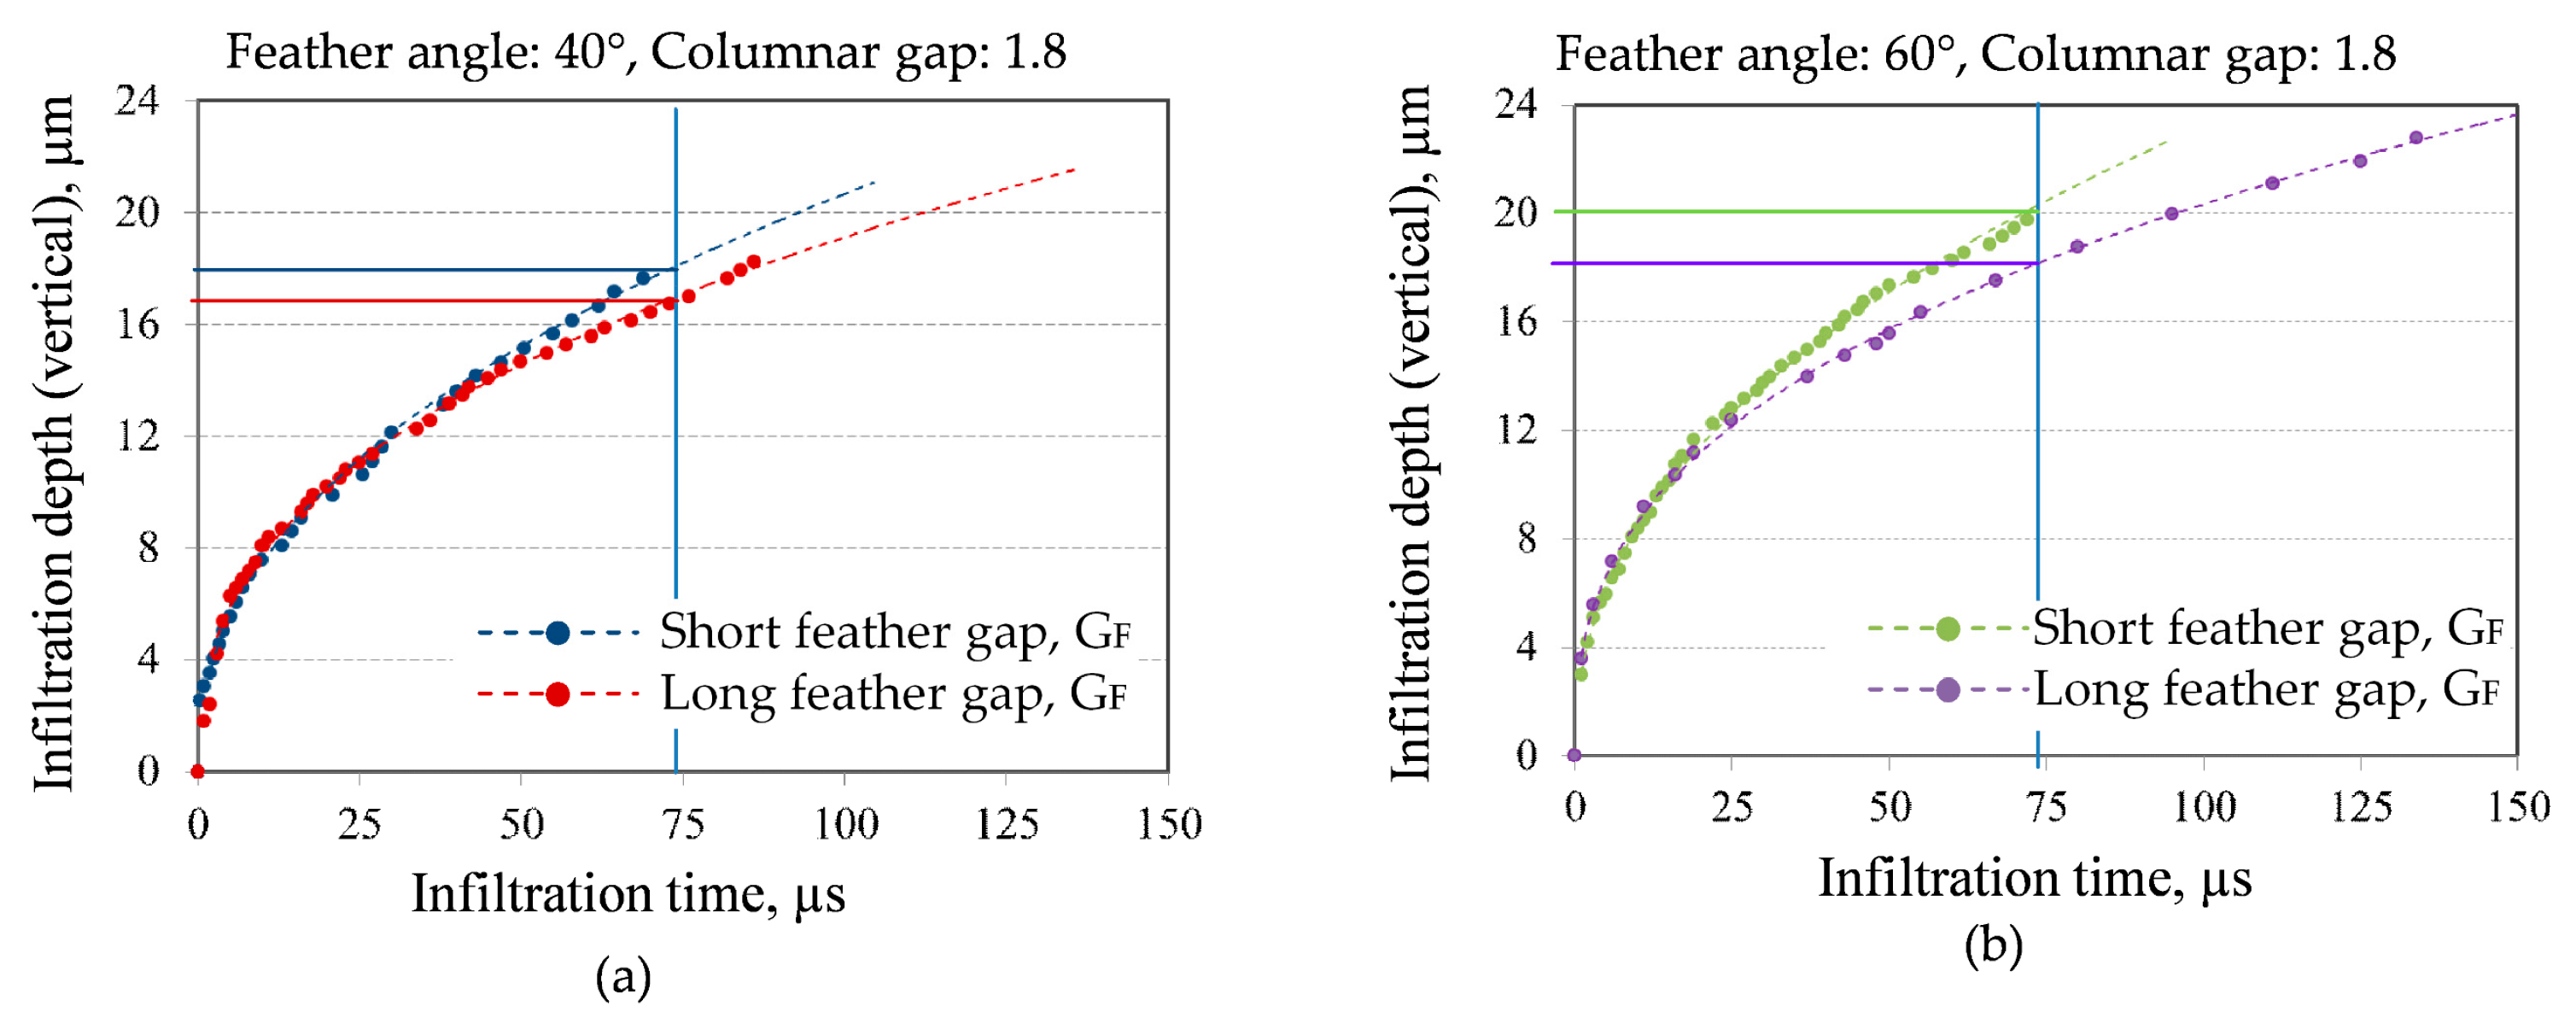
Infiltration depths along the columnar gaps in the longitudinal (vertical) direction and along the void between feather arms (feather gaps) for lateral (sideway) infiltration were analyzed. The estimated total time for longitudinal infiltration involves the time required to fill up the vertical gaps in columns, preceded by filling up the sideway gaps between feathers. In Figure 12, the longitudinal infiltrations are summarized for four models, with feather arm angles at 40° and 60°, and with short and long feather gap. The columnar gap was the same for all models to gain a comparative overview of the morphological influences on the infiltration kinetics.
The columnar infiltration depth increased almost logarithmically with time, i.e., the infiltration was initially faster, and became slower as the CMAS approached towards the bottom sections. This effect came from the gradual increase of friction effects from the increased contact surfaces during material flow. Friction between the Eulerian material and column boundaries offers continuous resistance during contact, as a result the non-linear decrease of the flow was found. It can be seen that for the models with longer feather arms (or gaps), the overall vertical infiltration decreased and a lower infiltration depth was obtained for a particular infiltration time (for example, at 75 µs time). Comparing Figure 12a,b it can also be found that the infiltration depth is higher for 60° feather inclination compared to 40° inclined feathers. This result is compared with horizontal lines at an infiltration time of 75 µs in Figure 12a,b. The prediction indicates that a higher inclination angle of feather arms facilitates an overall easy flow of CMAS in the vertical direction.
The lateral (sideway) infiltration through long and short feather gaps was also analyzed in order to obtain a comparative view of local flow characteristics inside different types of feather gaps. The results are summarized in Figure 13 in terms of the feather position from the top (feather height) and time of infiltration. Data points were taken at the end of feather gaps in feather sets (FS), marked by 1, 2, 3, 4 in Figure 10. In these simulations, primary infiltration occurred vertically in the columnar gap, and in the course of the CMAS flow the secondary infiltration occurred sideways along the feather gaps. In Figure 13a,b, the results were compared for infiltration through feather gaps for the third feather-set FS3 for 40° and 60° feather angles. The apparent relationship between the infiltration time and infiltration depth inside the feather gaps are marked for both the cases. As shown in the plots, the CMAS flow inside the longer feather gaps requires higher time to fill-up. For the longer feather arm model, the dotted trend lines for data points (FS1–FS3) lies slightly above the trend line of the short feather arm model. The trend lines indicate that the infiltration depths at a particular time are slightly higher for longer feather gaps. This result is due to the slight differences in the contact surfaces for the long and short feather gaps. The short feather models exhibit slightly more tortuous flow path, which consists of several feather tips with complex geometry. The frictional effect on the flow front is affected by this geometry; as a result, slightly lower infiltration height was achieved in this model.

3.1.2. Influence of Columnar Gap (Narrow and Wide) on CMAS Infiltration

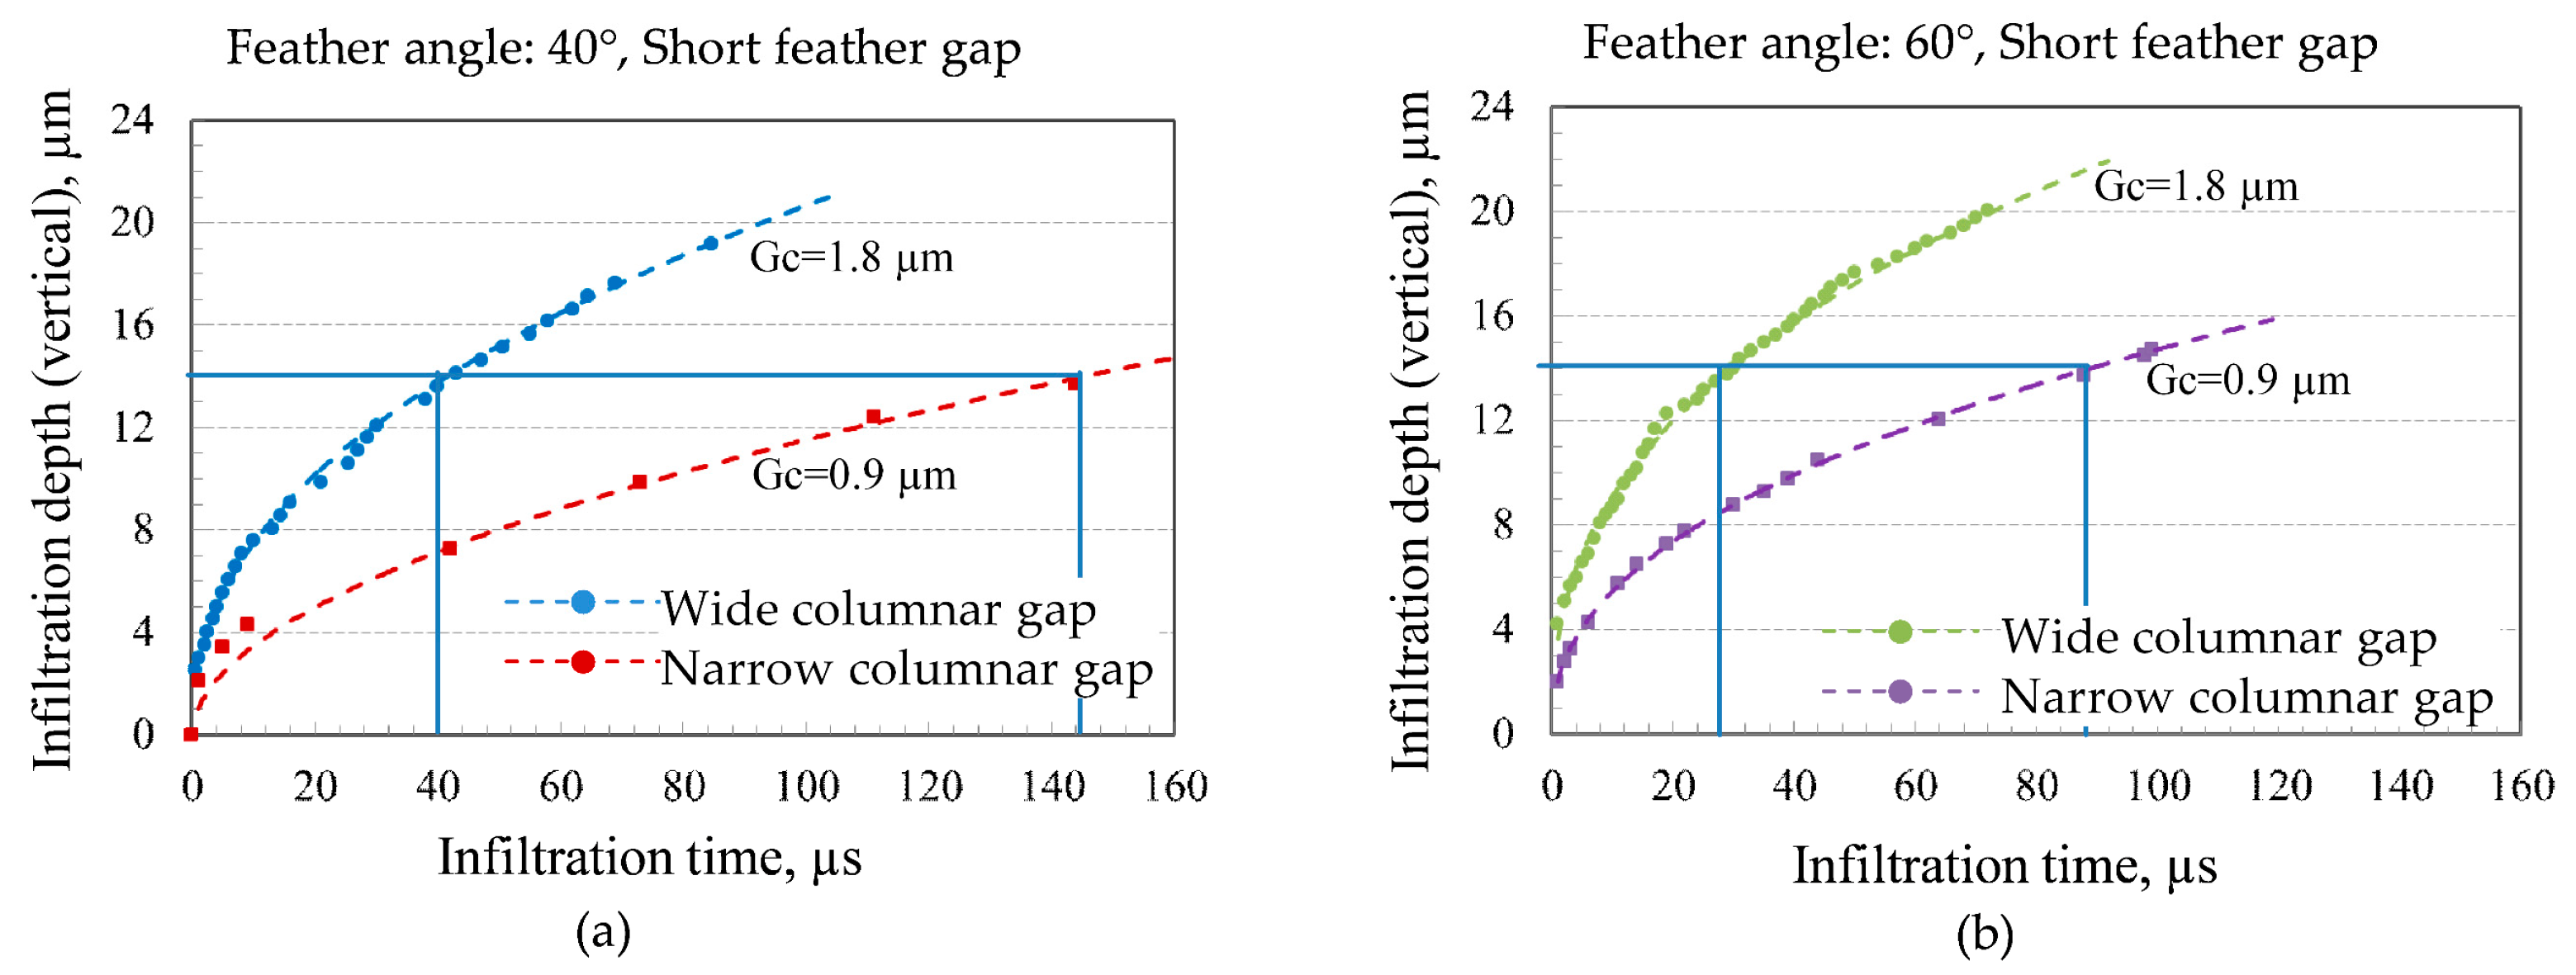
The influence of the columnar gap on the infiltration behavior was studied for narrow (GC = 0.9 µm) and wide (GC = 1.8 µm) columnar gaps. Narrow columnar gap models were obtained simply by halving the inter-columnar gaps from the previous models. Models with short feather arms taking 40° and 60° feather inclinations were used. In Figure 14a,b, the infiltration depths with respect to time were summarized. For a particular infiltration depth large differences in the infiltration time were obtained between narrow and wide columnar gaps.
In Figure 14a, the infiltration time was almost 3.5 times higher for narrow columnar gaps to travel an infiltration depth of ca. 14 µm. By normalizing the data for total infiltration time, it can be shown that the infiltration time was increased by 250% in narrow columnar gaps (GC = 0.9). The feather inclination was 40° for these models. Similarly, it can be shown from Figure 14b that the infiltration time was increased by ca. 200% in the narrow columnar gap for an infiltration depth of ca. 14 µm considering 60° feather inclination. The results showed that the reduction of the columnar gap width by a factor of 2.0 could reduce the infiltration time significantly. Comparing the results for feather inclinations one may also find that the models with 40° feather inclination showed reduced overall flow, which means, this model microstructure was more resistive to the molten CMAS infiltration compared to the 60° feather inclination model.

3.1.3. Microstructure Influence on the Infiltration Rate and Velocity

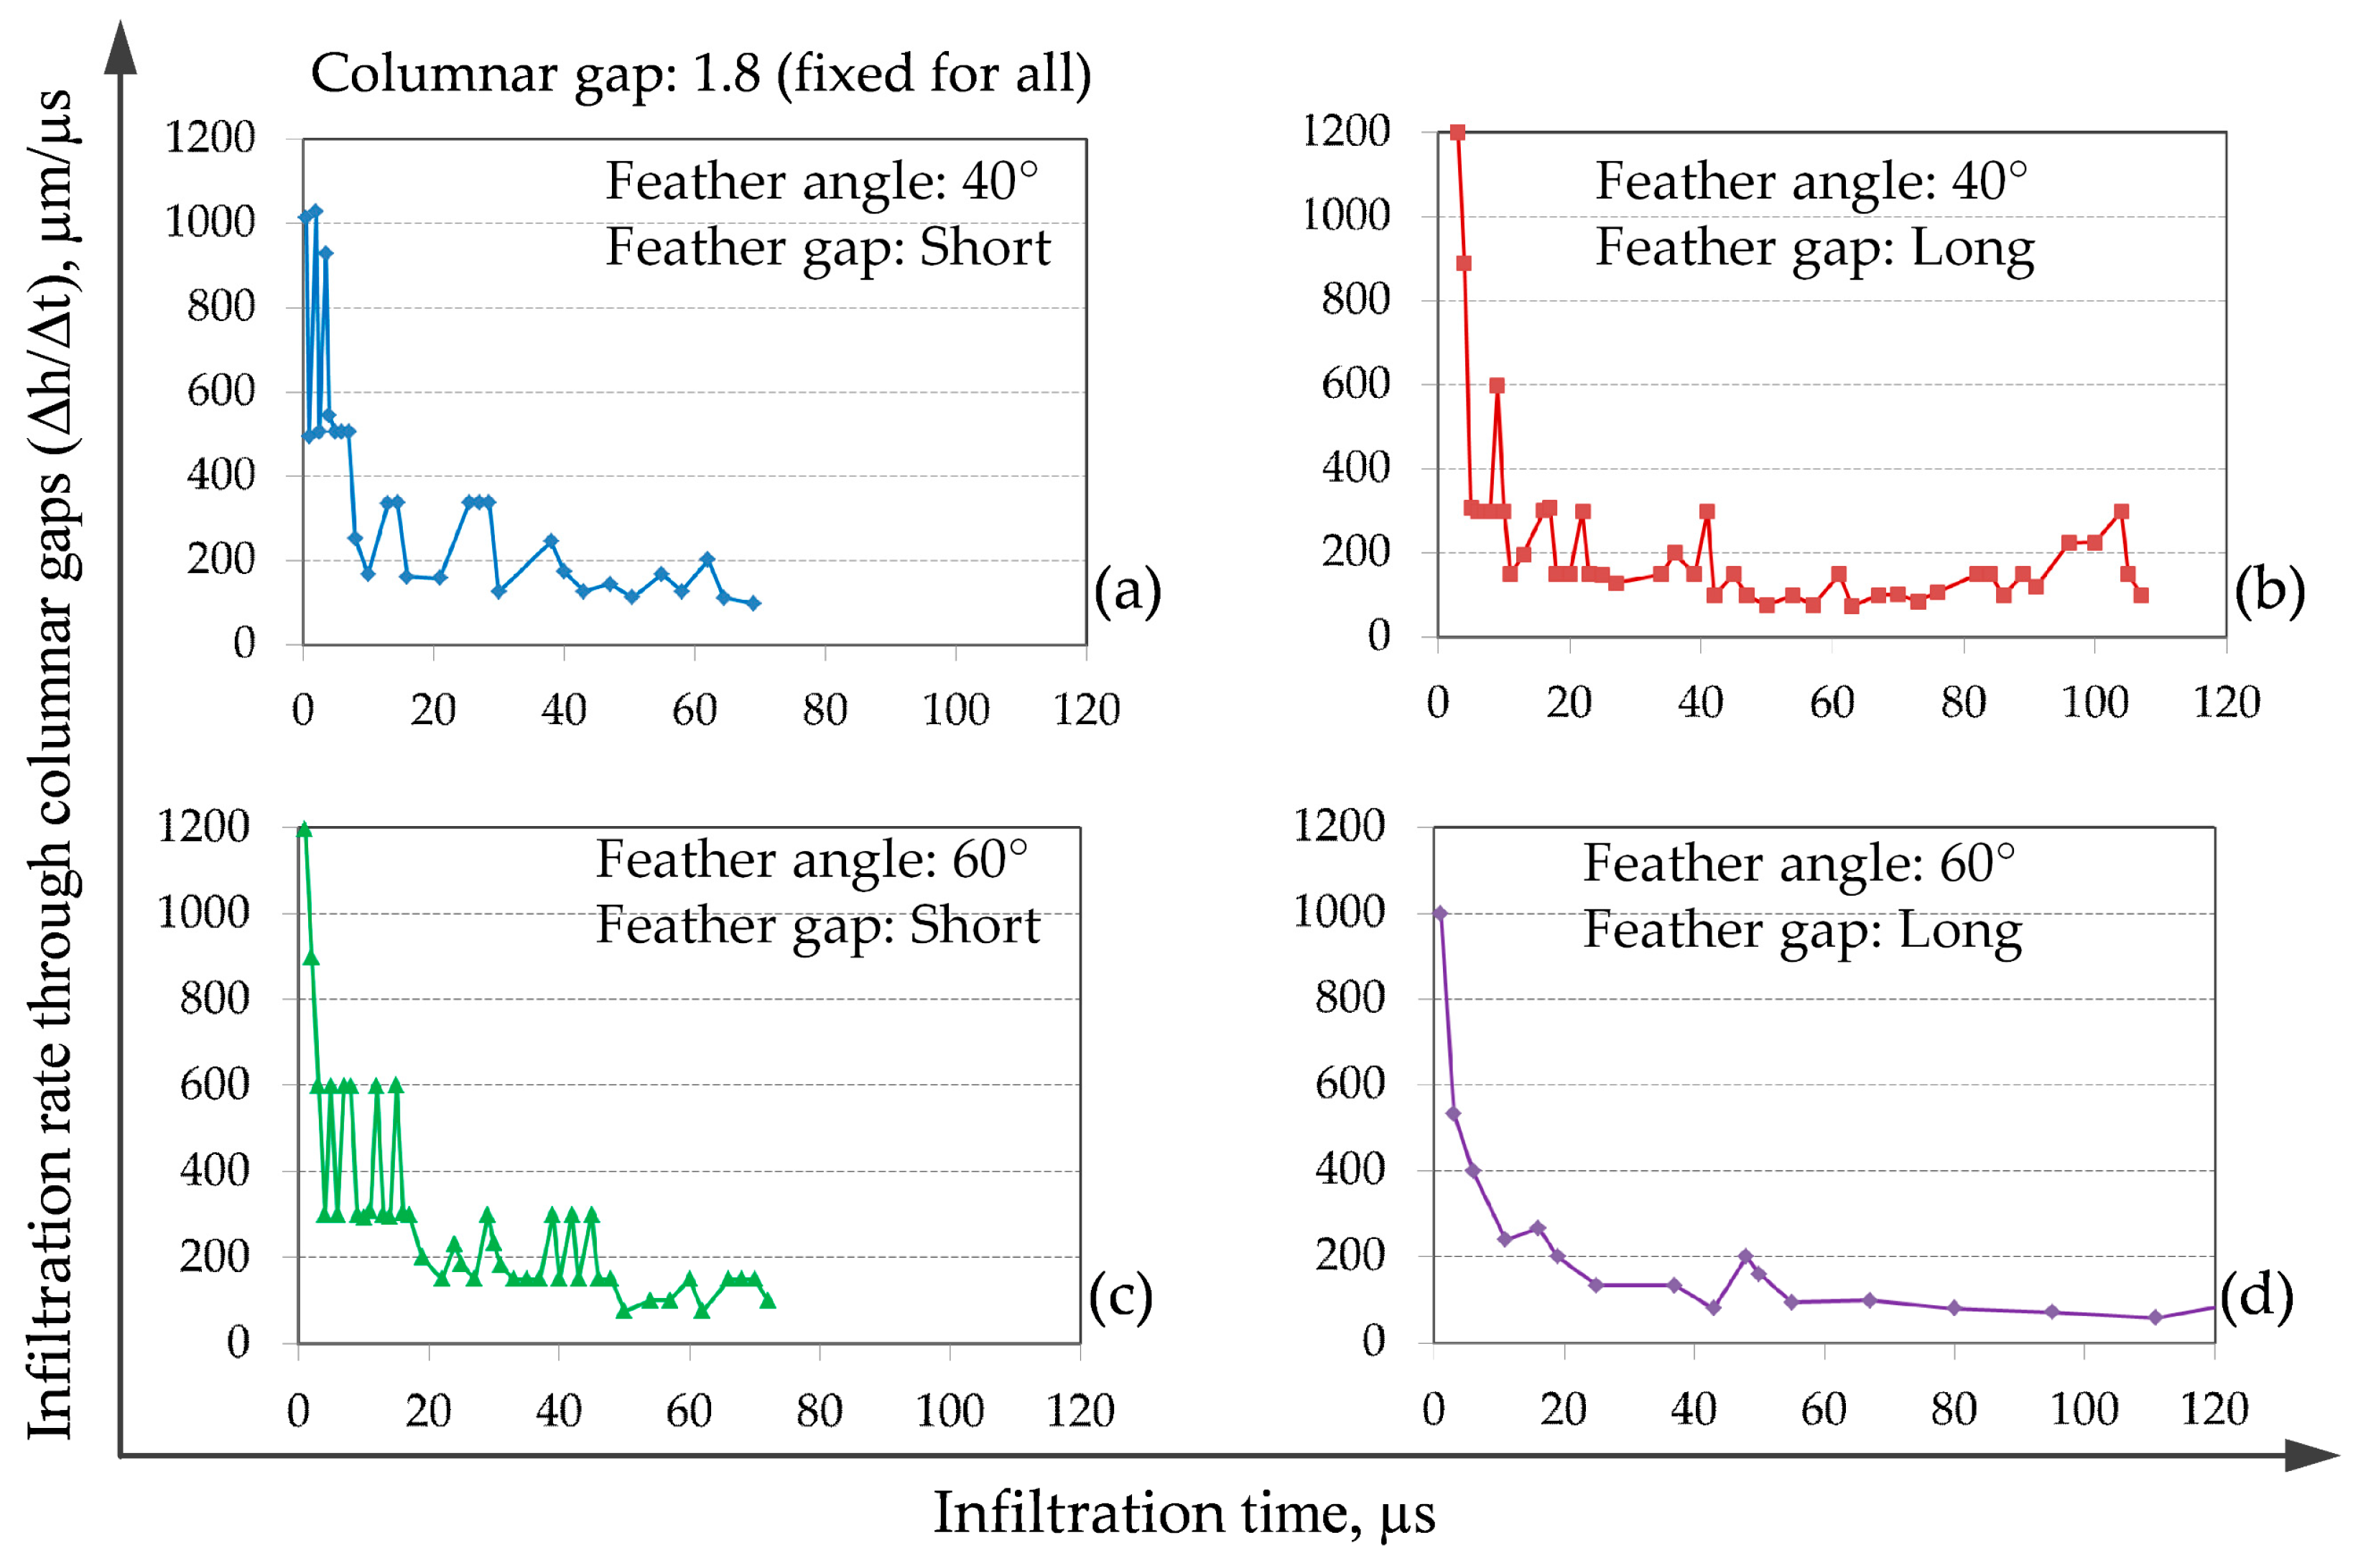
The morphological influence on the local infiltration kinetics can be understood clearly by analyzing the instantaneous rate of infiltration through columnar gaps for different feather morphologies. The instantaneous rate of infiltration was defined as the incremental change (Δh) in the columnar infiltration depth of the molten CMAS with respect to the incremental infiltration time (Δt). The infiltration rate was measured considering the morphological variations of feathery columns obtained by changing the feather arm size (for short or long GF = 1 or 2) and feather inclination angle (θF = 40° or 60°).
In Figure 15, the infiltration rate with respect to the total time of infiltration was summarized for these models. From the plots (a–d) exponential decreasing trends of the curves were observed. The curves showed very high infiltration rate at the top of the columnar gaps just below the throat area. At this location only a little contact surface between TBC and CMAS was present, therefore, less frictional drag was activated allowing faster CMAS flow rate.
The rate of flow drops drastically when the contact surface was successively increased with the moving flow-front of CMAS. After filling up several feather gaps, the slope of the curves decreased gradually due to the decreasing flow rate and finally the rate became the slowest at the bottom of the columnar gap.
The rates of infiltration showed locally up and down zigzag patterns in the curves. These undulations were due to the interactions of CMAS at each feather-arm tips it encountered. At this location the primary flow path at the vertical direction put forth a new flow-path along lateral (sideway) direction through the feather gaps. Eventually, new contact surfaces came gradually in contact with the sideway flow which reduced the overall flow kinetics. As a resulting effect, the vertical infiltration became temporary stagnant or progressed with a minimal rate. Once the feather gaps were filled with CMAS, the vertical flow became faster again. The zigzag pattern was the result of slow-fast infiltration rates along the columnar gaps due to the branching of the CMAS flow path. The slow rate was induced by the lateral movement of CMAS through feather gaps having different morphological variations.
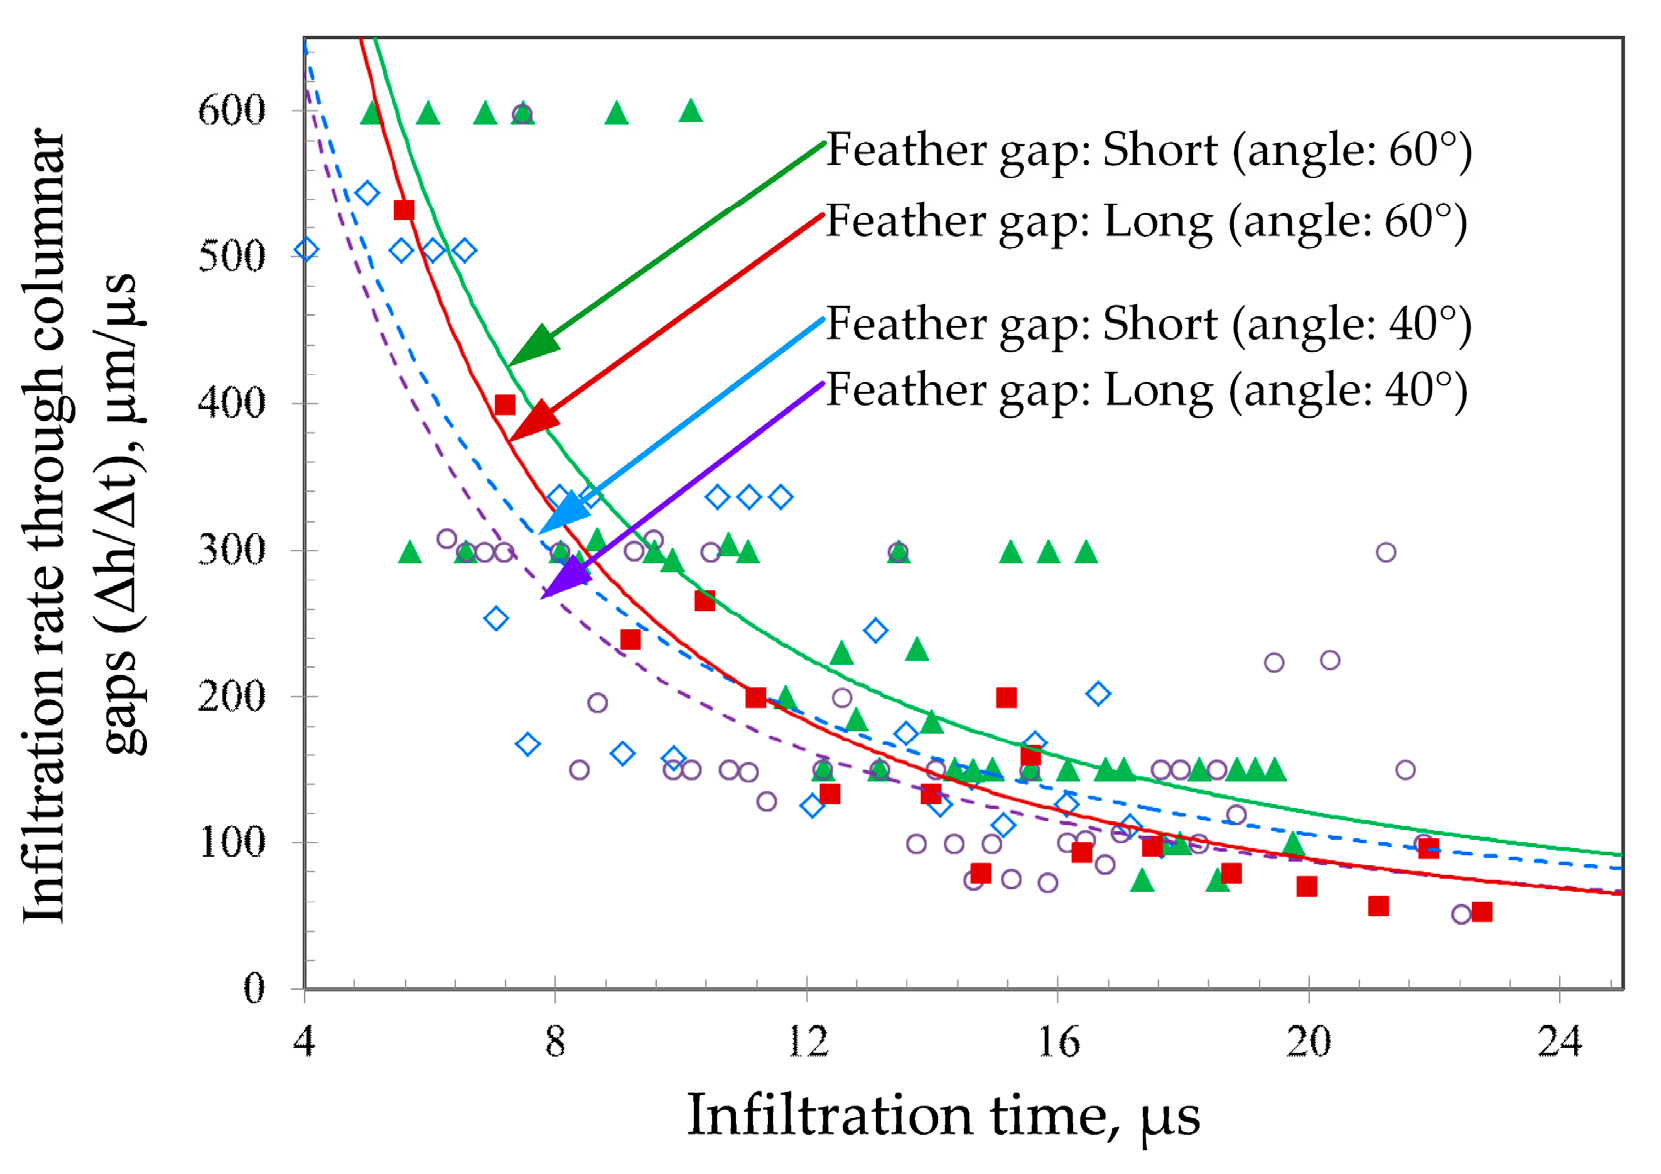
For a comparative study of the overall rate of the vertical infiltration with respect to the variations of feather arm length and inclination, the previous flow curves were reorganized with respect to the trend-line behavior of infiltration kinetics. The trend-lines basically approximate the curve behavior by fitting polynomial functions based on the available data points, thus the zigzag data patterns were idealized. In Figure 16, the morphological influences on the flow behavior can be recognized more clearly, from which two conclusive results can be drawn: (i) changing the feather inclination angle from 40° to 60°, the vertical infiltration rate (overall infiltration) at column gaps became faster; and (ii) increasing the feather length from short to long the vertical infiltration rate becomes slower.
For the first case, the 60° feather inclination narrowed down the feather gap diameter slightly (can be seen in Figure 9). As a consequence, the frictional drag per unit area was increased; therefore, the CMAS flow rate was reduced inside the feather gaps. However, the overall porosity is reduced, therefore, during less lateral flow in the feather gaps, more liquid flows into the vertical gaps, resulting in a faster flow rate (on average) compared to the 40° feather angle model.
For the second case, the longer feather arm increased the feather gaps. The frictional contact surface that the flow-path encounters becomes longer as well. In this model, during the CMAS flow the vertical flow-path subdivided into wider and longer branches along the feather gaps, reducing the effective flow rate along the vertical direction.
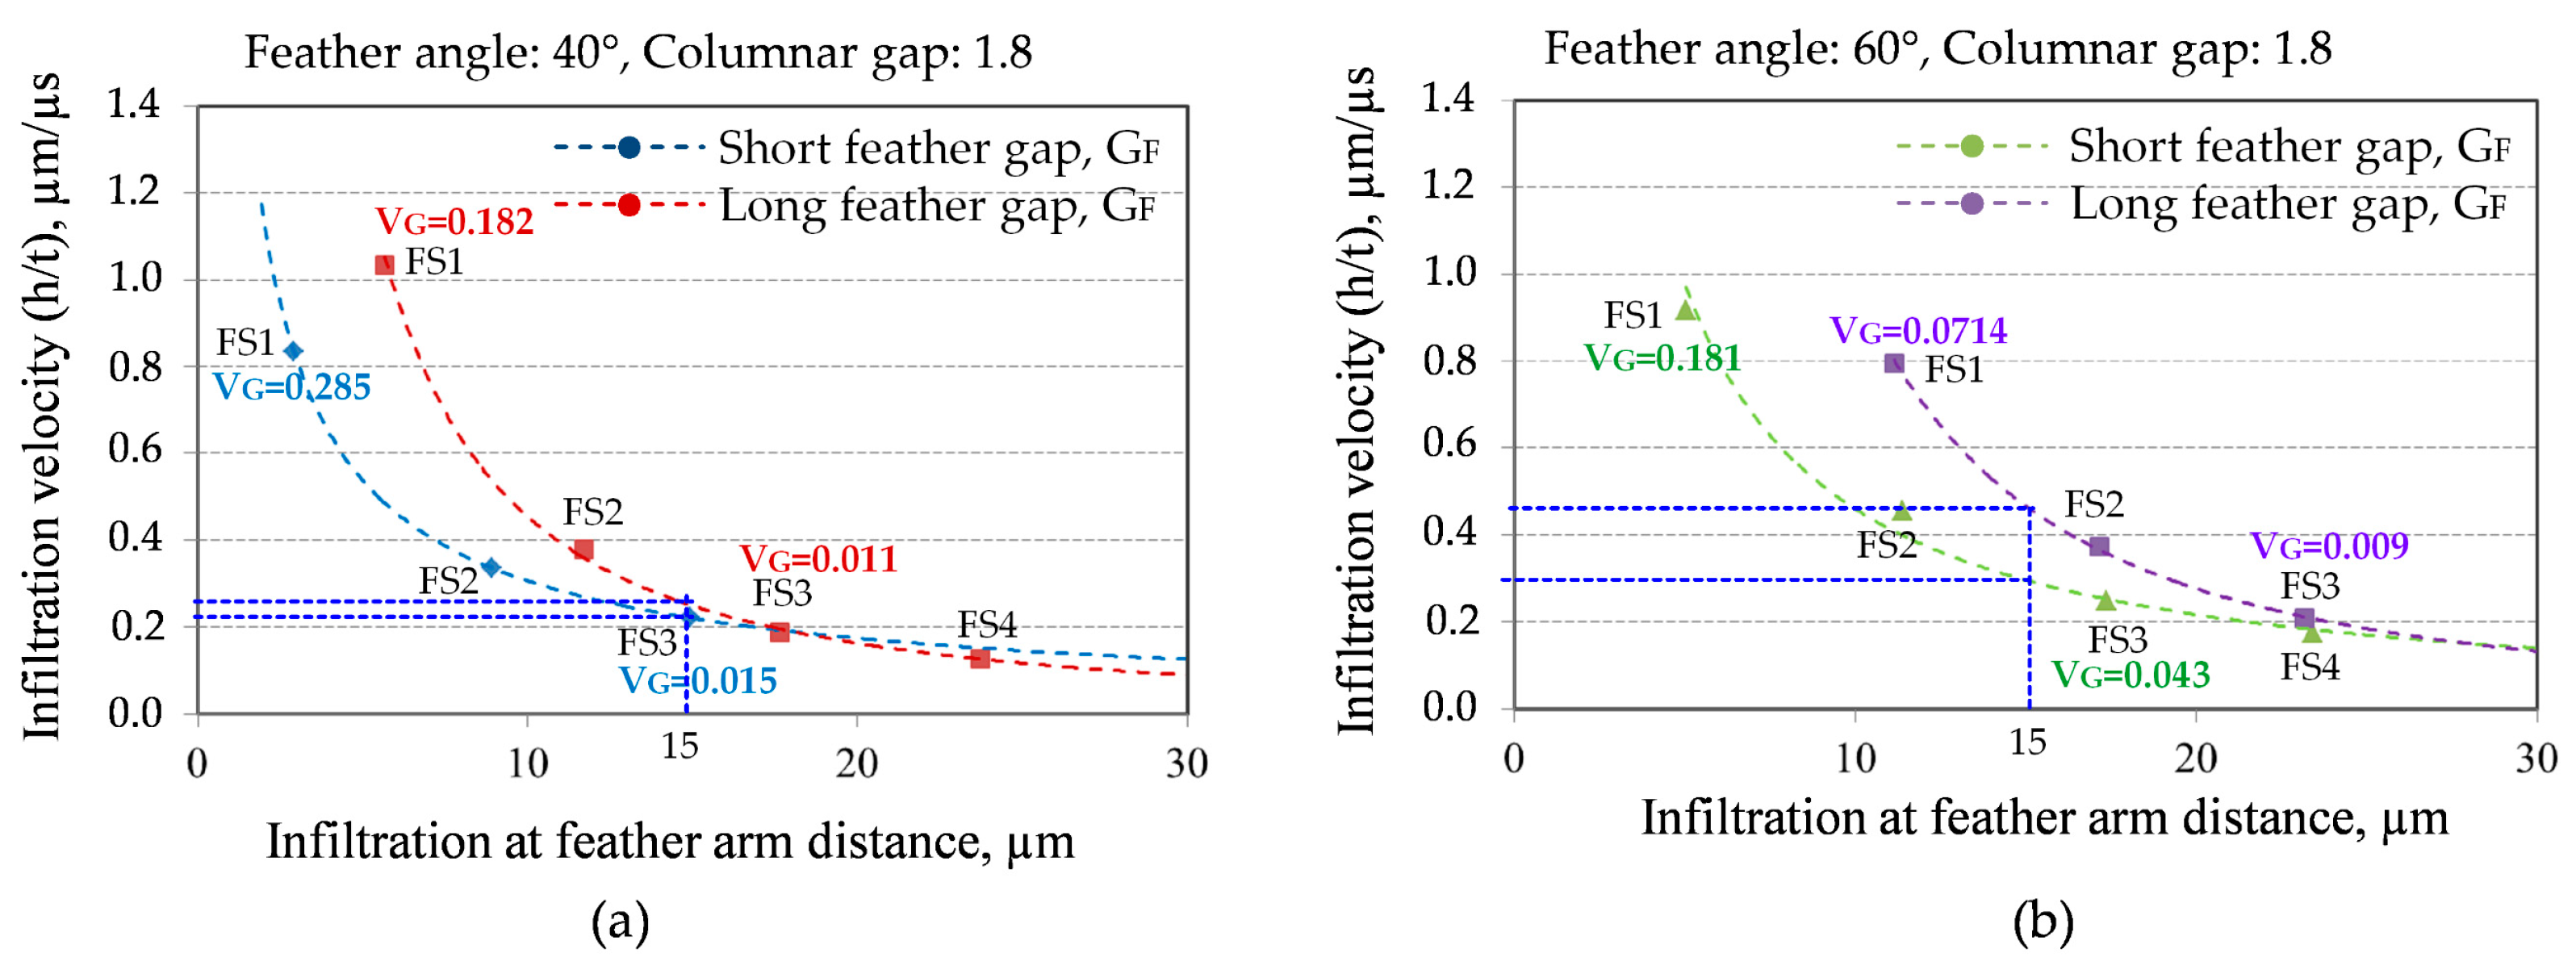
To understand the overall rate of lateral (sideway) infiltration, the infiltration velocity was computed along the feather gaps for each feather set (FS). An average infiltration velocity was estimated by measuring the required time for distance travelled by CMAS at the feather gaps. In Figure 17, the results were summarized for the four models. As the distances of the feather arm sets (FS) from the top position were different, different infiltration depth for FS1–FS4 was obtained. To compare the results, the trend-line behavior of the velocity data was analyzed.
The trend-lines showed that the flow was faster at the first feather gaps, and with the course of time, it was reduced successively for the second and third feather gaps. The reduction rate of the velocity depends on the frictional surface areas against which the CMAS interacts during flowing. For longer feather gaps the velocity reduction is higher, as the CMAS has to travel longer distances by overcoming longer frictional flow paths.
It should be noted that the high velocity (faster flow) at the FS1 is influenced by the wide CMAS entry area, which is slightly different for each model (recall Figure 11). The feather set FS3 is away from the CMAS entry area, therefore, at this position the flow becomes steady. This steadiness with respect to the feather gap size and inclination is compared with the velocity gradient (VG = Δvh) data, as shown in Figure 17.

3.2. Influence of Viscosity on CMAS Infiltration

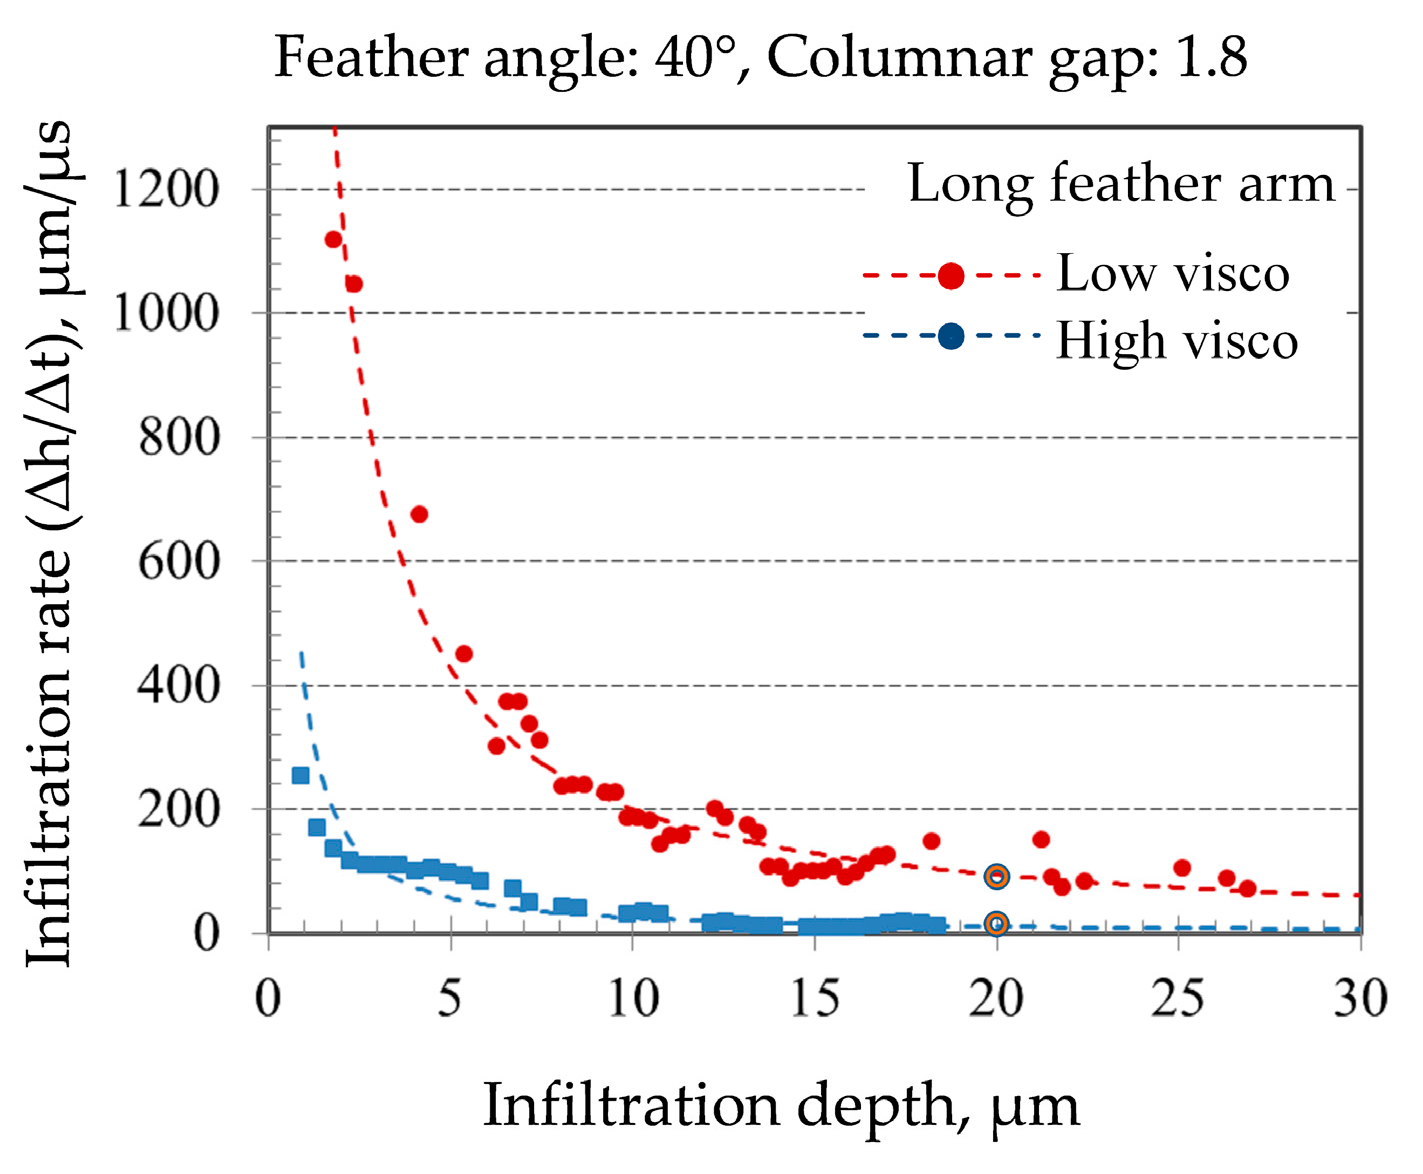
The influence of viscosity on the flow behavior for long feather arms and 40° feather inclination (model: θ40–2GFGC) was investigated by using two viscosity values: Low and high as stated in Section 2.3.3. The characteristics of the flow kinetics were distinguished by comparing the flow rate compared to the infiltration depth relationship, as shown in Figure 18. Here, the instantaneous rate of infiltration (Δht) was plotted, which captured the local change of the infiltration rate during traveling through the columnar gaps. The instantaneous rate gives a better understanding of the flow kinetics than the average rate of change, as for the earlier case the local variation can be better explored and understood.
As seen in Figure 18, the low viscous CMAS entered the column with a high flow rate and then the flow was gradually subsided while filling up the columnar gap. On the other hand, the high viscous fluid entered the columnar gap with an almost 8–9 times slower flow rate, as shown at a distance of 2 µm infiltration depth in the figure. After filling the columnar and feathery gaps at a distance of 20 µm, the higher viscos CMAS almost became sluggish, but the low viscous CMAS continued further with a slower flow rate.
For the high viscosity parameter a higher flow resistance was imposed on the molten CMAS, which eventually reduces the flow velocity inside the columnar and feathery gaps.
A comparison of the flow velocity for low and high viscosity parameters along the columnar gaps shows a similar decreasing pattern as given in Figure 18, and therefore, not presented here.
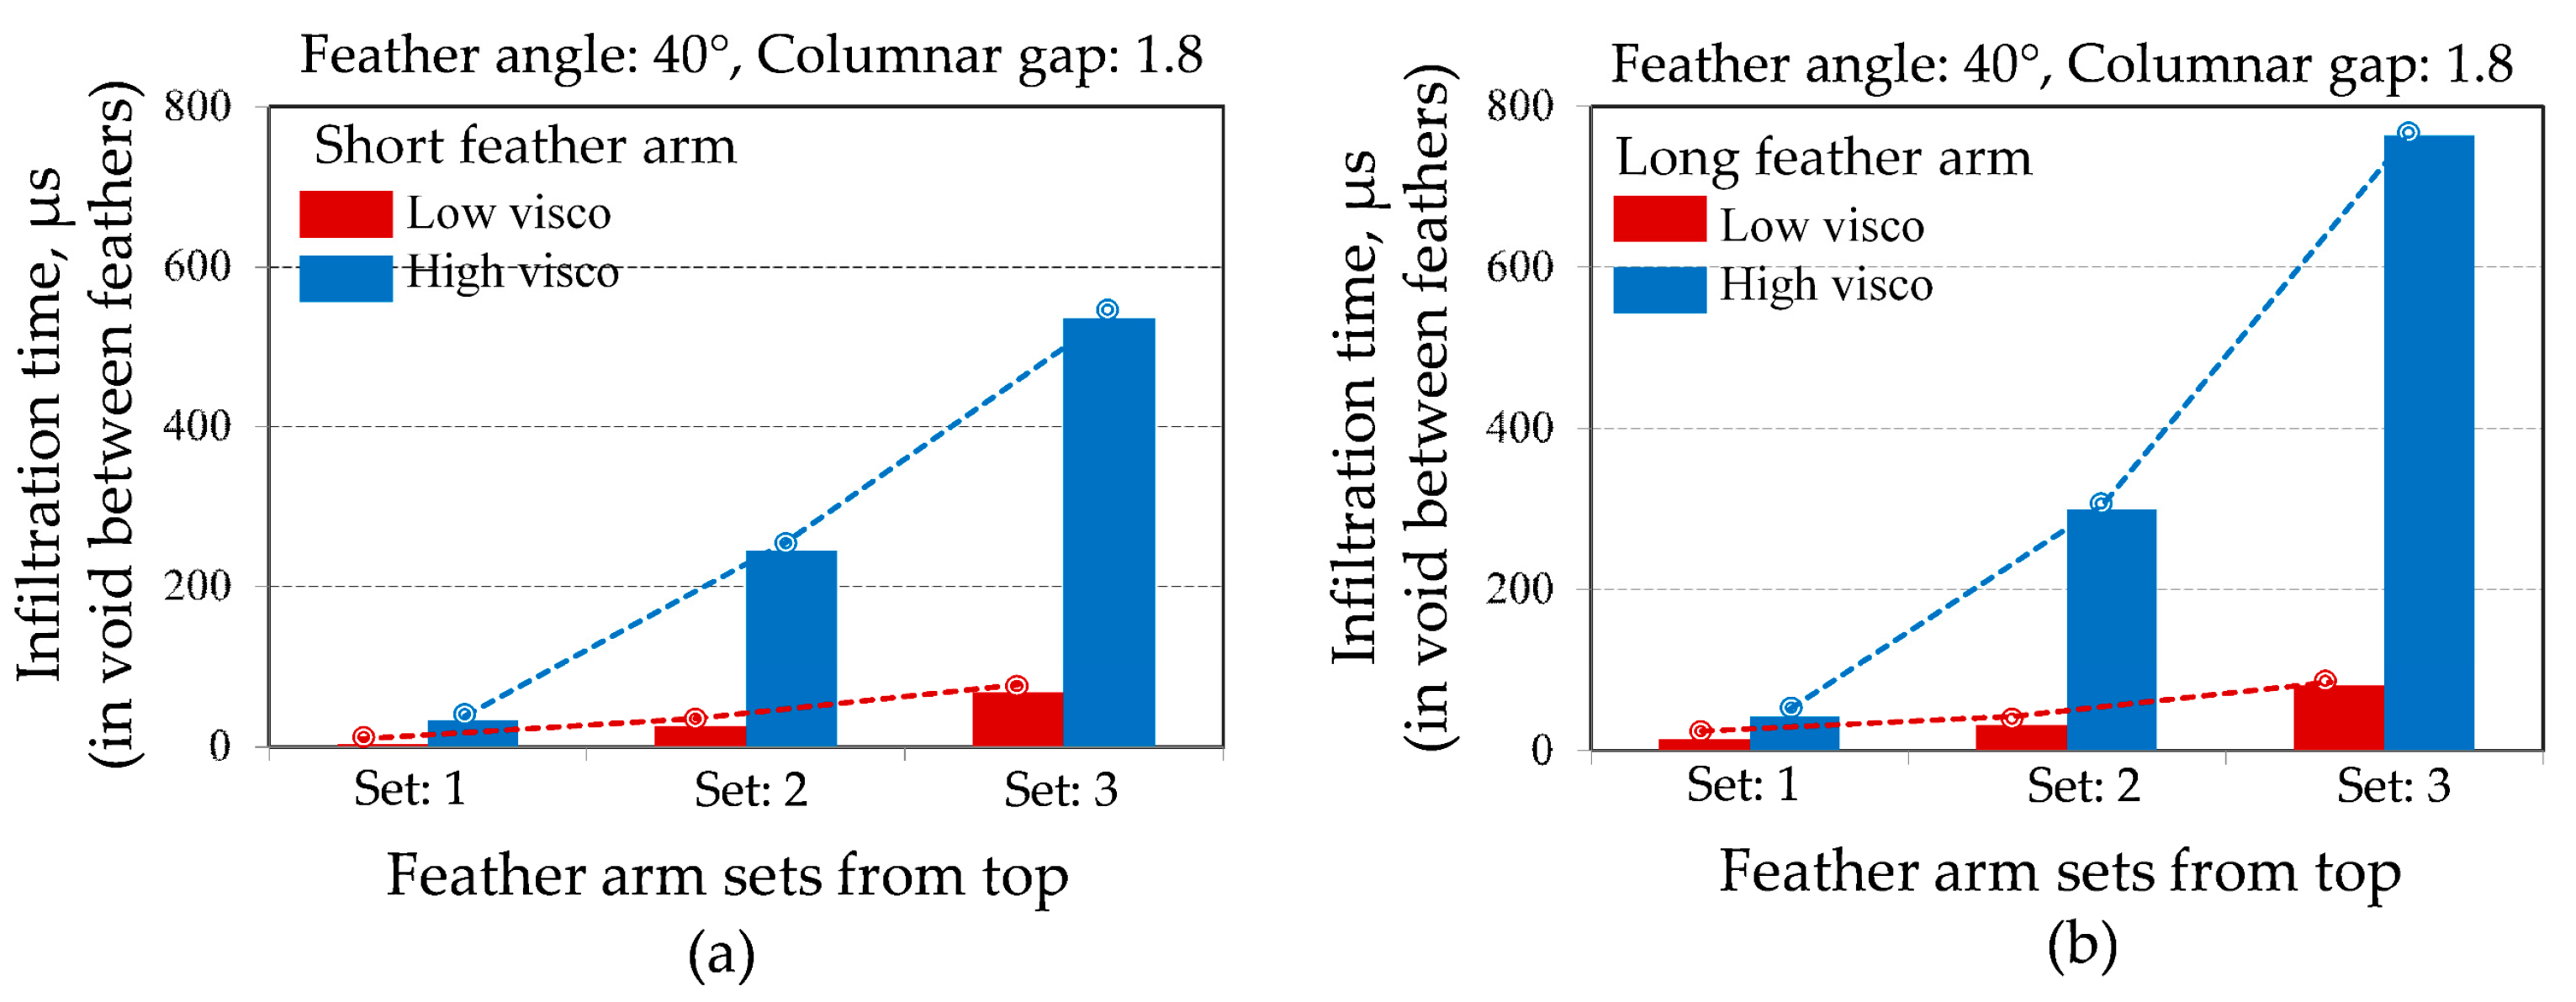
Further, the lateral (sideway) infiltration behavior for low and high viscosity parameters was studied for two different morphologies: One is for short and the other is for long feather arms (model: θ40GFGC and θ40–2GFGC), with the feather inclination angle at 40°. The infiltration time required for filling up the void between feather arms considering short and long feather arms were compared. In Figure 19, the total infiltration time was recorded for filling up each feather set (FS) in the θ40GFGC and θ40–2GFGC model. This infiltration time also includes the time of vertical infiltration, as the vertical and horizontal infiltration occurs successively.
In Figure 19a, the short feather arm model shows a slower infiltration for a high viscous CMAS compared to a lower viscous CMAS, as expected. The dotted lines indicate that the infiltration time increased exponentially for the high viscous CMAS while filling the longitudinal and lateral voids (in columnar and feathery gaps), while a moderate increase of time was observed for the low viscous CMAS. For the low viscous CMAS (Figure 19b), the infiltration time remained qualitatively the same for both short and long feather gaps. For the high viscous CMAS, the infiltration time increased remarkably for long feather gaps compared to the shorter one.

3.3. Qualitative Comparison with Experimental Infiltration Behavior

The CMAS infiltration kinetics was studied experimentally in previous researches [19,24] for the case of coarse and feathery morphologies (see Figure 2b,c). The overall porosity (gaps between columns and feathers) in the feathery structure was almost 2.5 times higher than that of the coarse structure. The main goal of the experimental investigation was to identify which microstructure resists CMAS infiltration depending on the geometrical factors. During the experiment infiltration was carried out for different times at a constant temperature. Then for both microstructures, the infiltration depth was measured by means of SEM imaging with the help of the energy-dispersive X-ray spectroscopy (EDS) analysis. The maximum infiltration depth of CMAS is normalized for both microstructures for a comparative study. If the maximum infiltration depth of CMAS is considered to be 100% (for a coating thickness of 400 µm), and the maximum infiltration time is 100%, then the infiltration rates for coarse and feathery structures can be qualitatively compared, which are shown in Figure 20a.
It was found that after 50% and 100% infiltration time, the difference in infiltration depth between feathery to coarse microstructure was found to be 50%. At any point of the infiltration time the feathery morphology exhibits almost 50% lesser infiltration depth.
For the numerical study, an equivalent microstructure for coarse and feathery columns was obtained from the θ40GFGC and θ40–2GF–0.5GC model. For both the models, simulations were performed only up to 15 µm infiltration depths, which cover full infiltration beyond four feather-sets. The respective variations of infiltration depths for two intervals of the infiltration time similar to the experimental case were compared. The results are depicted in Figure 20b. The difference of infiltration depth was found to be 46.8% at 100% infiltration time, which is close to the experimental result. At 50% of the maximum infiltration time the difference was found to be 48.21%. In both experimental and simulation results the infiltration depth was found to be ~50% lower in the feathery (feathers with double length) microstructure.
The numerical prediction of infiltration depth at 100% infiltration time predicts the experimental observation reasonably well, but for 50% infiltration time the model showed higher infiltration depth compared to experiments. This discrepancy can be explained on the basis of the melting nature of the CMAS melt. It is to be noted that at 1225 °C, the CMAS melt was in semi molten state (crystalline + glass) and longer heating times were required to make it fully glassy in nature which was the case of 20 h infiltration results (100% infiltration at 1225 °C). For the model simplicity, it was assumed that the whole CMAS was in a glassy and flowing condition, which in turn has resulted in higher infiltration depth than in the experiments. However, it was shown that the comparative trend of infiltration kinetics matches very well with the experimental observation.

4. Discussion

The CMAS infiltration kinetics was assessed for an EB-PVD TBC microstructure with varying morphology, which includes geometrical features for feather arm length, feather inclination angle, feather gaps, columnar gaps, etc. Based on the model parameters the infiltration behavior was quantitatively estimated. Some qualitative understanding of the infiltration kinetics with respect to the morphological variations was also gained. Some important results are discussed as following.

4.1. Influence of Columnar Gap width on Infiltration Behavior

Columnar gaps were arranged vertically in the models as described previously in Figure 3 and Figure 4. The tortuosity along the column height was modeled by arranging the longer and shorter feather arms alternatively. The negative pressure force (equivalent to a constant capillary force) was active in this gap. The infiltration flow was obstructed by the long and short feather arms with sharp feathery tips, and branched by the feather gaps with different inclination. The contact surfaces imposed frictional drag during flow progression. For a wide columnar gap the unit frictional surface area with respect to the total surface area is reduced because the ratio of the friction surface length and the columnar diameter (L/DC) is less compared to a narrow columnar gap. That means, for wide columnar gaps a unit volume of liquid is exposed to less frictional drag during infiltrating. For a narrow columnar gap the overall porosity is reduced, and the frictional effect is significantly higher for a unit volume of liquid to enter, which obviously increases the infiltration time (Figure 14).

4.2. Influence of Feather Length (Gap) on Total Infiltration Behavior

The vertical infiltration time estimated in the models is the time required to fill-up all the voids, e.g., columnar gaps arranged in vertical directions and feather gaps arranged laterally (sideway). Therefore, the vertical infiltration time is considered as the time of total infiltration. It was shown that for a constant columnar gap the variations in feather morphology, e.g., feather arm lengths and feather inclination influence the infiltration kinetics remarkably.
The feather arm length basically defines the length of feather gaps between two feathers. For a set of long feather arms the void between feather arms increases. Infiltration time is expected to be higher for this type of long feather model. Similar behavior was also observed in the experiments comparing coarse and feathery structures of the top coat columns [19,24]
As the contact surface areas between the CMAS flow path and the top coat boundaries retard the flow rate due to frictional effects, for an increased contact surface area slow infiltration was obtained. Therefore, a large feather arm model containing large feather gaps and large contact surface areas showed reduced overall flow rate.
Another morphological factor, the feather inclination, also affects the infiltration kinetics, basically due to the narrow feather gaps obtained during model generation. Narrow feather gaps increase the frictional drag effects per unit area as discussed in Section 3.1.3. As a result, the CMAS flow rate inside a more inclined feather gap was reduced. For 40° inclined feathers the gap was wider, and thus larger, therefore, the acted frictional drag on CMAS was less, and inside the feather gap flow was faster.
However, for the 60° inclined feather model the overall porosity is smaller compared to the 40° inclined feather as the both have the same inter-columnar gaps. As a result, the vertical flow rate, which is the resultant of the flow along inter-columnar and feather gaps, was higher for the 60° inclined model.
It should be noted that the narrow feather gap for a higher feather angle is only due to the trigonometric conversation of data in the parametric model output. In reality, an inclined feather can possess any arbitrary feather gaps, not necessarily a narrower feather gap.

4.3. Influence of Morphology on the Flow Velocity and Rate

For all of the models the rate of infiltration was higher at the very beginning, and it was reduced gradually with respect to the vertical infiltration along the columnar gaps. This behavior was obvious as the CMAS entry area offered less frictional contacts, and for the progressive CMAS flow increased frictional contact areas were activated on the fly.
It was shown that the flow velocity in feather gaps and columnar gaps are dependent on the gap diameter, which determines the vol.% of porosity and effective frictional surface encountered by the flow-front. For both the columnar and feather gaps the flow velocity was reduced for narrower gaps due to large frictional effects per unit area. For a more vertically inclined feather arms (e.g., 60° inclined), the flow at the narrow feather gaps was reduced but the vertical infiltration occurred continuously showing an overall increased flow rate (Section 3.1.3). Therefore, we observed higher infiltration depth in the 60° feather angle model at a particular infiltration time (Figure 12).

4.4. Influence of Viscosity

The known effects of viscosity on the CMAS flow kinetics in TBCs were once again proven with the developed model showing that the CMAS with less viscosity has the faster infiltration rates. For a high viscous flow, the effects of frictional drag increase exponentially with the distance travelled by the CMAS flow. For the low viscosity parameter, the frictional drag increases only slightly during continuous flow along the frictional flow path.
No linear relationship between the flow rates can be found comparing the results of low and high viscosity values. That means, a linear increase of viscosity parameter will not increase the infiltration time linearly; rather an exponential increase of infiltration time can be expected.

4.5. Suggestions and Remarks toward Future Direction

The presented simulations captured a quantitative picture of microstructure sensitivity of the CMAS infiltration behavior. Valuable information can be extracted from the predictive analysis, from which the critical morphological features that need to be customized for mitigating CMAS infiltration can be identified.
For example, the results obtained from the six idealized 2D models suggest that EB-PVD top coats may comprise some morphological features, like narrow inter-columnar gaps, long feather arms, lower feather inclination angles, and above all higher lateral porosity, in order to reduce the CMAS intake through infiltration. Simulation-based knowledge can thus be used for advanced TBC design against environmental attack.
It should be noted that the predictability of the present model is restricted due to several idealizations in flow behavior and morphology. These limitations can be improved by employing detailed physics-based modeling incorporating complex 3D representations of the TBC microstructures. In particular, a thermodynamic equilibrium based melt/coating interaction model taking the thermal gradient as well as the temperature dependent viscous flow of CMAS, considering crystallization dynamics during infiltration needs to be developed. Realization of such thermo-chemical interaction modeling requires an enhancement of the presented multi-physical computational approach, which is currently in progress and remains beyond the scope of this work.
The computational method presented here is not limited to the CMAS-TBC interaction analysis only. This modeling approach can be extended for the analysis of CMAS-EBC (environmental barrier coating) interactions with few modifications in the microstructure model.

5. Conclusions

In this work, a numerical approach was developed for studying the infiltration kinetics of molten CMAS considering the morphological variation of EB-PVD TBCs. For a numerical representation of the top coat TBC microstructure, a microstructure model was established by rational idealization of morphological features from the SEM images. Six models were generated for the TBC-CMAS interaction analysis. Detailed analyses of the flow kinetics were performed, and then the results were verified by experimental infiltration depths of the feathery and coarse microstructures. Based on the predicted results the flow characteristics regarding infiltration depth, rate, and velocity were evaluated with respect to the columnar microstructural features of the top coat, enabling a qualitative comparison of the microstructure sensitive flow kinetics of CMAS. An in-depth understanding of the CMAS flow behavior was gained, and several morphological features of the EB-PVD TBC controlling infiltration kinetics were identified. The results are summarized as follows:
  • Size of feather arms: For long feather arms the void between feather arms is elongated, thereby pore vol.% is increased. Elongated voids consist of large frictional surfaces that induce a higher drag against the CMAS flow. As a result, for the long feather arms the overall flow rate of CMAS can be reduced.
  • Feather arm inclination: For a higher inclination of feather arms the gap between feather arms becomes narrower due to the angular projection of the feather gap diameter. A narrow gap obviously imposes more frictional drag per unit area; therefore, the flow rate of CMAS in the feather gaps (lateral infiltration) is reduced. Keeping the vertical columnar gaps the same, the overall porosity decreases in a narrow feather gap model and oppositely, increases in a wide feather gap model. It was found that the flow rate at the vertical columnar gaps (longitudinal infiltration) remains high due to the reduction of overall porosity in the feather gaps when compared to the wider feather gap model.
  • Columnar gaps: Keeping the feather lengths the same, in a model with narrow columnar gaps the overall porosity decreases and the frictional drag per unit area increases. Thus, reducing the diameter between columnar channels a retardation of CMAS flow can be expected. If the columnar diameter is the same for two models, the model with a lower pore volume percent will take less infiltration time.
In future, the microstructure sensitive flow kinetics of molten CMAS will be assessed using 3D microstructure models considering extended geometrical features of the TBC columns. Furthermore, the model can be used for the thermomechanical stress analysis to predict the CMAS assisted stress evolution and fracture in advanced TBC layers.

Author Contributions

Conceptualization, M.R.K. and R.N.; Methodology, M.R.K.; Validation, M.R.K. and N.R.; Formal Analysis, A.K.S.; Investigation, M.R.K., A.K.S. and R.N.; Writing–Original Draft Preparation, M.R.K.; Writing–Review and Editing, A.K.S., R.N. and U.S.; Supervision, R.N. and U.S.; Project Administration, R.N. and U.S.; Funding Acquisition, R.N. and U.S.

Funding

This research was funded by Deutsche Forschungsgemeinschaft (DFG) (No. Schu 1372/5-1).

Acknowledgments

The authors acknowledge the supports from ICAMS, Ruhr-University Bochum for providing short-term computer facilities.

Conflicts of Interest

The authors declare no conflict of interest. The funders had no role in the design of the study; in the collection, analyses, or interpretation of data; in the writing of the manuscript, or in the decision to publish the results.

References

  1. Leyens, C.; Schulz, U.; Pint, B.A.; Wright, I.G. Influence of EB-PVD TBC microstructure on thermal barrier coating system performance under cyclic oxidation conditions. Surf. Coat. Technol. 1999, 120, 68–76. [Google Scholar] [CrossRef]
  2. Evans, A.G.; Mumm, D.R.; Hutchinson, J.W.; Meier, G.H.; Pettit, F.S. Mechanisms controlling the durability of thermal barrier coatings. Prog. Mater. Sci. 2001, 46, 505–553. [Google Scholar] [CrossRef]
  3. Schulz, U.; Leyens, C.; Fritscher, K.; Peters, M.; Saruhan-Brings, B.; Lavigne, O.; Dorvaux, J.-M.; Poulain, M.; Mévrel, R.; Caliez, M. Some recent trends in research and technology of advanced thermal barrier coatings. Aerosp. Sci. Technol. 2003, 7, 73–80. [Google Scholar] [CrossRef]
  4. Clarke, D.; Levi, C. Materials design for the next generation thermal barrier coatings. Annu. Rev. Mater. Res. 2003, 33, 383–417. [Google Scholar] [CrossRef]
  5. Levi, C.G. Emerging materials and processes for thermal barrier systems. Curr. Opin. Solid State Mater. Sci. 2004, 8, 77–91. [Google Scholar] [CrossRef]
  6. Clarke, D.R.; Oechsner, M.; Padture, N.P. Thermal-barrier coatings for more efficient gas-turbine engines. MRS Bull. 2012, 37, 891–898. [Google Scholar] [CrossRef] [Green Version]
  7. Krämer, S.; Yang, J.; Levi, C.G.; Johnson, C.A. Thermochemical interaction of thermal barrier coatings with molten CaO–MgO–Al2O3–SiO2 (CMAS) deposits. J. Am. Ceram. Soc. 2006, 89, 3167–3175. [Google Scholar] [CrossRef]
  8. Zhao, H.; Levi, C.G.; Wadley, H.N.G. Molten silicate interactions with thermal barrier coatings. Surf. Coat. Technol. 2014, 251, 74–86. [Google Scholar] [CrossRef]
  9. Borom, M.P.; Johnson, C.A.; Peluso, L.A. Role of environment deposits and operating surface temperature in spallation of air plasma sprayed thermal barrier coatings. Surf. Coat. Technol. 1996, 86–87, 116–126. [Google Scholar] [CrossRef]
  10. Mercer, C.; Faulhaber, S.; Evans, A.G.; Darolia, R. A delamination mechanism for thermal barrier coatings subject to calcium–magnesium–alumino–silicate (CMAS) infiltration. Acta Mater. 2005, 53, 1029–1039. [Google Scholar] [CrossRef]
  11. Grant, K.M.; Krämer, S.; Löfvander, J.P.A.; Levi, C.G. CMAS degradation of environmental barrier coatings. Surf. Coat. Technol. 2007, 202, 653–657. [Google Scholar] [CrossRef]
  12. Wellman, R.; Whitman, G.; Nicholls, J.R. CMAS corrosion of EB PVD TBCs: Identifying the minimum level to initiate damage. Int. J. Refract. Met. Hard Mater. 2010, 28, 124–132. [Google Scholar] [CrossRef] [Green Version]
  13. Levi, C.G.; Hutchinson, J.W.; Vidal-Sétif, M.-H.; Johnson, C.A. Environmental degradation of thermal-barrier coatings by molten deposits. MRS Bull. 2012, 37, 932–941. [Google Scholar] [CrossRef] [Green Version]
  14. Aygun, A.; Vasiliev, A.L.; Padture, N.P.; Ma, X. Novel thermal barrier coatings that are resistant to high-temperature attack by glassy deposits. Acta Mater. 2007, 55, 6734–6745. [Google Scholar] [CrossRef]
  15. Krämer, S.; Yang, J.; Levi, C.G. Infiltration-inhibiting reaction of gadolinium zirconate thermal barrier coatings with CMAS melts. J. Am. Ceram. Soc. 2008, 91, 576–583. [Google Scholar] [CrossRef]
  16. Rai, A.K.; Bhattacharya, R.S.; Wolfe, D.E.; Eden, T.J. CMAS-resistant thermal barrier coatings (TBC). Int. J. Appl. Ceram. Technol. 2010, 7, 662–674. [Google Scholar] [CrossRef]
  17. Pubbysetty, R.P. Developing the CMAS (CaO–MgO–Al2O3–SiO2) Resistant TBCs (Thermal Barrier Coatings): Alumina (Al2O3) as A Candidate for Restricting the CMAS Infiltration in TBCs. Master’s Thesis, RWTH Aachen, Aachen, Germany, July 2016. [Google Scholar]
  18. Gomez Chavez, J.J. Yttria Rich TBCs as Candidates for CMAS Resistant Top Coats. Master’s Thesis, University of Texas, El Paso, TX, USA, May 2016. [Google Scholar]
  19. Naraparaju, R.; Gomez Chavez, J.J.; Schulz, U.; Ramana, C.V. Interaction and infiltration behavior of Eyjafjallajökull, Sakurajima volcanic ashes and a synthetic CMAS containing FeO with/in EB-PVD ZrO2–65 wt % Y2O3 coating at high temperature. Acta Mater. 2017, 136, 164–180. [Google Scholar] [CrossRef]
  20. Drexler, J.M.; Gledhill, A.D.; Shinoda, K.; Vasiliev, A.L.; Reddy, K.M.; Sampath, S.; Padture, N.P. Jet engine coatings for resisting volcanic ash damage. Adv. Mater. 2011, 23, 2419–2424. [Google Scholar] [CrossRef] [PubMed]
  21. Schulz, U.; Braue, W. Degradation of La2Zr2O7 and other novel EB-PVD thermal barrier coatings by CMAS (CaO–MgO–Al2O3–SiO2) and volcanic ash deposits. Surf. Coat. Technol. 2013, 235, 165–173. [Google Scholar] [CrossRef]
  22. Mechnich, P.; Braue, W. Volcanic ash-induced decomposition of EB-PVD Gd2Zr2O7 thermal barrier coatings to Gd-oxyapatite, zircon, and Gd, Fe–zirconolite. J. Am. Ceram. Soc. 2013, 96, 1958–1965. [Google Scholar] [CrossRef]
  23. Eils, N.K.; Mechnich, P.; Braue, W. Effect of CMAS deposits on MOCVD coatings in the system Y2O3–ZrO2: Phase relationships. J. Am. Ceram. Soc. 2013, 96, 3333–3340. [Google Scholar] [CrossRef]
  24. Naraparaju, R.; Hüttermann, M.; Schulz, U.; Mechnich, P. Tailoring the EB-PVD columnar microstructure to mitigate the infiltration of CMAS in 7YSZ thermal barrier coatings. J. Eur. Ceram. Soc. 2017, 37, 261–270. [Google Scholar] [CrossRef] [Green Version]
  25. Renteria, A.F.; Saruhan, B.; Schulz, U.; Raetzer-Scheibe, H.-J.; Haug, J.; Wiedenmann, A. Effect of morphology on thermal conductivity of EB-PVD PYSZ TBCs. Surf. Coat. Technol. 2006, 201, 2611–2620. [Google Scholar] [CrossRef]
  26. Naraparaju, R.; Pubbysetty, R.P.; Mechnich, P.; Schulz, U. EB-PVD alumina (Al2O3) as a top coat on 7YSZ TBCs against CMAS/VA infiltration: Deposition and reaction mechanisms. J. Eur. Ceram. Soc. 2018, 38, 3333–3346. [Google Scholar] [CrossRef]
  27. Caliez, M.; Feyel, F.; Kruch, S.; Chaboche, J.-L. Oxidation induced stress fields in an EB-PVD thermal barrier coating. Surf. Coat. Technol. 2002, 157, 103–110. [Google Scholar] [CrossRef]
  28. Bhatnagar, H.; Ghosh, S.; Walter, M.E. A parametric study of damage initiation and propagation in EB-PVD thermal barrier coatings. Mech. Mater. 2010, 42, 96–107. [Google Scholar] [CrossRef]
  29. Zhang, X.; Xu, B.; Wang, H.; Wu, Y. An analytical model for predicting thermal residual stresses in multilayer coating systems. Thin Solid Films 2005, 488, 274–282. [Google Scholar] [CrossRef]
  30. Hochstein, L. Lebensdauer von 7YSZ EB-PVD Wärmedämmschichten in Flugtriebwerken mit Lokaler CMAS Belastung: Ausfallmechanismen und Modellierung. Master’s Thesis, TU Dresden, Dresden, Germany, March 2017. [Google Scholar]
  31. Naraparaju, R.; Gomez Chavez, J.J.; Niemeyer, P.; Hess, K.-U.; Song, W.; Dingwell, D.B.; Lokachari, S.; Ramana, C.V.; Schulz, U. Estimation of CMAS Infiltration depth in EB-PVD TBCs: A new constraint model supported with experimental approach. J. Eur. Ceram. Soc. 2019, 39, 2936–3945. [Google Scholar] [CrossRef]
  32. Schulz, U.; Terry, S.G.; Levi, C.G. Microstructure and texture of EB-PVD TBCs grown under different rotation modes. Mater. Sci. Eng. A 2003, 360, 319–329. [Google Scholar] [CrossRef]
  33. ABAQUS, V., 6.16; Documentation, Theory manual; Dassault Systèmes Simulia Corp.: Providence, RI, USA, 2016.
  34. Barbieri, L.; Bondioli, F.; Lancellotti, I.; Leonelli, C.; Montorsi, M.; Ferrari, A.M.; Miselli, P. The anorthite–diopside system: Structural and devitrification study. Part II: Crystallinity analysis by the Rietveld–RIR method. J. Am. Ceram. Soc. 2005, 88, 3131–3136. [Google Scholar] [CrossRef]
  35. Getson, J.M.; Whittington, A.G. Liquid and magma viscosity in the anorthite-forsterite-diopside-quartz system and implications for the viscosity-temperature paths of cooling magmas. J. Geophys. Res. Solid Earth 2007, 112, B10203. [Google Scholar] [CrossRef]
  36. Rigden, S.M.; Ahrens, T.J.; Stolper, E.M. Shock compression of molten silicate: Results for a model basaltic composition. J. Geophys. Res. Solid Earth 1988, 93, 367–382. [Google Scholar] [CrossRef] [Green Version]
  37. Ai, Y.; Lange, R.A. New acoustic velocity measurements on CaO–MgO–Al2O3–SiO2 liquids: Reevaluation of the volume and compressibility of CaMgSi2O6–CaAl2Si2O8 liquids to 25 GPa. J. Geophys. Res. Solid Earth 2008, 113, B04203. [Google Scholar] [CrossRef]
  38. Thomas, C.W.; Asimow, P.D. Direct shock compression experiments on premolten forsterite and progress toward a consistent high-pressure equation of state for CaO–MgO–Al2O3–SiO2–FeO liquids. J. Geophys. Res. Solid Earth 2013, 118, 5738–5752. [Google Scholar] [CrossRef]
  39. Wiesner, V.L.; Bansal, N.P. Mechanical and thermal properties of calcium–magnesium aluminosilicate (CMAS) glass. J. Eur. Ceram. Soc. 2015, 35, 2907–2914. [Google Scholar] [CrossRef]
  40. Sparks, R.S.J.; Huppert, H.E. Density changes during the fractional crystallization of basaltic magmas: Fluid dynamic implications. Contrib. Miner. Pet. 1984, 85, 300–309. [Google Scholar] [CrossRef]
  41. Giordano, D.; Russell, J.K.; Dingwell, D.B. Viscosity of magmatic liquids: A model. Earth Planet. Sci. Lett. 2008, 271, 123–134. [Google Scholar] [CrossRef]
  42. Wiesner, V.L.; Vempati, U.K.; Bansal, N.P. High temperature viscosity of calcium–magnesium–aluminosilicate glass from synthetic sand. Scr. Mater. 2016, 124, 189–192. [Google Scholar] [CrossRef]
  43. Kumar, R.; Jordan, E.; Gell, M.; Roth, J.; Jiang, C.; Wang, J.; Rommel, S. CMAS behavior of yttrium aluminum garnet (YAG) and yttria-stabilized zirconia (YSZ) thermal barrier coatings. Surf. Coat. Technol. 2017, 327, 126–138. [Google Scholar] [CrossRef]
  44. Deng, W.; Fergus, J.W. Effect of CMAS composition on hot corrosion behavior of gadolinium zirconate thermal barrier coating materials. J. Electrochem. Soc. 2017, 164, C526–C531. [Google Scholar] [CrossRef]
  45. Song, W.; Lavallée, Y.; Hess, K.-U.; Kueppers, U.; Cimarelli, C.; Dingwell, D.B. Volcanic ash melting under conditions relevant to ash turbine interactions. Nat. Commun. 2016, 7, 10795. [Google Scholar] [CrossRef] [PubMed] [Green Version]
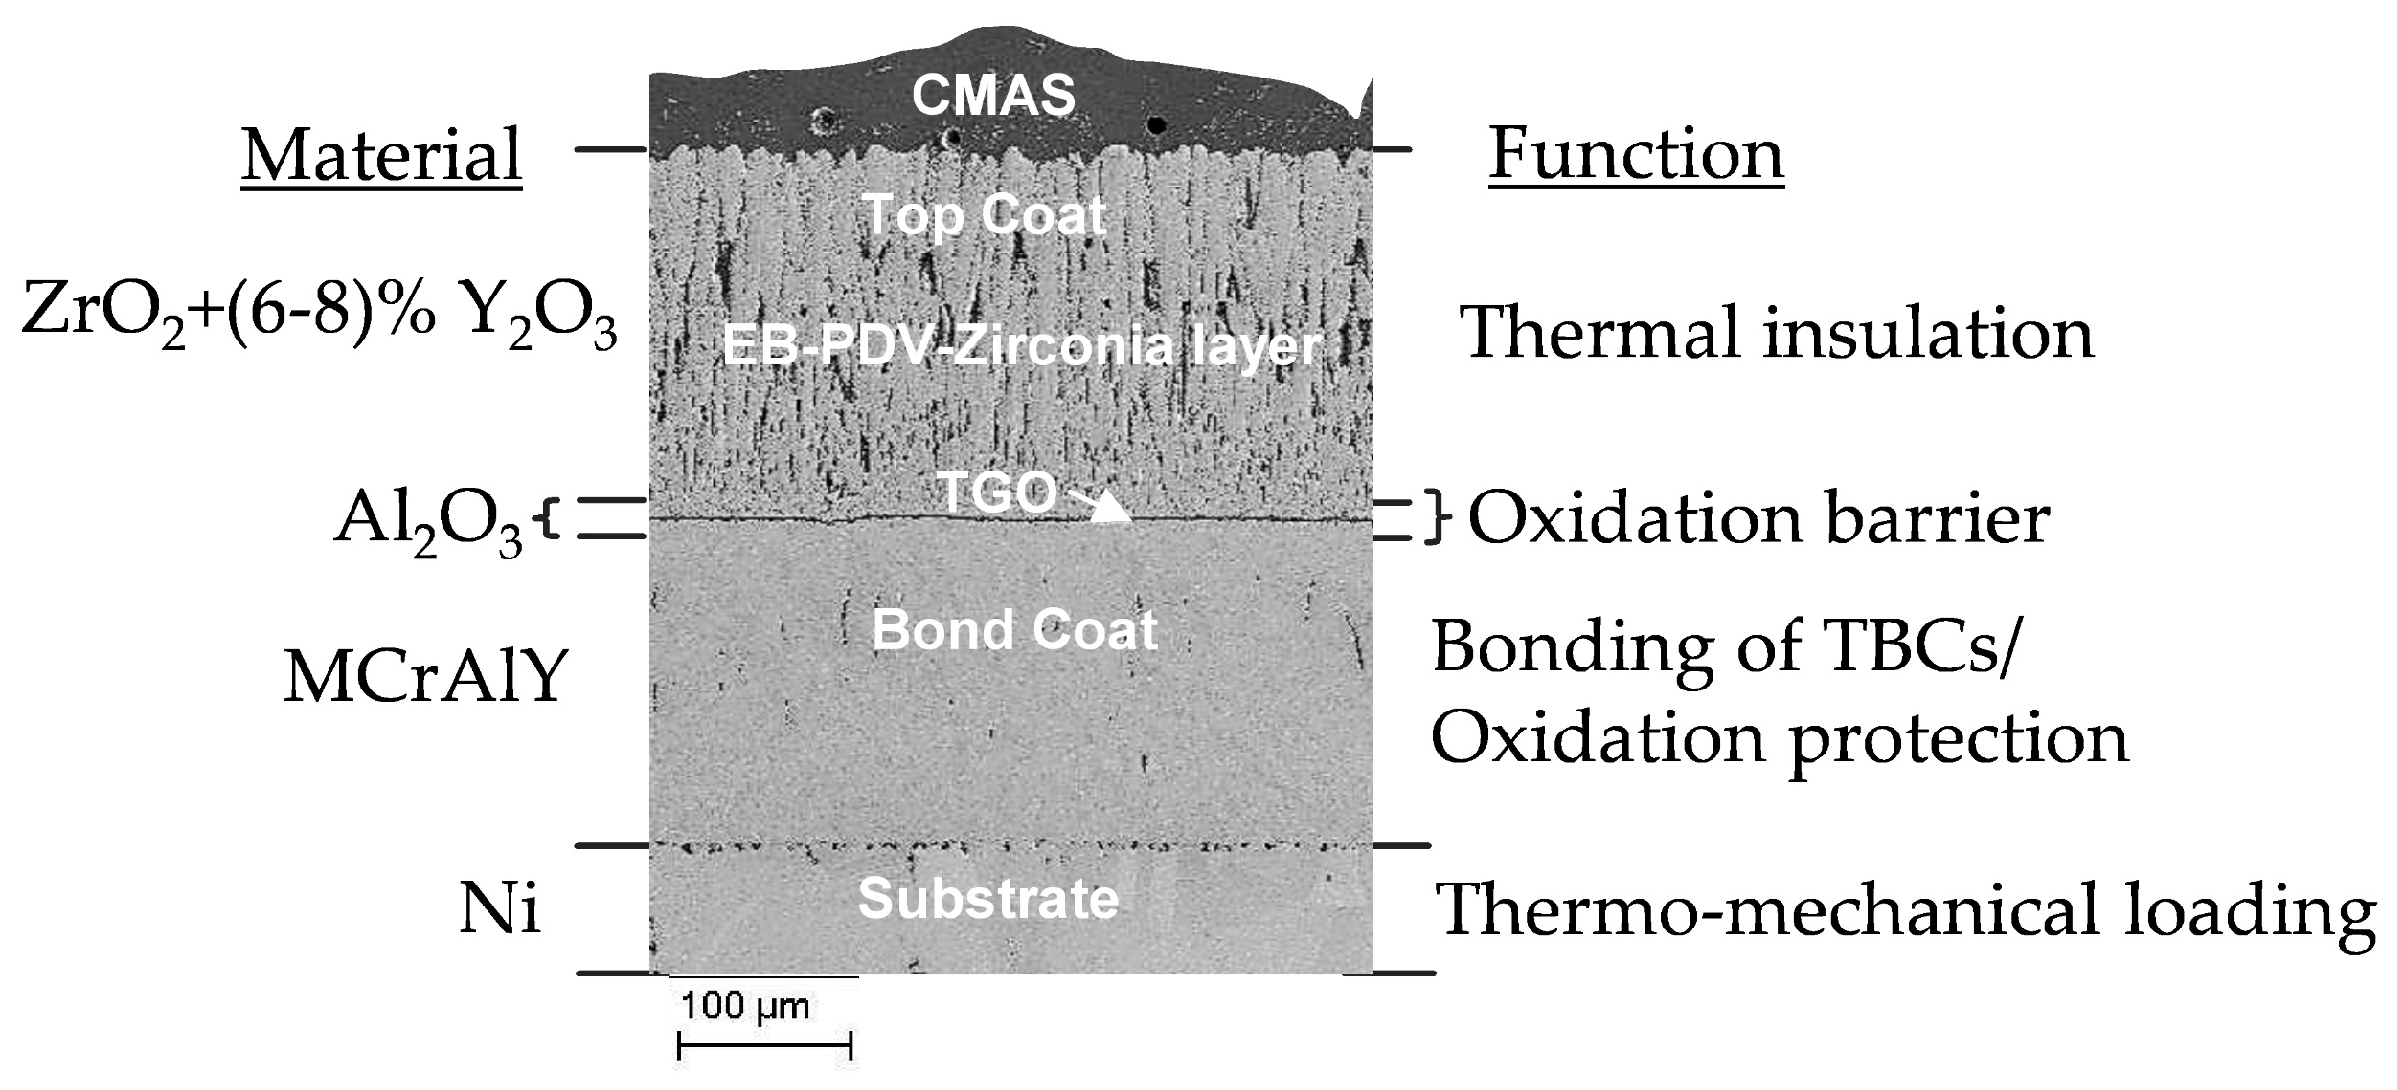
Figure 1. Cross-section of electron beam physical vapor deposition (EB-PVD) fabricated thermal barrier coating (TBC) showing layered structure with deposited calcium–magnesium–alumina–silicates (CMAS) on top.
Coatings 09 00332 g001
Figure 2. Tailored TBC microstructures fabricated by EB-PVD. Top view (upper A1, B1 and C1) and cross-sectional views (bottom A2, B2 and C2) are shown for: (a) Fine columnar microstructure; (b) coarse columnar microstructure; and (c) columnar microstructure with feathery arms (high porosity). Reprinted with permission from [25]; Copyright 2006 Elsevier.
Coatings 09 00332 g002
Figure 3. SEM image of a cross-sectional view of an EB-PVD 7YSZ column. The microstructures are shown for: (a) columnar geometry of the top coat (TC) with microstructural parameters identified for modeling purposes; and (b) closer look of the top view of pyramidal column tip, side view of feathers with irregular feather arrangements (top), and tortuous columnar gaps due to irregular feather arms (bottom). Reprinted with permission from [25]; Copyright 2006 Elsevier.
Coatings 09 00332 g003
Figure 4. Model representation of the EB-PVD columnar microstructure idealized from real microstructural SEM images: (a) definition of morphological parameters for computer generated parametric model of EB-PVD columns; and (b) automated model generation using morphological parameter variations. Column structures with different feather geometries were obtained.
Coatings 09 00332 g004
Figure 5. Microstructure unit cell (MUC) for infiltration analysis: (a) a two-dimensional (2D) representation of feathery columns with sideway periodic arrangements; (b) fine details of the feather tips idealized form real tortuous feathery structures; and (c) a three-dimensional (3D) representation of MUC consisting of four one-eighth feathery columns, arranged with alternate zigzag patterns of feathery structures.
Coatings 09 00332 g005
Figure 6. Identification of the CMAS initial position for modeling: (a) trapezoidal shape of the CMAS domain is isolated at the top of the columns; and (b) microstructure unit cell (MUC) with CMAS sub-domain and Eulerian domains for material flow. Reprinted with permission from [25]; Copyright 2006 Elsevier.
Coatings 09 00332 g006
Figure 7. Boundary conditions for the fluid-solid interaction model (FSI): (a) boundary conditions for the rigid top coat model; (b) applied capillary pressure at the bottom surface of the molten CMAS; and (c) velocity boundary condition for the Eulerian domain.
Coatings 09 00332 g007
Figure 8. Viscosities for CMAS1 measured experimentally and using the Giordano (GRD) model at different temperatures.
Coatings 09 00332 g008
Figure 9. EB-PVD microstructure unit cell models including the TBC inter columnar gaps, molten CMAS domain and an Eulerian domain, generated using the Python script: (a) 40° inclined feather arm model with short arm and narrow columnar gap; (b) with short arm and wide columnar gap; (c) with long arm and wide columnar gap; (d) 60° inclined feather arm model with short arm and narrow columnar gap; (e) with short arm and wide columnar gap; and (f) with long arm and wide columnar gap.
Coatings 09 00332 g009
Figure 10. Defined sections at the columnar gap and void between feather arms for numerical data evaluation during infiltration kinetics study
Coatings 09 00332 g010
Figure 11. Infiltrated CMAS height at time of 80 μs simulated for six top coat morphologies. Infiltration depths are shown for: (a) Model_40a; (b) model_40b; (c) model_40c; (d) model_60a; (e) model_60b; and (f) model_60c.
Coatings 09 00332 g011
Figure 12. Vertical infiltration in columnar gaps with respect to geometrical factors variations, e.g., feather angle, feather arm length: (a) comparison for 40° inclined feathers with short and long arm; and (b) comparison for 60° inclined feathers with short and long arm.
Coatings 09 00332 g012
Figure 13. Lateral (sideway) infiltration in feather gaps with respect to geometrical factors variations, e.g., feather angle, feather arm length. Data are measured at four feather sets FS1–FS4: (a) comparison for 40° inclined feathers with short and long arm; (b) comparison for 60° inclined feathers with short and long arm.
Coatings 09 00332 g013
Figure 14. CMAS infiltration behavior for narrow and wide columnar gaps for short feather arm model: (a) Comparison for 40° inclined feather arm models; (b) comparison for 60° inclined feather arm models.
Coatings 09 00332 g014
Figure 15. Change of infiltration rate through columnar gaps (vertical infiltration) influenced by different feather morphologies. The results are shown for: (a) short feathers with 40° feather inclination; (b) long feathers with 40° feather inclination; (c) short feathers with 60° feather inclination; and (d) long feathers with 60° feather inclination.
Coatings 09 00332 g015
Figure 16. Simulated infiltration rates in columnar gaps compared for short and long feather arm models considering 40° and 60° feather arm inclination.
Coatings 09 00332 g016
Figure 17. Lateral (sideway) infiltration in feather gaps showing velocity reduction in feather arm sets (FS) and the change of velocity gradient: (a) Comparison for 40° inclined feathers; (b) comparison for 60° inclined feathers.
Coatings 09 00332 g017
Figure 18. Decrease in the infiltration rate with respect to the infiltration depth measured in columnar gaps based on low and high viscosity values for 40° feather inclination, 1.8 µm columnar gap and long feather arm condition.
Coatings 09 00332 g018
Figure 19. Comparison of CMAS infiltration into the feather gaps for different feather sets using a low and a high viscosity parameter simulated in a model with 40° feather inclination and 1.8 µm columnar gap: (a) comparison of infiltration time to fill up three short feather gaps; and (b) comparison of infiltration time to fill up three long feather gaps.
Coatings 09 00332 g019
Figure 20. Comparison of infiltration depths and infiltration times for ‘feathery’ and ‘coarse’ morphology: (a) experimental results (normalized) at two columnar distances; and (b) simulation based prediction (normalized) at two columnar distances.
Coatings 09 00332 g020