1. Introduction
Pressure sensors have many applications in industrial production, medical testing, transportation, etc. Fiber optic structural pressure sensors have attracted people’s attention because of their low cost, high sensitivity, fast response time and good stability [
1,
2,
3,
4,
5,
6,
7,
8,
9,
10,
11,
12,
13,
14,
15]. Polydimethylsiloxane (PDMS) is a hydrophobic silicone material which can be used to prepare films of good quality. The method of filling PDMS can form a fiber sensor based on the Fabry-Perot effect, which has good effects in temperature and pressure detection. In particular, the continuous improvement of the manufacturing process of optical fiber sensors has led to a continuous improvement in sensing accuracy. For example, Zhang et al. proposed a multi-parameter measurement sensor consisting of a fiber Bragg grating (FBG) and the Fabry-Perot interferometers (FPIs). The FPIs are composed of a small single-mode fiber, an ultraviolet band solidification adhesive and other components [
16]. The sensor’s resolution for the temperature, pressure and liquid parameter sensing sensitivity can reach 0.07 °C, 6 kPa and 3.0 × 10
−4 RIU, respectively. Gao et al. proposed a high-sensitivity temperature sensor based on the principle of mode interference [
17]. The sensor is formed by welding a single-mode fiber to a fiber tube and filling the end face of the fiber tube with PDMS to form an F-P air microbubble. The sensitivity of this sensor can reach −384 pm/°C between 25 and 80 °C. Chen et al. introduced a fiber optic temperature sensor based on a filled PDMS air microbubble Fabry-Perot cavity, which is formed by splicing a single mode fiber (SMF) and fiber tube (HCF). The end face of the HCF is filled with a thickness of PDMS to form an F-P air microbubble cavity between the end of the single mode fiber and the interface of the PDMS. The sensor’s temperature sensitivity, between 51.2 and 70.5 °C, can reach 2.7035 nm/°C [
18].
However, the above studies did not deeply analyze the influence of the PDMS viscosity coefficient and diffusion rate on the sensor sensitivity. Considering the fact that the diffusion rate and diffusion depth are crucial to the sensor sensitivity, we analyzed the influence of the PDMS viscosity coefficient on the sensor sensitivity, and studied the optimization of the film thickness and fiber sensor pressure sensitivity by multiple transfer methods.
In this paper, the PDMS liquid is first placed in a temperature control box for moderate solidification to increase its viscosity coefficient and reduce the diffusion rate. The PDMS liquid, which has been solidified, is then filled into the fiber end of a hollow glass tube using the motor control function of the fusion splicer to form a very thin PDMS film. An optical fiber Fabry-Perot pressure sensor is formed through this method. Additionally, the sensitivity characteristics of the fiber-optic Fabry-Perot pressure sensor formed by the above method are analyzed and optimized.
2. Structure and Principle of Sensor
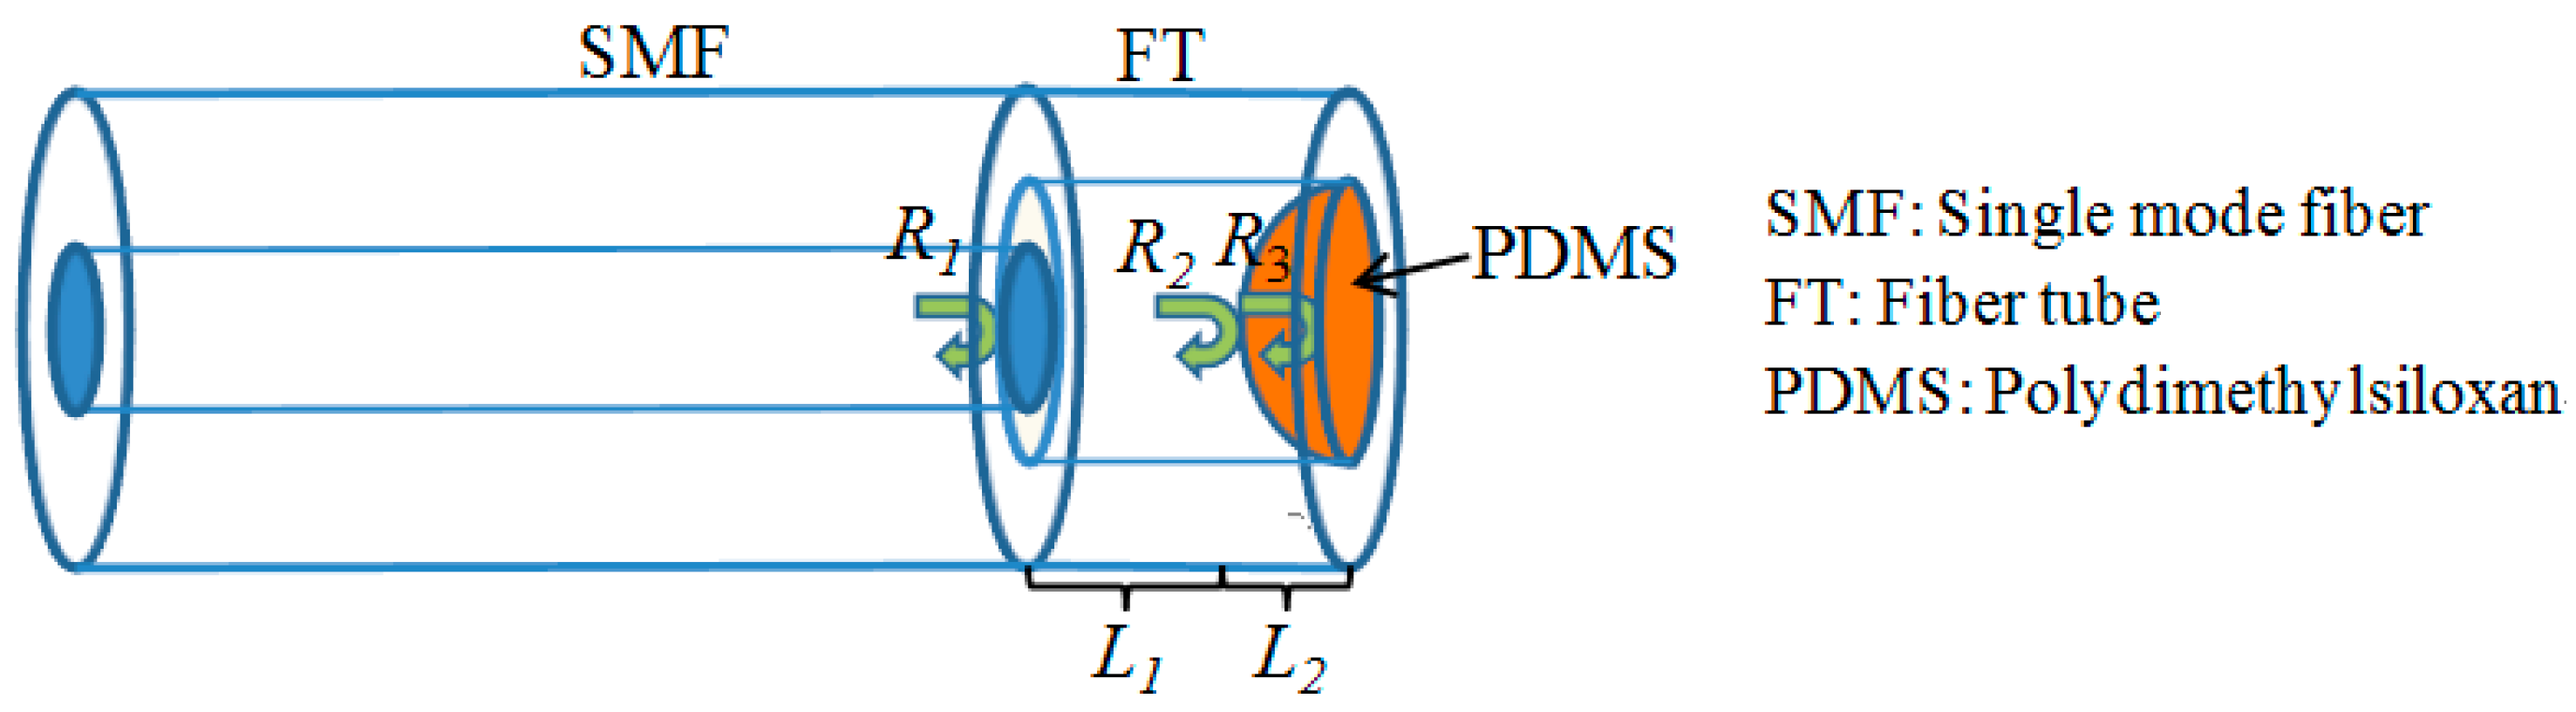
The proposed fiber tube sensor structure filled with PDMS is shown in
Figure 1. It is characterized by a glass tube with a length of 100 to 200 μm welded to the end of the fiber. Furthermore, a PDMS film layer with a film thickness of
L2 is formed at the end of the fiber glass tube by the proposed method. Light from a light source is coupled into the core of the single-mode fiber, encountering the first reflecting surface
R1 (the end face of the single-mode fiber), and encountering the second reflecting surface
R2 (inside the PDMS) after passing through the F-P air chamber. The light passes through the PDMS to reach the third reflective surface
R3 (outside of the PDMS film) on the far end surface, and the beams of the three reflecting surfaces form the interference phenomenon.
Assume that the F-P cavity length is
L1, the PDMS film thickness is
L2, the core refractive index is
n = 1.4492, the PDMS film refractive index is
n = 1.406, the FP cavity is air, and the refractive index is
n = 1. The corresponding three-beam interference light intensity can be expressed as [
6]:
Equation (1) gives the relationship between the three-beam interference spectrum, the PDMS thickness
L2 and the cavity length
L1. The actual fiber FPI cavity length
L1 is determined. Considering the limit of
(
), the Equation (1) can be simplified as:
Combining Equation (2) with the film theory, and considering the important influence of the film thickness and diameter parameters on the sensitivity enhancement, the following method is used to decrease the film thickness and enhance the sensitivity characteristic of the proposed fiber sensor.
3. Preparation of the Sensor
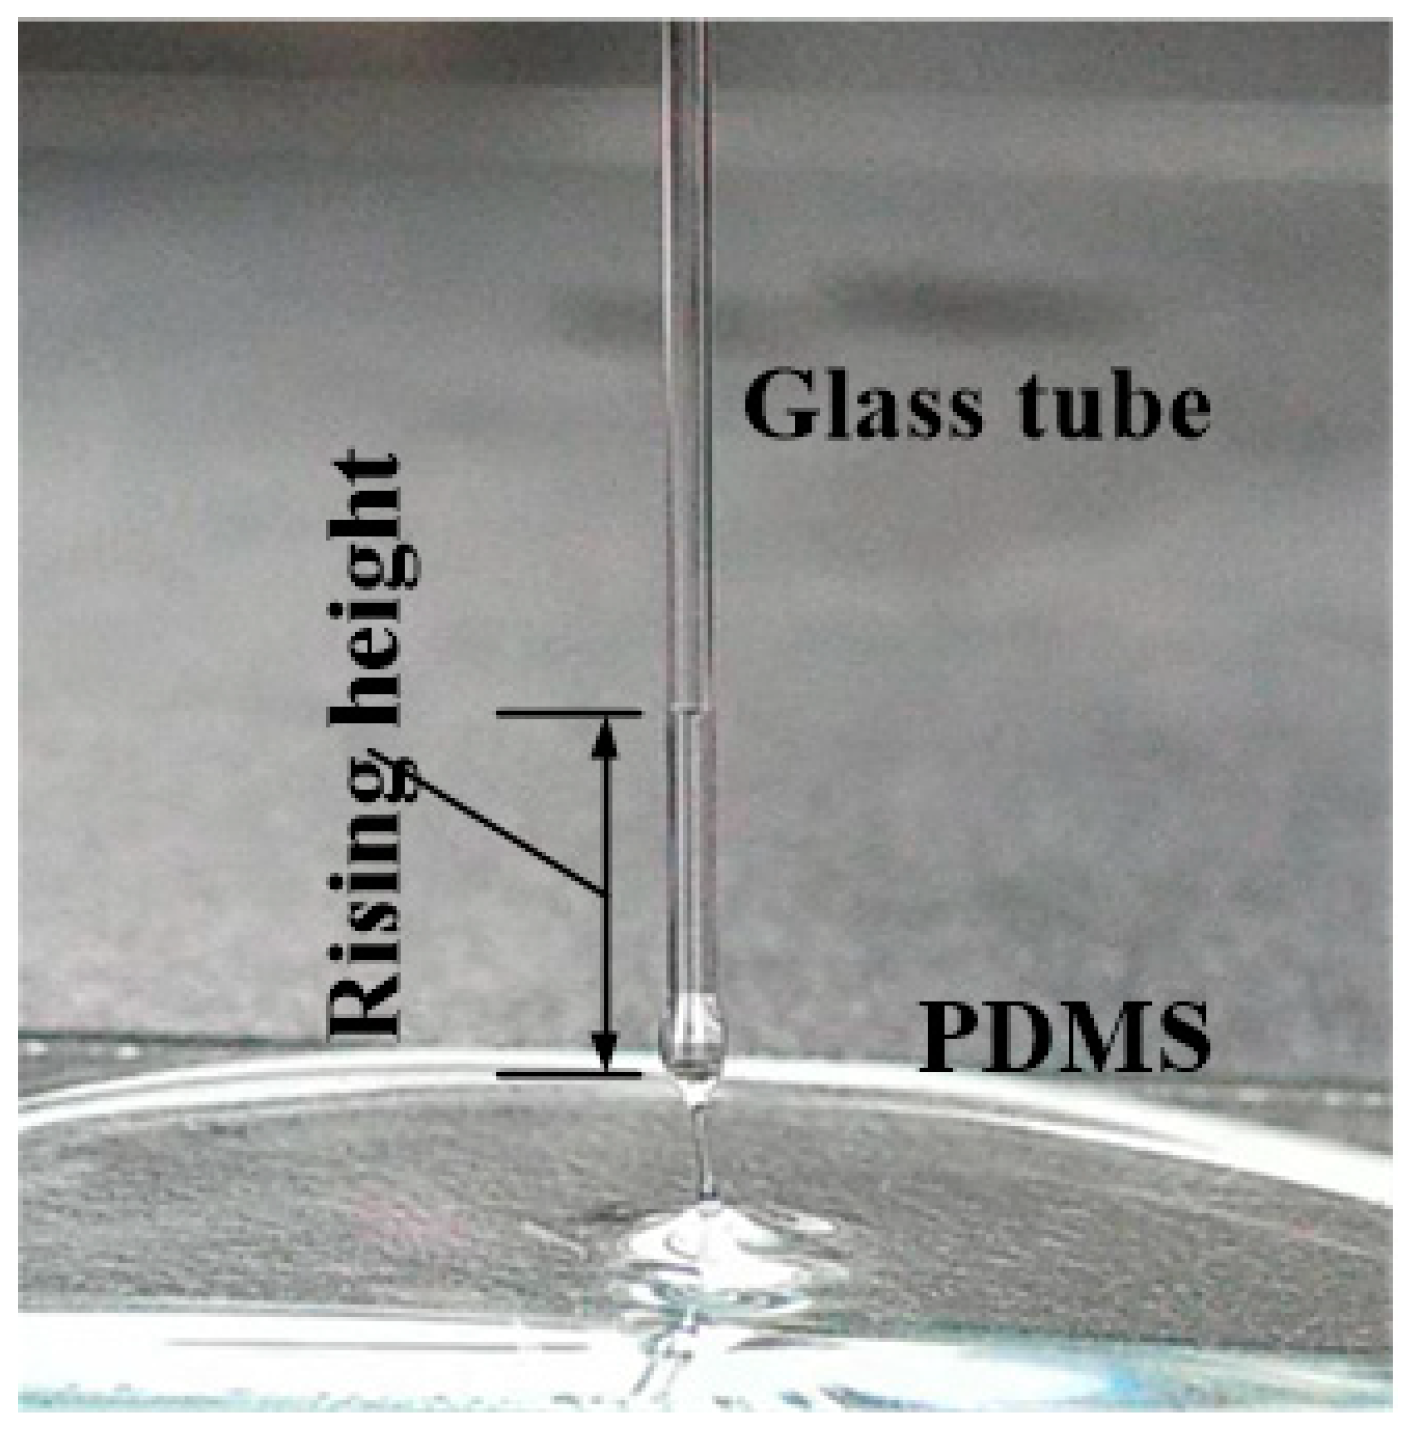
Through experiments, we found that PDMS with different viscosities shows an obvious difference in the diffusion effect of the film under the capillary effect. Therefore, we control the viscosity of the PDMS by controlling the solidification time of the PDMS. Glass tube diffusion experiments were performed on solidified PDMS for 10, 20, and 30 min. In order to reduce the diffusion rate of the PDMS in the glass tube, a high temperature solidification method is used to enhance the viscosity characteristics of the PDMS material. Specifically, after preparing the PDMS gel, the PDMS was fixed in an oven at 60 °C for a certain time
T, and then the capillary was vertically inserted into the solidified PDMS. For the capillary with an inner diameter of 300 μm, the height at which the PDMS rises at different times is recorded to calculate the diffusion rate after solidification (As shown in
Figure 2).
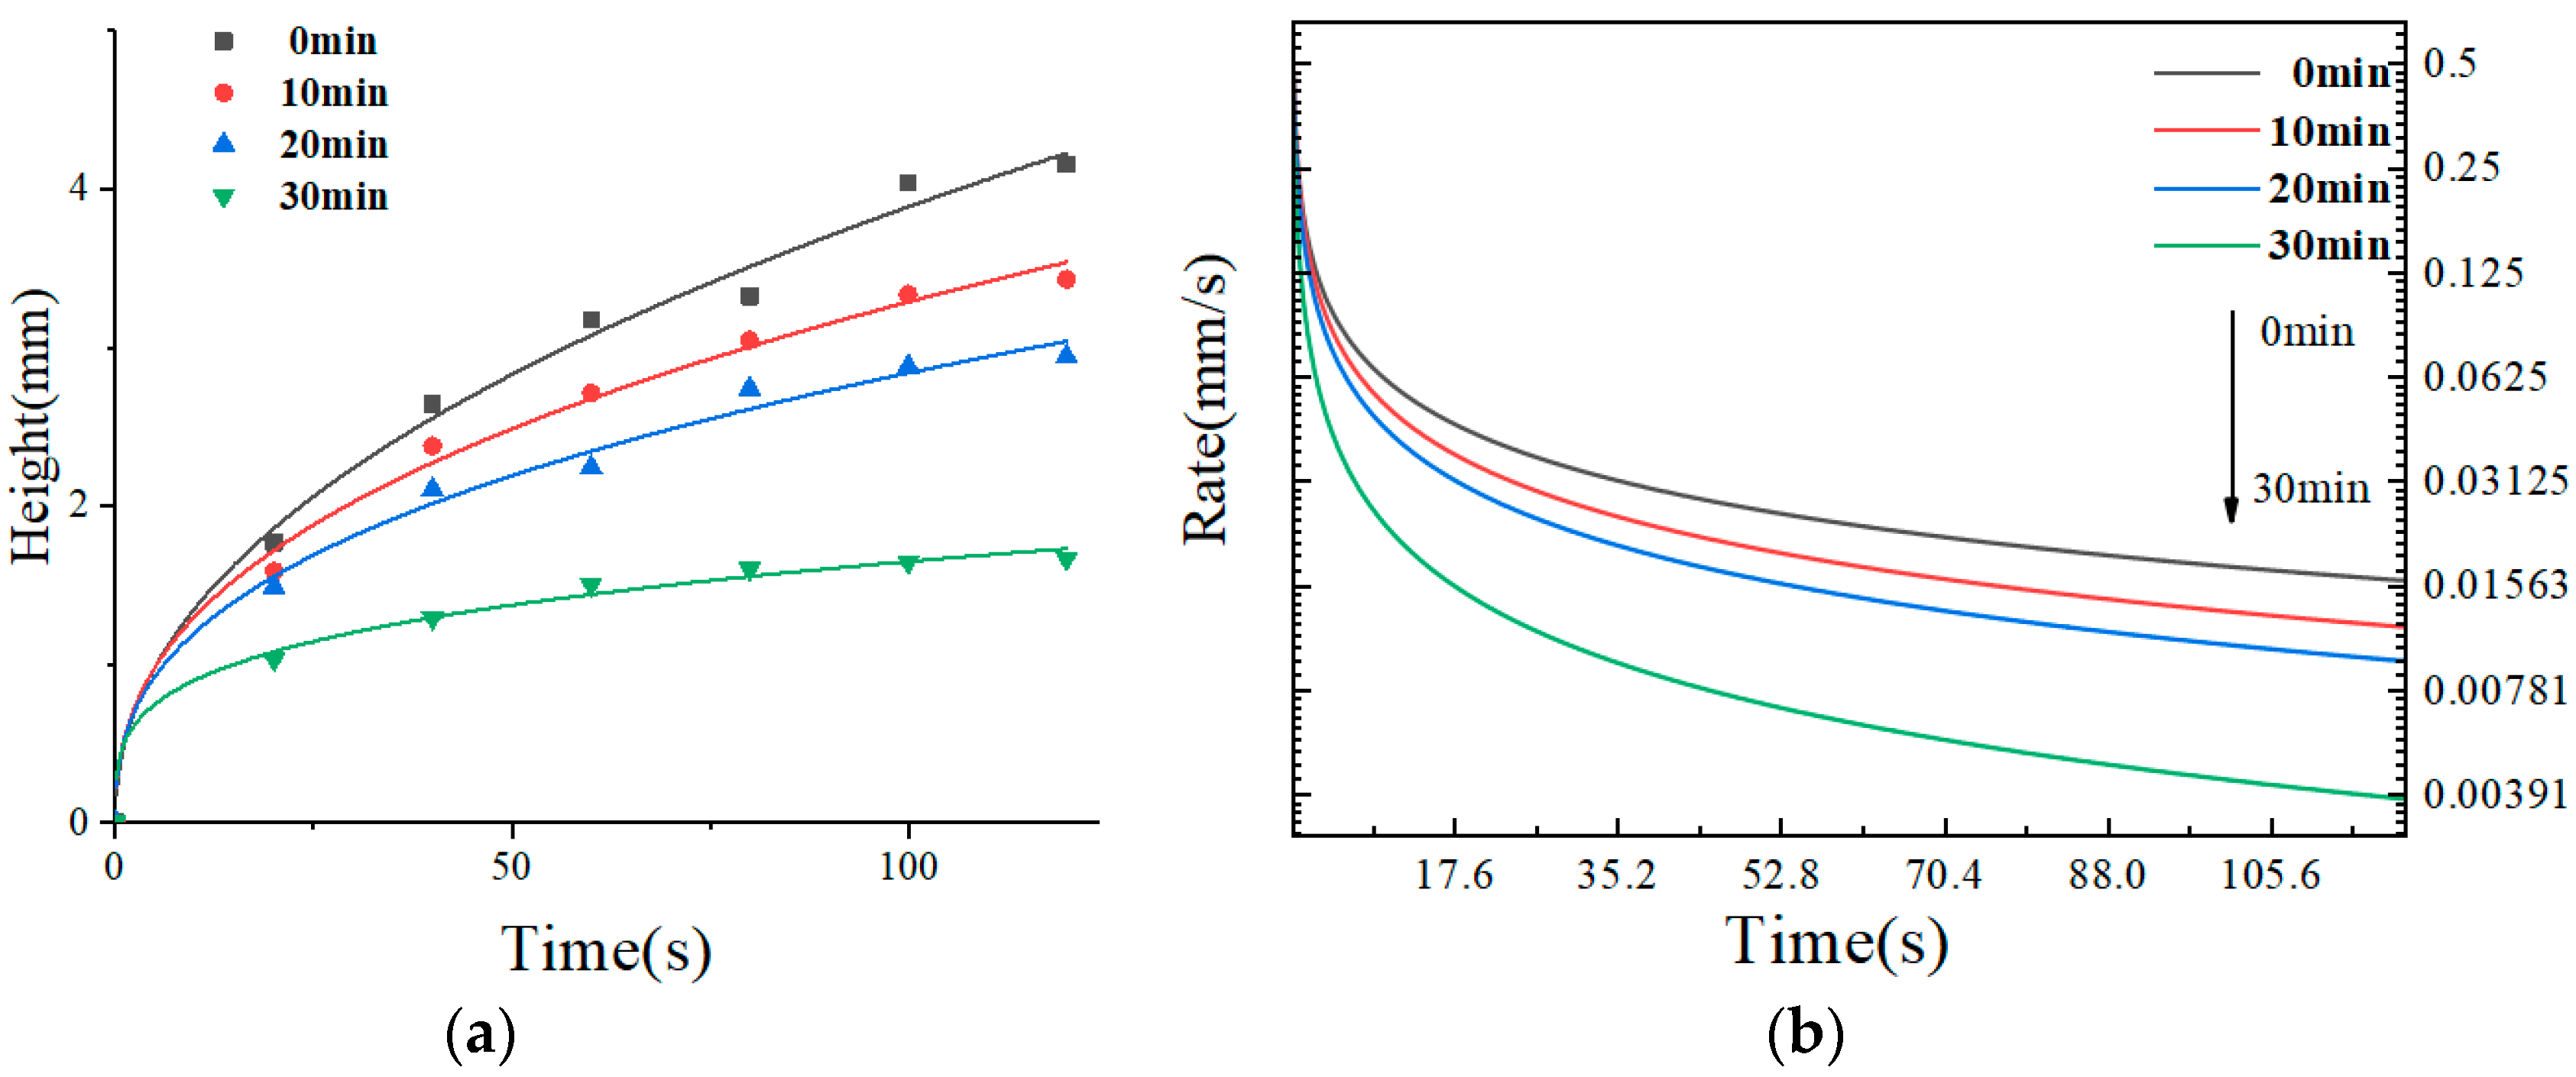
The relationship between the diffusion distance in the glass tube and the diffusion time is shown in
Figure 3a. As can be seen from
Figure 3a, as the time increases the PDMS liquid diffusion length in the glass tube is only about 1.3 mm in 120 s after solidification for 30 min.
Figure 3b is a graph showing the diffusion rate as a function of the time. One can see that the diffusion rate is not only related to the solidification time, but also to the diffusion time. As the time increases, the diffusion rate will gradually decrease.
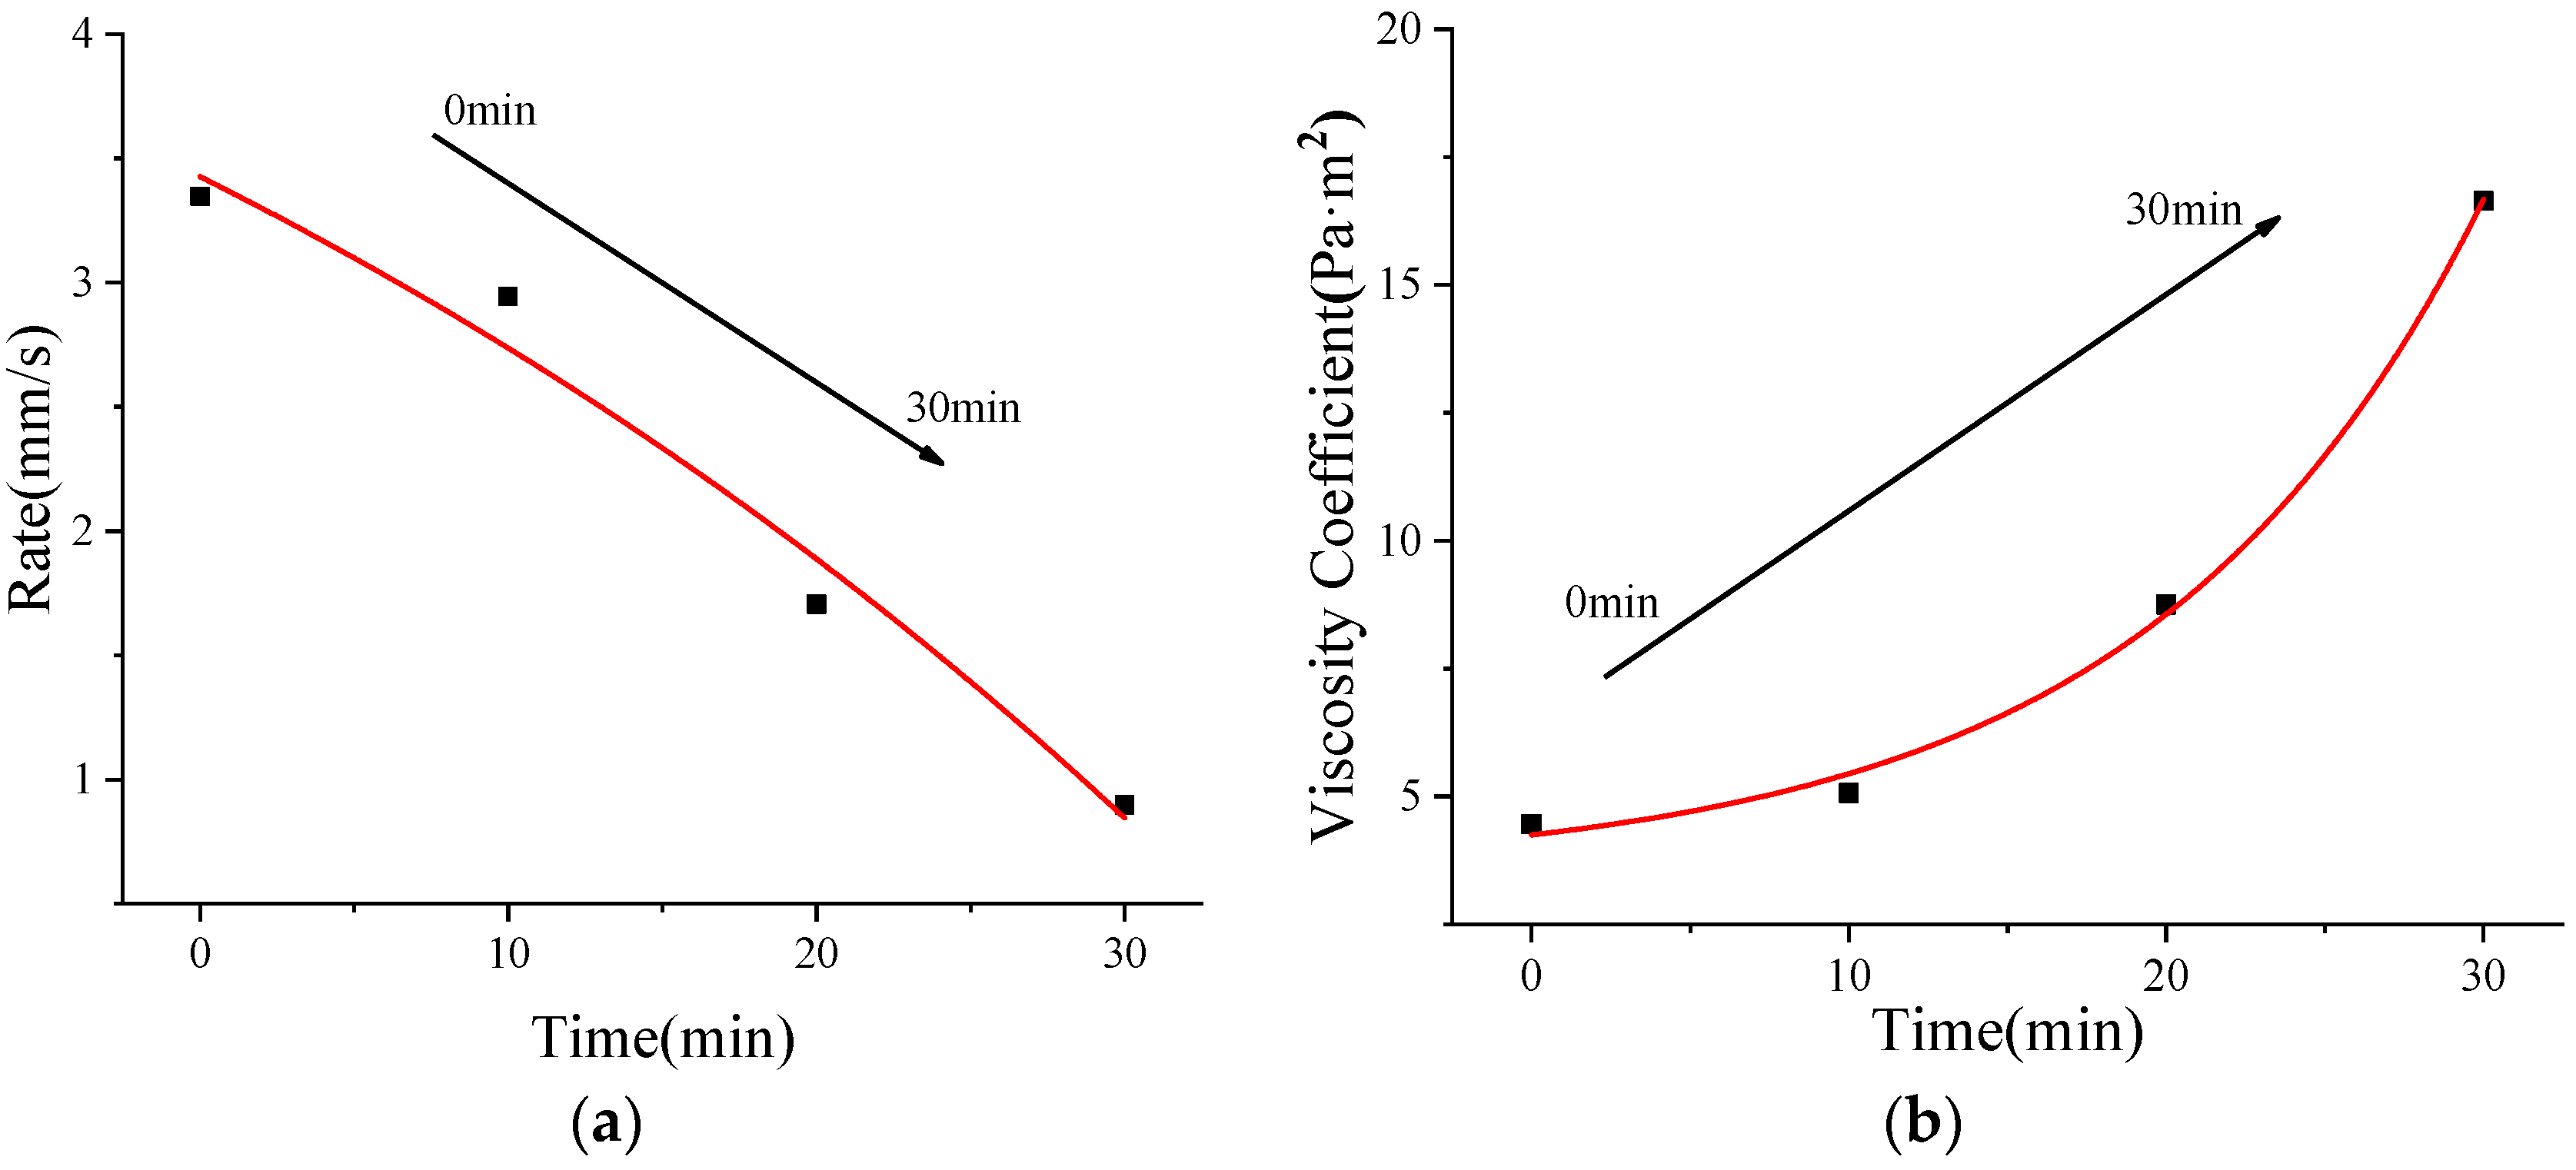
To analyze the relationship between the viscosity coefficient of the PDMS and the diffusion rate, we calculated the specific viscosity coefficient of the PDMS solution after a solidification for a certain period of time using the falling ball method [
19]. The specific method involves putting a 2 mm solid small steel ball into the PDMS after solidification had occurred for a while, and recording the time required for the ball to drop down to the PDMS depth
L. Then, the PDMS density of different solidification times was measured, and the viscosity of the PDMS was calculated through Equation (3):
where
d is the diameter of the pellet,
t is the fall time, ρ′ is the density of the pellet,
D is the diameter of the cylinder, and
H is the height of the liquid in the cylinder.
The relationship between the corresponding average falling velocity of the ball and the solidification time of the PDMS is shown in
Figure 4a. As can be seen from
Figure 4a, as the solidification time of the PDMS increases, the falling speed of the pellets is continuously slowed down, and the falling speed in the PDMS after solidification for 30 min is less than 1 mm/s.
Figure 4b is the relationship between the viscosity coefficient of the PDMS and its setting time. From the initial solidification to the solidification for 30 min, the viscosity coefficient of the PDMS increased from 4 to 17 Pa·m
2, exponentially increasing.
Comparing the diffusion rate with the solidification time in
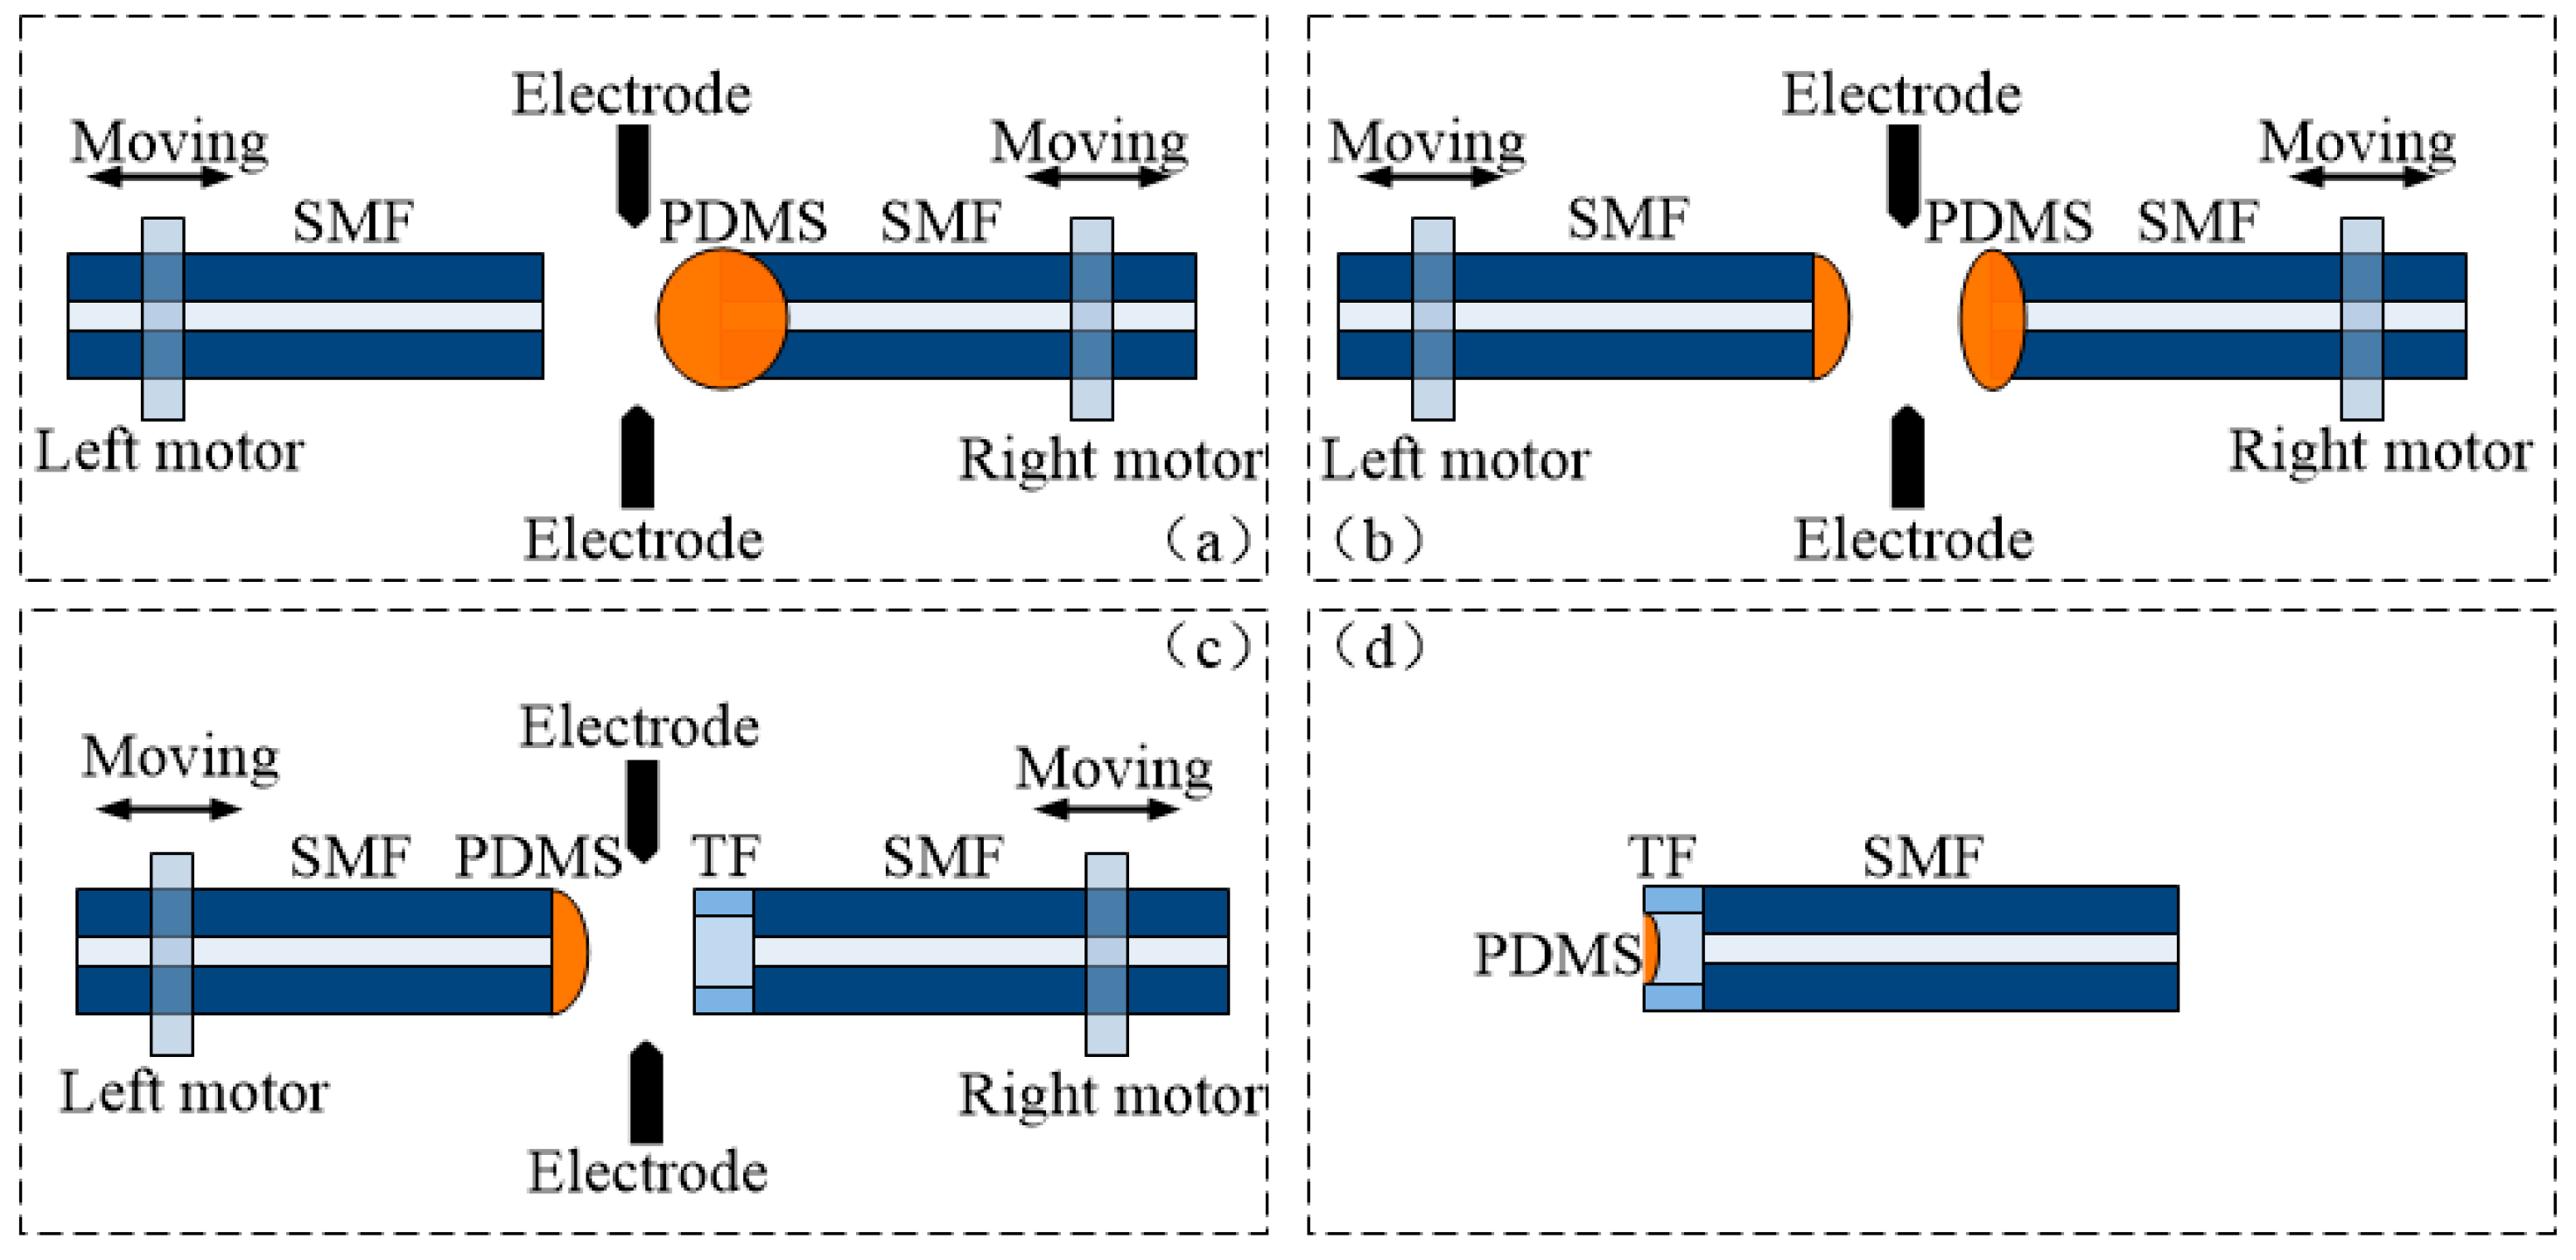
Figure 3, we know that as the solidification time increases, the viscosity coefficient of the PDMS increases greatly, and the corresponding diffusion rate decreases accordingly. Thus, we confirmed that the film thickness of the PDMS can be reduced by increasing the setting time. When the PDMS with the appropriate solidification time, as described above, was in contact with the end of the glass tube, the glass tube could inhale excess PDMS due to the capillary effect. To make the thickness of the PDMS film thinner and to improve the sensitivity, multiple transfer methods were used to reduce the amount of PDMS inhaled into the PDMS, that is, using the single-mode fiber to remove the end-end adhesive and then using another identical single-mode fiber in the fusion. The PDMS transfer was performed in the machine, and the thickness of the PDMS film layer can be known more accurately by controlling the number of transfer times. The experimental process is shown in
Figure 5. The specific experimental method involves first drawing a small amount of PDMS from the end of the single-mode fiber, and then transferring a part of the PDMS liquid to the end of the second single-mode fiber by a motor drive in a fusion splicer (61S, Fujikura Ltd., Tokyo, Japan). A portion of the existing PDMS liquid is then transferred to the end of the third single mode fiber. Gradually, the PDMS liquid at the end of the fiber will decrease, and the purpose of reducing the volume and thickness of the PDMS diffused into the glass tube in the sensor can ultimately be achieved. Since the remaining PDMS liquid will not form a film structure in the glass tube after a certain number of transfers, a similar transfer process does not last indefinitely.
By means of a precision cutting system, a fiber tube length of 100 to 200 μm can be fused to the end of another single mode fiber. This specific method involves fixing the single-mode fiber and the fiber tube at the two ends of the cutting platform, respectively, and monitoring the small movement of the fiber in real time using the charge-coupled device (CCD). High-precision mobile monitoring ensures that we can obtain the required length of the glass tube. In order to analyze the influence of the F-P cavity length on the sensitivity and in order to control the thickness of the PDMS film layer, two sets of glass tubes were prepared to be 176.6 and 263 μm long, respectively. The transferred small amount of PDMS was then diffused to the end of the fiber tube by a fusion splicer. Due to the capillary effect, the PDMS diffused to a certain depth
L2 within the fiber tube. Finally, the obtained PDMS embedded structure fiber Fabry-Perot sensor is shown in
Figure 5d. Since the film structure can undergo significant topography under the action of pressure, a pressure sensor can be formed.
By transferring the PDMS liquid multiple times, combined with the above PDMS solidification method, the thickness of the formed film layer can be greatly reduced. Then, we have specifically studied the influence of the prepared sensor sensitivity.
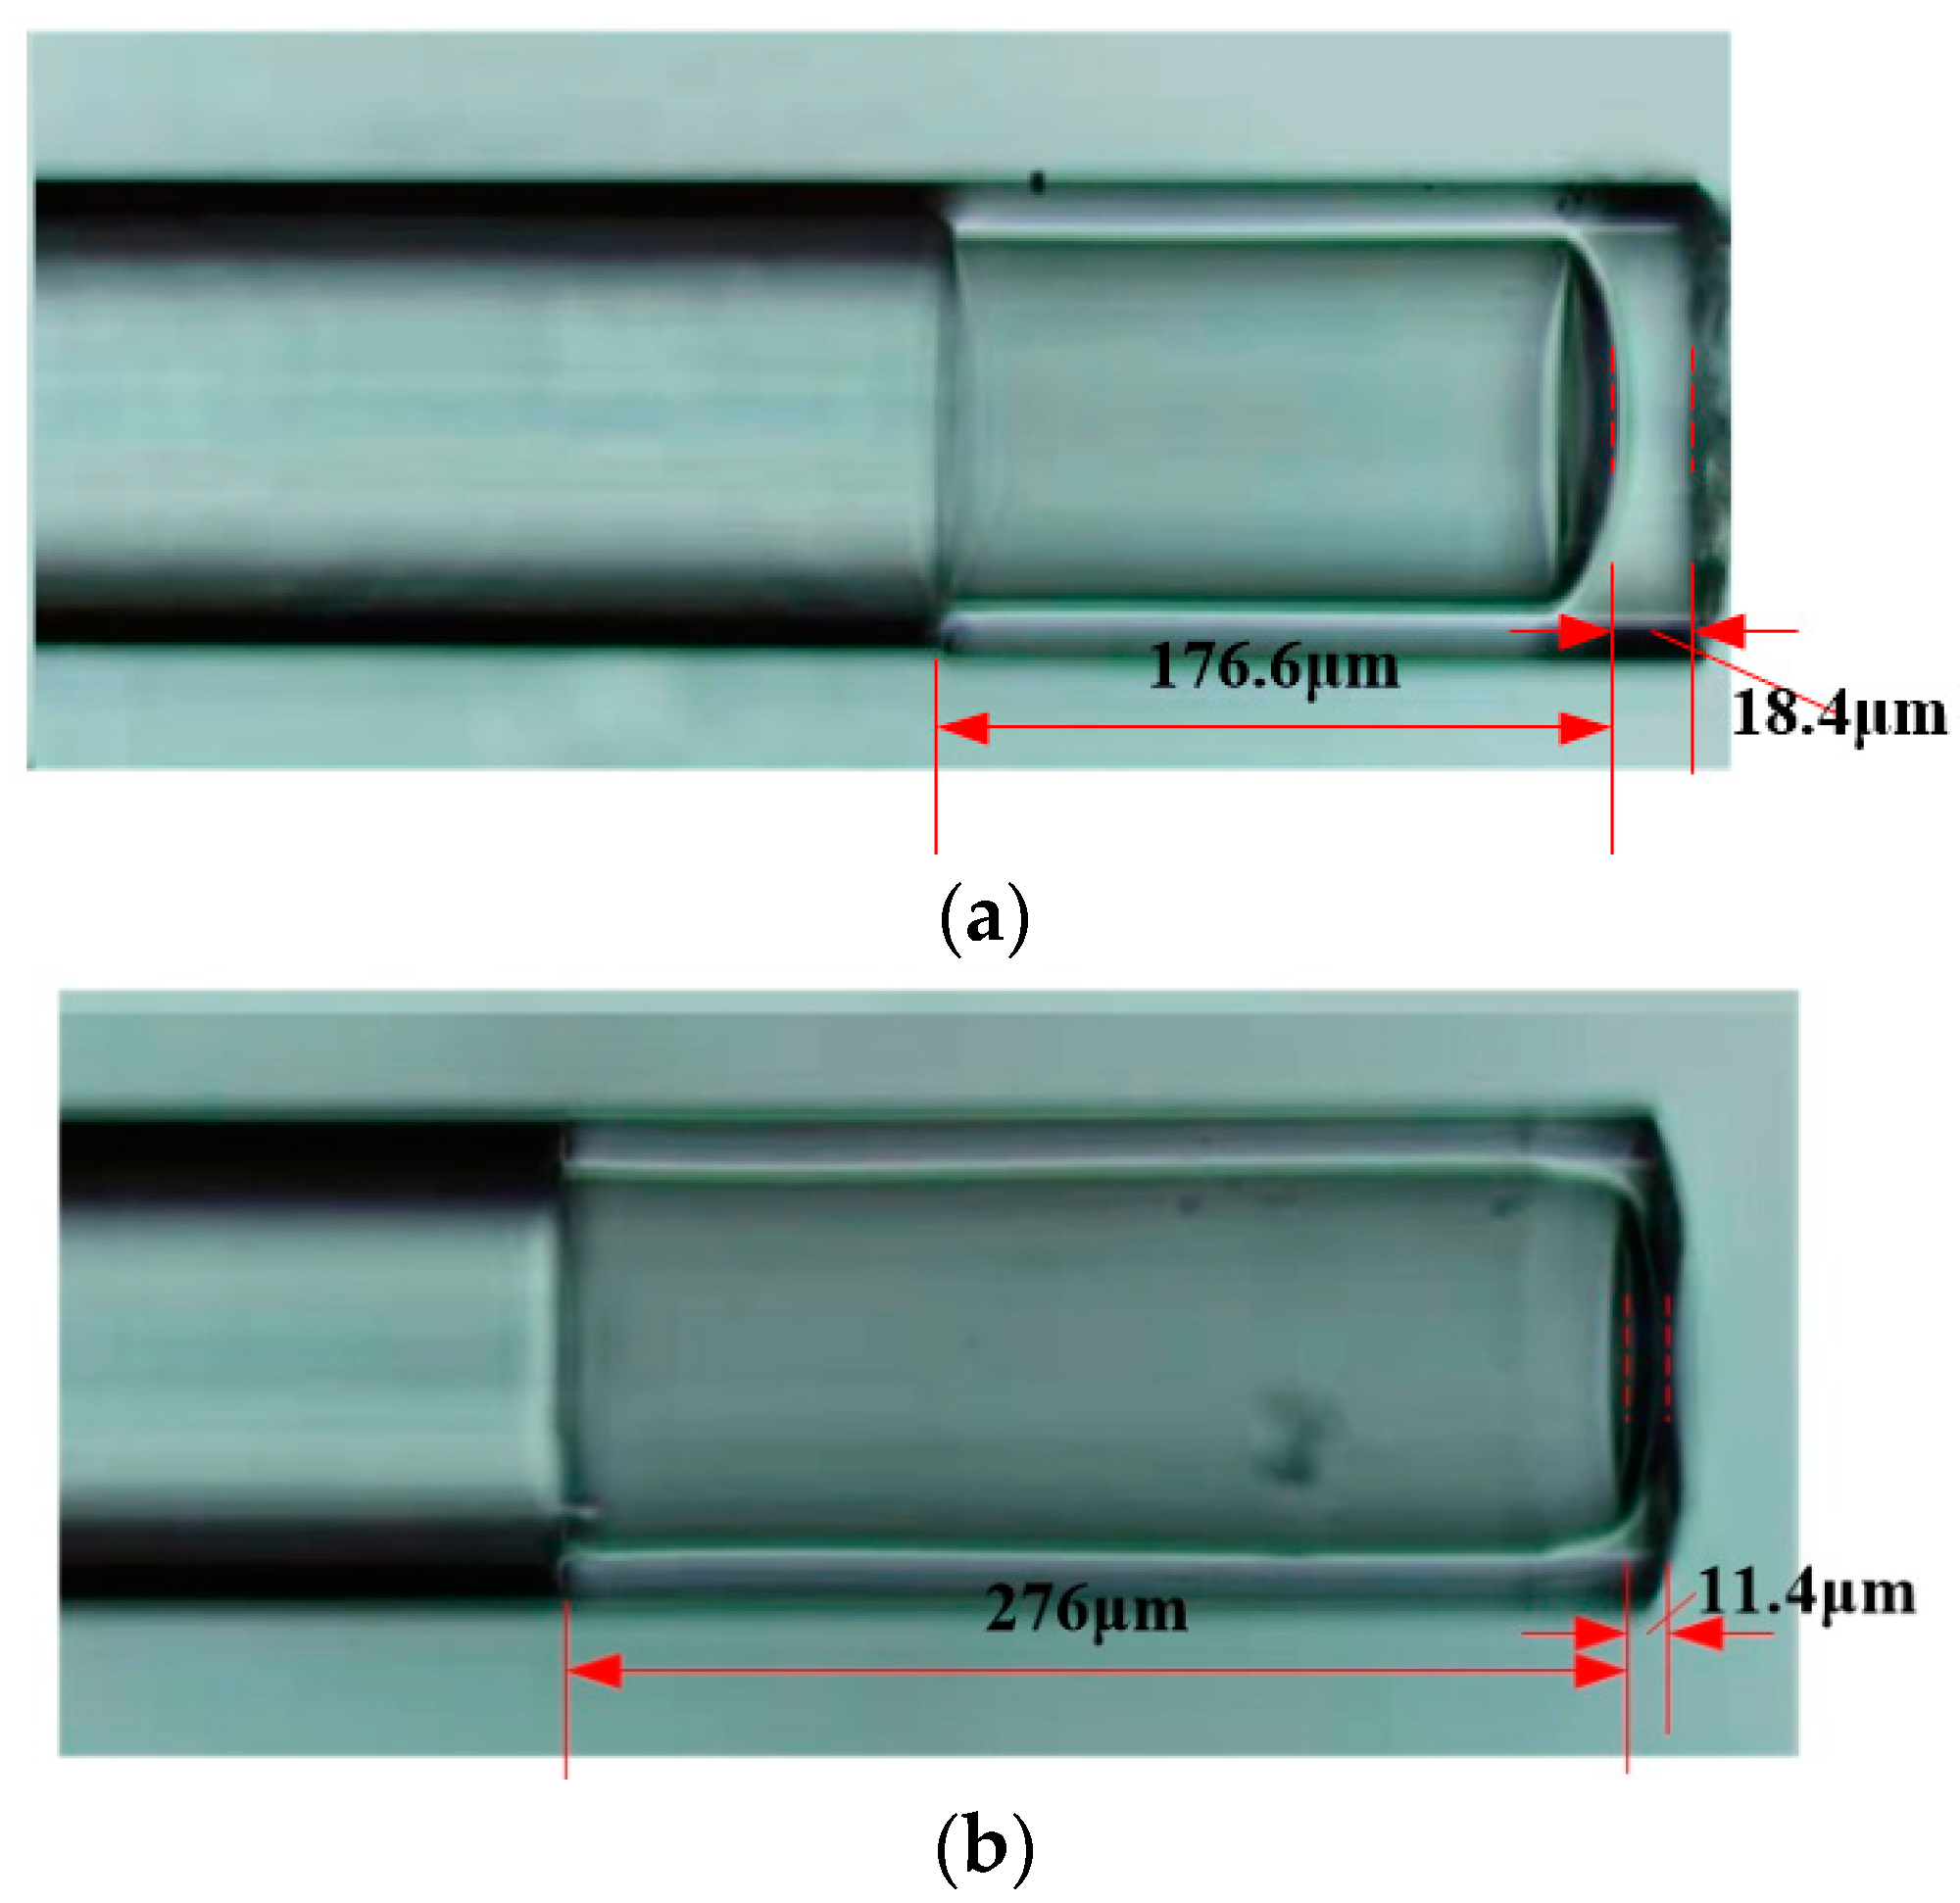
The finally prepared PDMS embedded structure fiber Fabry-Perot sensor is shown in
Figure 6. The cavity length of the sample S1 is about 176.6 μm, and the cavity length of the sample S2 is about 276 μm. The film thicknesses are about 18.4 and 11.4 μm, respectively. The corresponding solidification conditions were baked in an oven at 60 °C for 30 min and transferred 2 times. That is because, in the experiment, we found that the low viscosity of the PDMS leads to a large diffusion distance of the PDMS under the capillary effect. Accordingly, an imperfect film or an entire glass tube is formed to completely fill the PDMS. Eventually, it is impossible to form an F-P cavity. However, if the viscosity of the PDMS is large, the PDMS cannot be diffused into the glass tube.
4. Testing and Analysis of Sensor Performance
Figure 6 shows that the thickness of the PDMS film layer after the optimization is very thin, which contributes to the preparation of a pressure sensor with a relatively high sensitivity. Thus, in this section, we analyze the specific sensitivity of the sensor by constructing a pressure test system, as shown in
Figure 7. The system consists of a light source (ASE, Beijing Kangguan Century Optoelectronics Technology Co., Ltd., Beijing, China), a pressure pump (Beijing ConST Instrument Technology Co., Ltd., Beijing, China), a sealed air chamber, a fiber optic circulator, a spectrum analyzer (YOKOGAWA, Tokyo, Japan), and a prepared fiber Fabry-Perot sensor.
Due to the high elastic modulus and light transmission characteristics of the PDMS, the PDMS film layer moves slightly under different pressures. Accordingly, the length L1 of the F-P cavity and the peak position of the interference spectrum in the spectrometer also change. In this way, we can determine the change of the pressure by detecting the offset of the interference spectrum.
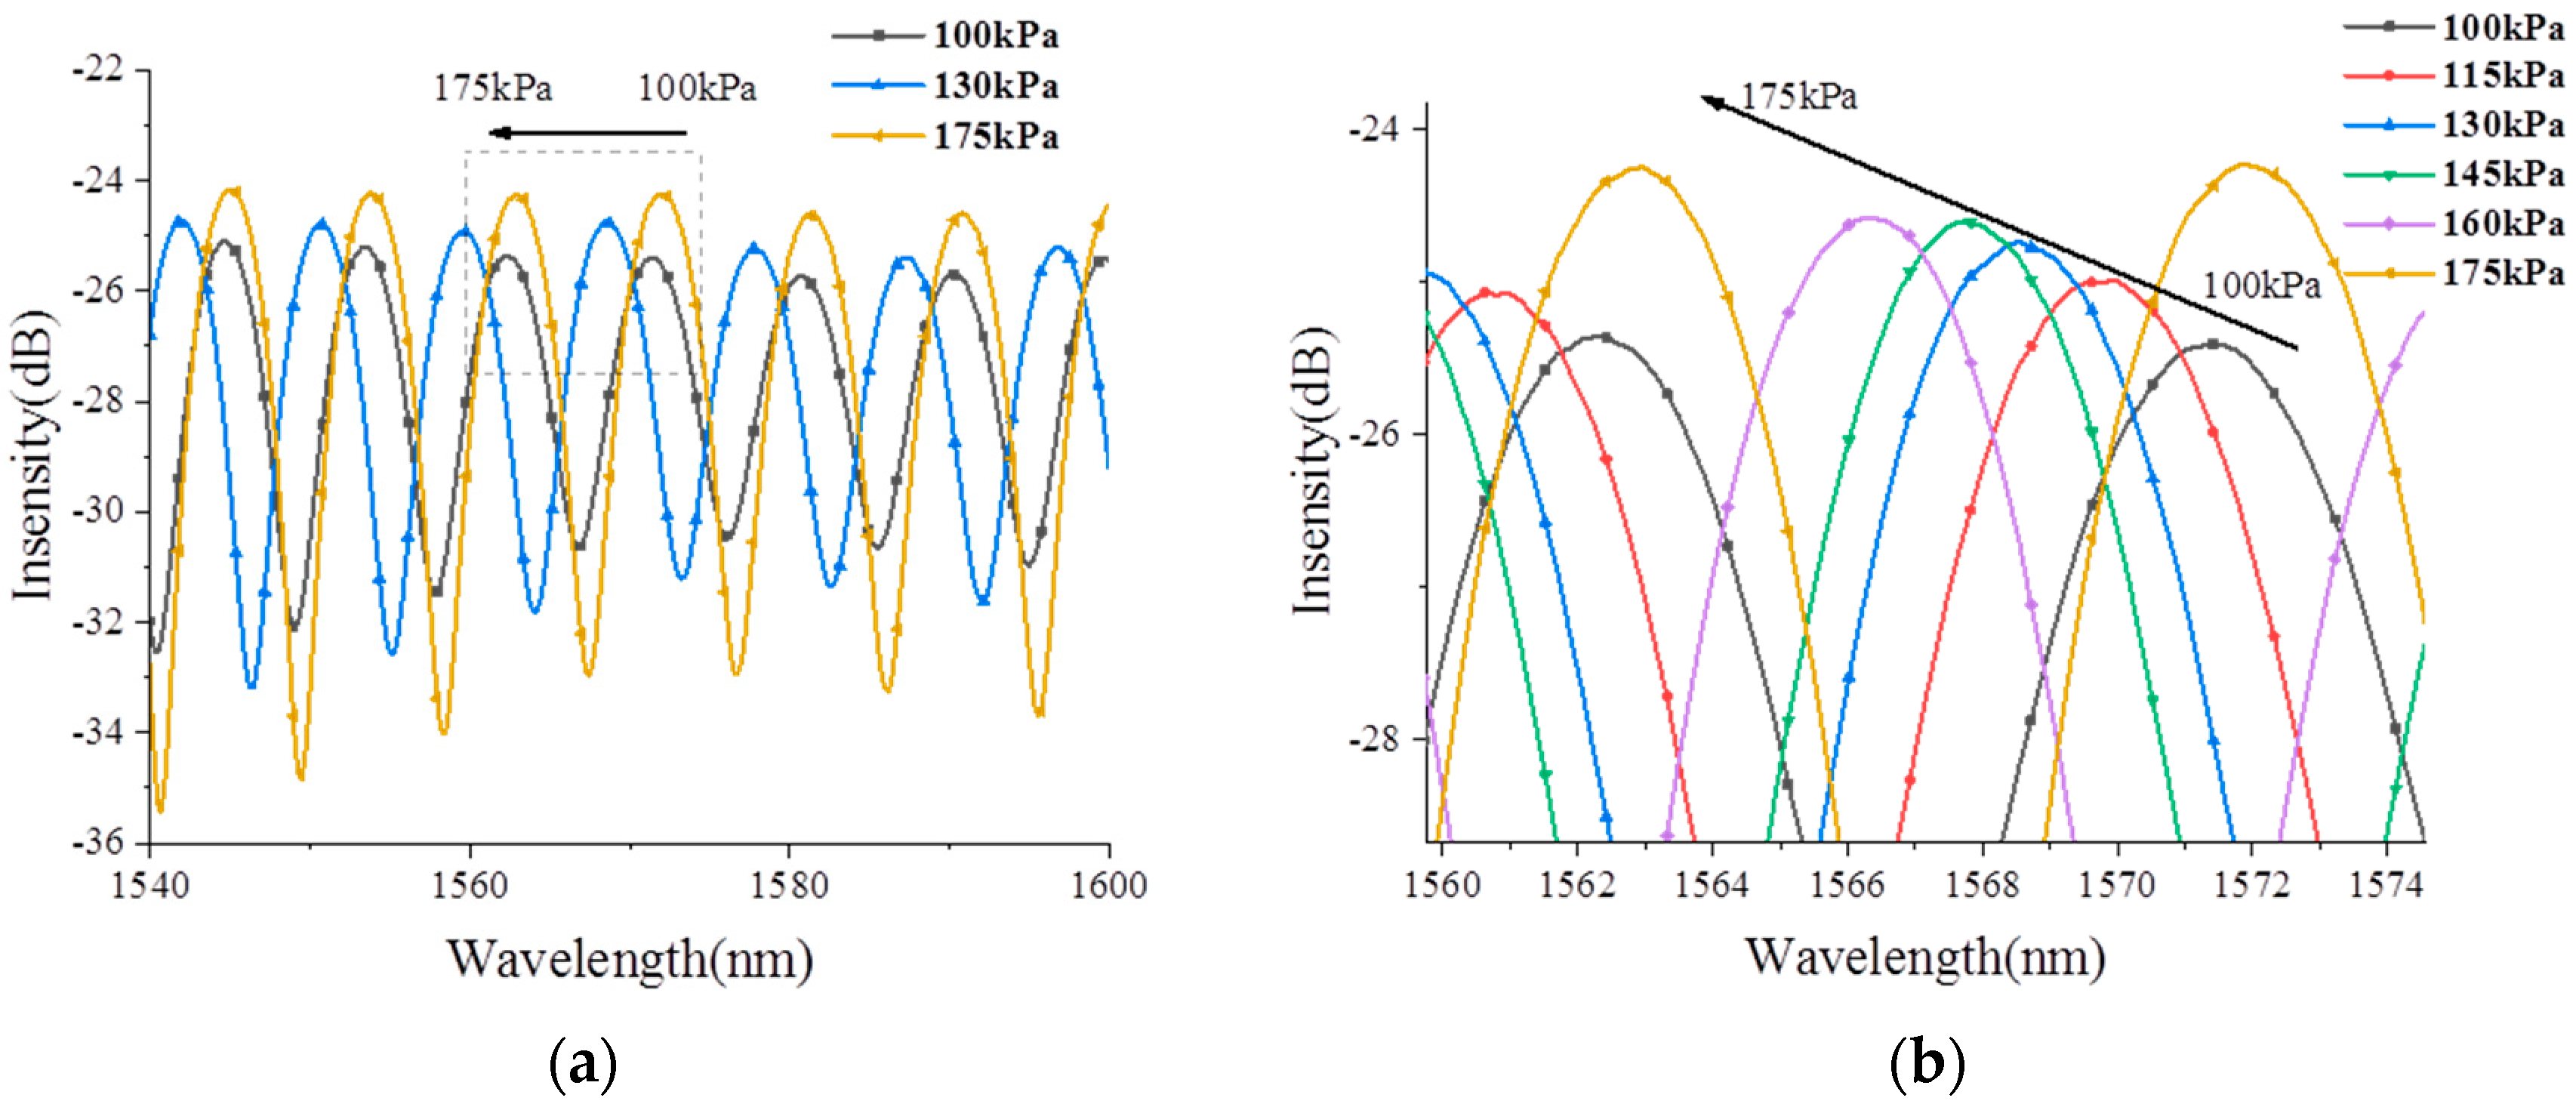
Figure 8a analyzes the reflection spectrum and its variation characteristics of sensor S1 in the range of 100 to 175 kPa. Due to the cavity length of about 176.6 μm, five interference peaks appear in the spectral range of 100 to 175 kPa. Here we select the intermediate interference peak for a more detailed analysis. As shown in
Figure 8b, as the pressure is increased, the peak of the interference spectrum is blue-shifted.
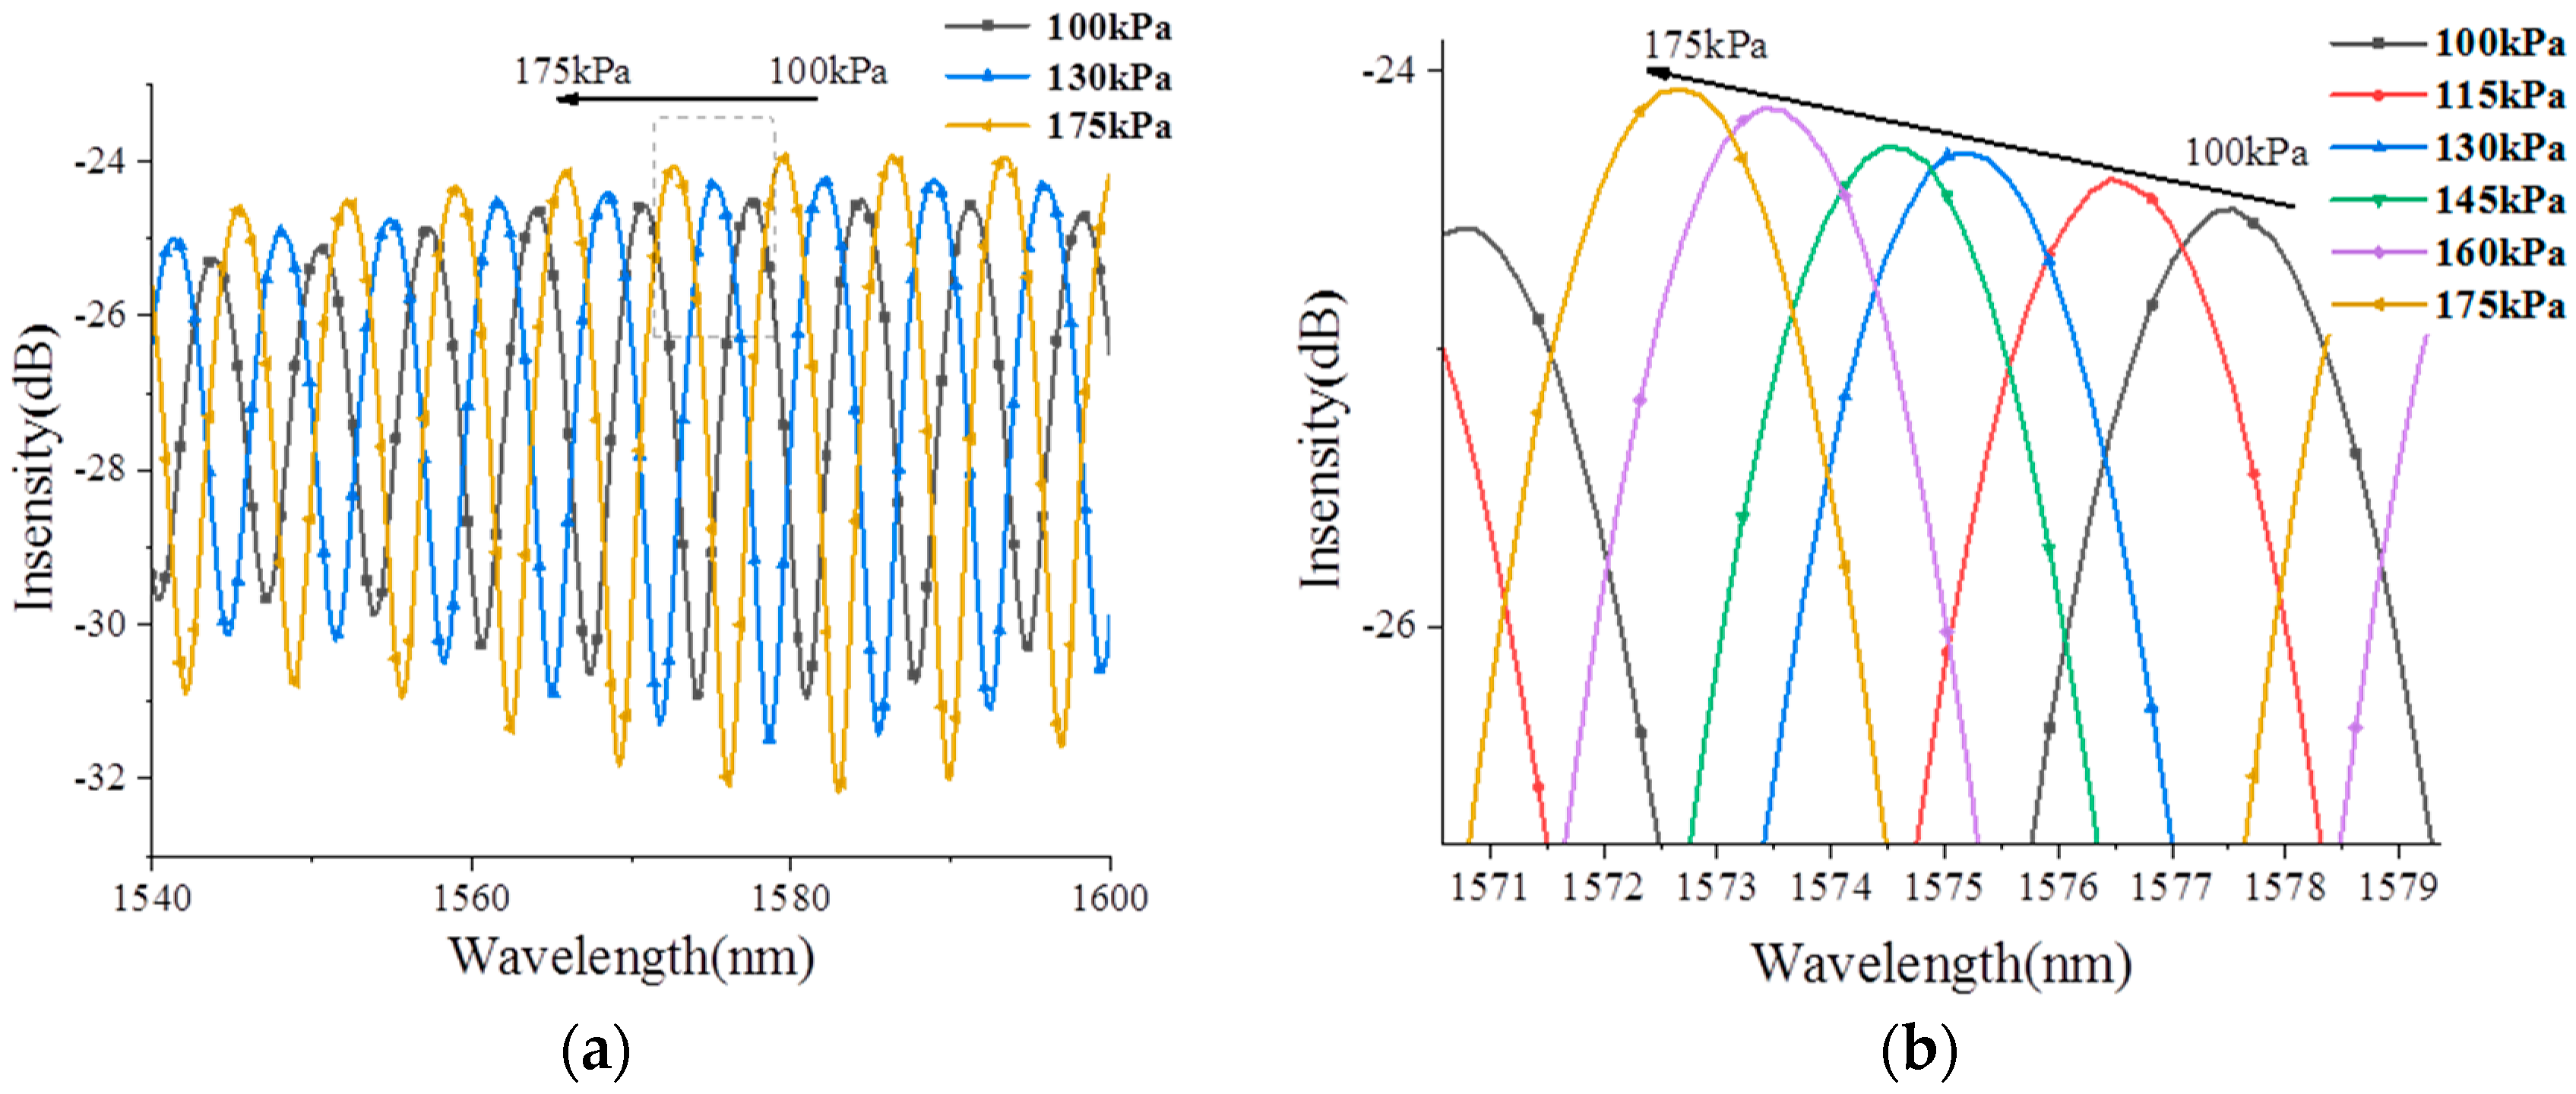
Figure 9a analyzes the reflection spectrum and its variation characteristics of sensor S2 in the range of the pressure range from 100 to 175 kPa. Compared with the sensor S1, since the cavity length is increased to about 276 μm, about 9 interference peaks appear in the spectral range of 1540 to 1600 nm. Here we still choose the intermediate interference peak for a more detailed analysis. As shown in
Figure 9b, as the pressure increases, the peak of the interference spectrum also appears blue-shifted.
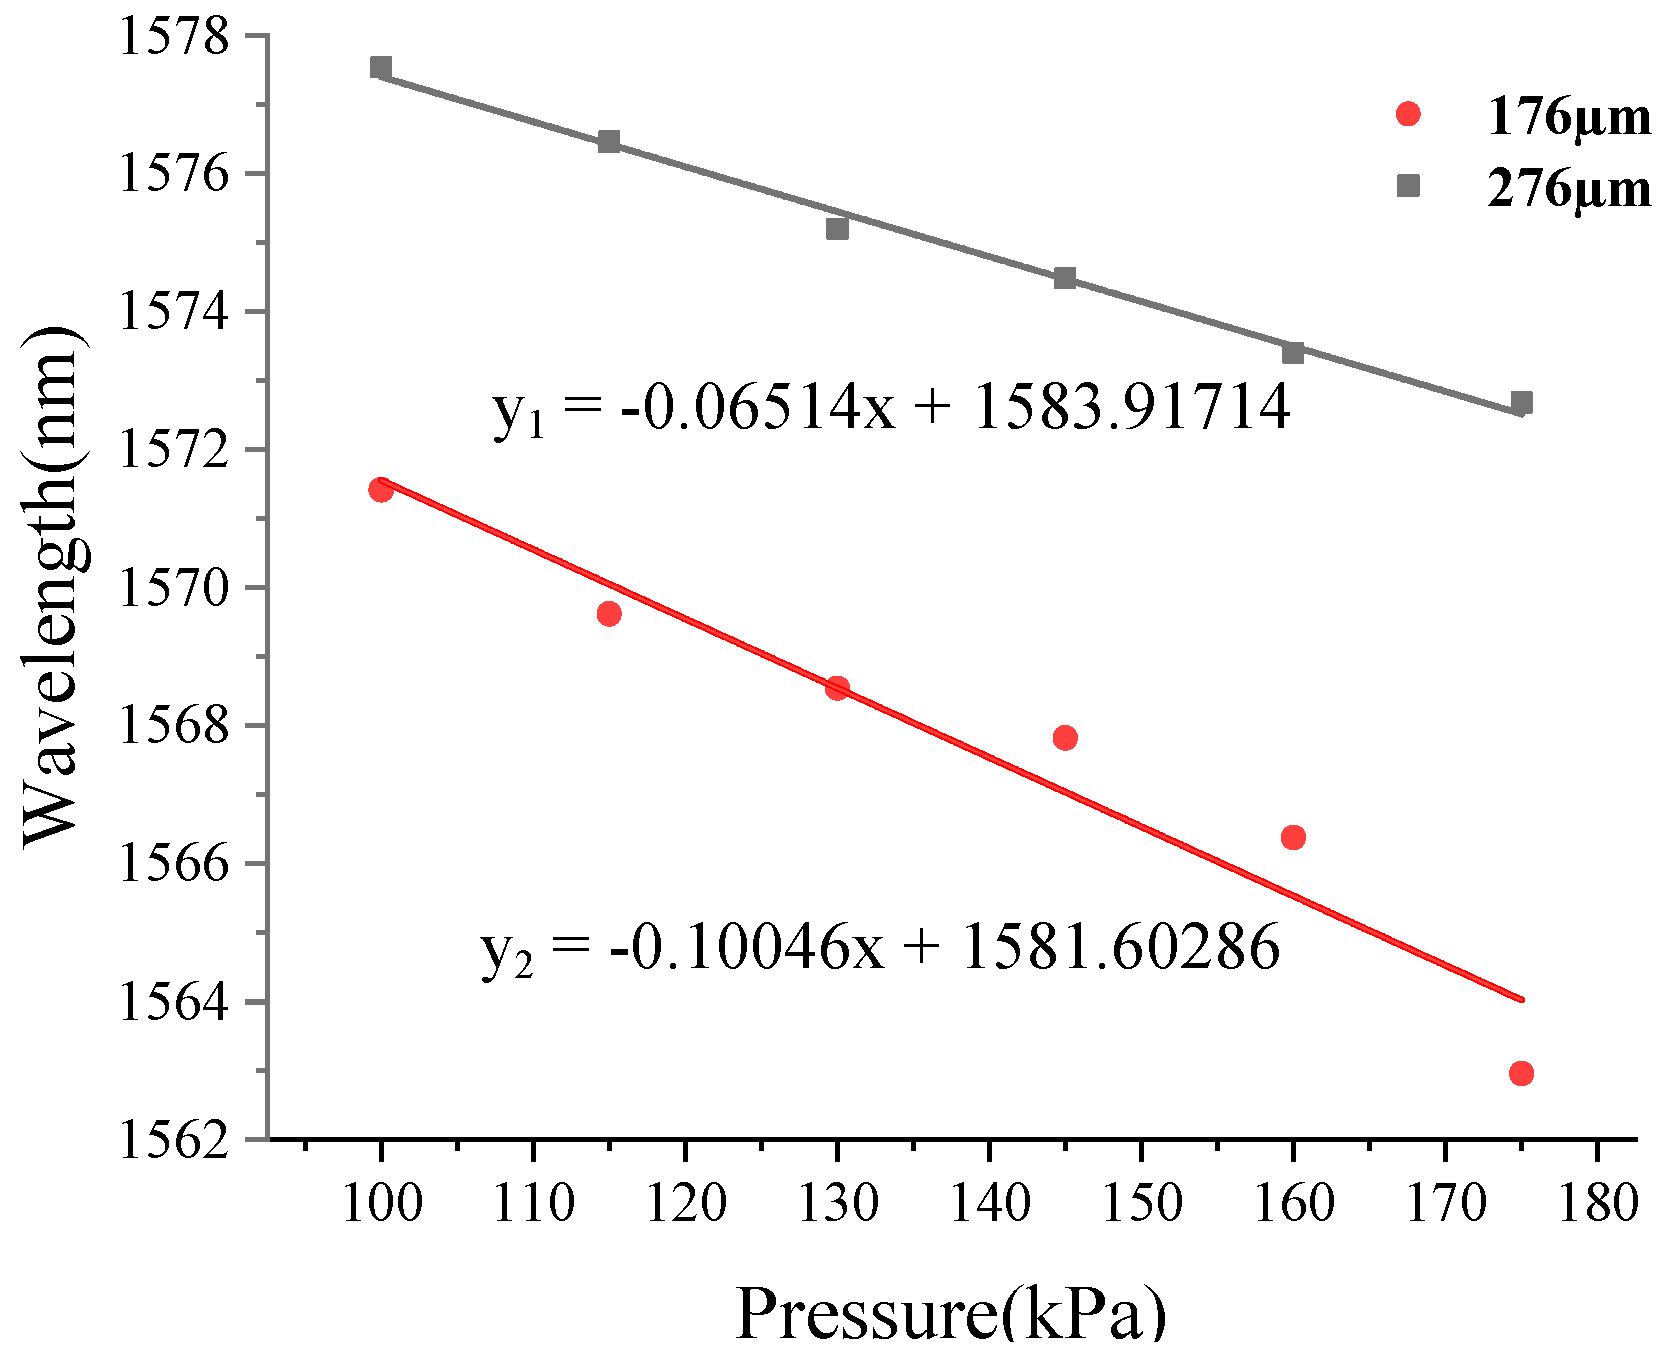
Figure 10 compares the corresponding sensitivity characteristics of the sensors S1 and S2. From
Figure 10, the corresponding sensitivities of the sensors S1 and S2 are 100.46 and 65.14 nm/kPa, respectively. Compared to the reported literature [
20], the sensor S1 sensitivity is about 100 times that of the literature data. Since the method of controlling the viscosity and the multiple transfers of the PDMS is adopted in this paper, the sensitivity of the sensor is greatly improved. The results show that the pressure sensitization method proposed in this paper has obvious effects and can provide a good reference for subsequent related research.
At the same time, we consider that the temperature characteristics are important factors in the pressure monitoring. If the sensor has a certain response to the temperature, various anti-interference methods should be used to reduce its temperature characteristics. Therefore, in this part, we also calculate the temperature sensitivity characteristics of sensor S2.
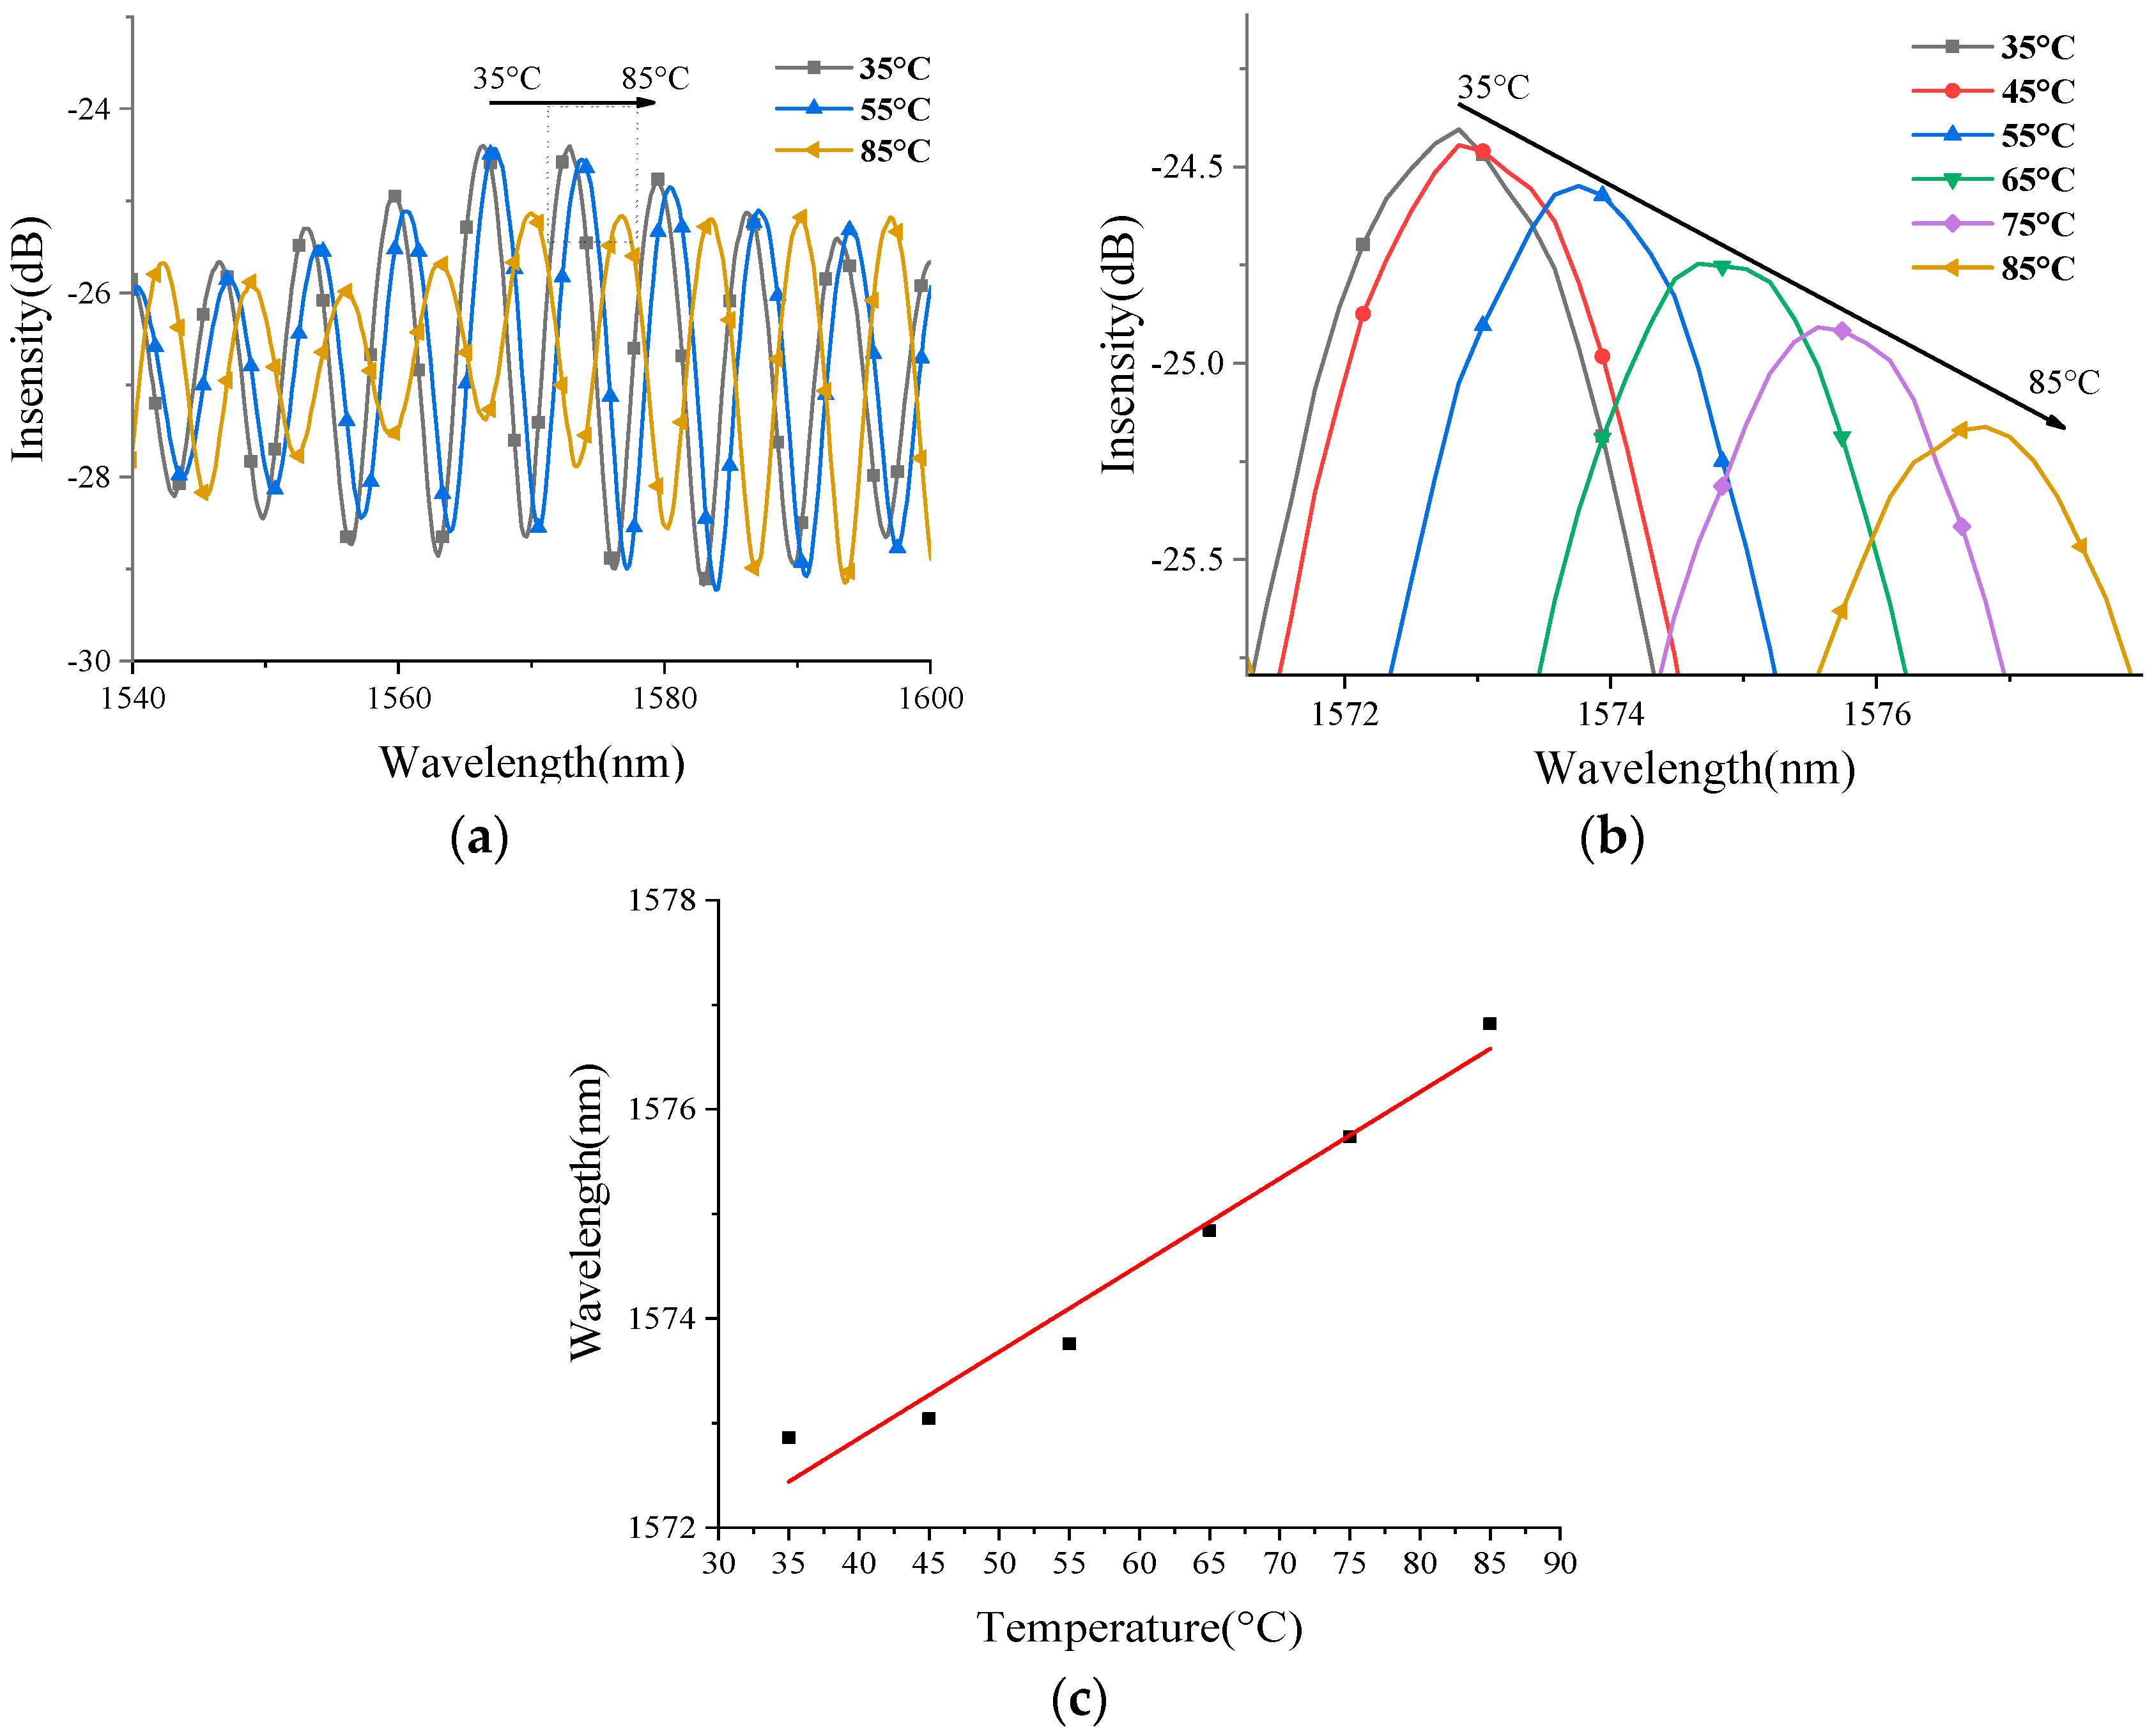
Figure 11a analyzes the corresponding peak change in the temperature change. We can see that the interference spectrum shows a red shift when the temperature increases.
Figure 11b specifically analyzes the peak change of one of the spectral peaks when the temperature is increased from 35 to 85 °C. It can be seen that the red shift trend is more obvious.
Figure 11c analyzes the corresponding spectral peak sensitivity characteristics, which correspond to approximately 82.8 pm/°C. This value is roughly 1/30 of the reference [
18]. The deformation size of the PDMS in the temperature change is reduced due to the large decrease of the film layer, which helps to improve its resistance to the temperature interference.
5. Conclusions
In this study of fiber optic FP pressure sensors, how to control the thickness of the filled-in PDMS is a very meaningful thing, which is crucial for optimizing the sensor sensitivity. This paper investigates the relationship between the PDMS viscosity, diffusion rate and the thickness of the PDMS film in the fiber.
The results of this experiment show that the thickness of the PDMS film in the sensor can be controlled by up to more than ten micrometers by precisely controlling the PDMS viscosity and multiple transfer methods. Compared with the previous literatures, the sensitivity of the sensor pressure is significantly improved by greatly reducing the thickness of the PDMS film in the sensor. The sensitivity of the sensor obtained in this paper can reach 100 pm/kPa, which is about 100 times that reported in the previous literature. In addition, due to the decrease of the thickness of the film, the temperature sensitivity of the sensor is also greatly reduced, which is about 1/30 of that reported in the literature, which greatly improves the temperature resistance of the sensor.
However, we also found that the viscosity coefficient is not as large as possible. Excessive viscosity coefficients cause the PDMS to fail to form an effective film and sensor structure at the end of the glass tube. In the 60 °C temperature control box, the solidification time selected in this paper is about 30 min. At the same time, the number of multiple transfers is also limited. The number of transfers selected in this paper is twice. In summary, this paper analyzes the influence of the multi-sensor sensitivity of the PDMS viscosity coefficient, diffusion rate, time and transfer times for the first time, which has certain reference value for related research.
