Article

Electrodeposition of Hydroxyapatite Coatings for Marble Protection: Preliminary Results

Department of Civil, Chemical, Environmental and Materials Engineering (DICAM), University of Bologna, Via Terracini 28, 40131 Bologna, Italy
*
Author to whom correspondence should be addressed.
Coatings 2019, 9(3), 207; https://doi.org/10.3390/coatings9030207
Submission received: 27 February 2019 / Revised: 17 March 2019 / Accepted: 19 March 2019 / Published: 23 March 2019
(This article belongs to the Special Issue Ion-Substituted Calcium Phosphates Coatings)

Abstract

:
Surface coatings made of hydroxyapatite (HAP) have been proposed to protect marble artworks from dissolution in rain, originated by the aqueous solubility of calcite. However, HAP coatings formed by wet chemistry exhibit incomplete coverage of marble surface, which results in limited protective efficacy. In this study, electrodeposition was explored as a new route to possibly form continuous coatings over the marble surface, leaving no bare areas. Electrodeposition was performed by placing marble samples in poultices containing the electrolyte (an aqueous solution with calcium and phosphate precursors) and the electrodes. The influence of several parameters was investigated, namely the role of the working electrode (cathode or anode), the distance between the marble sample and the working electrode, the deposition conditions (potentiostatic or galvanostatic), the electrolyte composition and concentration, the applied voltage, and time. The coating morphology and composition were assessed by SEM/EDS and FT-IR. The protective ability of the most promising formulations was then evaluated, in all cases comparing electrodeposition with traditional wet synthesis methods. The results of the study suggest that electrodeposition is able to accelerate and improve formation of HAP coatings over the marble surface, even though the obtained protective efficacy is not complete yet.

Graphical Abstract

1. Introduction

When exposed outdoors, marble artworks suffer from dissolution in rain because of the aqueous solubility of calcite (the mineral constituting marble, having solubility product Ksp = ~5 × 10⁻⁹ at 25 °C [1] and dissolution rate Rdiss = ~10−10 mol cm−2∙s−1 [2]). To prevent marble dissolution, a possible strategy is forming a surface coating with reduced solubility, compared to calcite. This has been attempted by several routes, e.g., by treating marble with aqueous solutions of ammonium oxalate, ammonium hydrogen tartrate, and ammonium phosphate to transform calcite into calcium oxalate, calcium tartrate, or calcium phosphates, respectively [2]. Among the investigated minerals, hydroxyapatite (HAP, Ca5(PO4)3OH, often written as Ca10(PO4)6(OH)2 because the crystal unit cell comprises two formula units) appears as highly promising. Indeed, HAP has solubility product Ksp = ~10−117 at 25 °C [3] and dissolution rate Rdiss = ~10-14 mol∙cm−2∙s−1 [2], both several orders of magnitude lower than those of calcite. If a continuous and dense coating of HAP is formed over the marble surface, significant protection against dissolution in rain can be expected [2]. Consequently, in recent years, several studies have investigated the feasibility and the effectiveness of forming a protective layer of HAP over marble [2,4,5,6,7,8]. HAP can be formed in a few hours in ambient conditions (necessary to treat monuments in the field), by reacting marble with an aqueous solution of a phosphate salt (typically diammonium hydrogen phosphate, DAP, (NH4)2HPO4) [8,9]. Although more effective than alternative commercial treatments [7], so-formed HAP coatings have nonetheless been found to provide marble with incomplete protection against acid attack, because some cracks and/or pores are present in the coatings [2,5,6,7]. With the aim of improving the coverage of the marble surface by HAP and reducing cracks and pores in the HAP layer, the effects of several parameters have been investigated, such as DAP concentration, addition of a calcium source, anionic additions, and organic additions [5,7,8]. By tuning such parameters, improved resistance to dissolution in simulated rain has been obtained, but marble dissolution is not completely inhibited yet [7]. The main limiting factor is that some calcite grains, likely having unfavorable crystallographic orientation for HAP epitaxial growth, remain bare after treatment, even though all the surrounding grains are completely covered with the new HAP coating [7]. Although not detrimental, a second factor that might reduce the protective efficacy of the coatings is that, alongside or even instead of HAP, other calcium phosphates (CaP) might form as the result of the DAP-based treatment [8,9,10,11]. For instance, octacalcium phosphate (OCP, Ca8(HPO4)2(PO4)4·5H2O) has been found to form when CaCl2 is added to the DAP solution as a calcium source [12] and when ethanol is added to the DAP solution to increase the reactivity of phosphate ions [7]. Because OCP has lower aqueous solubility than calcite (Ksp = ~10−97 [3]), its formation is not detrimental for the treatment success, but HAP formation would still be preferable, provided that the obtained coating is continuous and non-porous [7,10].
Therefore, in this study, electrodeposition (which is the transport of ions in a solution by application of an electric current and precipitation of material near the surface of an electrode) was explored, as a new route to promote formation of HAP (rather than other CaP) on the whole marble surface, independently of the crystallographic orientation of the underlying calcite grains. In fact, electrodeposition is currently largely used in the biomedical field to deposit HAP coatings over a wide variety of metallic substrates (typically, titanium and magnesium used as implants for bone regeneration) [13,14,15,16,17,18,19,20,21,22], with no dependence on the substrate crystallographic orientation. Moreover, the mineralogical composition of the electrodeposited coatings can be controlled, by suitably adjusting the process parameters [17,19].
Electrodeposition of HAP, and CaP in general, is based on the idea of coating a conductive material, such as a metal piece, by immersing it in an aqueous solution containing calcium and phosphate precursors, and then to favor CaP formation by applying an electric potential, using the metal piece as the cathode [13]. At the cathode, several electrochemical reactions can take place [18,19,22], which lead to formation of OH, HPO42− and PO43− ions:
O2 + 2H2O + 4e → 4OH
2H2O + 2e → H2 + 2OH
H2PO4 + e → HPO42− + ½H2
H2PO4 + 2e → PO43− + H2
2HPO42− + 2e → 2PO43− + H2
Thanks to OH formation and the consequent pH increase, deprotonation of phosphate species near the surface of the cathode is promoted, according to the reactions [13,17,18]:
H2PO4 + OH → HPO42 + H2O
HPO4 + OH → PO43 + H2O
In this environment, precipitation of several CaP phases with low solubility can occur, through the following reactions [13,17,18]:
Ca2+ + HPO42− + 2H2O → CaHPO4·2H2O (brushite)
5CaHPO4·2H2O + 6OH → Ca5(PO4)3OH + 2PO43− + 15 H2O (hydroxyapatite)
4Ca2+ + HPO42− + 2PO43− + 2.5H2O → Ca4(HPO4)(PO4)2·2.5H2O (octacalcium phosphate)
5Ca2+ + 3PO43− + OH → Ca5(PO4)3(OH) (hydroxyapatite)
Since the first research on CaP electrodeposition in 1990 [13], numerous studies have been carried out to investigate the effect of several parameters involved in the electrodeposition process on the features of the resulting coatings:
  • Nature and concentration of the calcium and phosphate salts used as CaP precursors. Typically, Ca(NO3)2 and (NH4)H2PO4 (ADP) are used, with a molar ratio of 10/6 to reproduce the Ca/P atomic ratio in stoichiometric hydroxyapatite [15,18,19,20,21,22,23,24,25,26,27,28,29,30,31];
  • Electrokinetic parameters, namely the electric potential (E) and the current density (i). Typically, these parameters vary in the range E = −1.4 ÷ (−3) V and i = 0.5 ÷ 25 mA/cm2 [13,14,16,18,19,20,21,22,23,24,25,29,30,32];
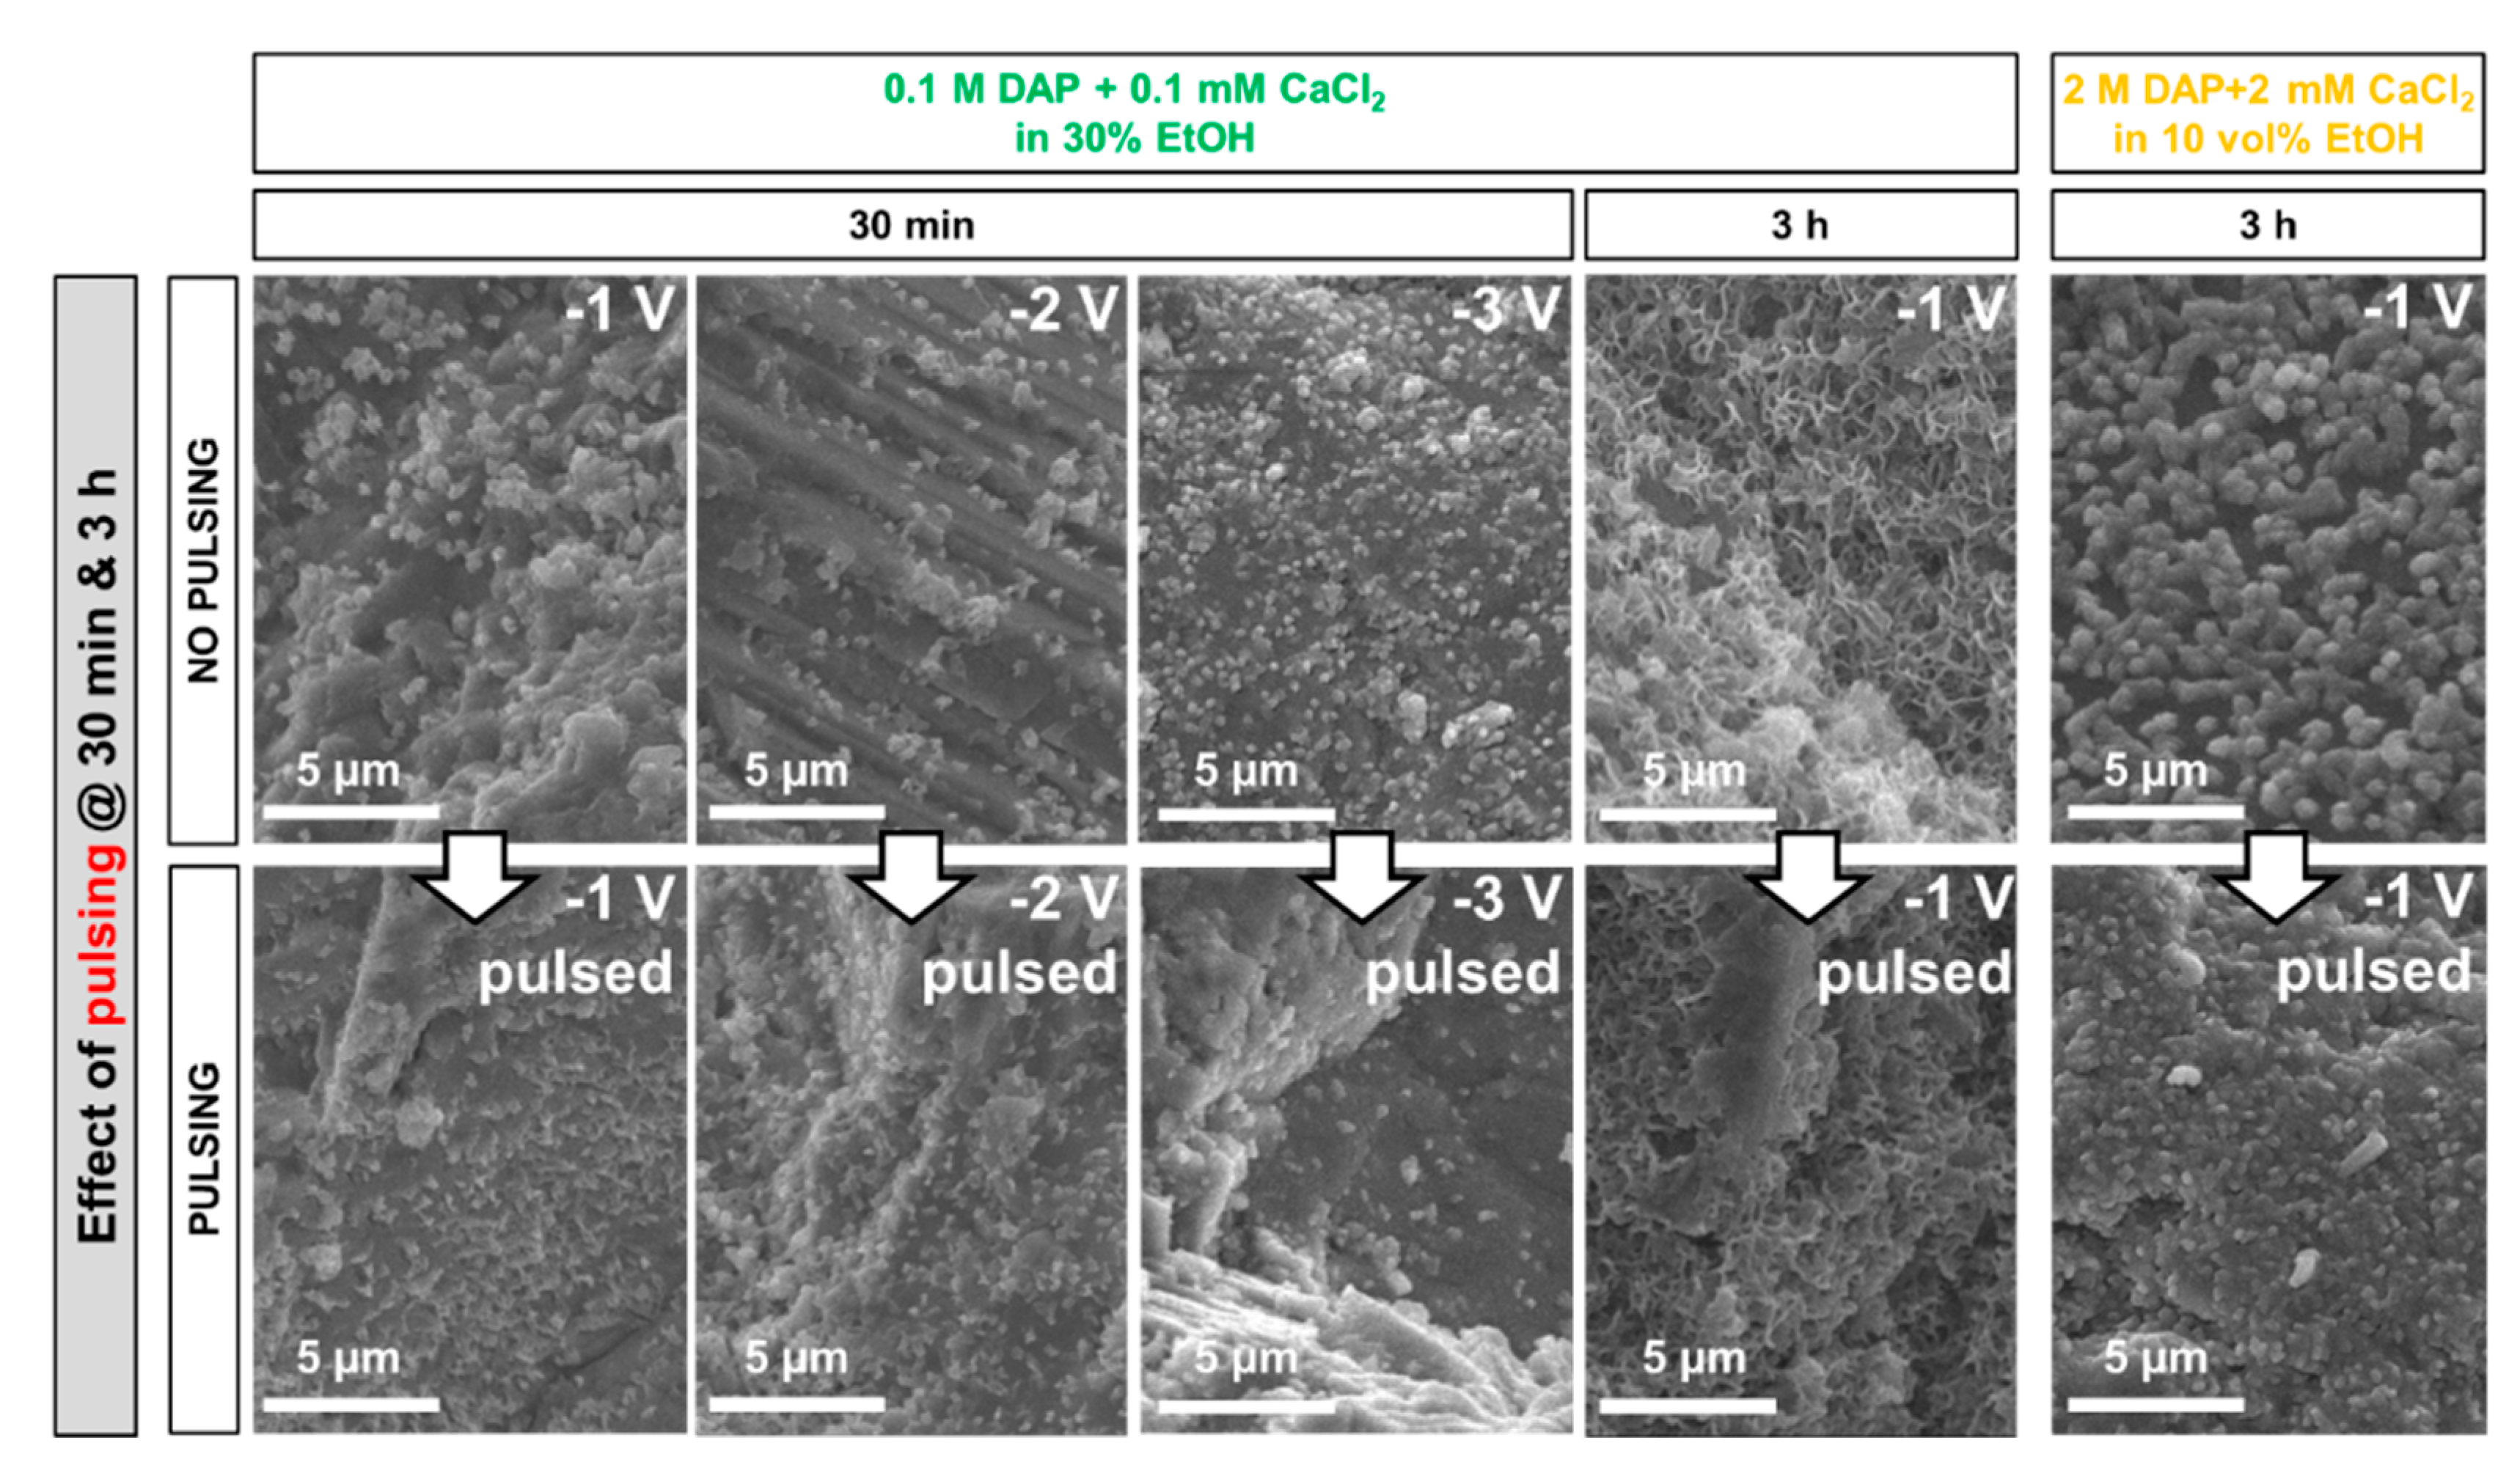
  • Possible application of pulsed electric potential. For CaP coating densification, some studies have proposed using pulsed potential, i.e., applying the electric potential by cyclically alternating on/off periods [24,27,29]. According to these studies, during the on-period, OH ions are produced at the cathode; during the off-period, Ca2+ and PO43− ions have the time to diffuse from the bulk solution towards the cathode, where OH groups are present so that Reactions (9)–(11) take place [29]. Moreover, pulsed potential reportedly reduces formation of H2 bubbles (cf. Reactions (3–5)), which might otherwise adhere to the substrate and prevent formation of a dense and well adhering coating [24,27].
  • Possible addition of ethanol (EtOH) to the electrolyte solution. To reduce the formation of H2 bubbles, the possible addition of ethanol to the aqueous solution has been proposed [23,28]. In fact, ethanol addition reduces the conductivity of the solution, thus reducing H2 bubble formation and promoting coating densification [23,28]. The best results were reported for ethanol additions of about 30–50 vol.% [23,28].
  • Possible addition of hydrogen peroxide (H2O2) to the electrolyte solution. H2O2 is a strong oxidative agent that is reduced before H2O, hence H2O2 addition (about 5–10 vol.% [31]) to the electrolyte can provide an alternative source of OH ions, according to Reaction (12) [31]:
    H2O2 + 2e → 2OH
In this way, OH ions necessary for HAP formation are obtained with no generation of H2 bubbles and with consequent improved adhesion of the coating to the substrate [22,32].
Based on the studies summarized above, intended for biomedical applications, in the present study the possible use of electrodeposition to form HAP coatings over marble was investigated. At present, only a few studies have explored the possible use of electrochemical methods for conservation of non-metallic materials, such as marble, stones, and bricks.
In a first group of studies, electrochemical methods were used to extract ions from porous materials contaminated by salts [33,34,35]. The idea is to put the porous material to be desalinated between two poultices, impregnated with water and in contact with two electrodes connected to a power supply (Figure 1a). Then, current is applied and the anions in the material migrate towards the anode and the cations towards the cathode [33]. Because H+ ions are generated at the anode, which might lead to deterioration of the substrate, clay poultices with pH buffer capacity have been investigated to prevent acidification at the anode [35]. By adopting this electrokinetic method, encouraging desalinating ability has been obtained [33,34,35].
In a second group of studies, electrochemical methods were used to introduce ions into porous materials, with the aim of precipitating an insoluble product inside the pore network and providing consolidating action [36,37,38]. To make the ions penetrate into the porous material, the adopted experimental setup was basically reversed compared to that described above for ion extraction (Figure 1b). The material to be consolidated is in contact with two different solutions, which in turn are in contact with the electrodes connected to a power supply—the solution containing the anions (e.g., HPO42− [36] or CO32− [37,38]) is in contact with the cathode, while the solution containing the cations (e.g., Ba2+ [36] or Mg+ [37,38]) is in contact with the anode. When current is applied, ions migrate towards the electrode with the opposite sign, thus crossing the sample. When anions and cations encounter inside the material, an insoluble salt precipitates inside the pores (e.g., Ba3(PO4)2 [36] or MgCO3·3H2O [37,38]). Similar to the case of salt extraction, also in this case acidification at the anode occurs, which again led to the use of clay poultices with pH buffer capacity [37].
Moreover, an electrokinetic route has been proposed to deposit a layer of calcium oxalate monohydrate (whewellite) over the marble surface, with protective function [39]. This represents a development of the ammonium oxalate treatment proposed by Matteini in the 1990s [40], which consists of treating carbonate stones (supplying Ca2+ ions) with an ammonium oxalate solution (supplying C2O42− ions), so that protective whewellite (CaC2O4·H2O) is formed. In the cited electrokinetic study [39], whewellite formation was reportedly favored by placing the marble piece close to the anode of an electrochemical cell, connected to a power supply, immersed in an ammonium oxalate solution. Because the C2O42− ions are attracted to the anode, a region richer in C2O42− ions is formed near the anode and near the adjacent marble sample, which leads to formation of a thicker whewellite coating over the marble surface compared to simple immersion in an ammonium oxalate solution with no current applied [39].
Based on the studies summarized above, in this study, HAP electrodeposition over marble was explored by first comparing the effect of placing the marble sample close to the cathode (to exploit OH formation at the cathode, like in the biomedical studies [27]) or close to the anode (to exploit PO43− migration towards the anode, like in the studies on stone consolidation [36,37,38] and protection [39]). Second, the experimental setup was optimized, by investigating whether direct contact between the electrode and the marble sample is preferable and whether potentiostatic (constant potential) or galvanostatic (constant current) conditions are preferable [27]. Then, the influence of several parameters was investigated, regarding both the electrolyte (concentration of the calcium and phosphate precursors, possible addition of ethanol and/or hydrogen peroxide) and the electrokinetic parameters (pulsing, voltage, and time). Finally, the protective ability of the most promising formulations was evaluated, comparing the acid resistance of untreated and treated marble. To isolate the effect of electrodeposition, a systematic comparison with coatings deposited by simple wet chemistry (with no current application) was carried out. A scheme summarizing the rationale of the study is illustrated in Figure 2.

2. Materials and Methods

2.1. Materials

Carrara marble was used for the tests. Specimens with 20 × 20 × 5 mm3 size were sawn from a slab supplied by Imbellone Michelangelo S.A.S. (Bologna, Italy). The specimens were subjected to the electrodeposition tests described in the following without preliminary polishing, because a very flat surface would not be representative of marble condition in the field (where prolonged exposure to rain leads to roughening of the surface).
Diammonium hydrogen phosphate (DAP, (NH4)2HPO4, assay >99%, Acros Organics, Milan, Italy), calcium chloride (CaCl2·2H2O, assay >99%, Sigma Aldrich, Milan, Italy), ethanol (EtOH, Sigma Aldrich), hydrogen peroxide solution (30 wt% H2O2 in D.I. water, Sigma Aldrich), and deionized water were used. Cellulose pulp (MH300, Phase, Florence, Italy) was used to prepare poultices for consolidant application.

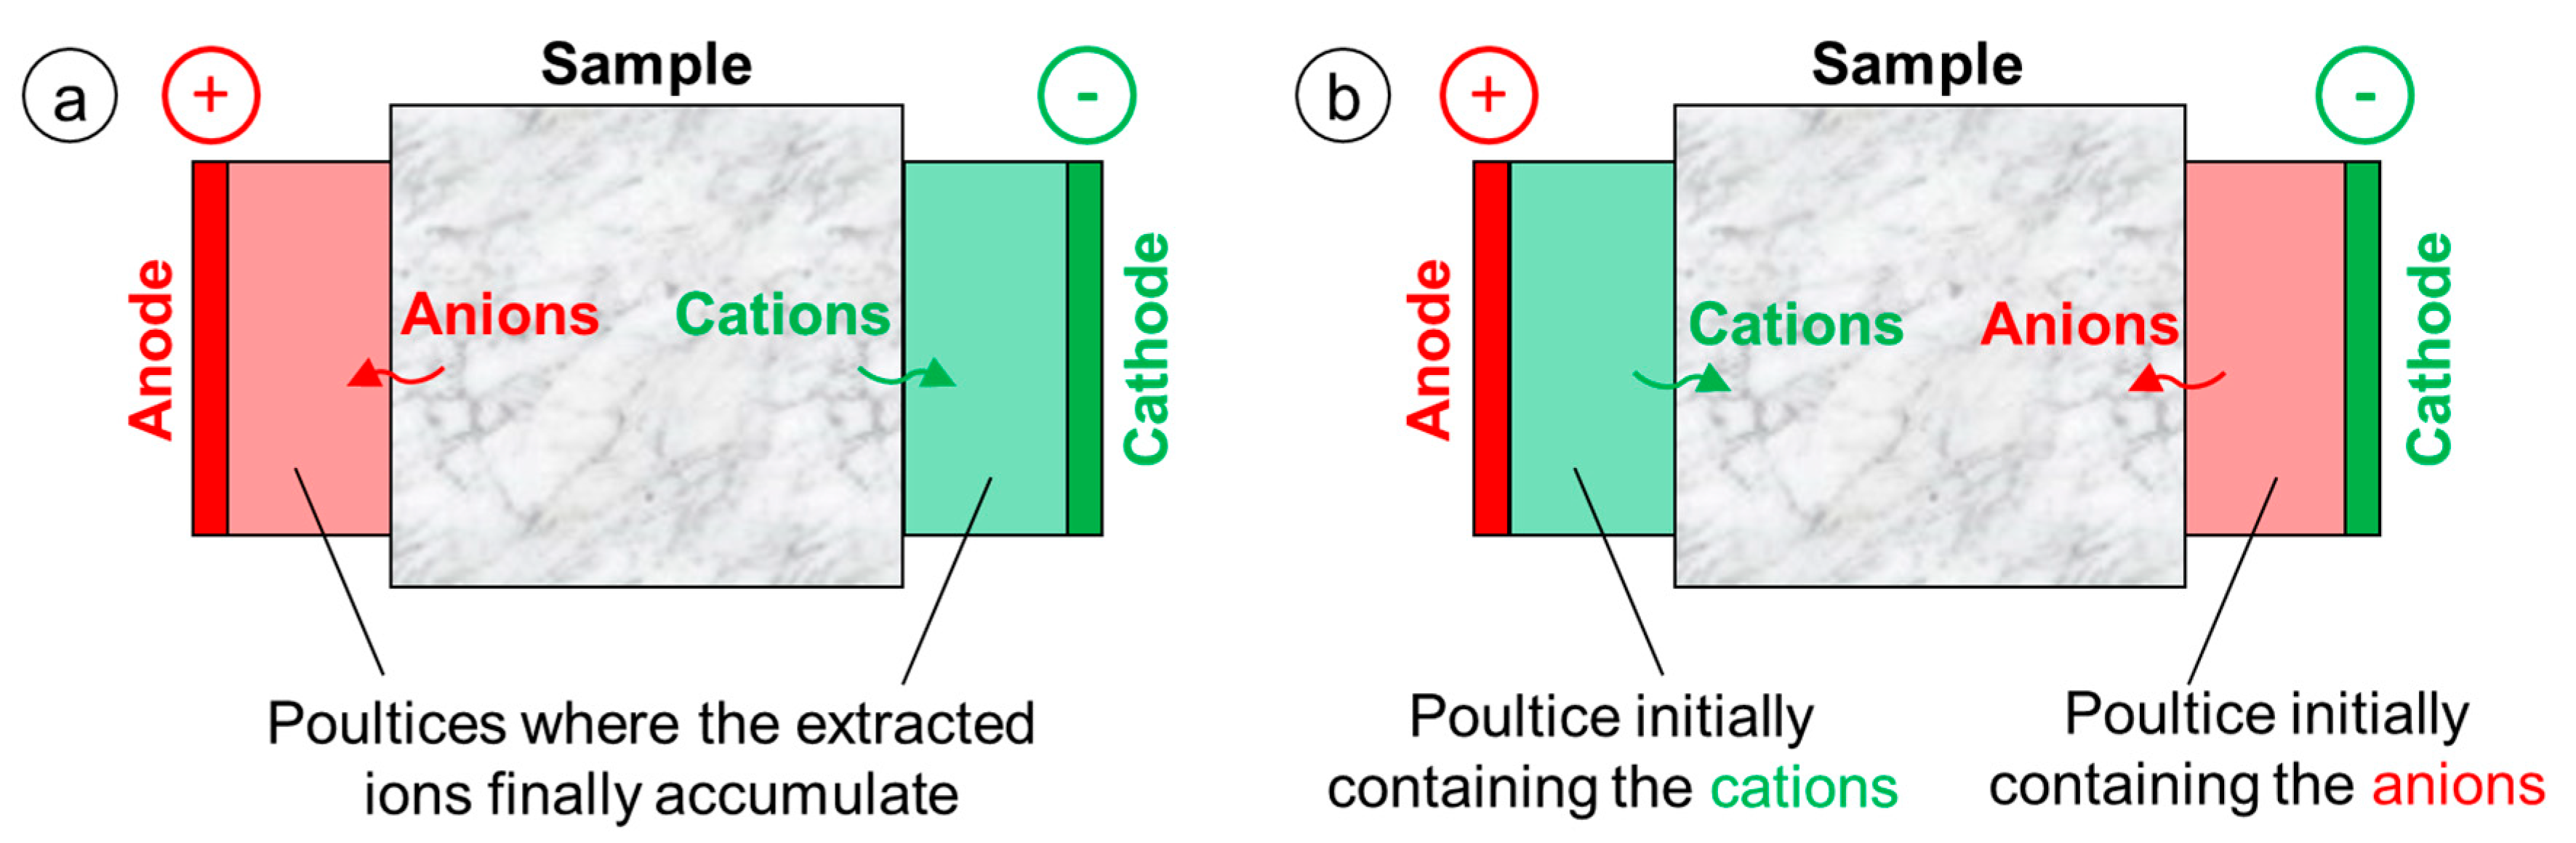
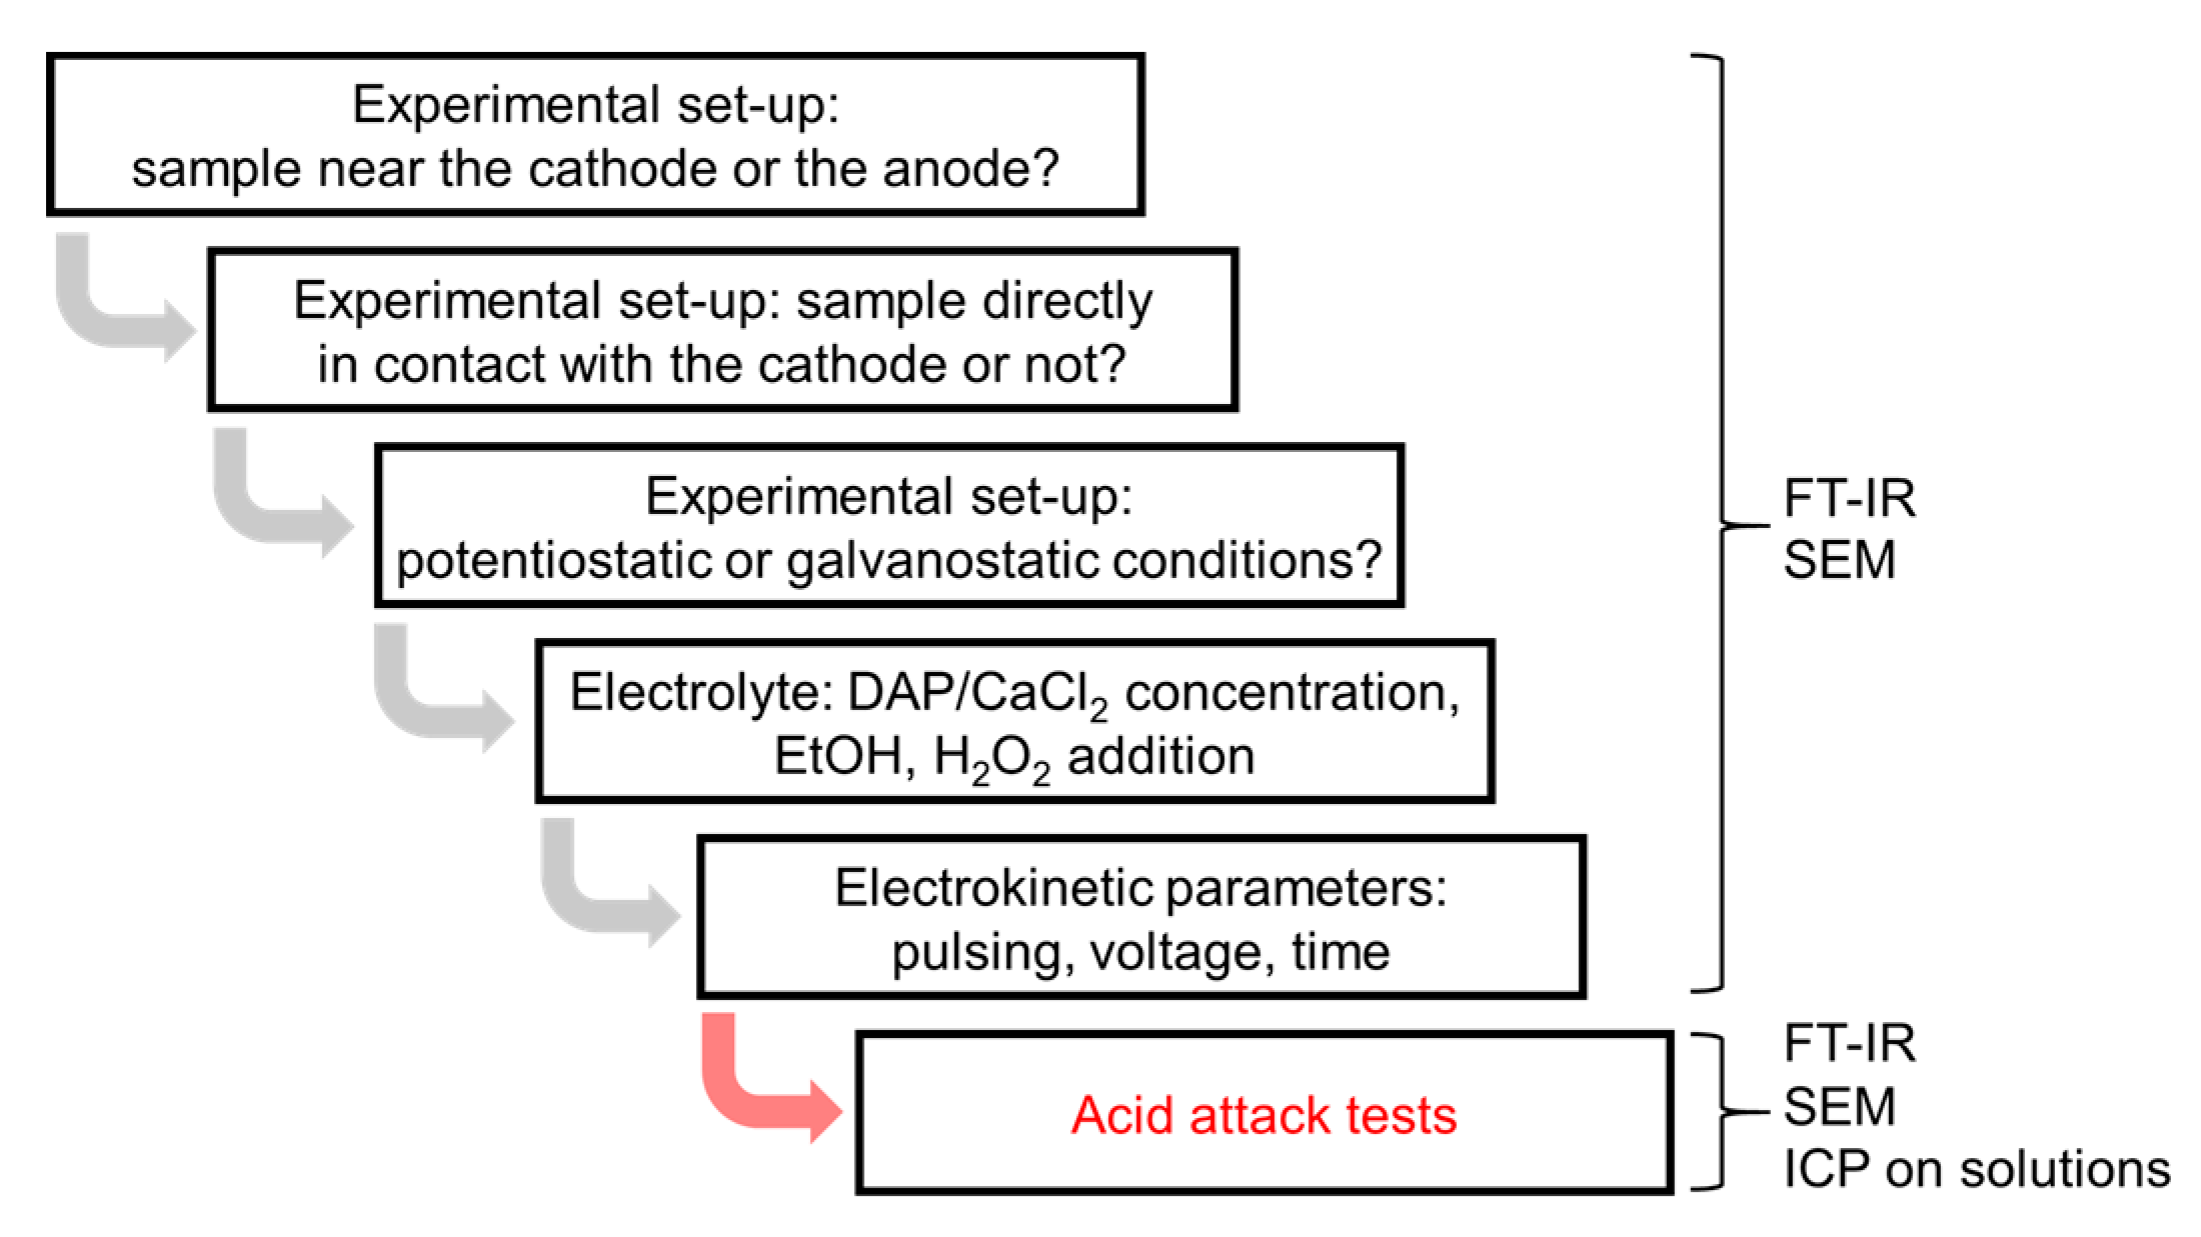
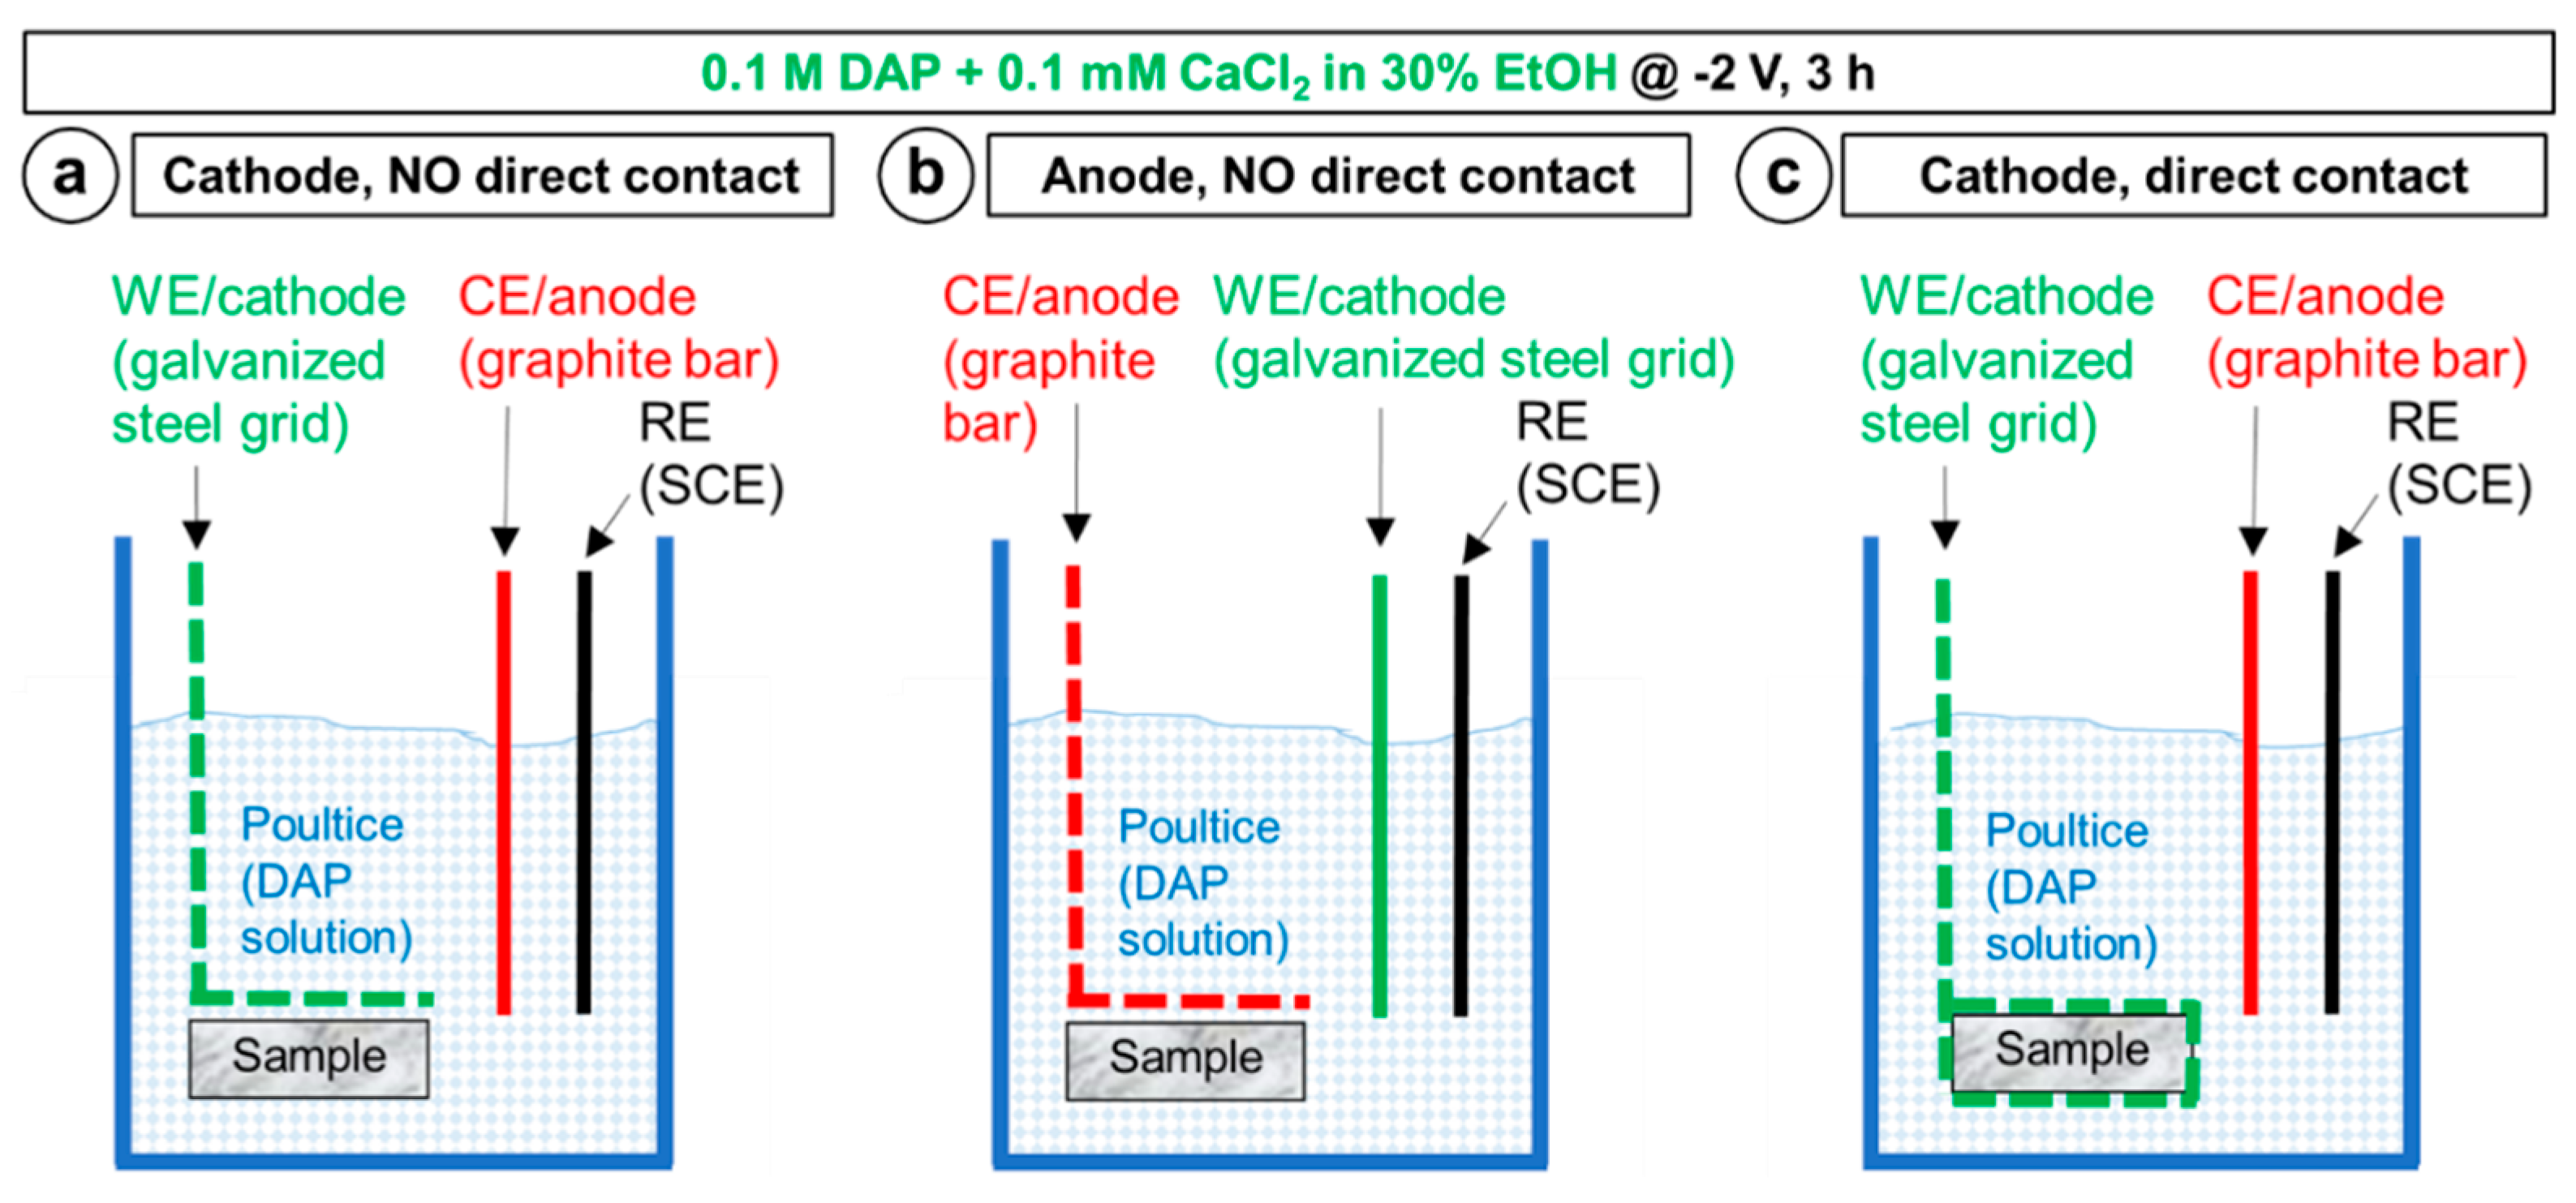
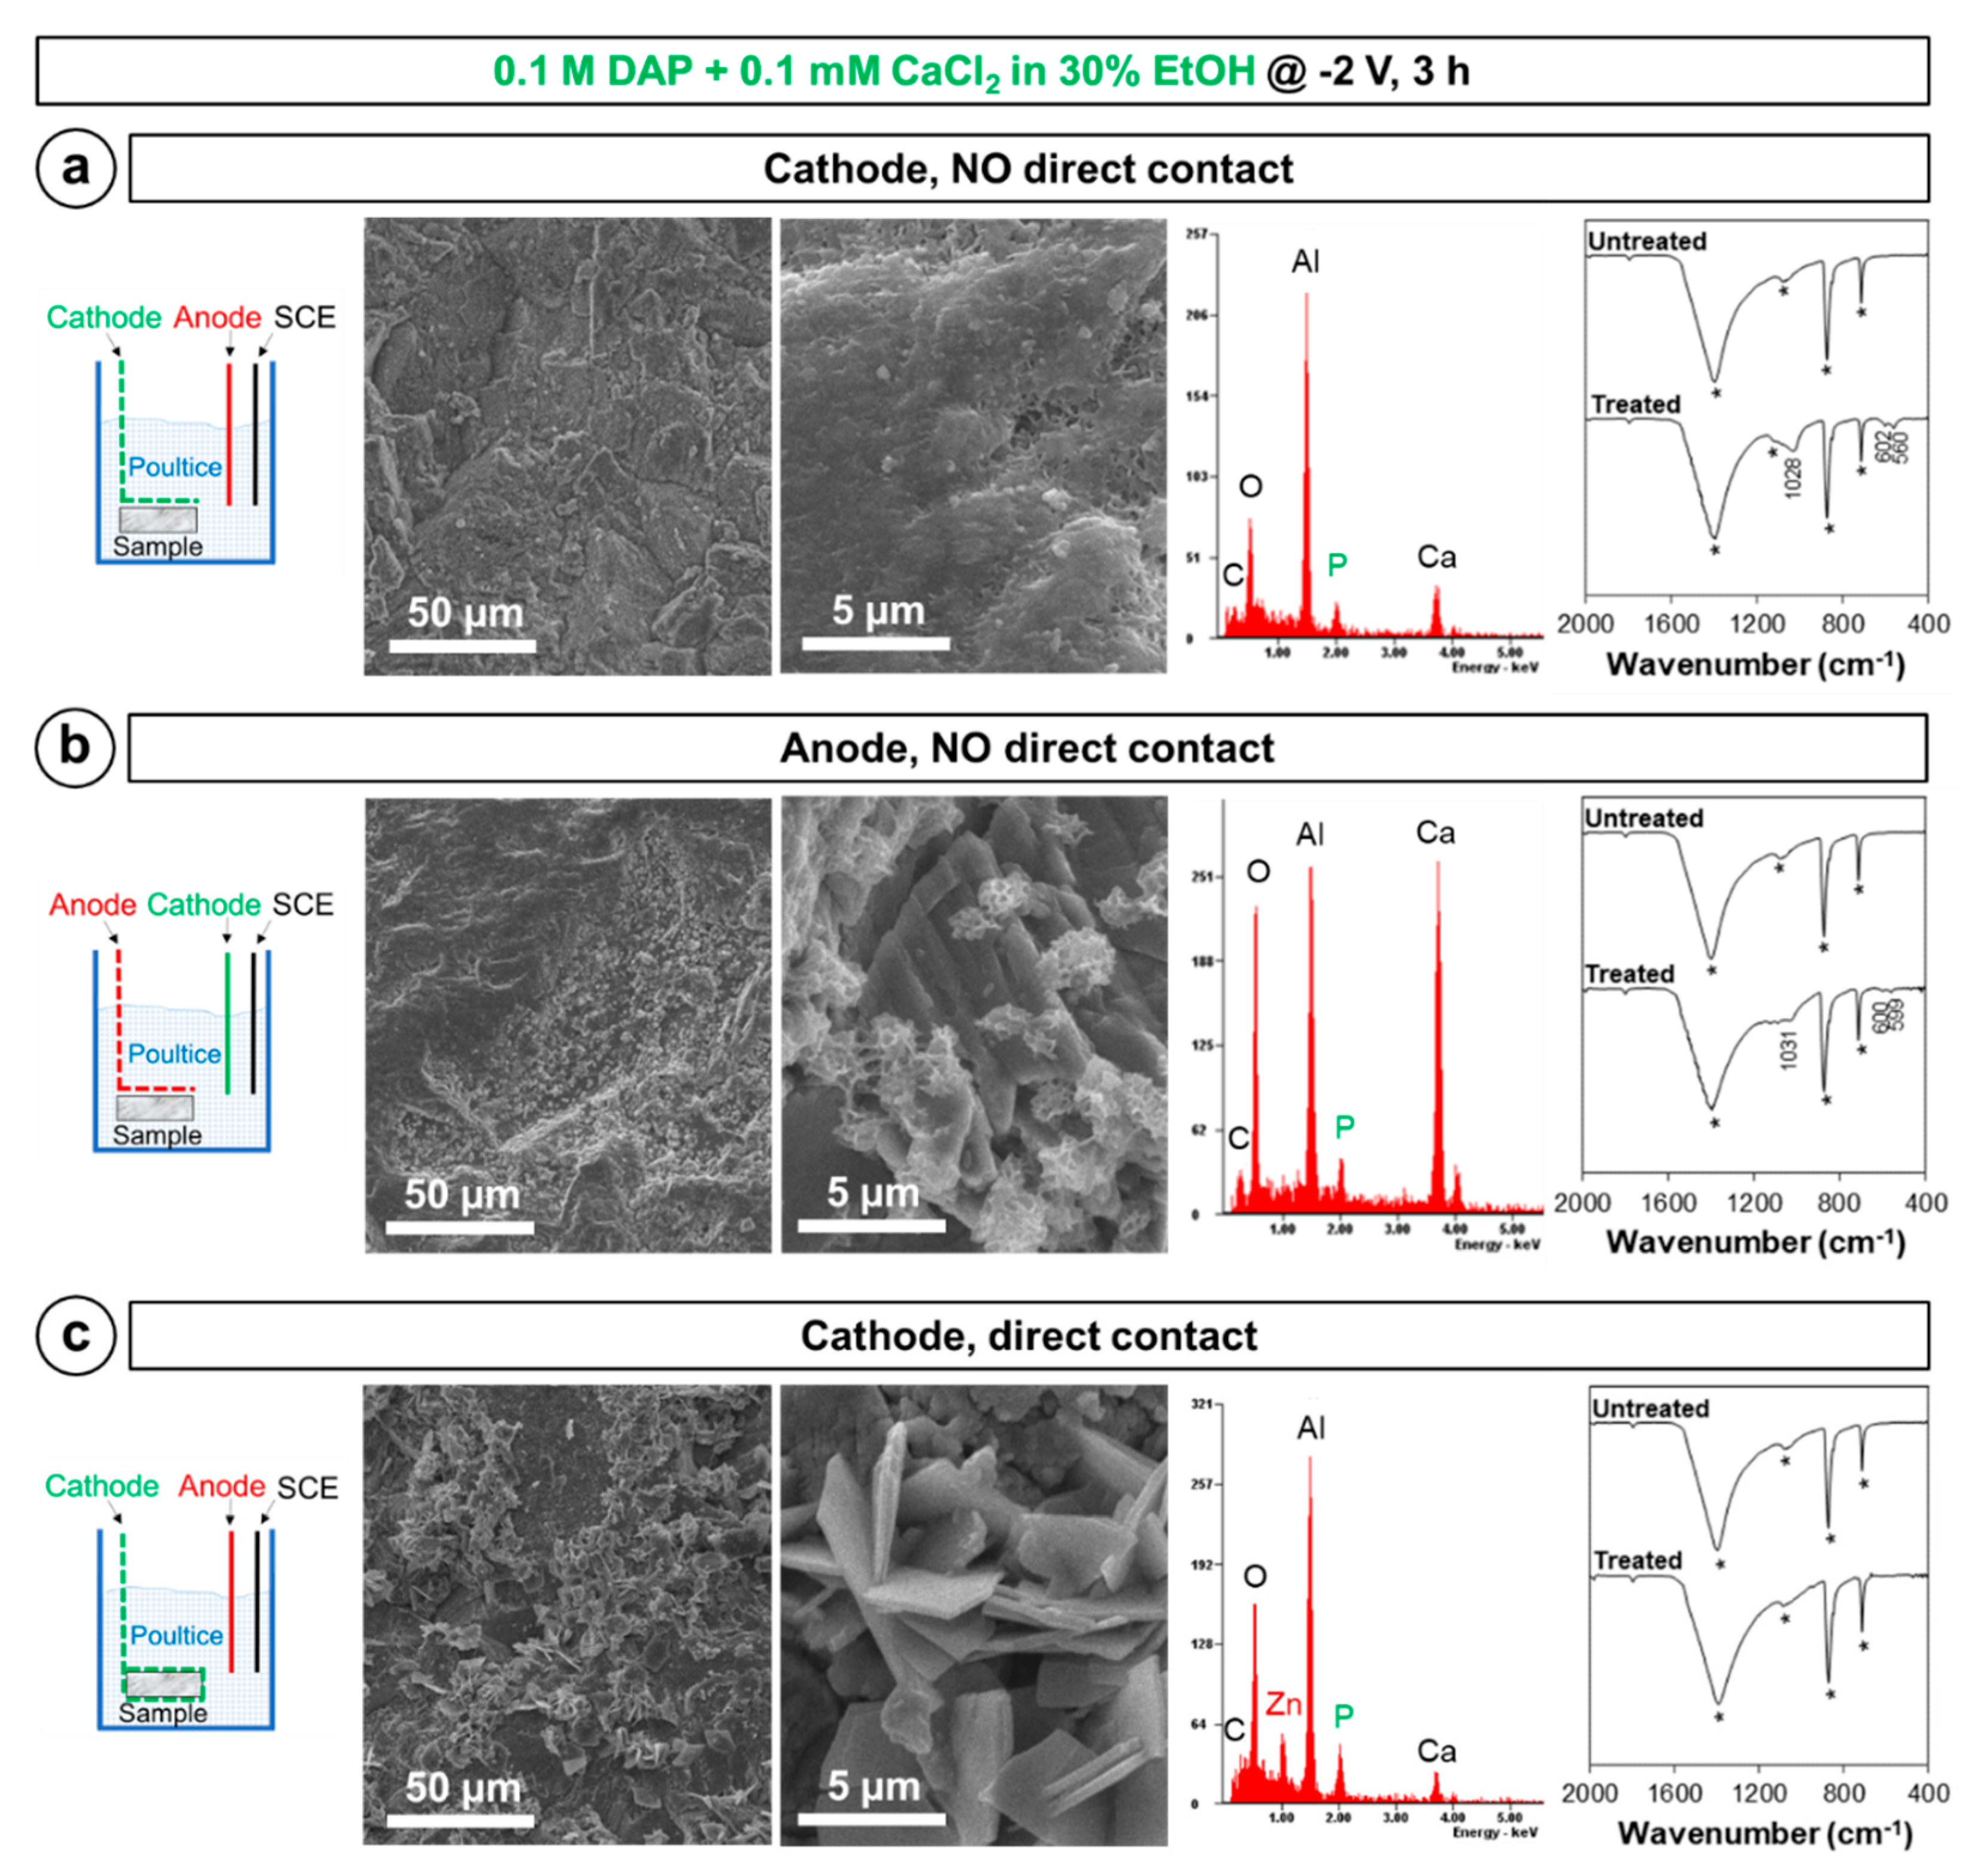
2.2. Influence of the Experimental Setup

For the screening tests aimed at identifying the most suitable setup, one of the most recent formulations of the HAP-treatment was considered, namely a solution of 0.1 M DAP + 0.1 mM CaCl2 in 30 vol.% EtOH [7]. Even with no electrodeposition involved, in a previous study this formulation was found to cause basically continuous coverage of the marble surface by CaP after 24 h, although precipitation of some isolated CaP crystals was noticed already in the bulk solution [7]. For the present tests on electrodeposition, the solution was used to prepare a poultice with cellulose pulp, in which the marble samples and the electrodes were embedded. For each test, the poultice was prepared using 100 g of solution and 25 g of dry cellulose fibers.
All the electrodeposition tests were performed using a 3-electrode setup—the working electrode (WE) was a galvanized steel grid, the counter electrode (CE) was a graphite bar, and the reference electrode (RE) was a saturated calomel electrode (SCE) by Amel Electrochemistry (Milan, Italy). Except for the test aimed at comparing potentiostatic and galvanostatic conditions (see below), all the tests were carried out in potentiostatic conditions (i.e., a certain potential was applied and kept constant, while the resulting current was measured [27]), using a potenziostat (7050 Amel Electrochemistry).
First, it was investigated whether the marble sample should be placed close to the cathode (like in the biomedical studies [27]) or the anode (like in the study on ammonium oxalate electrodeposition [39]). The two setups illustrated in Figure 3a,b were adopted, where the only difference was the role of the galvanized steel grid, working either as cathode or anode, respectively. When the marble sample was placed near the cathode (Figure 3a), the expected cathodic reactions were the electrochemical Reactions (1)–(11), while the anodic reaction was expected to be the oxidation of the graphite bar used as counter electrode, according to the reaction:
C + 2H2O → CO2 + 4H+ + 4e.
When the marble sample was placed near the anode (Figure 3b), the expected anodic reaction (necessary to attract the negative PO43− ions) was the oxidation of the zinc coating present over the galvanized steel grid, according to the reaction:
Zn → Zn2+ + 2e
while the cathodic Reactions (1)–(11) were expected at the cathode (the graphite bar). In both cases, the marble sample was kept at a distance of ~3 mm from the grid, the two being separated by a thin layer of poultice. Electrodeposition was carried out applying a constant potential of −2 V or +2 V (depending on whether the grid was working as cathode or anode, respectively) for 3 h.
Second, it was investigated whether direct contact between the marble sample and the steel grid used as cathode might favor the coating formation, expecting the local effect of electrodeposition to be the higher the closer to the electrode. The setup in Figure 3a was compared with the alternative setup illustrated in Figure 3c. The difference consisted in that, in the latter case, the marble sample was directly in contact with the steel grid, wrapped around the sample. In both cases in Figure 3a,c, the steel grid was working as the cathode (E = −2 V for 3 h). In the setup in Figure 3c, the same cathodic Reactions (1)–(11) and anodic reaction (13) as in Figure 3a were expected.
Finally, it was investigated whether potentiostatic or galvanostatic conditions are preferable, considering that studies in the biomedical literature have shown that controlling potential or current may lead to significantly different results [30]. For a given setup (Figure 3a) and treatment duration (3 h), the effects of applying a constant potential of −2 or −3 V (potentiostatic conditions) were compared to the effects of applying a constant current of −5 or −20 mA (galvanostatic conditions). In all cases, the variable parameter (current in potentiostatic conditions, potential in galvanostatic conditions) was recorded over time. The adopted current values (−5 and −20 mA) were selected as they correspond to the values recorded in the potentiostatic experiments (at E = −2 and −3 V, respectively, cf. Section 3.1.).
Based on the obtained experimental results (cf. Section 3.1.), the setup illustrated in Figure 3a was adopted for all the tests described in the following, as this setup gave the most promising results.

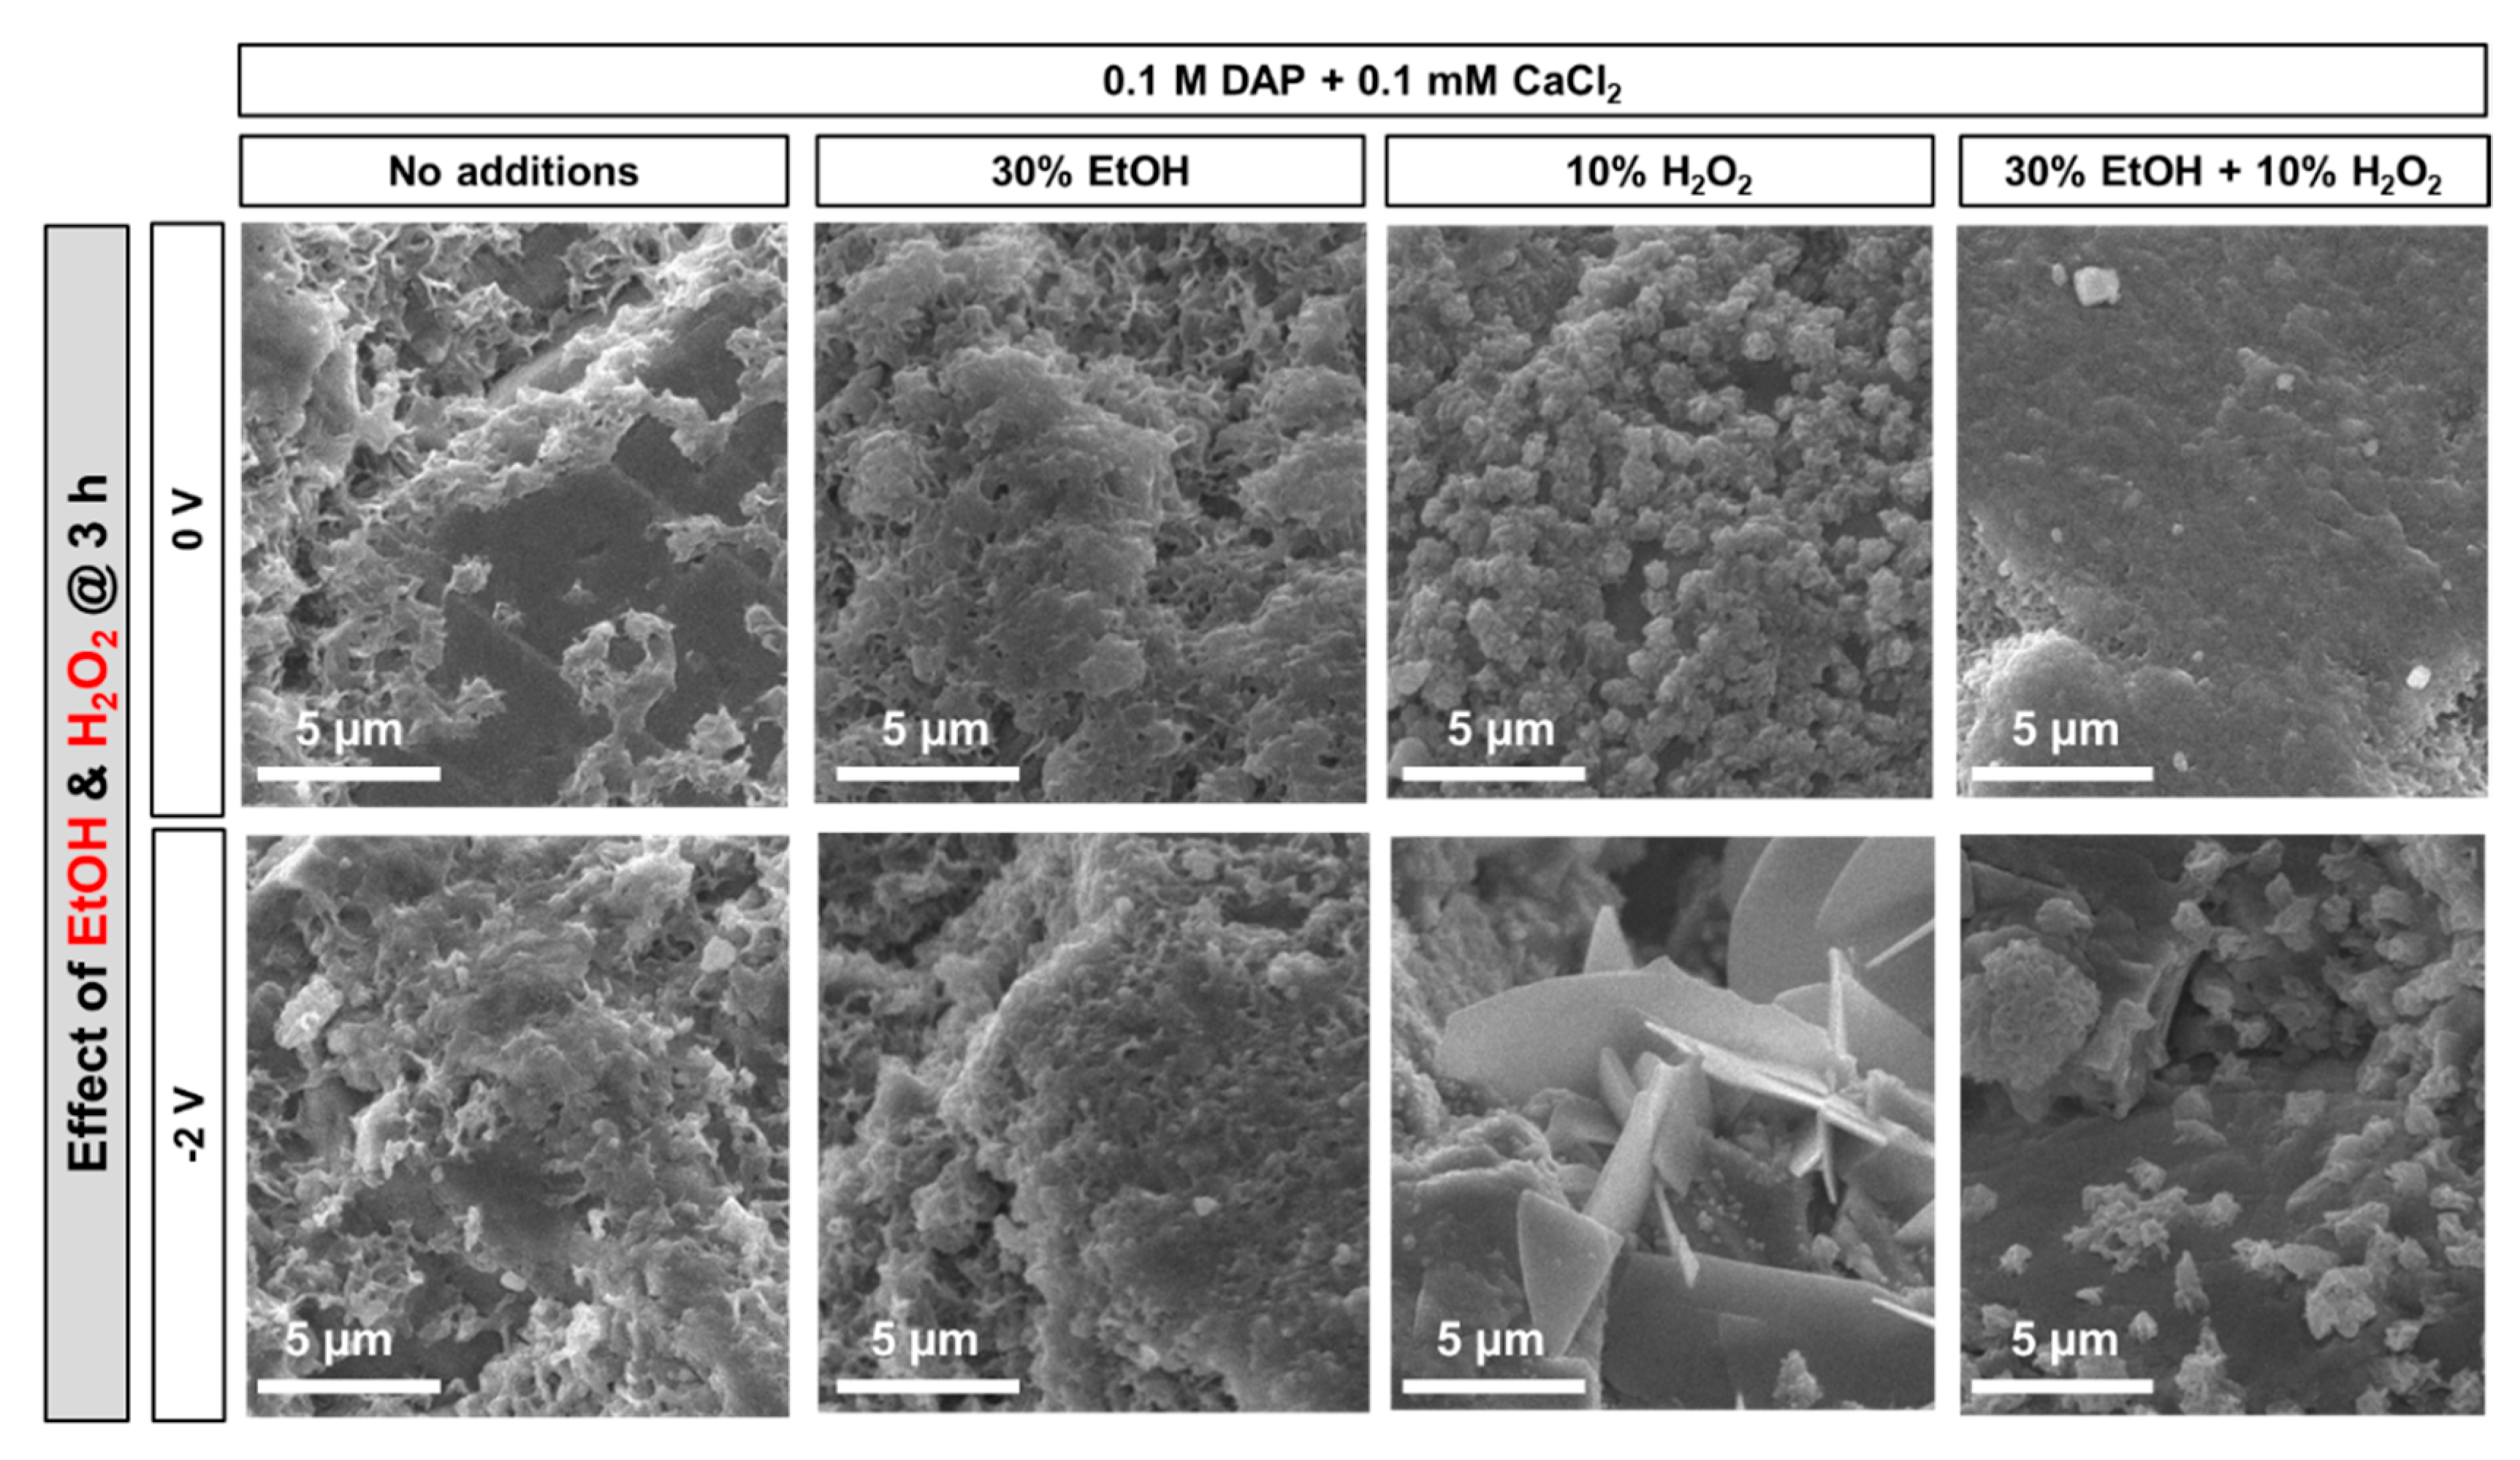
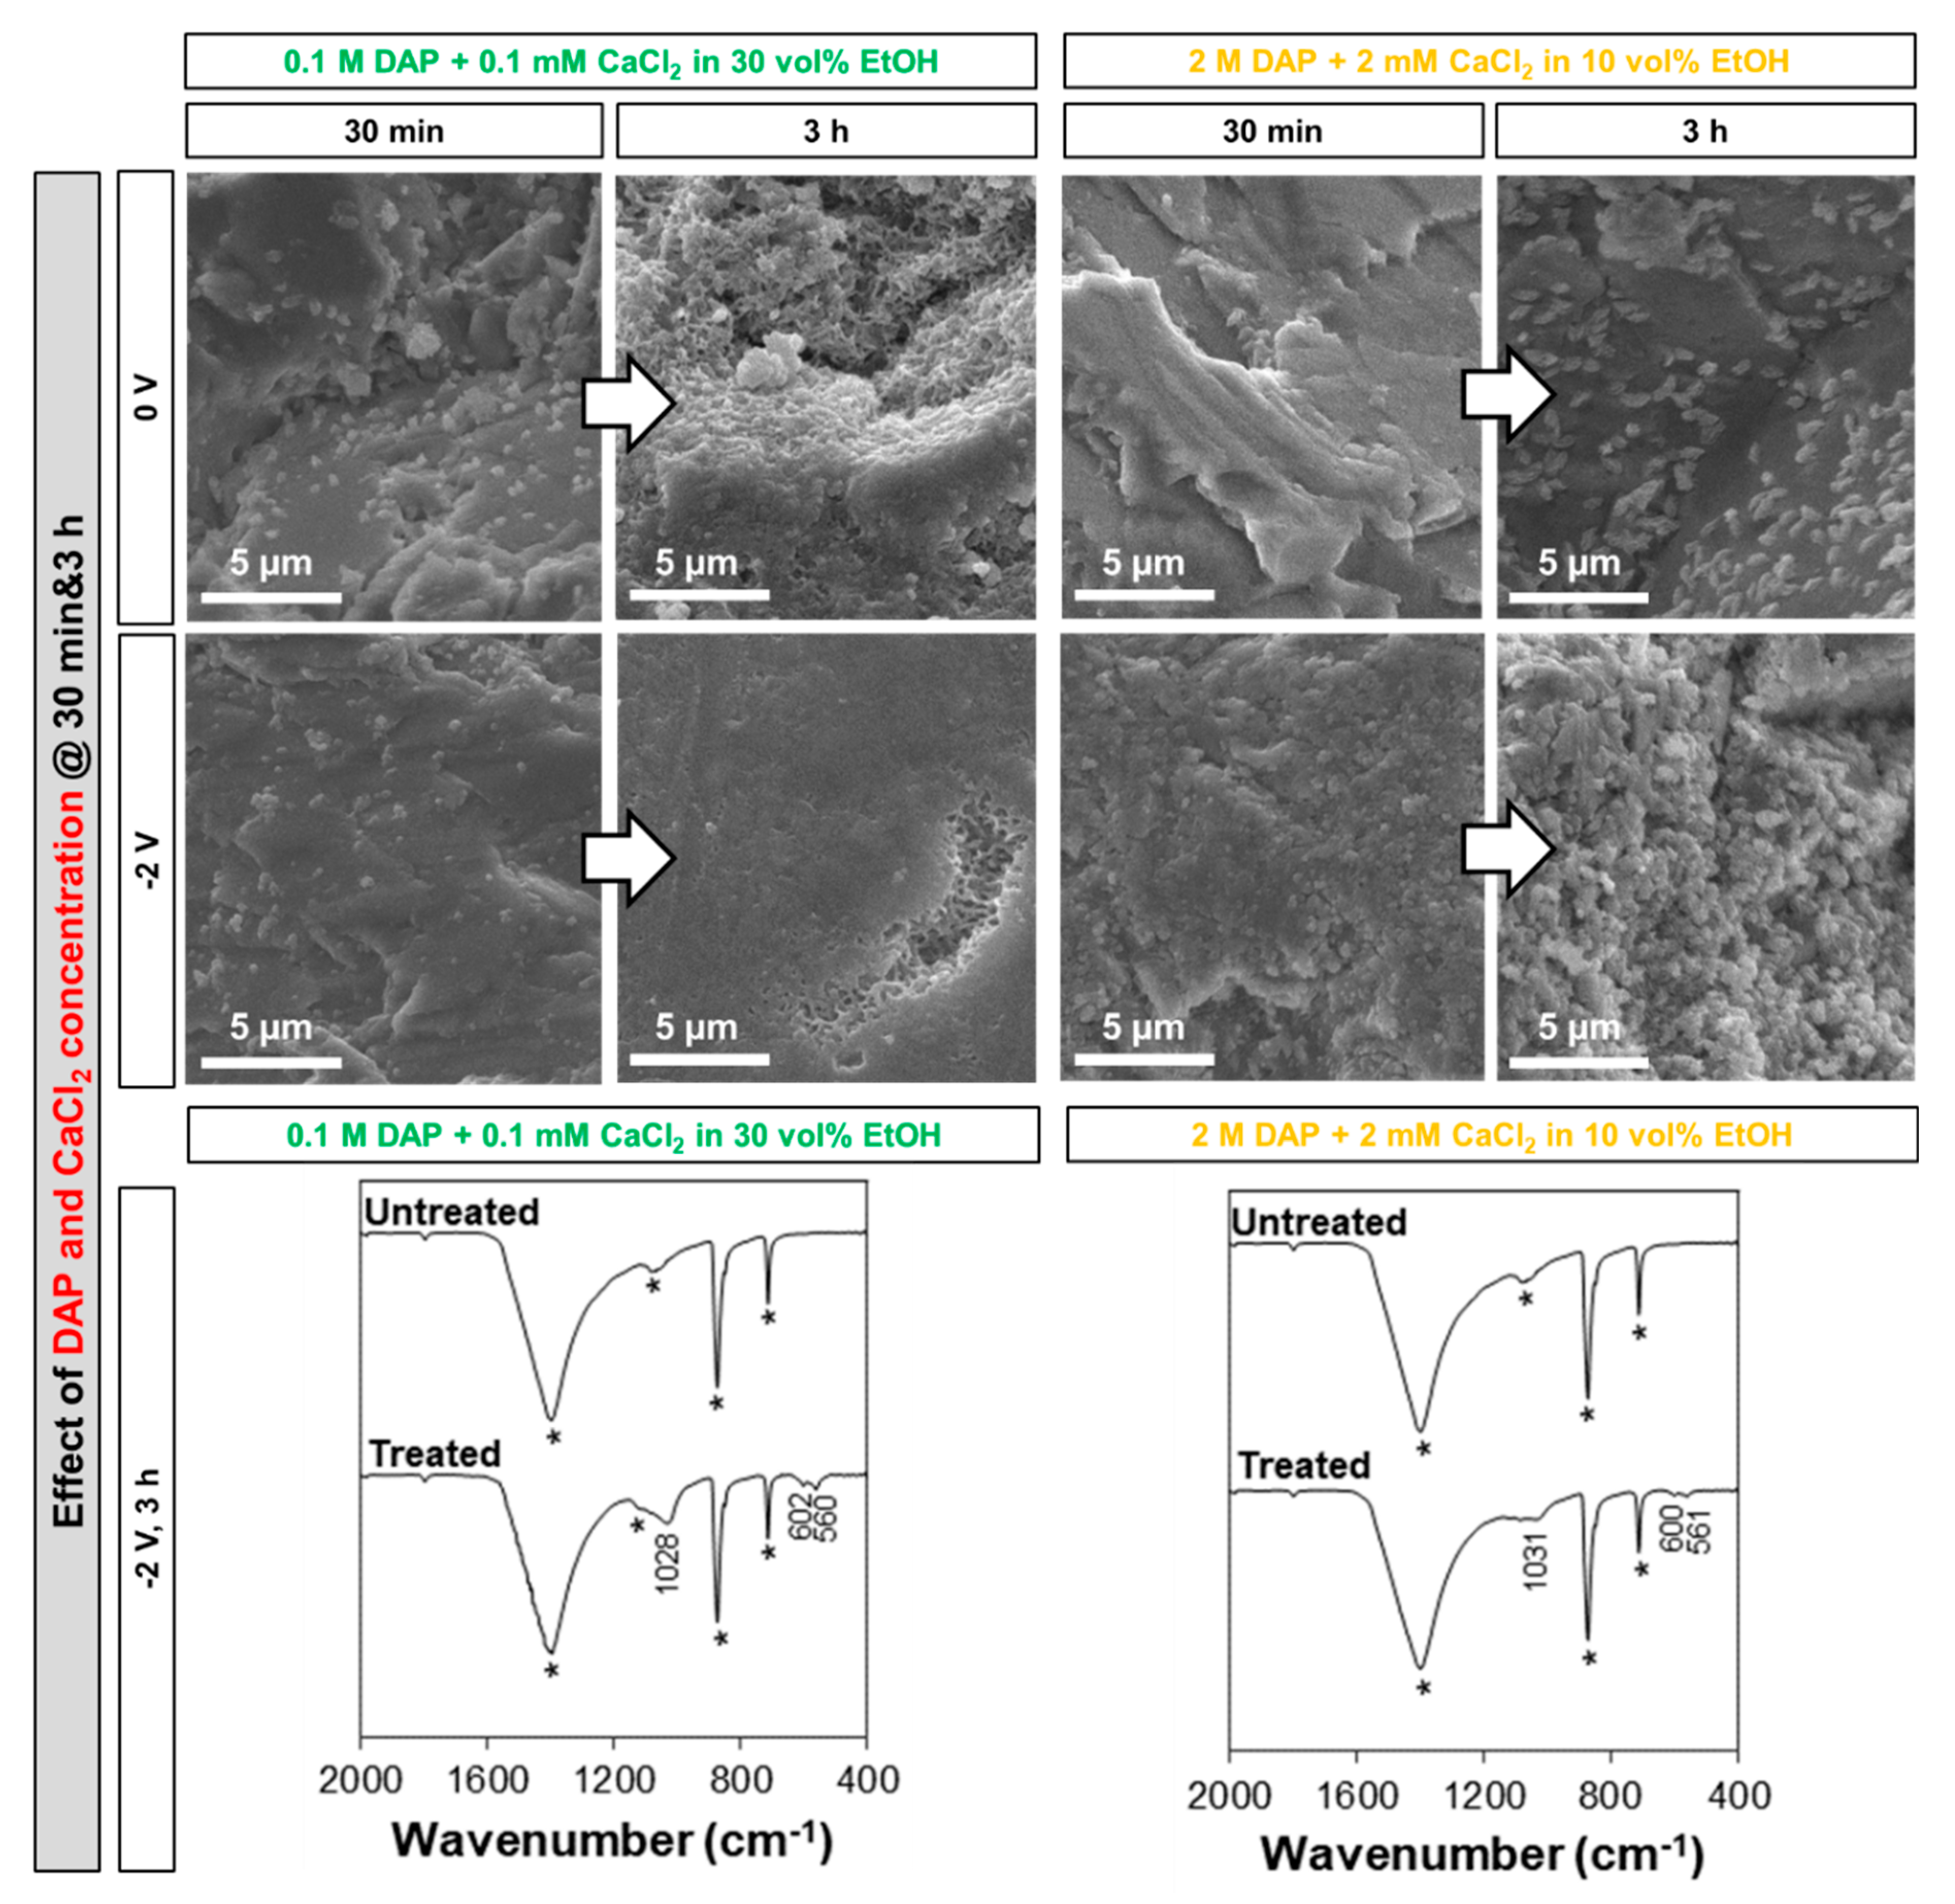
2.3. Influence of the Electrolyte: DAP and CaCl2 Concentration, Ethanol and/or H2O2 Addition

The effects of EtOH and/or H2O2 were investigated by comparing the coatings formed using a 0.1 M DAP + 0.1 mM CaCl2 solution (with no additions) and the coatings obtained when the same solution was added with:
  • 30 vol.% EtOH. As mentioned above, this is the maximum concentration not leading to immediate precipitation in the bulk solution at the given DAP and CaCl2 concentrations (only a few isolated crystals were formed in the bulk solution). Even when no current is applied, EtOH promotes HAP nucleation [5,7], so some benefit compared to the reference 0.1 M DAP + 0.1 mM CaCl2 solution is already expected. Moreover, when electrodeposition is adopted, EtOH reportedly reduces H2 bubbling and promotes coating densification [23,28], so an additional benefit is expected.
  • 10 vol.% H2O2. When electrodeposition is adopted, H2O2 is reduced before water, so it can provide the OH ions necessary for HAP formation without generation of H2 bubbles [22,31,32], with a consequent benefit in the coating density and adhesion.
  • 30 vol.% EtOH + 10 vol.% H2O2. To combine the two effects described above, the double addition was also investigated.
To distinguish between the effect of simply adding EtOH and H2O2 to the DAP/CaCl2 solution (even with no electrodeposition) and the additional benefit resulting from electrodeposition, all the additions were tested without (E = 0 V) and with electrodeposition (E = −2 V), using the setup illustrated in Figure 3a.
Moreover, the effect of using a higher DAP concentration was also considered. In fact, the higher the DAP concentration, the higher the amount of PO43− ions available to form HAP, but also the higher the risk of cracking during drying [7]. A solution of 2 M DAP + 2 mM CaCl2 in 10 vol.% EtOH was tested. The EtOH concentration was selected as this is the maximum amount not leading to immediate precipitation in the bulk solution at the given DAP and CaCl2 concentrations. In this case, no H2O2 addition was adopted based on the results of the tests described above (cf. Section 3.2). The comparison between the less-concentrated formulation (0.1 M DAP + 0.1 mM CaCl2 in 30 vol.% EtOH) and the more-concentrated one (2 M DAP + 2 mM CaCl2 in 10 vol.% EtOH) was carried out by treating marble samples for 30 min and 3 h, without (E = 0 V) and with electrodeposition (E = −2 V), always using the set up illustrated in Figure 3a.

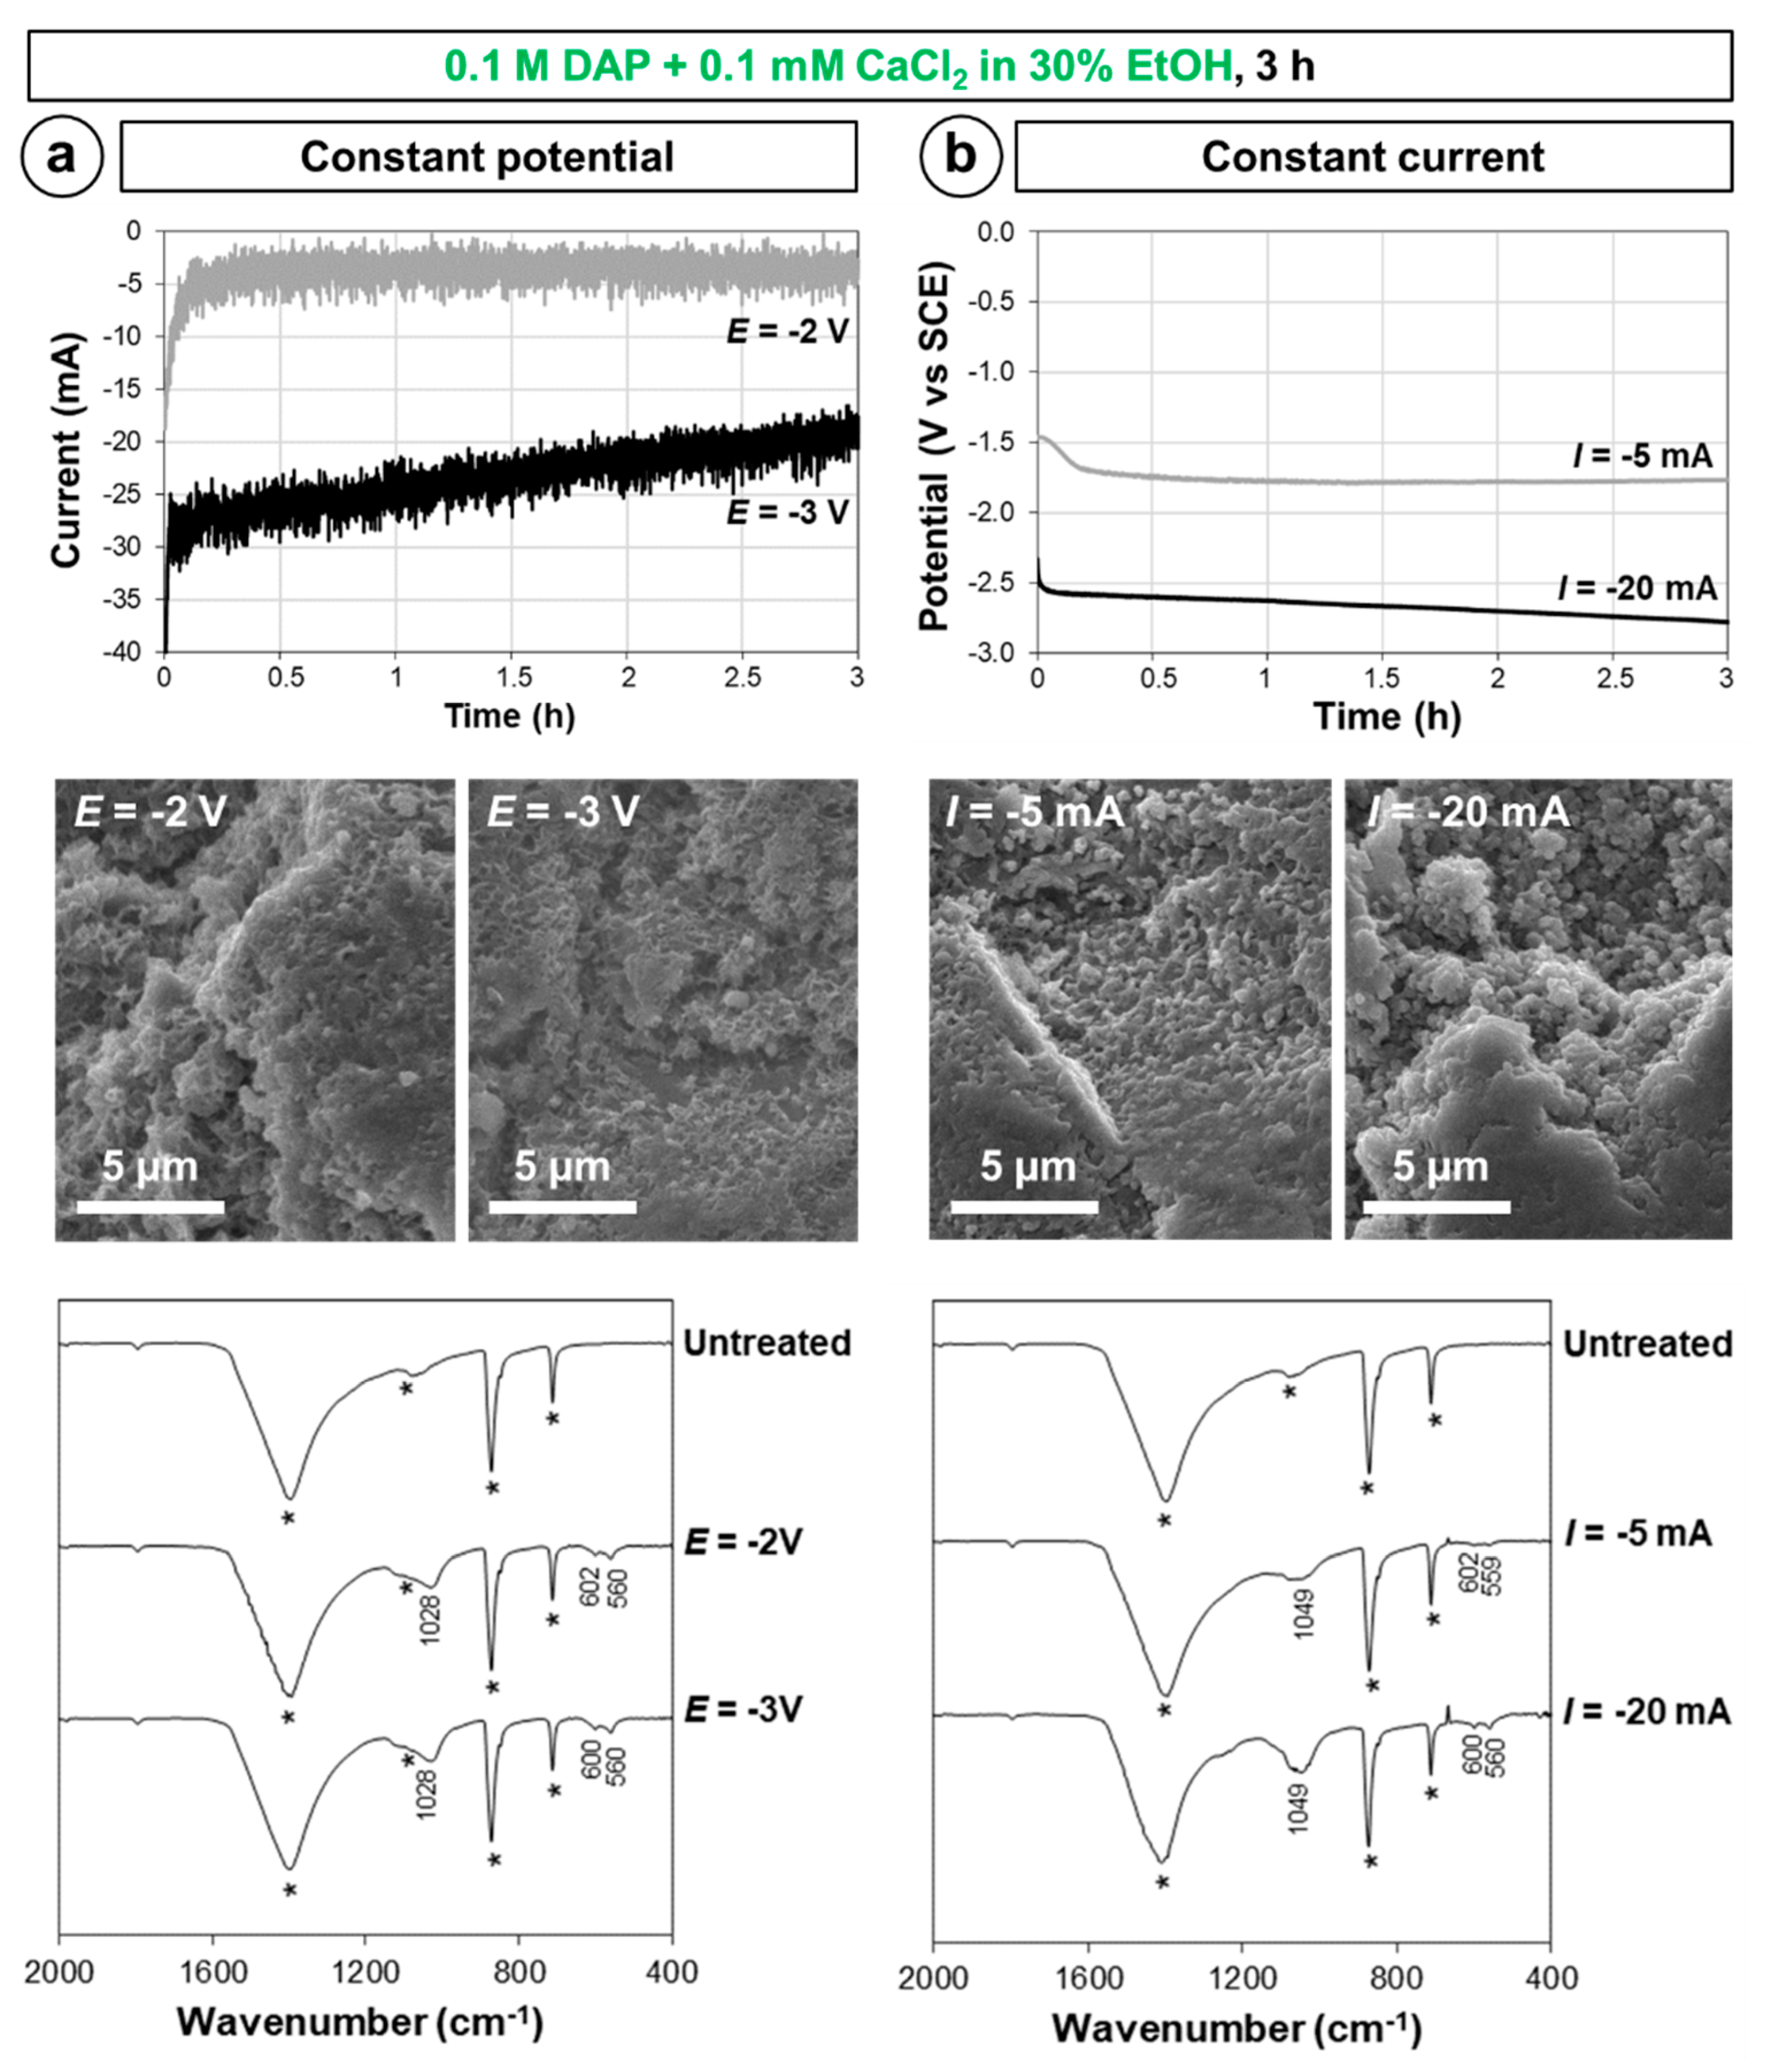
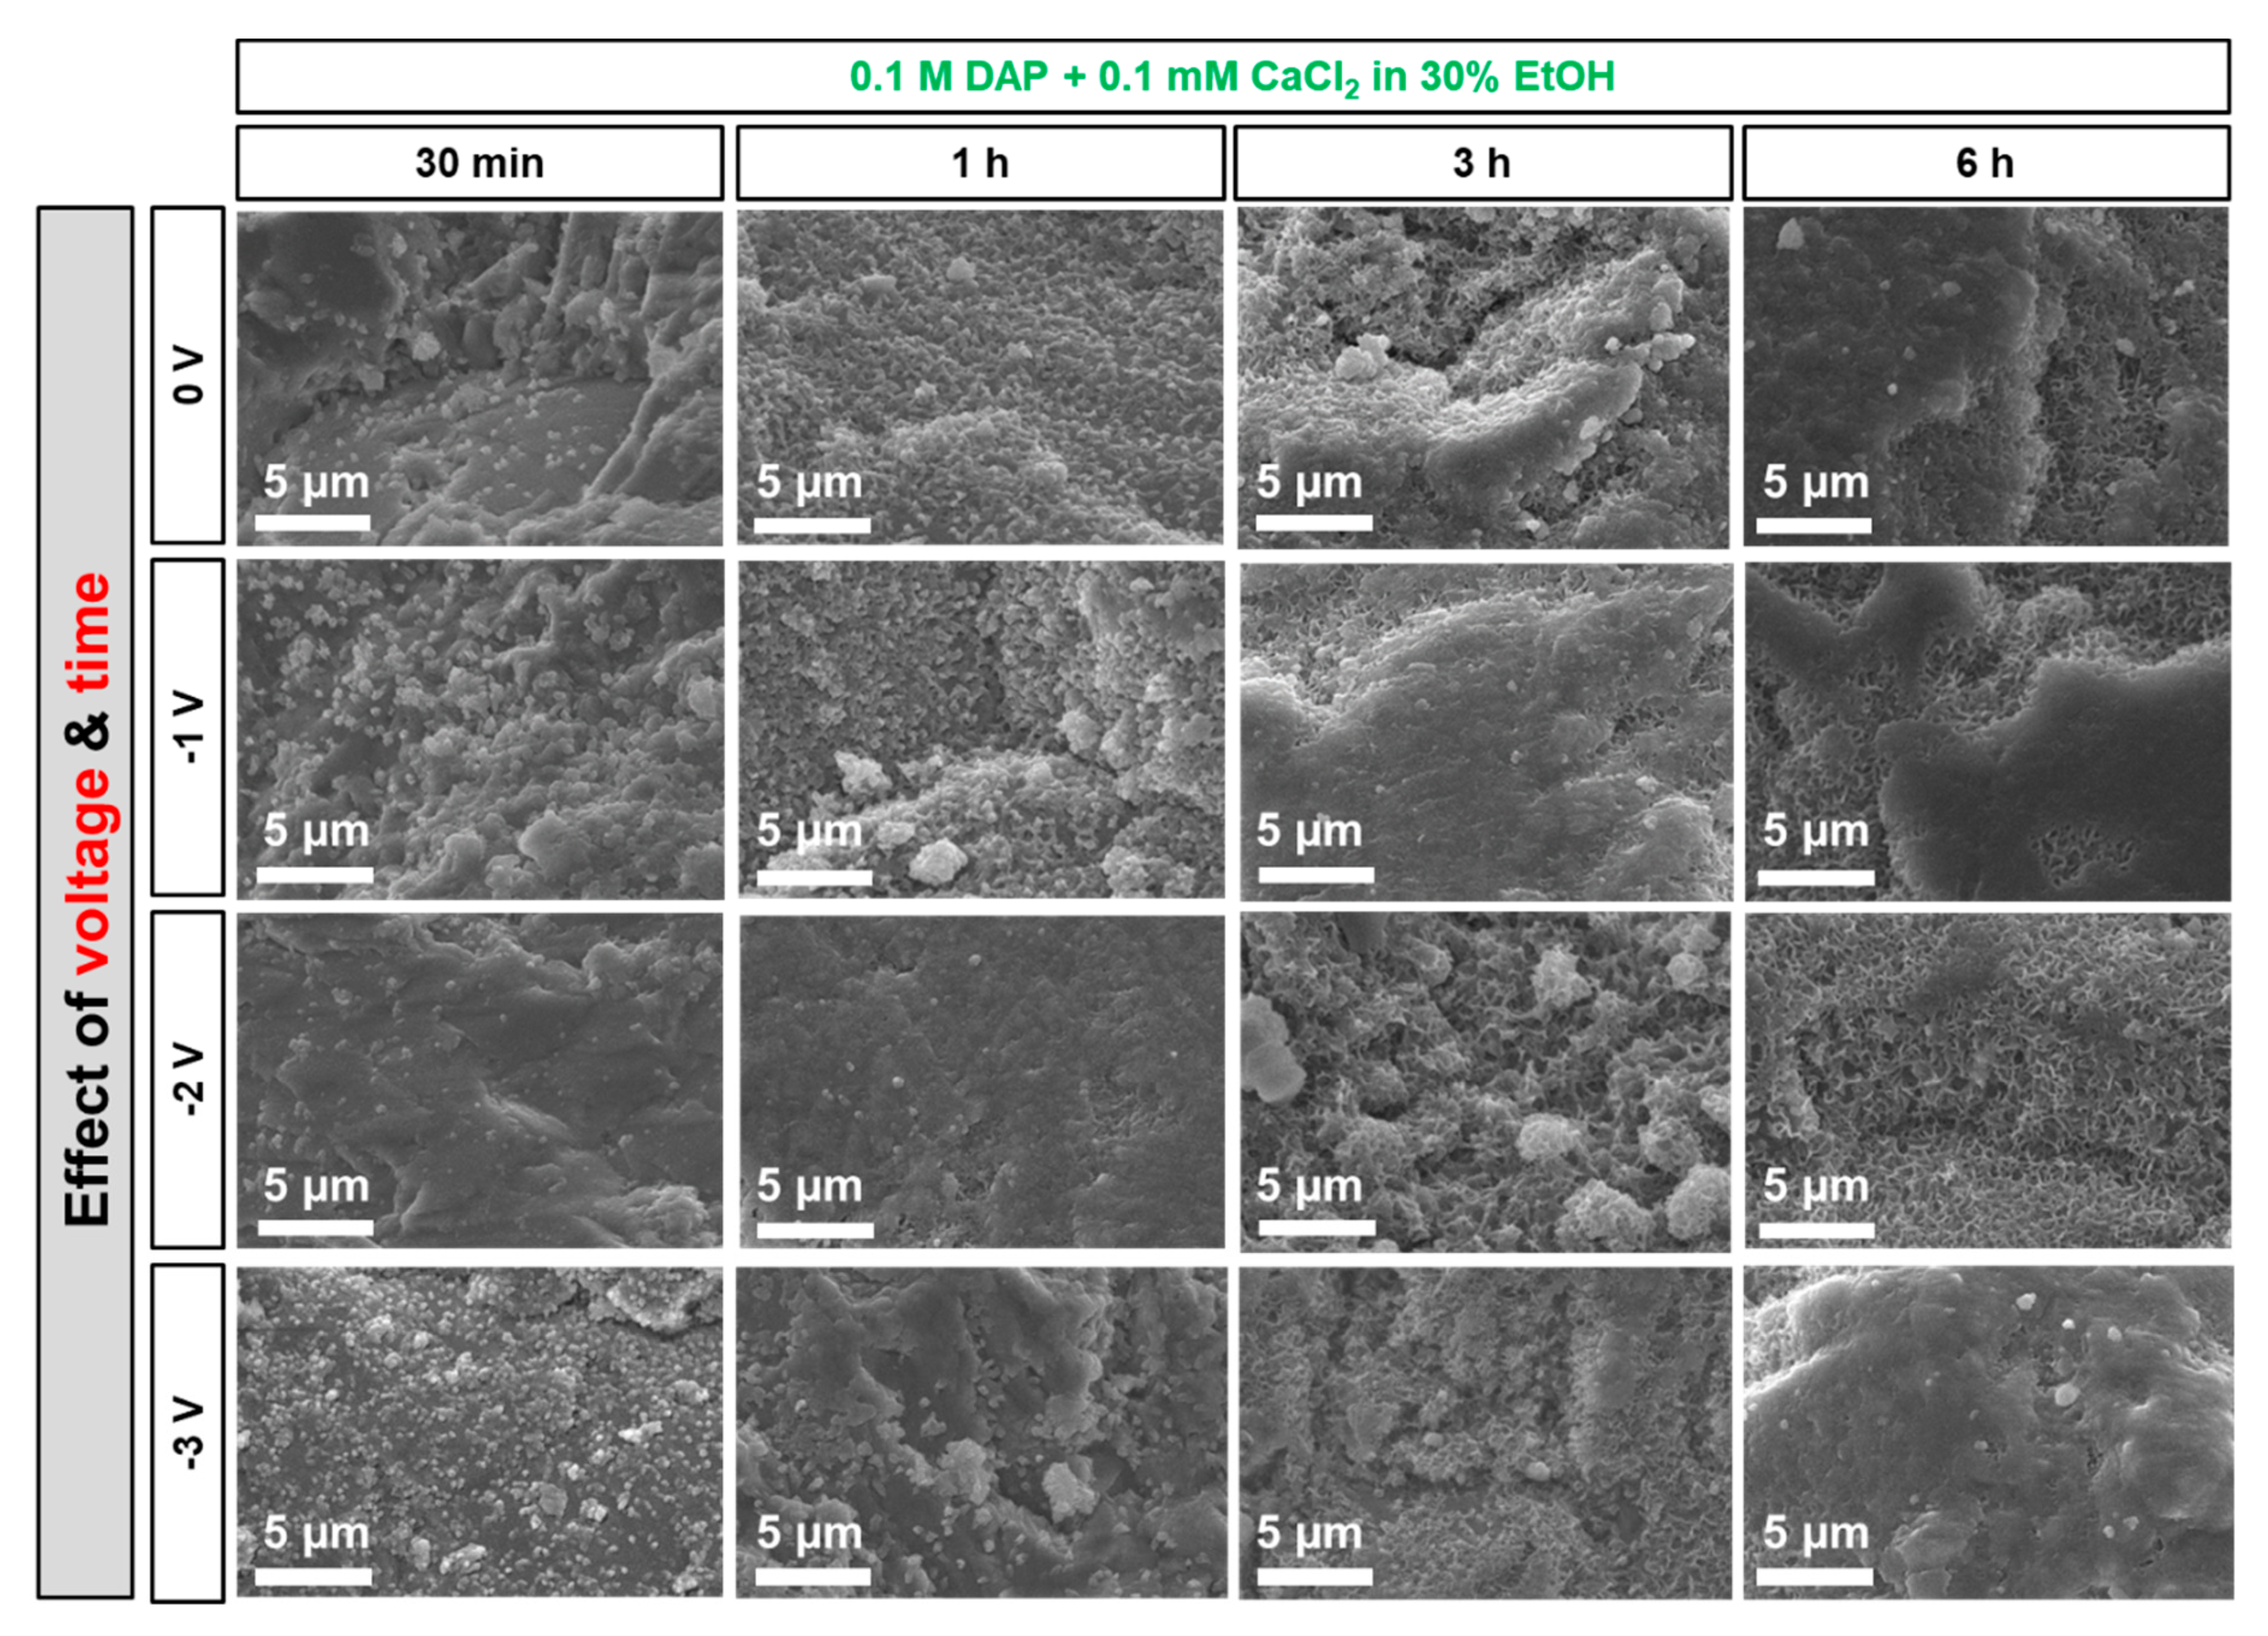
2.4. Influence of Electrokinetic Parameters: Pulsing, Voltage, and Time

The effect of applying a pulsed potential of −1 V for 3 h was investigated on both the less-concentrated solution (0.1 M DAP + 0.1 mM CaCl2 in 30 vol.% EtOH) and the more-concentrated one (2 M DAP + 2 mM CaCl2 in 10 vol.% EtOH), using the setup illustrated in Figure 3a. In addition, for the less-concentrated solution the effect of the pulsed potential was investigated also for a shorter time of 30 min, applying a pulsed potential of −1, −2, and −3 V. The pulsed potential experiments consisted of applying cycles of 1 s on and 2 s off [29].
For both solutions, the effect of applying an increasing negative voltage (without pulsing) was then systematically investigated, again adopting the setup illustrated in Figure 3a. Because, in the literature, HAP was found to be the major phase formed on titanium when a potential of −1.55 V or lower was applied (in that case, the electrolyte being a 42 mM Ca(NO3)2 + 25 mM ADP solution [18]), in the present study potential values above and below this threshold were considered: −1, −2, and −3 V in the case of the less-concentrated solution and −1 and −2 V in the case of the more-concentrated one. For the latter solution, E = −3 V was not tested, because drying cracks appeared in the coating formed at −2 V, suggesting that the film growth was already excessive at this voltage (cf. Section 3.3). For each voltage value, increasing treatment durations were investigated (30 min, 1, 3, and 6 h). For all the voltage/time conditions, one sample was also treated without electrodeposition (E = 0 V), for comparison’s sake.

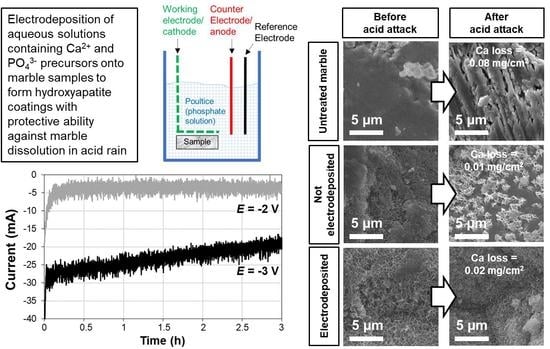
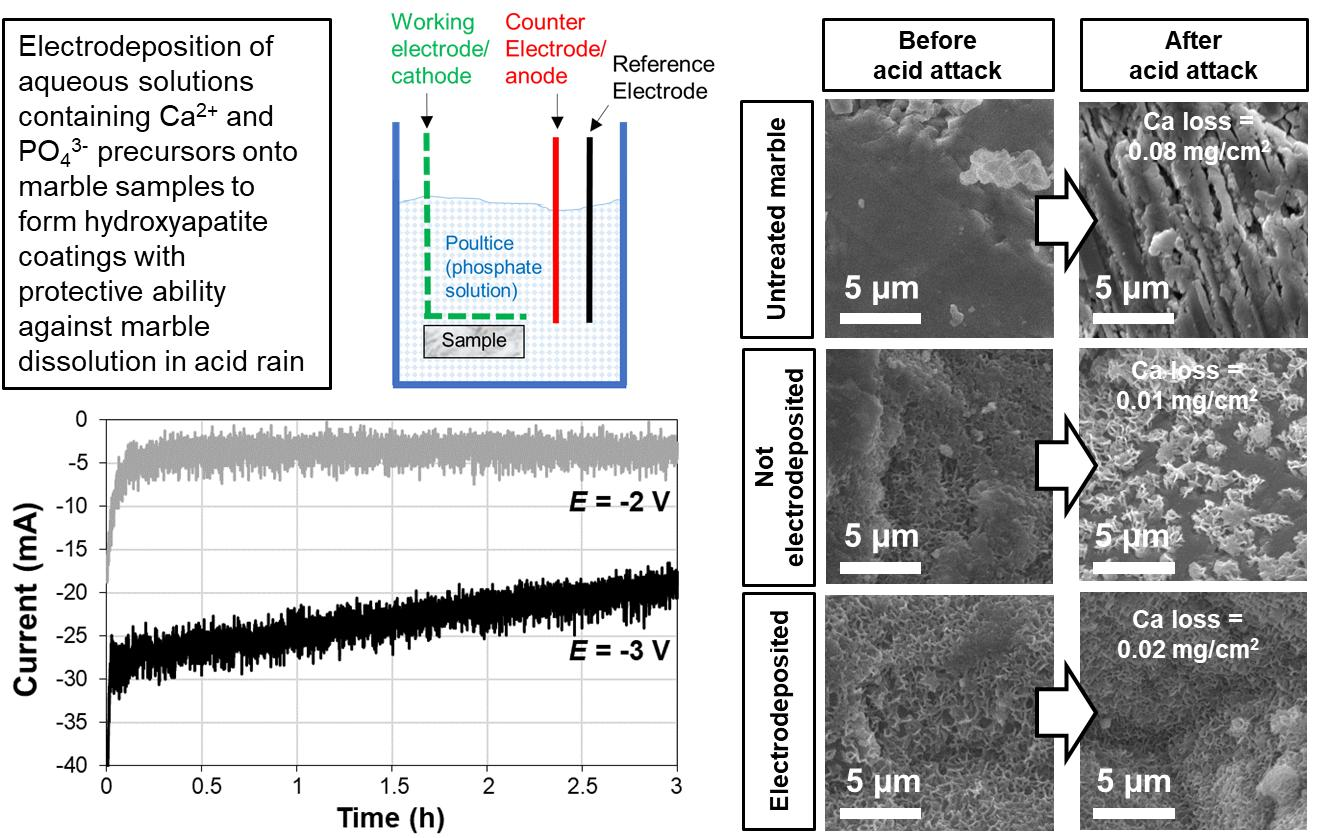
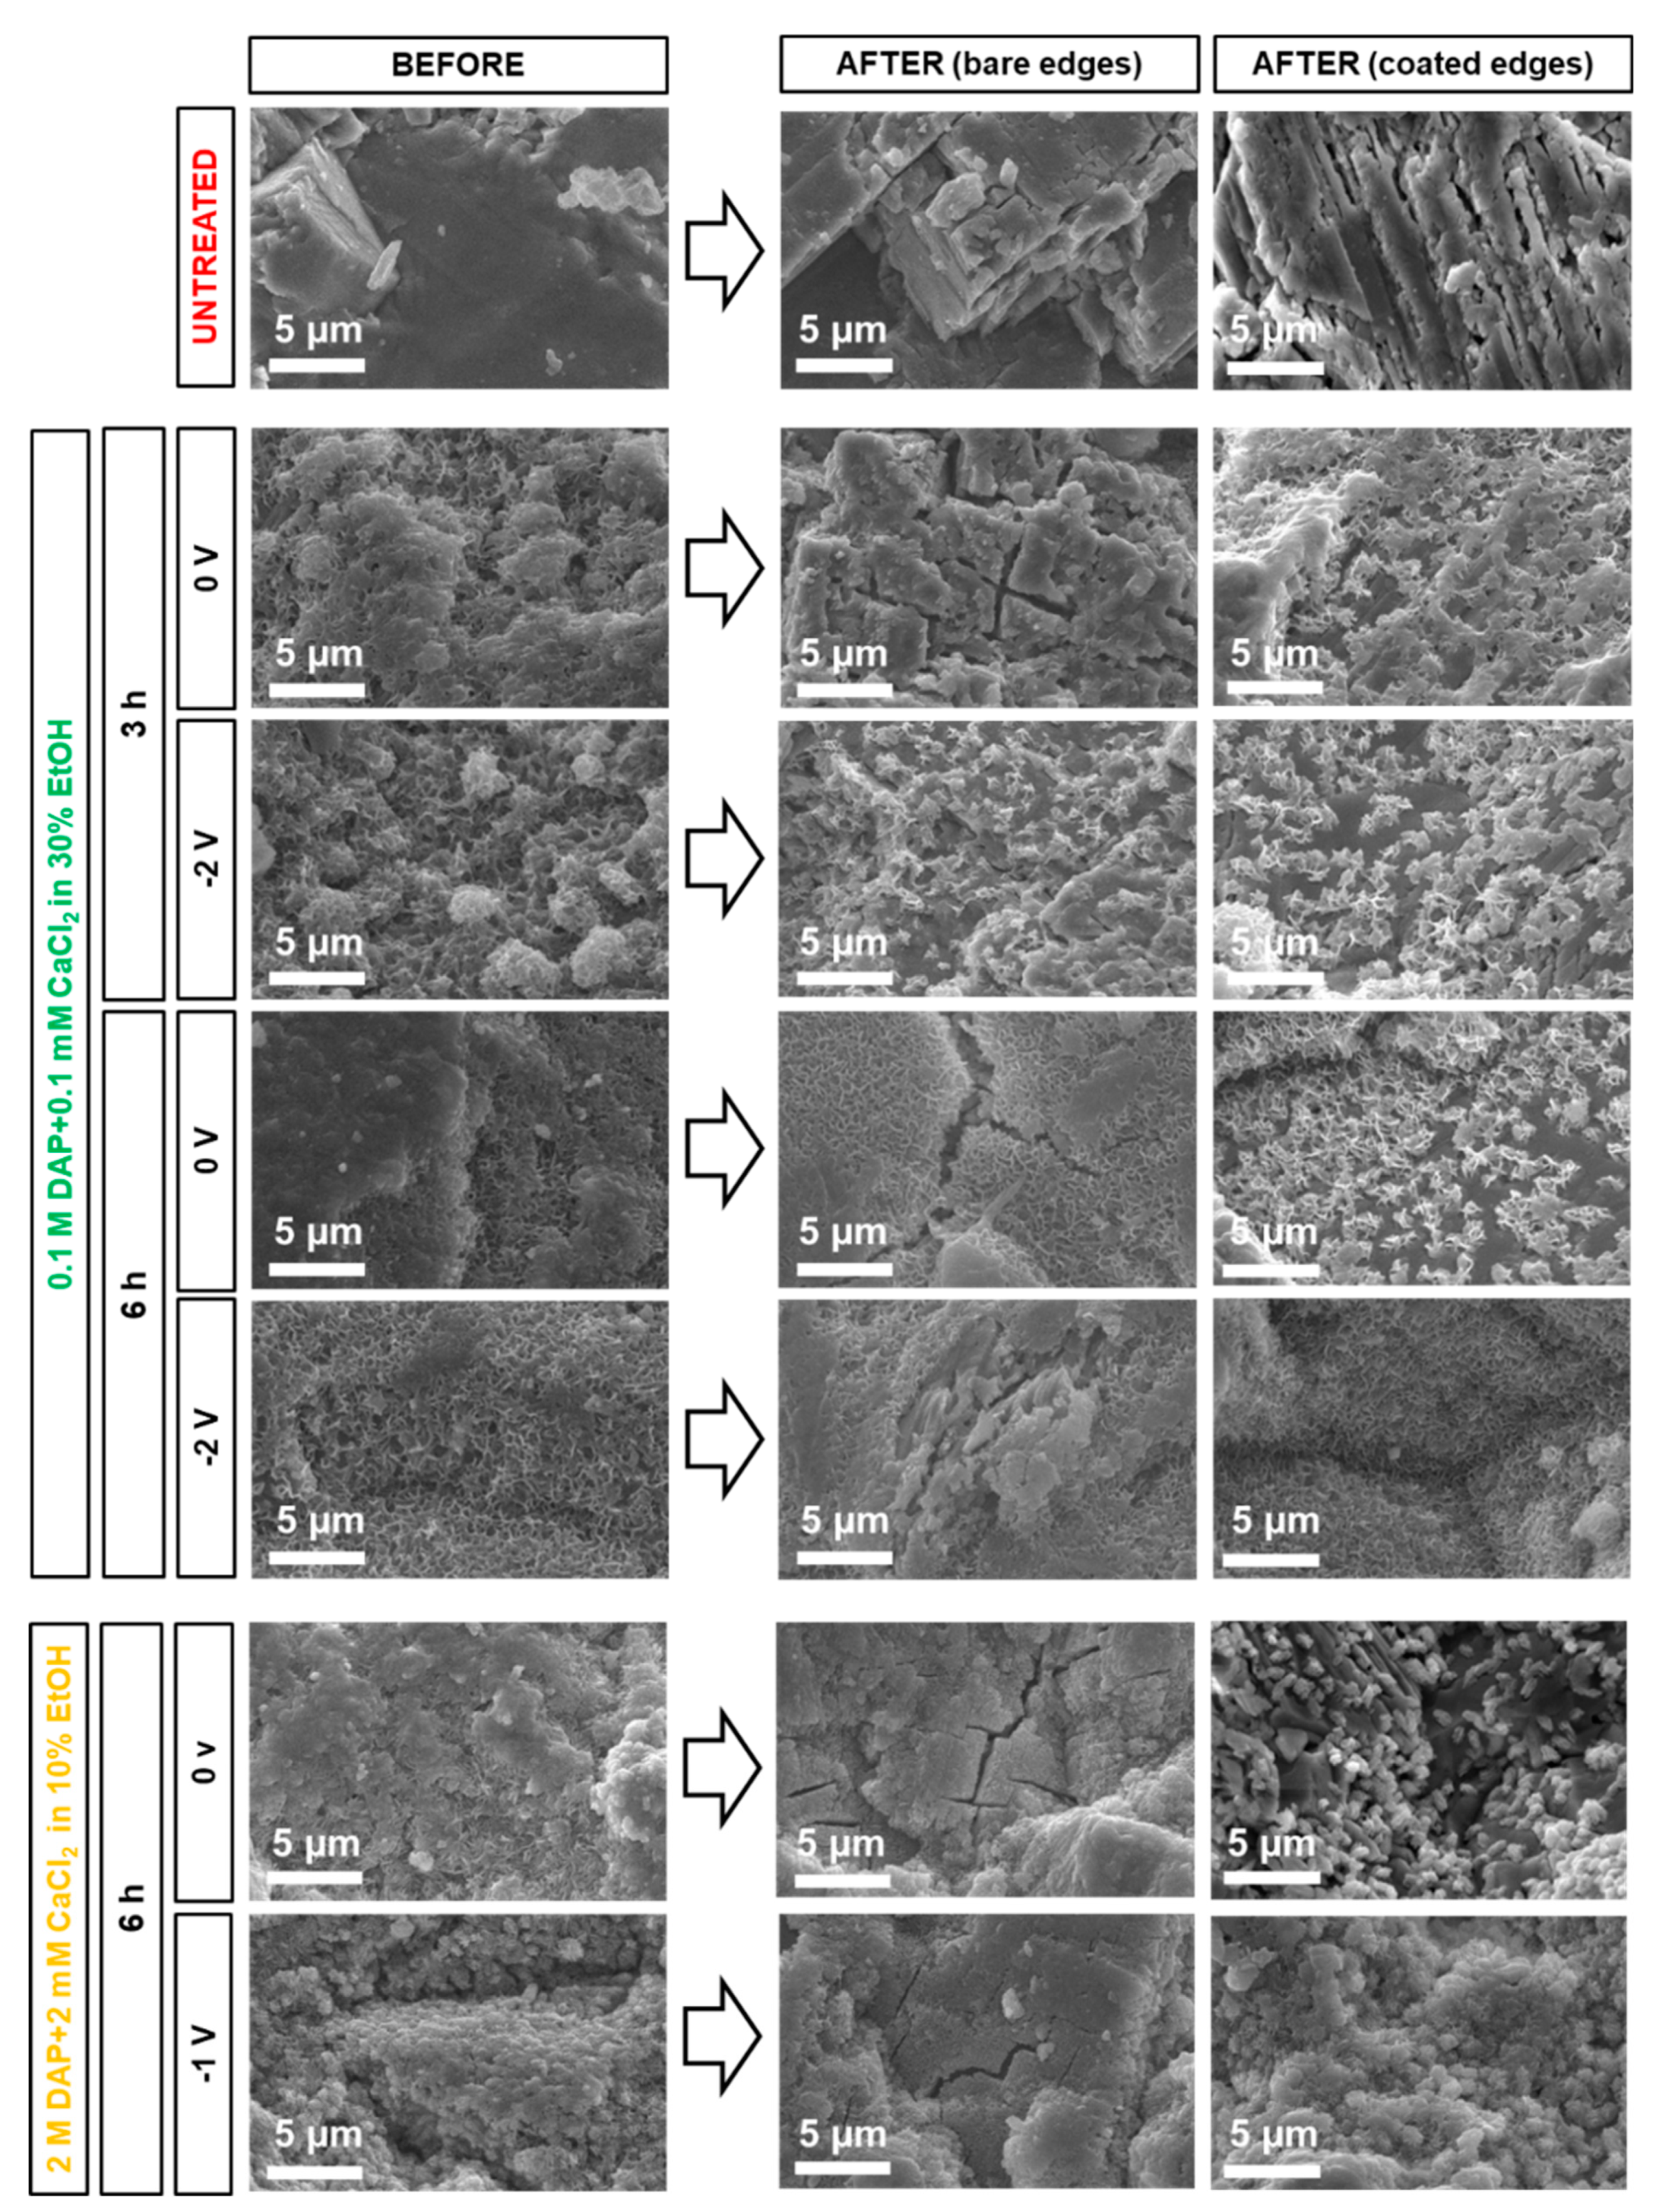
2.5. Acid Resistance

For the most promising formulations, identified by the screening tests described in the previous paragraphs, the protective ability of the resulting coatings was evaluated. The selected formulations were: (i) 0.1 M DAP + 0.1 mM CaCl2 in 30 vol.% EtOH solution at E = −2 V for 3 h and (ii) for 6 h, and (iii) 2 M DAP + 2 mM CaCl2 in 10 vol.% EtOH solution at E = −1 V for 6 h. All the electrodeposition treatments were applied adopting the setup in Figure 3a. For comparison’s sake, the same solutions were also applied for the same time, but without electrodeposition (E = 0 V). An untreated reference was tested too.
After coating deposition, half of the specimens was directly subjected to the acid resistance test, while the other half was subjected to a further preparation step. In fact, previous studies suggested that the sample edges are often incompletely covered with the protective coatings, not because of a scarce performance of the coatings themselves, but because the sample edges are more prone to wear during treatment and handling [7]. For this reason, according to previous studies [6,7] an impermeable coat was applied over the edges of the second half of the samples, to exclude any interference from damage possibly affecting the sample edges. After application of the impermeable coat, two uncovered areas (each measuring 12 × 12 mm2) were isolated in the middle of the two square faces of the prismatic specimens (measuring 20 × 20 × 5 mm3), while the edges and the sides of the prisms were covered with the coat. In this way, only the uncovered central area was exposed to the acidic solution used for the test.
To resemble slightly acidic rain, samples were exposed to aqueous solutions of HNO3 at pH 5. In fact, thanks to the policies of traffic regulation in the city centers in Europe [41], the average rain pH is currently ~5 in Europe and is predicted to remain at this value in the future [42]. Following a procedure similar to that adopted in previous studies [1,5,7], each sample was submerged in a separated container with 100 mL of solution and left submerged for 15 h, the solution being continuously stirred. At the end of the test, samples were rinsed with D.I. water and dried at room temperature until constant weight. Solutions were collected to determine the Ca and P content by inductively coupled plasma optical emission spectrometry (ICP-OES), using a Serie Optima 3200 XL Perkin Elmer instrument (Milan, Italy).

2.6. Sample Characterization

The composition of the new CaP phases was investigated by Fourier-transform infrared spectrometry (FT-IR), using a Perkin Elmer Spectrum One spectrometer (Milan, Italy). The samples to be analyzed by FT-IR were obtained by scratching from one squared face of the marble specimens, using a spatula. To univocally identify the new CaP phases, combination of FT-IR with other analytical techniques, ideally X-ray diffraction, would be needed [43]. However, given the very low thickness of the new CaP coatings formed over marble (~5 µm [7]), grazing incidence X-ray diffraction (GI-XRD) would be needed, so that the surface layer could be analyzed without the influence from the substrate [7]. However, in the present case, GI-XRD was not available, so the investigation of the new CaP phases was limited to FT-IR, which can provide very important information. In fact, it is true that FT-IR can hardly distinguish between CaP with very similar structure, such as HAP (having strong bands at 1031, 604, and 563 cm−1 [43]) and OCP (having strong bands at 1038, 1023, 602, and 560 cm−1 [43]). Nonetheless, FT-IR analysis allowed us to conclusively exclude formation of other CaP phases with high aqueous solubility (e.g., brushite, CaHPO4·2H2O, having strong bands at 1136, 1063, 986 cm−1 [43]).
The coverage of the marble surface and the morphology of the new CaP phases were evaluated by observation of the other squared face of the specimens (originally close to the steel grid), using a scanning electron microscope (Philips XL20 SEM, Milan, Italy). The samples to be analyzed by SEM were made conductive by coating them with aluminum (after FT-IR analysis).

3. Results and Discussion

3.1. Influence of the Experimental Setup

The results of the tests aimed at defining the best experimental setup are reported in Figure 4.
With regard to the position of the marble sample with respect to the electrodes, new CaP phases were found to form both when the sample was placed near the cathode (Figure 4a) and near the anode (Figure 4b). However, in the former case, the new CaP coating exhibited more promising features. Indeed, ideally the new CaP coating should be continuous (e.g., not leaving uncovered bare areas) and non-porous, which can be more likely achieved when the coating is composed of closely packed small crystals. When the sample was placed near the cathode (Figure 4a), the marble surface appeared as continuously covered with small flower-like crystals, closely following the morphology of the marble surface. Such flower-like morphology is typical of HAP and CaP phases in general [8,12]. Differently, when the sample was placed near the anode (Figure 4b) only few isolated crystals, having significantly bigger size, were visible. Because isolated crystals cannot provide effective protection to the marble surface, the coating formed in this latter condition was regarded as less promising. Consistently with SEM results, in the FT-IR spectra bands owing to new CaP were definitely more pronounced when the sample was placed near the cathode (Figure 4a). In terms of composition of the new phases, based on the band position (1028–1031, 599–602, and 559–560 cm−1), in both cases formation of HAP seems most likely, even though formation of OCP cannot be completely excluded [43]. The difference in the composition of the new phases in the two cases suggests that the local increase in pH, following formation of OH ions near the cathode [17], is predominant over the local increase in phosphate ion concentration, occurring near the anode [39].
Once assessed that CaP formation is more abundant when the marble sample is placed near the cathode, the possible advantage of putting the sample directly in contact with the cathode (Figure 4c) rather than at ~3 mm distance (Figure 4a) was investigated. In the case of direct contact, SEM observation disclosed formation of very big crystals, with size reaching 5 µm, which, however, left the marble surface largely uncovered (Figure 4c). EDS analysis revealed that these crystals contained P and also Zn, whereas FT-IR analysis of the marble surface did not detect any new CaP phase. The source of Zn was found to be the galvanized steel grid used as cathode—the basic environment of the DAP solution (initially at pH 8 and further increased by OH formation near the cathode) led to dissolution of the Zn coating originally present over the steel grid, with consequent Zn release and formation of isolated zinc phosphate crystals. This, in turn, hindered formation of a continuous CaP coating over marble. For this reason, at least in the adopted conditions (i.e., galvanized steel grid used as cathode), direct contact between the marble sample and the cathode is counterproductive, as it leads to formation of zinc phosphates and consequent consumption of phosphate ions. However, in different conditions (e.g., the use of a stainless steel or titanium cathode), direct contact between the sample and the cathode should be re-evaluated. It is worth mentioning that, when the sample was put at ~3 mm from the electrode, no Zn was detected by EDS on the marble surface (Figure 4a).
The results of the test aimed at evaluating whether constant potential or constant current is preferable during electrodeposition are reported in Figure 5.
Both in potentiostatic (Figure 5a) and galvanostatic (Figure 5b) conditions, the variable parameter (current or potential, respectively) exhibits a visible change in the first ~5 min of the test, then it becomes almost stable for the whole duration of the test. In addition to some adjustment in the experimental setup in the initial phase of the test, the registered initial variation is thought to derive from deposition of CaP phase also on the working electrode (the galvanized steel grid). This causes some reduction in the current circulating through the system (Figure 5a) and makes a more negative potential necessary to maintain the same current circulating (Figure 5b). SEM observation of the steel grids at the end of the electrodeposition confirmed that new CaP phases are formed also on the electrode. In terms of features of the new CaP phases formed over marble, SEM observation indicated that, in all cases, complete coverage of the marble surface seems to be achieved by coatings composed of sub-micrometric crystals (Figure 5). However, a significant difference was found in the composition of the new phases obtained in these conditions. While in potentiostatic conditions (Figure 5a), HAP was most likely formed (bands at 1028, 600–602, and 560 cm−1 [43]), in the case of galvanostatic conditions (Figure 5b), the identification of the new CaP phase was less straightforward (bands at 1049, 600–602, and 559–560 cm−1), but formation of HAP or OCP seems excluded. Because HAP and OCP are the most desirable phases to form (the other CaP phases having higher aqueous solubility), the coatings formed in potentiostatic conditions were regarded as less promising to provide marble with protection against dissolution in rain, hence they were not adopted further in the prosecution of the study.
Both in potentiostatic and galvanostatic conditions, SEM and FT-IR suggest some increase in the amount of new CaP formed after electrodeposition for increasing negative potential and increasing current, respectively (Figure 5). This confirms the importance of performing a systematic analysis of the influence of the applied potential, which was done in the prosecution of the study (cf. Section 3.3.).

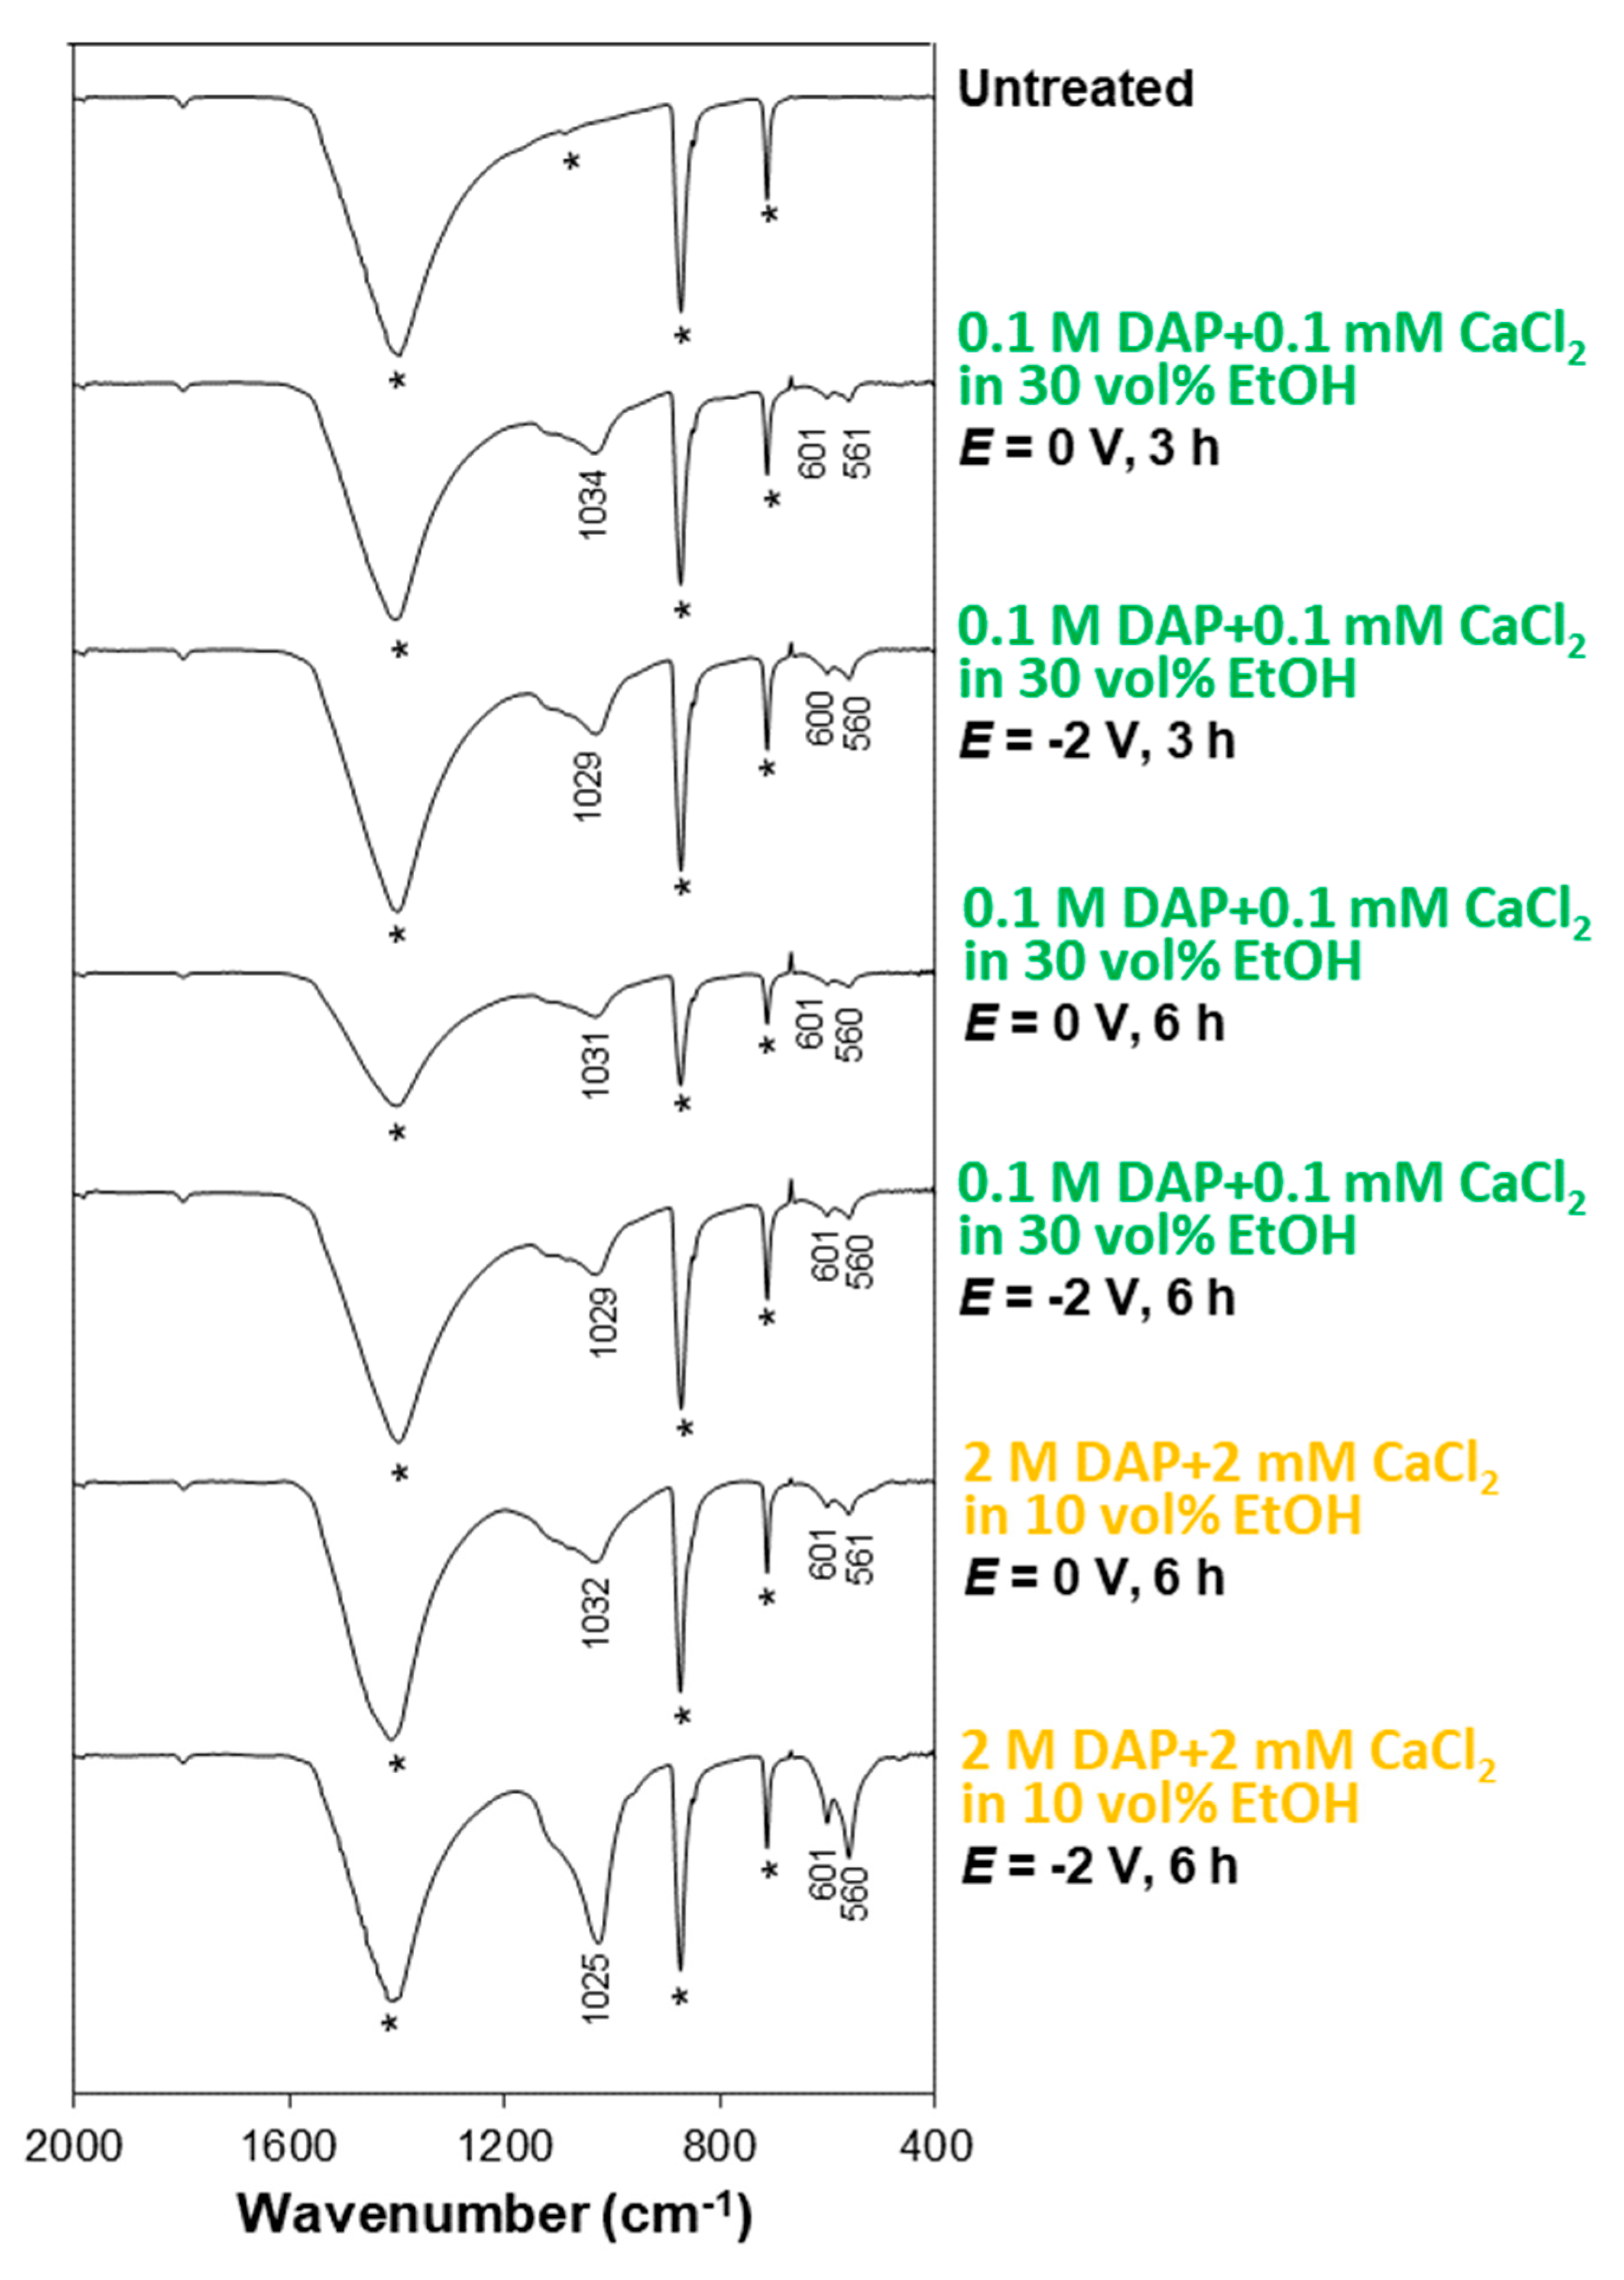
3.2. Influence of the Electrolyte: DAP and CaCl2 Concentration, Ethanol and/or H2O2 Addition

The effects of adding EtOH and/or H2O2 to a 0.1 M DAP + 0.1 mM CaCl2 solution are reported in Figure 6. Incomplete coverage of the marble surface was found when no addition was made (either without or with electrodeposition), as the marble surface (dark gray in Figure 6) is clearly visible below isolated CaP crystals. Differently, almost complete coverage of the marble surface was obtained when 30 vol.% EtOH was added, even without electrodeposition (Figure 6). This was possible thanks to the boosting effect of ethanol on CaP nucleation, as assessed in previous studies [5,7]. Indeed, ethanol molecules weaken the hydration sphere of phosphate ions in solution, which makes them more reactive to form CaP [7]. When an electric potential was applied, some increase in the packing of the CaP coating was observed, which can be attributed to the beneficial effect of ethanol on CaP electrodeposition, as previously reported in biomedical studies [23,28]. However, the improvement in the coating was not dramatic.
In the case of H2O2 addition, bigger crystals (size of 0.5–1 µm) were formed even with no electrodeposition (Figure 6). When potential was applied, the crystal size further increased dramatically, leading to formation of isolated crystals with 5–10 µm length. Such huge increase in the crystal size, promoted by the increased availability of OH groups induced by H2O2 reduction [31], is consistent with previous results available in the literature, reporting even precipitation of CaP directly in the bulk solution upon H2O2 addition [32]. However, this huge increase in crystal size is counterproductive towards achievement of a continuous coating, able to protect marble from dissolution in acid. For this reason, H2O2 addition was not considered in the prosecution of the study.
By adding both EtOH and H2O2 to the solution, when no electrodeposition was used, a coating similar to that obtained using EtOH alone was found (Figure 5). However, when potential was applied, again isolated crystals with 1–2 µm size were formed. Although smaller than in the case of H2O2 addition alone, these crystals were unable to completely cover the marble surface (in Figure 6, bare calcite grains are clearly visible as darker zones below the lighter CaP crystals). Therefore, combined EtOH + H2O2 addition was discarded in the prosecution of the study.
With regard to the effect of increasing the DAP and, proportionally, the CaCl2 concentrations in the solution (always maintaining a DAP:CaCl2 ratio of 1000:1 and adding the maximum amount of EtOH not leading to immediate CaP precipitation in the solution), the variation in the amount and morphology of the new CaP phases is illustrated in Figure 7.
With no electrodeposition, after 30 min isolated clusters (small lighter particles over the darker marble surface) were found in the case of the solution with the lower concentration and almost no clusters in the case of the more-concentrated solution. This can be explained considering that, in the less-concentrated solution, a much higher amount of EtOH is present (30 vol.%, instead of 10 vol.%), which significantly increases the nucleation of the new CaP phases even at low DAP concentration [7]. Consistently, after 3 h the more-concentrated solution (with lower EtOH addition) caused formation of isolated crystals, relatively big in size (0.5–1 µm), whereas the marble surface was apparently completely covered by a new coating with flower-like morphology in the case of the less-concentrated solution (containing higher EtOH amounts). When potential was applied, formation of new phases was much more abundant for both solutions at both times (Figure 7). After 3 h, in the case of the less-concentrated solution, a very densely packed coating was formed, exhibiting the typical flower-like morphology in a recess in the surface. Also in the case of the more-concentrated solution, almost complete coverage was obtained after 3 h, but the resulting coating appeared as significantly coarser. In terms of composition of the new phases formed after 3 h at E = −2 V, FT-IR spectra exhibit bands attributable to HAP, which were more defined (especially the band at 1028–1031 cm−1) when more EtOH was present in the solution.
For both DAP/CaCl2 concentrations, formation of an almost continuous coating was obtained. Based on the position of the FT-IR bands (Figure 7), it seems most likely that the coatings are composed of HAP, even though formation of OCP cannot be completely excluded. In either case, both formulations were regarded as promising and hence taken into consideration in the prosecution of the study.

3.3. Influence of Electrokinetic Parameters: Pulsing, Voltage, and Time

The effect of applying a pulsed potential is illustrated in Figure 8.
In the case of the less-concentrated solution, a limited increase in the density of the new CaP clusters when pulsed potential was applied can be noticed after treatment for 30 min, while the pulsing effect became less evident after 3 h. In fact, after 3 h the flower-like coating was basically complete even with constant potential, so that no increase in coverage thanks to the pulsed potential was visible. In the case of the more-concentrated solution (containing less EtOH), the effect of pulsing was not investigated at 30 min, because almost no coating had been found to form at that time at constant potential (Figure 7). After 3 h, the coating deposited at constant potential appeared to be composed of relatively big, separated crystals, which leave the marble surface partly bare. With pulsed potential, the surface was somewhat improved, although better results were obtained using the less-concentrated solution (containing more EtOH).
Because, in all cases, the effect of pulsing was lower than hoped based on the studies reported in the literature [24,27,29], constant potential was adopted in the prosecution of the study.
The change in the amount and surface coverage of the new phases as a function of the applied voltage and time is illustrated in Figure 9 for the less-concentrated solution and in Figure 10 for the more-concentrated one.
In both cases, it is possible to observe that, at short time (30 min), the number of new phases increased visibly for increasing voltage. In fact, at 30 min, only a few CaP clusters were formed when no voltage was applied (lighter particles over the darker marble surface in Figure 9 and Figure 10). This is consistent with previous results reported in the literature, where CaP formation was found to start to be significant between 3 and 6 h, depending on the formulation of the precursor phosphate solution [12]. When voltage was applied and progressively increased, a progressively more continuous coating was formed. In the case of the more-concentrated solution (Figure 10), the effect was still visible up to 3 h, because the lower amount of EtOH present in this solution (10 vol.%, compared to 30% in the less-concentrated one) implies a longer time for the CaP coating to develop. After 6 h, no significant difference was evident among samples treated with different voltage, including the samples treated without electrodeposition. Apparently, at least in the investigated conditions, after prolonged treatment the effect of time becomes predominant over that of electrodeposition.
In the case of the less-concentrated solution (Figure 9), a significant change in the amount and morphology of the new phases was clearly visible passing from 0 to −1 and −2 V. On the contrary, the difference between coatings formed at −2 and −3 V was less evident. A reason for this might be that, during electrodeposition, the cathode itself is progressively coated with new CaP phases, as already suggested by the change in current measured during potentiostatic deposition (Figure 5a) and confirmed by SEM observation of the steel grids. As a consequence, after a certain time, the amount of current circulating in the system diminishes, so that electrodeposition of the new phases over the marble sample diminishes as well. Consistently, a reduction was found in the current measured during electrodeposition at −2 and −3 V (Figure 5a), whereas no significant change in current was registered during electrodeposition at −1 V (graph not shown). This is consistent with results previously reported in the literature, indicating that HAP was present only in minor amounts when electrodeposition was carried out at −1.25 V and it became the major phase when electrodeposited at −1.55 V or lower [18].
In the case of the more-concentrated solution, micro-cracks with ~5 µm length and ~1 µm width are visible in the flowery coating deposited at −2 V for 6 h (Figure 10, bottom-right image). This suggests that the film formed in these conditions is likely porous and thick, which leads to cracking during drying. In fact, drying cracks do not form when the film is dense and its thickness is below the critical threshold, below which cracking is thermodynamically impeded [44]. Consequently, electrodeposition at −3 V was not considered for the acid resistance tests in the case of the more-concentrated solution.
Based on all the results reported above, the choice of the formulations for the acid attack tests was made. In the case of the less-concentrated solution, treatment at −2 V for 3 and 6 h was selected, because in both cases a basically complete coverage of the marble surface was achieved (Figure 9). In the case of the more-concentrated solution, the treatment at −1 V for 6 h was taken into account, while the treatment at higher voltage (E = −2 V) was discarded, because the resulting coating was heavily cracked (Figure 10). For all these conditions, samples treated for the same time but without electrodeposition were also considered, for comparison’s sake.

3.4. Acid Resistance

The amounts of Ca and P released in the acidic solutions, measured by ICP at the end of the acid resistance test, are reported in Table 1.
The surface appearance of untreated and treated marble samples, before and after the acid attack test, is illustrated in Figure 11.
As expected, after the acid test, the untreated reference exhibited visible surface etching, in the form of grooves and exposed grain boundaries. As a consequence, Ca ions were detected in the solution (Table 1).
In the case of treated samples, tested with bare edges, no formulation was able to completely prevent dissolution of the marble substrate. In fact, the measured Ca losses had the same order of magnitude as those of the untreated reference (Table 1) and cracking of the protective coatings was clearly visible after the acid attack test (Figure 11). Some limited benefits seem to result from treatments applied by electrodeposition for 6 h, with either concentration of DAP and CaCl2 (Table 1). In these conditions, the lowest Ca losses were registered, and limited damage of the coating was observed after the acid attack test. In the case of the less-concentrated formulation, no P was detected in the solutions analyzed after the acid test, which suggests that the coatings were not dissolved during exposure to acid and that the measured Ca losses mostly originate from dissolution of the marble substrate in uncovered zones or cracks in the coating. Differently, in the case of the more-concentrated solution, some small amounts of P were also detected in the solutions, suggesting that some coating dissolution likely took place.
The reason why cracks were visible after the acid resistance test (Figure 11), while no crack was noticed for the same formulations before the acid attack test (Figure 9 and Figure 10), is thought to be the presence of pores inside the coatings, combined with the specific experimental conditions adopted for these specimens. Indeed, before exposure to acid, the bonding at the interface between the coating and the substrate was strong enough to prevent cracking during drying at the end of the treatment application. However, during the acid test, pores likely allowed acid to reach the substrate/coating interface and to weaken the bonding between the two. As a result, the stress arising in the pores during drying at the end of the acid test now led to cracking. To verify the presence of pores in the coatings, further tests would be needed (e.g., observation of cross sections by a focused ion beam microscope, FIB-SEM). A further reason for the weakening of the coating/substrate interface is thought to be the specific experimental conditions adopted for the first set of specimens, i.e., subjecting them to the acid resistance test without coating their edges. In these conditions, the acid attack can start from the edges (where the coating is often damaged during treatment and handling) and then propagate to the rest of the sample. For this reason, the second set of specimens was treated after coating their edges with an impermeable coat, so that only the central, uniform part of the samples was exposed to acid. In these latter conditions, quite different results were obtained.
In fact, when samples were tested after coating the edges with an impermeable coat, the untreated reference exhibited Ca release much higher than the treated samples (Table 1), which indicates that the coatings were able to provide a better acid protection than in the previous case. Accordingly, SEM images show no sign of cracking in any sample (Figure 11). This confirms that the presence of damaged areas near the sample edges allowed acid to reach the substrate/coating interface, weaken the bonding between the two, and trigger cracking. Nonetheless, the effect of pores in the coatings cannot be excluded and further analyses by FIB-SEM are opportune. In some cases, especially in samples treated without electrodeposition, the calcite substrate is sometimes visible in the SEM images (darker areas beneath the lighter flower-like crystals in Figure 11). This indicates that, also in the case of samples tested after coating the edges, the surface coverage and the resulting protection were not complete. Anyway, all the specimens subjected to the acid attack test clearly exhibited bands attributable to HAP after the test (Figure 12), which confirms that the coatings are still present after exposure to acid.

4. Conclusions

The results of the present study, aimed at assessing the feasibility of electrodepositing HAP coatings over marble and evaluating the protective ability of the resulting coatings, allow to derive the following conclusions:
  • Electrodeposition of HAP over the marble surface can be obtained by placing the marble sample close to the cathode. In these conditions, OH groups formed near the cathode during electrodeposition favor HAP formation, compared to the situation when no electric potential is applied. Compared to simple increase in pH of the phosphate solution used as HAP precursor, the local increase in OH near the cathode has the advantage that precipitation of CaP in the bulk solution and excessive film growth are prevented.
  • At short times (30 min and 1 h), electrodeposition has a significant effect in accelerating and improving marble coverage by the new HAP coating. At longer times, the effect becomes less evident, because HAP nucleation and growth take place even without electrodeposition.
  • Among the two formulations investigated in this study (namely, a solution containing 0.1 M DAP + 0.1 mM CaCl2 in 30 vol.% EtOH and a solution containing 2 M DAP + 2 mM CaCl2 in 10 vol.% EtOH), the less-concentrated one, containing a higher amount of ethanol, leads to formation of more uniform coatings in a shorter time. This is possible thanks to the boosting effect of ethanol, which is visible even without electrodeposition and which is further enhanced when electric potential is applied.
  • The HAP coatings formed by electrodeposition in the present most promising conditions (−2 V for 3 and 6 h in the case of the less-concentrated solution and −1 V for 6 h in the case of the more-concentrated one) provide some protective efficacy, even though the substrate dissolution is not completely inhibited. In fact, pores are likely present in the electrodeposited coatings, which reduces their protective efficacy and leads to cracking when the coating thickness is excessive. Moreover, possible damaged parts (e.g., the areas near the edges) proved to have a not negligible influence on the coating protective efficacy, which needs to be taken into account when designing acid resistance tests.
All things considered, electrodeposition seems like a technique able to accelerate and improve formation of HAP coatings over the marble surface, even though the resulting protective efficacy is not complete yet. Electrodeposited coatings appear to be mainly composed of HAP, while presence of other CaP was not evidenced. To ascertain the presence of pores in the coatings, further research is needed, for instance observation of cross sections by FIB-SEM.

Author Contributions

Conceptualization, E.S.; Methodology, E.S., G.M, M.C.B. and E.F.; Investigation, E.S. and G.M.; Resources, M.C.B. and E.F.; Data Curation, E.S. and G.M.; Writing-Original Draft Preparation, E.S.; Writing-Review & Editing, E.S., G.M., M.C.B. and E.F.; Supervision, M.C.B. and E.F.; Funding Acquisition, E.S.

Funding

This work has received funding from the European Union’s Horizon 2020 research and innovation program under the Marie Skłodowska-Curie grant agreement N. 655239 (HAP4MARBLE project, “Multi-functionalization of hydroxyapatite for restoration and preventive conservation of marble artworks”).

Acknowledgments

George W. Scherer is gratefully acknowledged for fruitful and inspiring discussion. Adelia Albertazzi (Centro Ceramico, Bologna) is gratefully acknowledged for ICP analyses.

Conflicts of Interest

The authors declare no conflict of interest.

References

  1. Patnaik, P. Handbook of Inorganic Chemical Compounds, 1st ed.; McGraw-Hill: New York, NY, USA, 2003. [Google Scholar]
  2. Naidu, S.; Blair, J.; Scherer, G.W. Acid-resistant coatings on marble. J. Am. Ceram. Soc. 2016, 99, 3421–3428. [Google Scholar] [CrossRef]
  3. Dorozhkin, S.V. Calcium orthophosphates: Occurrence, properties, biomineralization, pathological calcification and biomimetic applications. Biomatter 2011, 1, 121–164. [Google Scholar] [CrossRef]
  4. Naidu, S.; Sassoni, E.; Scherer, G.W. New treatment for corrosion-resistant coatings for marble and consolidation of limestone. In Jardins de Pierres—Conservation of Stone in Parks, Gardens and Cemeteries; Stefanaggi, M., Vergès-Belmin, V., Eds.; XL Print: Paris, France, 2011; pp. 289–294. [Google Scholar]
  5. Graziani, G.; Sassoni, E.; Franzoni, E.; Scherer, G.W. Hydroxyapatite coatings for marble protection: Optimization of calcite covering and acid resistance. Appl. Surf. Sci. 2016, 368, 241–257. [Google Scholar] [CrossRef]
  6. Graziani, G.; Sassoni, E.; Scherer, G.W.; Franzoni, E. Resistance to simulated rain of hydroxyapatite- and calcium oxalate-based coatings for protection of marble against corrosion. Corros. Sci. 2017, 127, 168–174. [Google Scholar] [CrossRef]
  7. Sassoni, E.; Graziani, G.; Franzoni, E.; Scherer, G.W. Calcium phosphate coatings for marble conservation: Influence of ethanol and isopropanol addition to the precipitation medium on the coating microstructure and performance. Corros. Sci. 2018, 136, 255–267. [Google Scholar] [CrossRef]
  8. Sassoni, E. Hydroxyapatite and other calcium phosphates for the conservation of cultural heritage: A review. Materials 2018, 11, 557. [Google Scholar] [CrossRef] [PubMed]
  9. Sassoni, E.; Naidu, S.; Scherer, G.W. The use of hydroxyapatite as a new inorganic consolidant for damaged carbonate stones. J. Cult. Herit. 2011, 12, 346–355. [Google Scholar] [CrossRef]
  10. Possenti, E.; Colombo, C.; Bersani, D.; Bertasa, M.; Botteon, A.; Conti, C.; Lottici, P.P.; Realini, M. New insight on the interaction of diammonium hydrogen phosphate conservation treatment with carbonatic substrates: A multi-analytical approach. Microchem. J. 2016, 127, 79–86. [Google Scholar] [CrossRef]
  11. Possenti, E.; Colombo, C.; Conti, C.; Gigli, L.; Merlini, M.; Rikkert Plaisier, J.; Realini, M.; Sali, D.; Diego Gatta, G. Diammonium hydrogenphosphate for the consolidation of building materials. Investigation of newly-formed calcium phosphates. Constr. Build. Mater. 2019, 195, 557–563. [Google Scholar] [CrossRef]
  12. Naidu, S.; Scherer, G.W. Nucleation, growth and evolution of calcium phosphate films on calcite. J. Colloid Interface Sci. 2014, 435, 128–137. [Google Scholar] [CrossRef] [PubMed]
  13. Redeppening, J.; McIsaac, J.P. Electrocrystallization of brushite coatings on prosthetic alloys. Chem. Mater. 1990, 2, 625–627. [Google Scholar] [CrossRef]
  14. Shirkhanzadeh, M. Bioactive calcium phosphate coatings prepared by electrodeposition. J. Mater. Sci. Lett. 1991, 10, 1415–1417. [Google Scholar] [CrossRef]
  15. Monma, H. Electrolytic depositions of calcium phosphates on substrate. J. Mater. Sci. 1994, 29, 949–953. [Google Scholar] [CrossRef]
  16. Shirkhanzadeh, M. Calcium phosphate coatings prepared by electrocrystallization from aqueous electrolytes. J. Mater. Sci. Mater. Med. 1995, 6, 90–93. [Google Scholar] [CrossRef]
  17. Redeppening, J.; Schlessinger, T.; Burnham, S.; Lippiello, L.; Miyano, J. Characterization of electrolytically prepared brushite and hydroxyapatite coatings on orthopedic alloys. J. Biomed. Mater. Res. 1996, 30, 287–294. [Google Scholar] [CrossRef]
  18. Yen, S.K.; Lin, C.M. Cathodic reactions of electrolytic hydroxyapatite coating on pure titanium. Mater. Chem. Phys. 2002, 77, 70–76. [Google Scholar] [CrossRef]
  19. Kuo, M.C.; Yen, S.K. The process of electrochemical deposited hydroxyapatite coatings on biomedical titanium at room temperature. Mater. Sci. Eng. C 2002, 20, 153–160. [Google Scholar] [CrossRef]
  20. Eliaz, N.; Sridhar, T.M. Electrocrystallization of hydroxyapatite and its dependence on solution conditions. Cryst. Growth Des. 2008, 8, 3965–3977. [Google Scholar] [CrossRef]
  21. Hu, R.; Lin, C.; Shi, H.; Wang, H. Electrochemical deposition mechanism of calcium phosphate coating in dilute Ca-P electrolyte system. Mater. Chem. Phys. 2009, 115, 718–723. [Google Scholar] [CrossRef]
  22. Mokabber, T.; Lu, L.Q.; van Rijn, P.; Vakis, A.I.; Pei, Y.T. Crystal growth mechanism of calcium phosphate coatings on titanium by electrochemical deposition. Surf. Coat. Technol. 2018, 334, 526–535. [Google Scholar] [CrossRef]
  23. Bobby Kannan, M. Enhancing the performance of calcium phosphate coating on a magnesium alloy for bioimplant applications. Mater. Lett. 2012, 76, 109–112. [Google Scholar] [CrossRef]
  24. Kannan, M.B.; Wallipa, O. Potentiostatic pulse-deposition of calcium phosphate on magnesium alloy for temporary implant applications—An in vitro corrosion study. Mater. Sci. Eng. C 2013, 33, 675–679. [Google Scholar] [CrossRef]
  25. Kannan, M.B. Improving the packing density of calcium phosphate coating on a magnesium alloy for enhanced degradation resistance. J. Biomed. Mater. Res. A 2013, 101A, 1248–1254. [Google Scholar] [CrossRef]
  26. Walter, R.; Kannan, M.B.; He, Y.; Sandham, A. Influence of the cathodic activity of magnesium alloys on the electrochemical deposition of calcium phosphate. Mater. Lett. 2014, 130, 184–187. [Google Scholar] [CrossRef]
  27. Bobby Kannan, M. Electrochemical deposition of calcium phosphates on magnesium and its alloys for improved biodegradation performance: A review. Surf. Coat. Technol. 2016, 301, 36–41. [Google Scholar] [CrossRef]
  28. Chen, J.S.; Juang, H.Y.; Hon, M.H. Calcium phosphate coating on titanium substrate by a modified electrocrystallization process. J. Mater. Sci. Mater. Med. 1998, 9, 297–300. [Google Scholar] [CrossRef] [PubMed]
  29. Gopi, D.; Indira, J.; Kavitha, L. A comparative study on the direct and pulsed current electrodeposition of hydroxyapatite coatings on surgical grade stainless steel. Surf. Coat. Technol. 2012, 206, 2859–2869. [Google Scholar] [CrossRef]
  30. Monasteiro, N.; Ledesma, J.L.; Aranguiz, I.; Garcia-Romero, A.; Zuza, E. Analysis of electrodeposition processes to obtain calcium phosphate layer on AZ31 alloy. Surf. Coat. Technol. 2017, 319, 12–22. [Google Scholar] [CrossRef]
  31. Drevet, R.; Benhayoune, H.; Wortham, L.; Potiron, S.; Douglade, J.; Laurent-Maquin, D. Effects of pulsed current and H2O2 amount on the composition on electrodeposited calcium phosphate coatings. Mater. Character 2010, 61, 786–795. [Google Scholar] [CrossRef]
  32. Blackwood, D.J.; Seah, K.H.W. Electrochemical cathodic deposition of hydroxyapatite: Improvements in adhesion and crystallinity. Mater. Sci. Eng. C 2009, 29, 1233–1238. [Google Scholar] [CrossRef]
  33. Ottosen, L.M.; Rörig-Dalgård, I. Electrokinetic removal of Ca(NO3)2 from bricks to avoid salt-induced decay. Electrochim. Acta 2007, 52, 3454–3463. [Google Scholar] [CrossRef]
  34. Ottosen, L.M.; Rörig-Dalgård, I. Desalination of a brick by application of an electric DC field. Mater. Struct. 2009, 42, 961–971. [Google Scholar] [CrossRef]
  35. Ottosen, L.M.; Christensen, I.V. Electrokinetic desalination of sandstones for NaCl removal—Test of different clay poultices at the electrodes. Electrochim. Acta 2012, 86, 192–202. [Google Scholar] [CrossRef]
  36. Bernabeu, A.; Expçsito, E.; Montiel, V.; Ordònez, S.; Aldaz, A. A new electrochemical method for consolidation of porous rocks. Electrochem. Commun. 2001, 3, 122–127. [Google Scholar] [CrossRef]
  37. Feijoo, J.; Ottosen, L.M.; Nòvoa, X.R.; Rivas, T.; de Rosario, I. An improved electrokinetic method to consolidate porous materials. Mater. Struct. 2017, 50, 186. [Google Scholar] [CrossRef] [Green Version]
  38. Feijoo, J.; Nòvoa, X.R.; Rivas, T. Electrokinetic treatment to increase bearing capacity and durability of granite. Mater. Struct. 2017, 50, 251. [Google Scholar] [CrossRef]
  39. Meloni, P.; Manca, F.; Carcangiu, G. Marble protection: An inorganic electrokinetic approach. Appl. Surf. Sci. 2013, 273, 377–385. [Google Scholar] [CrossRef]
  40. Matteini, M.; Moles, A.; Giovannoni, S. Calcium oxalate as a protective mineral system for wall paintings: Methodology and analyses. In Proceedings of the III International Symposium Conservation of Monuments in the Mediterranean Basin, Venice, Italy, 22–25 June 1994. [Google Scholar]
  41. Sandrolini, F.; Franzoni, E.; Sassoni, E.; Diotallevi, P.P. The contribution of urban-scale environmental monitoring to materials diagnostics: A study on the Cathedral of Modena (Italy). J. Cult. Herit. 2011, 12, 441–450. [Google Scholar] [CrossRef]
  42. Bonazza, A.; Messina, P.; Sabbioni, C.; Grossi, C.M.; Brimblecombe, P. Mapping the impact of climate change on surface recession of carbonate buildings in Europe. Sci. Total Environ. 2009, 407, 2039–2050. [Google Scholar] [CrossRef]
  43. Karampas, I.A.; Kontoyannis, C.G. Characterization of calcium phosphates mixtures. Vib. Spectrosc. 2013, 64, 126–133. [Google Scholar] [CrossRef]
  44. Evans, A.G.; Drory, M.D.; Hu, M.S. The cracking and decohesion of thin films. J. Mater. Res. 1988, 3, 1043–1049. [Google Scholar] [CrossRef]
Figure 1. Schemes illustrating the setups adopted for (a) ion extraction from porous substrates contaminated with salts and (b) ion introduction into porous substrates to be consolidated.
Coatings 09 00207 g001
Figure 2. Scheme summarizing the rationale of the study and the adopted analytical techniques.
Coatings 09 00207 g002
Figure 3. Schemes illustrating the different setups adopted to determine the best setup conditions: In (a) and (b), the role of the working electrode (the galvanized steel grid) is switched, to determine whether the marble sample should be placed near the cathode or near the anode; in (a) and (c), the marble sample is always placed near the cathode, but either at ~3 mm distance from the electrode or directly in contact, to determine whether direct contact is preferable or not. The setup in (a) was also adopted to compare potentiostatic and galvanostatic conditions.
Coatings 09 00207 g003
Figure 4. Morphology and composition of the new phases formed by placing the marble sample (a) at ~3 mm from the cathode, (b) at ~3 mm from the anode, and (c) directly in contact with the cathode. EDS spectra were acquired in the whole left SEM image. In the FT-IR spectra, bands owing to the substrate are marked by a star, while the position of the new bands owing to CaP phases is reported.
Coatings 09 00207 g004
Figure 5. Electrokinetic parameters measured during electrodeposition, morphology, and composition of the new phases formed in (a) potentiostatic and (b) galvanostatic conditions (in the FT-IR spectra, bands owing to the substrate are marked by a star, while the position of the new bands owing to CaP phases is reported).
Coatings 09 00207 g005
Figure 6. Effect of EtOH and H2O2 addition on the morphology of the new CaP phases formed with and without electrodeposition.
Coatings 09 00207 g006
Figure 7. Effect of the different diammonium hydrogen phosphate (DAP) and CaCl2 concentrations on the new calcium phosphate (CaP) phases formed at different times, with and without electrodeposition (in the FT-IR spectra, bands owing to the substrate are marked by a star, while the position of the new bands owing to CaP phases is reported).
Coatings 09 00207 g007
Figure 8. Effect of pulsed potential on the morphology of the new CaP formed at different times.
Coatings 09 00207 g008
Figure 9. Effect of voltage and time on the morphology of the new CaP phases formed from the less-concentrated solution (0.1 M DAP + 0.1 mM CaCl2 in 30 vol.% EtOH).
Coatings 09 00207 g009
Figure 10. Effect of voltage and time on the morphology of the new CaP phases formed from the less-concentrated solution (2 M DAP + 2 mM CaCl2 in 10 vol.% EtOH).
Coatings 09 00207 g010
Figure 11. Surface morphology of untreated and treated marble samples, before and after the acid resistance test (samples with either bare or coated edges during the acid test are reported).
Coatings 09 00207 g011
Figure 12. FT-IR spectra of untreated and treated samples (tested with coated edges), after the acid test (in the FT-IR spectra, bands owing to the substrate are marked by a star, while the position of the new bands owing to CaP phases is reported).
Coatings 09 00207 g012
Table 1. Weight amounts of Ca and P per unit area of surface exposed to the acid attack, dissolved from untreated and treated marble samples, measured by inductively coupled plasma optical emission spectrometry (ICP) in the solutions collected at the end of the acid resistance tests (marble specimens with bare edges and coated edges were tested).
SampleVoltage, TimeBare EdgesCoated Edges
Ca (mg/cm2)P (mg/cm2)Ca (mg/cm2)P (mg/cm2)
Untreated reference0.090.08
0.1 M DAP + 0.1 mM CaCl2 in 30 vol.% EtOH0 V, 3 h0.100.03
0.1 M DAP + 0.1 mM CaCl2 in 30 vol.% EtOH −2 V, 3 h0.080.02
0.1 M DAP + 0.1 mM CaCl2 in 30 vol.% EtOH 0 V, 6 h0.090.01
0.1 M DAP + 0.1 mM CaCl2 in 30 vol.% EtOH −2 V, 6 h0.080.02
2 M DAP + 2 mM CaCl2 in 10 vol.% EtOH0 V, 6 h0.110.010.01
2 M DAP + 2 mM CaCl2 in 10 vol.% EtOH−1 V, 6 h0.080.010.02

