Article

Manufacturing Errors of Concrete Cover as a Reason of Reinforcement Corrosion in a Precast Element—Case Study

Faculty of Civil Engineering and Architecture, Kielce University of Technology, Al. Tysiąclecia Państwa Polskiego 7, 25-314 Kielce, Poland
*
Author to whom correspondence should be addressed.
Coatings 2019, 9(11), 702; https://doi.org/10.3390/coatings9110702
Submission received: 28 September 2019 / Revised: 23 October 2019 / Accepted: 25 October 2019 / Published: 27 October 2019
(This article belongs to the Special Issue Manufacturing and Surface Engineering II)

Abstract

:
The article concerns the assessment of technical condition of the precast loggia wall in a large panel building after 25 years of use as well as the cause of its damage. As a result of the study, cracks and losses of the concrete cover were found. Corrosion products were visible on exposed reinforcing rods. The reinforcement distribution and concrete cover thickness in loggia wall were estimated using a rebar detector. The corrosion assessment of reinforcement was performed using a semi non-destructive galvanostatic pulse method that allows the location of areas of corrosion and estimate the reinforcement corrosion activity. The phase composition of the concrete cover was analyzed. The test results showed an insufficient thickness of the concrete cover as the main cause of loggia wall damage. The research indicated that manufacturing errors made in the prefabrication plants affect the technical condition of precast elements and may lead to the damage of the structure well before the expected of its service life. In the case of manufacturing errors causing the implementation of an element with a concrete cover that does not meet the standard requirements for thickness and tightness, it is recommended to use protective coatings to increase the element’s durability to the designed level.

1. Introduction

In Europe’s post-war years (and until the mid-1980s in Poland), large panel system-building was a widespread form of construction due to extensive war damage and the need to quickly and efficiently erect new residential buildings [1,2]. A characteristic feature of this method is the manufacture of load-bearing elements in prefabrication plants, which are then transport and assembled on the construction site. With years, other production systems were introduced and the existing systems were modified by the so-called “houses factories”. The adopted production model assumed shortening the time of building erection [3]. The finished construction elements were also expected to be of high quality from the prefabrication plants owing to the controlled manufacturing conditions, as opposed to those on the construction site. It thus seems natural to assume that precast elements were manufactured according to all design assumptions made in relation to, among others:
  • The geometry of the element;
  • Reinforcement distribution;
  • Concrete cover parameters.
The thickness of concrete cover is emphasized in this paper as one of the key factors determining the durability of reinforced concrete structural elements susceptible to the aggressive influence of the external environment, especially in the context of the corrosion risk of reinforcement [4,5]. This thickness determines the speed of penetration of aggressive substances deep into the reinforced concrete element, which results in damage to the passive layer on the bars and initiation of reinforcement corrosion processes. Manufacturing errors involving insufficient concrete cover decrease its protective function and thus affects the durability of the element or leads to its failure [6].
This issue is important as the existing buildings were built in the 80s with a design life of 50 years, according to structural class S4 as per Eurocode 2 PN-EN-1992-1-1. Particular attention should be drawn to the errors made in prefabrication plants. A considerable pace of work at that time often resulted, among others, in the failure to maintain the reinforcement cover thickness of the structural elements and, consequently, during the service life, which contributed to reinforcement corrosion. The problem is all the more important now since a significant revival in production of precast elements has been observed in recent years, partly as a result of their growing export potential (e.g., to the Scandinavian countries) and domestic demand. Considering the high level of technological advancement, the quality of components produced in prefabrication plants should also be high. Unfortunately, this is not always the case, as shown by the research on precast elements described in [7,8,9,10]. Significant deviations in the distribution of the reinforcement and thickness of concrete cover were found in these tested elements. In order not to duplicate errors from previous years, special attention should be paid to the quality of element manufacture and production control consisting not only of checking the general geometry of precast elements or quality control used in production materials (concrete or steel), but also to correct the reinforcement arrangement, especially during the concreting process.
In addition (due to production costs incurred, as well as to minimize waste), it is worth taking remedial measures to increase the durability parameters of incorrectly made elements. For this purpose, protective coatings [6] can be used, which improve the desired parameters of the element to be used in accordance with the design objectives. It is important to choose the right type of protective coating depending on both the type of aggressive environmental factor acting on the damaged element and the type of element itself [11,12,13].
The aim of this paper is to assess the corrosion risk of reinforcement in the loggia wall made in the large-panel system after 25 years of service life, i.e., in the middle of the planned period of use. The research included the inventory of reinforcement, determination of reinforcement corrosion, prediction of corrosion rate, and analysis of the phase composition of the concrete cover.

2. Materials and Methods

The basis of the study was the inventory of the loggia wall of a residential building constructed in the 90s according to the W-70/MK system. A visual inspection of the wall constituting the support of floor slabs in the loggia revealed numerous cracks and a loosening of the concrete cover, probably due to the corrosion of the reinforcement (Figure 1).
The precast walls of the inventory loggia were made of concrete of the planned class B17.5 [14]. During the inventory, approximate values of the actual compressive strength of the concrete were determined based on sclerometric tests performed at six points. Tests were carried out using the N-type Schmidt hammer (Figure 2c). The results were presented in the form of an estimated concrete compressive strength in Table 1.
Based on the obtained concrete strength, the concrete class was determined as C25/30 (B30) [15]. It is higher than the assumed design class.
The analysis of archival technical documentation as well as reinforcement inventory (ribbing on bars) allowed to determine the reinforcing steel grade. It was found that the longitudinal reinforcement was made of 18G2 steel, while the transverse reinforcement was made of ST3SX steel. Table 2 shows the chemical composition and yield stress of the indicated steel types.
The analysis of the reinforcement corrosion risk in the wall was based on the measurements with the semi-destructive electrochemical method using the GP-5000 GalvaPulseTM diagnostic device (Germann Instruments A/S, Copenhagen, Denmark) (Figure 2a) and on the phase composition of the concrete sample taken from the concrete cover. In addition, the actual reinforcement distribution was determined and the thickness of the cover was estimated using the Ferroscan PS200 (Hilti Poland Sp. z o.o., Warsaw, Poland) (Figure 2b).
Figure 3 shows the geometry of the tested wall with the marked points in which measurements were made during the tests, the crack, and concrete loss patterns. In addition, the “×” symbol indicates the areas where the concrete cover detached.

2.1. Measurements of the Reinforcement Distribution and the Concrete Cover Thickness

One of the stages in the assessment of the condition of the diagnosed loggia reinforced concrete wall involved determining the distribution of reinforcement and the level of its covering. For this purpose, a non-invasive diagnostic device Ferroscan PS200 (Figure 2b) was used. It operates on the principle of electromagnetic induction and eddy currents. Transceiver coils generate an electromagnetic field, which upon encountering a ferromagnetic element, causes eddy currents in it, as a result of which the magnetic field appearing in it generates the induction current in the coil. Then there is a change in the magnetic field of the coil itself and the reinforcement in the reinforced concrete elements is detected. The test consists in marking on the surface of the element measuring fields with dimensions of 0.60 m × 0.60 m divided into 8 paths (4 vertical and 4 horizontal) with widths of 0.15 m, after which subsequent measuring passes were performed (Figure 3b). One test can be performed in a total of 9 such fields. The effective detection range of the device is about 0.10 m from the surface of tested element. It should be noted that the measurement error of both the thickness of the cover and the diameter of the detected reinforcement varies within ±2 mm, and thus, to accurately determine the reinforcement diameter, it is also recommended to make a local opencast [18,19,20].

2.2. The Reinforcement Corrosion Test

The evaluation of the corrosion risk of the reinforcement loggia wall performed using electrochemical polarization, the galvanostatic pulse method [21,22,23]. This is an alternative measurement method to the more commonly used half-cell potential measurements [24]. The usually used potential mapping technique, measuring half-cell potential on concrete surface sometimes led to misinterpretation especially in structures placed in wet and anaerobic environment [25,26,27]. For this reason the galvanostatic pulse technique has been introduced [25,26,27,28]. Both electrochemical methods assume that corrosion of reinforcement in concrete is an electrochemical process in which a steel reinforcing bar is an electrode and the alkaline liquid filling the pores of the concrete is an electrolyte. Local anode and cathode formed on the surface of the bar generate the flow of electric charge through electricity, while the liquid filling the pores of the concrete is the carrier of ions. In the galvanostatic pulse method, the short-time anodic current pulse is impressed galvanostatically, which leads to a polarization of reinforcement and allows one to measure certain electrical quantities, i.e., reinforcement stationary potential (Est), corrosion current density (icor), and concrete cover resistivity (Θ). The obtained values, after comparing them with the criterion values (Table 3), allow the assessment of the degree of reinforcement corrosion in concrete. The corrosion current density measurements are the most reliable. Other values such as the reinforcement stationary potential and the concrete cover resistance give only estimated results and they are not as important as when measured in accordance with [24,29].
It should be remembered that the criteria presented in Table 3 are appropriate for measurements made using the galvanostatic pulse method and other reference criteria are applied when a different measurement technique is used.
One of the few devices available on the market for the simultaneous measurement of three electrical quantities stationary potential of reinforcement (Est), concrete cover resistivity (Θ), and the corrosion current density (icor) is the GP-5000 GalvaPulseTM set (Figure 2a) [30,31,32,33]. The advantage of using the GalvaPulseTM device (compared to devices used in half-cell potential measurements) is the relatively short measurement time, which is usually no more than a few seconds at one point.

2.3. Test of the Concrete Phase Composition

Material tests were carried out using the X-ray diffraction method (XRD). A part of concrete removed near the measuring point (1,12) was obtained for testing. In order to perform the test, the sample was ground. The aggregate was separated from it at the same time. The obtained material, with a grain size less than 0.065 mm was tested in a PANalytical Empyrean X-ray diffractometer. The tests were carried out using a Cu lamp in the range of angles—2Θ, from 5° to 55°.

3. Results and Analysis

3.1. Analysis of the Reinforcement Distribution and the Concrete Cover Thickness

All tests (including those related to the detection and assessment of reinforcement corrosion) were carried out on a fragment of the reinforcement concrete wall shown in Figure 3b. The actual reinforcement distribution and cover thickness (cnom) measurements are presented in the indicated characteristic points selected on the basis of the corrosion activity measurements presented in the further part of the paper.
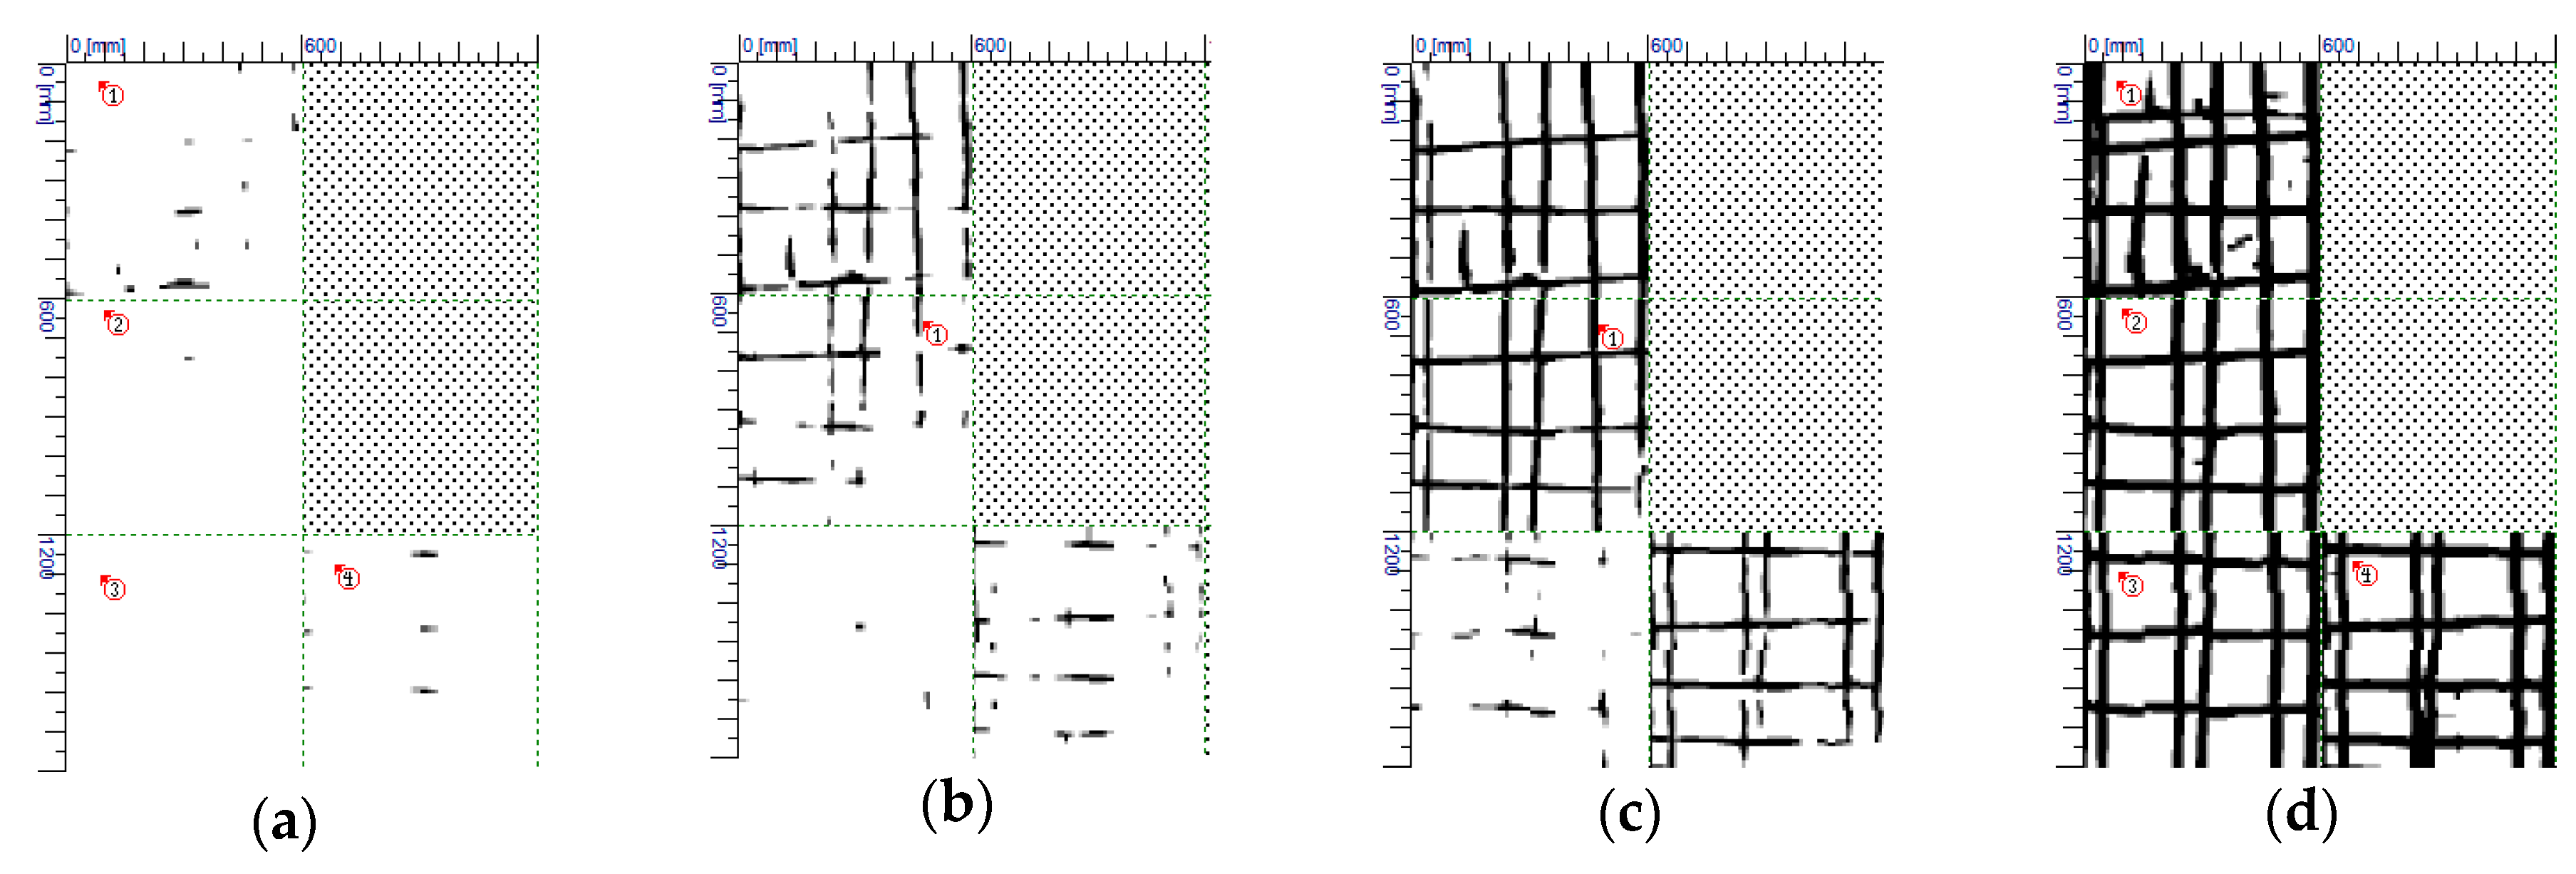
Figure 4 presents examples of maps of the reinforcement distribution obtained from the analysis of the Ferroscan PS200 data. For this purpose, the PS200 Software (Version 5.4.2.1:2008) was used. It was calibrated on the basis of inventoried diameters of longitudinal and transverse reinforcements, determined on the basis of the concrete cover at the level of 18 mm (vertical reinforcement) and 6 mm (horizontal reinforcement).
The scans reveal the failure to maintain the assumed thickness of concrete cover and non-parallel reinforcement trajectories. The deviations of the reinforcement cover were significant as according to Figure 4, at the level of 1–11 mm (almost on the surface of the element), reinforcement fragments are visible. At the level of 5–15 mm a certain reinforcement mesh in the upper zone can be observed and practically most of the bars are visible at the level of 10–20 mm. The indicated level of cover can be unquestionably considered insufficient, especially for elements designed in accordance with exposure class XC4 or XF1, i.e., elements exposed to periodic wetting and drying or frost [15,17]. For them the minimum recommended thickness of concrete cover is 30 mm [17]. The determined cover thickness also did not meet the requirements in force at the time when the elements were designed, i.e., 25 mm for environment G/C.4.w.1a (according to the Polish standards PN-84/B-03264 [14] and PN-80/B-01800) [34]. Failure to maintain the required thickness of cover markedly contributed to concrete damage as a result of steel reinforcement corrosion processes (Figure 1). A summary of the cover levels determined at points C1–C11 (Figure 3a,b) is shown in Table 4.
The presented results of the reinforcement concrete cover measurements show a technological regime failure. This negligence caused a significant reduction in the thickness of cover, in extreme cases by 20 mm (80%), compared to that assumed in accordance with the previous standard [14] and even by 25 mm (83%) in accordance with the current requirements [17], increasing the risk of reinforcement corrosion.

3.2. The Reinforcement Corrosion Test Analysis

The visible detachments of the concrete cover layer allowed without the additional removal of concrete, the determination of the main reinforcement bar’s position in the loggia wall’s Y direction. The research area was determined on this basis. It comprised of three reinforcing bars along which 20 measuring points were placed on the concrete surface directly above each bar at intervals of ~100 mm (Figure 3a and Figure 5). In total, 60 measurement points were marked in accordance with the adopted coordinate system from (1,1) to (3,20). However, at 9 points located on bar 1 (i.e., the bar nearest to the outside wall of the loggia) the measurements could not be done due to the detachment of the concrete cover (Figure 1 and Figure 3c).
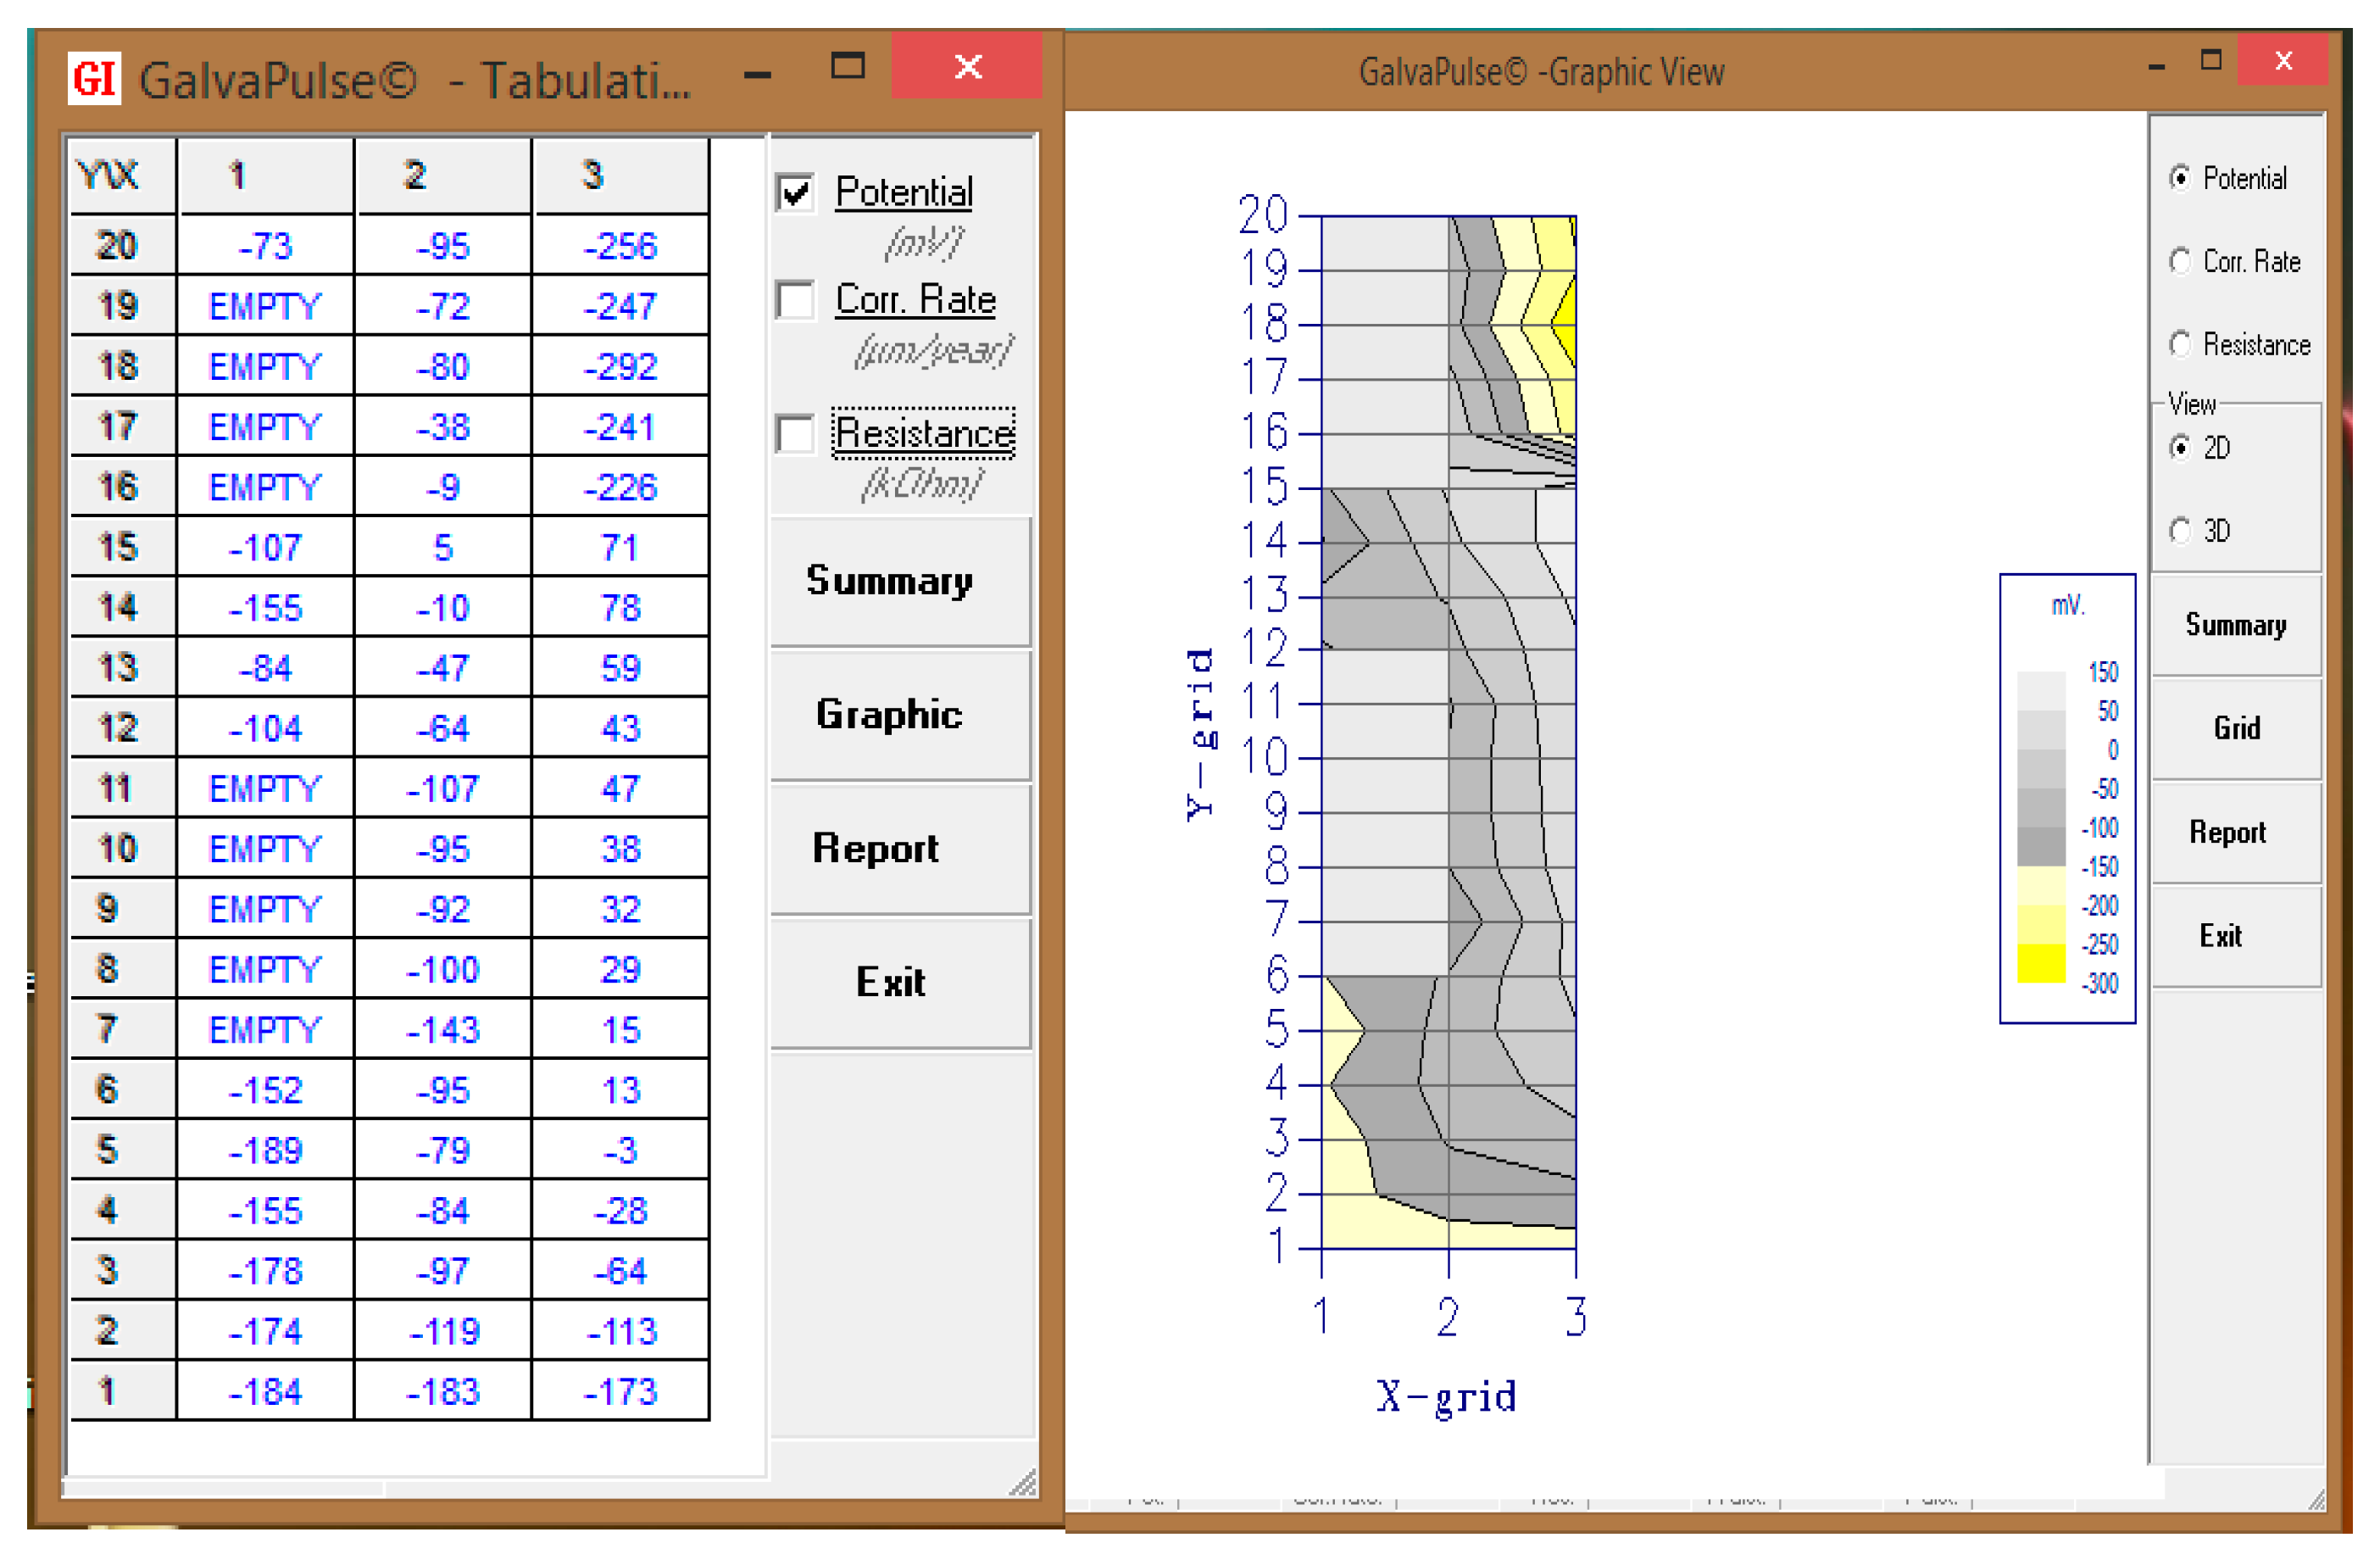
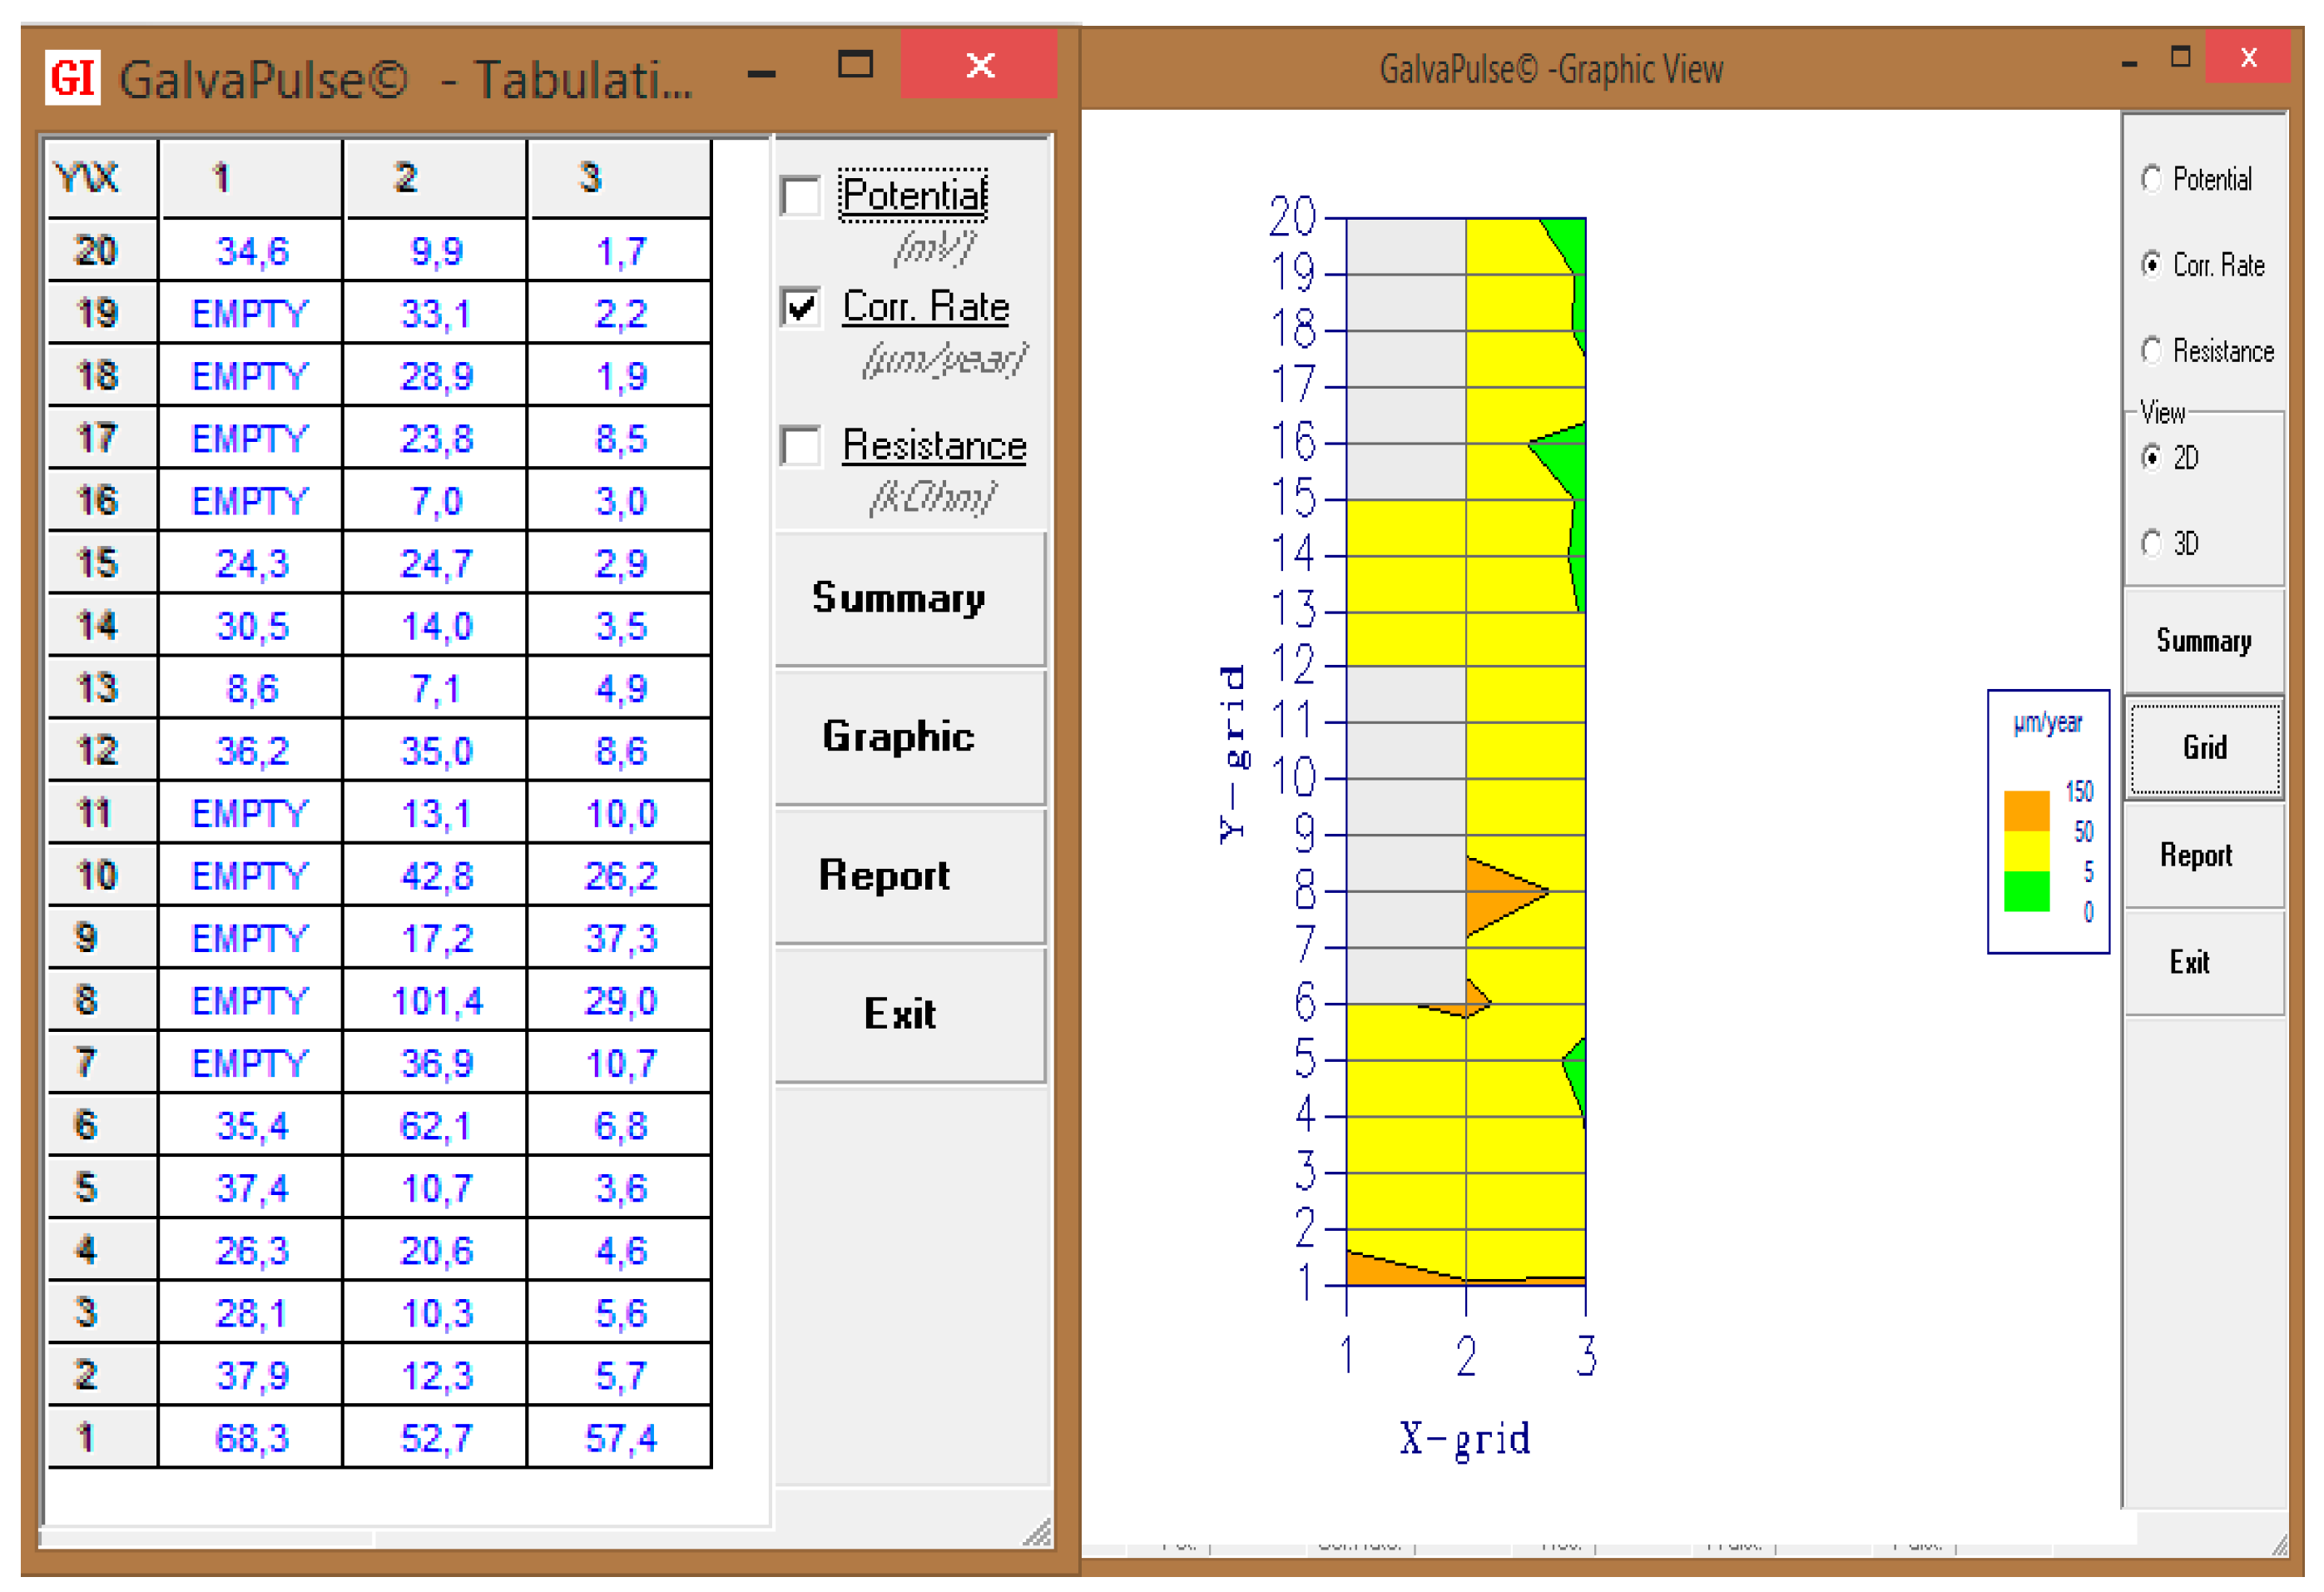
The results of all three parameters measurements, i.e., the stationary potential of reinforcement (Est), the concrete cover resistivity (Θ), and the corrosion current density (icor) performed with the GP-5000 GalvaPulseTM device, are presented in separate tables generated by the GalvaPulse software with graphical maps of their distribution values (Figure 5, Figure 6 and Figure 7). Instead of the density of the corrosion current, the values of the corrosion rate [m·year−1] have been given (automatically recalculated in the program). The above data obtained from 51 measurement points (after eliminating 9 points in which the measurement was impossible due to the lack of concrete cover) were analyzed based on the criteria set out in Table 3. Data analysis determined the probability of reinforcement corrosion in the studied area on the basis on the reinforcement stationary potential and the concrete cover resistivity. The rate of corrosion of the tested bars was estimated based on the corrosion current density.
Analysis of the value of reinforcement stationary potential showed that in most of the studied area (results from 46 points), the probability of reinforcement corrosion was 5%. However, at 5 points ((3,16), (3,17), (3,18), (3,19), and (3,20)) located above bar No. 3 in the central part of the loggia wall, the values of this parameter were smaller than Est = −200 mV, which indicated a 50% probability of reinforcement corrosion in this area (Figure 5).
The results of the corrosion current density at 27 points located mainly above bars No. 2 and No. 3 did not exceed icor = 2µA·cm−2, which indicates unpredicted or irrelevant corrosion activity of the tested reinforcement. At 21 points (distributed over all three bars), the measured corrosion current density was within the range icor = 2 ÷ 5 µA·cm−2, indicating low corrosive reinforcement activity. However at 3 points above bar No. 1, the corrosion current density was in the range icor = 5 ÷ 15 µA·cm−2, which indicates moderate corrosion activity of this bar and the predicted rate of corrosion was estimated at 68.3 μm·year−1 (Figure 6).
Resistance measurements of concrete cover at 9 points above bar No. 3 (more or less in the middle of the loggia wall height) were in the range Θ = 10 ÷ 20 kΩ·cm, thus showing the average probability of reinforcement corrosion in this area, but in all other points the values of this parameter were lower than Θ = 10 kΩ·cm, indicating a high probability of corrosion (Figure 7).

3.3. The Analysis of the Concrete Phase Composition

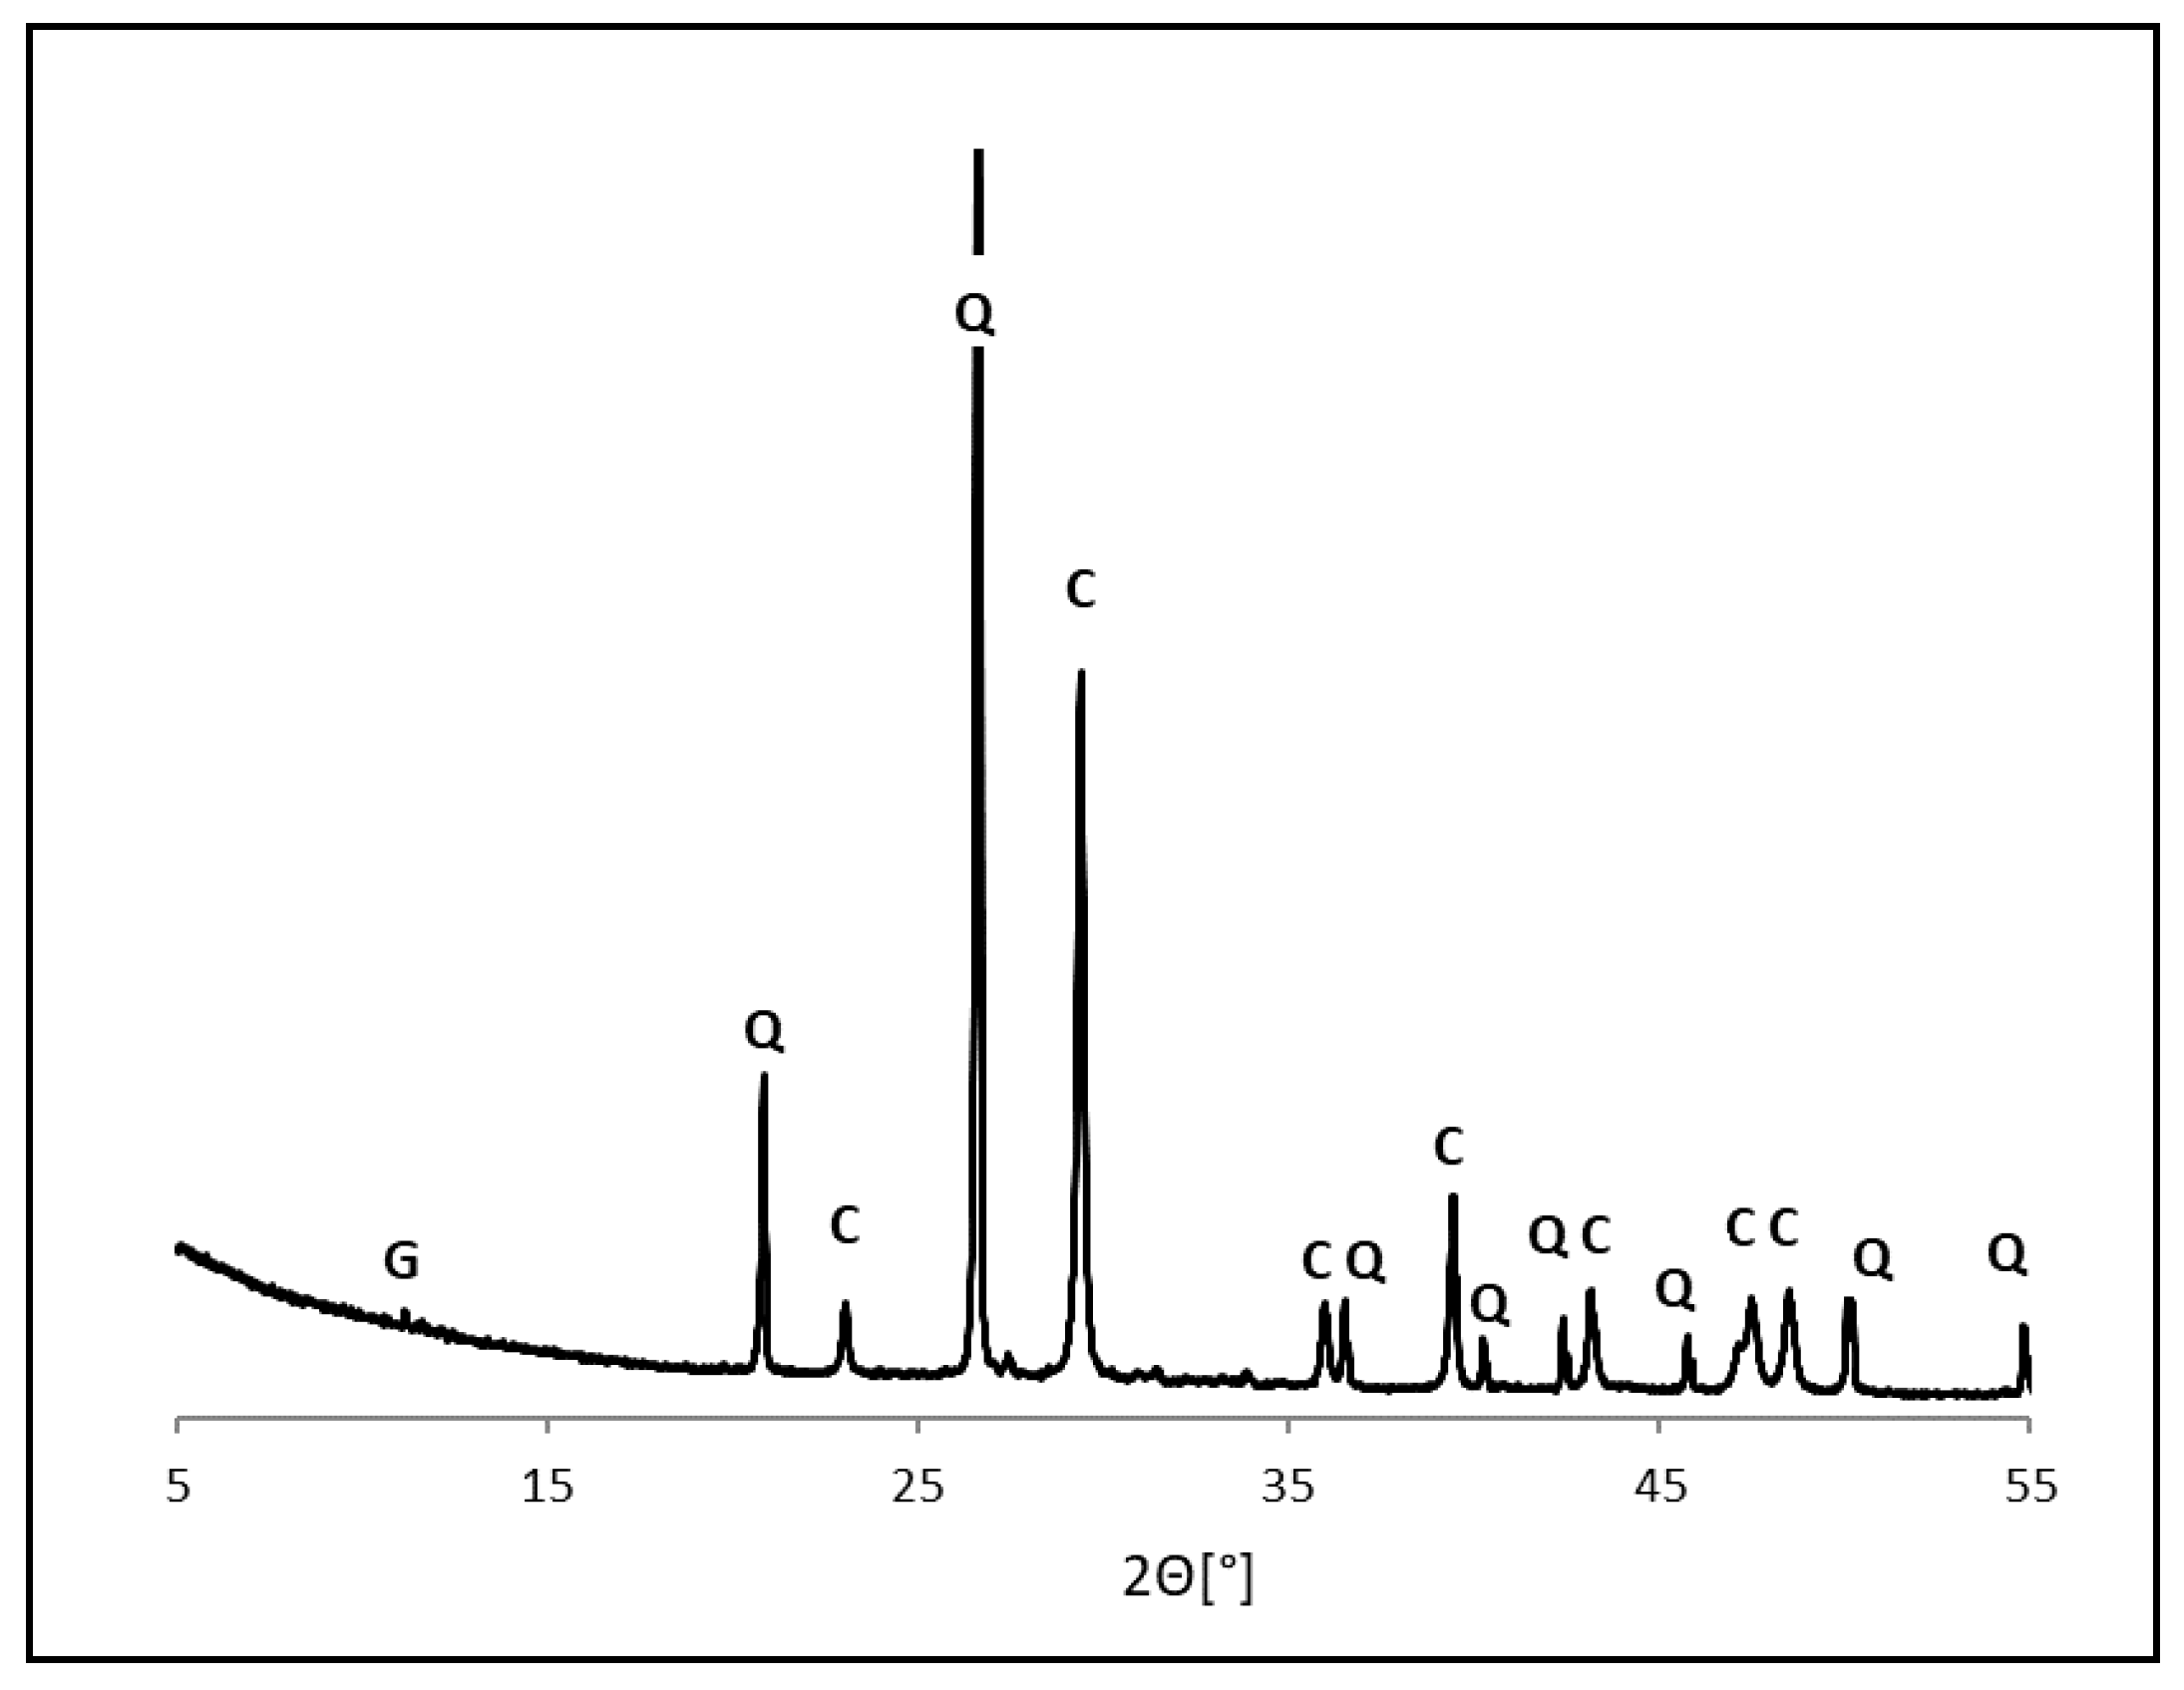
The analysis of the phase composition of the concrete sample were carried out in order to determine the chemical composition of the damaged concrete cover and to identify the causes of reinforcing steel corrosion. The results of this analysis are shown in Figure 8. The dominance of reflections originating from aggregate (which probably could not be separated to a sufficient precision), i.e., quartz and calcite and weak reflections from feldspars, were observed. The presence of calcite may be the result of the reaction between portlandite and carbon dioxide in the carbonation process. The carbonation process can also be demonstrated by the absence of reflections from portlandite on X-ray images. Transitional products generated in the carbonation process were not observed. In addition, the gypsum reflex may indicate sulphate corrosion. The gypsum could also be a component of admixtures used during the manufacturing of the precast element from which a concrete sample was taken [35,36].

4. Summary and Conclusions

The test results analysis indicated that the production errors (mainly significant deviations in the cover thickness in relation to the design data) were the direct cause of damage in the precast loggia wall. Differences in the thickness in a less safe direction of up to 15 mm were probably the main cause of the loggia wall damage in the residential building, which was the place especially exposed to variable environment conditions. The largest damages occurred along bar No. 1, located closest to the outer edge of the loggia and in the layer at the bottom of the slab, i.e., in the areas of the greatest impact of negative external environment factors such as the action of carbon dioxide or moisture and temperature changes, including freezing and thawing cycles in winter. Laboratory tests revealed full carbonation in the analyzed fragment of concrete cover at bar No. 1 which probably initiated in reinforcement corrosion, gradual increase of corrosion products, and partial removal of the concrete cover. Electrochemical measurements confirmed the highest corrosion activity in the reinforcement along bar No. 1 and the resistivity measurements of the concrete cover indicated the highest probability of reinforcement corrosion in this area. The values of stationary reinforcement potential were less consistent with the above results. This indicated the need for the comprehensive tests and the use of different testing methods to verify the results. In addition, the precast concrete elements were often made in specific conditions, as the gypsum compounds were used to accelerate mix setting which may indicate sulphate corrosion.
In summary, it should be noted that the regime of manufacturing precast reinforced concrete elements according to the assumed exposure class is very important.
In the case of manufacturing errors causing the implementation of concrete cover that do not meet the standard requirements for thickness and tightness, it is recommended to use appropriate protective coatings to obtain an element with parameters that meet the durability design assumptions for the given environmental conditions [6,11].

Author Contributions

Idea, K.B., M.B., and W.R.; methodology, K.B., M.B., W.R., and W.G.; formal analysis, K.B., M.B., W.R., and W.G.; data interpretation, K.B., M.B., W.R., and W.G.; writing, K.B., M.B., and W.R.; editing K.B., M.B., and W.R.; funding acquisition, K.B., M.B., and W.R.

Funding

This research was funded by grant number 02.0.06.00/2.01.01.01. 0007; MNSP. BKWB. 16.001. “Analysis of limit states, durability and diagnostics of structures and methods and tools for quality assurance in construction” [Kielce University of Technology, Kielce, Poland].

Conflicts of Interest

The authors declare no conflict of interest.

References

  1. Beyer, C.; Ortlepp, S.; Naumann, T.; Ortlepp, R. Reinforced concrete roof frames as a typical construction form of the post-war period. Bautechnik 2018, 95, 16–26. [Google Scholar] [CrossRef]
  2. Borodinecs, A.; Zemitis, J.; Dobelis, M.; Kalinka, M.; Geikins, A. Development of Prefabricated Modular Retrofitting Solution for Post-World War II Buildings. In Proceedings of the Environmental Engineering 10th International Conference, Vilnius Gediminas Technical University, Vilnius, Lithuania, 27–28 April 2017. [Google Scholar]
  3. Gu, W.; Zhao, Y.; Zhang, D. The Application of PC Technology in Public Buildings: A Case Study of Security Center. In Proceedings of the Twelfth National Athletics, International Conference on Advances in Energy and Environmental Science (ICAEES), Guangzhou, China, 30–31 July 2013. [Google Scholar]
  4. Segura, I.; Cavalaro, S.; de la Fuente, A.; Aguado, A.; Alegre, V. Service-Life Assessment of Existing Precast Concrete Structure Exposed to Severe Marine Conditions. J. Perform. Constr. Facil. 2016, 30, 1–14. [Google Scholar] [CrossRef]
  5. Melchers, R.E.; Li, C.Q. Reinforcement Corrosion in Concrete Exposed to the North Sea for More Than 60 Years. Corrosion 2009, 65, 554–566. [Google Scholar] [CrossRef]
  6. Saffiuddin, M. Concrete damage in Field Conditions and Protective Sealer and Coating Systems. Coatings 2017, 7, 90. [Google Scholar] [CrossRef]
  7. Tworzewski, P.; Szczecina, M.; Uzarska, I. Numerical Modeling of Reinforced Concrete Beams, Including the Real Position of Reinforcing Bars. Struct. Environ. 2018, 10, 28–38. [Google Scholar]
  8. Tworzewski, P.; Goszczyńska, B. Relation between Reliability and Reinforcement Manufacturing Errors in Reinforced Concrete Beams. Struct. Environ. 2017, 9, 16–24. [Google Scholar]
  9. Tworzewski, P.; Goszczyńska, B. An Application of an Optical Measuring System to Reinforced Concrete Beams Analysis. In Proceedings of the 2016 Prognostics and System Health Management Conference (PHM-Chengdu), Chengdu, China, 19–21 October 2016. [Google Scholar]
  10. Parasonis, J. Quality control with the assurance of normative precision of geometrical parameters in erection of one-storey framed buildings. In Proceedings of the 8th International Conference on Durability of Building Materials and Components (8dbmc), Vancouver, BC, Canada, 30 May–3 June 1999. [Google Scholar]
  11. Li, J.; Ji, Y.; Huang, G.; Zhang, L. Microstructure Evolution of Magnesium Phosphate Protective Layer on Concrete Structures in a Sulfate Environment. Coatings 2018, 8, 140. [Google Scholar] [CrossRef]
  12. Li, G.; Cui, H.; Zhou, J.; Hu, W. Improvements of Nano-TiO2 on the Long-Term Chloride Resistance of Concrete with Polymer Coatings. Coatings 2019, 9, 323. [Google Scholar] [CrossRef]
  13. Climent, M.A.; Carmona, J.; Garces, P. Graphite-Cement Paste: A New Coating of Reinforced Concrete Structural Elements for the Application of Electrochemical Anti-Corrosion Treatments. Coatings 2016, 6, 32. [Google Scholar] [CrossRef]
  14. Concrete, Reinforced Concrete and Prestressed Structures. Static Calculations and Design; PN-84/B-03264; Polish Standardization, Measurement and Quality Committee: Warsaw, Poland, 1986; [Konstrukcje betonowe, żelbetowe i sprężone. Obliczenia statyczne i projektowanie in Polish].
  15. LST, E. PN-EN 206–1 Concrete—Part 1: Specification, Performance, Production and Conformity; British Standards Institution: London, UK, 2002. [Google Scholar]
  16. Steel for Determined Purposes—Steel for Concrete Reinforcement—Grades; PN-89/H-84023/06; Polish Standardization, Measurement and Quality Committee: Warsaw, Poland, 1989; [Stal określonego zastosowania. Stal do zbrojenia betonu. Gatunki. in Polish].
  17. Eurocode 2—Design of Concrete Structures—Part 1-1: General Rules and Rules for Buildings; PN-EN 1992-1-1; European Committee for Standardization: Brussels, Belgium, 2004.
  18. Urbanowicz, D.; Warzocha, M. Wykorzystanie urządzeń ferromagnetycznych w diagnostyce konstrukcji budowlanych. Prz. Bud. 2015, 5, 32–35. [Google Scholar]
  19. De Alcantara, N.P.; Costa, D.C.; Guedes, D.S.; Artori, R.V.; Bastos, P.S. A Non-Destructive Testing Based on Electromagnetic Measurements and Neural Networks for the Inspection of Concrete Structures. Adv. Mater. Res. 2011, 301, 597–602. [Google Scholar] [CrossRef]
  20. Salman, A.A. Non-Destructive Test of Concrete Structures Using: FERROSCAN. Eng. Technol. J. 2011, 29, 2933–2941. [Google Scholar]
  21. Ahmad, S. Reinforcement corrosion in concrete structures, its monitoring and service life prediction—A review. Cem. Concr. Compos. 2003, 25, 459–473. [Google Scholar] [CrossRef]
  22. Poursaee, A.; Hanson, C.M. Galvanostatic pulse technique with the current confinement guard ring: The laboratory and finite element analysis. Corros. Sci. 2008, 50, 2739–2746. [Google Scholar] [CrossRef]
  23. Song, H.W.; Saraswathy, V. Corrosion monitoring of reinforced concrete structures—A review. Int. J. Electrochem. Sci. 2007, 2, 1–28. [Google Scholar]
  24. Standard Test Method for Half-Cell Potentials of Uncoated Reinforcing Steel in Concrete. In American Society of Testing and Materials; ASTM C876–09; ASTM: West Conshohocken, PA, USA, 2009.
  25. Klinghoffer, O. In situ monitoring of reinforcement corrosion by means of electrochemical methods. Nord. Concr. Res. 1995, 1, 1–13. [Google Scholar]
  26. Elsner, B.; Klinghoffer, O.; Frolund, T.; Rislund, E.; Schiegg, Y.; Böhni, H. Assessment of Reinforcement Corrosion by Means of Galvanostatic Pulse Technique. In Proceedings of the International Conference Repair of Concrete Structures Norway, Svolvaer, Norway, 28–30 May 1997. [Google Scholar]
  27. Frølund, T.; Klinghoffer, O.; Poulsen, E. Rebar Corrosion Rate Measurements for Service Life Estimates; ACI Fall Convention: Toronto, ON, Canada, 2000. [Google Scholar]
  28. Vedalakshmi, R.; Balamurugan, L.; Saraswathy, V.; Kim, S.-H.; Ann, K.Y. Reliability of Galvanostatic Pulse Technique in Assessing the Corrosion Rate of Rebar in Concrete Structures: Laboratory vs Field Studies. KSCE J. Civ. Eng. 2010, 14, 867–877. [Google Scholar] [CrossRef]
  29. Standard Test Method for Bulk Electrical Resistivity or Bulk Conductivity of Concrete; ASTM C1876–19; ASTM: West Conshohocken, PA, USA, 2012.
  30. Nikoo, M.; Sadowski, Ł.; Nikoo, M. Prediction of the Corrosion Current Density in Reinforced Concrete Using a Self-Organizing Feature Map. Coatings 2017, 7, 160. [Google Scholar] [CrossRef]
  31. Raczkiewicz, W.; Wójcicki, A. Evaluation of effectiveness of concrete coat as a steel bars protection in the structure—Galvanostatic pulse method. In Proceedings of the 26th International Conference Metallurgy and Materials, Brno, Czech Republic, 24–26 May 2017; pp. 1425–1431. [Google Scholar]
  32. Raczkiewicz, W. Influence of the Air-Entraining Agent in the Concrete Coating on the Reinforcement Corrosion Process in Case of Simultaneous Action of Chlorides and Frost. Adv. Mater. Sci. 2018, 18, 13–19. [Google Scholar] [CrossRef] [Green Version]
  33. Galva Pulse. Available online: http://www.germann.org/TestSystems/GalvaPulse/GalvaPulse.pdf (accessed on 28 September 2019).
  34. Anticorrosive Protection in Construction. Concrete and Reinforced Concrete Structures. Classification and Definition of Environments; PN-80/B-01800; Polish Standardization, Measurement and Quality Committee: Warsaw, Poland, 1981; [Antykorozyjne zabezpieczenia w budownictwie. Konstrukcje betonowe i żelbetowe. Klasyfikacja i określenie środowisk in Polish].
  35. Rasheeduzzafar. Influence of Cement Composition on Concrete Durability. ACI Mater. J. 1992, 89, 574–586. [Google Scholar]
  36. Cement Aggregates Concrete. Available online: https://www.gorazdze.pl/pl/system/files_force/assets/document/c2__korozja_chemiczna_betonu.pdf?download=1 (accessed on 28 September 2019).
Figure 1. The analyzed precast reinforced concrete wall.
Coatings 09 00702 g001
Figure 2. Measuring devices: (a) GP-5000 GalvaPulseTM kit, (b) Ferroscan PS200, and (c) DigiSchmidt.
Coatings 09 00702 g002
Figure 3. Test reinforced concrete wall, measuring areas: (a) GalvaPulse, (b) Ferroscan, and (c) crack pattern.
Coatings 09 00702 g003
Figure 4. Image of reinforcement at depths: (a) 1–11 mm, (b) 5–15 mm, (c) 10–20 mm, and (d) 20–30 mm.
Coatings 09 00702 g004
Figure 5. The results of the measurements of reinforcement stationary potential.
Coatings 09 00702 g005
Figure 6. The results of the corrosion measurements current density converted to the rate of corrosion.
Coatings 09 00702 g006
Figure 7. The results of concrete cover resistivity measurements.
Coatings 09 00702 g007
Figure 8. A diffractogram of a sample of concrete taken from loggia wall near point (1–12). Signs: C—Calcite, Q—Quartz, and G—Gypsum.
Coatings 09 00702 g008
Table 1. Concrete compressive strengths determined from sclerometric tests.
Nrfci,CUBE [MPa]fcm,CUBE [MPa]Standard Deviations [MPa]Coefficient of Variation ϑ [%]
141.839.65.112.90%
233.8
347.1
435.8
534.6
644.3
Table 2. Chemical characteristics and yield stress of reinforcing steel [16].
Steel TypeRe [16] (fyk [17]), [MPa]C [%]Si [%]Mn [%]P [%]S [%]Cu [%]Cr [%]Ni [%]Mo [%]
St3SX240Max 0.22Max 0.07Max 1.10Max 0.05Max 0.50Max 0.30Max 0.30Max 0.30Max 0.10
18G23550.15 ÷ 0.220.20 ÷ 0.551.00 ÷ 1.50Max 0.05Max 0.05Max 0.35Max 0.30Max 0.30Max 0.10
Table 3. Criteria for assessing the degree of reinforcement corrosion risk.
Criteria for Assessing the Degree of Reinforcement Corrosion Risk by Use the Galvanostatic Pulse Method
Reinforcement Corrosion ActivityCorrosion Pace; [mm·year−1]
On the basis of corrosion current densityicor [μA·cm−2]<0.5not forecasted corrosion activity<0.006
0.5 ÷ 2.0irrelevant activity corrosion0.006 ÷ 0.023
2.0 ÷ 5.0low corrosion activity0.023 ÷ 0.058
5.0 ÷ 15.0moderate corrosion activity0.058 ÷ 0.174
>15.0high corrosion activity>0.174
On the basis of reinforcement stationary potentialEst [mV]<−35095% of corrosion probability
−350 ÷ −20050% of corrosion probability
>−2005% of corrosion probability
On the basis of concrete cover resistivityΘ [kΩ⋅cm]≤10high corrosion probability
10 ÷ 20medium corrosion probability
≥20small corrosion probability
Table 4. Determined and standard values of concrete cover.
Measuring PointConcrete Cover [mm]Average Cover [mm]Coefficients of Variation [%]Minimum Standard Concrete Cover by [14] [mm]Required Concrete Cover by [14] [mm]Differences in Concrete Cover [mm]
C157.324.24%2025−20
C26−19
C36−19
C47−18
C56−19
C65−20
C79−16
C810−15
C98−17
C108−17
C1110−15