Preparation of Ni-Doped Li2TiO3 Using an Inorganic Precipitation–Peptization Method


Abstract
:1. Introduction
2. Experimental
2.1. Preparation of Ni-Doped Li2TiO3 Sol
2.2. Preparation of Li2TiO3 Powders
2.3. Characterization
3. Results and Discussion
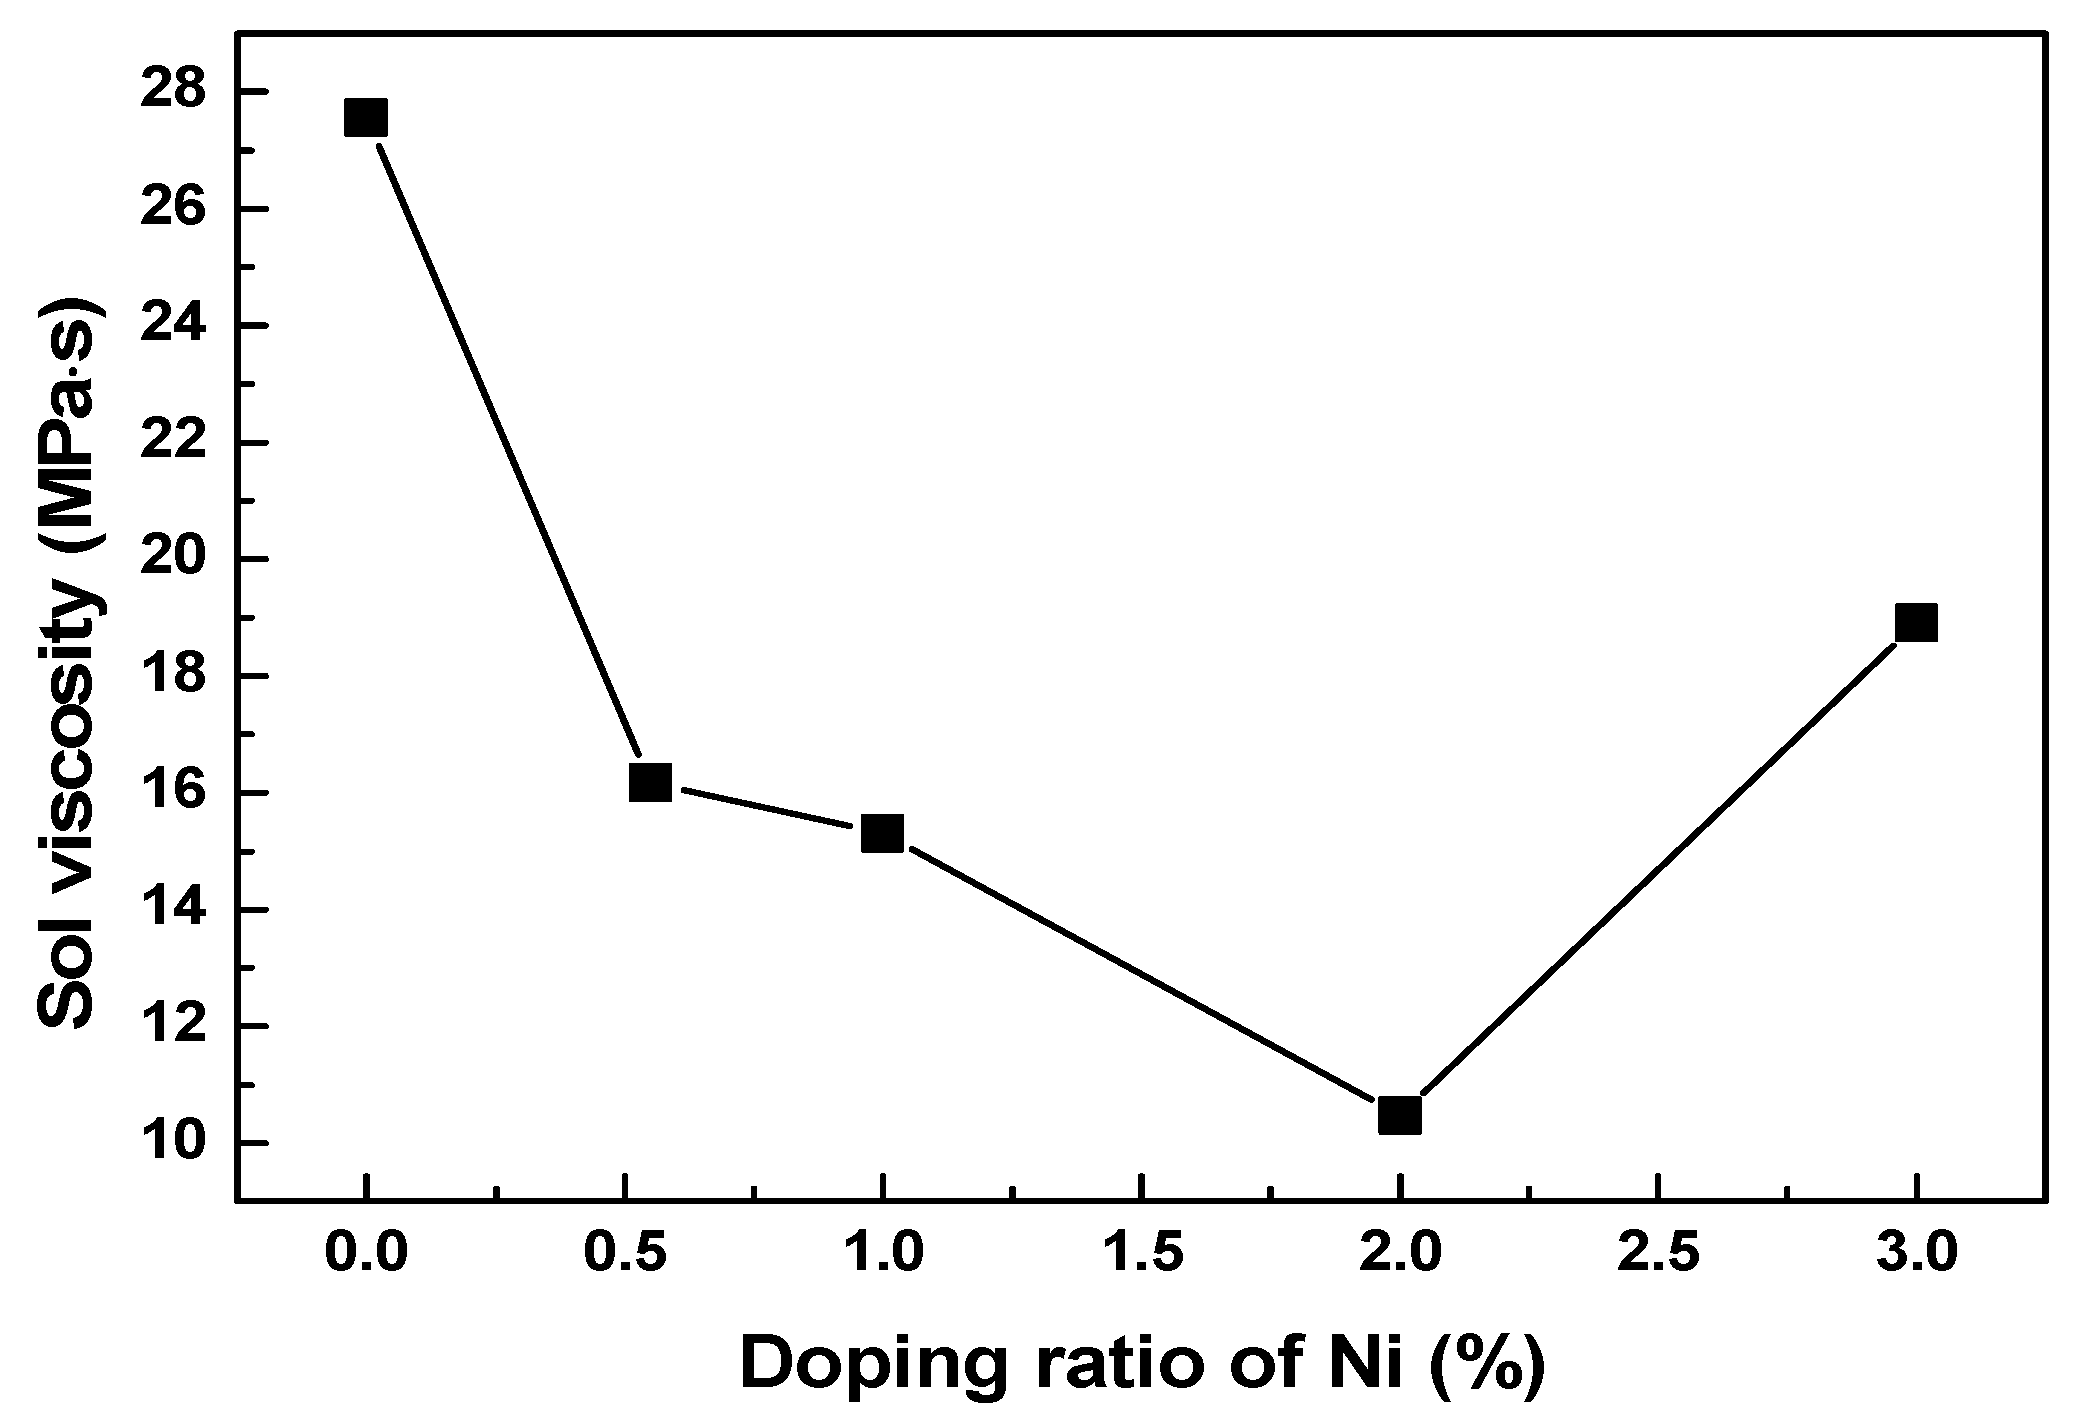
3.1. Viscosity Test
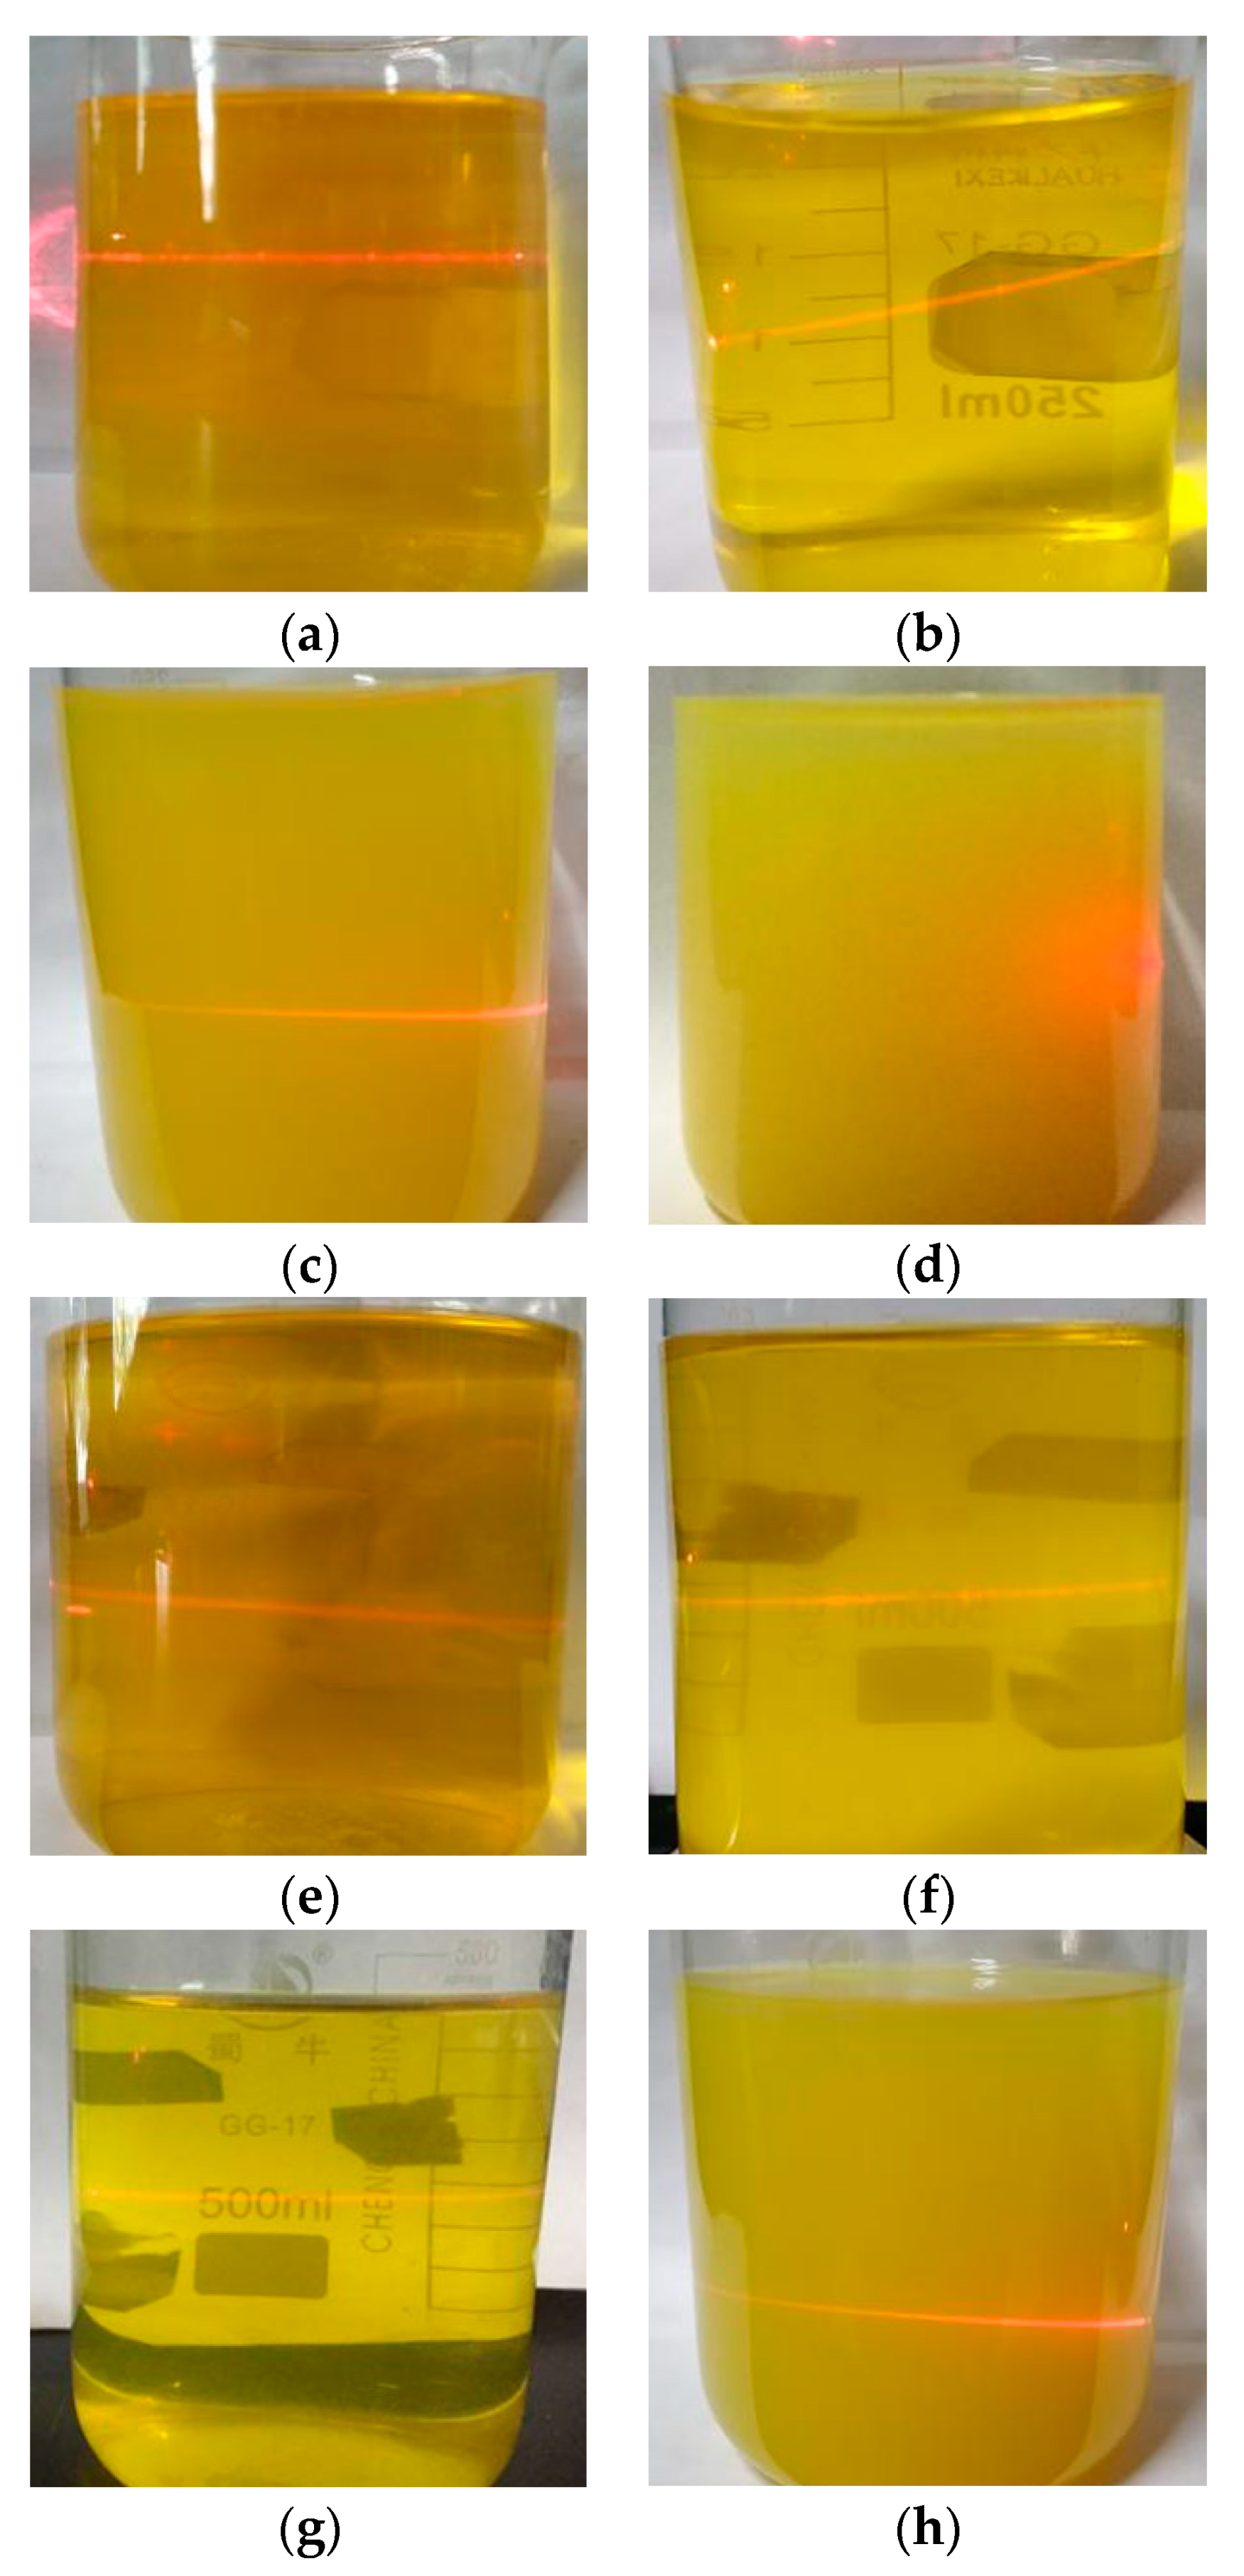
3.2. Performance of the Precursor Sol
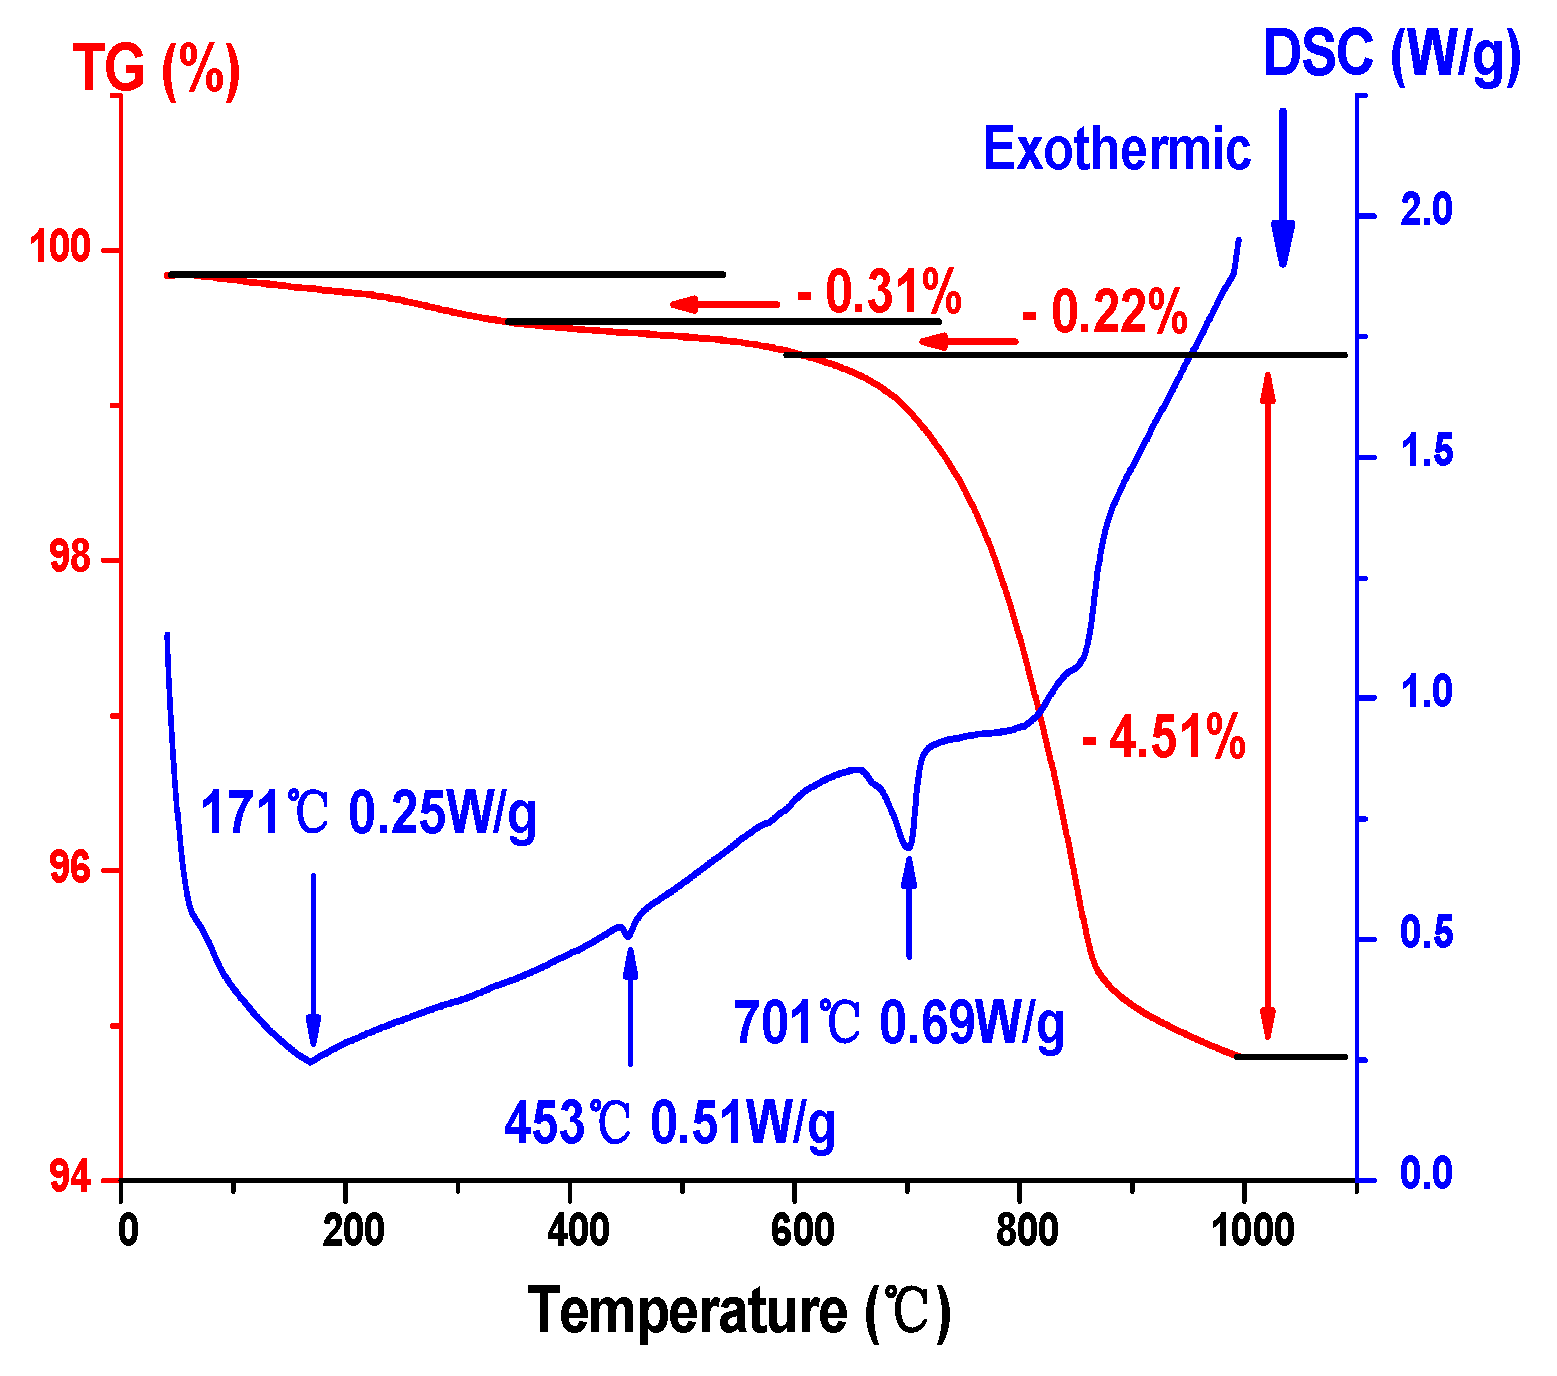
3.3. TG–DSC Analysis
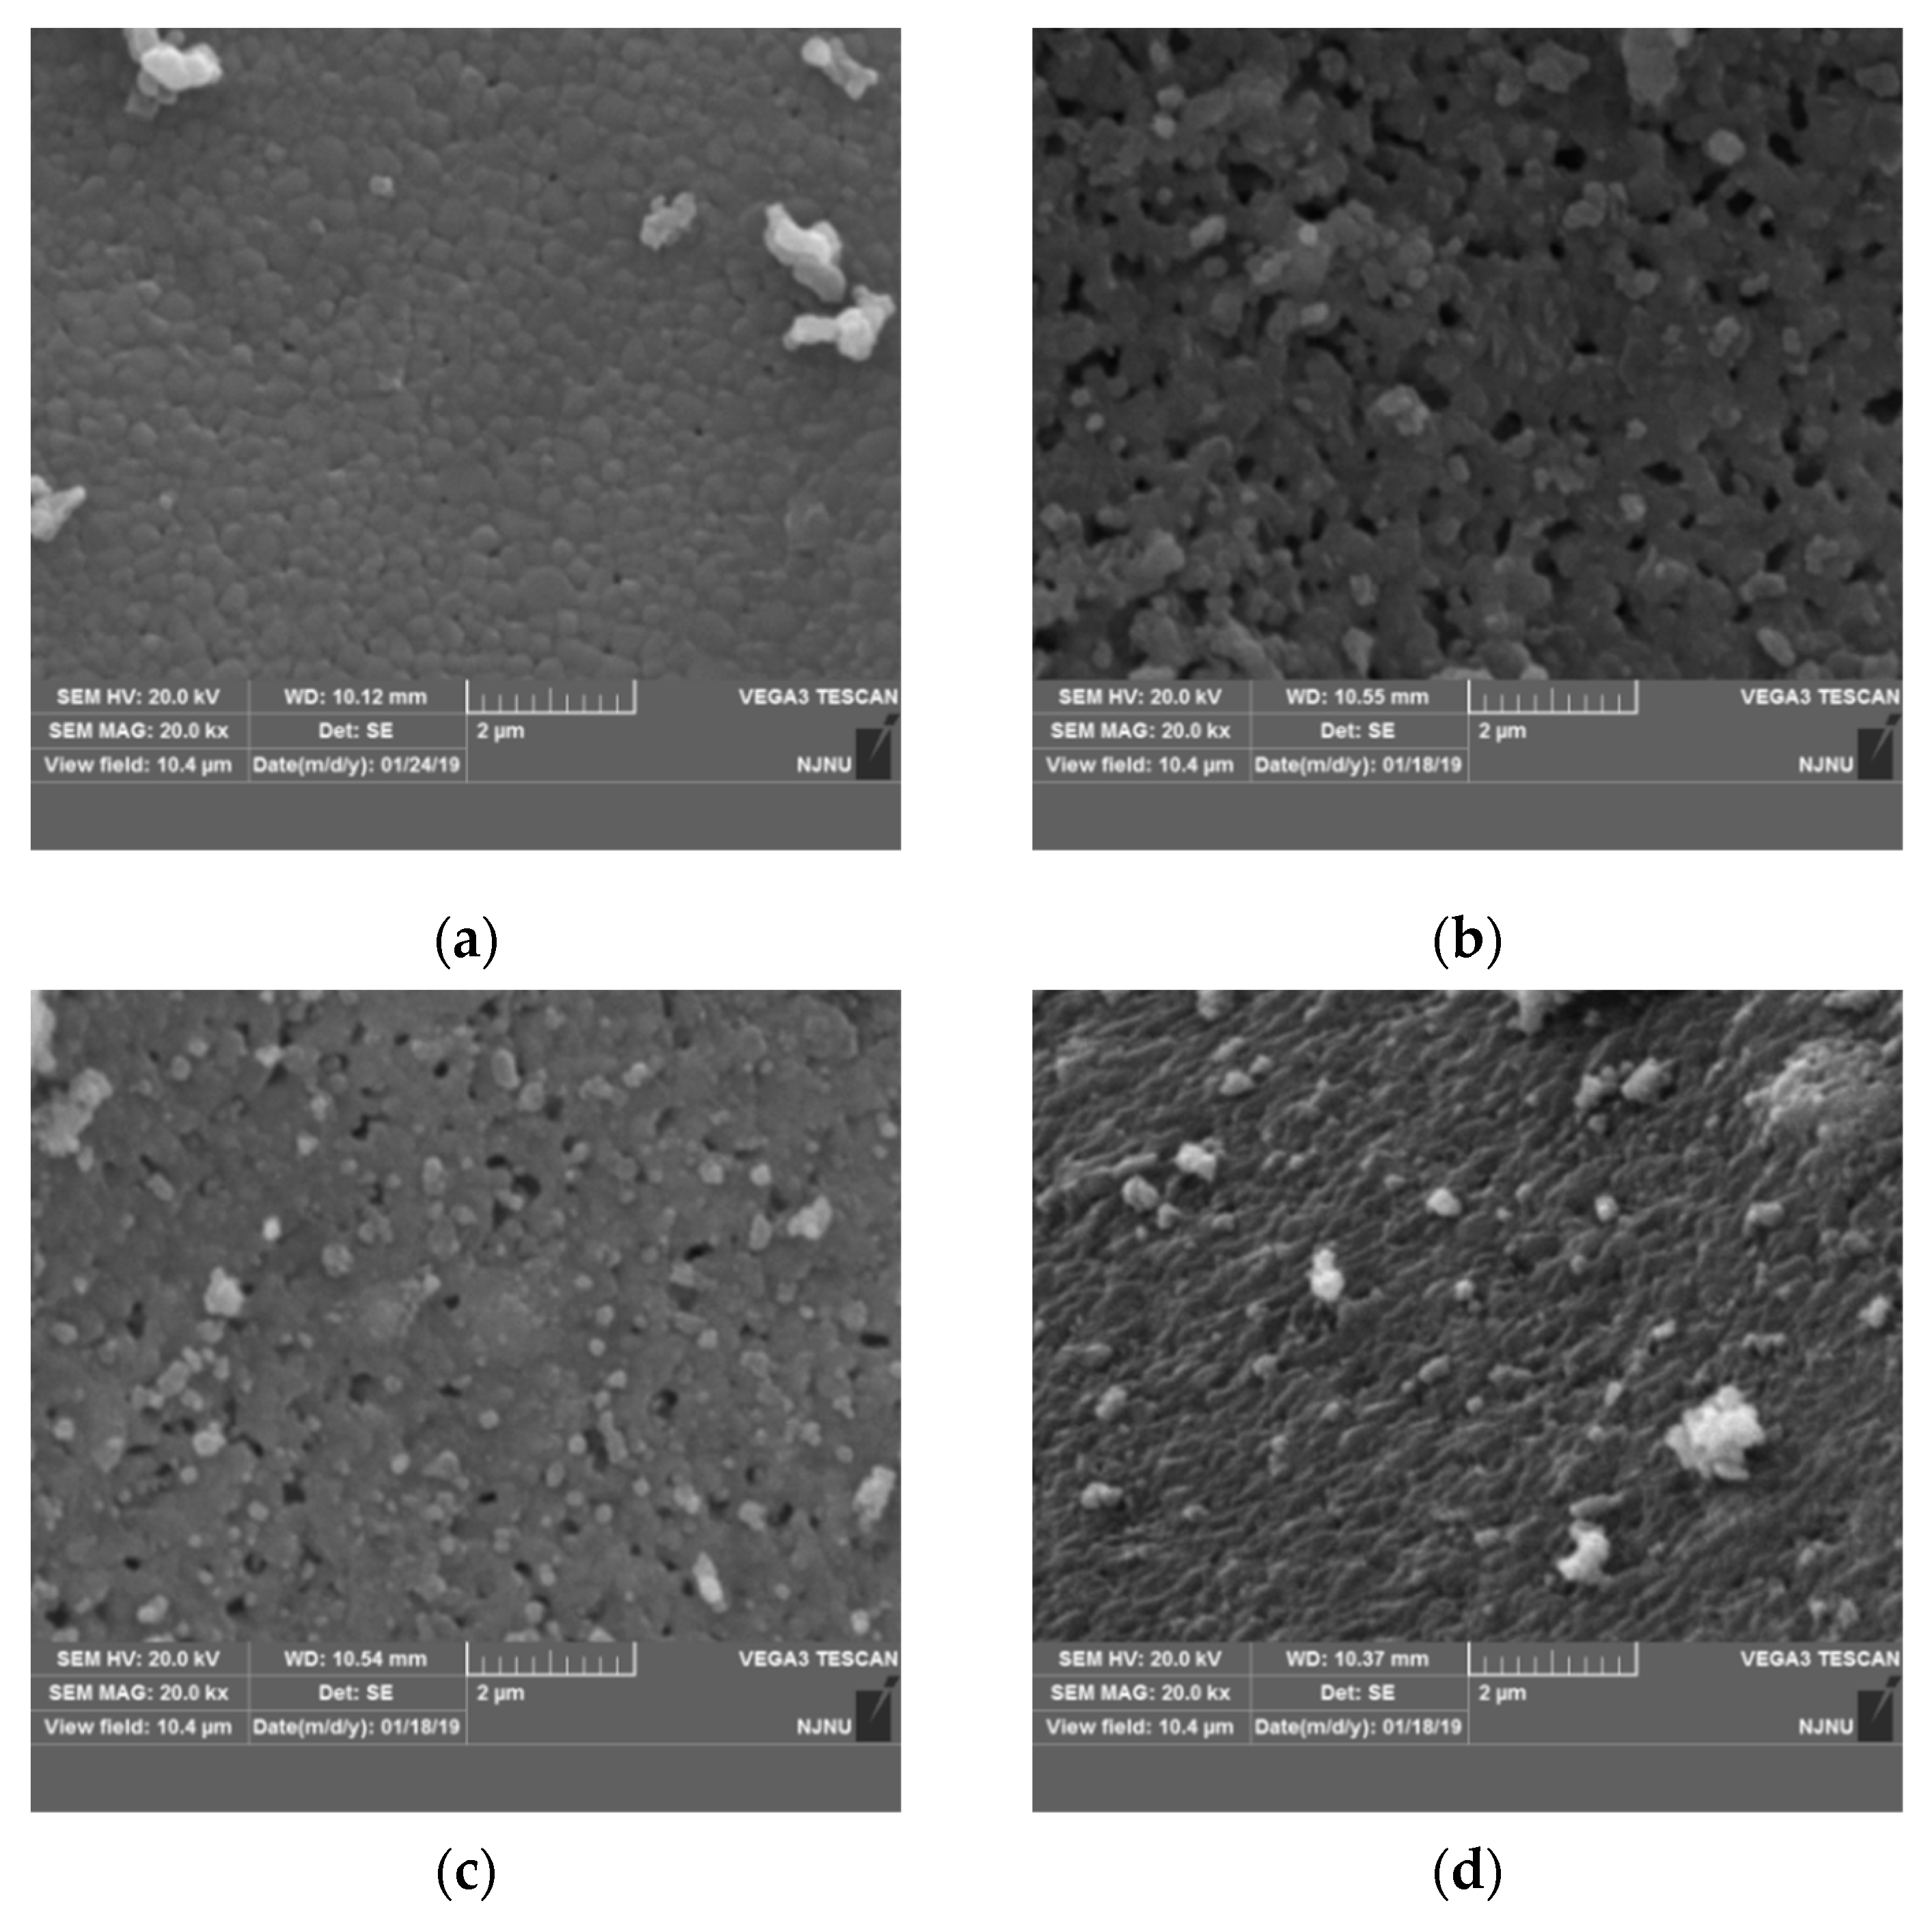
3.4. SEM Analysis
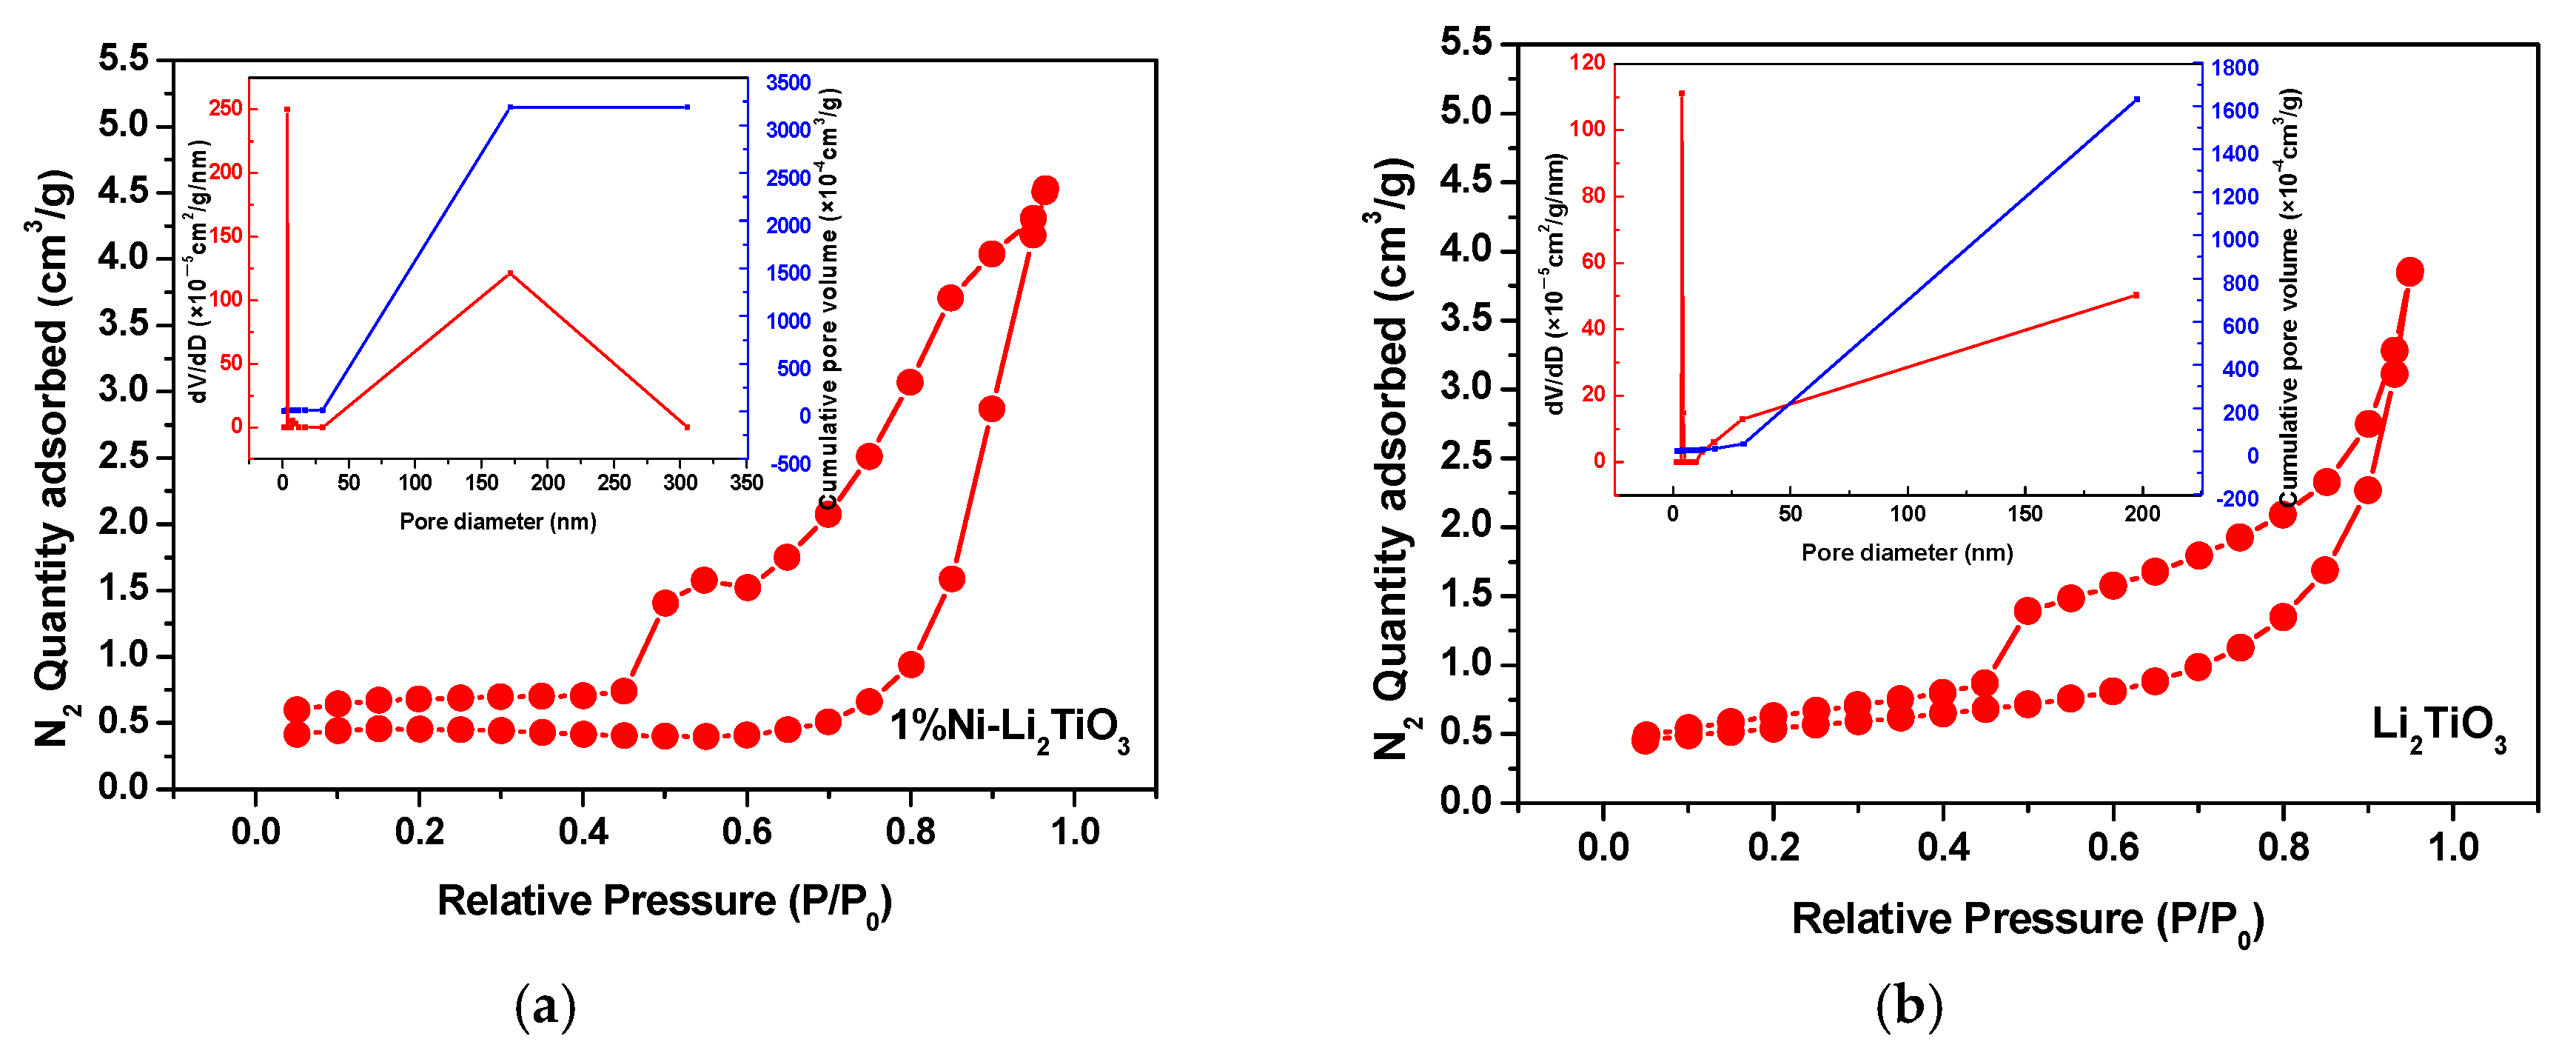
3.5. BET Analysis
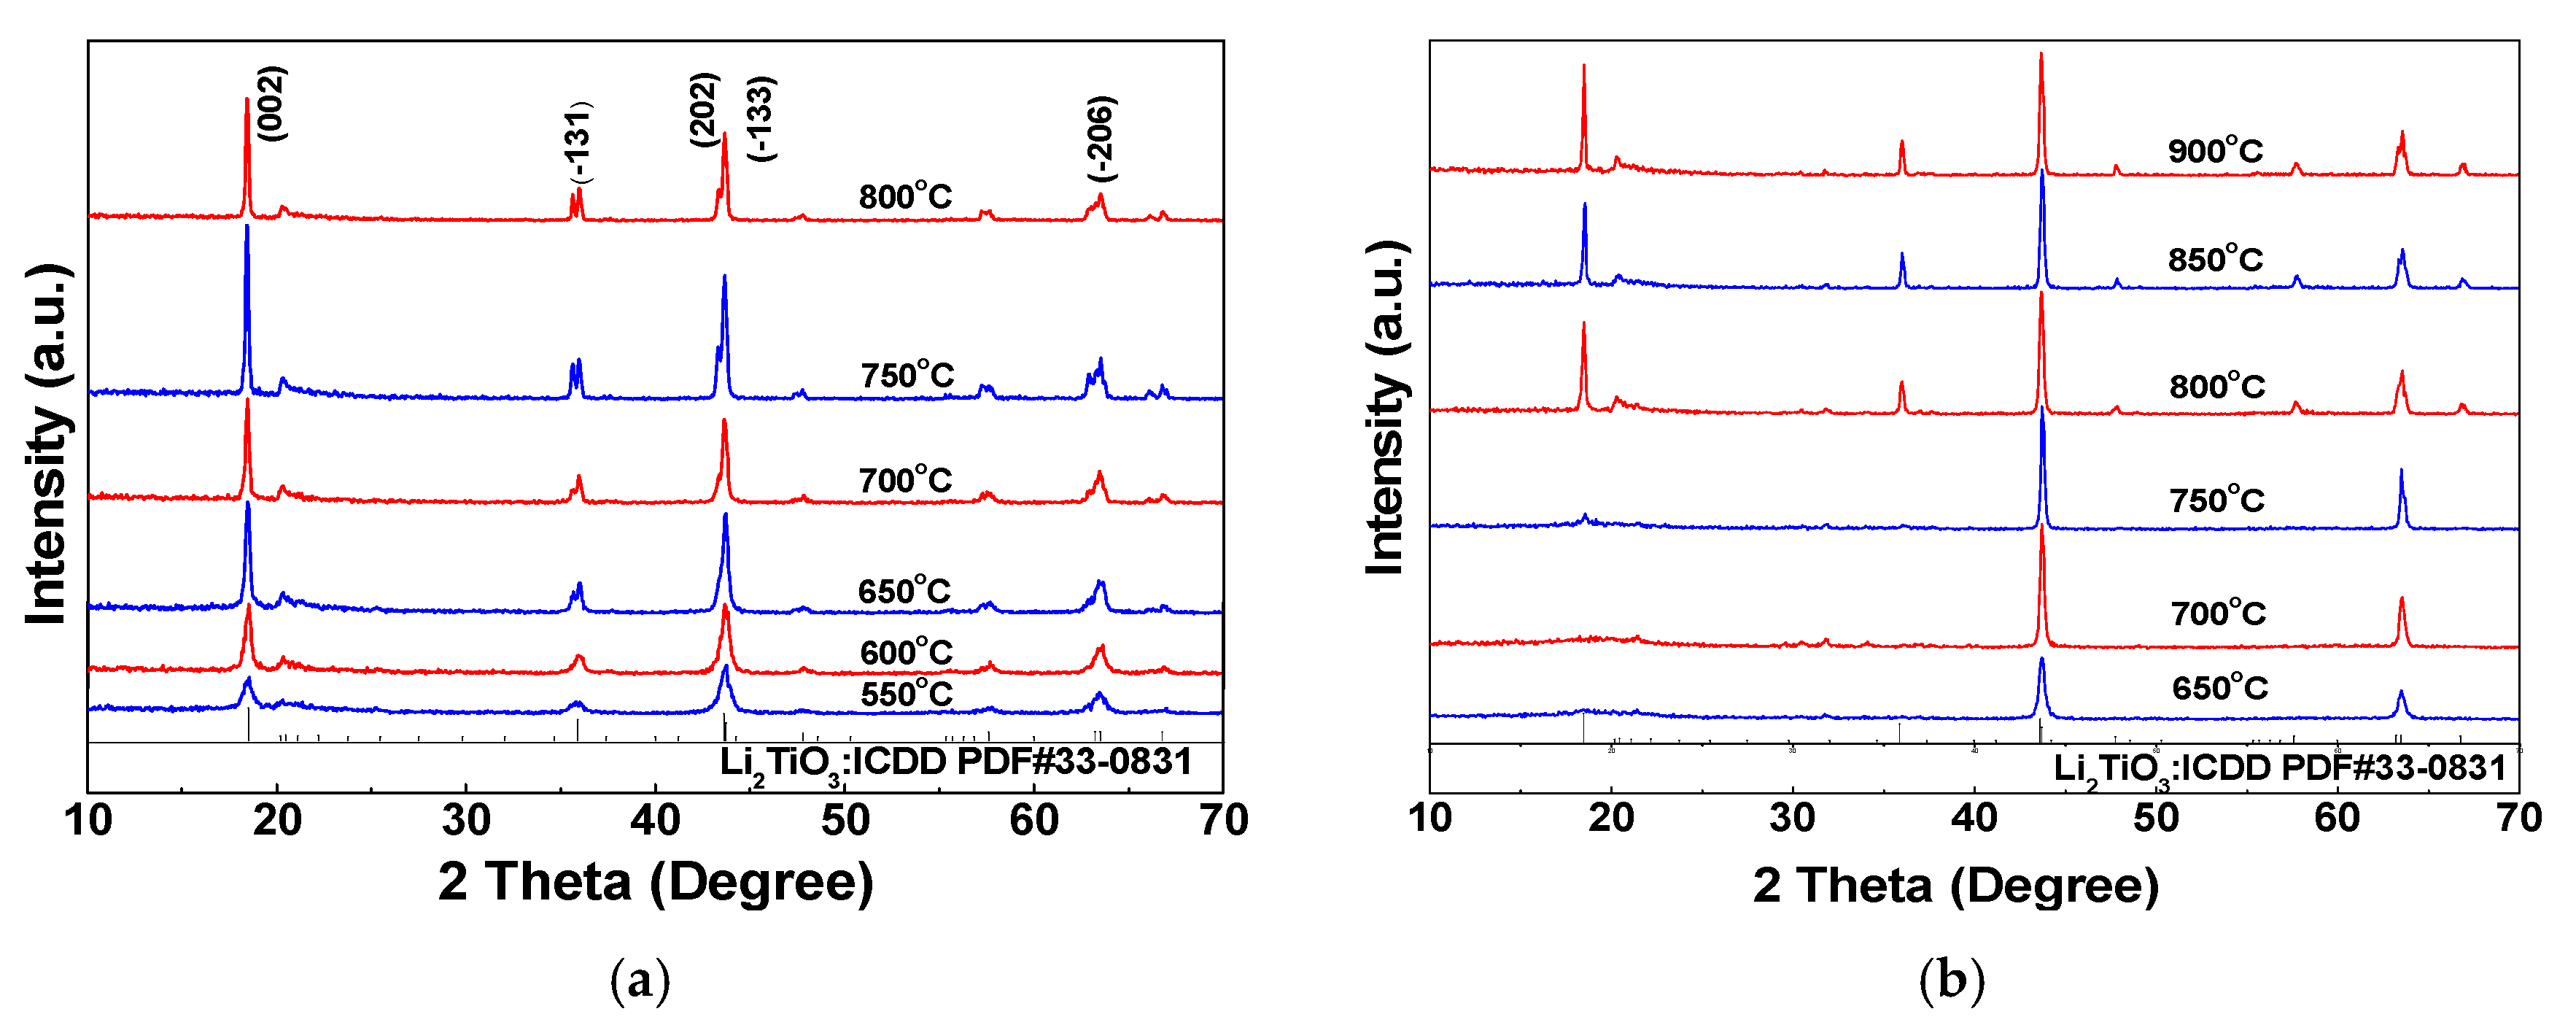
3.6. XRD Analysis
3.7. TEM Analysis
3.8. FT–IR Analysis
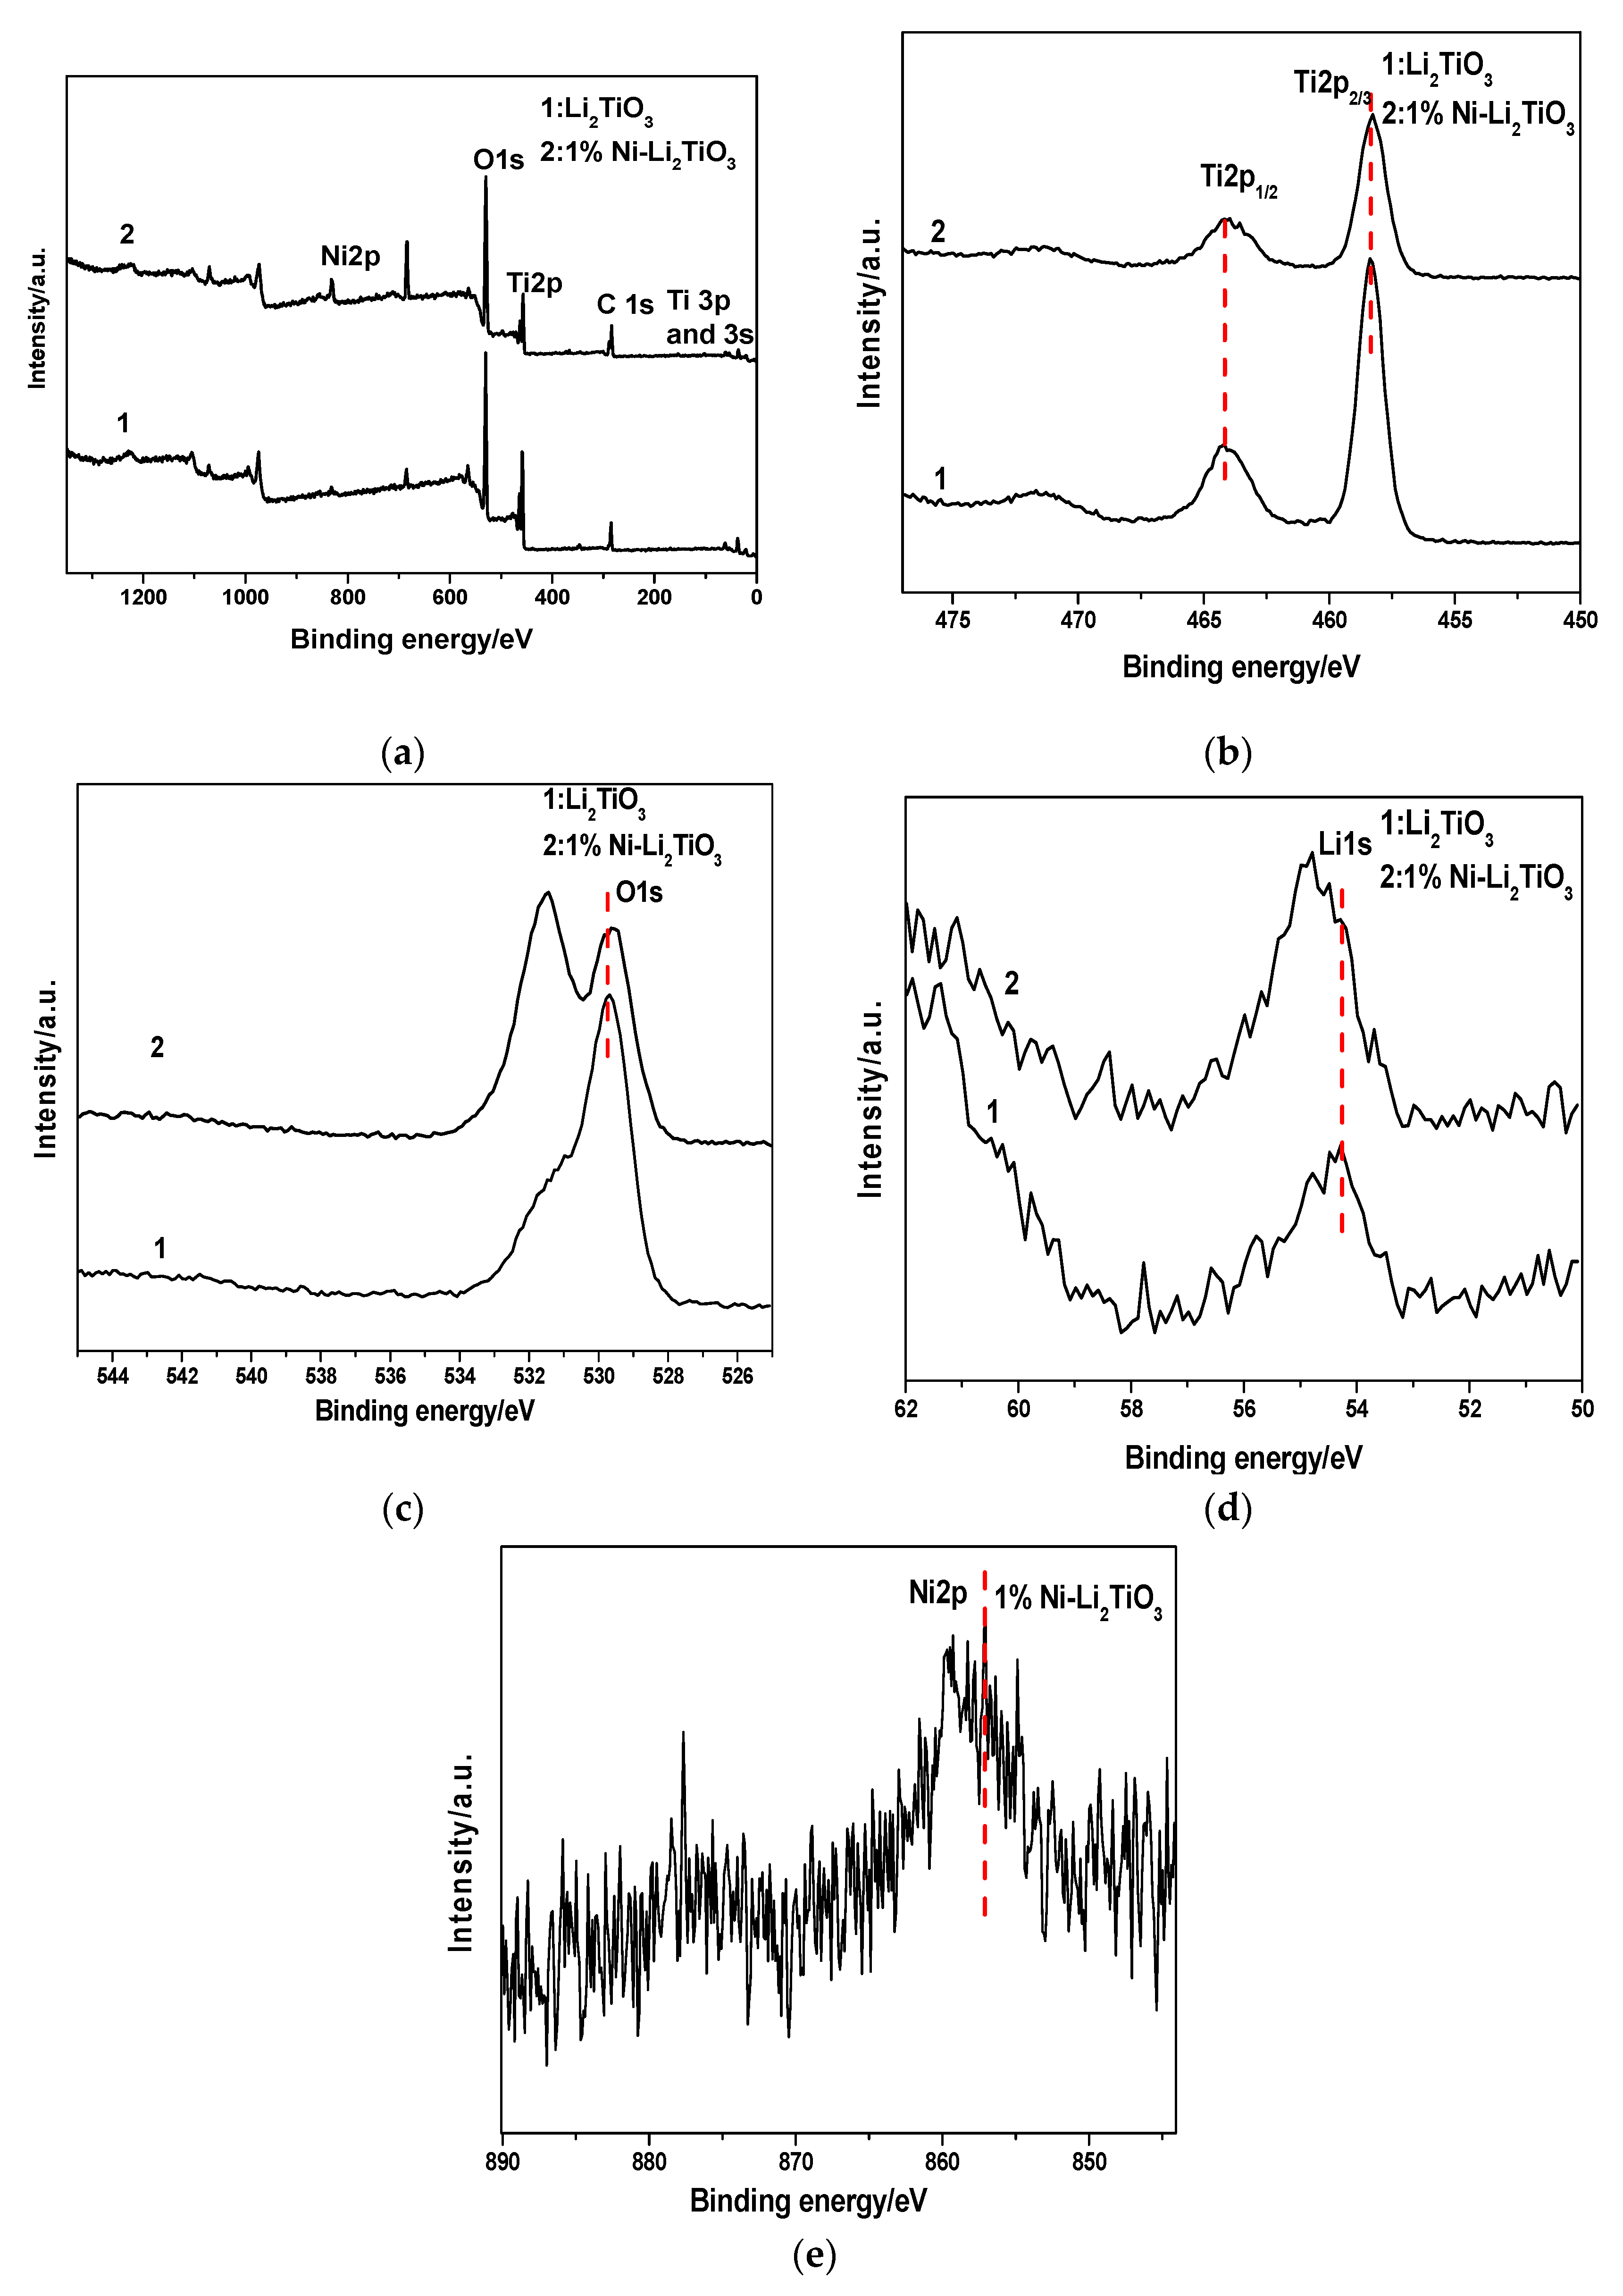
3.9. XPS Analysis
4. Conclusions
Author Contributions
Funding
Conflicts of Interest
References
- Luo, Y.Z.; Xu, X.; Zhang, Y.X.; Pi, Y.Q.; Zhao, Y.L.; Tian, X.C.; An, Q.Y.; Wei, Q.L.; Mai, L.Q. Hierarchical carbon decorated Li3V2(PO4)3 as a bicontinuous cathode with high-rate capability and broad temperature adaptability. Adv. Energy Mater. 2014, 4, 1400107. [Google Scholar] [CrossRef]
- Huang, H.; Faulkner, T.; Barker, J.; Saidi, M.Y. Lithium metal phosphates, power and automotive applications. J. Power Sources 2009, 189, 748. [Google Scholar] [CrossRef]
- Luo, Q.P.; Guo, P.C.; Li, C.Z.; Chen, L. Distribution of lithium resources and research status on lithium extraction technology. Hydrometall. China 2012, 2, 67–70. [Google Scholar]
- Zhao, X.; Wu, H.H.; Duan, M.S.; Hao, X.C.; Yang, Q.W.; Zhang, Q.; Huang, X.P. Liquid-liquid extraction of lithium from aqueous solution using novel ionic liquid extractants via COSMO-RS and experiments. Fluid Phase Equilib. 2018, 459, 129. [Google Scholar] [CrossRef]
- Zhang, L.C.; Li, L.J.; Shi, D.; Li, J.F.; Peng, X.W.; Nie, F. Selective extraction of lithium from alkaline brine using HBTA-TOPO synergistic extraction system. Sep. Purif. Technol. 2017, 188, 167. [Google Scholar] [CrossRef]
- Shi, C.L.; Jing, Y.; Xiao, J.; Wang, X.Q.; Jia, Y.Z. Liquid-liquid extraction of lithium using novel phosphonium ionic liquid as an extractant. Hydrometallurgy 2017, 169, 314. [Google Scholar] [CrossRef]
- Xiang, W.; Liang, S.K.; Zhou, Z.Y.; Qin, W.; Fei, W.Y. Extraction of lithium from salt lake brine containing borate anion and high concentration of magnesium. Hydrometallurgy 2016, 166, 9. [Google Scholar] [CrossRef]
- Wang, S.L.; Zheng, S.L.; Wang, Z.M.; Cui, W.W.; Zhang, H.L.; Yang, L.R.; Zhang, Y.; Li, P. Superior lithium adsorption and required magnetic separation behavior of iron-doped lithium ion-sieves. Chem. Eng. J. 2018, 332, 160. [Google Scholar] [CrossRef]
- Paranthaman, M.P.; Li, L.; Luo, J.Q.; Hoke, T.; Ucar, H.; Moyer, B.A.; Harrison, S. Recovery of lithium from geothermal brine with lithium–aluminum layered double hydroxide chloride sorbents. Environ. Sci. Technol. 2017, 51, 13481. [Google Scholar] [CrossRef]
- Song, J.F.; Nghiem, L.D.; Li, X.M.; He, T. Lithium extraction from chinese salt-lake brines: opportunities, challenges, and future outlook. Environ. Sci. Wat. Res. Technol. 2017, 3, 593. [Google Scholar] [CrossRef]
- He, L.H.; Xu, W.H.; Song, Y.F.; Liu, X.H.; Zhao, Z.W. Selective removal of magnesium from a lithium-concentrated anolyte by magnesium ammonium phosphate precipitation. Sep. Purif. Technol. 2017, 187, 214. [Google Scholar] [CrossRef]
- Swain, B. Recovery and recycling of lithium: A review. Sep. Purif. Technol. 2017, 172, 388. [Google Scholar] [CrossRef]
- Zhang, Q.H.; Li, S.P.; Sun, S.Y.; Yin, X.S.; Yu, J.G. LiMn2O4 spinel direct synthesis and lithium ion selective adsorption. Chem. Eng. Sci. 2010, 65, 169. [Google Scholar] [CrossRef]
- Xu, H.; Chen, C.G.; Song, Y.H. Synthesis and properties of lithium ion-sieve precursor Li4Mn5O12. J. Nonferr. Metal. 2013, 28, 720. [Google Scholar] [CrossRef]
- Ji, Z.Y.; Yuan, J.S.; Li, X.G. Extraction of solanesol by dynamic saponification method. Chem. Eng. 2007, 35, 9. [Google Scholar]
- Hagh, N.M.; Amatucci, G.G. Effect of cation and anion doping on microstructure and electrochemical properties of the LiMn1.5Ni0.5O4−δ spinel. J. Power Sources 2014, 256, 457. [Google Scholar] [CrossRef]
- Dong, D.Q.; Zhang, F.B.; Zhang, G.L.; Liu, Y.F. Synthesis of Li4Ti5O12 and its exchange kinetics with Li+. Acta Phys. Chim. Sin. 2007, 23, 950. [Google Scholar]
- Shi, X.C.; Zhang, Z.B.; Zhou, D.F.; Zhang, L.F.; Chen, B.Z.; Yu, L.L. Synthesis of Li+ adsorbent (H2TiO3) and its adsorption properties. T. Nonferr. Metal. Soc. 2013, 23, 253. [Google Scholar] [CrossRef]
- Yu, C.L.; Yanagisawa, K.; Kamiya, S.; Kozawa, T.; Ueda, T. Monoclinic Li2TiO3 nano-particles via hydrothermal reaction: Processing and structure. Ceram. Int. 2014, 40, 1901. [Google Scholar] [CrossRef]
- Zhang, L.Y.; Zhou, D.L.; Yao, Q.Q.; Zhou, J.B. Preparation of H2TiO3-lithium adsorbent by the sol-gel process and its adsorption performance. App. Surf. Sci. 2016, 368, 82. [Google Scholar] [CrossRef]
- Yao, Q.Q.; Zhou, J.; Zhang, L.; Yang, S.; Zhou, D. Study on H2TiO3-1ithium exchanger synthesized by precipitation-peptization method. Iron Steel Vanadium Titan. 2017, 38, 38. [Google Scholar]
- Zhang, L.Y.; Zhou, D.L.; He, G.; Yao, Q.Q.; Wang, F.H.; Zhou, J.B. Synthesis of H2TiO3-lithium adsorbent loaded on ceramic foams. Mater. Lett. 2015, 145, 351. [Google Scholar] [CrossRef]
- Zhang, L.Y.; Liu, Y.W.; Zhou, D.L.; Yao, Q.Q. Dynamic adsorption and elution performances of H2TiO3-lithium adsorbent loaded on ceramic foams. J. Sichuan Univ. (Nat. Sci. Edi.) 2017, 54, 1275. [Google Scholar]
- Zhang, L.Y.; Liu, Y.W.; Huang, L.; Li, N. A novel study on preparation of H2TiO3-lithium adsorbent with titanyl sulfate as titanium source by inorganic precipitation-peptization method. RSC Adv. 2018, 8, 1385. [Google Scholar] [CrossRef]
- Li, Y.; Jiang, P.; Xiang, W.; Ran, F.Y.; Cao, W.B. A novel inorganic precipitation-peptization method for VO2 sol and VO2 nanoparticles preparation: Synthesis, characterization and mechanism. J. Colloid Interf. Sci. 2016, 462, 42. [Google Scholar] [CrossRef]
- Wang, L.; Zhang, X.; Ma, L.B.; Zhang, Q. Research progress of cationic doping of lithium manganese oxide ion-sieve. J. Salt Sci. Chem. Ind. 2018, 47, 8. [Google Scholar]
- Mohan, P.; Ranjith, B.; Kalaignan, G.P. Structure and electrochemical performances of co-substituted LiSmxLa0.2-xMn1.80O4 cathode materials for rechargeable lithium-ion batteries. J. Solid State Electr. 2014, 18, 2183. [Google Scholar] [CrossRef]
- Kamata, H.; Tian, Z.Q.; Izumi, Y. Dispersed and high loading Ni catalyst stabilized in porous SiO2 matrix for substituted natural gas production. Catal. Today. 2018, 299, 193. [Google Scholar] [CrossRef]
- Todorov, Y.M.; Hideshima, Y.; Noguchi, H.; Yoshio, M. Determination of theoretical capacity of metal ion-doped LiMn2O4 as the positive electrode in Li-ion batteries. J. Power Sources 1999, 77, 198. [Google Scholar] [CrossRef]
- Feng, L.Y.; Jiang, X.X.; Wang, S.D.; Fan, Y.Q.; Zhang, L.H.; Jiang, W.; Yang, X.W. The adsorption performance of doped lithium ion sieve. Nonferr. Metal (Ext. Met.) 2008, 6, 31. [Google Scholar]
- Humphreys, B.A.; Wanless, E.J.; Webber, G.B. Effect of ionic strength and salt identity on poly(N-isopropylacrylamide) brush modified colloidal silica particles. J. Colloid Interf. Sci. 2018, 516, 153. [Google Scholar] [CrossRef] [PubMed]
- Yang, J.; Li, H.J.; Guo, Y.M.; Li, B.; Hou, H.Y. Stability of Ni/SiO2 sol and phase-chemical structure of its gel material. Chem. Eng. 2019, 47, 47. [Google Scholar]
- Dai, Y.M.; Mao, I.H.; Chen, C.C. Evaluating the optimum operating parameters of biodiesel production process from soybean oil using the Li2TiO3 catalyst. J. Taiwan Inst. Chem. Eng. 2017, 70, 260. [Google Scholar] [CrossRef]
- Liu, L.C.; Ji, Z.Y.; Zou, W.X. In situ loading transition metal oxide clusters on TiO2 nanosheets as co-catalysts for exceptional high photoactivity. ACS. Catal. 2013, 3, 2052. [Google Scholar] [CrossRef]
- Xiang, Z.H.; Mercado, R.; Huck, J.M.; Wang, H.; Guo, Z.H.; Wang, W.C.; Cao, D.P.; Haranczyk, M.; Smit, B. Systematic tuning and multifunctionalization of covalent organic polymers for enhanced carbon capture. J. Am. Chem. Soc. 2015, 137, 13301. [Google Scholar] [CrossRef]
- Xu, Q.; Zou, L.X.; Xiong, X.Q. Structure and property of nano crystalline WO3·NiO·0.33H2O photo-catalyst. Chem. Ind. Eng. Prog. 2010, 29, 260. [Google Scholar]
- Long, F.; Zhang, J.; Zhang, M.Y.; He, J.Y.; Wu, X.L.; Zou, Z.G. Ni-doped FeS2: Solvothermal synthesis and the visible-light photocatalytic properties. Chinese J. Inorg. Chem. 2015, 31, 1119. [Google Scholar]
- Sadanov, E.V.; Dudka, O.V.; Ksenofontov, V.A.; Mikhailovskij, I.M.; Maziova, T.I.; Manakin, V.L.; Starchenko, I.V. Binding energy of self-interstitial atoms to grain boundaries: An experimental approach. Mater. Lett. 2016, 183, 139. [Google Scholar] [CrossRef]
- Zhou, H.M.; Yuan, J.S.; Zhang, L.; Fu, Y.P.; Hou, J. Hydrothermal synthesis of doped chromium spinel-type lithium ion-sieve and its lithium absorption properties. J. Funct. Mater. 2011, 42, 621. [Google Scholar]
- Tang, J.; Zhang, D.; Bi, X.G.; Niu, W.; Dong, Y.N.; Zhou, W.P.; Zhang, R.Q.; Sun, X.D. Preparation and characterization of micron-level TiO2 powders for rutile single crystal growth using verneuil method. J. Funct. Mater. 2018, 49, 9184. [Google Scholar]
- Han, F.; Jia, L.; Qiao, X.L.; Jin, Y.; Fan, B.G. Effect of crystal structure on the desulfurization reactivity of magnesium slag. Chem. Ind. Eng. Prog. 2019, 38, 3319. [Google Scholar]
- Duan, Z.H.; Luo, L.T.; Shao, G.X.; Zhang, X.H. Effects of template and Ni dope on mesoporous titania material. J. Mol. Catal. 2005, 19, 298. [Google Scholar]
- Song, Z.H.; Guo, H.Q.; Zhang, C.H.; Wang, G.L.; Wu, C.H.; Wu, Q.S.; Wu, Z.J. Characterization of nano-tungsten powder and its lattice distortion analysis. Mater. Rev. 2009, 23, 106. [Google Scholar]
- Xu, G.M.; Shi, Z.; Deng, J. Characterization of adsorption of antimony and phosphate by using IOCS with XRD, FTIR and XPS. Acta Sci. J. Environ. Sci.-China 2007, 27, 402. [Google Scholar]
- Qiu, Y.; Wang, L.M.; Shen, Y.; Xu, L.H.; Chen, C. Preparation of Ni/ZnO and its application on modified polyester fabric. J. Funct. Mater. 2018, 49, 8189. [Google Scholar]
- Chen, G.; Song, C.; Chen, C.; Cao, S.; Zeng, F.; Pan, F. Resistive switching and magnetic modulation in cobalt-doped ZnO. Adv. Mater. 2012, 24, 3515. [Google Scholar] [CrossRef]


| Viscosity /MPa∙s | 1 | 18 | 23 | 27 | 39 | 48 | 51 | 63 | 69 | 75 | 87 |
|---|---|---|---|---|---|---|---|---|---|---|---|
| 0.55% Ni% | 2.897 | 2.010 | 2.087 | 2.157 | 1.923 | 2.320 | 2.260 | 5.630 | 10.20 | 12.767 | 16.167 |
| 1% Ni% | 2.783 | 2.650 | 2.627 | 2.840 | 2.497 | 2.620 | 2.783 | 2.903 | 2.767 | 3.860 | 15.30 |
| 2% Ni% | 3.190 | 1.923 | 2.423 | 1.853 | 1.903 | 1.973 | 2.050 | 6.693 | 3.787 | 7.847 | 10.467 |
| 3% Ni% | 3.230 | 2.137 | 2.263 | 2.170 | 1.583 | 1.877 | 1.940 | 2.743 | 1.830 | 2.947 | 18.90 |
| Sample | Pore Diameter (nm) | Pore Volume (cm3/g) | Surface Area (m2/g) |
|---|---|---|---|
| 1%Ni-doped | 3.834 | 0.316 | 1.349 |
| Pure sample | 3.837 | 0.165 | 0.911 |
| Samples | I(002)/I(−133) | Crystalline Size: (−133) nm |
|---|---|---|
| 550 °C | 0.648 | 13.47 |
| 600 °C | 0.960 | 16.30 |
| 650 °C | 1.077 | 20.73 |
| 700 °C | 1.199 | 23.82 |
| 750 °C | 1.375 | 25.39 |
| 800 °C | 1.363 | 29.47 |
| Samples | Crystalline Size: (−133) nm |
|---|---|
| 650 °C | 20.79 |
| 700 °C | 31.93 |
| 750 °C | 38.46 |
| 800 °C | 33.71 |
| 850 °C | 37.78 |
| 900 °C | 37.94 |
| Sample | Calcination Temperature/°C | C/at % | O/at % | Li/at % | Ti/at % | Ni/at % |
|---|---|---|---|---|---|---|
| Li2TiO3 | 750 | 19.24 | 43.74 | 22.2 | 14.82 | 0.0 |
| 1%Ni-Li2TiO3 | 750 | 21.86 | 39.37 | 29.91 | 7.65 | 1.21 |
© 2019 by the authors. Licensee MDPI, Basel, Switzerland. This article is an open access article distributed under the terms and conditions of the Creative Commons Attribution (CC BY) license (http://creativecommons.org/licenses/by/4.0/).
Share and Cite
Zhang, L.-Y.; Shui, Y.; Zhao, L.-L.; Zhu, P.; Xu, W.-Y.; You, Y.-H. Preparation of Ni-Doped Li2TiO3 Using an Inorganic Precipitation–Peptization Method. Coatings 2019, 9, 701. https://doi.org/10.3390/coatings9110701
Zhang L-Y, Shui Y, Zhao L-L, Zhu P, Xu W-Y, You Y-H. Preparation of Ni-Doped Li2TiO3 Using an Inorganic Precipitation–Peptization Method. Coatings. 2019; 9(11):701. https://doi.org/10.3390/coatings9110701
Chicago/Turabian StyleZhang, Li-Yuan, Yi Shui, Ling-Ling Zhao, Ping Zhu, Wen-Yong Xu, and Yao-Hui You. 2019. "Preparation of Ni-Doped Li2TiO3 Using an Inorganic Precipitation–Peptization Method" Coatings 9, no. 11: 701. https://doi.org/10.3390/coatings9110701
APA StyleZhang, L.-Y., Shui, Y., Zhao, L.-L., Zhu, P., Xu, W.-Y., & You, Y.-H. (2019). Preparation of Ni-Doped Li2TiO3 Using an Inorganic Precipitation–Peptization Method. Coatings, 9(11), 701. https://doi.org/10.3390/coatings9110701