Article

Engineering Low-Friction Carbonitrided Steel Surfaces: A Joint RSM–ANN Study of Multi-Pass Scratch Behavior in AISI 4130

1
Laboratory of Mechanics, Materials and Processes (LMMP), National High School of Engineering of Tunis (ENSIT), University of Tunis, 5 Avenue Taha Hussein, Montfleury, Tunis 1008, Tunisia
2
Deanship of Scientific Research, Imam Mohammad Ibn Saud Islamic University (IMSIU), Riyadh 11432, Saudi Arabia
*
Author to whom correspondence should be addressed.
Coatings 2026, 16(9), 1104; https://doi.org/10.3390/coatings16091104
Submission received: 31 July 2026 / Revised: 25 August 2026 / Accepted: 15 September 2026 / Published: 16 September 2026
(This article belongs to the Section Metal Surface Process)

Abstract

This paper concerns the optimization of the tribological properties of carbonitrided steel, a matter of particular significance in the design of highly stressed, hardened mechanical components. The study aims to explore the simultaneous treatment of microhardness, normal load and number of passes as jointly optimized design variables for the multi-pass scratch friction response of carbonitrided AISI 4130 steel. It employs a full-factorial response-surface (RSM) approach, in conjunction with a desirability-function optimization and an artificial neural network (ANN) model, with the objective of both explaining and predicting this response. The microstructural and mechanical properties of carbonitrided AISI 4130 steel were first examined by looking at how the steel wears in tribological applications. The microstructure of the carbonitrided steel was analyzed using optical microscopy and X-ray diffraction (XRD), with varying carbon-potential and tempering parameters. As the tempering temperature increased, the carbonitrided steel demonstrated a decrease in microhardness, consistent with progressive relief of quenching-induced stresses and decomposition of retained austenite. The surface microhardness ranged from 630 HV0.1 (C12, tempered at 550 °C) to 980 HV0.1 (C2), against 270 HV0.1 for untreated steel. To investigate the friction coefficient, a multi-pass scratching approach was employed, utilizing a full-factorial design of experiments (4 × 4 × 4 combinations of hardness, normal load and number of passes). The experimental data were analyzed by response surface methodology (RSM) with a desirability-function approach, and by an artificial neural network (ANN) trained with the standard back-propagation algorithm. The correlation coefficient (R2) of 0.993 demonstrates a strong agreement between the model predictions and the experimental results. The findings establish a validated, transferable quantitative relationship between carbonitriding-induced hardness gradients and adhesive-wear friction behavior, providing a predictive framework that can be extended to other case-hardened low-alloy steels subjected to multi-pass sliding degradation.

1. Introduction

The enhancement of mechanical strength in components manufactured using micro-alloyed steels is predominantly attributable to the application of hardening treatments, which produce a resilient exterior layer situated on a malleable core [1,2,3]. Thermochemical surface treatments are utilized extensively to mitigate surface degradation, with the process involving the enrichment of the surface layer of components with elements such as nitrogen or carbon, thereby enhancing their mechanical and tribological properties. Among these processes, carbonitriding is distinguished by its ability to simultaneously improve hardness, wear resistance, fatigue life and corrosion resistance while maintaining the dimensional stability of components [2,4]. This explains why it has become one of the most prevalent hardening treatments for small and medium components made of low-alloy steel with low-to-modest mechanical characteristics [5]. The presence of retained austenite and martensite in carbonitrided steel has been demonstrated to be contingent on the carbonitriding conditions and the type of steel under investigation [6], and this microstructural composition consequently enhances the fatigue and corrosion resistance of the treated components [7].
The tribological performance of case-hardened steels is conventionally assessed using pin-on-disc or reciprocating sliding tests. These tests provide reliable steady-state friction and wear data, but generally require longer test durations, larger specimen volumes, and do not readily capture the progressive evolution of friction with repeated, localized contact. Single-pass scratch testing addresses some of these limitations but does not reproduce the cumulative damage built-up experienced by components such as gear flanks or shaft-bearing interfaces under repeated contact cycles. The multi-pass scratch test has therefore recently been introduced as a cost-effective and rapid alternative, in which the friction response is tracked as a function of cumulative sliding distance on a single, small specimen under precisely controlled and repeatable normal load [8]. Multi-pass scratch testing has previously been utilized to examine the friction behavior of deep-drawing-quality steel sheets under repeated sliding contact. In this context, load and surface roughness have been identified as the predominant factors governing the evolution of the friction coefficient with the number of passes [8,9]. Furthermore, related single- or multi-pass friction studies on tool steels and coated/textured surfaces have demonstrated a similar sensitivity of friction evolution to surface hardness, contact pressure and surface finish [10,11,12]. However, to the best of our knowledge, no study has directly evaluated and jointly optimized the influence of the three parameters most relevant to carbonitrided components in service—hardness (HV), normal load (FN) and number of passes (Np)—under adhesive wear conditions.
The steel AISI 4130 (25CrMo4) was selected as the material of interest for this study. It is frequently utilized in the fabrication of gears and transmission shafts, and it is one of the most used steels in combination with carbonitriding. It has been extensively documented for its excellent hardening ability and favorable tribological behavior in the manufacture of highly stressed mechanical components, such as gears, shafts and crankshafts. A significant number of studies have investigated the enhancement of its properties through thermochemical treatments. However, many of these studies have concentrated on identifying the optimal treatment parameters in isolation, rather than on the subsequent tribological response under controlled, repeated contact. The multi-pass scratch test methodology adopted here addresses precisely this issue.
The response surface methodology (RSM) is a robust statistical tool encompassing a range of techniques that facilitate the identification of interactions between multiple process variables while reducing the number of experimental trials needed. As Mondal et al. [13] demonstrated, the efficacy of RSM lies in its ability to identify key process parameters and establish significant relationships between process variables and responses. This is achieved by means of variance analysis, which is used to evaluate the effectiveness of each parameter. Concurrently, recent studies have demonstrated the efficacy of artificial neural networks (ANNs) in modeling small experimental datasets, thereby enhancing time- and cost-efficiency [14,15]. RSM provides an explicit, physically interpretable regression model, while ANN offers superior flexibility for capturing nonlinear interactions. Consequently, several recent studies have combined the two approaches so that ANN predictions can be validated alongside empirical RSM models, with each model compensating for the other’s limitations [16,17]. This combined RSM–ANN strategy is adopted in this study for the same reason.
This study is distinguished from prior work by the same research group in several respects. First, an earlier single- and multi-pass scratch investigation of carbonitrided AISI 4130 steel [18] compared only two carbonitrided conditions (C1 and C2), without the C11/C12 tempered conditions used here, without a 4 × 4 × 4 factorial designs, and without RSM or ANN modeling. As stated in Reference [14], a combined RSM–ANN approach was previously applied to nitrided D2 steel. However, a single process factor (nitriding time) was varied, and the focus was on friction/wear behavior, without the simultaneous optimization of hardness, normal load and number of passes as co-equal design factors. This study differs from previous research in three respects: This study treats carbonitriding plus tempering (four distinct conditions: C1/C11/C12/C2) rather than a single thermochemical treatment varied in duration. Furthermore, it employs a full 4 × 4 × 4 factorial design (64 trials) co-optimizing three independent factors simultaneously, rather than a single factor sweep. Finally, it couples the tribological response with quantitative depth-resolved retained-austenite profiles to provide a microstructural explanation of the hardness–friction relationship, a link not established in [14].
This study constitutes a pioneering effort in the field, as it is the first to simultaneously treat microhardness, normal load, and number of passes as jointly optimized design variables for the multi-pass scratch friction response of carbonitrided AISI 4130 steel. The study employs a full-factorial response surface methodology (RSM)/desirability-function approach, in conjunction with an artificial neural network (ANN) model to achieve two objectives: to explain the response and to predict it. The scientific problem that is the focus of this study is the current absence of a quantitative, jointly optimized relationship between carbonitriding-induced hardness, contact load and cumulative sliding passes, and the resulting friction coefficient of carbonitrided AISI 4130 steel. The applied problem is the corresponding lack of a validated predictive design tool for selecting carbonitriding and duty-cycle parameters for carbonitrided transmission components. The objective of this study is to characterize the response surfaces of three parameters (FN, HV and Np) and to utilize a neural network to predict the friction coefficient. The hypothesis tested is that microhardness (as controlled by carbonitriding/tempering), normal load and number of passes can be jointly optimized, and their relative contributions quantified, to minimize the friction coefficient under dry multi-pass scratch conditions. Furthermore, it is hypothesized that an ANN model can reproduce this relationship with an accuracy comparable to the RSM regression model. The selection of these three parameters was based on a recent literature review [19,20,21], which emphasized the significance of normal stress in the tribological behavior of the tested material and, consequently, on the coefficient of friction of carbonitrided AISI 4130 steels. A full factorial approach was employed in the experimental design, and the ensuing results were analyzed using response surface methodology (RSM) and an artificial neural network (ANN) model. This was performed to estimate the optimum conditions and quantify the relationship between process input and output parameters. The parameters of the optimized friction coefficient were determined using Minitab software (2020). Specifically, the advance over existing methodologies and tools is fivefold: The experiment was conducted using a full 4 × 4 × 4 (64-trial) factorial design, which jointly optimized microhardness, normal load and number of passes as co-equal factors for carbonitrided steel. This is a novel finding, as no such experiment has been previously reported. The experiment involved mutual cross-validation between an explicit RSM regression and an independently trained ANN (R → 1 for the best-performing structures). Finally, quantitative coupling of depth-resolved retained-austenite profiles to the friction response was used to provide a microstructural explanation of the hardness–friction relationship.

2. Materials and Methods

This study focuses on AISI 4130 steel, a material that is widely utilized in the mechanical industry for the manufacturing of automotive transmission parts. The chemical composition of the steel is presented in Table 1. To enhance the properties of the specimens, they were subjected to carbonitriding on all surfaces. The conditions employed in this study are designated C1, C11, C12 and C2. The detailed treatment conditions are outlined in Table 2.
A variety of techniques were used to study the microstructural and mechanical properties of carbonitrided AISI 4130 steel. Cross-sections of treated and untreated samples were polished and then etched in a 4% Nital solution at room temperature. The phase composition and structure of the compound layers was determined by performing XRD on an X-ray diffractometer. Measurements were taken at 45 kV and 40 mA using Cu Ka radiation (k = 1.544 Å) at room temperature. Vickers microhardness tests were used to assess the mechanical properties of the carbonitrided layers. The test was carried out on the polished sections using a load of 0.1 N (100 g) and a dwell time of 15 s. The CLEMEX JS 2000 M apparatus (Brossard, QC, J4Z 3V4-Canada) was used for the test. The distribution of residual austenite in the treated samples was determined using a Pulstec μ-X360 device (Pulstec Industrial Co., Ltd., Hamamatsu, Japan). The process of electrolytic polishing was used to achieve a detailed profile of residual austenite, with the radius of the samples being progressively reduced. Details of the retained austenite measurement are presented in Table 3.
The friction coefficient was selected as the primary response based on three factors: The parameter is of direct operational relevance in relation to power loss and heat generation in transmission components in service. Furthermore, it can be measured continuously and non-destructively during the multi-pass test. This allows its evolution with cumulative sliding distance to be tracked on a single specimen. In contrast, mass-loss measurement is a destructive end-point technique. The rationale for adopting the multi-pass scratch test itself, as opposed to alternative methods such as pin-on-disc, block-on-ring, or reciprocating tests, is outlined in the Introduction.
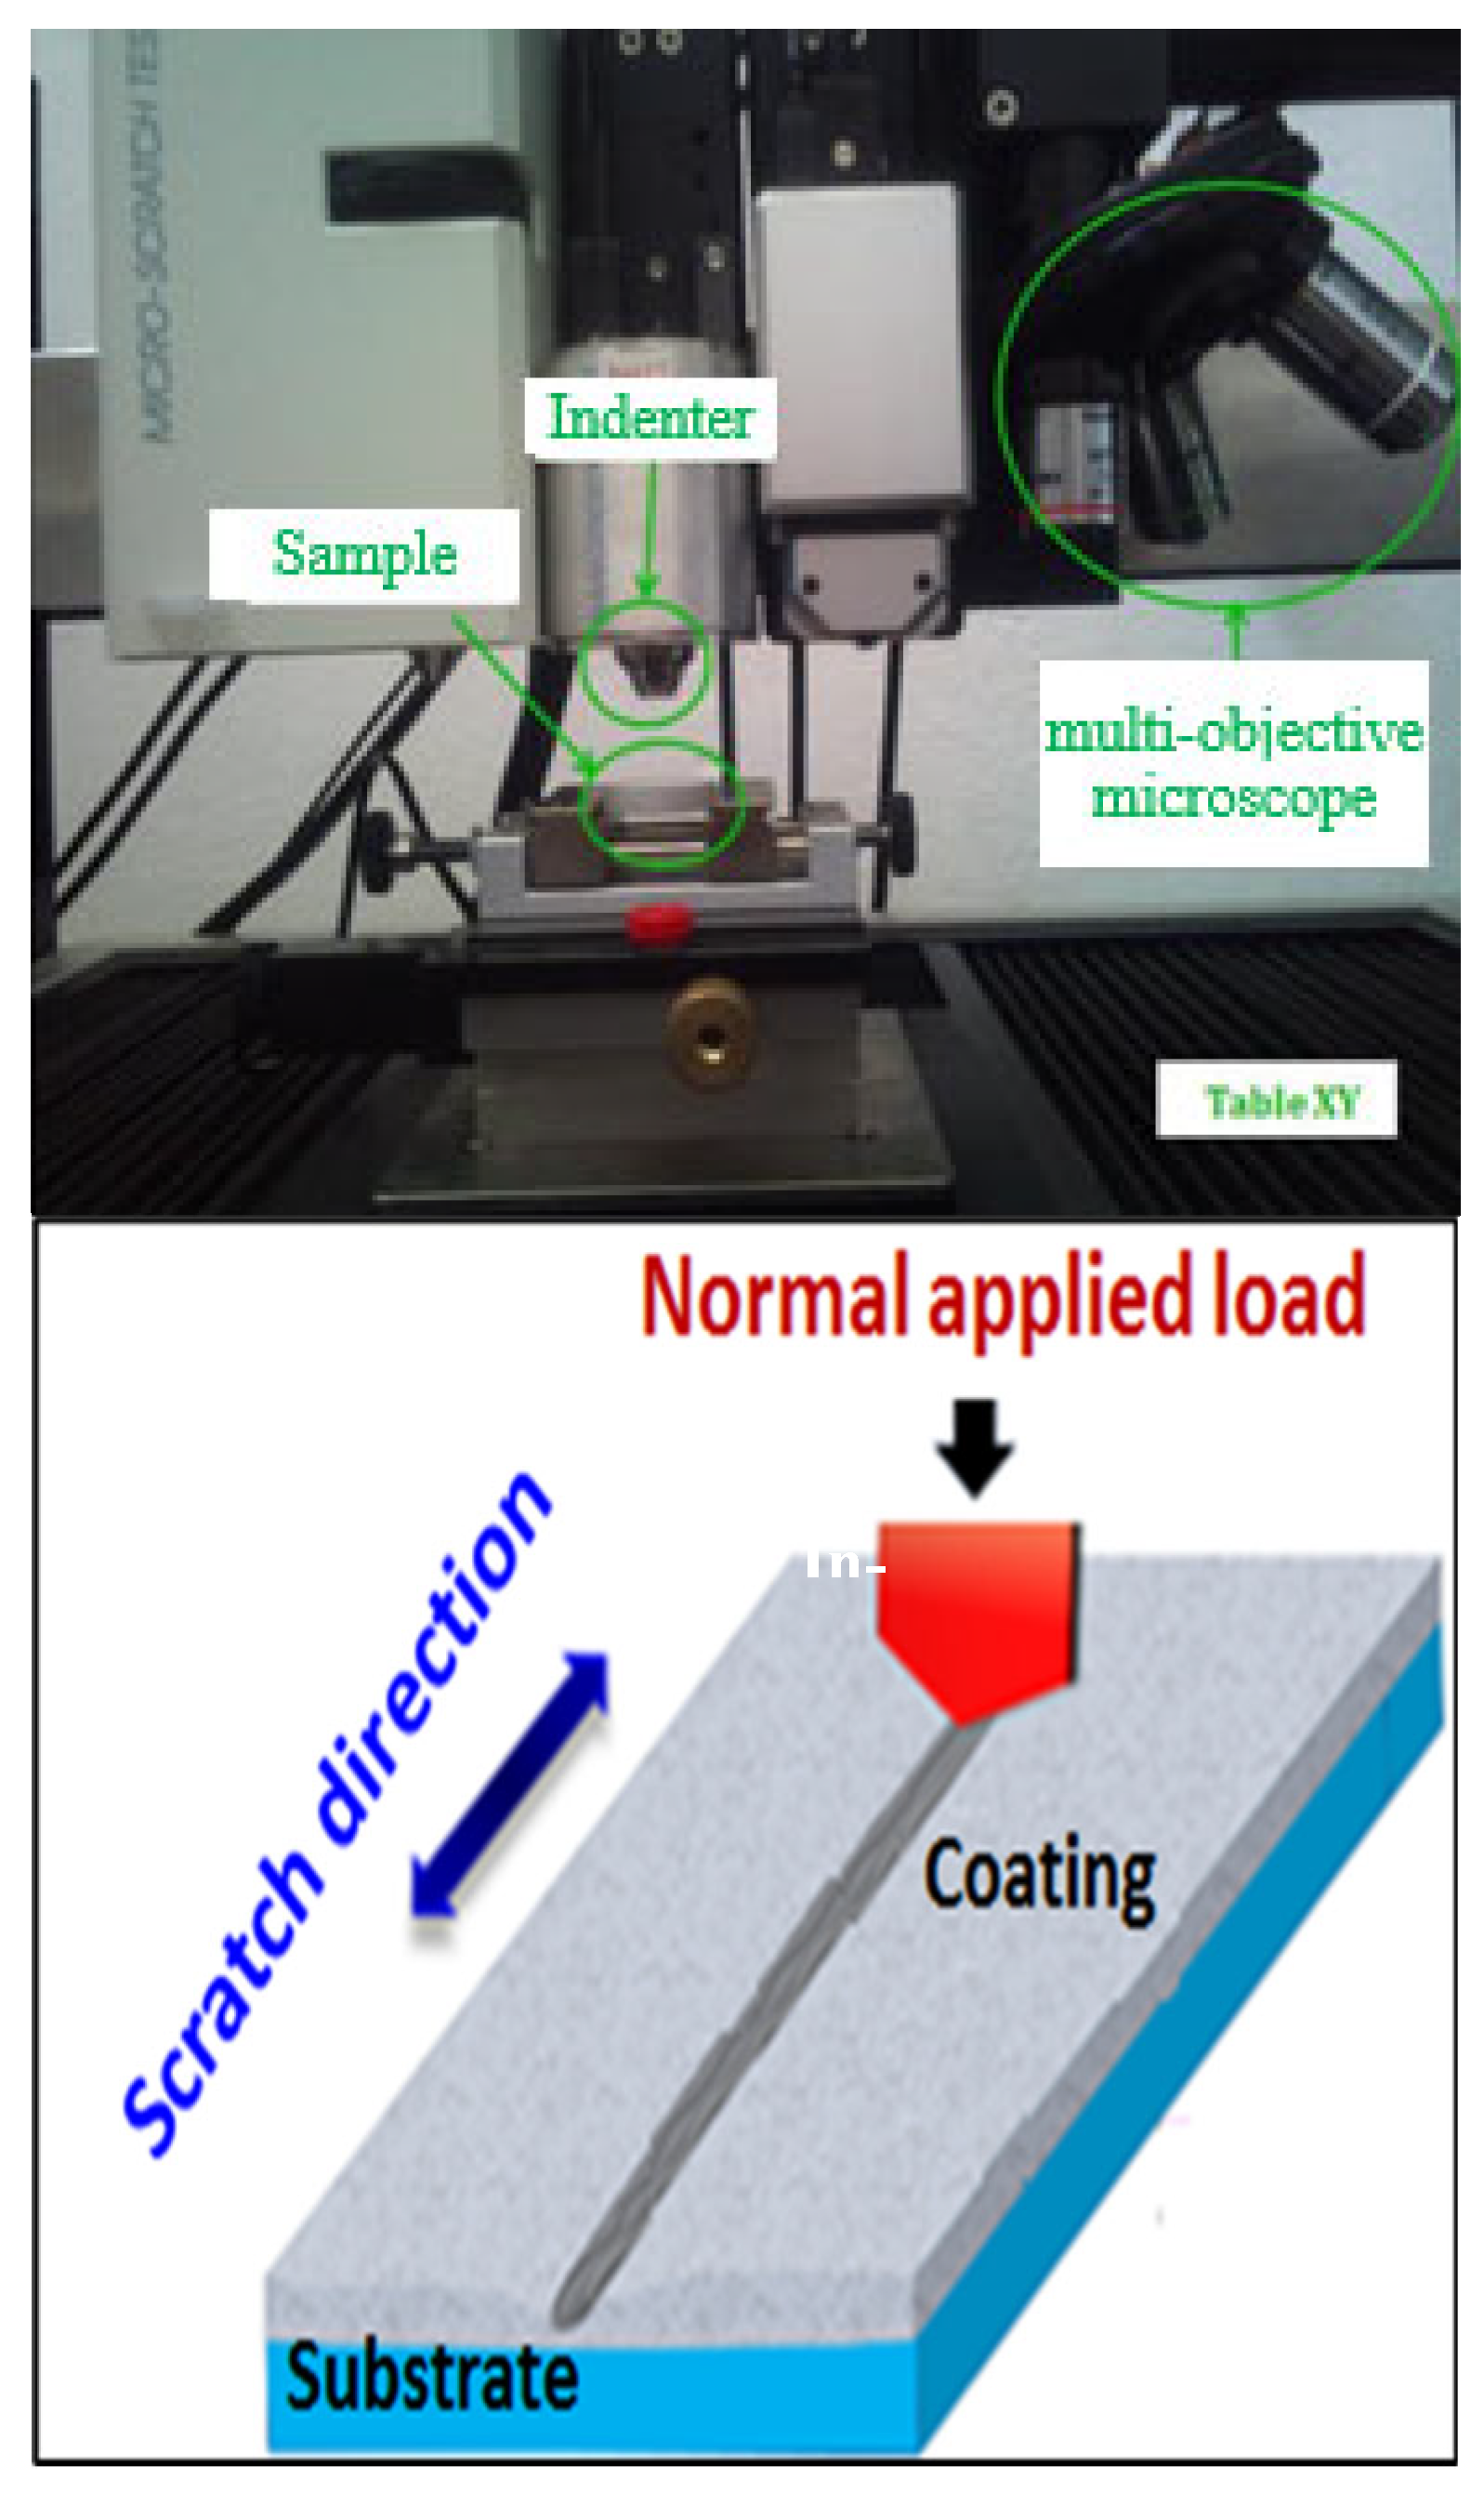
The tribological performance of carbonitrided AISI 4130 steel was investigated using the multi-pass scratch test. A Rockwell C diamond indenter with a tip radius of 200 μm was used to evaluate the steel’s wear resistance (Figure 1). The tests were carried out for up to 100 cycles under a range of applied loads (5, 10, 15 and 20 N) at a scratching speed of 10 mm/min, with a scratch length of 3 mm.
All scratch tests were conducted at ambient temperature. Each test condition was repeated between two and three times to confirm its repeatability. It was found that surface roughness did not differ measurably between the four carbonitrided/tempered conditions (C1, C11, C12, C2). This is because roughness is set by the mechanical polishing/preparation step applied identically to all specimens prior to testing. The carbonitriding treatment and the subsequent tempering step do not alter this parameter. A full 4 × 4 × 4 factorial design was employed, with microhardness, normal load and number of passes all subjected to simultaneous variation. The resulting dataset was then subjected to further analysis using signal-to-noise ratios and delta-statistic ranking, in accordance with Taguchi’s robust-design philosophy for identifying factor importance. It should be noted that the underlying design of experiments itself remains a complete factorial rather than a fractional Taguchi orthogonal array. Specifically, a multi-pass scratch test was conducted, with three parameters identified as controlling factors: microhardness, normal load and number of passes. Each of these factors was assigned to four levels, denoted by L1, L2, L3 and L4, respectively. The selection of these factors and their corresponding levels was based on pilot experiments, as detailed in Table 4.
Therefore. accurate quantitative prediction of the friction coefficient holds significant theoretical significance and practical utility. In this study, an artificial neural network (ANN) model was employed for modeling. However, traditional ANN models are driven in the direction of maximum error reduction gradient, which can lead to local minimum values and slow convergence speeds [10,22,23,24,25].

3. Results

3.1. Micrographical Analysis

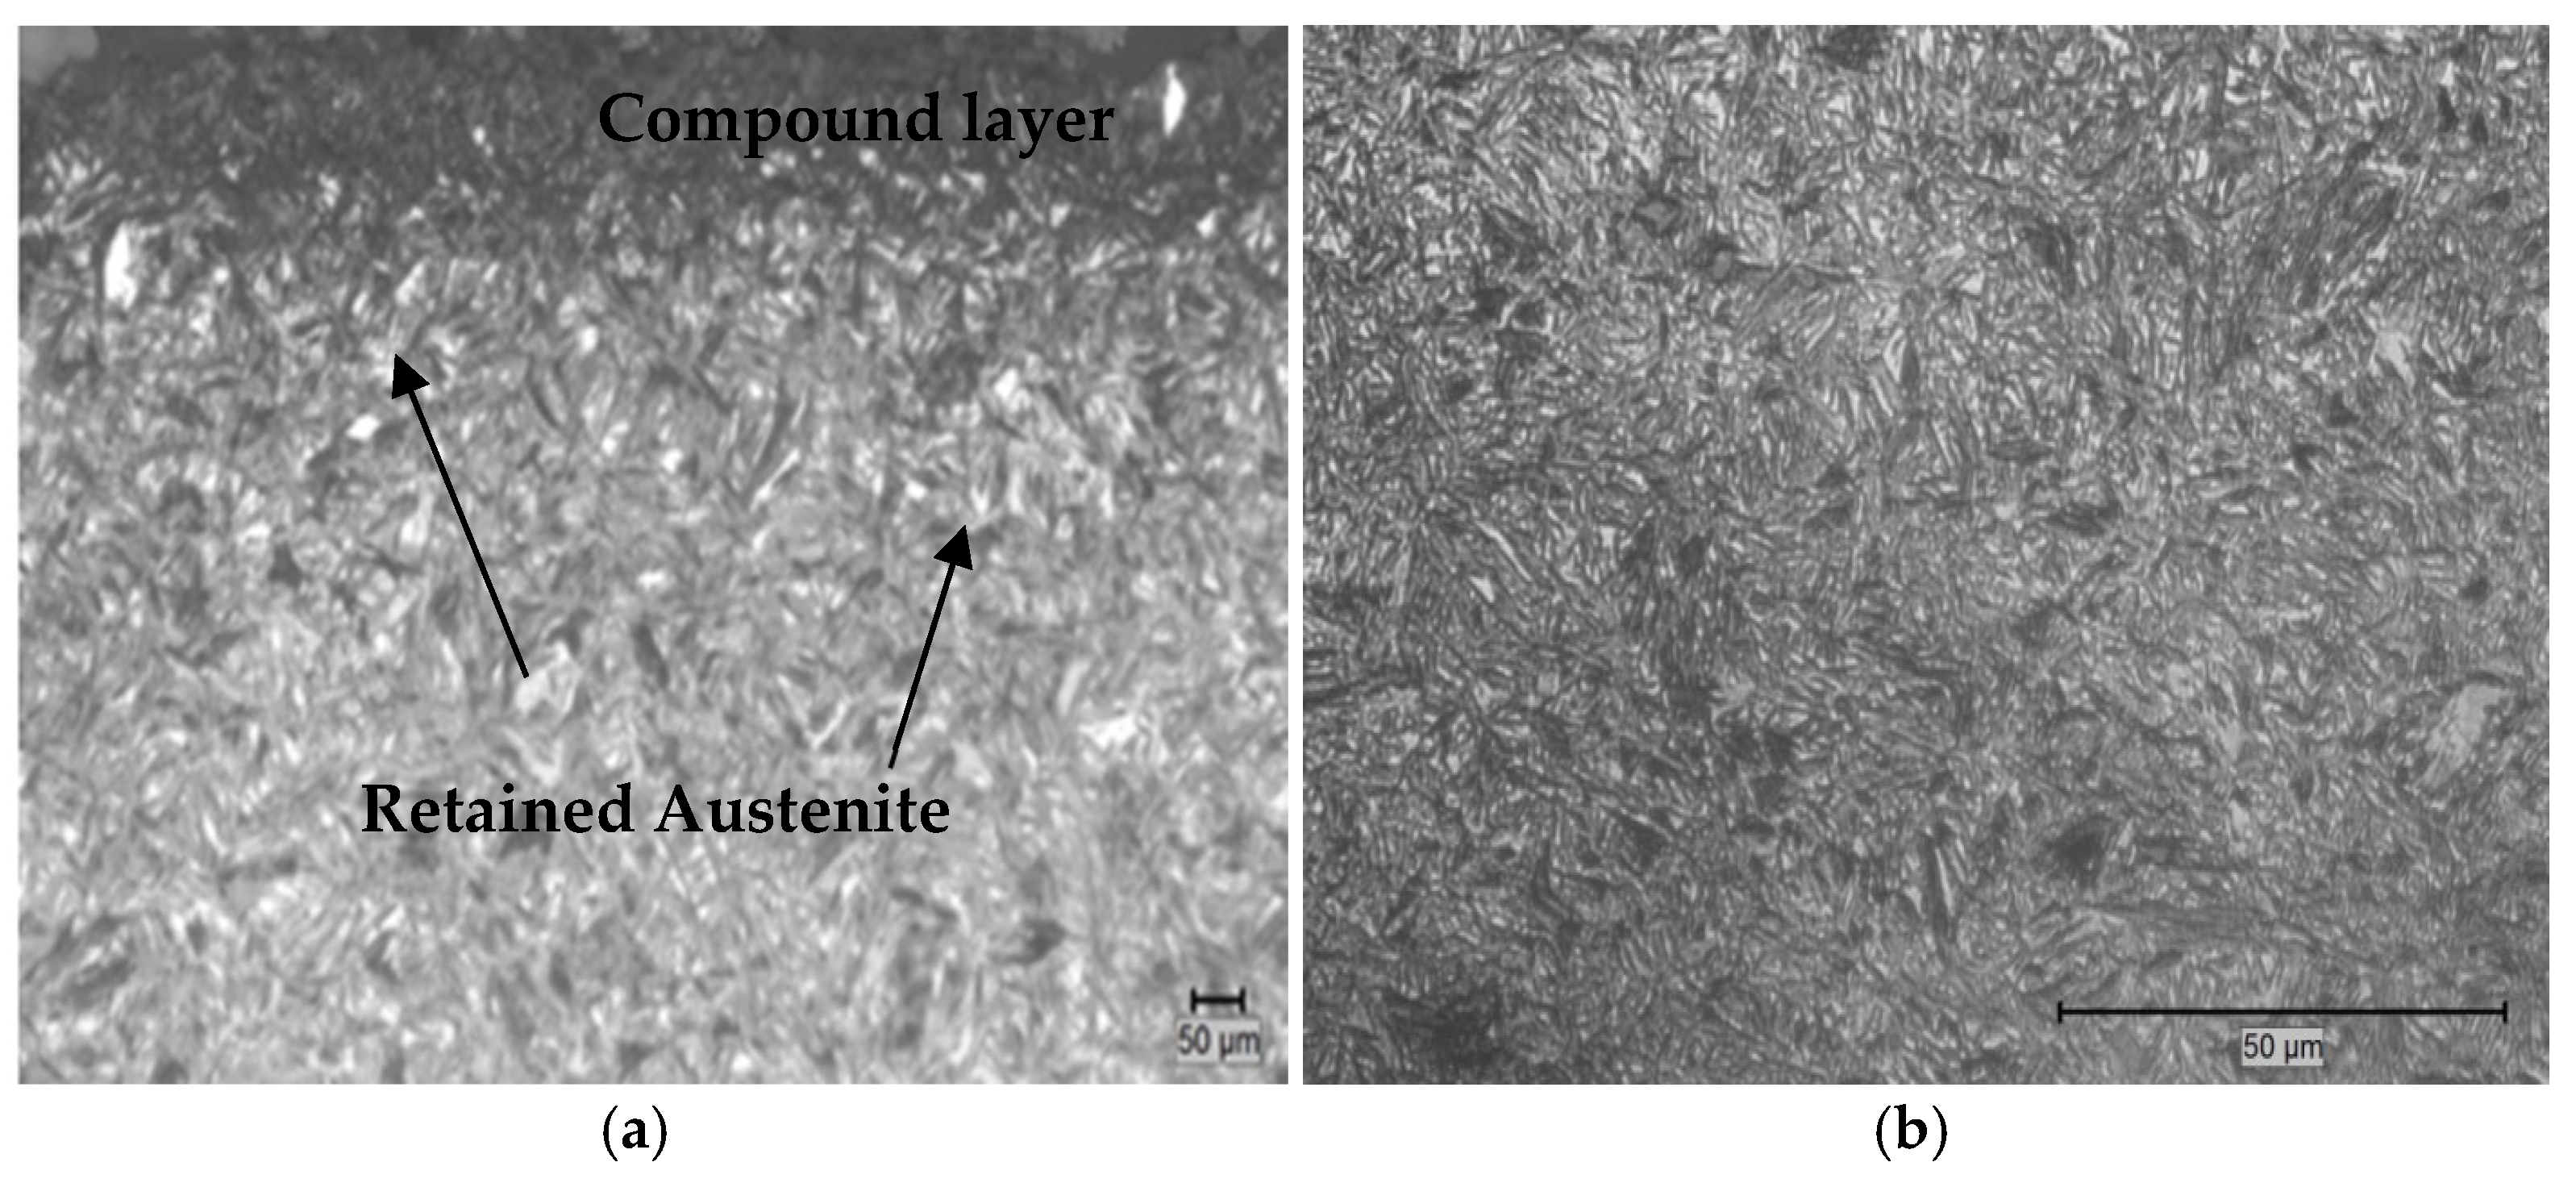
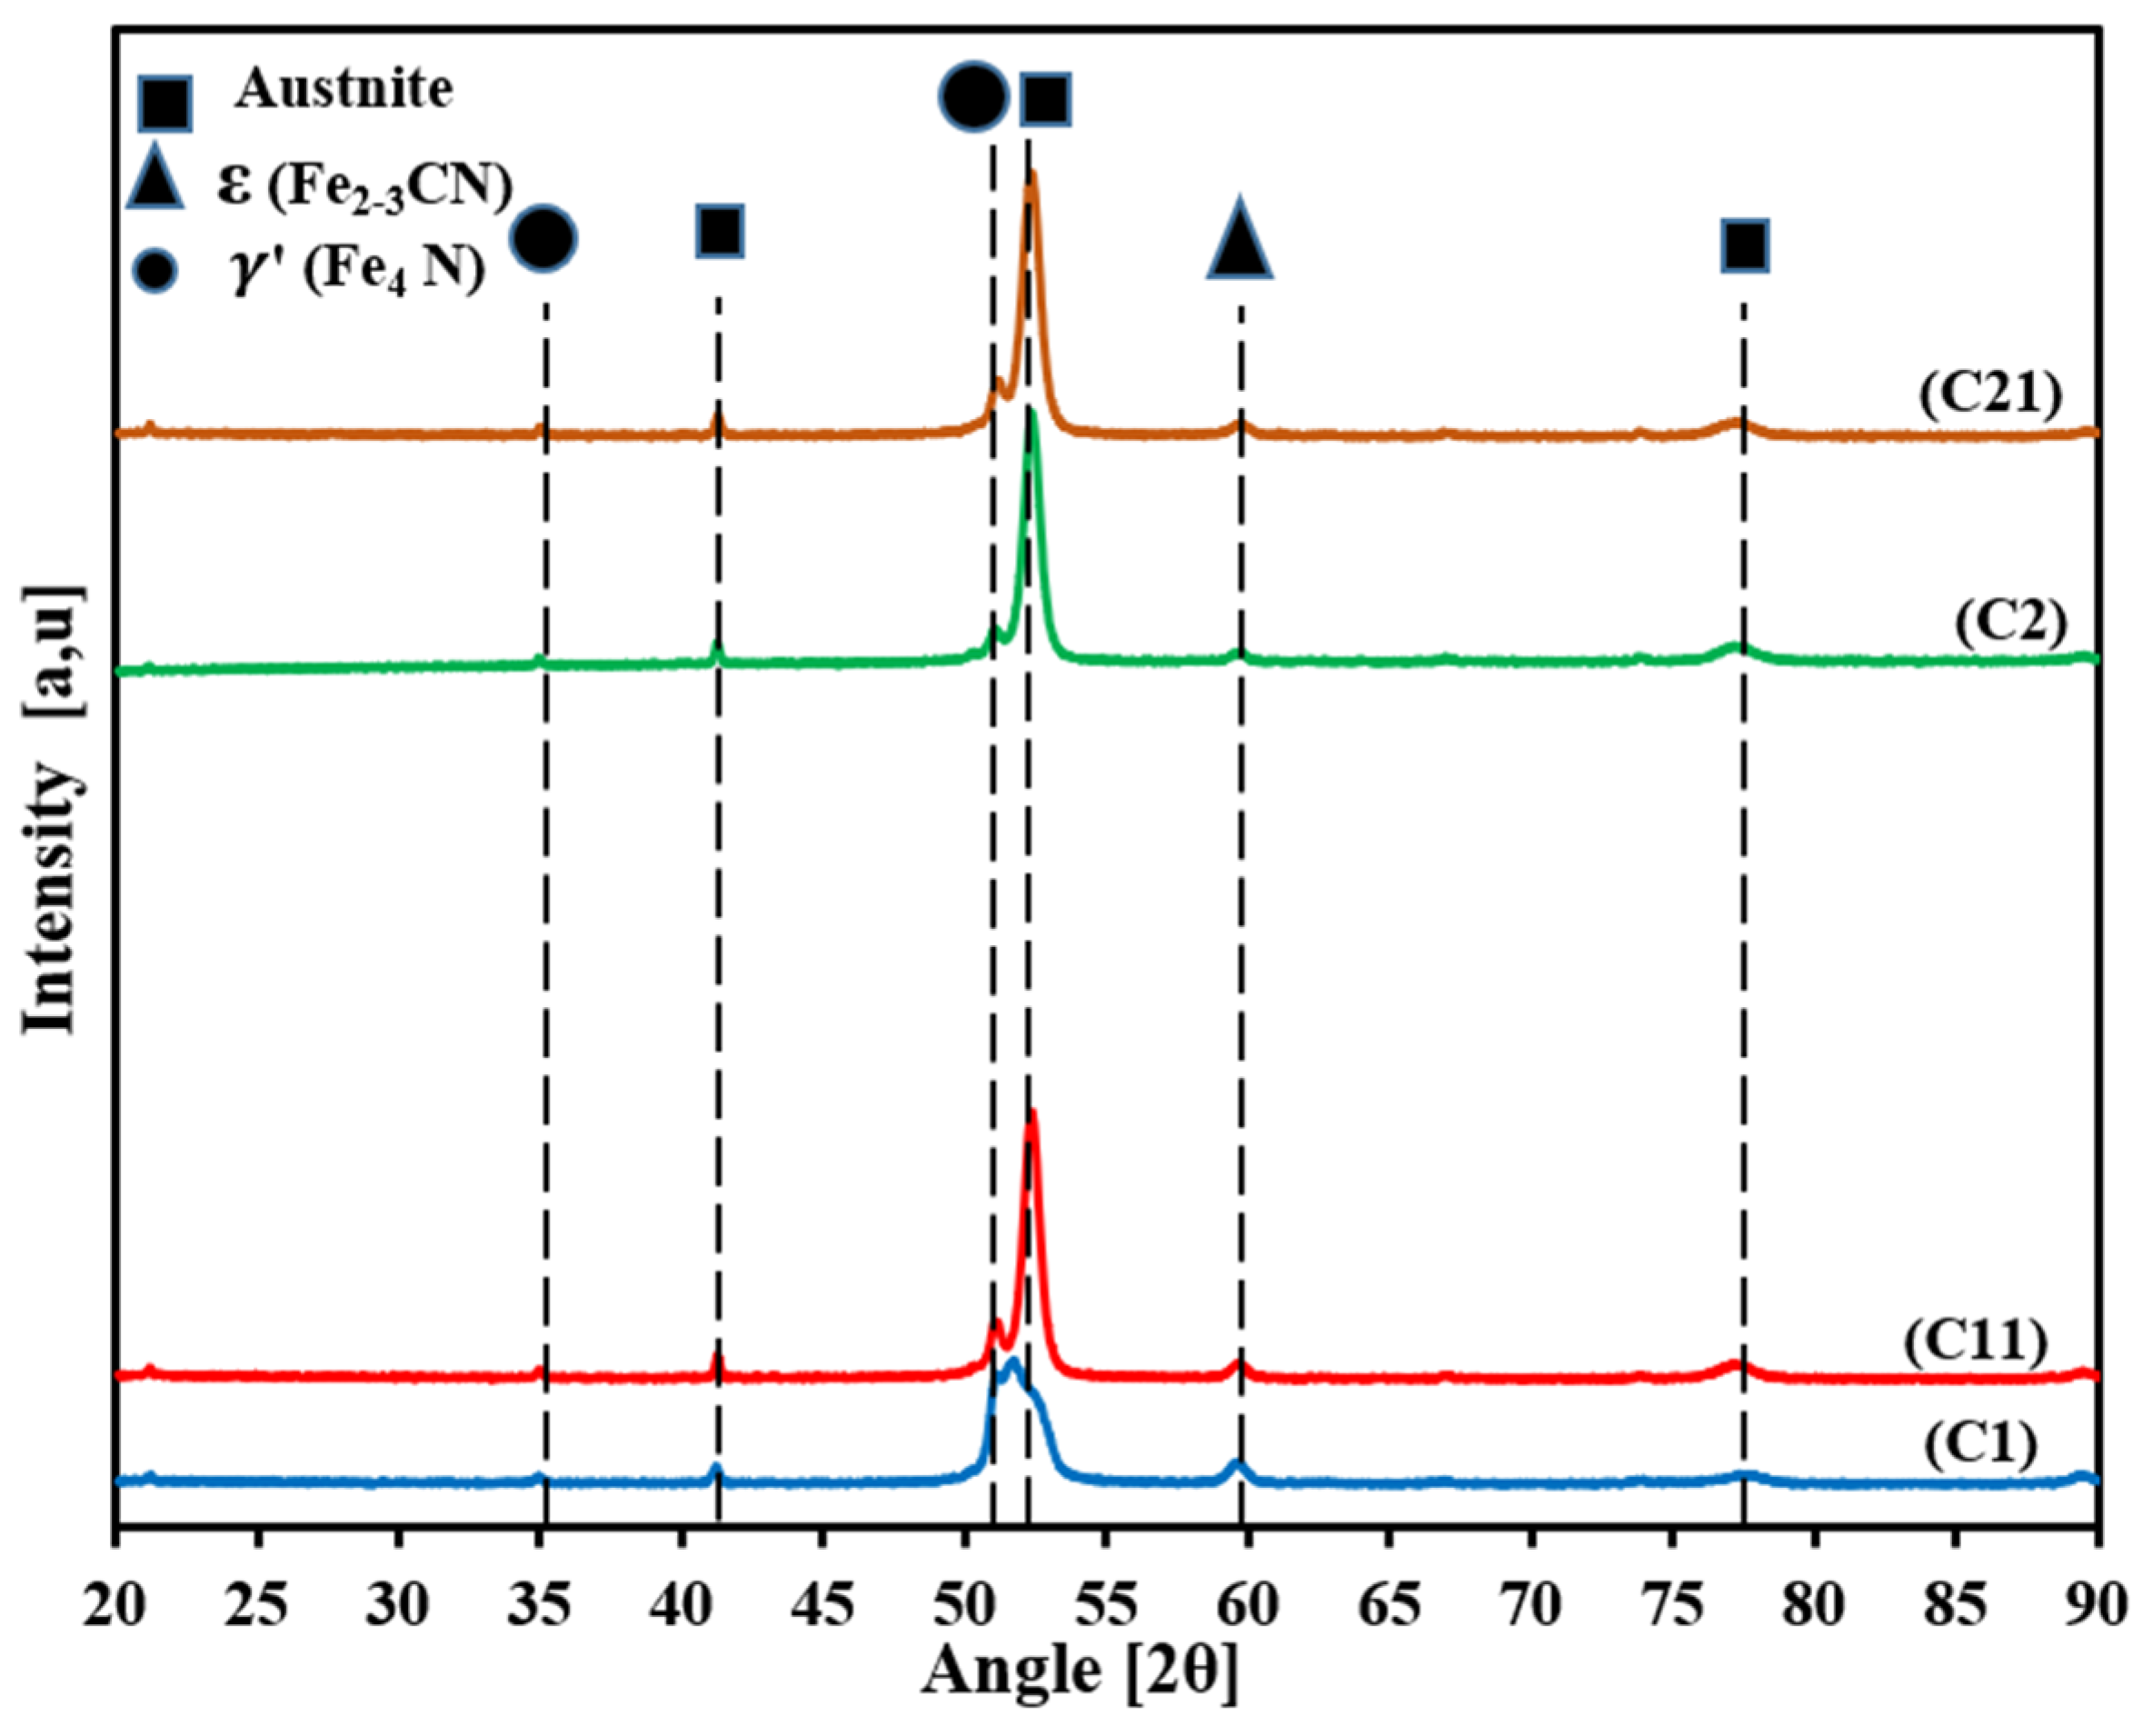
Following metallographic preparation of the samples, their microstructures were analyzed using an optical microscope. Both thermochemical treatments produced distinct transverse surface microstructures in the carbonitrided specimens, exhibiting a predominantly martensitic structure (Figure 2). Retained austenite appeared as white regions, resulting in a noticeable decrease in surface hardness. Additionally, the introduction of ammonia gas during the carbonitriding process minimized internal oxidation [1,4]. A dense, carbon- and nitrogen-enriched sublayer was also observed beneath the surface. Figure 3 shows the X-ray diffraction patterns of the samples. Precipitation of γ′ (Fe4N) was observed in the supersaturated solid solution of nitrogen, which included both martensite and retained austenite.

3.2. Residual Austenite Analysis

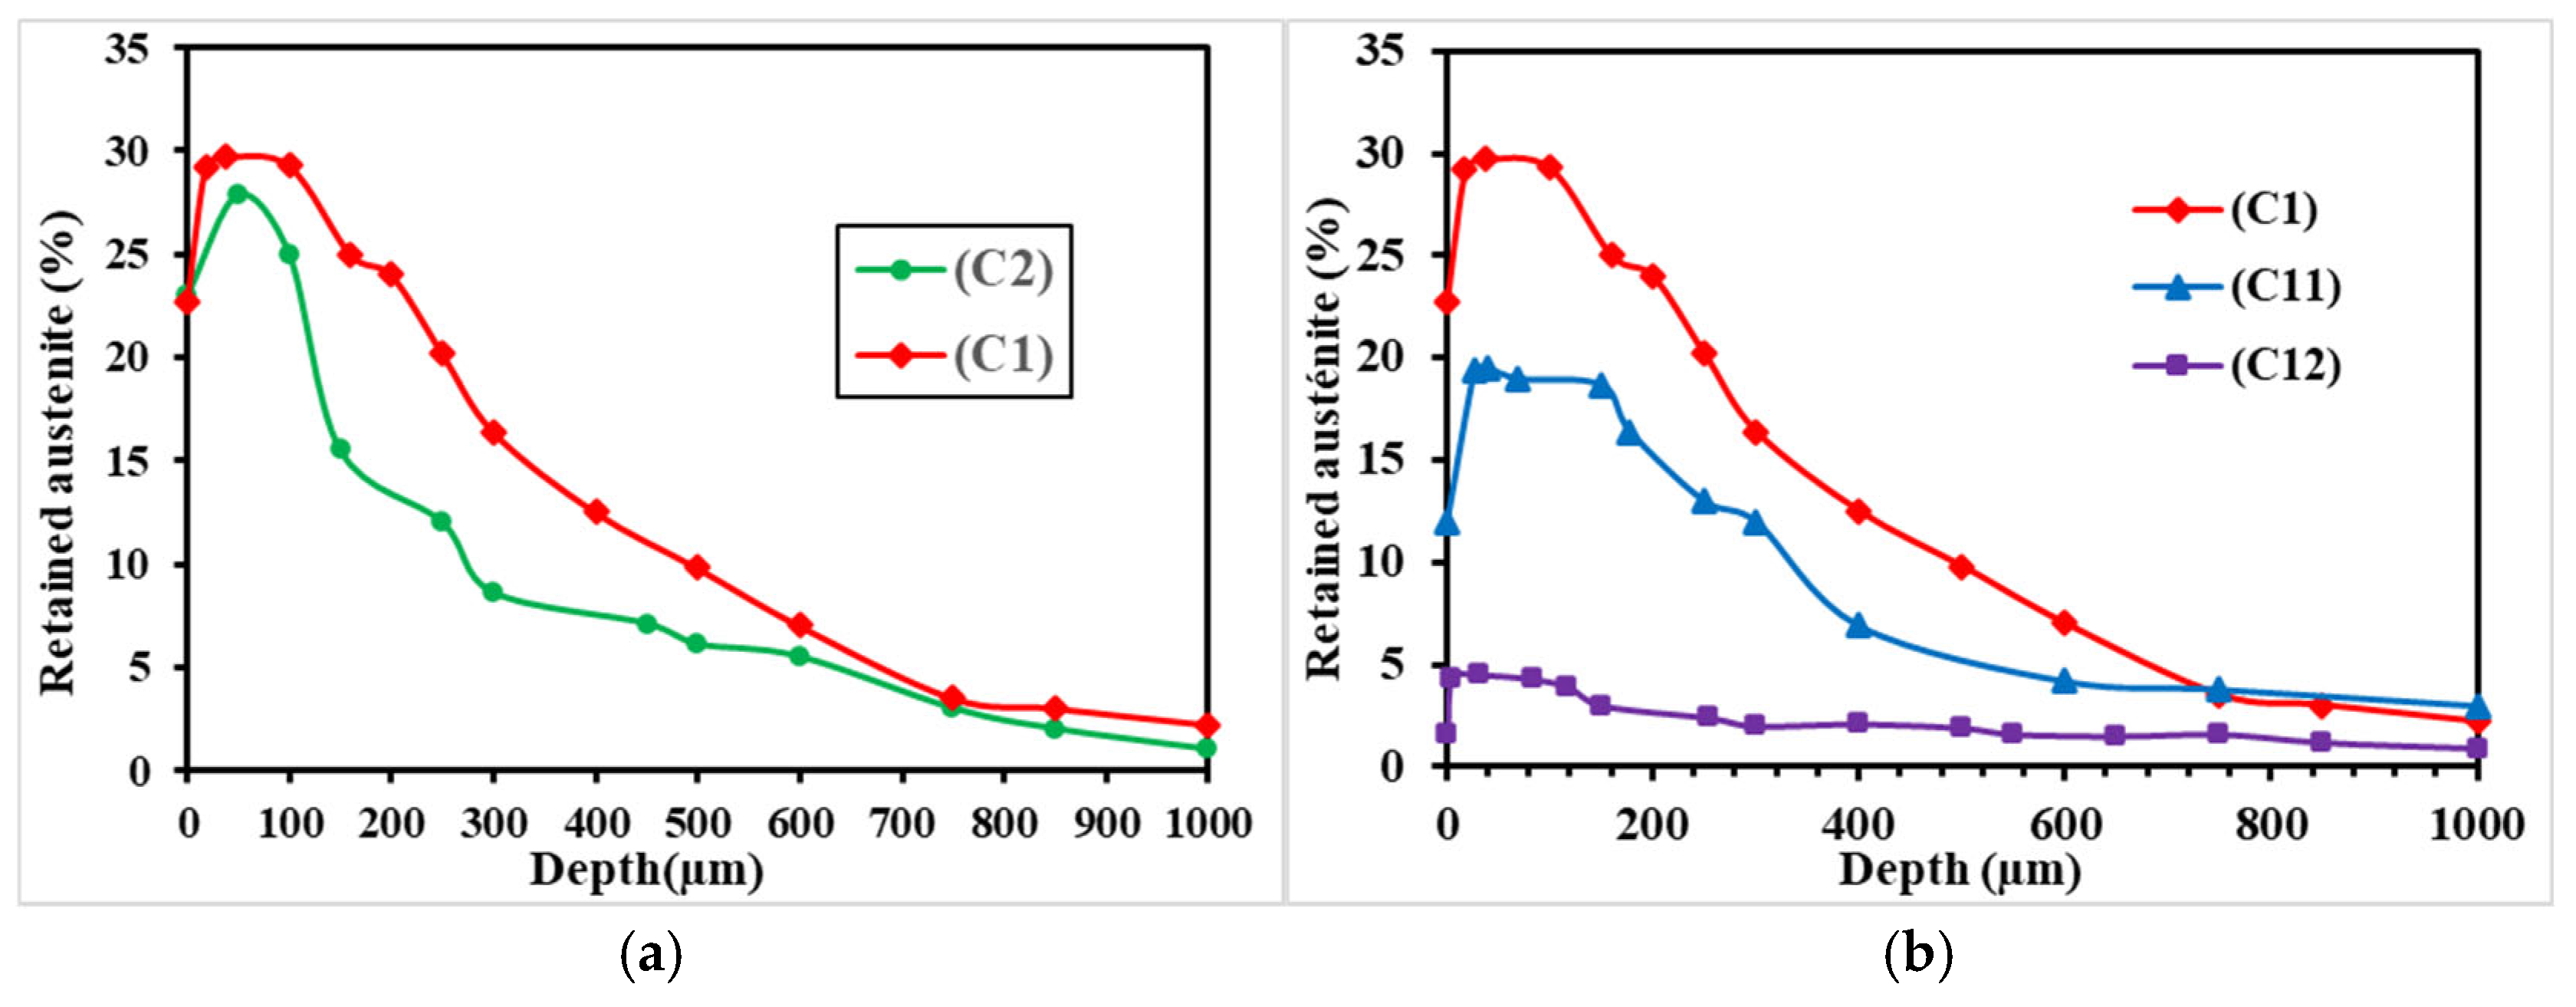
Figure 4 shows the depth profiles of retained austenite for each successive layer. It can be observed that the C1 treatment consistently produced higher amounts of retained austenite compared to the C2 treatment at all points within the hardened layer [1,4]. The highest retained austenite fractions, 30% and 28%, were recorded at a depth of 100 µm for the C1 and C2 treatments, respectively. This fraction remained uniform between 50 µm and 200 µm. Approaching the surface, the retained austenite fraction gradually declined, reaching approximately 12% and 9% for the C1 and C2 treatments, respectively. The higher retained-austenite fraction observed in the C1 condition, in comparison with the C2 condition, is indicative of the reduced carbon potential and the shorter treatment time employed in the C1 process. This shorter treatment time serves to restrict the extent of nitrogen/carbon diffusion, thereby limiting the subsequent decomposition of retained austenite during the cooling process.

3.3. Microhardness Profile

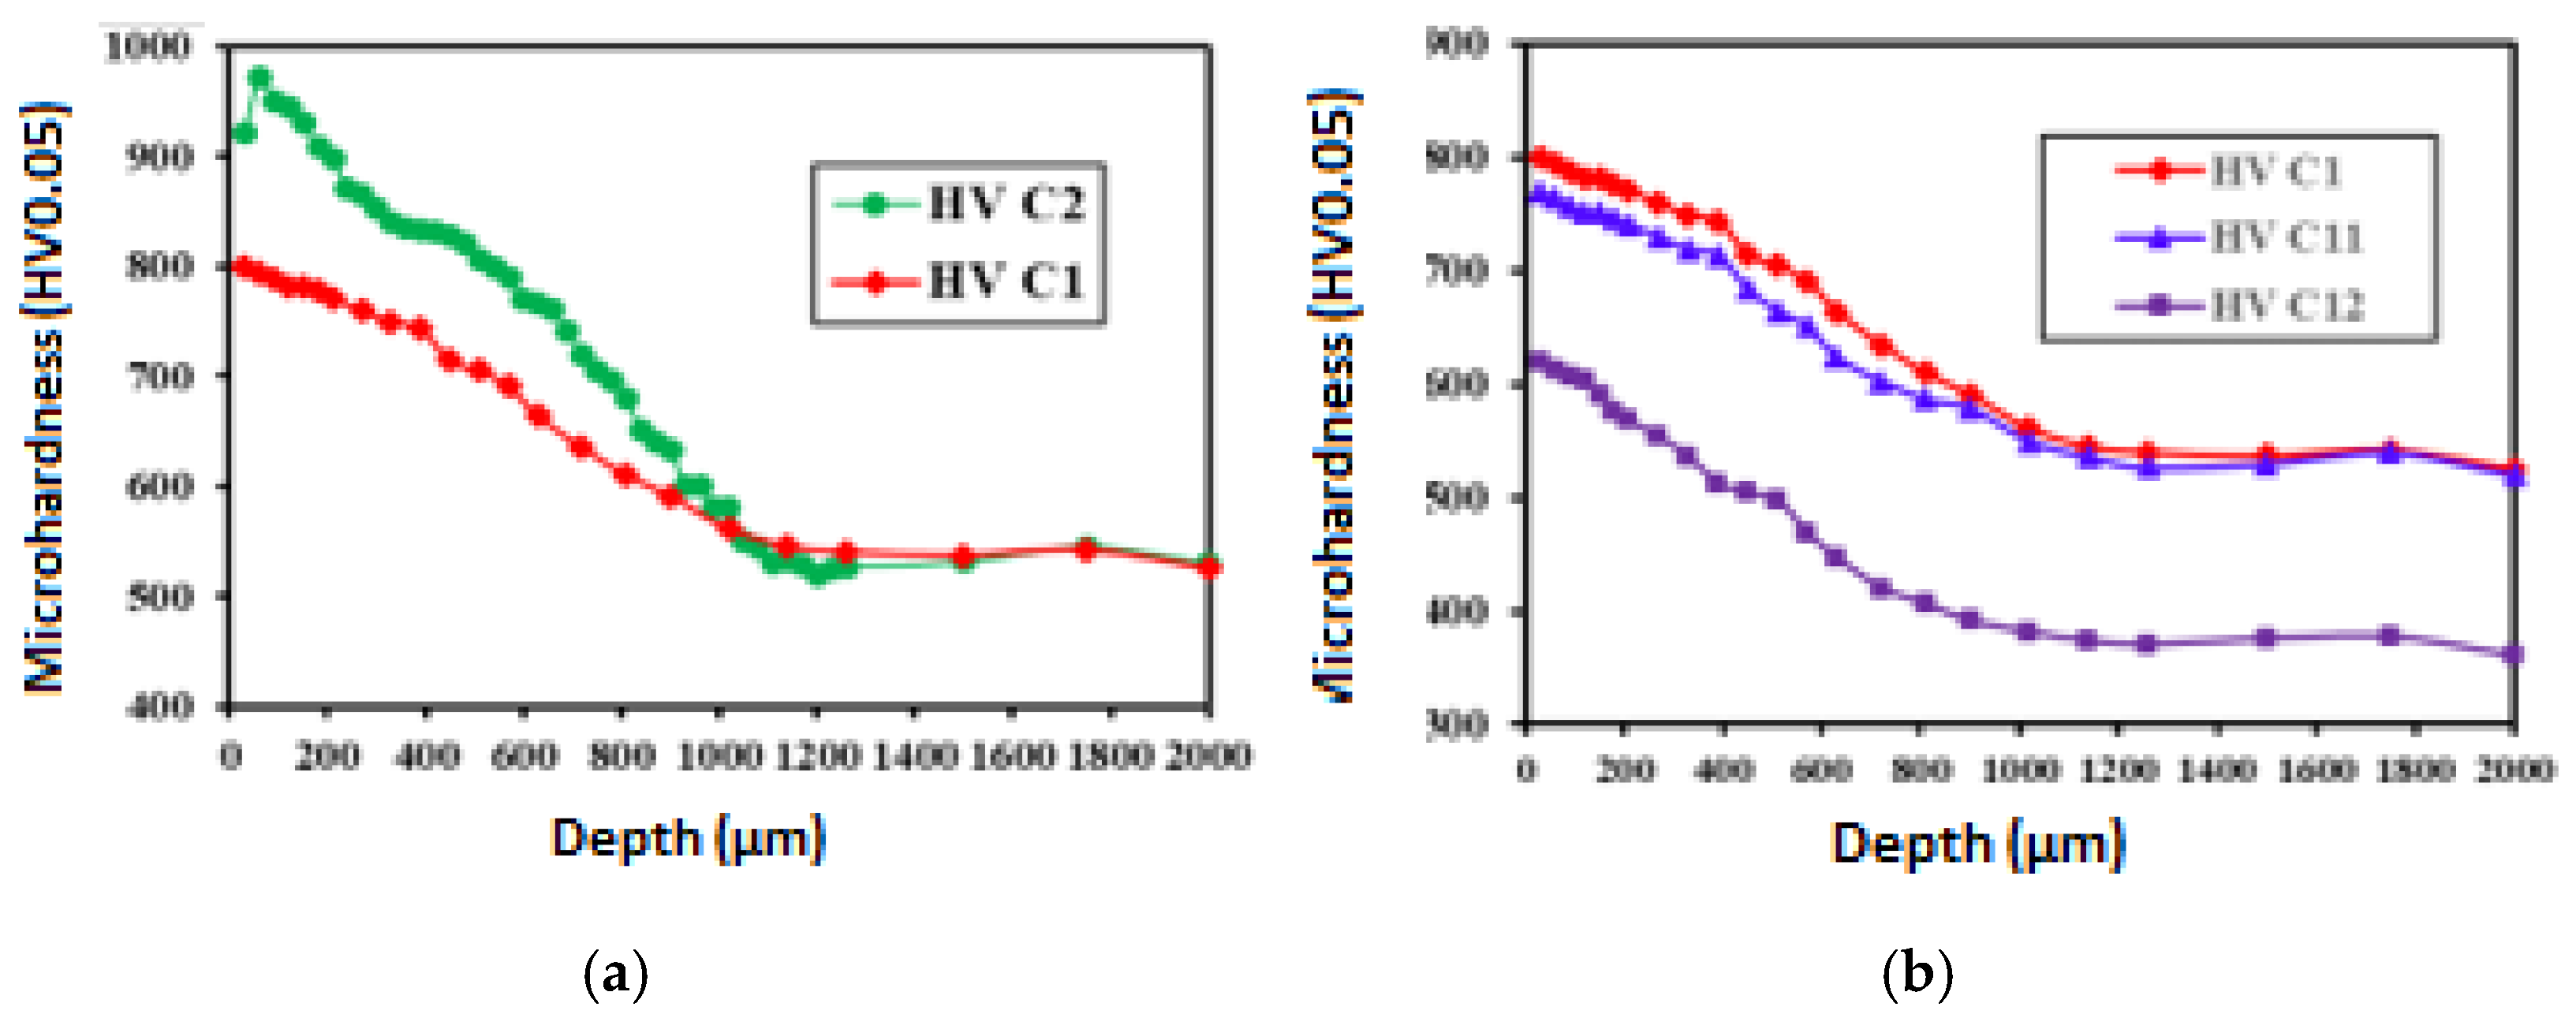
The depth-dependent microhardness profile represents a key factor in characterizing the processing of materials. Figure 5 presents the Vickers microhardness distributions for four carbonitriding conditions—C1, C2, C11 and C12. These profiles reveal a gradual decrease in hardness from the surface toward the specimen’s core, reflecting variations in carbon content. Notably, the surface microhardness values of the carbonitrided layers C2, C1, C11 and C12 are 980, 870, 780 and 630 HV0.1, respectively.
The lower surface hardness recorded after tempering (780 HV0.1 for C11 at 200 °C and 630 HV0.1 for C12 at 550 °C, compared with 870 HV0.1 for the as-carbonitrided C1 condition) reflects the progressive relief of quenching-induced internal stresses and the partial decomposition of retained austenite and transition carbonitrides during tempering, an effect that becomes more pronounced as the tempering temperature increases from 200 °C to 550 °C. Notwithstanding the tempering-driven decomposition mechanism, retained austenite constitutes a softer, more compliant face-centered cubic phase in comparison to the surrounding martensite. Consequently, a higher retained-austenite fraction in proximity to the surface directly contributes to a reduced measured composite microhardness. As demonstrated in Figure 4a,b, the retained-austenite fraction can be directly read at a depth of 0 (surface) for the four conditions (C1 ≈ 28%, C2 ≈ 24%, C11 ≈ 18%, C12 ≈ 4%). A strong positive correlation is observed when these values are correlated with the corresponding surface hardness values (870, 980, 780, 630 HV0.1). This correlation has a high degree of significance, r = +0.89 (n = 4 treatment conditions). This confirms that hardness and near-surface retained-austenite content are set jointly by the same carbonitriding/tempering choice.

3.4. Friction

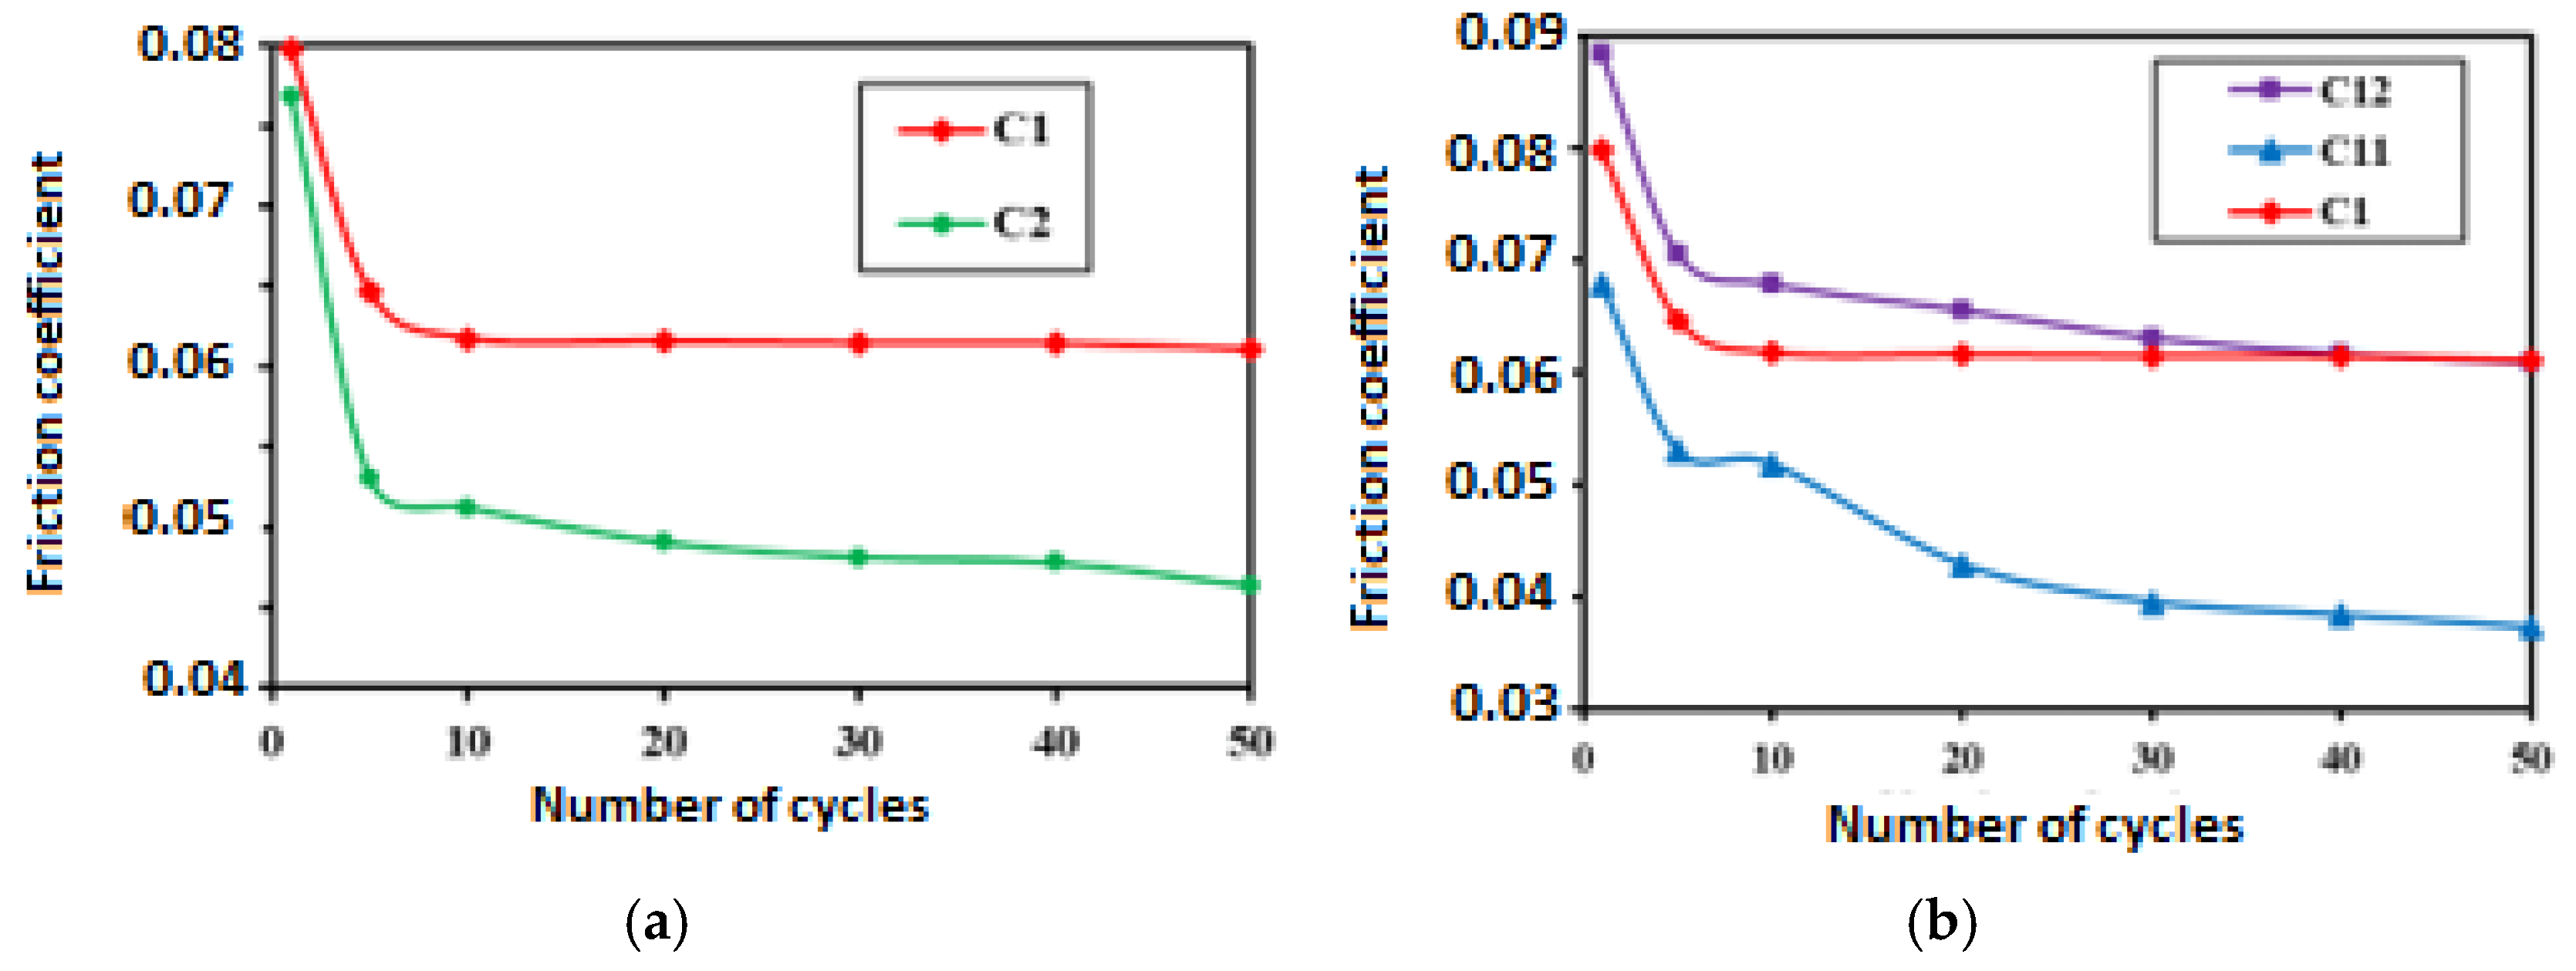
The friction and wear behavior of the carbonitrided layers were investigated using the multi-pass scratch test, as previously reported. The multi-scratching tests were conducted on the untreated steel and the carbonitrided layers C1, C2, C11 and C12. As demonstrated in Figure 6, the coefficient of friction exhibits variation at a normal load of 10 N, as a function of the number of cycles for the various carbonitrided layers. It is evident that the friction resistance demonstrates considerable variation between the layers. It is noteworthy that the C12 state demonstrates the highest friction coefficient, while the carbonitrided layer C2 exhibits the lowest friction coefficient, approximately 0.065.
This study establishes an inverse relationship between surface hardness and friction coefficient. The hardest condition (C2, 980 HV0.1) gives the lowest friction, while the softest tempered condition (C12, 630 HV0.1) gives the highest. To quantify this trend, a Pearson correlation was computed between microhardness (HV) and the friction coefficient using the 16 friction-coefficient values recorded at a single pass (Np = 1) for each of the four hardness conditions across the four applied loads (see Table 6). This gave r = −0.40 (n = 16, t (14) = −1.65, p ≈ 0.12, two-tailed). The negative sign is consistent with the harder-surface/lower-friction trend previously reported. The correlation is moderate and does not reach conventional statistical significance at Np = 1 alone. This is because, as demonstrated by the ANOVA of Table 8, friction at a single pass count is jointly governed by hardness, load and their interaction (HV·FN is significant, p = 0.0027) rather than by hardness alone. Therefore, a pairwise correlation restricted to Np = 1 understates, rather than contradicts, the hardness effect established by the full factorial ANOVA.

3.5. Surfaces Responses

The response surfaces of each parameter (sample hardness, normal force and number of passes) were studied using a complete design of 64 trials (4 × 4 × 4), and the evolution of the coefficient of friction during the scratch tests was observed. Table 5 presents the mean for each response characteristic at each factor level. The table presents a hierarchical structure derived from delta statistics, which serve to evaluate the comparative magnitude of efforts. The delta statistic is calculated as the maximum minus the minimum average for each factor. In Minitab 2020, ranks are assigned based on delta values. Rank 1 is assigned to the value with the highest delta value, rank 2 to the second-highest, and so on. The importance of each factor in determining the response is shown by the hierarchical structure of the ranks.
A substantial body of research has been dedicated to the optimization of scratch test parameters, with a range of techniques being employed. including those of a design of experiments nature, genetic algorithms, and data mining [11,26,27,28]. This approach facilitates the selection of the parameters of scratch tests, thus enabling the achievement of the desired technological results.
The methodology enables the selection of scratch test parameters to achieve the desired outcomes for the specified technological parameters [9,12,18,29]. The objective is to optimize the parameters of the scratch tests (Table 6), the experimental design methodology, the response surface methodology of RSM, and the statistical methodology following analysis of variance. The objective is to optimize the parameters of the scratch tests by employing the experimental design method.

3.5.1. Main Effects of Parameters

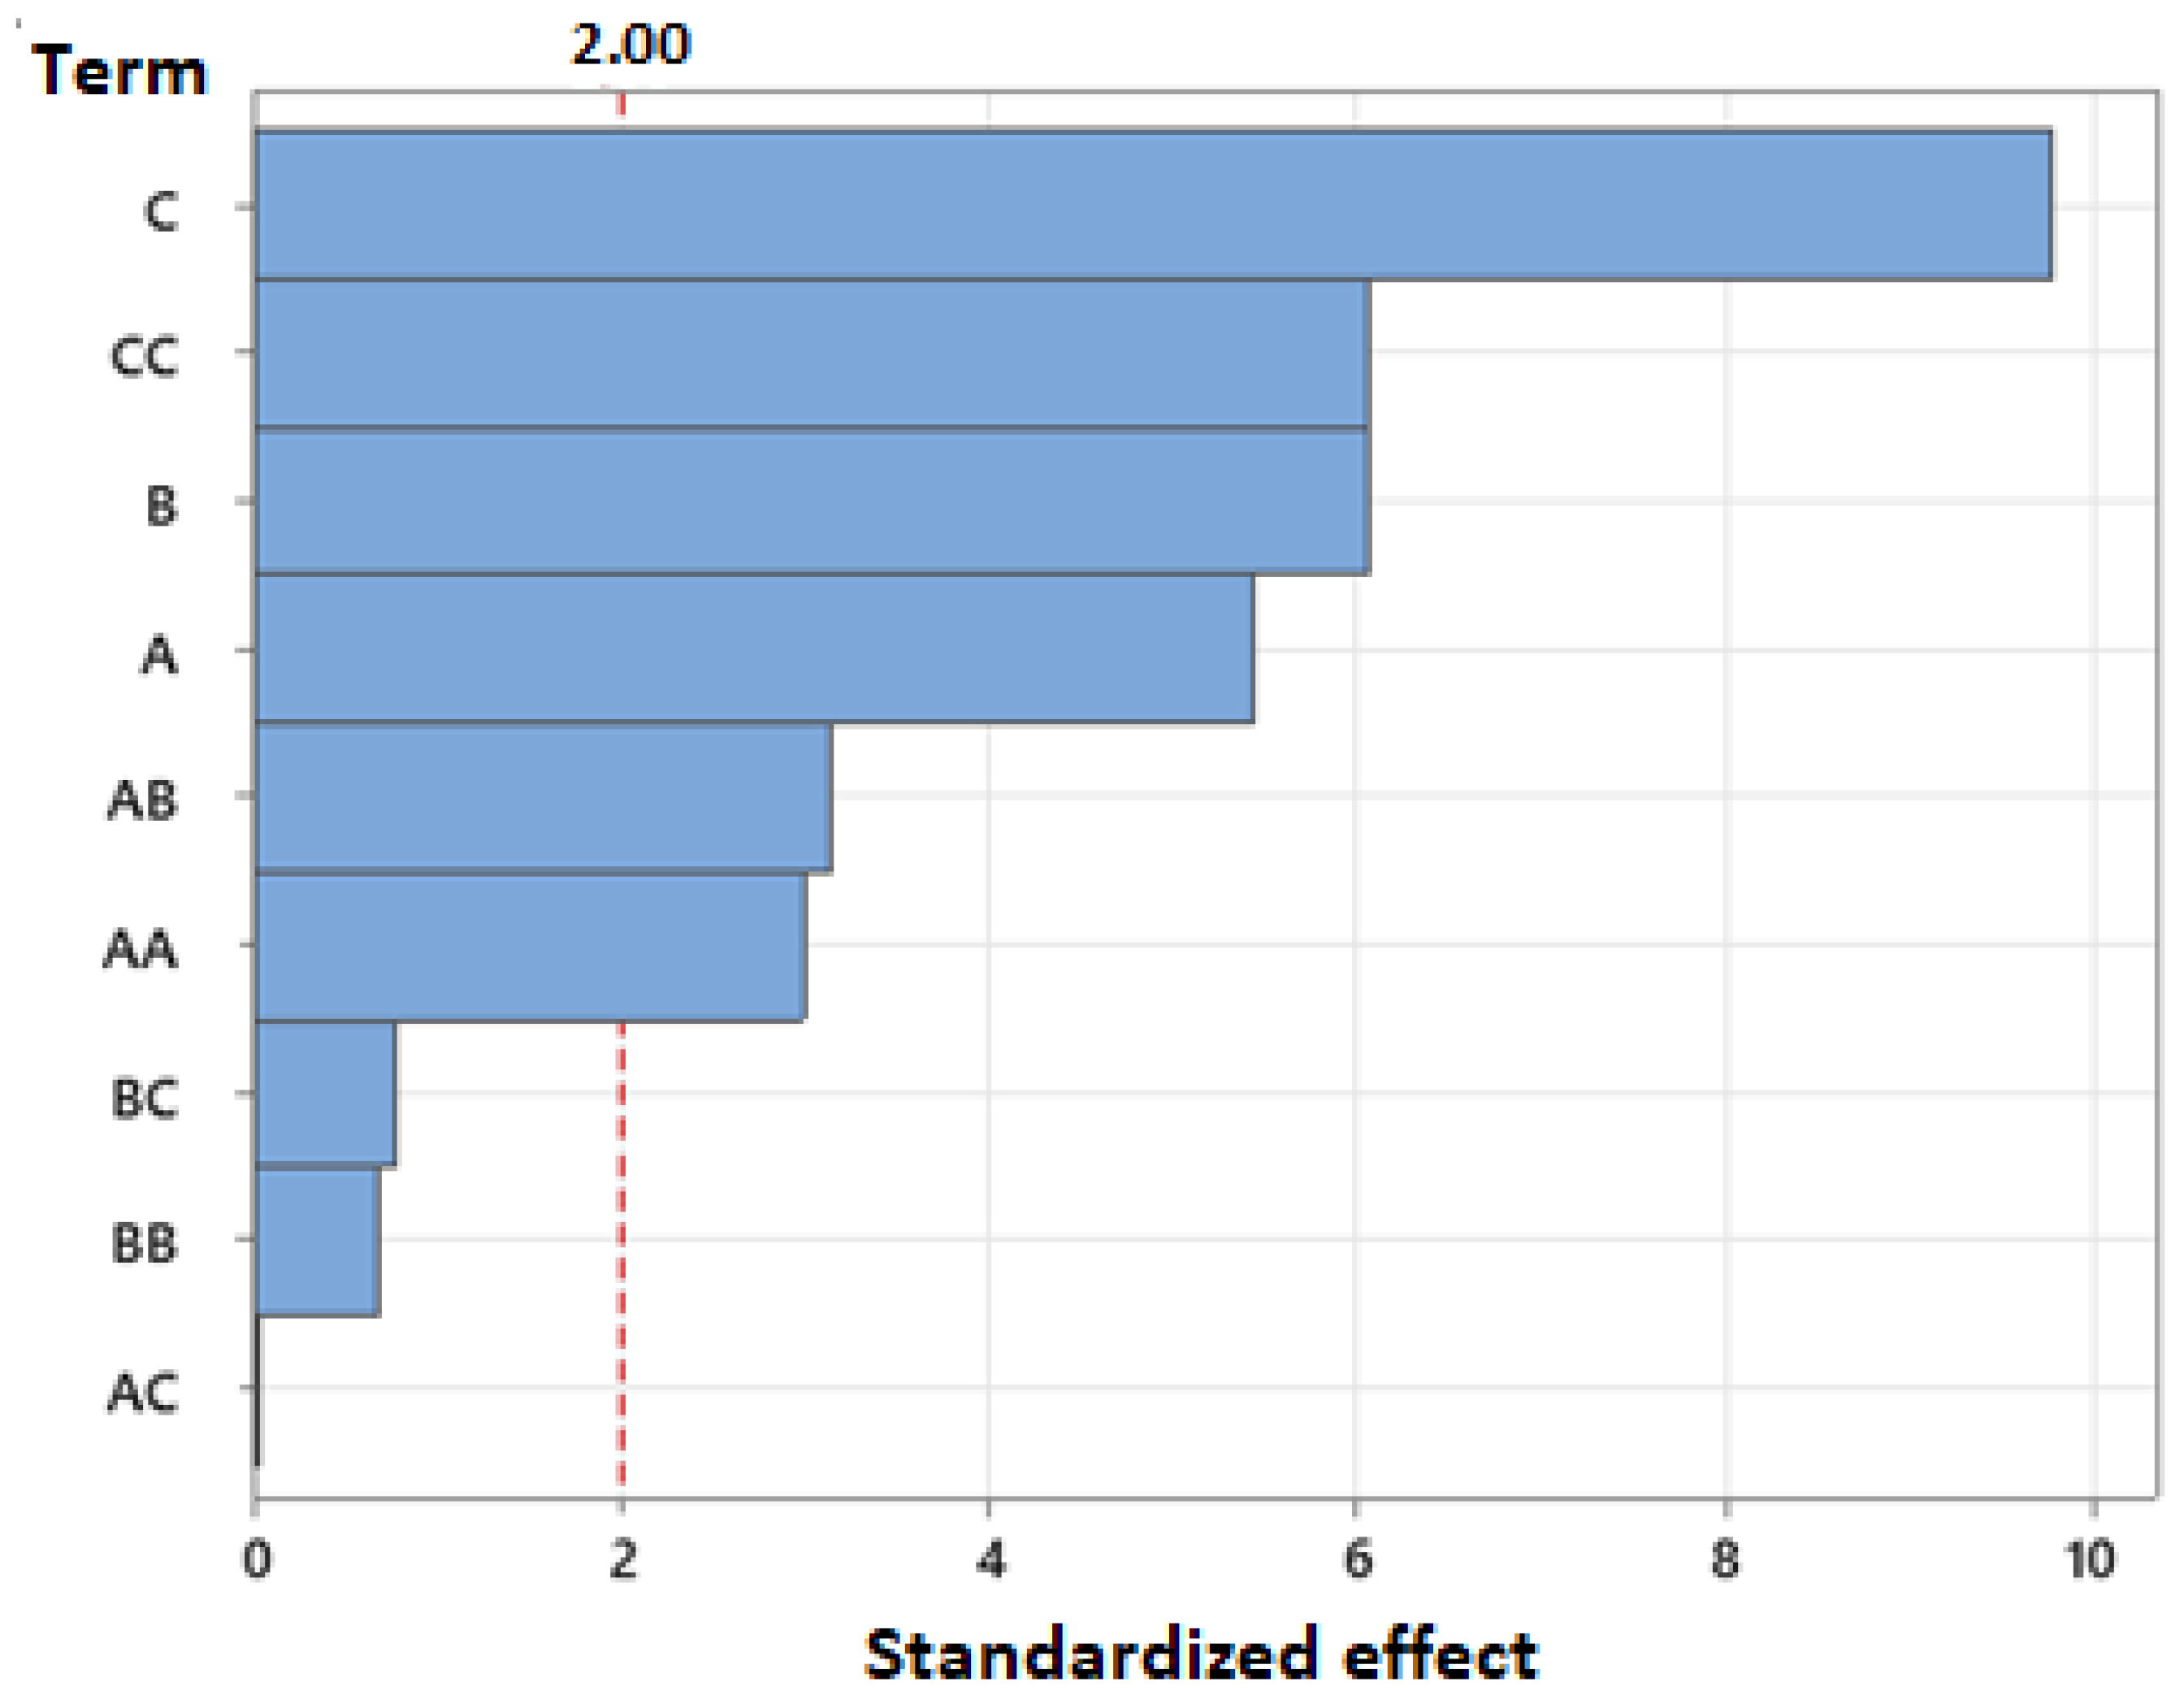
Figure 7 presents the Pareto diagram, which illustrates the relative importance of various parameters utilized in scratch testing. The analysis reveals that the number of multi-passes is the most significant factor influencing the coefficient of friction, followed by normal load and microhardness. Additionally, the interaction between normal stress and microhardness is found to have a substantial impact on the coefficient of friction.

3.5.2. Interactive Influence of Scratch Tests Parameters on Friction Coefficient

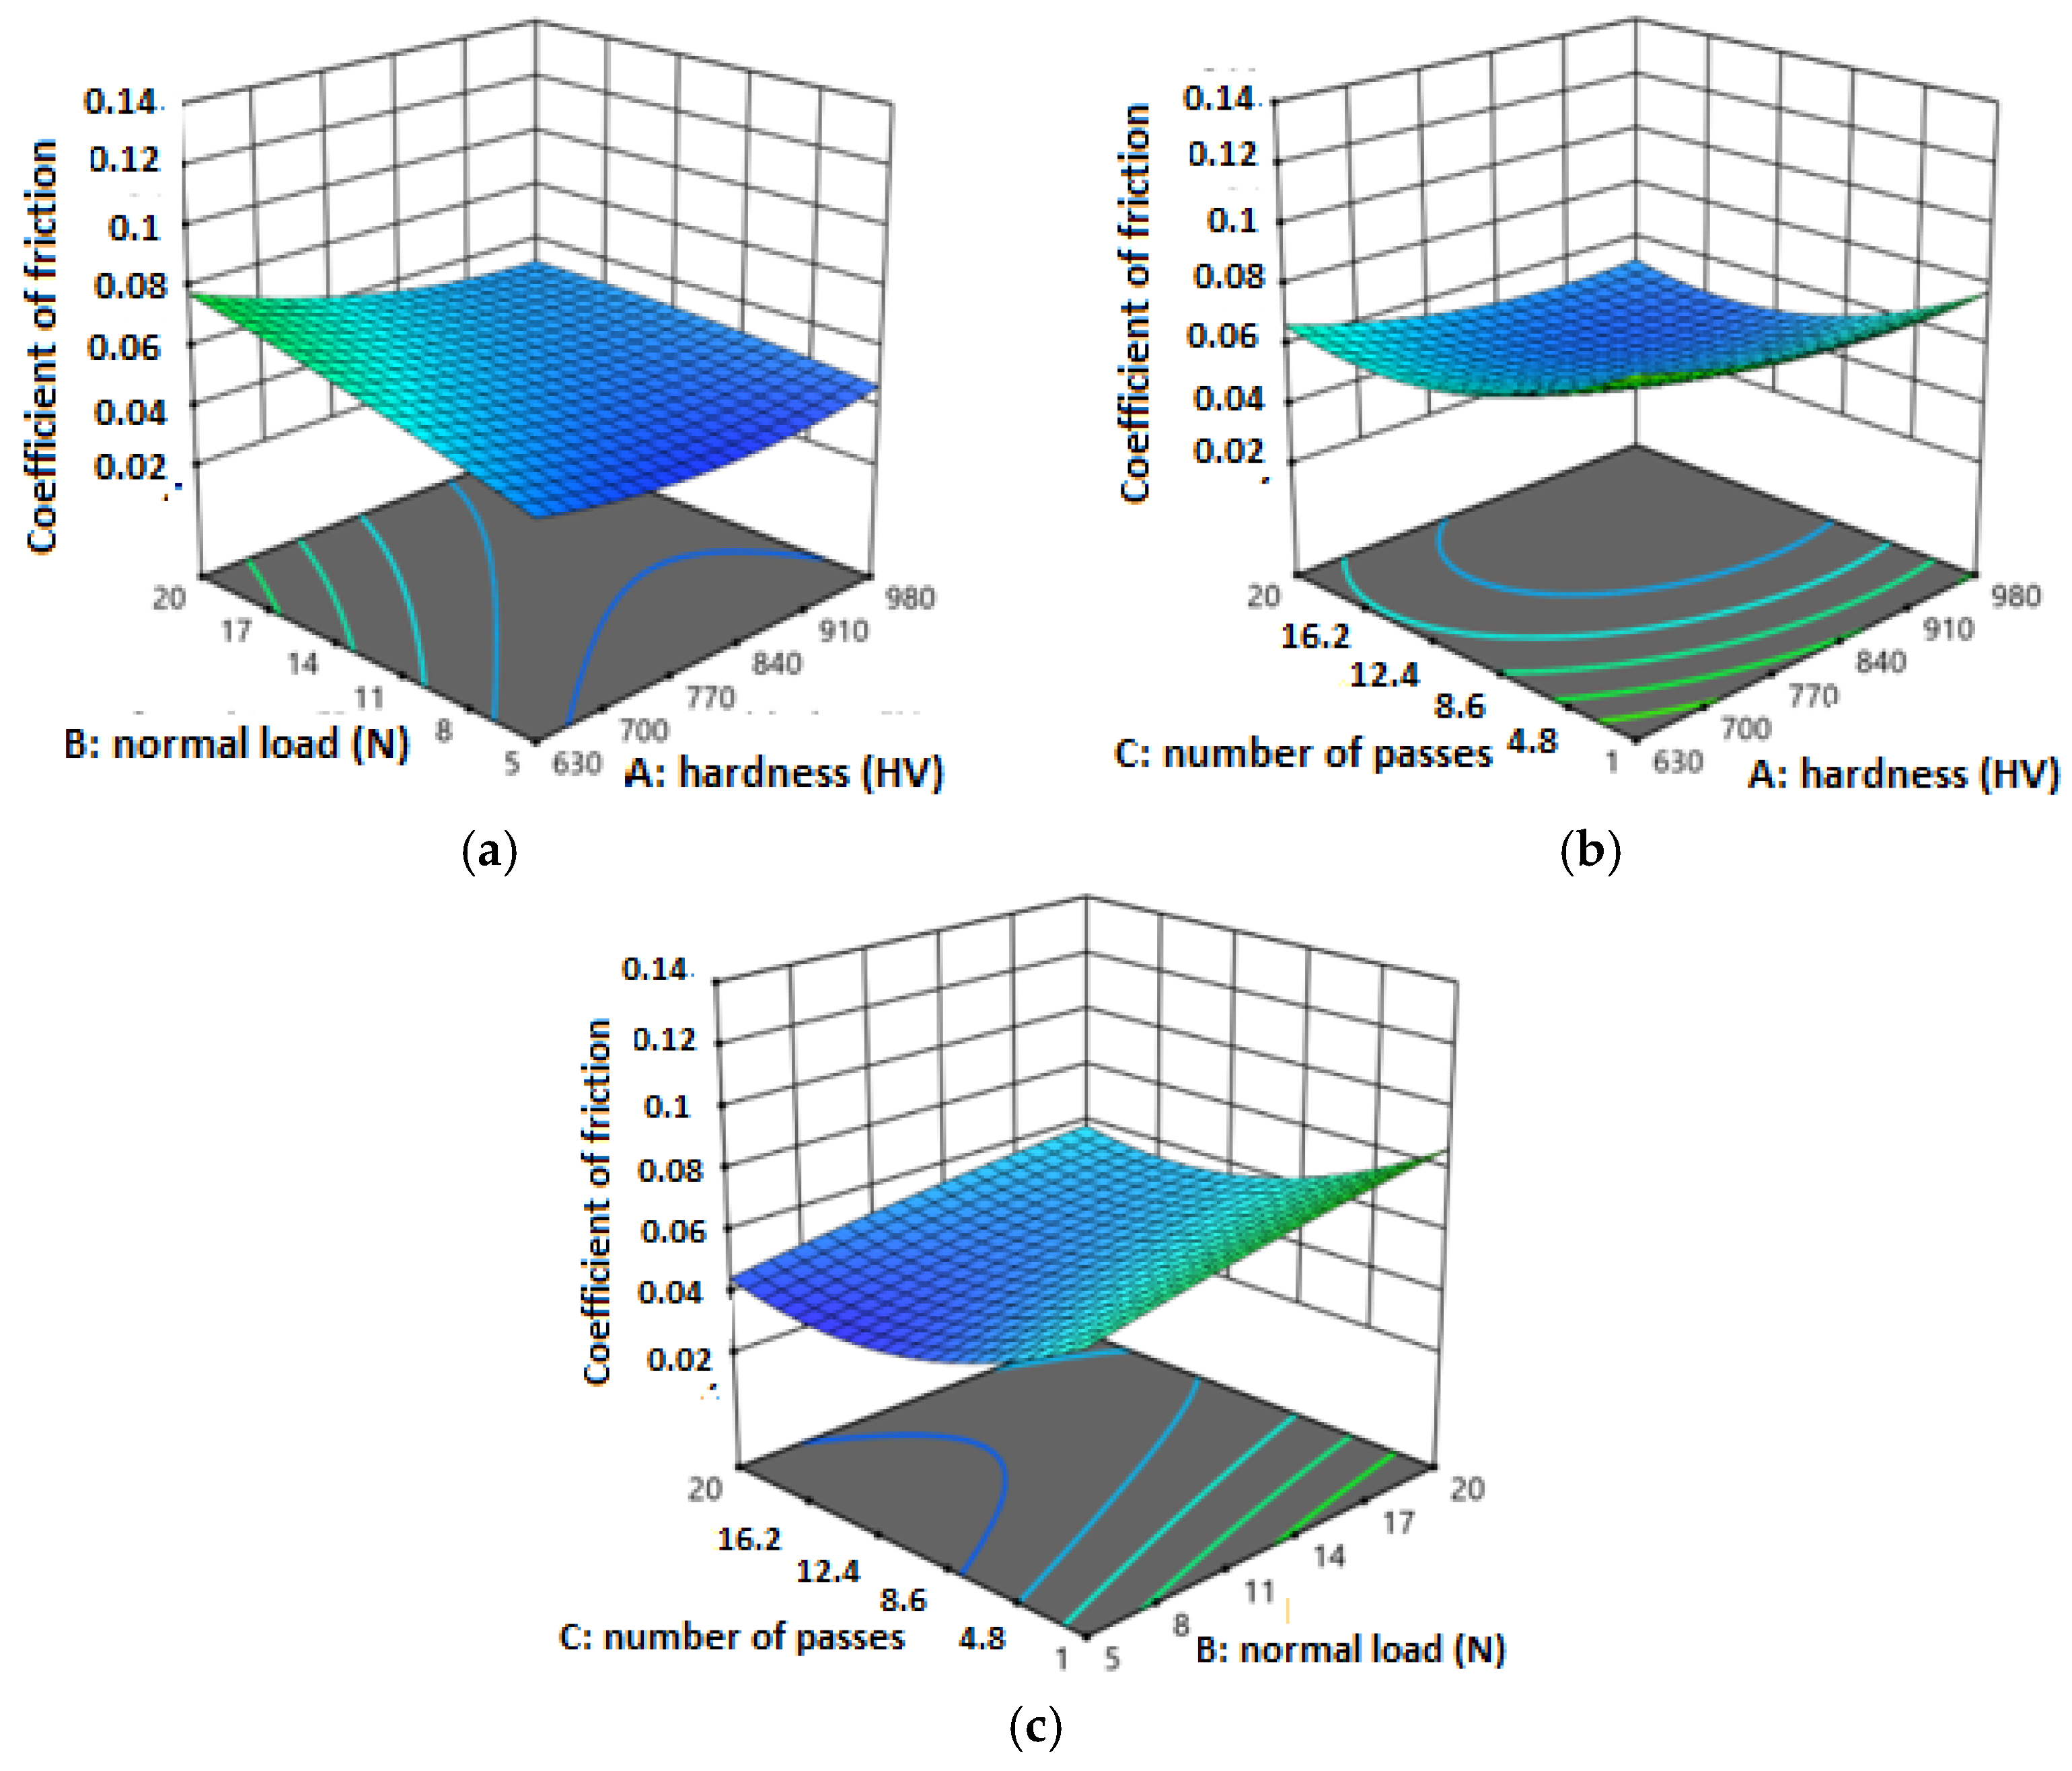
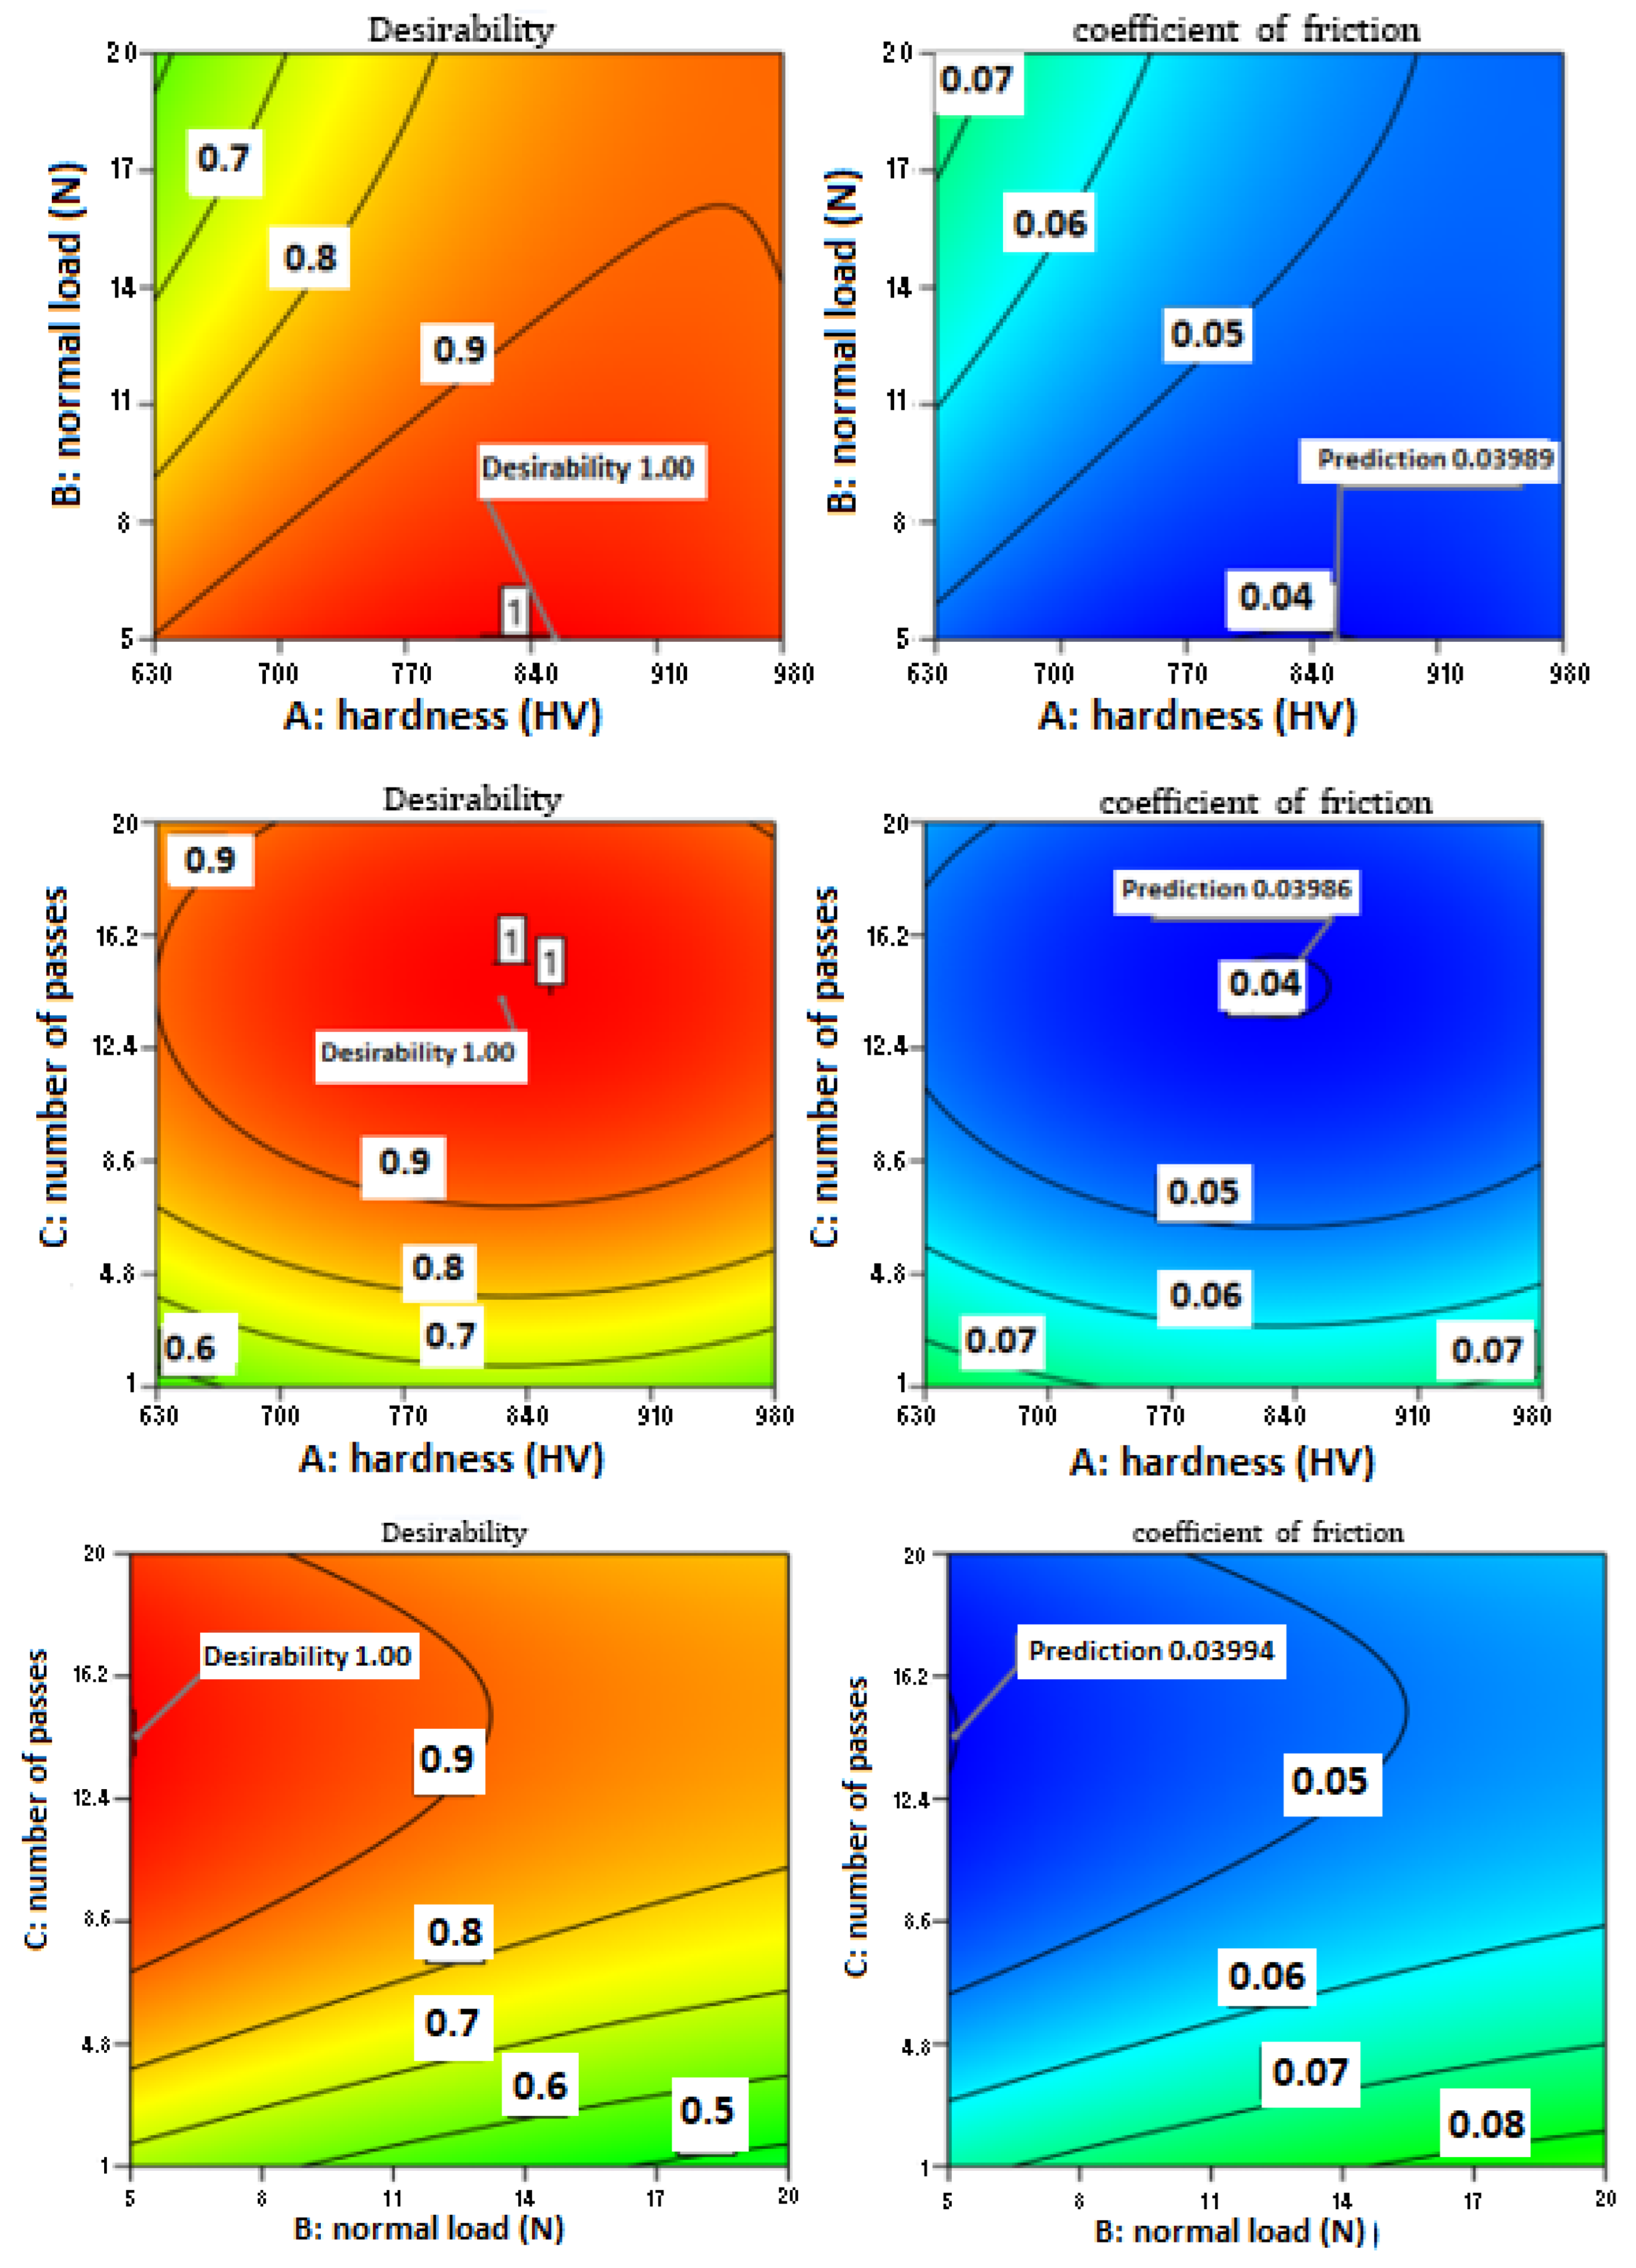
The interaction between normal load, microhardness and number of passes on the coefficient of friction was investigated using response surface methodology. The results are presented in Figure 8a–c. As illustrated in Figure 8a. the response surface demonstrates the interaction between normal load and microhardness on the coefficient of friction when the number of passes is equal to 10. The friction coefficient has been shown to increase by increasing normal load and to decrease with decreasing microhardness. The highest value of the friction coefficient is observed under conditions of maximum normal stress and minimum microhardness, suggesting a significant influence of the interaction between normal load and microhardness on the friction coefficient.
As illustrated in Figure 8b. the response surface demonstrates the interaction between the number of passes and microhardness on the coefficient of friction, when the normal force is 12.5 N. It is evident that the coefficient of friction increases rapidly with several passes lower than 12. The highest value of the friction coefficient is observed at the lowest hardness and number of passes. This finding indicates that the interaction between hardness and the number of passes applied exerts a significant influence on the coefficient of friction.
Figure 8c illustrates the interaction between normal load and number of passes on the coefficient of friction when the microhardness is 805 HV. The coefficient of friction increases with normal force, irrespective of the number of passes. The inflection point is located at approximately 12; the lowest possible value for the coefficient of friction is obtained when the normal load is at its minimum and the number of passes is 12. This finding suggests that the interaction between the number of passes and the normal load on the coefficient of friction is significant. These results indicate that the interactions between normal loads, microhardness, and number of passes have a significant impact on the coefficient of friction, and that optimizing these parameters is crucial for minimizing friction and wear.

3.5.3. Regression Equation

The objective of this study is to investigate the relationship between the friction coefficient (f) and three independent variables: normal load (FN), number of passes (Np) and microhardness (HV). This is achieved through simple linear regression analysis, where the friction coefficient is the dependent variable and the independent variables are the explanatory variables. The regression equation, based on a cubic model (Table 7), is as follows:
f = 0.1887 − 0.000324 (HV) + 0.00546 (FN) − 0.00434 (Np) + 0.000001 (HV)2 − 0.000027 (FN)2 + 0.000155 (Np)2 − 0.000004 (HV × FN) − 0.000019 (FN × Np)
where f is the friction coefficient (dimensionless); HV is the Vickers surface microhardness, HV0.1 (range 630–980); FN is the normal load, N (range 5–20); and Np is the number of scratch passes (range 1–20). This equation represents the relationship between the friction coefficient and the three independent variables, highlighting the interactions and quadratic effects of these variables on the friction coefficient.
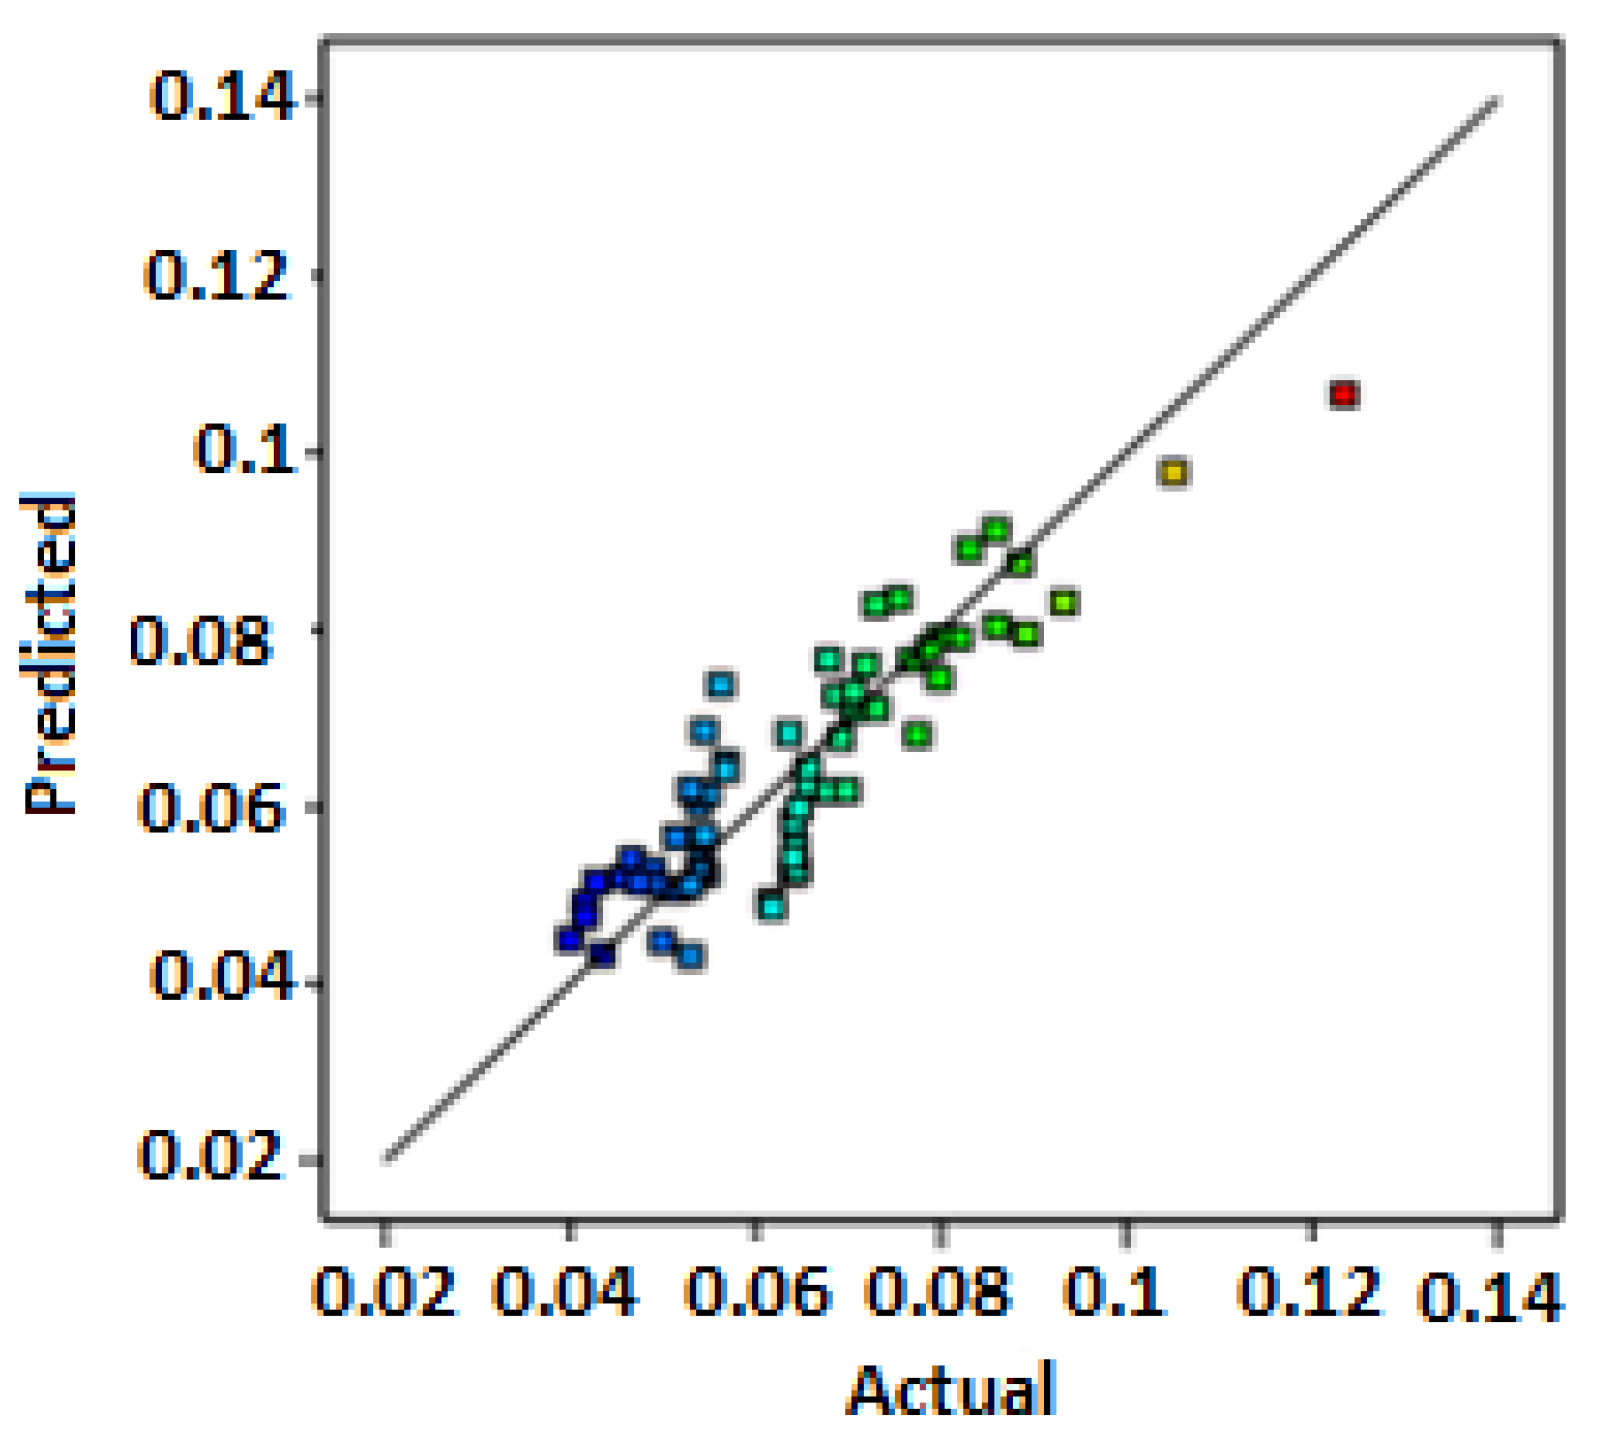
As demonstrated in Figure 9, a linear relationship is evident between the actual and predicted values for the coefficient of friction. The figure demonstrates a high degree of agreement between the response surface methodology (RSM) model predictions and the experimental results. This indicates the accuracy and reliability of the RSM model in predicting the coefficient of friction.

3.5.4. Analysis of Variance

The analysis of variance (ANOVA) for the quadratic model used to estimate the friction coefficient is presented in Table 8. The results indicate that three parameters—hardness, load and number of passes—are effective and have significant effects on the friction coefficient. The R2 value of the final model is 95.50%, indicating a strong fit. Statistical analysis revealed that hardness (15.02%), load (11.93%) and number of passes (4.40%) had the largest effects on the friction coefficient, respectively.
Figure 10 presents the experimental model’s predictions, highlighting the ideal values of the input parameters that can provide optimal responses. The desirability of the individual responses obtained from the design tool is 1.00 for the coefficient of friction, indicating a perfect alignment between the predicted and desired outcomes. This suggests that the model has successfully identified the optimal input parameters for achieving the desired coefficient of friction.
It is important to note that the delta-statistic ranking in Table 5 identifies the number of passes as the factor producing the largest shift in the mean friction response (Rank 1), and this is now confirmed rather than contradicted by the corrected ANOVA decomposition above: considering linear and quadratic contributions together, the number of passes accounts for approximately 50.0% of the total variance, ahead of hardness (≈14.6%) and load (≈14.0%). This finding is consistent with the near-comparable bar heights obtained for hardness, load and number of passes in the Pareto diagram and resolves the discrepancy present in the original manuscript.

3.5.5. Optimal Solution

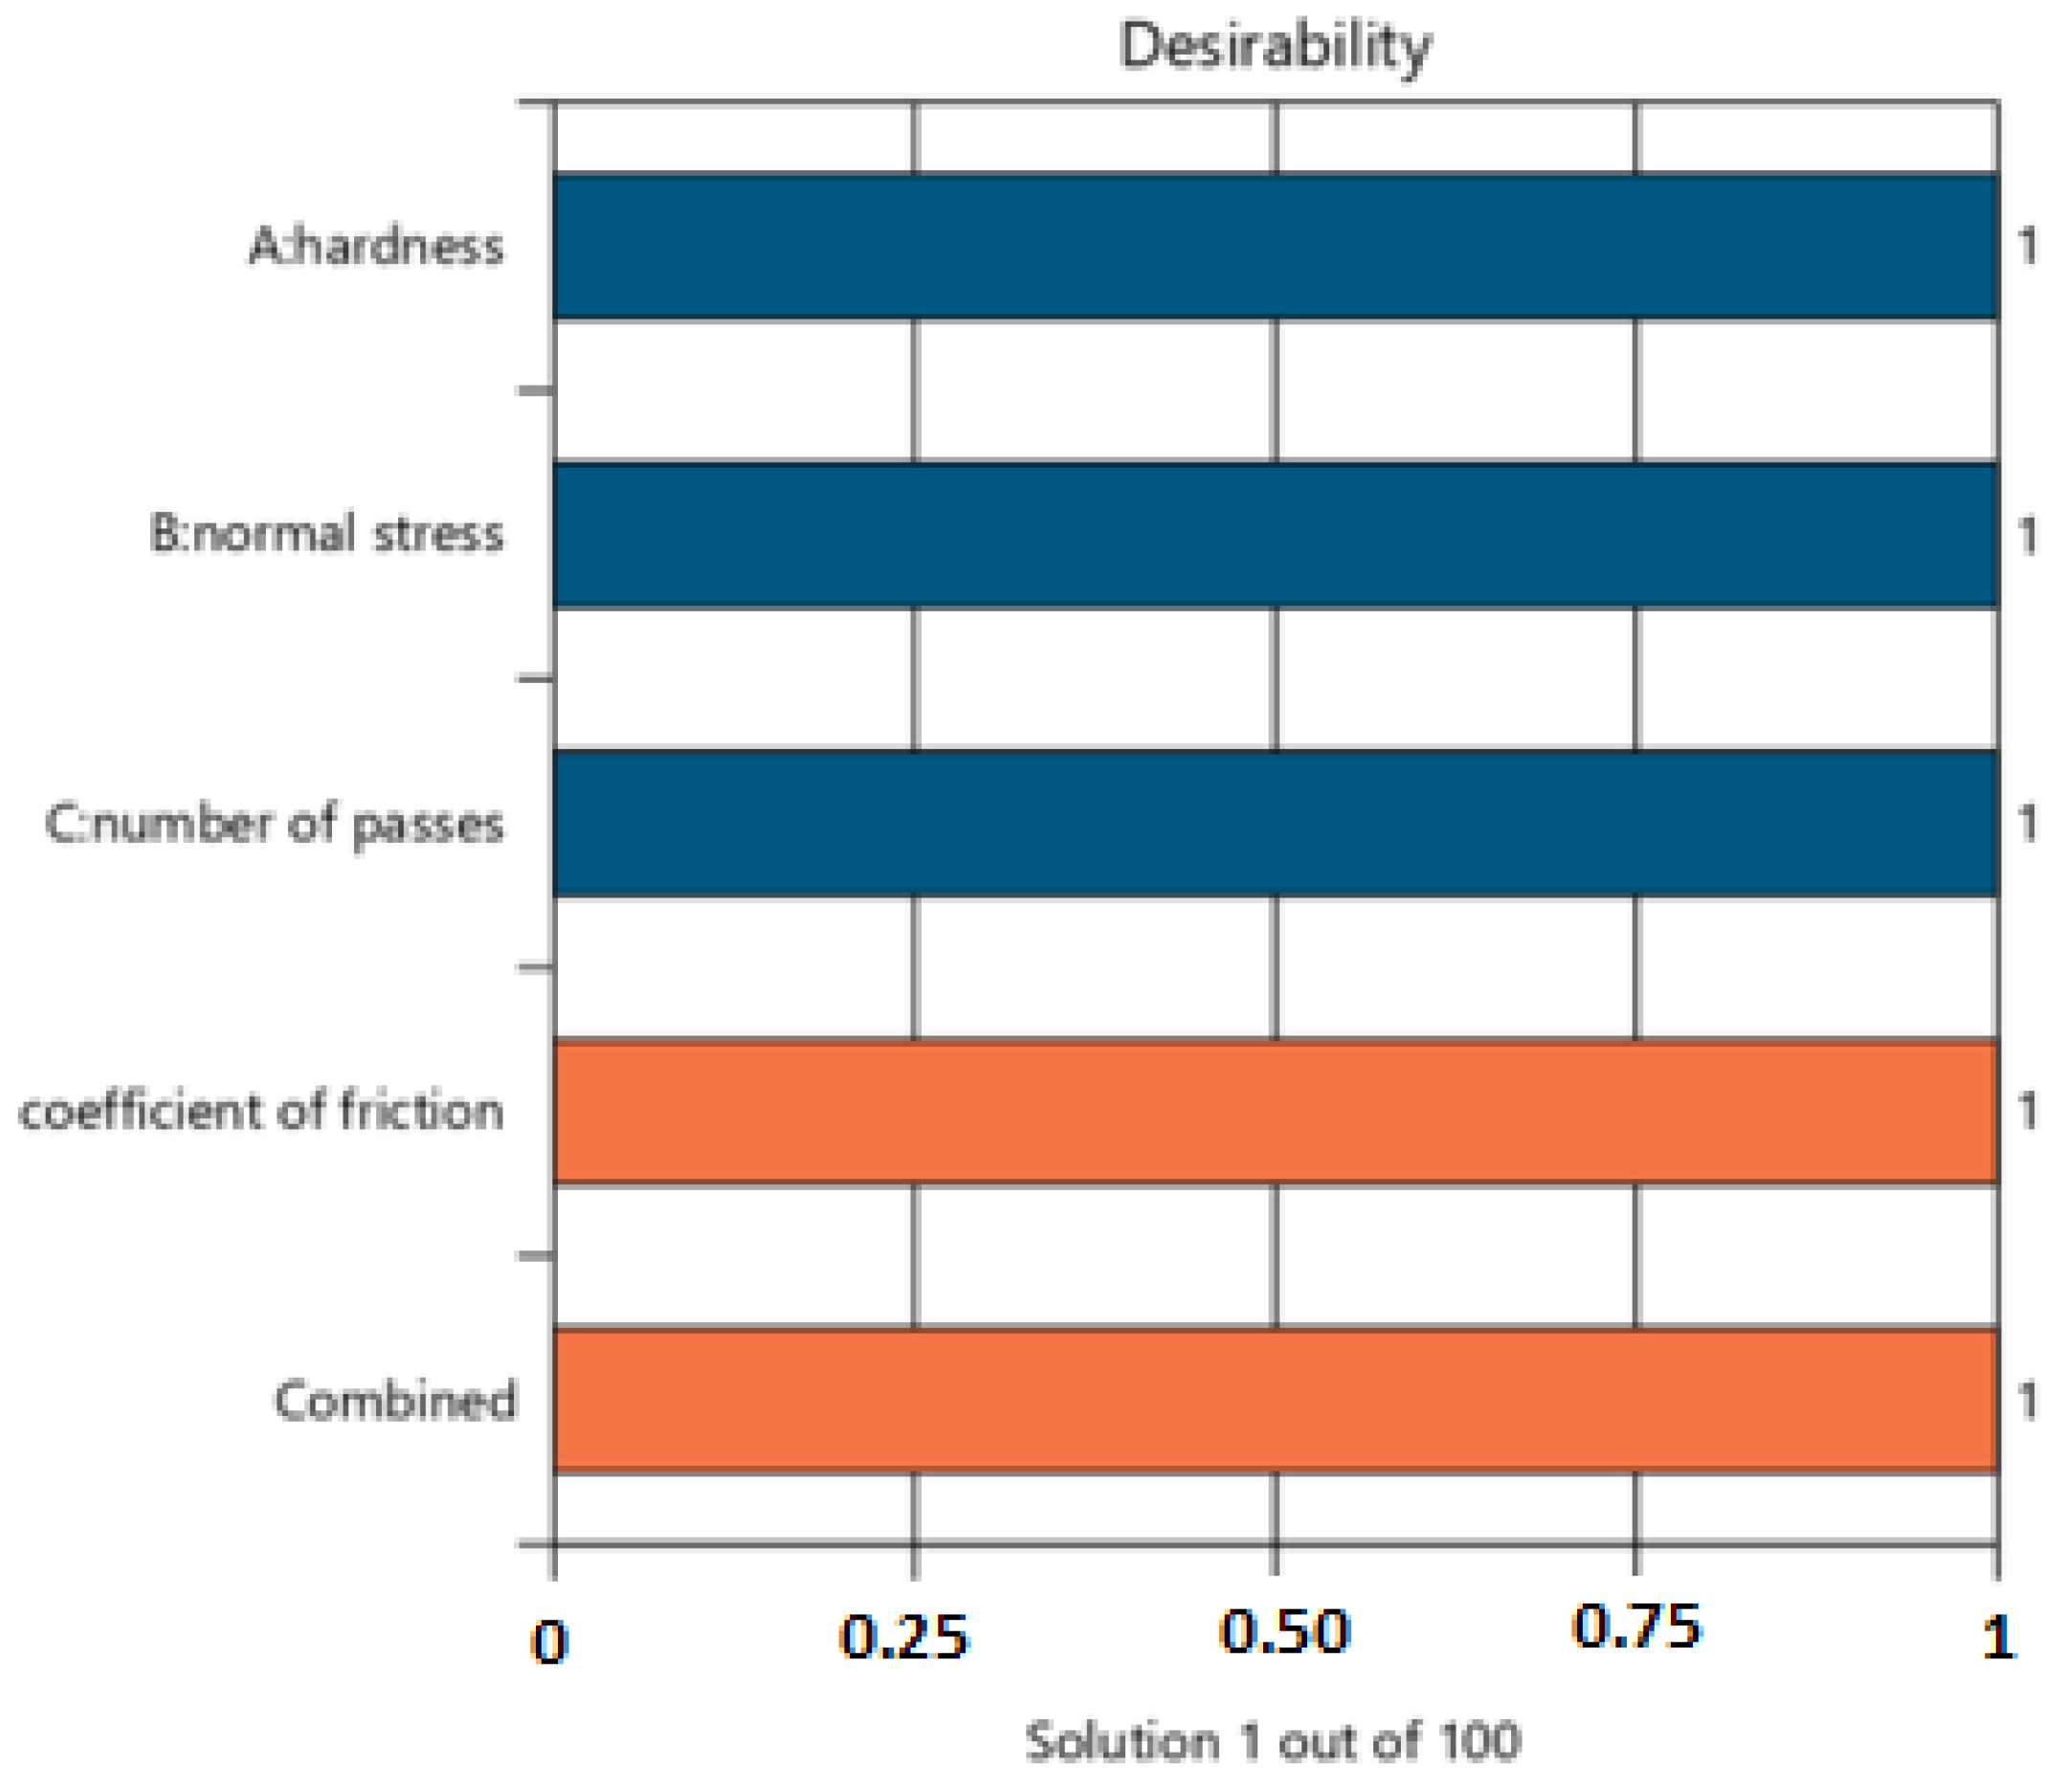
The settings for the input and output parameters that are best for them are shown in Table 9. The input parameters are within the specified range and exhibit a positive effect on the output. In the optimal setting, it is important to note that the output parameters are minimized and desirability is optimized. The optimal condition is standardized based on the operating environment that produced the highest desirability value. Figure 11 shows the optimal solution for each factor in the form of a desirability bar graph. The first three bars on the desirability graph represent the input factors, with the subsequent two bars showing the anticipated optimal responses.
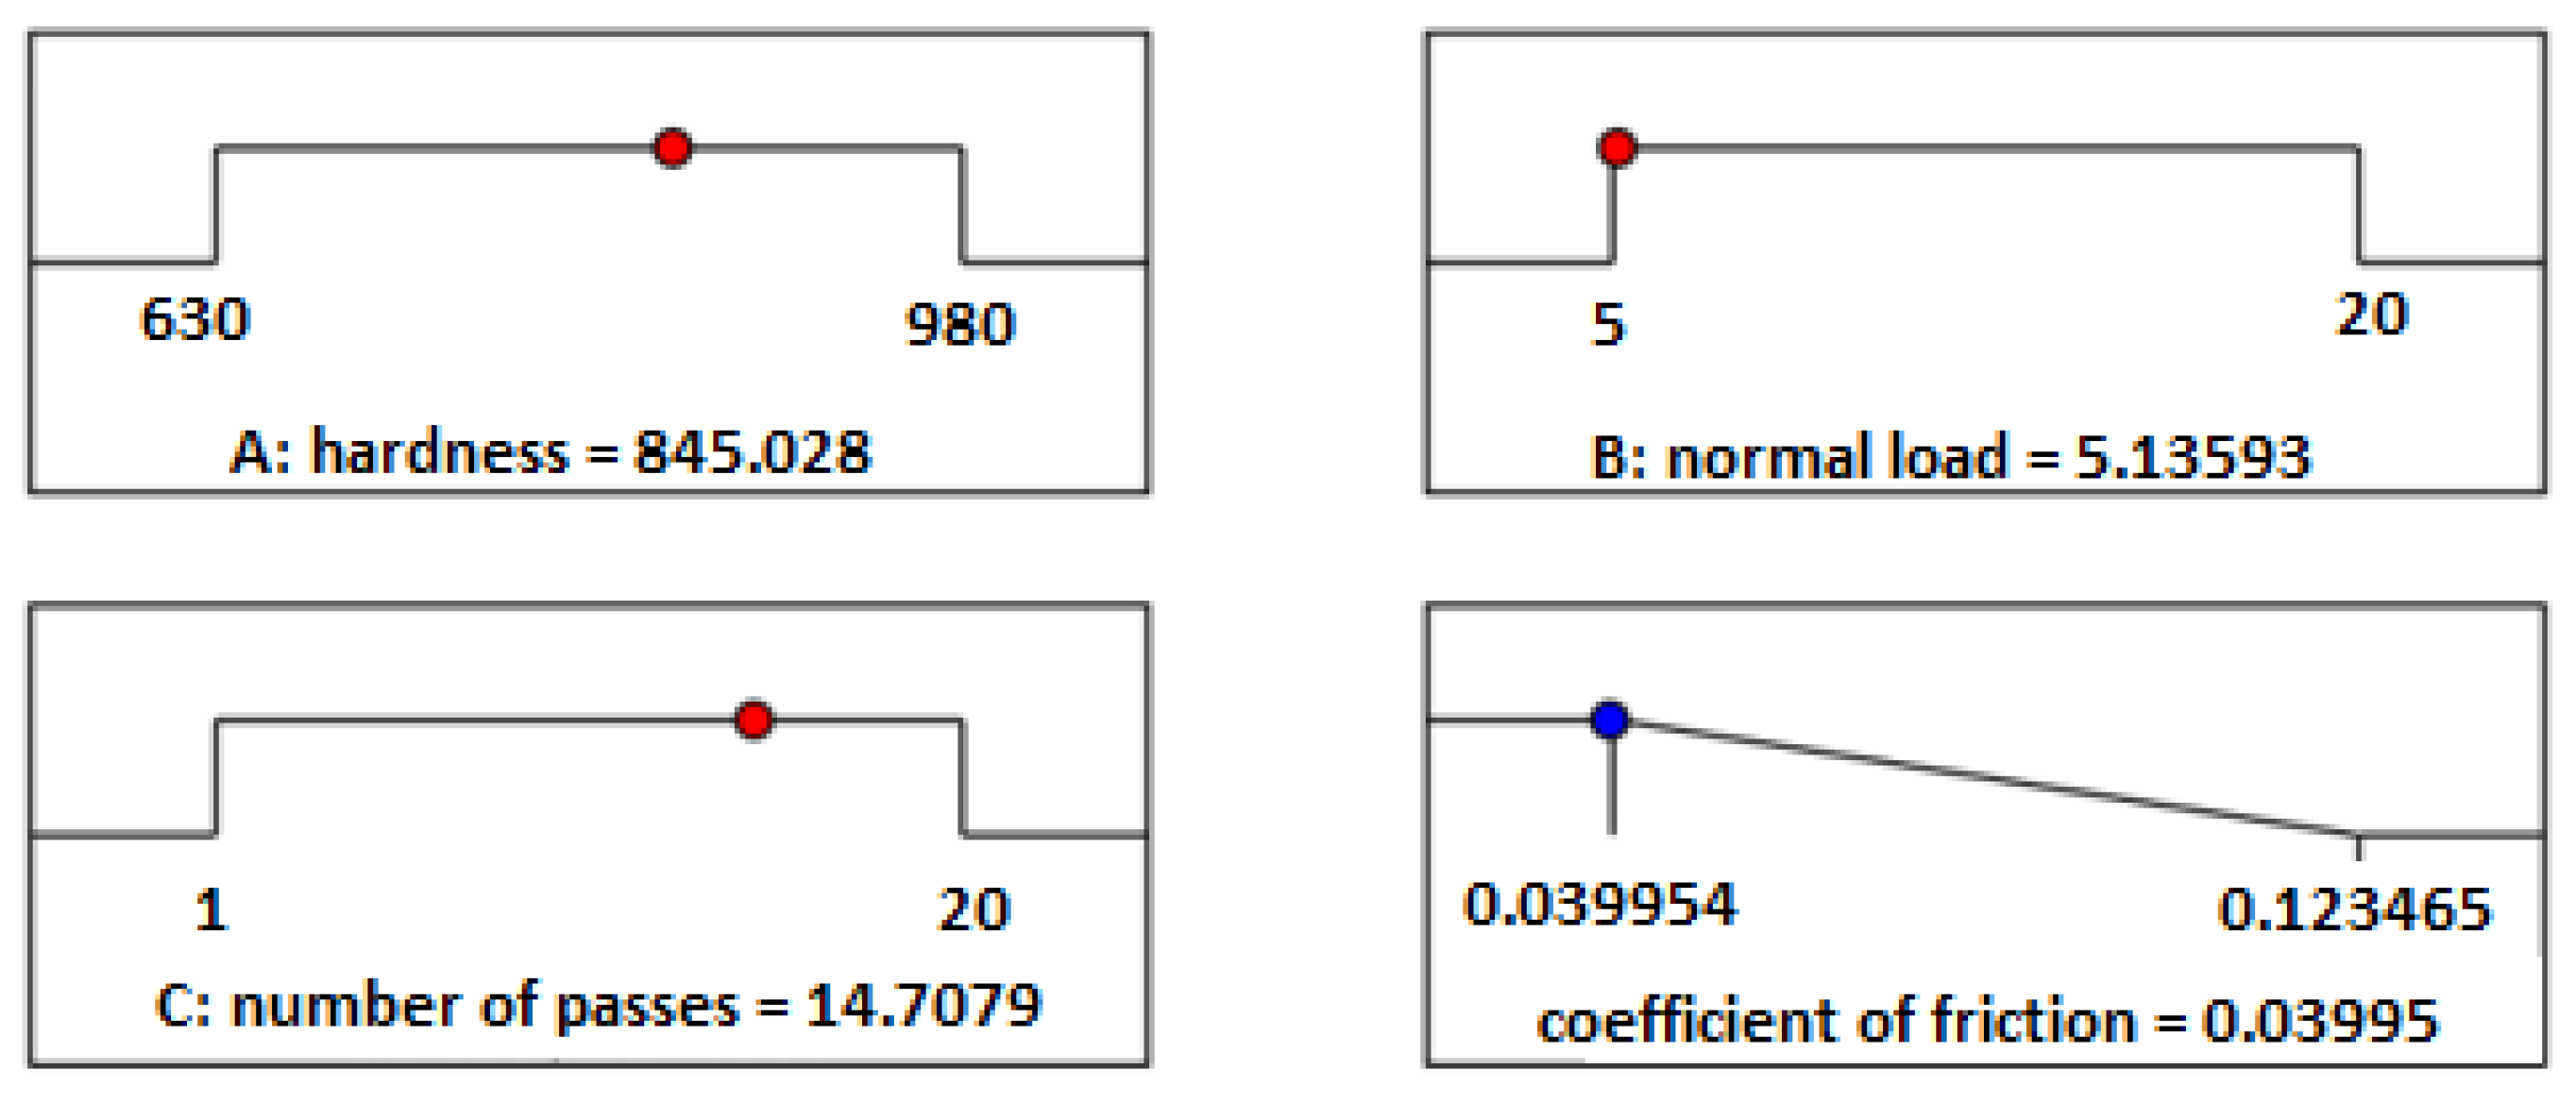
The desirability of each response is presented using numerical optimization graphs. Figure 12 shows the ramps of optimized numerical values. Using ramps makes interpretation easier by showing the individual graphs, with the dot on each ramp denoting the predicted response of the solution. In this instance, the value to be minimized or maximized is presented as a slope or ramp. Figure 13 demonstrates the overlay graph employed for optimization; the flag on this graph indicates the optimal solution. The use of the ramp function and overlay plots makes it easy to see how multi-objective optimization works, and this, in turn, makes it easier to understand and interpret the optimized values.
In this instance of optimization, the variables of hardness, load, and number of passes are considered as the independent inputs or design variables. Conversely, surface hardness is fixed by the selection of the carbonitriding/tempering condition, rather than being a continuously tunable output. Additionally, the depth of the case (hardened layer) was not measured as a distinct response within the present factorial design. The microhardness depth profile was the sole response recorded, primarily for the purpose of characterizing the treatments. This is a scope limitation of the present single-response (friction) desirability optimization. An extension of this to a true multi-response formulation that jointly minimizes friction while maximizing case depth is identified as a priority direction for future work.

3.6. Prediction

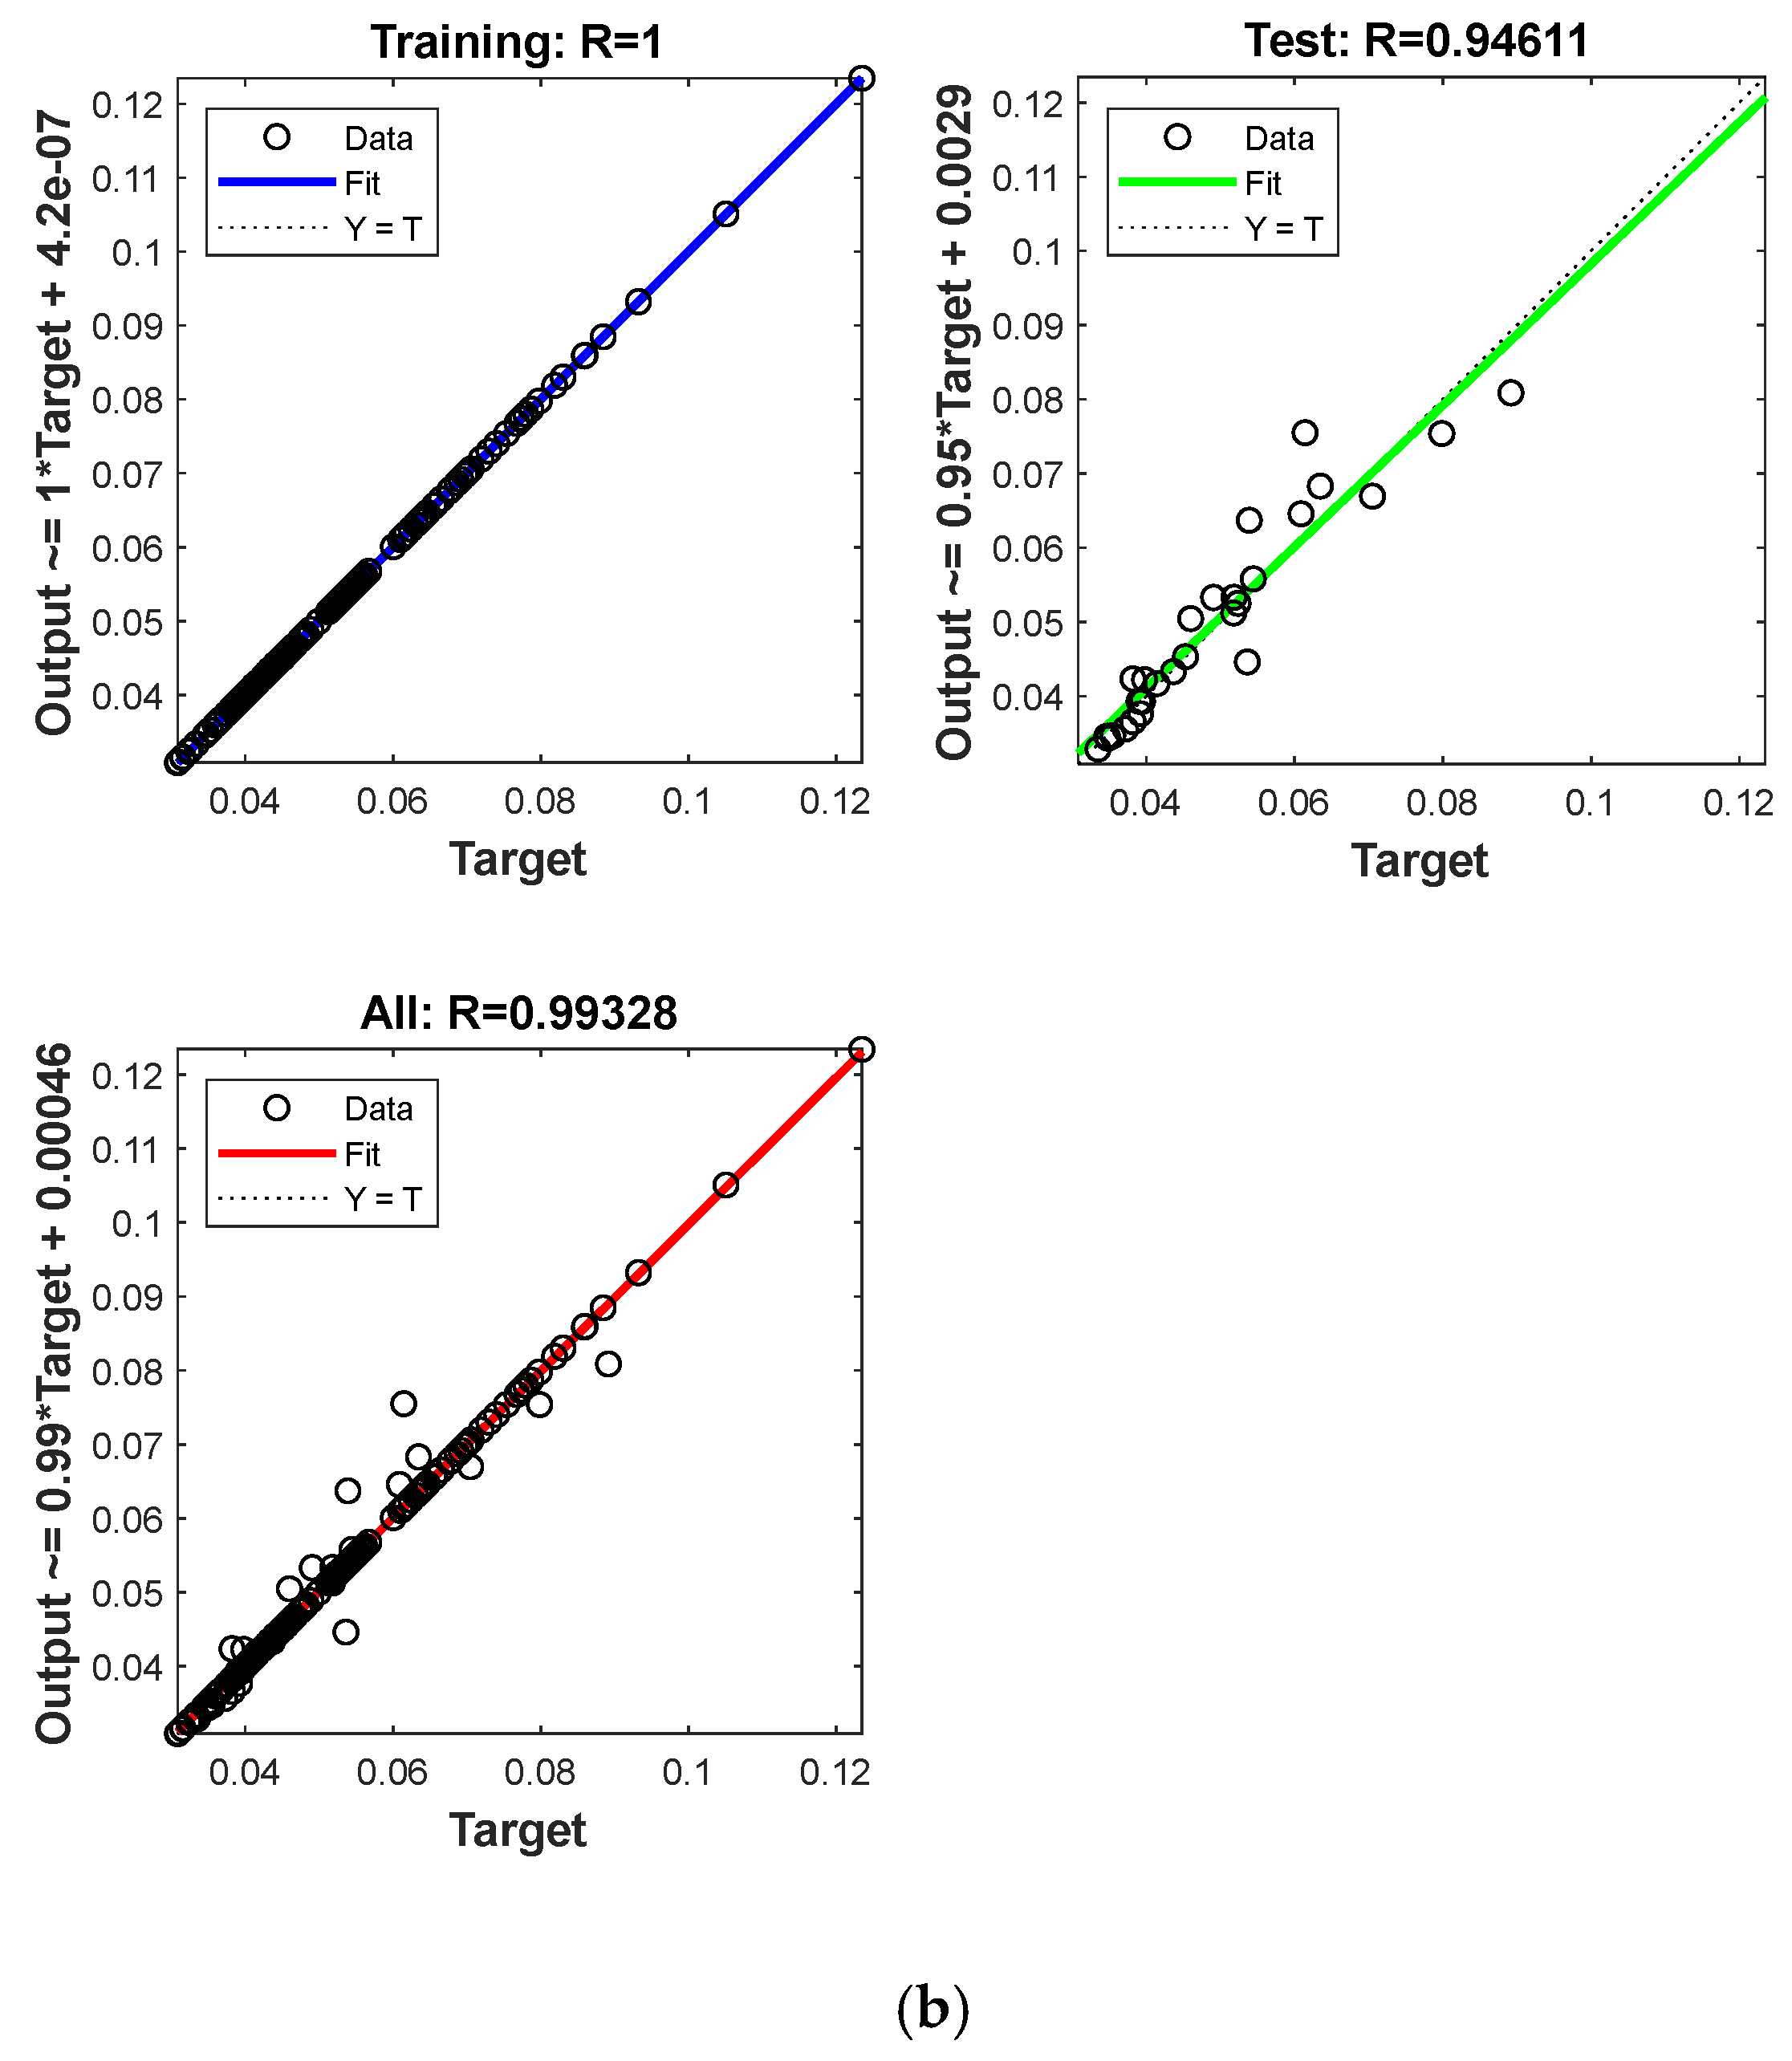
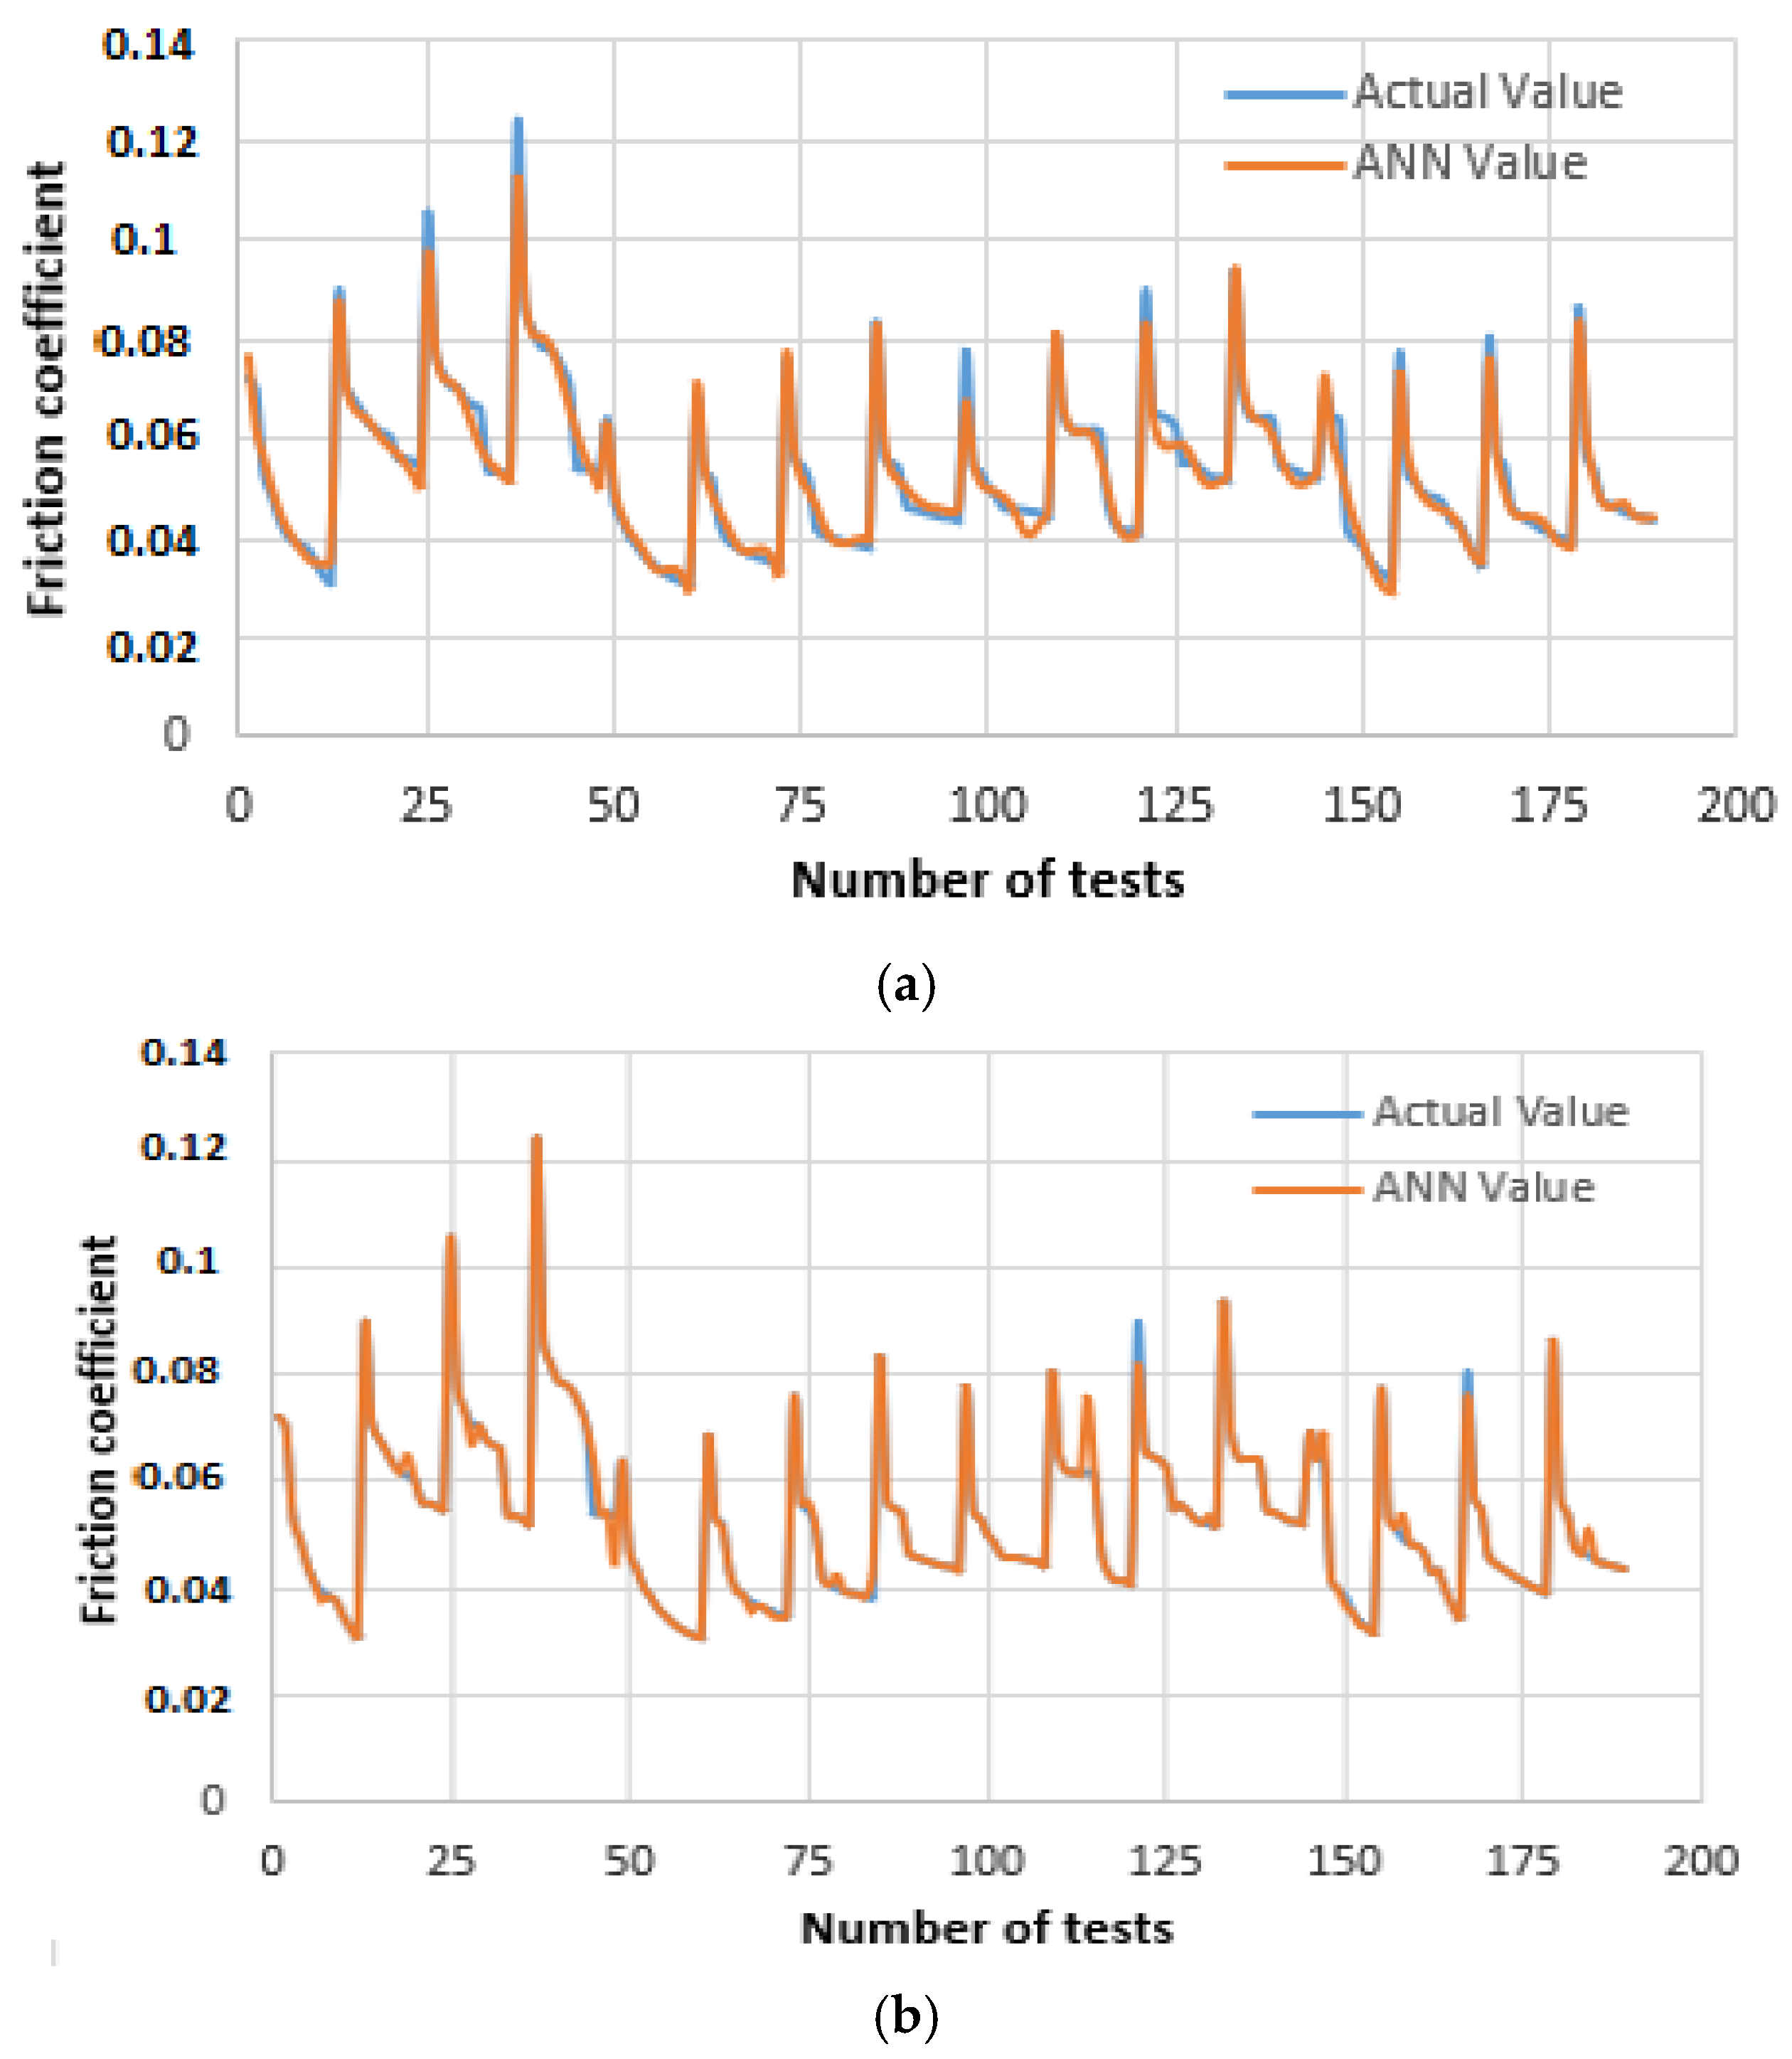
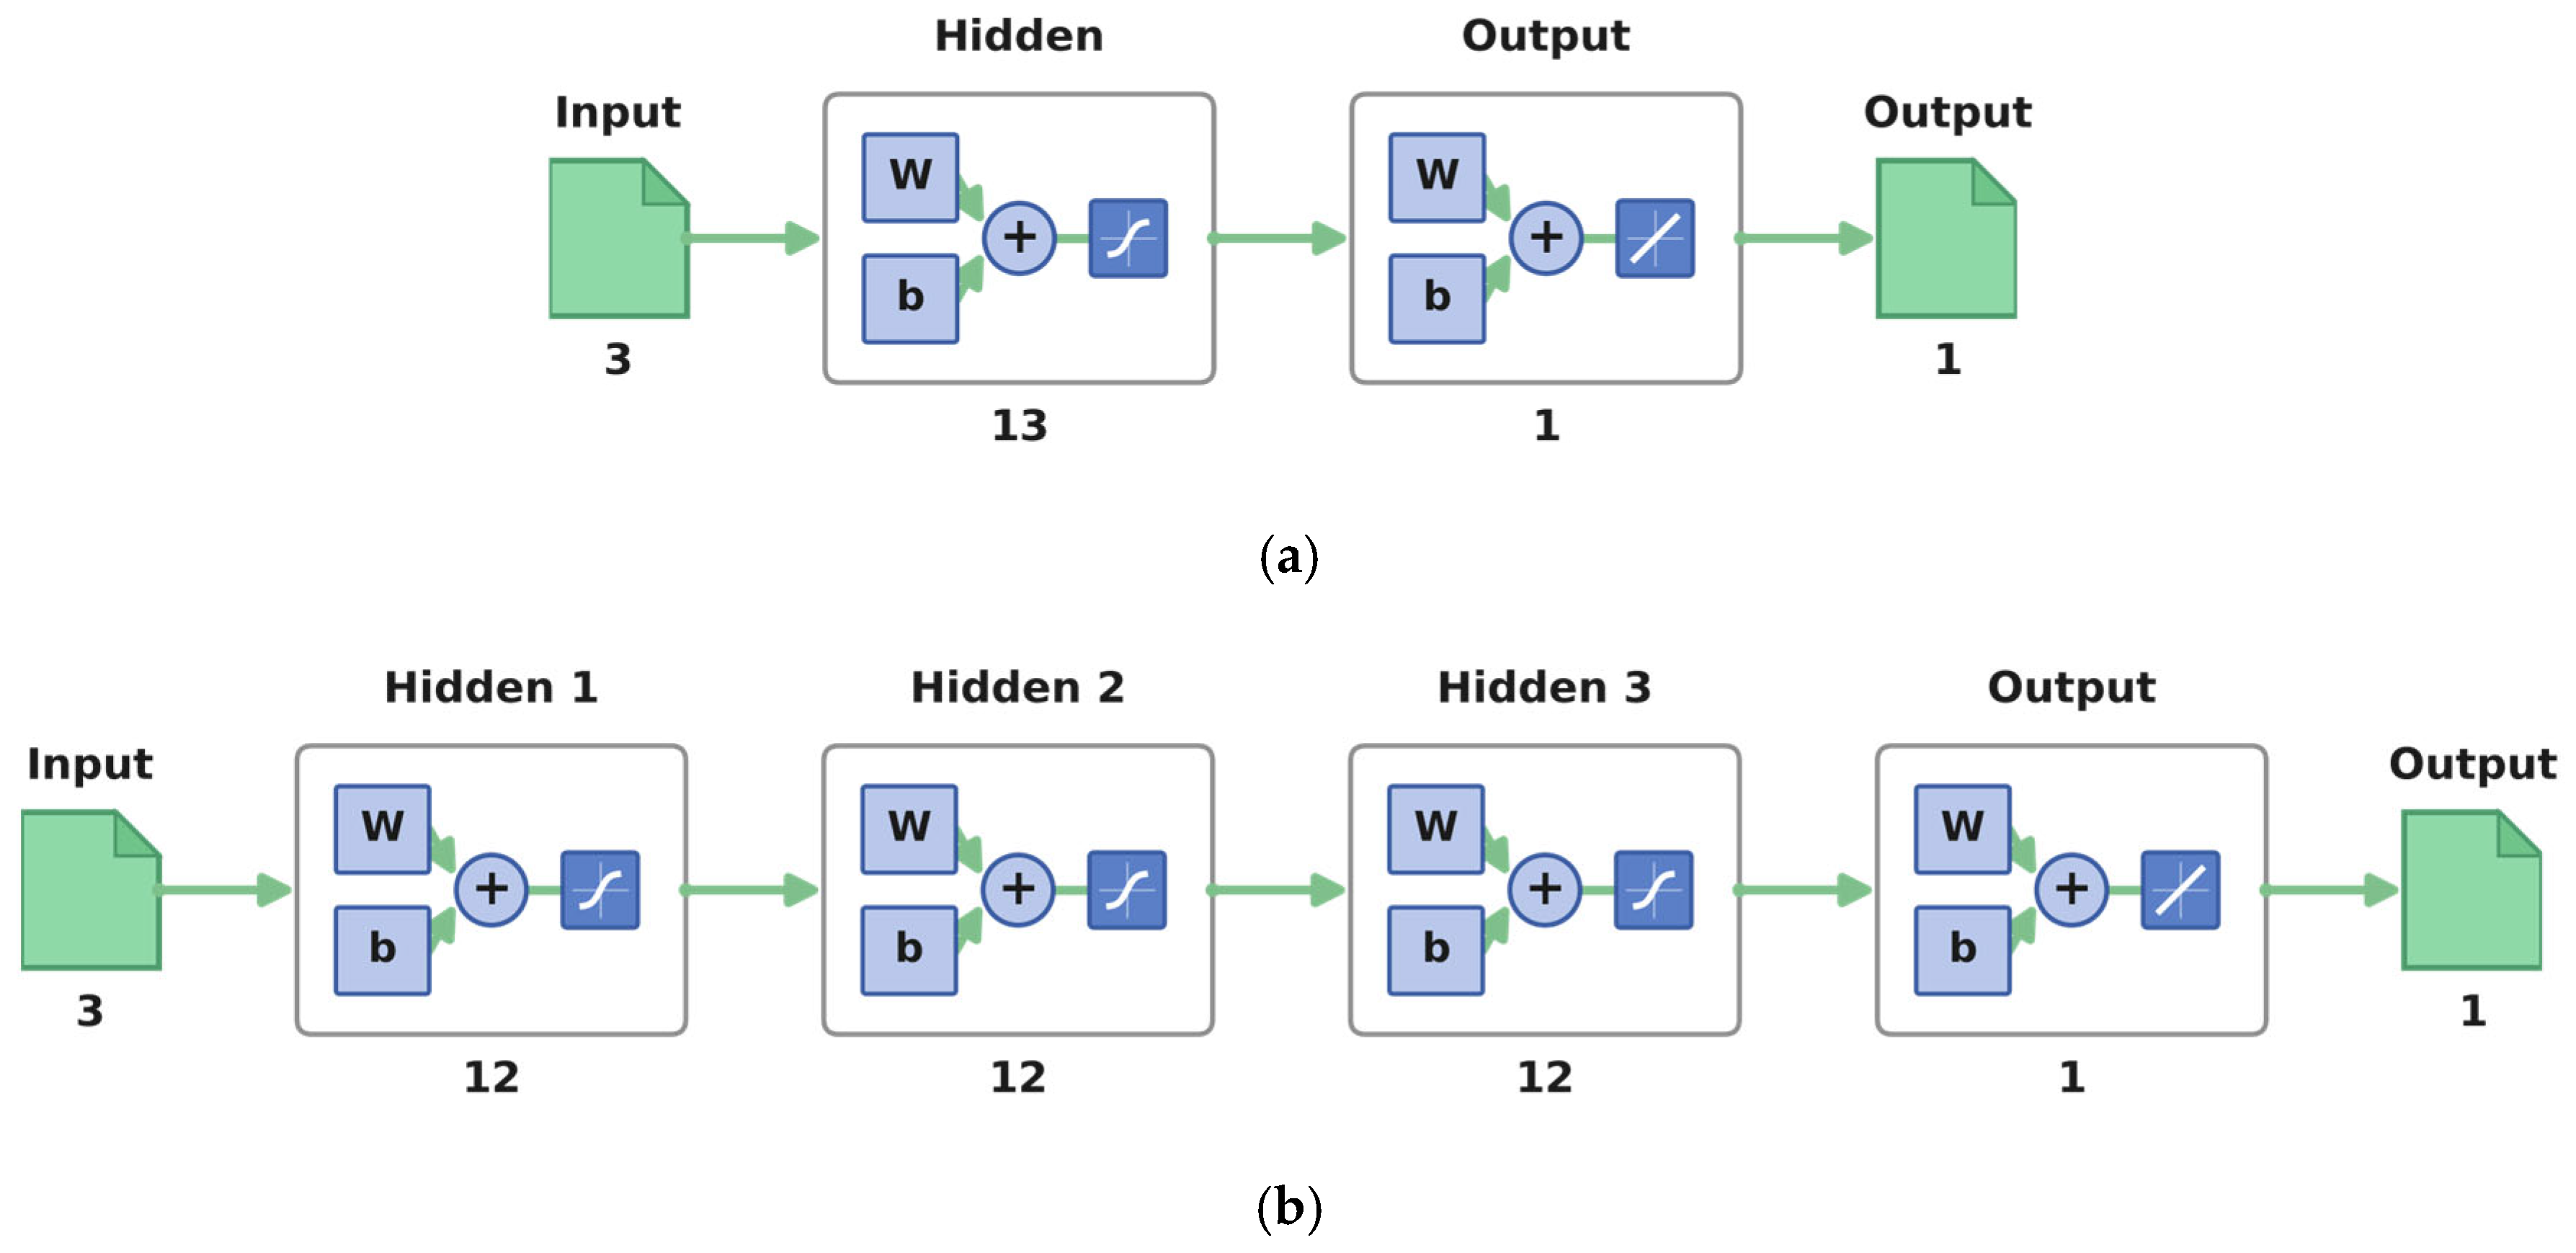
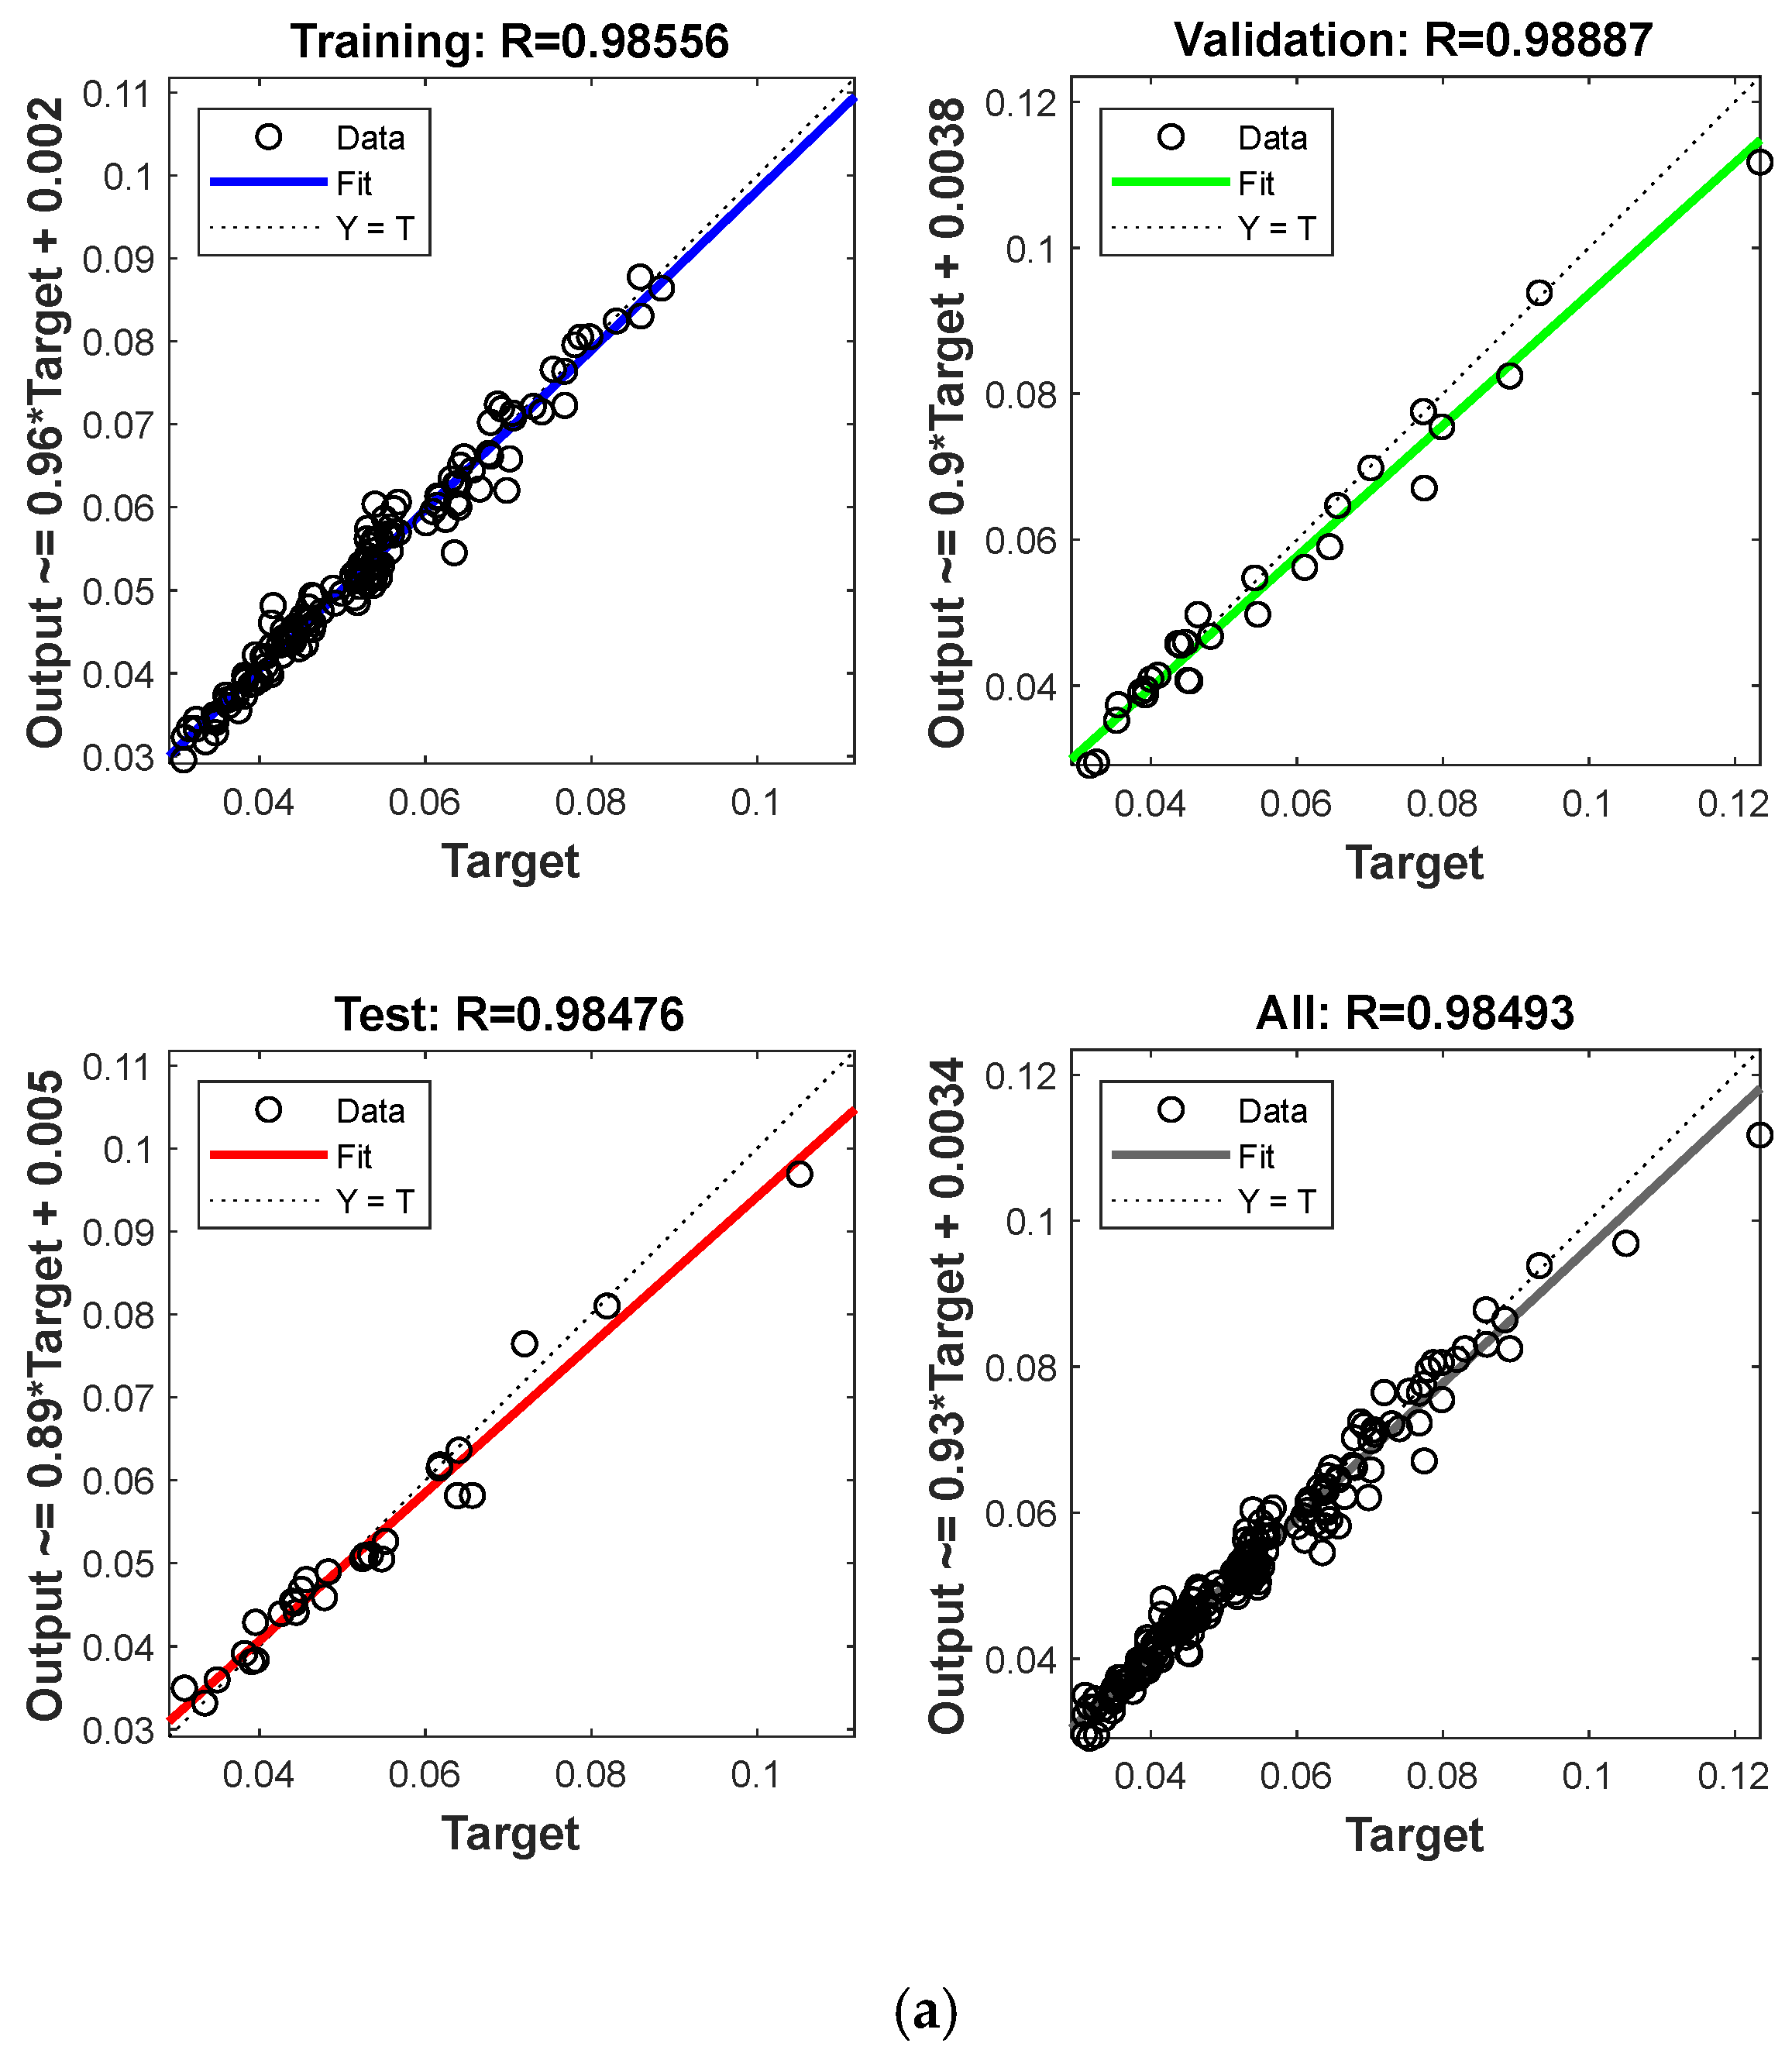
The experimental dataset employed for the construction of the artificial neural network (ANN) model comprised 240 friction-coefficient values. These were obtained through the sampling of the friction-coefficient evolution that was recorded during each scratch test at 15 points along the pass-count curve for each of the 4 × 4 (hardness x load) design combinations (4 × 4 × 15 = 240). The dataset was segmented into 168 values (70%) for the training phase, 36 values (15%) for the validation phase, and 36 values (15%) for the testing phase, using MATLAB’s Neural Network Toolbox function ‘dividerand’. This function performs a random split, applied identically to all four algorithms and all network structures. The three input variables (HV, FN, Np) and the output (friction coefficient) were rescaled to the [−1, 1] range using MATLAB’s ‘mapminmax’ function prior to training, consistent with the hyperbolic-tangent (tansig) hidden-layer activation function used (Figure 14); the output layer used a linear activation function. After this, predictions were rescaled back to physical units via the corresponding inverse mapping for the comparisons shown in Figure 15 and Figure 16.
Figure 14. Algorithm structure diagram (a) Algorithm 2 and (b) Algorithm 3. Panels (a,b) are illustrative schematic diagrams of two representative architectures, one for Algorithm 2 (Trainlm) and one for Algorithm 3 (Trainbr); they are not intended to depict every structure listed in Table 10, which should be consulted for the complete set of screened architectures (number of hidden layers and neurons per layer) for all four algorithms.
Coatings 16 01104 g014
Table 10. Algorithms comparisons.
Learning AlgorithmStructureTraining DataTesting Data
MSE R MSE R
Algorithm 1 Trainscg12-1-11.4 × 10−40.7191.1 × 10−40.727
13-1-11.4 × 10−40.6171.4 × 10−50.671
14-1-19 × 10−50.8209.5 × 10−50.655
12-2-17.6 × 10−50.8316.0 × 10−50.857
13-2-11.0 × 10−40.7576.3 × 10−50.796
14-2-18.8 × 10−50.8291.0 × 10−40.643
12-3-12 × 10−40.4811.0 × 10−40.595
13-3-18.5 × 10−50.7741.4 × 10−40.642
14-3-12.6 × 10−40.4222.3 × 10−40.343
Algorithm 2 Trainlm12-1-15.04 × 10−60.9891.5 × 10−50.952
13-1-15.06 × 10−60.9869.4 × 10−60.985
14-1-13.1 × 10−60.9941.3 × 10−50.972
12-2-12.4 × 10−60.9952.9 × 10−50.926
13-2-15.8 × 10−60.9874.5 × 10−50.926
14-2-14.3 × 10−60.9914.4 × 10−50.913
12-3-12.8 × 10−60.9941.5 × 10−50.930
13-3-19.4 × 10−80.9996.2 × 10−50.906
14-3-18.7 × 10−60.9823.7 × 10−50.911
Algorithm 3
Trainbr
12-1-14.2 × 10−60.9911.9 × 10−50.953
13-1-14.5 × 10−60.9918.6 × 10−60.960
14-1-15.2 × 10−60.9862.6 × 10−50.976
12-2-18.6 × 10−90.9994.2 × 10−50.928
13-2-12.9 × 10−80.9992.9 × 10−50.967
14-2-11.01 × 10−80.9993.6 × 10−50.952
12-3-18.5 × 10−1112.1 × 10−50.993
13-3-12.5 × 10−1312.9 × 10−50.945
14-3-17.5 × 10−1212.4 × 10−50.938
Algorithm 4
Trainrp
12-1-17 × 10−50.8548.9 × 10−50.720
13-1-15.9 × 10−50.8461.4 × 10−40.722
14-1-11.1 × 10−40.7571.6 × 10−40.623
12-2-11.4 × 10−40.6641.4 × 10−40.689
13-2-19.1 × 10−50.7791.0 × 10−40.788
14-2-19.5 × 10−50.7797.5 × 10−50.718
12-3-15.9 × 10−50.869341.3 × 10−40.715
13-3-14.5 × 10−50.8948.3 × 10−50.830
14-3-16.8 × 10−50.8429.2 × 10−50.729
Figure 15. Comparison of experimental and predicted values: (a) Algorithm 2 and (b) Algorithm 3.
Coatings 16 01104 g015aCoatings 16 01104 g015b
Figure 16. Correspondence between actual and ANN values: (a) Algorithm 2 and (b) Algorithm 3.
Coatings 16 01104 g016
During 2. Levenberg–Marquardt) and Trainbr (Algorithm 3, Bayesian regularization) exhibited a clear advantage over Trainscg (Algorithm 1) and Trainrp (Algorithm 4). The correlation coefficients achieved by the former two algorithms approached unity: e.g., R = 0.999 and MSE = 9.4 × 10⁻⁸ for the 13-3-1 structure under Trainlm (Algorithm 2)—this value was misattributed to Trainbr in the original manuscript. Under Trainbr (Algorithm 3), the same 13-3-1 structure in fact achieves an even lower training MSE of 2.5 × 10⁻¹³ with R = 1 (Table 10). Both algorithms simultaneously generated significantly reduced mean-squared errors on both the training and testing sets. This finding is consistent with the well-established suitability of second-order (Levenberg–Marquardt) and Bayesian-regularized training algorithms for small-to-moderate experimental datasets, such as the present one. These algorithms reduce the risk of overfitting compared with first-order gradient-descent-type Trainscg and Trainrp algorithms.
The optimal structure is determined by the correlation coefficient r and the squared error (MSE) for the training and validation sets. In this instance, the 13-1-1 and 12-3-1 structure was adopted, as has been demonstrated to be successful in previous studies (Figure 14). The model comprises three nodes in the input layer, which corresponds to the number of scratch test parameters (i.e., microhardness. normal load and number of passes). In addition, the model contains several nodes in the hidden layer with a hyperbolic tangent transfer function, and a node in the output layer with a linear transfer function.
Table 10 summarizes the R and MSE values obtained for the training and testing datasets using the three algorithms. As shown in Figure 15, the correlation coefficients between the target (experimental values) and the predicted outputs (ANN results) for the training, validation and testing phases demonstrate that the neural network model performs satisfactorily. Furthermore, a regression analysis was performed to evaluate the effects of the input parameters on the responses, both individually and in combination.
As illustrated in Table 10, a systematic traversal was conducted over hidden-layer width (12, 13 and 14 neurons) crossed with a second-layer size (1, 2 and 3 neurons). This resulted in nine architectures per algorithm for each of the four training algorithms. Bayesian regularization (Trainbr) has been developed for the purpose of controlling overfitting by penalizing large weights within the training objective. This process effectively limits the network’s effective number of free parameters, regardless of the nominal neuron count. Consequently, the low training MSE obtained for some Trainbr structures (e.g., 8.5 × 10⁻¹¹ for the 12-3-1 structure) does not necessarily indicate overfitting. The diagnostic employed in this study is the training-versus-testing MSE gap. For the 12-3-1 Trainbr structure, the testing MSE is 2.1 × 10⁻⁵ with R = 0.993.
This indicates that the testing performance is close to the best testing performance obtained by any structure/algorithm, suggesting good generalization despite the near-zero training error. To ensure comprehensibility, Table 10 error values are also expressed as root-mean-square error (RMSE = √MSE), in the same units as the friction coefficient. For the 13-3-1 structure under Trainlm, the training RMSE is approximately 3.07 × 10⁻⁴ and the testing RMSE is approximately 7.87 × 10⁻³. For the 12-3-1 structure under Trainbr, the training RMSE is approximately 9.22 × 10⁻⁵ and the testing RMSE is approximately 4.58 × 10⁻³.
As Figure 16 shows, the experimental and artificial neural network (ANN) values for the coefficients of friction of the drive and test assemblies are very similar. The most notable outcome is that the predicted values closely align with the experimental values, showcasing the network’s exceptional ability to estimate the coefficient of friction. As a result, the three input parameters chosen for predicting the coefficient of friction produced unique results. The performance of the test and training sets in predicting the friction coefficient shows that the LM training algorithm is accurate to within 5% of the true value.
The coefficient of friction is a key quantity, and its precise quantitative estimation is both theoretically significant and practically useful. The coefficient of friction is significantly affected by the normal load and the number of passes during multi-pass scratching tests on hardened steel. However, if we consider that the standard NN is driven towards the largest error reduction gradient, it is likely to fall into a local minimum value collapse and has a slow rate of convergence. The coefficient of friction is a key quantity, and its precise quantitative estimation is both theoretically significant and practically useful. The coefficient of friction is significantly affected by the normal load and the number of passes during multi-pass scratching tests on hardened steel. However, if we consider that the standard NN is driven towards the largest error reduction gradient, it is likely to fall into a local minimum value collapse and has a slow rate of convergence.

4. Discussion

The friction coefficient of carbonitrided AISI 4130 steel under multi-pass scratch loading is governed jointly by the microhardness of the carbonitrided layer, the normal load and the number of passes. These three factors can be explained mechanistically and predicted quantitatively using complementary RSM and ANN models.
The analysis of variance (ANOVA) indicates that the predominant influence of microhardness is consistent with the microstructural characterization of Section 3.1, Section 3.2 and Section 3.3: the C2 condition, which exhibits the highest carbon potential and the shortest retained-austenite persistence near the surface (~9% at the surface versus ~12% for C1), also exhibits the highest surface hardness (980 HV0.1) and the lowest friction coefficient (~0.065). Conversely, the tempered conditions (C11, C12) demonstrate a progressive reduction in hardness associated with retained-austenite and transition-carbonitride decomposition during tempering, exhibiting correspondingly higher friction coefficients. This finding is consistent with an adhesion-ploughing mechanism, whereby a harder, less deformable surface reduces the real contact area beneath the diamond indenter and limits plastic ploughing, thereby lowering the coefficient of friction. The strong interaction terms identified between hardness and normal load (Figure 8a) and between hardness and number of passes (Figure 8b) further indicate that the benefit of a harder carbonitrided layer is most pronounced precisely under the more severe combinations of high load and low pass count, where ploughing would otherwise be most significant.
The underlying microscopic mechanism can be stated explicitly as follows: as the tempering temperature increases from 200 °C (C11) to 550 °C (C12), thermal activation promotes progressive decomposition of retained austenite into cementite/transition carbides and relieves quenching-induced residual stresses in the martensitic matrix. This process has been shown to reduce both carbon supersaturation and dislocation density, thereby softening the near-surface layer (a finding that is consistent with the measured drop from 870 HV0.1 for as-carbonitrided C1 to 630 HV0.1 for C12). In accordance with the classical adhesive-contact relation for the real contact area, A_real ≈ FN/HV, a softer surface produces a larger real contact area for a given normal load, thereby increasing the adhesive and ploughing components of friction beneath the diamond indenter. The mechanistic chain (tempering → retained-austenite/carbide decomposition → reduced HV → increased A_real → increased friction) accounts for the monotonic hardness–friction trend reported in Section 3.4.
In order to establish a quantitative framework for the severity of contact underlying these measurements, a first-order Hertzian elastic-contact estimate was performed for the diamond indenter (radius R = 200 μm, E ≈ 1140 GPa, ν ≈ 0.07) on the hardened steel (E ≈ 210 GPa, ν ≈ 0.3), giving a combined modulus E* ≈ 192 GPa. It is evident from the data that, at the highest applied load (FN = 20 N), the Hertzian contact radius is a ≈ 25 μm and the corresponding maximum elastic contact pressure is p_max = 3FN/(2πa2) ≈ 15 GPa. At the lowest load (FN = 5 N), the radius is a ≈ 16.4 μm and the pressure is p_max ≈ 8.9 GPa. It is evident that these values exceed the highest recorded surface hardness (980 HV0.1 ≈ 9.6 GPa) by a substantial margin. Consequently, the elastic solution can only be considered a first-order estimate of the initial contact stress. However, it does confirm that contact occurs in the elastic–plastic/fully plastic regime from the onset of loading. This is consistent with the classical scratch-hardness result that the mean contact pressure under steady sliding approximates the material hardness itself (p_m ≈ H).
Table 11 provides a comprehensive overview of this study in relation to the existing body of research on friction and wear optimization, as referenced in the manuscript. Although response-surface and neural-network methodologies have heretofore been employed in the context of friction or wear behavior of other steels and coatings (e.g., deep-drawing-quality steel sheets [8,9], nitrided D2 and 4140 steels [14,29], laser-textured tool steel [12] and model-based friction transferability studies [10]), none of these studies have addressed the carbonitriding-induced hardness gradient, normal load and number of passes as co-optimized design factors for the friction coefficient of a carbonitrided steel. This study is distinguished by two features: first, the scope, which encompasses three jointly optimized factors as opposed to one or two; and second, the combined use of a cross-validated RSM/desirability-function model in conjunction with an ANN model of comparable accuracy (R2 = 0.993 and R close to 1 for the best-performing algorithms). For a fixed contact configuration (sliding velocity and contact geometry) and dry (unlubricated) sliding conditions, the regression equation (Equation (1)) and/or the trained ANN model can be used to estimate the friction coefficient directly from the component’s surface hardness—itself a process choice fixed by the selected carbonitriding-tempering condition—together with the expected operating normal load and number of sliding cycles. The predicted friction coefficient can then be substituted into the classical friction–force relation (Ff = f × FN) to estimate friction force, hence the associated power loss (P = Ff × v) at a given sliding velocity. This provides component designers with a first-order, experimentally validated basis for selecting carbonitriding and tempering parameters for gears, shafts and other highly stressed transmission components, ahead of more detailed lubricated-contact modeling.

5. Conclusions

The carbonitriding of AISI 4130 steel produces a hardness gradient governed by carbon/nitrogen potential and tempering condition, with surface microhardness ranging from 630 HV0.1 (C12) to 980 HV0.1 (C2), against 270 HV0.1 for the untreated core. This hardness gradient, together with the associated retained-austenite content (up to 30% near the sub-surface), is shown for the first time to be a statistically dominant driver (14.6% contribution) of the friction coefficient measured in multi-pass scratch testing, alongside normal load (14.0%) and number of passes (50.0%).
The multi-pass scratch test has been shown to be a rapid and cost-effective screening method for the tribological qualification of carbonitrided components. Within the tested envelope (5–20 N normal load, 1–20 passes, 630–980 HV0.1), the response-surface optimization with a desirability-function approach identifies an optimal combination of high hardness and low load that minimizes the predicted friction coefficient towards the lower bound of the experimental range (~0.04), consistent with the lowest friction coefficient directly measured among the tested conditions, ~0.065 for the C2 state. In combination, the regression model (cubic, R2 = 0.993) and the trained ANN model (relative error < 5% on the test set) provide industry-usable predictive tools for estimating the friction coefficient directly from processing and duty-cycle parameters. These tools can inform the selection of carbonitriding parameters for gears, shafts and other highly stressed transmission components, obviating the need for exhaustive full-scale wear testing.
The desirability function optimization identifies a specific numerical optimum. It can be deduced from the data that HV ≈ 845 HV0.1, FN ≈ 5.14 N and Np ≈ 15 passes. This calculation provides a predicted friction coefficient of 0.040. It is evident that HV ≈ 845 corresponds to a carbonitriding/tempering condition intermediate between C1 and C2. Consequently, component designers targeting minimal friction should favor carbonitriding/tempering parameters producing surface hardness in this range. In addition, duty cycles that keep contact loads and pass counts on the lower end of the ranges studied here should be employed. For lightly loaded transmission components, for instance, where friction-driven power loss is the dominant design concern, this approach is particularly relevant. In practice, the cubic RSM regression equation is recommended in situations where a transparent, closed-form estimate is required for expeditious manual or spreadsheet-based calculations during the early stages of component design, or when the physical interpretability of individual main effects and interactions is of interest. It should be noted that this equation carries a moderately higher error (adjusted R2 = 0.9401). The utilization of a trained artificial neural network (ANN) model, employing either the 13-3-1 or 12-3-1 architecture, and either the Trainlm or Trainbr configuration, is strongly advocated in scenarios where optimal predictive precision is imperative. This may be exemplified by its application in the context of embedding within a digital twin or an automated optimization workflow. However, it should be noted that this approach is accompanied by a compromise in physical interpretability and the necessity for re-training in instances where extrapolation occurs beyond the confines of the tested range (630–980 HV0.1, 5–20 N, 1–20 passes).
This study is constrained to dry sliding contact and a single steel grade (AISI 4130); the crystallographic characterization was restricted to phase-fraction quantification by XRD, without full lattice-parameter/residual-stress refinement; and the desirability optimization treats friction alone as the response, with hardness fixed by the chosen carbonitriding/tempering condition and case depth not measured as a distinct, optimized response. Subsequent research will extend the RSM/ANN methodology to lubricated-contact conditions relevant to in-service operation. This will involve incorporating sliding velocity and contact geometry as additional factors. Furthermore, the desirability optimization will be extended to a true multi-response formulation, which will jointly minimize friction while maximizing case depth. In addition, mass loss/wear rate will be characterized as a complementary response alongside friction coefficient. Finally, the friction dataset will be combined with detailed microstructural and residual-stress analysis to strengthen the mechanistic interpretation of the hardness–friction relationship identified here.


Author Contributions

Conceptualization. M.A.T., S.T. and A.K.G.; Methodology. S.T., A.K.G. and M.A.T.; Validation. M.A.T.; Formal analysis. S.T. and A.K.G.; Data curation. S.T. and A.K.G.; Writing—original draft. S.T.; Writing—review and editing. B.L. and M.A.T.; Visualization. B.L.; A.K.G. and M.A.T.; Supervision. M.A.T.; Project administration. B.L. All authors have read and agreed to the published version of the manuscript.

Funding

This study was supported and funded by the Deanship of Scientific Research at Imam Mohammad ibn Saud Islamic University (IMSIU) (grant number IMSIU-DDRSP2503).

Institutional Review Board Statement

Not applicable.

Informed Consent Statement

Not applicable.

Data Availability Statement

The original contributions presented in this study are included in the article. Further inquiries can be directed at the corresponding author.

Conflicts of Interest

The authors declare no conflicts of interest.

References

  1. Ghanem, A.; Terres, M.A. The influence of carbonitriding conditions on microstructure and mechanical properties of AISI 4130 low-alloy steel. Metall. Res. Technol. 2021, 118, 115–118. [Google Scholar] [CrossRef] [Scilit]
  2. Paventhan, R.; Thirumalaikumarasamy, D.; Kantumuchu, V.C.; Ahmed, O.S.; Abbas, M.; Alahmadi, A.A.; Alwetaishi, M.; Alzaed, A.N.; Ramachandran, C.S. Optimizing Friction Welding Parameters in AISI 304 Austenitic Stainless Steel and Commercial Copper Dissimilar Joints. Coatings 2023, 13, 261. [Google Scholar] [CrossRef] [Scilit]
  3. Krishna, A.R.S.; Krishna, B.V.; Harshith, D.; Sashank, T.; Subbiah, R. Investigation of mechanical properties of AISI 316 stainless steel by carbonitriding process. In Proceedings of the E3S Web of Conferences 184 (2020), Hyderabad, India, 10–12 July 2020. [Google Scholar]
  4. Ghanem, A.; Terres, M.A. The influence of carbon potential after gas-carbonitriding on the microstructure and fatigue behavior of low alloyed steel. Mater. Res. Express 2022, 9, 026505. [Google Scholar] [CrossRef] [Scilit]
  5. Steinbacher, M.; Hoffmann, F.; Zoch, H.-W.; Lombardo, S.; Tobie, T. Recent Developments on the Microstructure and the Mechanical Properties of Carbonitrided Parts: Part 1: Investigation on Materials Properties. Treat. Mater. 2015, 70, 201–217. [Google Scholar]
  6. Kocurova, K.; Domankova, M.; Hazlinger, M. The influence of carbonitriding process on microstructure and mechanical properties of micro-alloyed steel. Metallurgia 2013, 52, 19–22. [Google Scholar]
  7. Smirnov, A.E.; Shevchenko, S.Y.; Shchipunov, V.S.; Kunyaev, V.E.; Sevalev, G.S. Special features of the carbonitriding of parts of instrument bearings designed for extreme service conditions. Met. Sci. Heat Treat. 2016, 58, 5–6, 287–292. [Google Scholar] [CrossRef] [Scilit]
  8. Trzepieciński, T.; Szwajka, K.; Szewczyk, M. Analysis of Coefficient of Friction of Deep-Drawing-Quality Steel Sheets Using Multi-Layer Neural Networks. Lubricants 2024, 12, 50. [Google Scholar] [CrossRef] [Scilit]
  9. Trzepieciński, T.; Szwajka, K.; Szewczyk, M.; Barlak, M.; Zielińska-Szwajka, J. Effect of Countersample Coatings on the Friction Behaviour of DC01 Steel Sheets in Bending-under-Tension Friction Tests. Materials 2024, 17, 3631. [Google Scholar] [CrossRef] [Scilit] [PubMed]
  10. Schanner, J.; Reiß, F.; Leidich, E.; Hasse, A. Transferability of Model-Based Static Coefficient of Friction. Lubricants 2024, 12, 371. [Google Scholar] [CrossRef] [Scilit]
  11. Luiz, V.D.; Santos, A.J.; Câmara, M.A.; Rodrigues, P.C.M. Influence of Different Contact Conditions on Friction Properties of AISI 430 Steel Sheet with Deep Drawing Quality. Coatings 2023, 13, 771. [Google Scholar] [CrossRef] [Scilit]
  12. Daodon, W.; Saetang, V. Improvement of Frictional Property of AISI D2 Tool Steel Surface against JIS SPFC 980Y Advanced High-Strength Steel by Using Laser Texturing Process. Lubricants 2023, 11, 68. [Google Scholar] [CrossRef] [Scilit]
  13. Mondal, P.; Sadhukhan, A.K.; Gupta, A.G.P. Optimization of process parameters for bio-enzymatic and enzymatic saccharification of waste broken rice for ethanol production using response surface methodology and artificial neural network—Genetic algorithm. 3 Biotech 2021, 11, 28. [Google Scholar] [CrossRef] [Scilit] [PubMed]
  14. Souid, A.; Mzali, S.; Louhichi, B.; Terres, M.A. Enhancement of Wear Behaviour and Optimization and Prediction of Friction Coefficient of Nitrided D2 Steel at Different Times. Lubricants 2025, 13, 550. [Google Scholar] [CrossRef] [Scilit]
  15. Kanake, V.S.; Bahuja, B. Prediction of Tool Wear Length in Micro-EDM Process Using an Artificial Neural Network. Mater. Today Proc. 2022, 63, 107–112. [Google Scholar] [CrossRef] [Scilit]
  16. Mondal, N.; Ghosh, S.; Mandal, M.C.; Pati, S.; Banik, S. ANN and RSM based predictive model development and EDM process parameters optimization on AISI 304 stainless steel. Mater. Today Proc. 2026, 116, 116–121. [Google Scholar] [CrossRef] [Scilit]
  17. Najjar, I.; Sadoun, A.; Alam, M.N.; Fathy, A. Prediction of Wear Rates of Al-TiO2 Nanocomposites Using Artificial Neural Network Modified with Particle Swarm Optimization Algorithm. Mater. Today Commun. 2023, 35, 105743. [Google Scholar] [CrossRef] [Scilit]
  18. Ghanem, A.; Atallah, M.S.; Khlifi, K.; Barhoumi, N.; Terres, M.A. Investigation of friction and wear resistance of carbonitrided AISI 4130 steels using single and multi-pass scratch technique. Proc. Inst. Mech. Eng. Part C J. Mech. Eng. Sci. 2022, 236, 8690–8702. [Google Scholar] [CrossRef] [Scilit]
  19. Karamanli, İ.A.; GöK, M.S.; Küçük, Y.; Ünal, O. Study of the Wear Resistance Plasma Nitrided GGG60 by Optimization of Surface Treatment Conditions Using Response Surface Methodology. Int. J. Met. 2025, 19, 387–403. [Google Scholar] [CrossRef] [Scilit]
  20. Rathinam, G.S.N.; Manickajothi, G.; Ezhil, E.D.V.; Sundaram, M.; Devarajan, Y. Testing and evaluation on friction surfacing of Alloy 36 over spheroidal graphite iron and its effect on coating thickness and width using artificial neural networks and response surface methodology. Mater. Werkst. 2024, 55, 141–152. [Google Scholar] [CrossRef] [Scilit]
  21. Saravanakumar, S.; Prakash, K.B.; Dinesh, D.; Kumar, P.M.; Fouad, Y.; Soudagar, M.E.M.; Ali, M.M.; Bashir, M.N. Optimizing friction stir processing parameters for aluminium alloy 2024 reinforced with SiC particles: A taguchi approach of investigation. J. Mater. Res. Technol. 2024, 30, 4847–4855. [Google Scholar] [CrossRef] [Scilit]
  22. Laouissi, A.; Yallese, M.A.; Belbah, A.; Belhadi, S. Haddad Investigation, modeling, and optimization of cutting parameters in turning of gray cast iron using coated and uncoated silicon nitride ceramic tools. Based on ANN. RSM. and GA optimization. Int. J. Adv. Manuf. Technol. 2018, 101, 523–548. [Google Scholar] [CrossRef] [Scilit]
  23. Palavar, O.; Özyürek, D.; Kalyan, A. Artificial Neural Network Prediction of Aging Effects on the Wear Behavior of IN706 Superalloy. Mater. Des. 2015, 82, 164–172. [Google Scholar] [CrossRef] [Scilit]
  24. Ravikumar, K.S.; Chethan, Y.D.; Likith, C.; Chethan, S.P. Prediction of Wear Characteristics for Al-MnO2 Nanocomposites Using Artificial Neural Network (ANN). Mater. Today Proc. 2023, 98, 102–108. [Google Scholar] [CrossRef] [Scilit]
  25. Shebani, A.; Iwnicki, S. Prediction of wheel and rail wear under different contact conditions using artificial neural networks. Wear 2018, 406–407, 173–184. [Google Scholar] [CrossRef] [Scilit]
  26. Kumar, S.; Maity, S.R.; Patnaik, L. Effect and optimization of tribological parameters upon wear responses of TiAlN coating. Emerg. Mater. Res. 2023, 12, 68–77. [Google Scholar] [CrossRef] [Scilit]
  27. Razzaq, M.; Majid, A.; Dayang, L.; Ishak, M.R. Mathematical modeling and analysis of tribological properties of AA6063 aluminum alloy reinforced with fly ash by using response surface methodology. Crystals 2020, 10, 403. [Google Scholar] [CrossRef] [Scilit]
  28. Gajalakshmi, K.; Senthilkumar, N.; Prabu, B. Multi-response optimization of dry sliding wear parameters of AA6026 using hybrid gray relational analysis coupled with response surface method. Meas. Control 2019, 52, 540–553. [Google Scholar] [CrossRef] [Scilit]
  29. Daghbouch, A.; Louhichi, B.; Terres, M.A. Optimization and prediction of mass loss during adhesive wear of nitrided AISI 4140 steel parts. Crystals 2025, 15, 875. [Google Scholar] [CrossRef] [Scilit]
Figure 1. System and principle of scratch tests.
Coatings 16 01104 g001
Figure 2. Typical cross-sections of surface microstructures after carbonitriding: (a) carbonitrided layer and (b) core of steel.
Coatings 16 01104 g002
Figure 3. X-ray diffraction specters for carbonitrided specimens.
Coatings 16 01104 g003
Figure 4. The variation of retained austenite in carbonitrided layers: (a) influence of carbon potential and (b) influence of tempered temperature.
Coatings 16 01104 g004
Figure 5. Microhardness depth profiles of carbonitrided layers: (a) influence of carbon potential and (b) influence of tempered temperature.
Coatings 16 01104 g005
Figure 6. Variation of friction coefficient at a normal load of 10 N of carbonitrided layers: (a) influence of carbon potential and (b) influence of tempered temperature.
Coatings 16 01104 g006
Figure 7. Main effects: Pareto diagram.
Coatings 16 01104 g007
Figure 8. Interactive influence of scratch tests parameters and carbonitrided state on friction coefficient: (a) number of passes; (b) normal load; and (c) carbonitrided state.
Coatings 16 01104 g008
Figure 9. Predicted vs. Actual.
Coatings 16 01104 g009
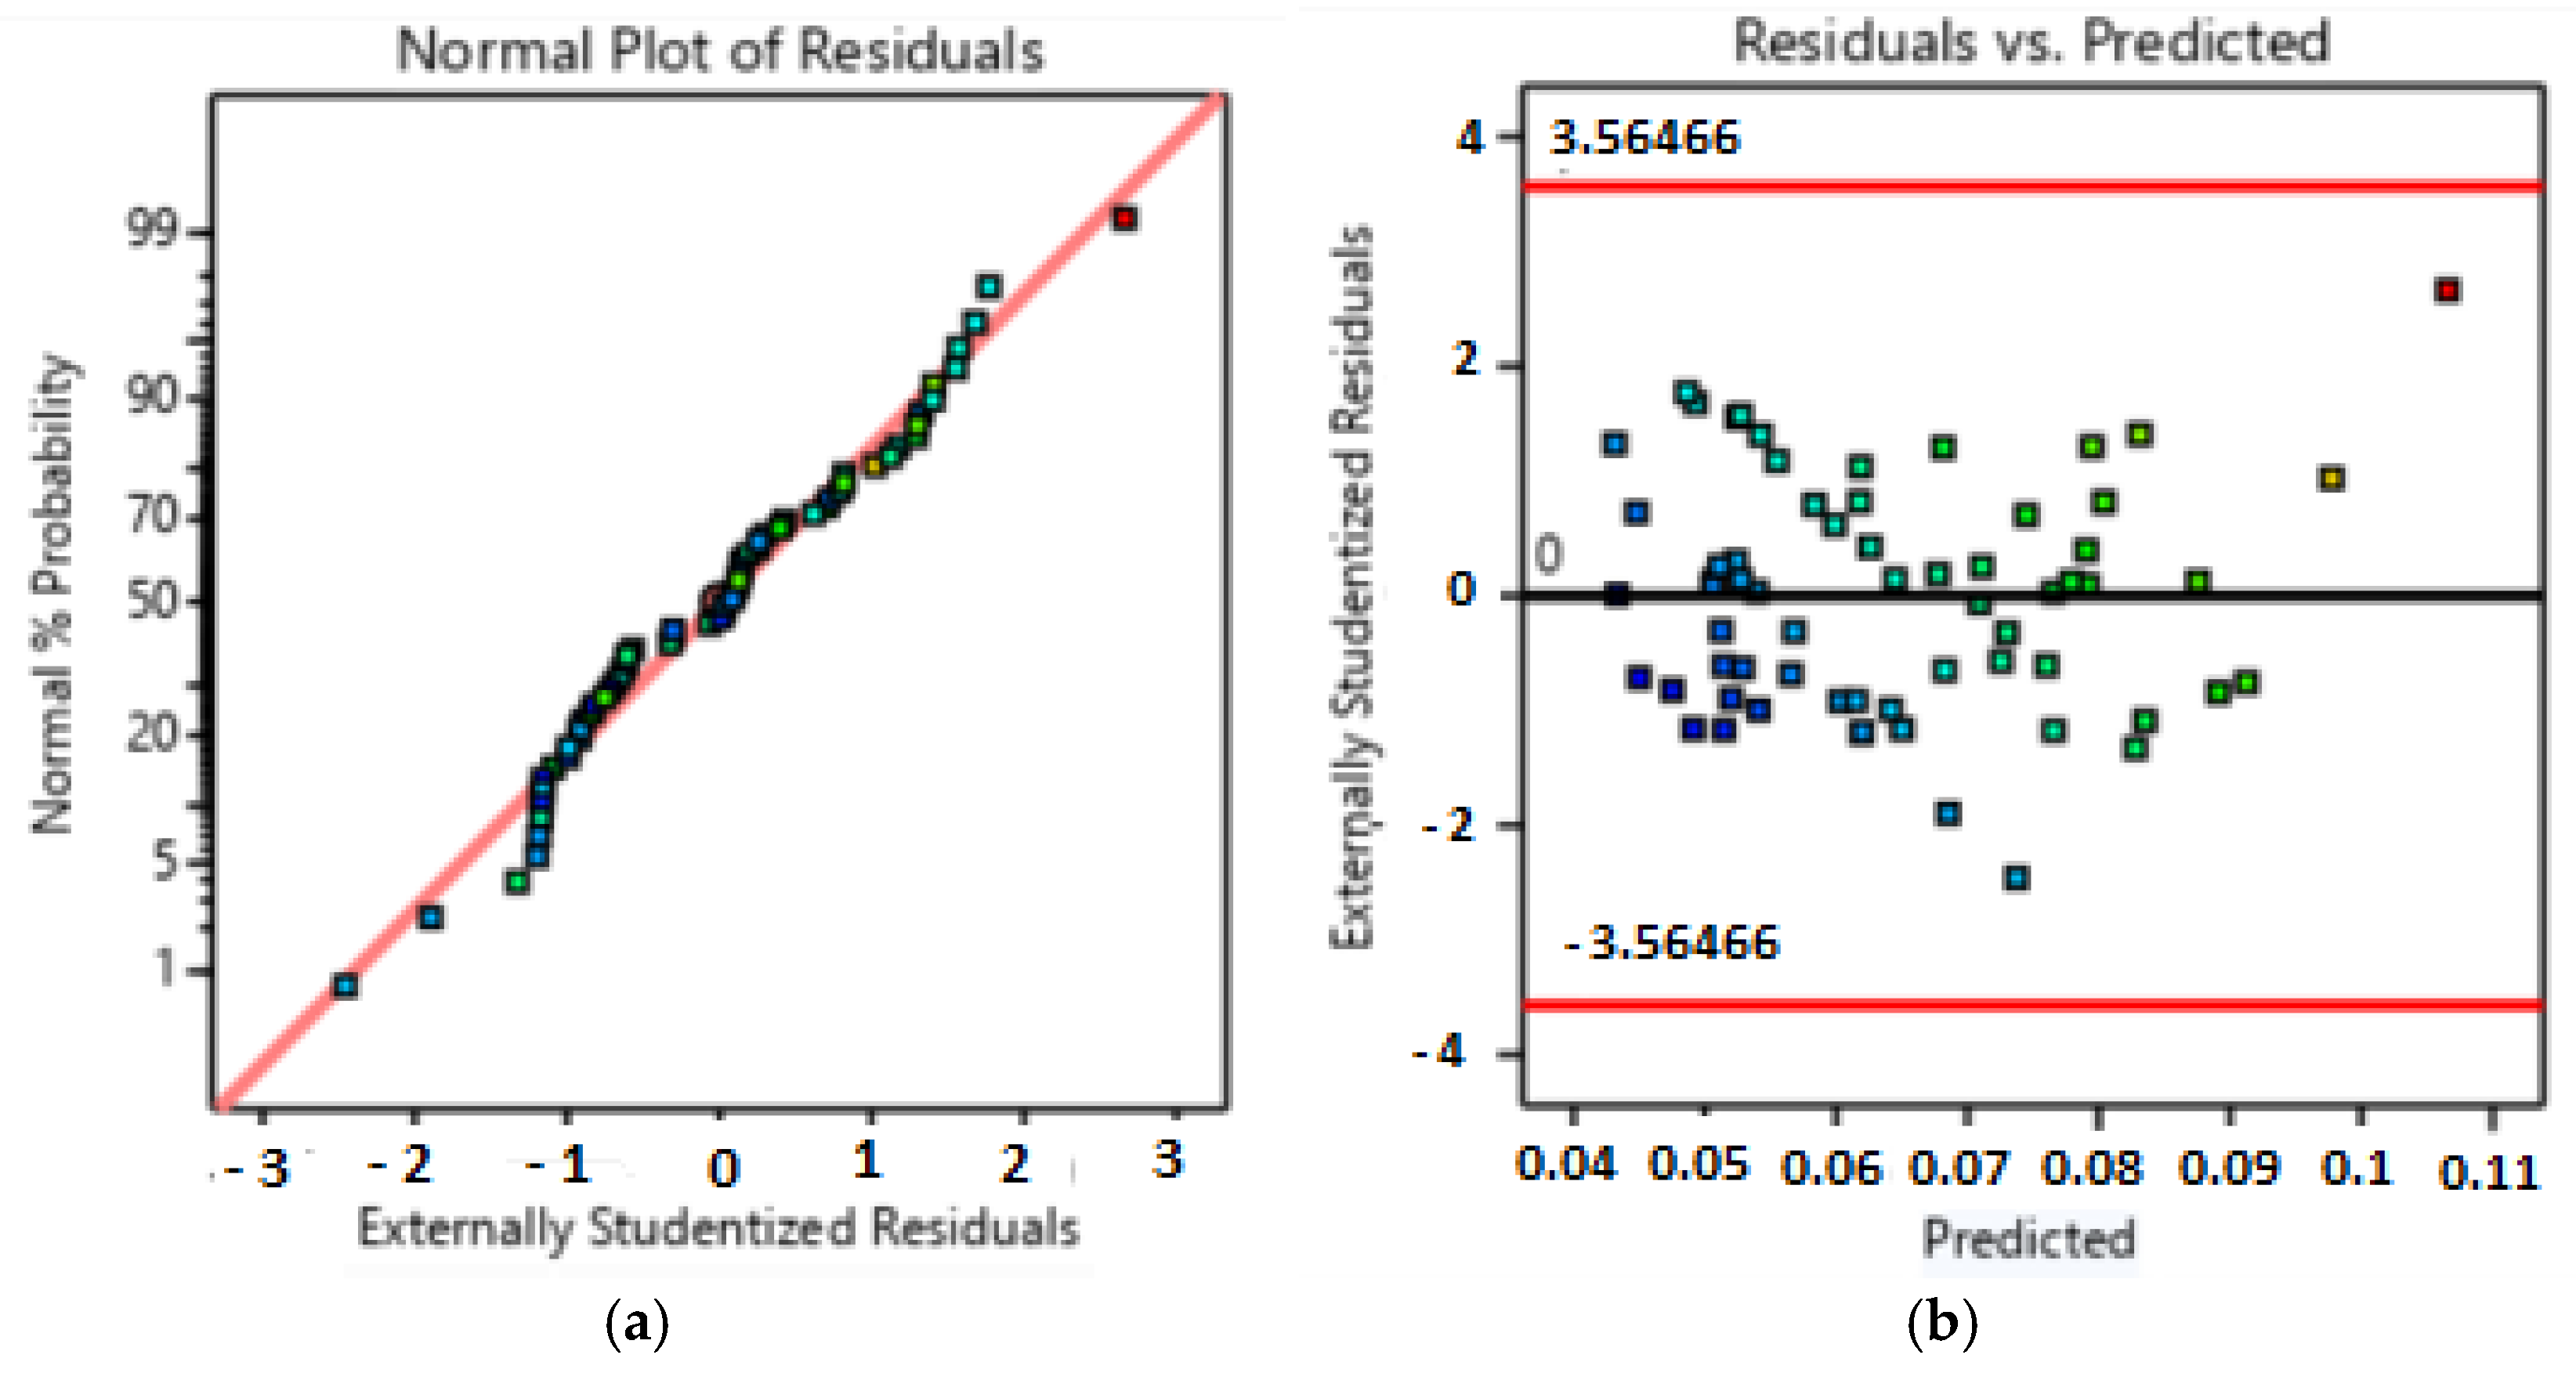
Figure 10. Residual plots for the friction coefficient model: (a) normal distribution of residual values and (b) residual values compared with fitted values.
Coatings 16 01104 g010
Figure 11. Desirability bar graph for machining parameters.
Coatings 16 01104 g011
Figure 12. Ramp function graph of desirability.
Coatings 16 01104 g012
Figure 13. Overlay plot for multi-responses.
Coatings 16 01104 g013
Table 1. Chemical composition of AISI 4130 steel in % weight [1].
ElementCMnSiSCrPMoFe
Wt. (%)0.260.840.300.0291.060.0090.22bal.
Table 2. Carbonitriding and tempering parameter designations.
Samples DesignationsCarbon Potential (%)Temperature (°C)Time (h)Tempered Conditions
C10.8–18707-
C110.8–18707200 °C, 1 h
C120.8–18707550 °C, 1 h
C21–1.28708-
Table 3. X-ray parameters for retained austenite.
X-ray diffraction
Difractometer: Pulstec μ-X360 apparatus
Retained austenite determination
Austenite γ face-centered cubic
Measure uncertainly
{2 1 1}plane. 2θ = 156.4°
±0.3%
Table 4. Important process parameters and their levels.
Hardness (HV0.1)Load F(N)Number of Passes (Np)
Level 163051
Level 2780105
Level 38701510
Level 49802020
Table 5. Mean friction-coefficient response (signal-to-noise ratio) by factor level. Values are the mean response computed at each level of each factor, not the physical level settings themselves (see Table 4 for the corresponding hardness, load and pass-count values at each level).
LevelMicrohardness (HV)Load (FN)Number of Passes (Np)
10.076720.055480.08310
20.055780.062860.06211
30.067250.067330.05779
40.057930.072010.05468
Delta0.020940.016540.02842
Rank231
Table 6. Full 4 × 4 × 4 factorial design and dataset (64 runs).
OrderHardness (HV)FN (N)NpFriction CoefficientOrderHardness (HV)FN (N)NpFriction Coefficient
198015100.054613378010200.04282
27801510.07538346302010.12346
39805200.04164357802050.05619
463010200.0655636780510.06356
57801550.05445379801550.05673
678015200.051453898020100.05374
79802050.05672397805200.03995
88702010.093224063020200.07868
978020200.05381419805100.04164
1098015200.045674278010100.05179
1163015100.0729943980510.06868
129801010.0767644980550.06403
1378020100.05472459802010.08598
1487020100.064214678015100.05445
15780550.046664798010100.05125
168701550.06563487801010.06784
1787015200.063844987010200.06158
1863020100.08189509801050.05301
198705100.05293518701510.08916
2087015100.06446527801050.053
2163015200.07049536302050.08589
228702050.06917546305100.05295
236305200.04887556301050.07059
2463010100.067865698010200.04907
257802010.0830157630550.06979
26870510.07742588701050.06465
277805100.04339596301550.07299
286301510.105096087010100.06174
298701010.079786198020200.04744
30870550.05420626301010.08846
318705200.0499463630510.07193
329801510.079846487020200.06402
Table 7. Model Summary Statistics.
SourceSequential p-ValueAdjusted R2Predicted R2
Linear<0.00010.55830.5193
2FI0.12480.57920.5170
Quadratic<0.00010.76090.7162
Cubic<0.00010.94010.8960Suggested
Quartic0.01490.95840.8883Aliased
Table 8. Analysis of variance.
SourceSum of SquaresdfMean SquareF-Valuep-ValueRemark
Model0.013090.001423.28<0.0001Significant
A-HV-Microhardness0.001810.001829.55<0.0001
B-FN-Normal Load0.002310.002336.80<0.0001
C-Np-Number of passes0.005910.005995.57<0.0001
HV. FN0.000610.00069.920.0027
HV. Np1.170 × 10−711.170 × 10⁻⁷ 0.00190.9655
FN. Np0.000010.00000.61540.4362
(HV)20.000610.00068.970.0041
(FN)20.000010.00000.47080.4955
(Np)20.002310.002336.87<0.0001
Residual0.0034540.0001
Cor Total0.016463
Table 9. Constraints for optimization of input and output parameters.
NameGoalLower LimitUpper LimitLower WeightUpper WeightImportance
A: Hardnessis in range630980113
B: Normal loadis in range520113
C: Number of passesis in range120113
Friction coefficient minimize0.0399540.123465113
Table 11. Comparison with previous friction/wear optimization studies.
ReferenceMaterial/ProcessTest MethodOptimization ApproachKey Reported Outcome/Distinction vs. Present Study
Trzepieciński et al. [8] Deep-drawing-quality steel sheetsMulti-pass friction testMulti-layer neural networkPredicts friction under sheet-forming contact; single-material study, no hardness gradient factor
Souid et al. [14] Nitrided D2 steelScratch/wear test at varying nitriding timesRSM + ANNClosest prior work by the same group; varies nitriding time only, not a joint hardness-load-passes factorial design
Schanner et al. [10] Various steel pairsStatic friction coefficient testingModel-based transferability analysisFocuses on transferability of static friction models between contact pairs, not multi-pass adhesive wear optimization
Daodon & Saetang [12] AISI D2 tool steel vs. advanced high-strength steelSliding friction with laser-textured surfaceExperimental comparison (no RSM/ANN)Surface texturing approach rather than bulk hardness-gradient (carbonitriding) approach
Daghbouch et al. [29]Nitrided AISI 4140 steelAdhesive wear (mass loss)RSM + optimizationRelated low-alloy steel and RSM approach, but targets mass loss rather than friction coefficient, and nitriding rather than carbonitriding
Present studyCarbonitrided (+tempered) AISI 4130 steelMulti-pass scratch testFull-factorial RSM/desirability function + ANNFirst joint optimization of hardness (via carbonitriding/tempering), normal load and number of passes for friction coefficient, with cross-validated RSM and ANN models (R2 = 0.993)
Disclaimer/Publisher’s Note: The statements, opinions and data contained in all publications are solely those of the individual author(s) and contributor(s) and not of MDPI and/or the editor(s). MDPI and/or the editor(s) disclaim responsibility for any injury to people or property resulting from any ideas, methods, instructions or products referred to in the content.