1. Introduction
In unconventional natural gas drilling projects, traditional cast-in-place construction sites generate substantial amounts of waste concrete. The removal of this concrete during site rehabilitation produces significant concrete waste residues, while the alkaline byproducts generated during burial treatment severely compromise soil biological activity and ecological functions. This process not only incurs high transportation costs but also causes secondary environmental pollution. Furthermore, concrete production consumes large quantities of sand and gravel, and cement manufacturing emits substantial amounts of carbon dioxide, sulfur dioxide, and nitrogen oxides, adversely affecting the environment and hindering efforts toward energy conservation, emissions reduction, carbon neutrality, and achieving carbon peak targets. The rational and reliable management of these extensive volumes of construction solid waste has become crucial for balancing urban development constraints, social progress, and environmental protection objectives.
In recent years, Chinese policies have increasingly promoted green and low-carbon transformation in the construction sector, with prefabricated construction playing a key role in this transition [
1]. As a novel building technology, prefabricated construction offers multiple advantages: it reduces material waste during construction, minimizes construction site debris, enhances energy efficiency, enables modular and industrialized production prior to excavation, is unaffected by rainy seasons, eliminates the need for on-site concrete curing, and significantly shortens construction timelines.
Against the backdrop of promoting prefabricated construction in China, research on the application of prefabricated module technology in pre-drilling engineering actively aligns with national development requirements. Mastering prefabricated construction techniques holds significant research importance for ensuring the quality of pre-drilling projects and accelerating their construction pace; therefore, developing and promoting prefabricated module technology for pre-drilling engineering is essential.
Vaitkus et al. [
2] investigated the impact of concrete mixture mechanical properties on the thickness and dimensions of prefabricated concrete panels, demonstrating that the minimum panel thickness depends on panel dimensions, concrete mix design, mechanical properties, elastic modulus, and tensile splitting strength. Jiang et al. [
3] employed elastic slab theory combined with finite element analysis to examine the mechanical behavior of prefabricated concrete pavement panels, identified the most unfavorable load positions, recommended a panel size of 4 m × 3 m × 0.28 m with circular tongue-and-groove joints, and further analyzed the mechanical responses under different joint configurations to determine optimal panel dimensions and load distribution patterns. Shuangquan et al. conducted research evaluating the geometric effects on full-size prefabricated concrete panels with various load transfer joint types, establishing computational frameworks for determining optimal dimensions and thicknesses based on macroscopic structural geometry parameters.
Guo et al. [
4] conducted monotonic loading tests on detachable connection systems for prefabricated pavement panels to investigate the effects of parameters such as connector width and end spacing on mechanical properties, developing computational design methods through finite element analysis. Wang et al. [
5] examined tongue-and-groove and lap joint configurations in prefabricated steel fiber-reinforced concrete pavement panels, measuring maximum tensile stress, shear stress, and deflection under various axle loads via experimental and software simulations. Sadeghi et al. [
6] employed ABAQUS nonlinear finite element analysis to study the mechanical response of pavement joints under moving axle loads using a concrete damage plasticity model, evaluating load transfer efficiency between pin-and-tongue joints and groove joints. Zhang et al. [
7] compared the load transfer efficiency of three connectors—pins, Uretek GFRP bolts, and open pins—under static and cyclic loads. Jiachen Guo et al. performed monotonic loading tests to analyze how stainless steel rod connector width, slab thickness, and end spacing influence the mechanical behavior of proposed connection systems. Pradena et al. [
8] characterized the load transfer efficiency versus crack width relationship for innovative short-section conventional concrete pavements in laboratory settings. These studies focus on the mechanical behavior of panel joints and connectors, ensuring pavement continuity and durability.
Liu et al. [
9] conducted static and cyclic loading tests on nickel–iron slag concrete prefabricated components to evaluate their ultimate bearing capacity and structural behavior. Wang et al. [
10] investigated the mechanical responses of steel fiber-reinforced concrete slabs under varying static loads, analyzing strain distribution patterns and microstructural characteristics; their study demonstrated that steel fiber reinforcement enhances the bonding performance at the fiber–mortar interface. These studies return to fundamental material principles, demonstrating how altering concrete composition can improve mechanical or interfacial properties.
Han et al. [
11] conducted static tests on prefabricated steel truss–precast hollow concrete composite slabs to investigate their ultimate bearing capacity, failure modes, and cracking characteristics, with experimental results agreeing within 10% of the theoretical predictions. Alwehaidah et al. [
12] tested three full-scale prefabricated prestressed concrete pavements with variable thicknesses mounted on granular subgrades under static and repeated loading conditions. Xin et al. [
13] investigated the influence of steel trusses on the mechanical properties of prefabricated slabs. These studies focused on specific slab configurations and employed full-scale or scaled physical experiments to directly determine load-bearing capacity, cracking behavior, and failure patterns.
Liu et al. [
14], utilizing the elastic layered Boussinnesque theory combined with an ABAQUS finite element model, analyzed stress distribution and displacement patterns at various locations of precast pavement panels under aircraft wheel loads. Kim et al. [
15] developed and validated a three-dimensional finite element model to evaluate the impact of thermal gradients on the behavior of prestressed concrete pavement systems. Chaojia Liu et al., employing the elastic layered Boussinnesque calculation theory alongside an ABAQUS finite element numerical model, determined stress distribution laws, wheel load-induced displacements across different panel positions, the effects of additional loading rods on pavement panels, and load transfer between adjacent panels. These studies primarily employ finite element or elastic theory methodologies, focusing on establishing computational models and elucidating distribution patterns.
Dominik Prammer et al. [
16], through an in-depth analysis of two years of measurement data, evaluated temperature variations, extreme values, and gradients associated with external weather conditions. The study focused on the additional internal forces and long-term performance evolution induced by external temperature changes.
These studies have made significant contributions in the specific dimensions of design theory, experimental methodology, and finite element modeling; however, they all share common limitations, such as insufficient experimental validation, limited load scenarios, and failure to account for temperature–load coupling. Notably, there is a lack of an integrated research framework that comprehensively incorporates design theory, ultimate bearing capacity testing, and ANSYS-based mechanical response analysis. To address these shortcomings associated with individual experimental approaches, this paper draws on the technical principles of prefabricated construction to propose methodologies for applying prefabricated modular structures in unconventional natural gas drilling projects. It involves designing and performing theoretical calculations for prefabricated pavement panels, conducting ultimate bearing capacity studies, and analyzing the mechanical properties of road structures under static and dynamic loads using ANSYS numerical simulation methods.
2. Design and Theoretical Calculation of Prefabricated Pavement Panels
The current pavement design is primarily based on estimated traffic volumes and standard axle loads (BZZ-100), which differ somewhat from the actual traffic volumes and vehicle axle loads observed during preliminary engineering surveys. Therefore, a vehicle load survey was conducted at shale gas well sites in the southwestern region of China. The results showed that two-axis vehicles and three-axis vehicles accounted for 22%, four-axis vehicles (including trucks and large fracturing vehicles with a load capacity of 31–40 tons) accounted for 52%, five-axis vehicles accounted for 14%, and six-axis vehicles accounted for 12%. In practice, trucks dominate the traffic composition, and the pavement surfaces at shale gas well sites are primarily designed to withstand loads from vehicles with four or more axles.
The investigation revealed that approximately 60% of the axle loads on four-axle vehicles range from 10 to 15 tons, accounting for about 52% of the total traffic volume at the well site and constituting the majority of traffic flow. Taking into account both the service life of the pavement panels and their economic reliability, the design conditions for prefabricated panels were initially established using the BZZ-100 axle load as a benchmark (axial load of 140 kN). During verification calculations, additional scenarios—including heavy-load conditions (axial load of 200 kN) and extreme conditions (axial load of 280 kN)—were incorporated to account for overload situations.
2.1. Calculation of Vehicle Wheel Print Area
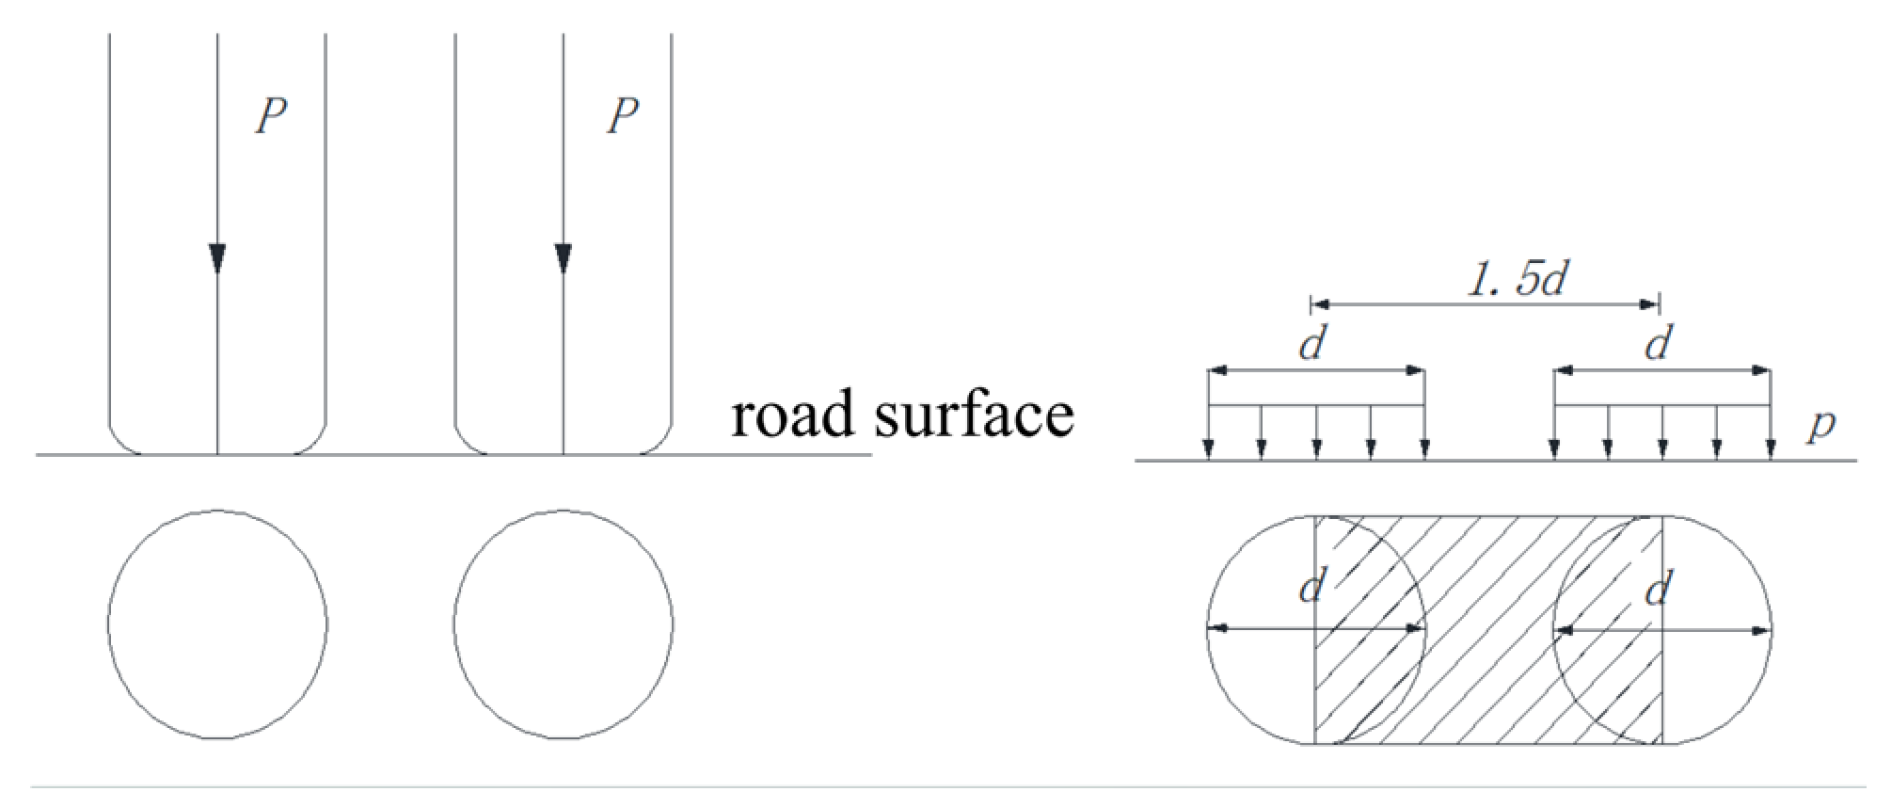
In load calculation, a rectangular area is used for computation, as shown in
Figure 1. Under the three operating conditions of design, overload, and extreme stress, with a load pressure of 0.7 MPa each, the wheelbase remains constant at 1.8 m; corresponding axle loads are 140 kN, 200 kN, and 280 kN, while the single-wheel equivalent circle diameters are 0.357 m, 0.426 m, and 0.505 m respectively. For a single-axis load of 140 kN, the dual-circle load d equals 0.252 m. It should be noted that this study assumes a tire pressure of 0.7 MPa under all three operating conditions, which is consistent with the actual tire inflation pressures measured at the field site. Field surveys indicate that the tire pressure for transport vehicles at well sites typically ranges between 0.7 and 0.8 MPa, and the variation in tire pressure under heavy-load conditions is limited; therefore, this assumption is acceptable within the scope of this analysis.
2.2. Reinforcement Calculation
Given that excessively thick pavement panels hinder transportation and installation, while overly thin panels cannot withstand heavy loads, the prefabricated pavement panels are designed with a thickness of 150 mm. The concrete protective layer has a thickness of c = 35 mm, and the distance ϵs from the tensile edge of the panel to the longitudinal tension reinforcement is 40 mm; consequently, the effective height h0 of the cross-section is 110 mm. It should be noted that the cover thickness of 35 mm is adopted based on the specific site conditions of the shale-gas well pads in southwestern China, where no de-icing salts are used and carbonation risk is moderate. For applications in cold or industrially polluted regions, a larger cover should be used in accordance with relevant codes.
The design load values must account for both the dynamic loads from vehicles and the self-weight of the prefabricated slab: 1.2 times self-weight + 1.4 times vehicle load.
, = 140 ÷ 0.357 ÷ 2 = 196.08 kN/m, mobile load: = 274.51 kN/m
, 25 kN/m3, slab self-weight: = 6.75 kN/m
Prefabricated pavement slabs struggle to establish continuous, tight contact with the subgrade and leveling layer, while the rigid pavement layer must bear the majority of load stresses. Consequently, slab design cannot strictly adhere to standard cast-in-place road specifications. To simplify calculations and ensure accurate reinforcement design, voided prefabricated pavement slabs may be treated as beams for reinforcement analysis. This treatment is equivalent to the one-way slab (beam) assumption, i.e., the load is assumed to be carried primarily in the span direction, with moment redistribution in the transverse direction neglected. This assumption is conservative because it disregards the beneficial effect of two-way load sharing, and it is also consistent with the simply supported beam configuration adopted in the subsequent full-scale static loading tests. Based on actual site conditions, void spans can be specified as 1.0 m, 1.5 m, or 2.0 m. For a void span of l = 1000 mm, the cross-sectional dimensions of the calculation unit are b × h = 1000 mm × 150 mm.
2.2.1. Bending Moment Design Value
2.2.2. Area of Reinforcement
Concrete strength grade C40: Design compressive strength of concrete (f
c) = 19.1 N/mm
2; design strength of reinforcement (f
y) = 360 N/mm
2; stress coefficient α
1 for rectangular stress diagram = 1.0. The cross-sectional area of longitudinal reinforcement bars under all operating conditions is calculated using Formula (1).
The cross-sectional area of the longitudinal tension reinforcement under each operating condition was calculated separately and is presented in
Table 1. Design 1 represents the design condition (140 kN); Design 2 represents the extreme condition (200 kN); and Design 3 corresponds to the ultimate condition (280 kN).
As shown in
Table 1, when the void span is excessively large, increasing the reinforcement area of prefabricated pavement slabs (>1500 mm
2) leads to higher slab weight, which hinders cost reduction and occurs with low probability; conversely, using a smaller reinforcement area (<1000 mm
2) fails to meet operational requirements. Therefore, a reinforcement area of As = 1026 mm
2 was selected to satisfy Condition 1 and part of Condition 2. According to the Code for Design of Concrete Structures (GB 50010-2010) [
17], C14@150 steel bars shall be used for longitudinal tension reinforcement at the bottom of prefabricated pavement slabs, while C14@150 bars shall be employed for transverse tension reinforcement at the bottom of prefabricated culvert pavement slabs.
2.2.3. Calculation of Bearing Capacity
Load-bearing capacity calculation enables more accurate determination of the load-bearing performance and structural safety margin of prefabricated pavement slabs, making it a critical component of the design. The following calculations are categorized into central compression load-bearing capacity analysis and corner compression load-bearing capacity analysis based on actual pavement slab conditions. Calculation of the bearing capacity of the compressed zone at the corners of pavement panels during installation can be carried out using Formula (2). The bearing capacity of the compression zone in the middle of the pavement slab in an assembled section can be calculated using Formula (3). According to the Code for Design of Concrete Structures (GB 50010-2010), the design value for the worst-case local compressive bearing capacity of prefabricated slabs is approximately 3200 kN, significantly exceeding the benchmark design axial load of 140 kN, the overload axial load of 200 kN, and the ultimate axial load of 280 kN, thereby meeting practical engineering requirements.
2.2.4. Calculation of the Maximum Crack Width for Prefabricated Pavement Panels
In actual wellsite applications, the crack width directly affects the durability of the structure (e.g., steel reinforcement corrosion and concrete carbonation); therefore, the maximum crack width must be verified in accordance with relevant codes. This paper presents the calculation of crack width based on the provisions of GB 50010-2010. Use the following formula for calculation (4):
where ω
max—maximum crack width; σ
s—steel bar stress; ψ—coefficient of non-uniformity of steel bar strain between cracks; ρ
te—longitudinal tension steel reinforcement ratio calculated based on the effective tensile concrete cross-sectional area; d
eq—equivalent diameter of longitudinal tension steel bars; ν—steel bar surface characteristic coefficient; Es—elastic modulus of steel bars; c
s—cover thickness.
The above analysis demonstrates that the reinforcement area of the prefabricated pavement slab reaches As = 1026 mm2, meeting the requirements for Service Condition 1 as well as some of Conditions 2 and 3; thus, this reinforcement area is deemed appropriate. Consequently, the longitudinal tension bars in the lower section of the prefabricated pavement slab should be C14@150, while the transverse tension bars should also be C14@150. According to the Code for Design of Concrete Structures, when concentrated loads are significant, the longitudinal tension bars in the upper layer shall be C10@200.
4. Mechanical Response Analysis of Prefabricated Concrete Roads Based on ANSYS
Following the static load test described in
Section 3, a three-dimensional finite element model of the prefabricated pavement system—comprising four precast slabs, a dry-mixed mortar leveling layer, and the underlying soil subgrade—was developed using the ANSYS 2021 finite element software to analyze the mechanical responses of the road structure under both static and moving loads.
4.1. Model Design
4.1.1. Model Parameter Settings
The model parameters were selected based on the experimental results and the “Code for Design of Concrete Structures” [
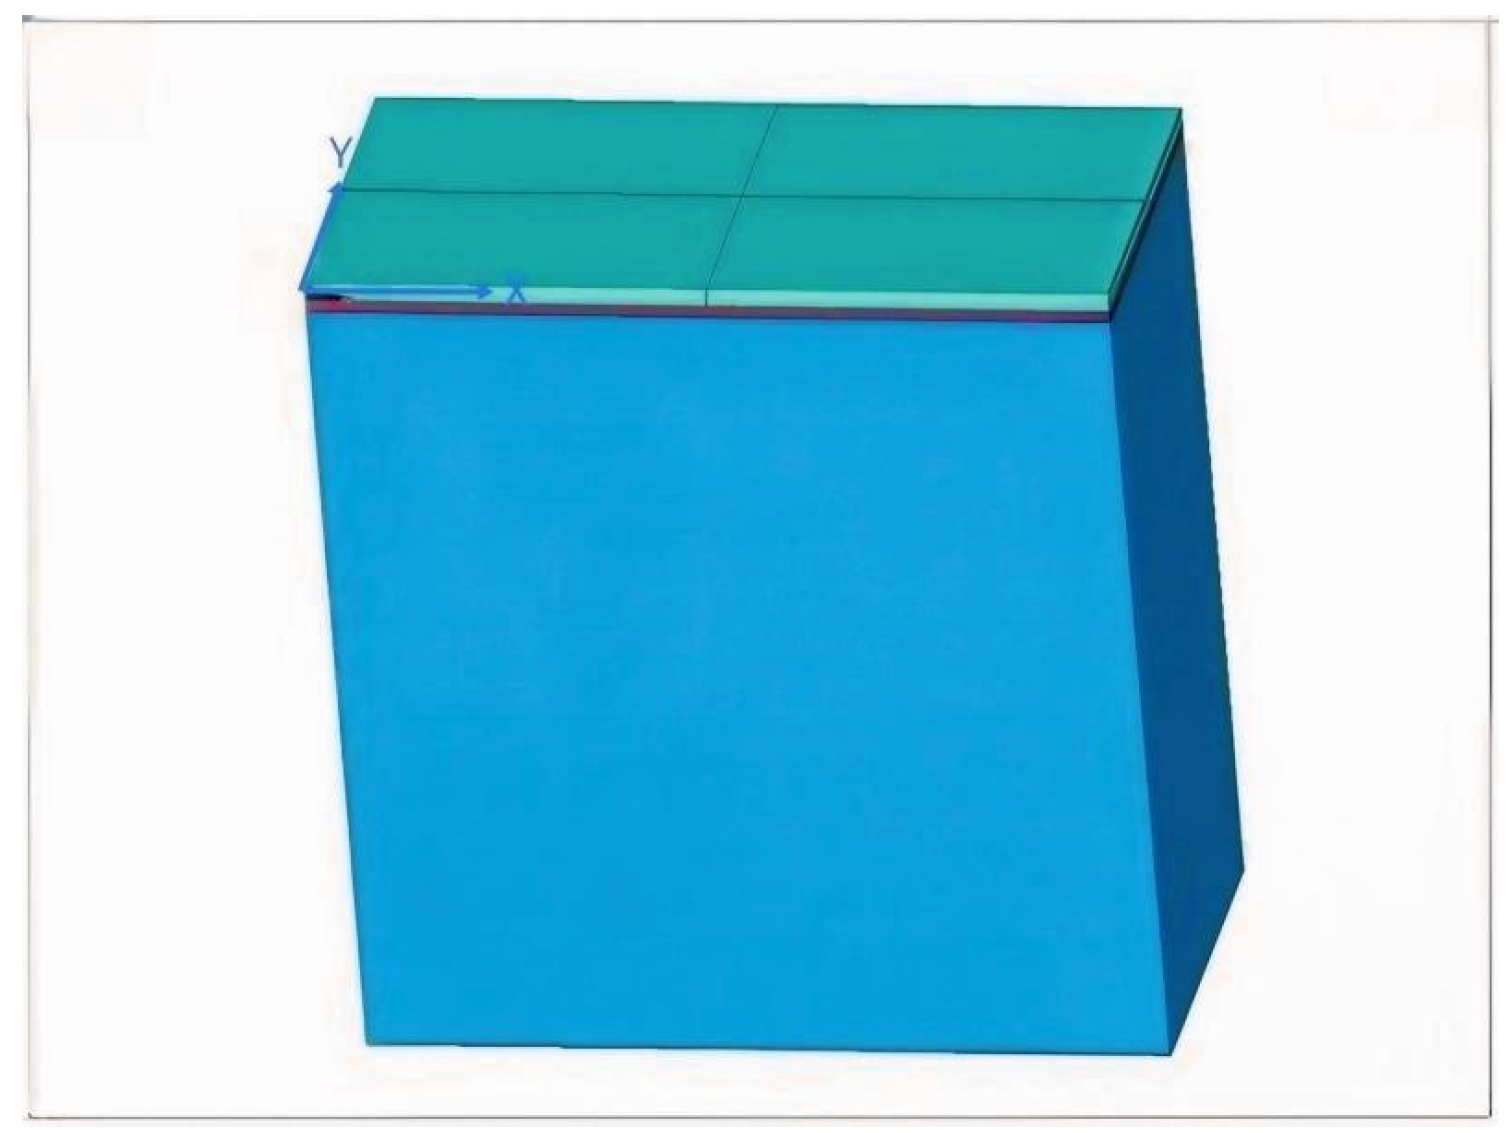
17]. To simulate the actual stress conditions of a prefabricated road, four prefabricated pavement slabs were employed to model a road structure measuring 6000 mm in length, 3000 mm in width, and 6000 mm in depth, as shown in
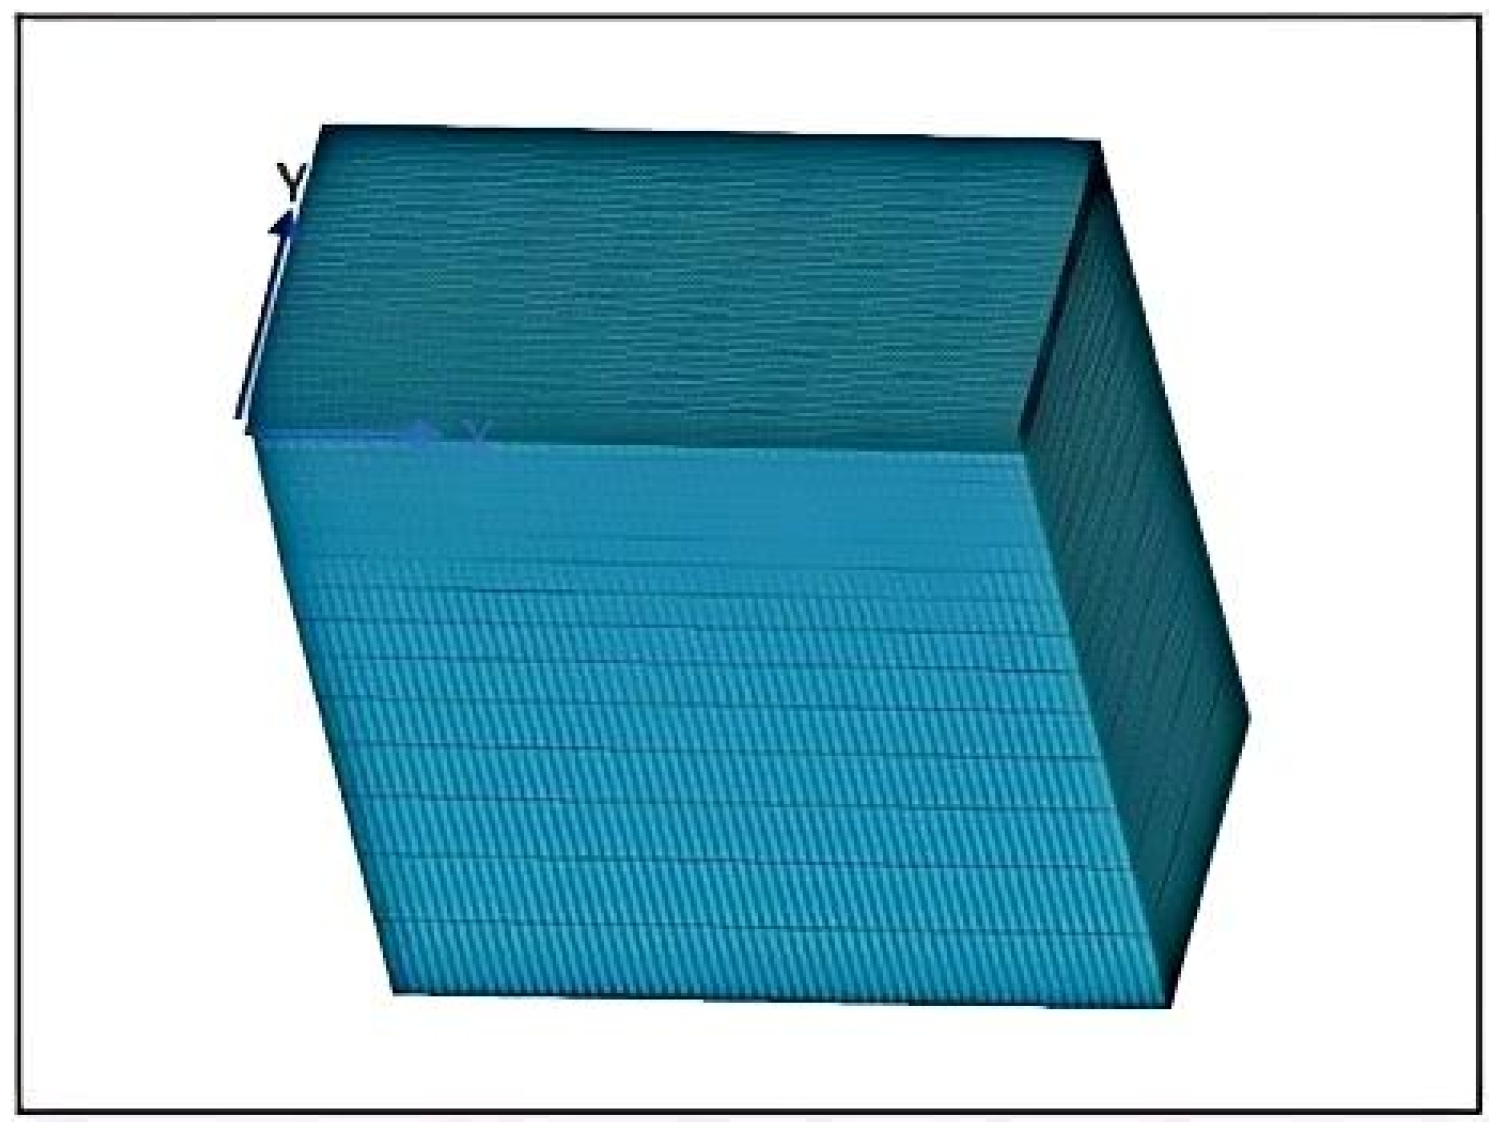
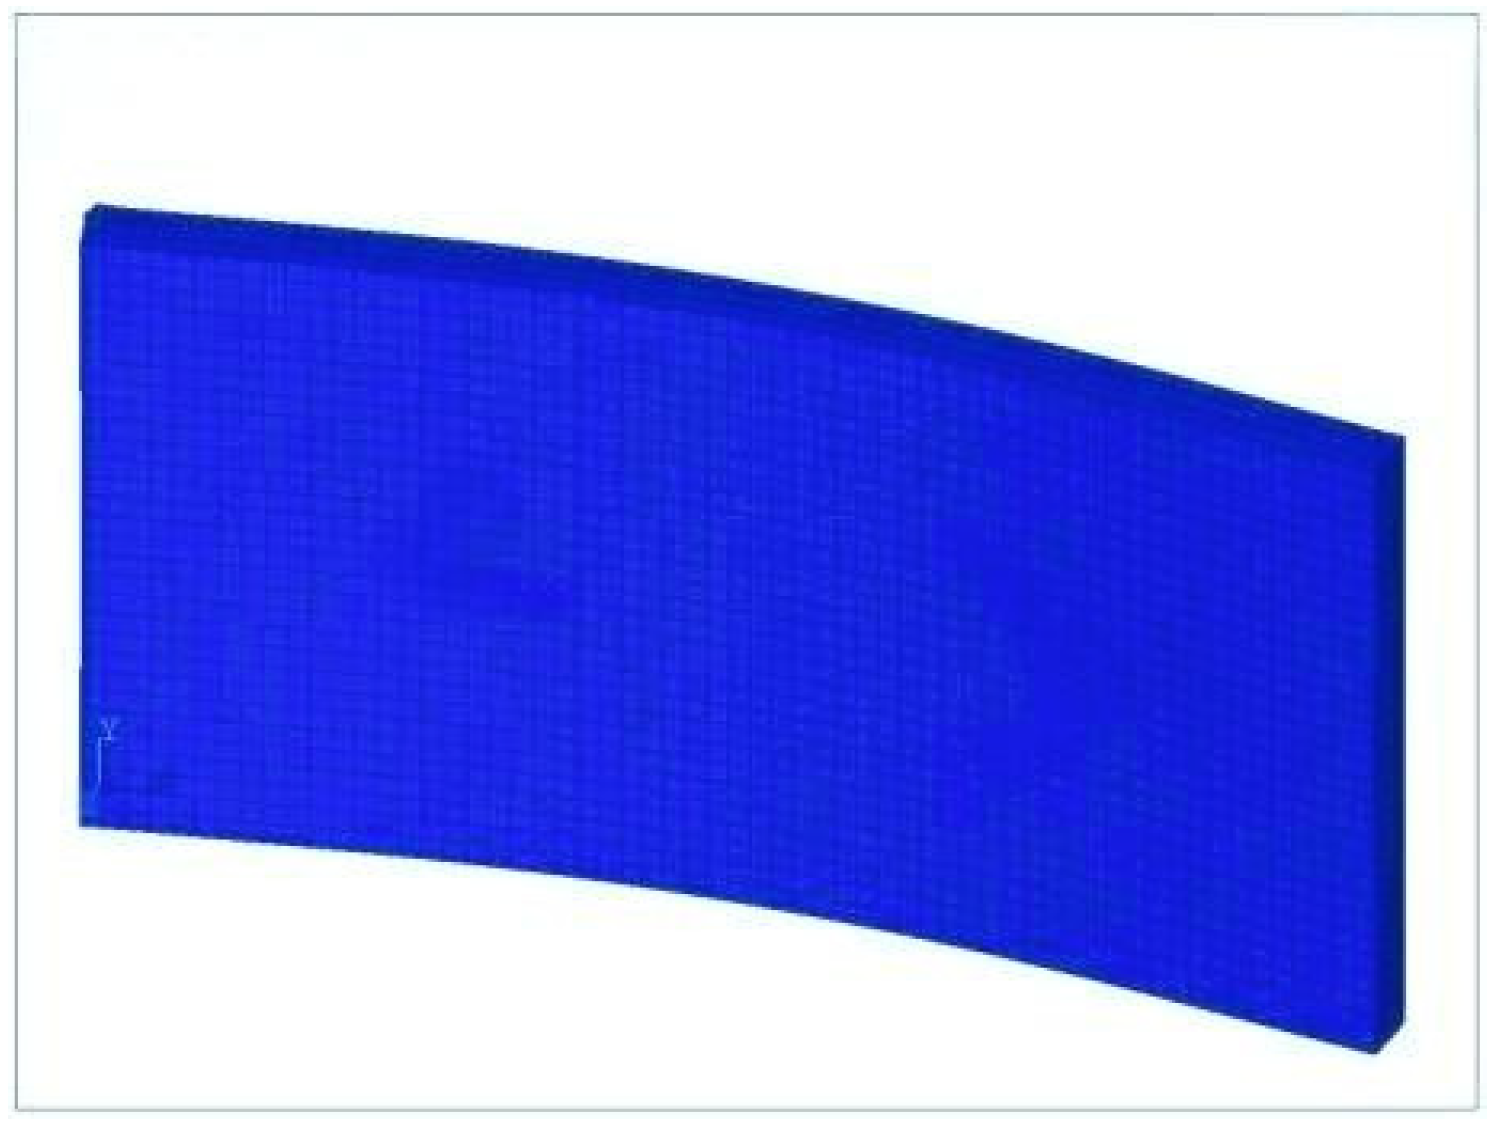
Table 2. Considering computational requirements and processing speed, the road structure dimensions were divided following the principle of “dense upper layers and sparse lower layers”: the vehicle travel zone of the pavement layer was subdivided using a 50 × 50 mm grid, while grids for the leveling course and subgrade gradually increased in size; all layers were interconnected via merging to simplify the model and facilitate comparison with the single-slab test. Specific mechanical parameter values are presented in
Table 3.
4.1.2. Model Unit
Use Solid95 concrete elements that accommodate irregular shape models without compromising accuracy. For the concrete constitutive model, adopt the two-parameter model proposed by Guo Zhenhai et al. at Tsinghua University.
Simulations can be conducted using the Link180 steel bar element, which is suitable for various engineering applications. Depending on the specific context, this element can be classified as a truss element, cable element, chain element, or spring element.
4.1.3. Model Experiment
In the FE model validation, the precast slab was assigned the same simply supported boundary conditions as in the laboratory test, with both ends restrained in the vertical direction and a clear span of 2.8 m, to ensure a direct comparison between the simulated and measured responses. The concrete precast pavement structure consists of three main layers: the precast pavement slab, a dry-mixed mortar leveling layer, and the soil subgrade. For simulation purposes, an elastic multi-layer model should be employed as the mechanical analysis framework. In ANSYS, the Block command can be directly utilized for solid modeling; the soil material model adheres to the DP yield criterion, employs a well-defined elastic–plastic constitutive model that accounts for volume expansion under yielding conditions, though temperature-induced variations are not considered in this simulation.
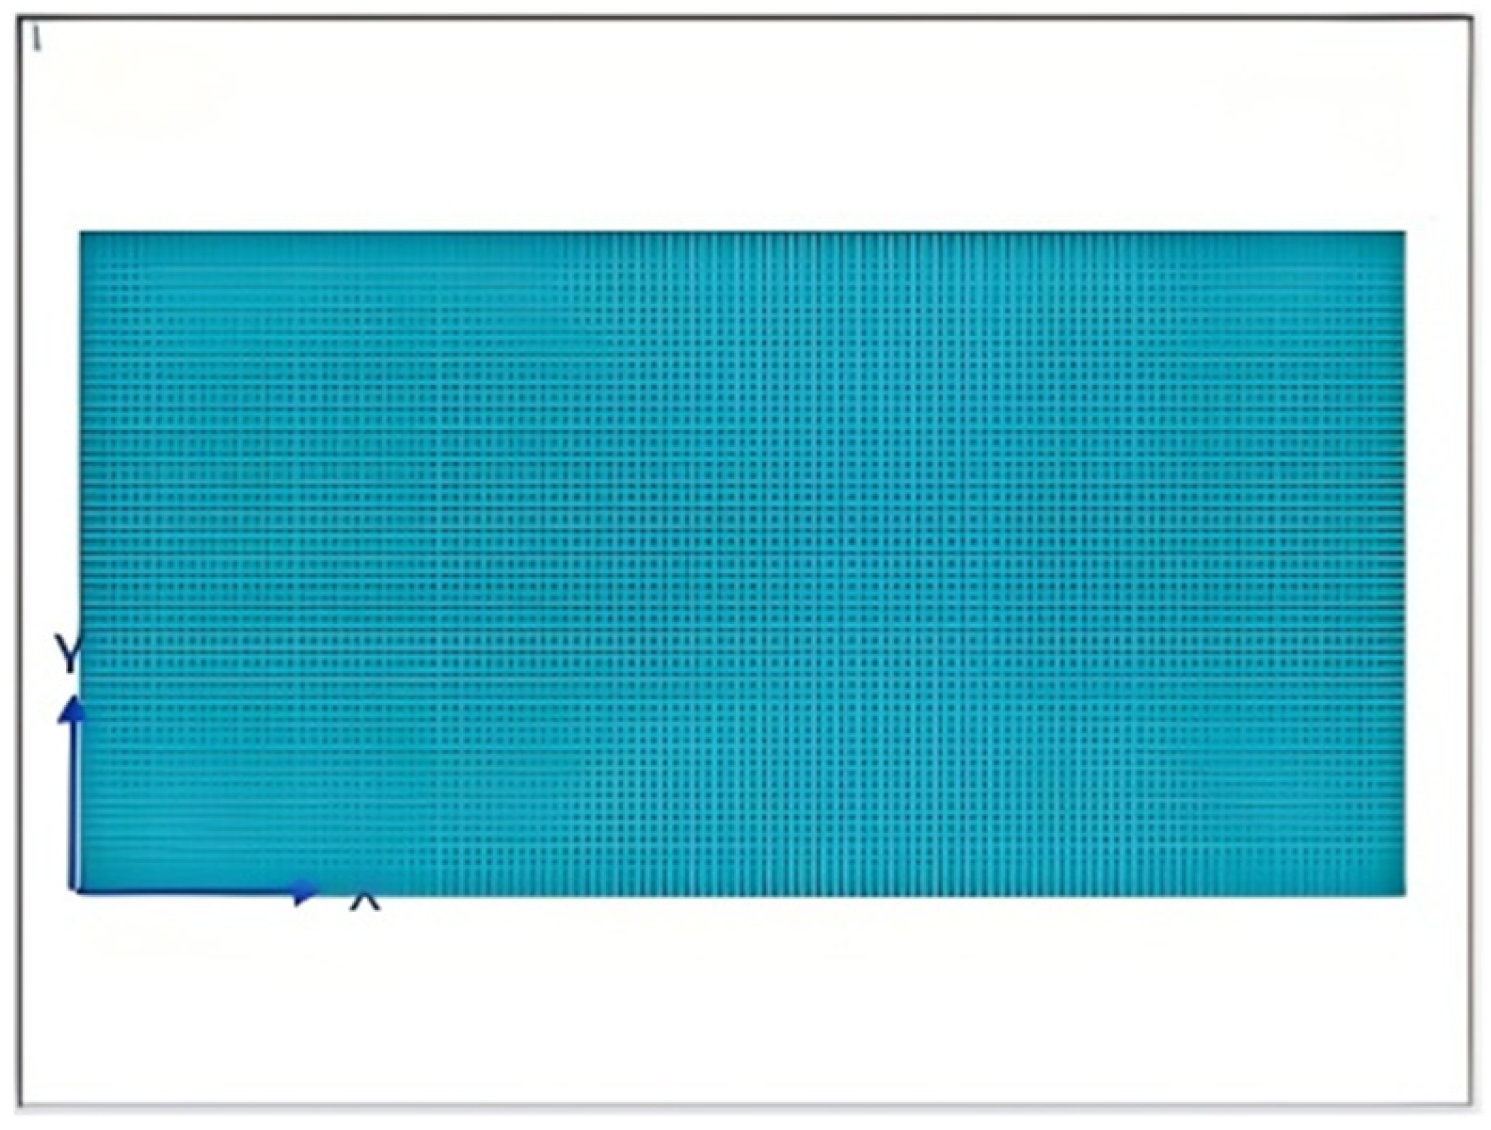
The concrete for prefabricated pavement slabs employs a multilinear following reinforcement model, while the steel reinforcement utilizes a bilinear isotropic hardening plasticity model. The paving slab is simulated using solid elements, and the entire model adopts a discrete element approach, as shown in
Figure 10 and
Figure 11.
The soil subgrade was modeled using the Drucker–Prager yield criterion (hereafter referred to as the DP model), which is commonly used for geomaterials to account for pressure-dependent yielding and volume expansion (dilatancy) under shear loading. The DP model parameters were calibrated based on typical compacted subgrade conditions in the Sichuan Basin, with a friction angle of φ = 30° and a cohesion of c = 30 kPa. The dilatancy angle was taken as ψ = 0° (associated flow rule).
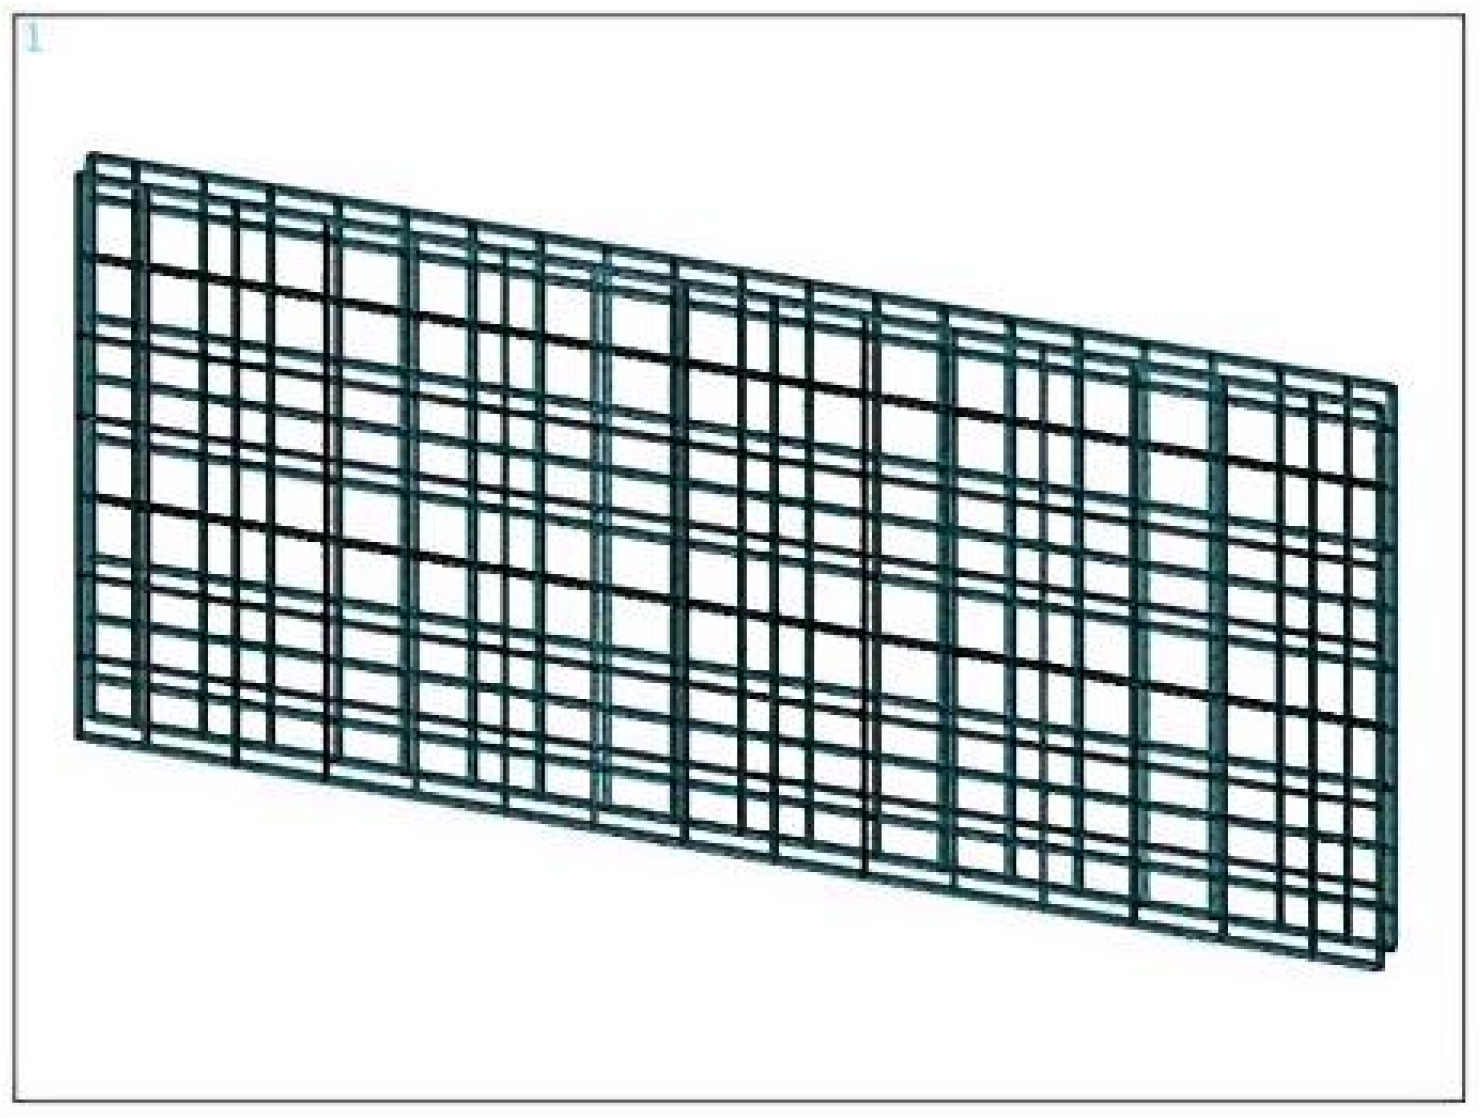
For the reinforcement-concrete interface, the bond–slip interaction was neglected, and a perfect bond was assumed between the steel bars and the surrounding concrete. This was implemented using the embedded region technique in ANSYS (via the Ceintf command to establish constraint equations between reinforcement and concrete element nodes). Under this approach, the translational degrees of freedom of the reinforcement nodes are constrained to the corresponding concrete nodes, allowing no relative slip. The Willan–Warnke five-parameter failure criterion was applied for concrete.
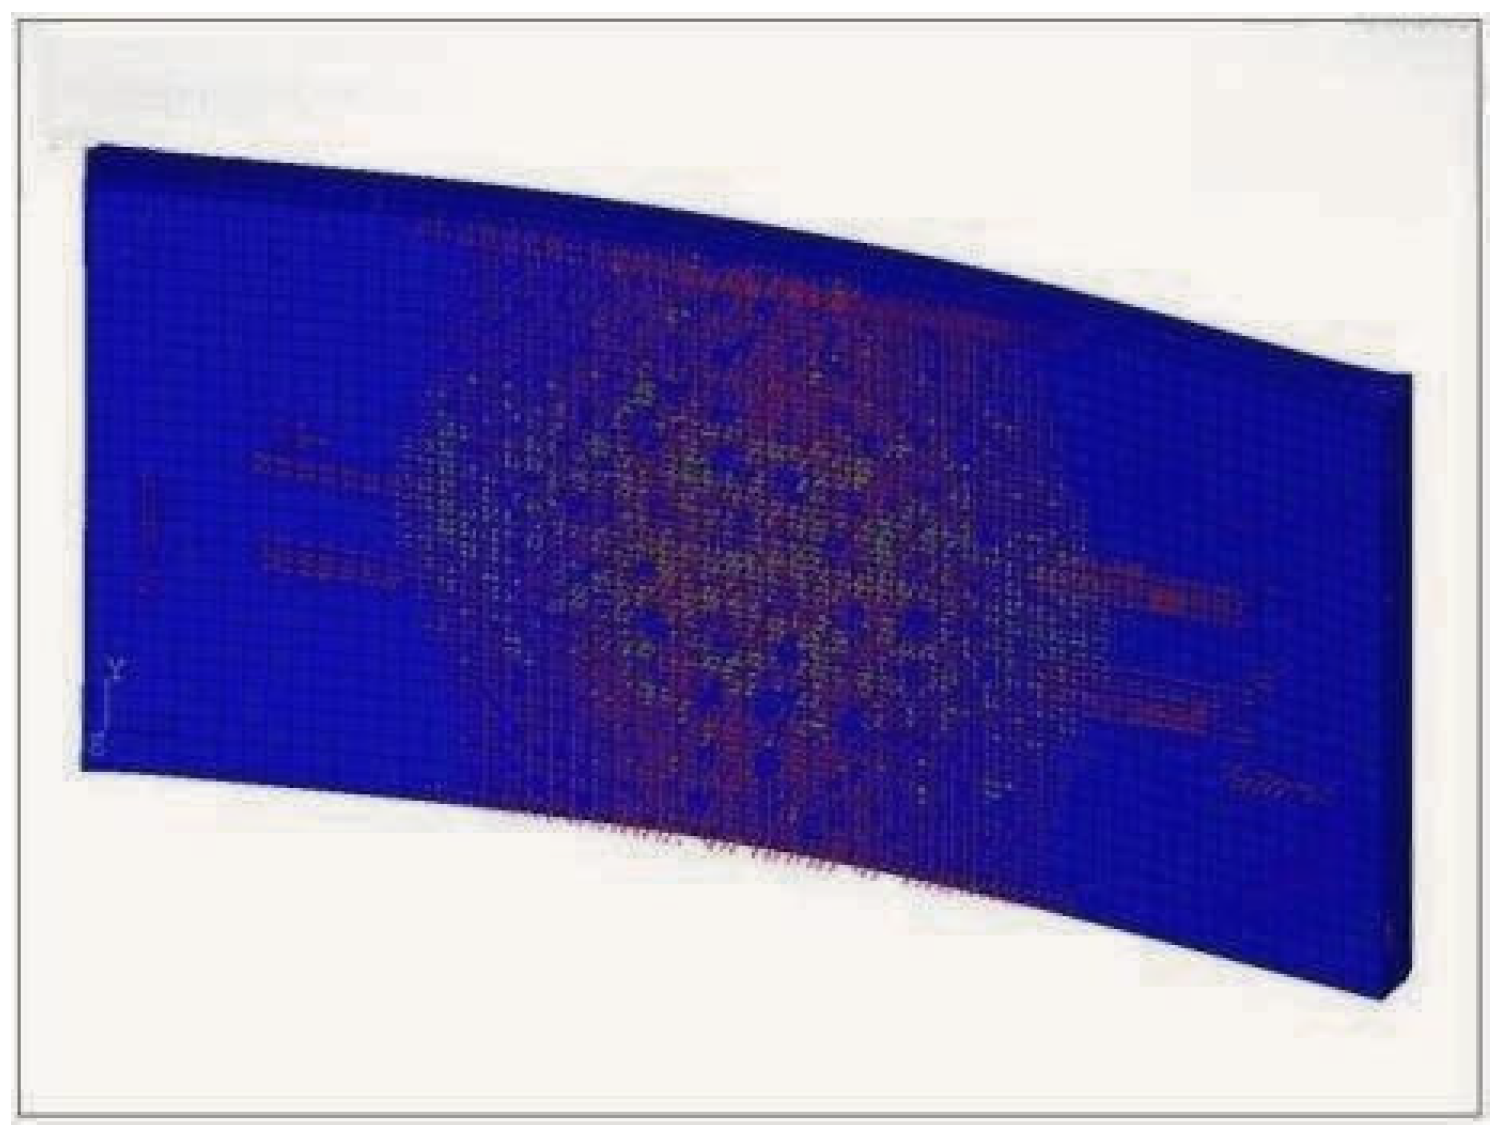
Since the entity-based segmentation method cannot position the surface layer reinforcement bars and bottom-layer reinforcement bars in asymmetric locations, the constraint equation method was used to establish the upper and lower reinforcement sections separately. The modeling procedure is as follows: first, use the Point command to locate each reinforcement bar; second, connect them with the Line command to form individual bars; and finally, apply the Ceintf command to generate the constraint equations that couple the reinforcement and concrete element nodes, thus producing a fully integrated precast pavement slab model.as shown in
Figure 12.
After completing the grid division, the prefabricated road structure should be constrained. To simplify the model, when setting boundary conditions for the prefabricated road, the ground surface is fully constrained, and simultaneous relative displacement constraints are applied along both the
X- and
Y-axis directions.as shown in
Figure 13.
The four precast slabs in the pavement system were placed adjacent to each other without any mechanical connectors between them. The slab-to-slab interfaces were modeled as simple contact edges transmitting only compressive and shear forces through nodal constraints, with no bending moment transfer. This joint modeling approach is consistent with the simplified beam-type design and the single-slab test configuration. In this FE analysis, the slab, leveling layer, and subgrade were coupled at nodes as fully bonded interfaces to facilitate comparison with the single-slab static test. This simplification does not apply to joint load-transfer or slab-void analyses.
4.2. Car Load
The forces exerted by a vehicle on the road can be categorized into those during stationary conditions and during driving conditions. To better simulate the forces acting on the road under various driving scenarios, when the vehicle is in motion, tire loads are modeled as uniformly distributed vertical rectangular loads; for braking sections, wheel loads are assumed to be uniformly distributed vertical and horizontal rectangular loads, with the horizontal force acting on the road surface aligned with the vehicle’s direction of travel.
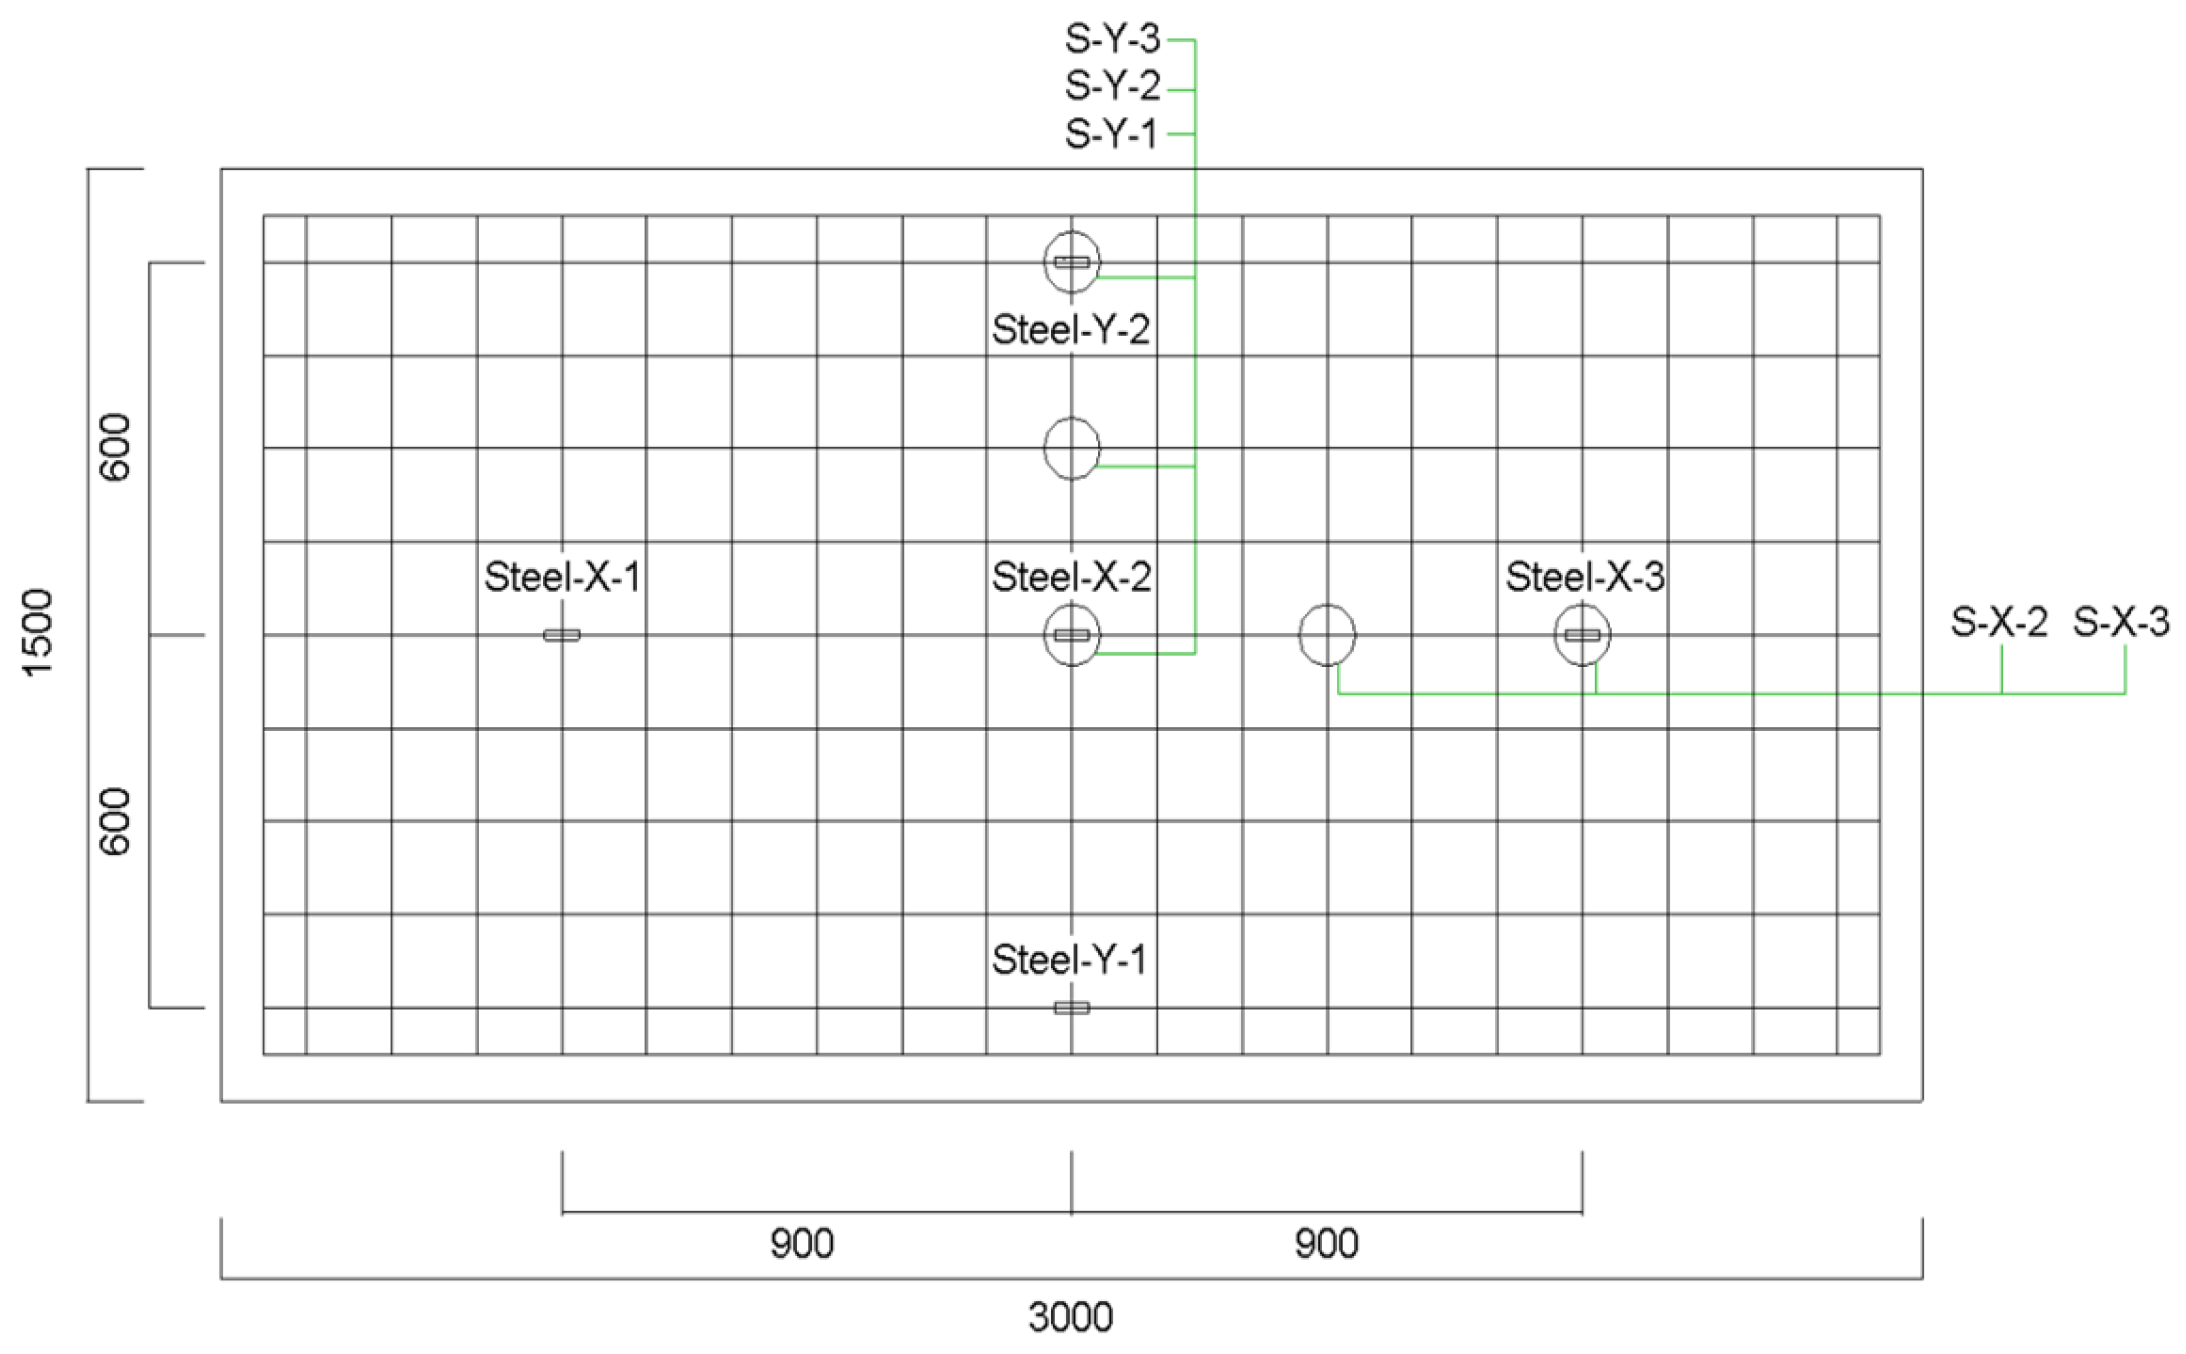
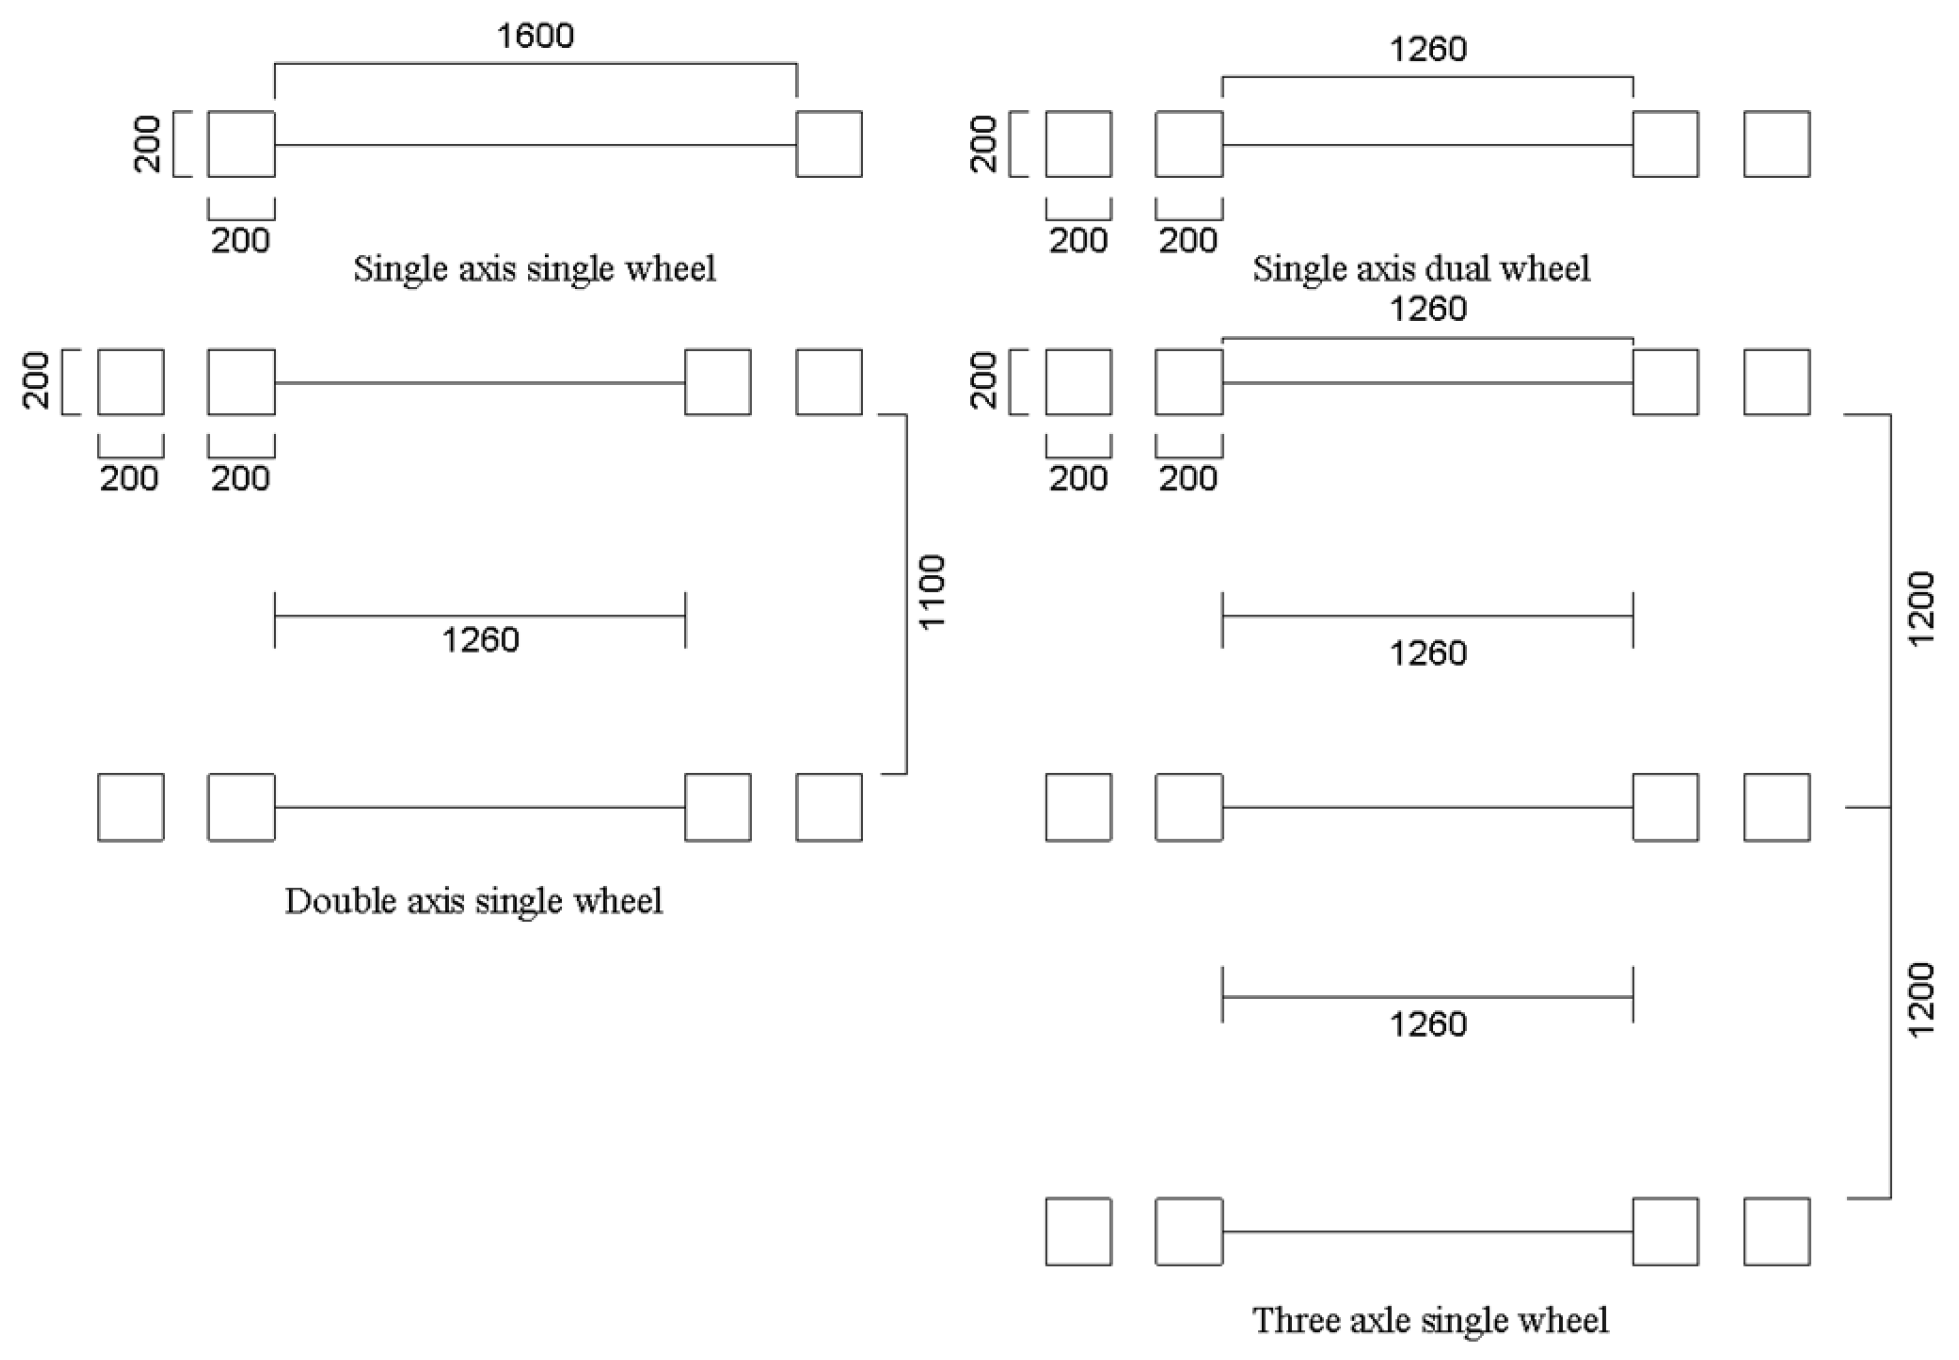
Classified by configuration (single-axis single-wheel, single-axis dual-wheel, dual-coupling, or triple-coupling), the specific wheelbase and wheel weight distribution are shown in
Figure 14.
As the uniaxial load increases, the tire contact area expands significantly, leading to a more pronounced increase in wheel track length and a wheel profile that approaches a rectangular shape rather than an elliptical one, approaching the rectangular assumption. Therefore, the wheel track size is set at 200 × 200 mm with a wheelbase of 1300 mm.
4.3. Validation of the Finite Element Simulation Model
Before analyzing prefabricated road structures, it is necessary to compare the modeling of pavement panels with existing known data to verify the validity of their simulations.
The prefabricated pavement panels were simulated using the loading and restraint methods employed in the experiment, with both ends of the panels subjected to simply supported constraints and fixed loads applied to them. The load-bearing capacity test data of the pavement panels served as the comparative reference group.
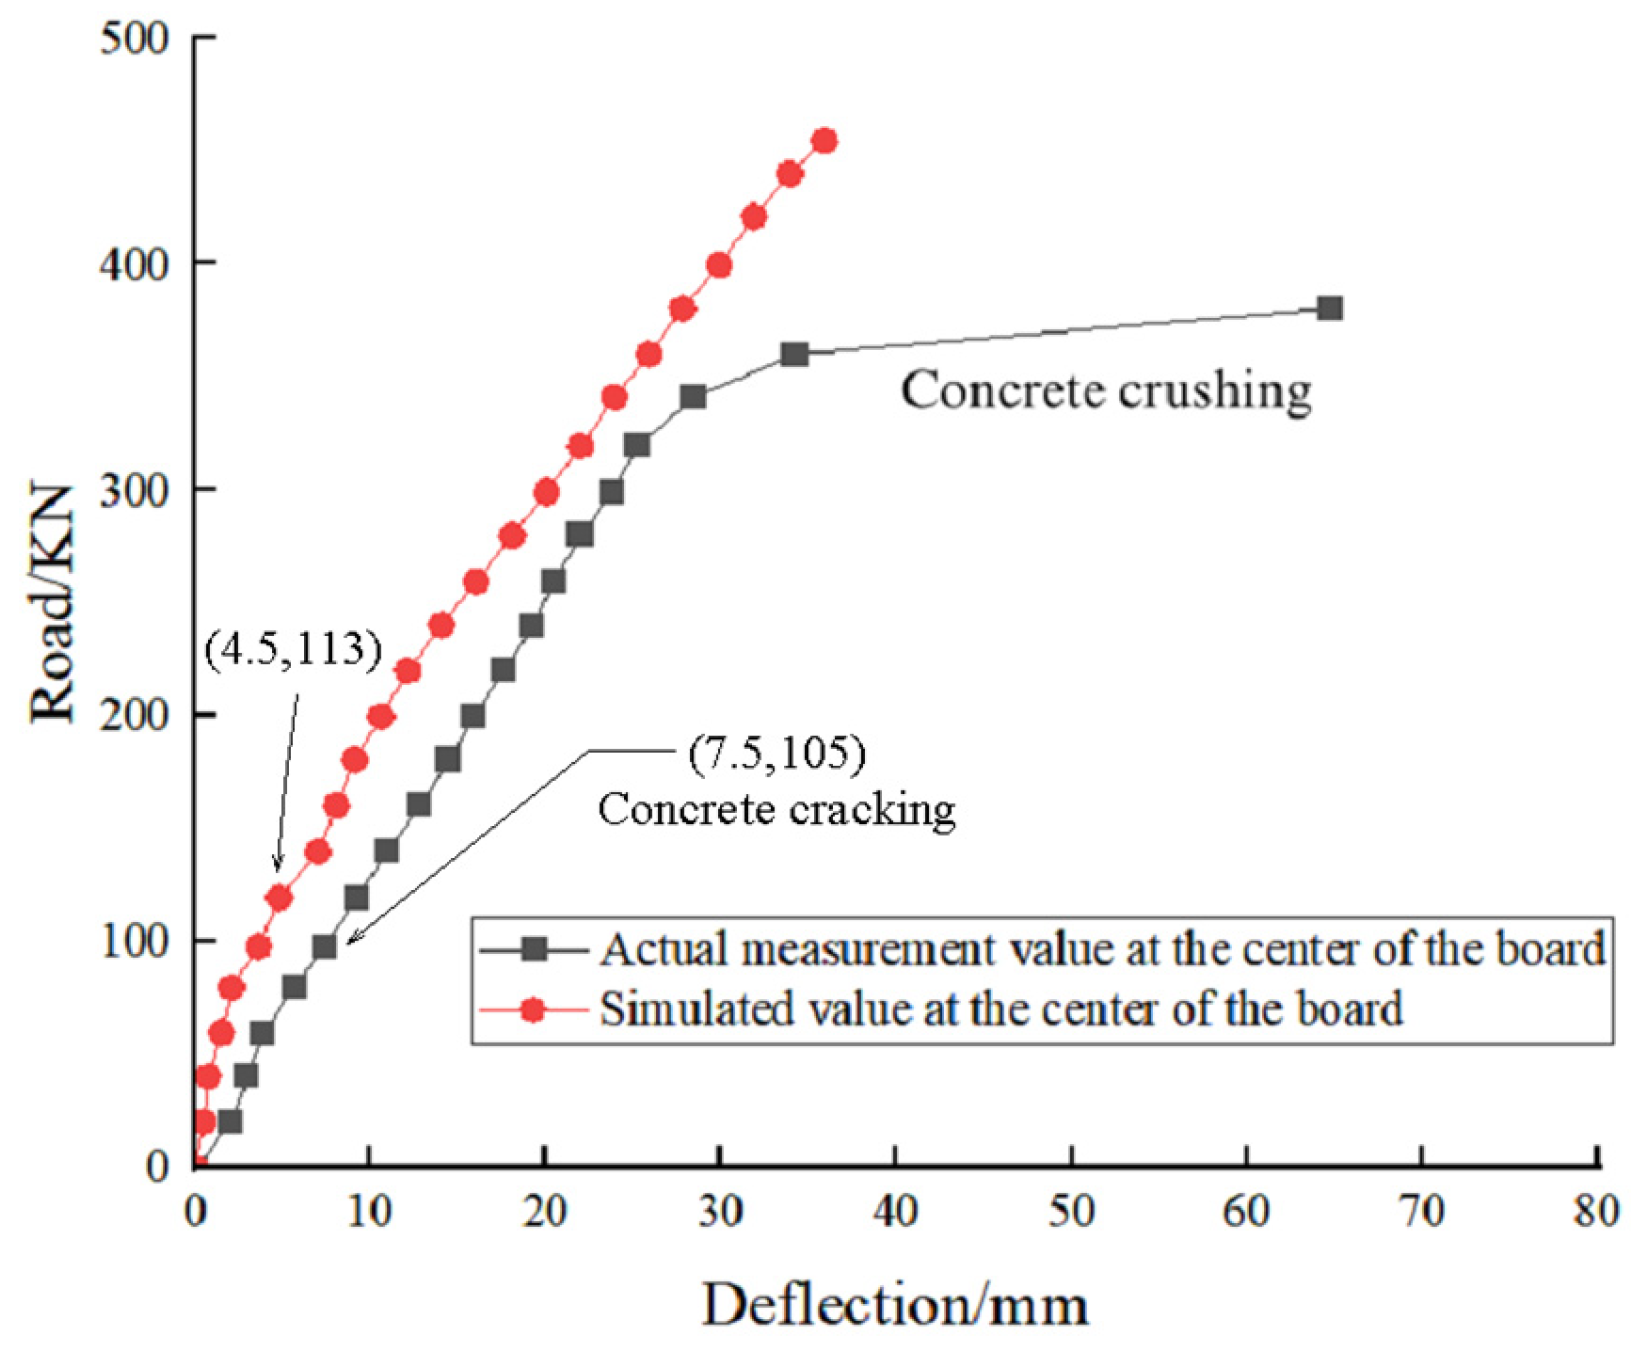
As shown in
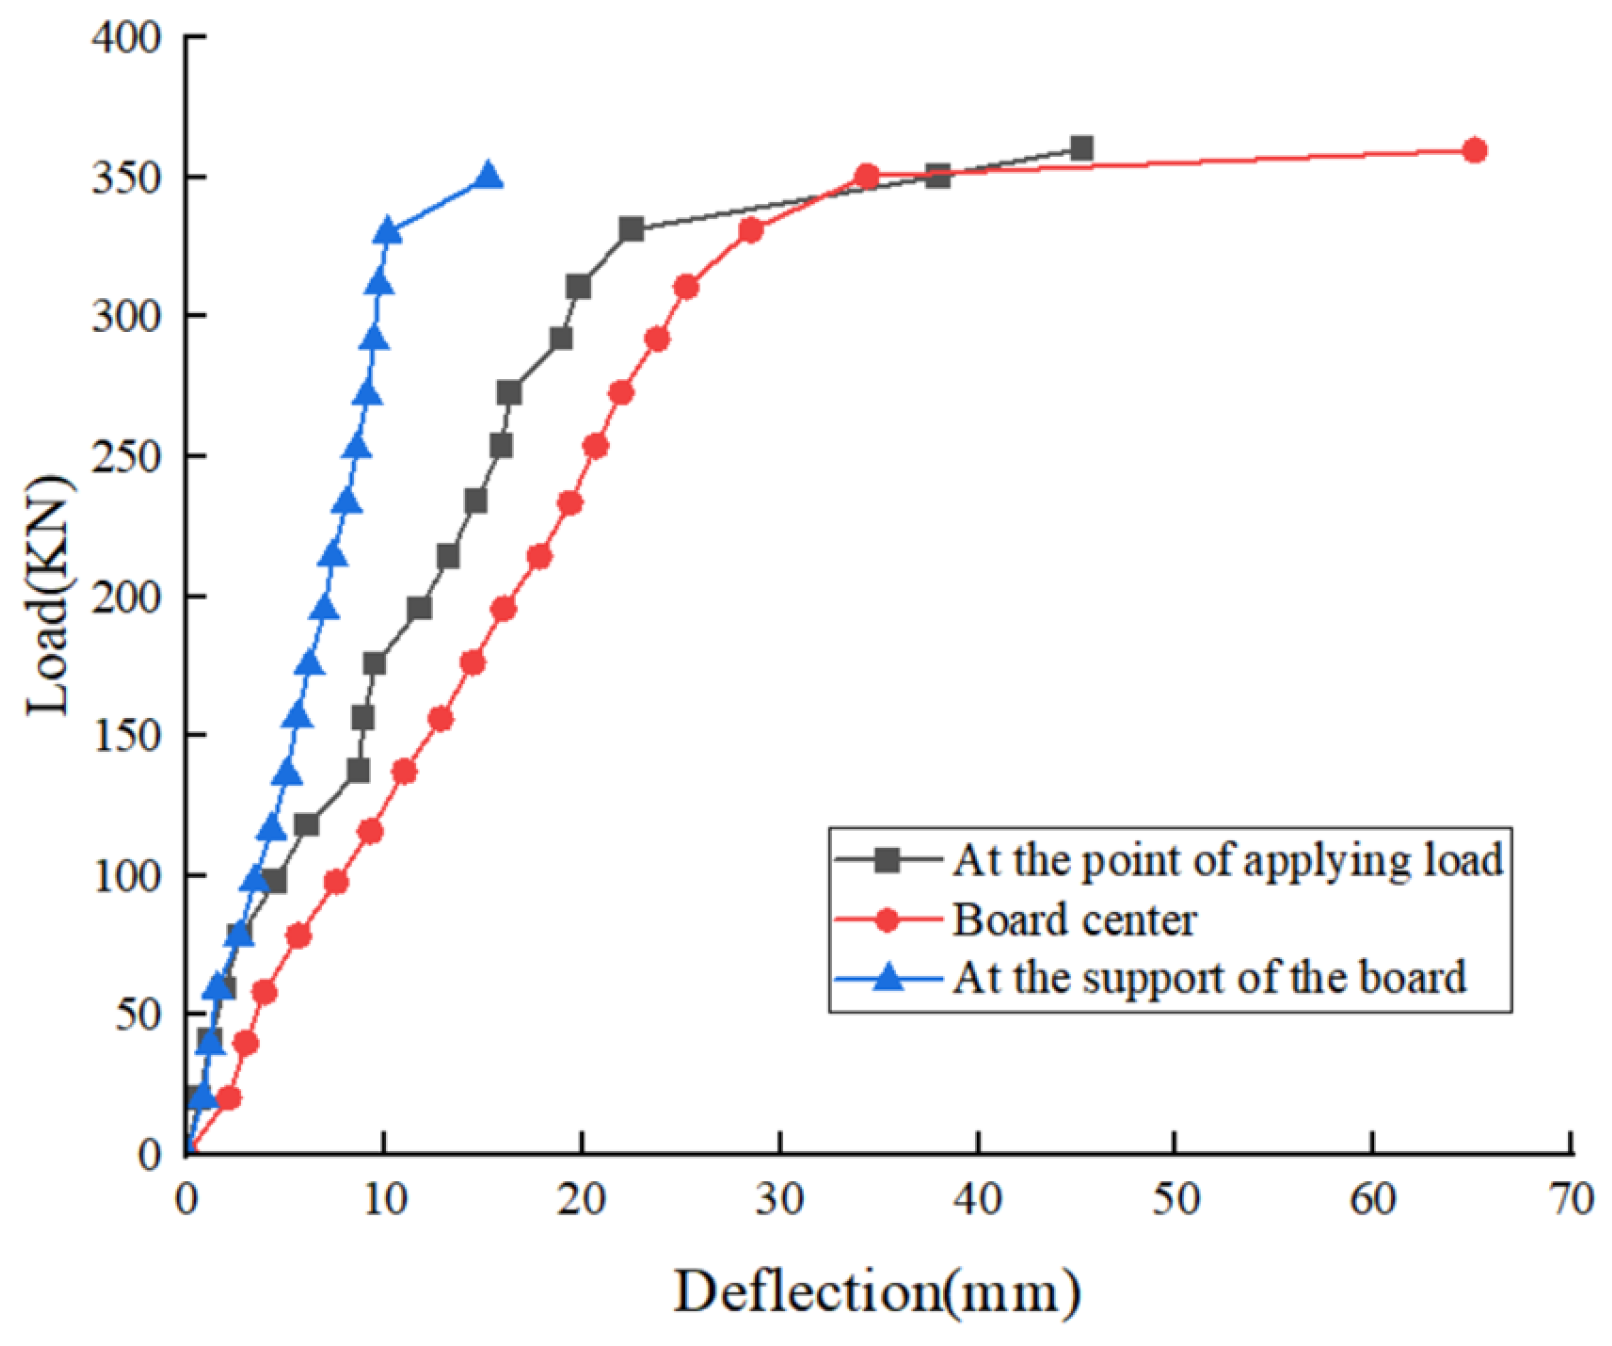
Figure 15, the deflection at the center of the simulation slab exhibits a linear relationship with the measured values, showing a largely similar upward trend. In later stages, when reaching the ultimate values of steel bar yielding and concrete crushing, the measured values exhibit a rapid increase, whereas the simulation values continue to rise linearly; ultimately, the measured deflection reaches 65 mm, while the simulation value reaches 36 mm.
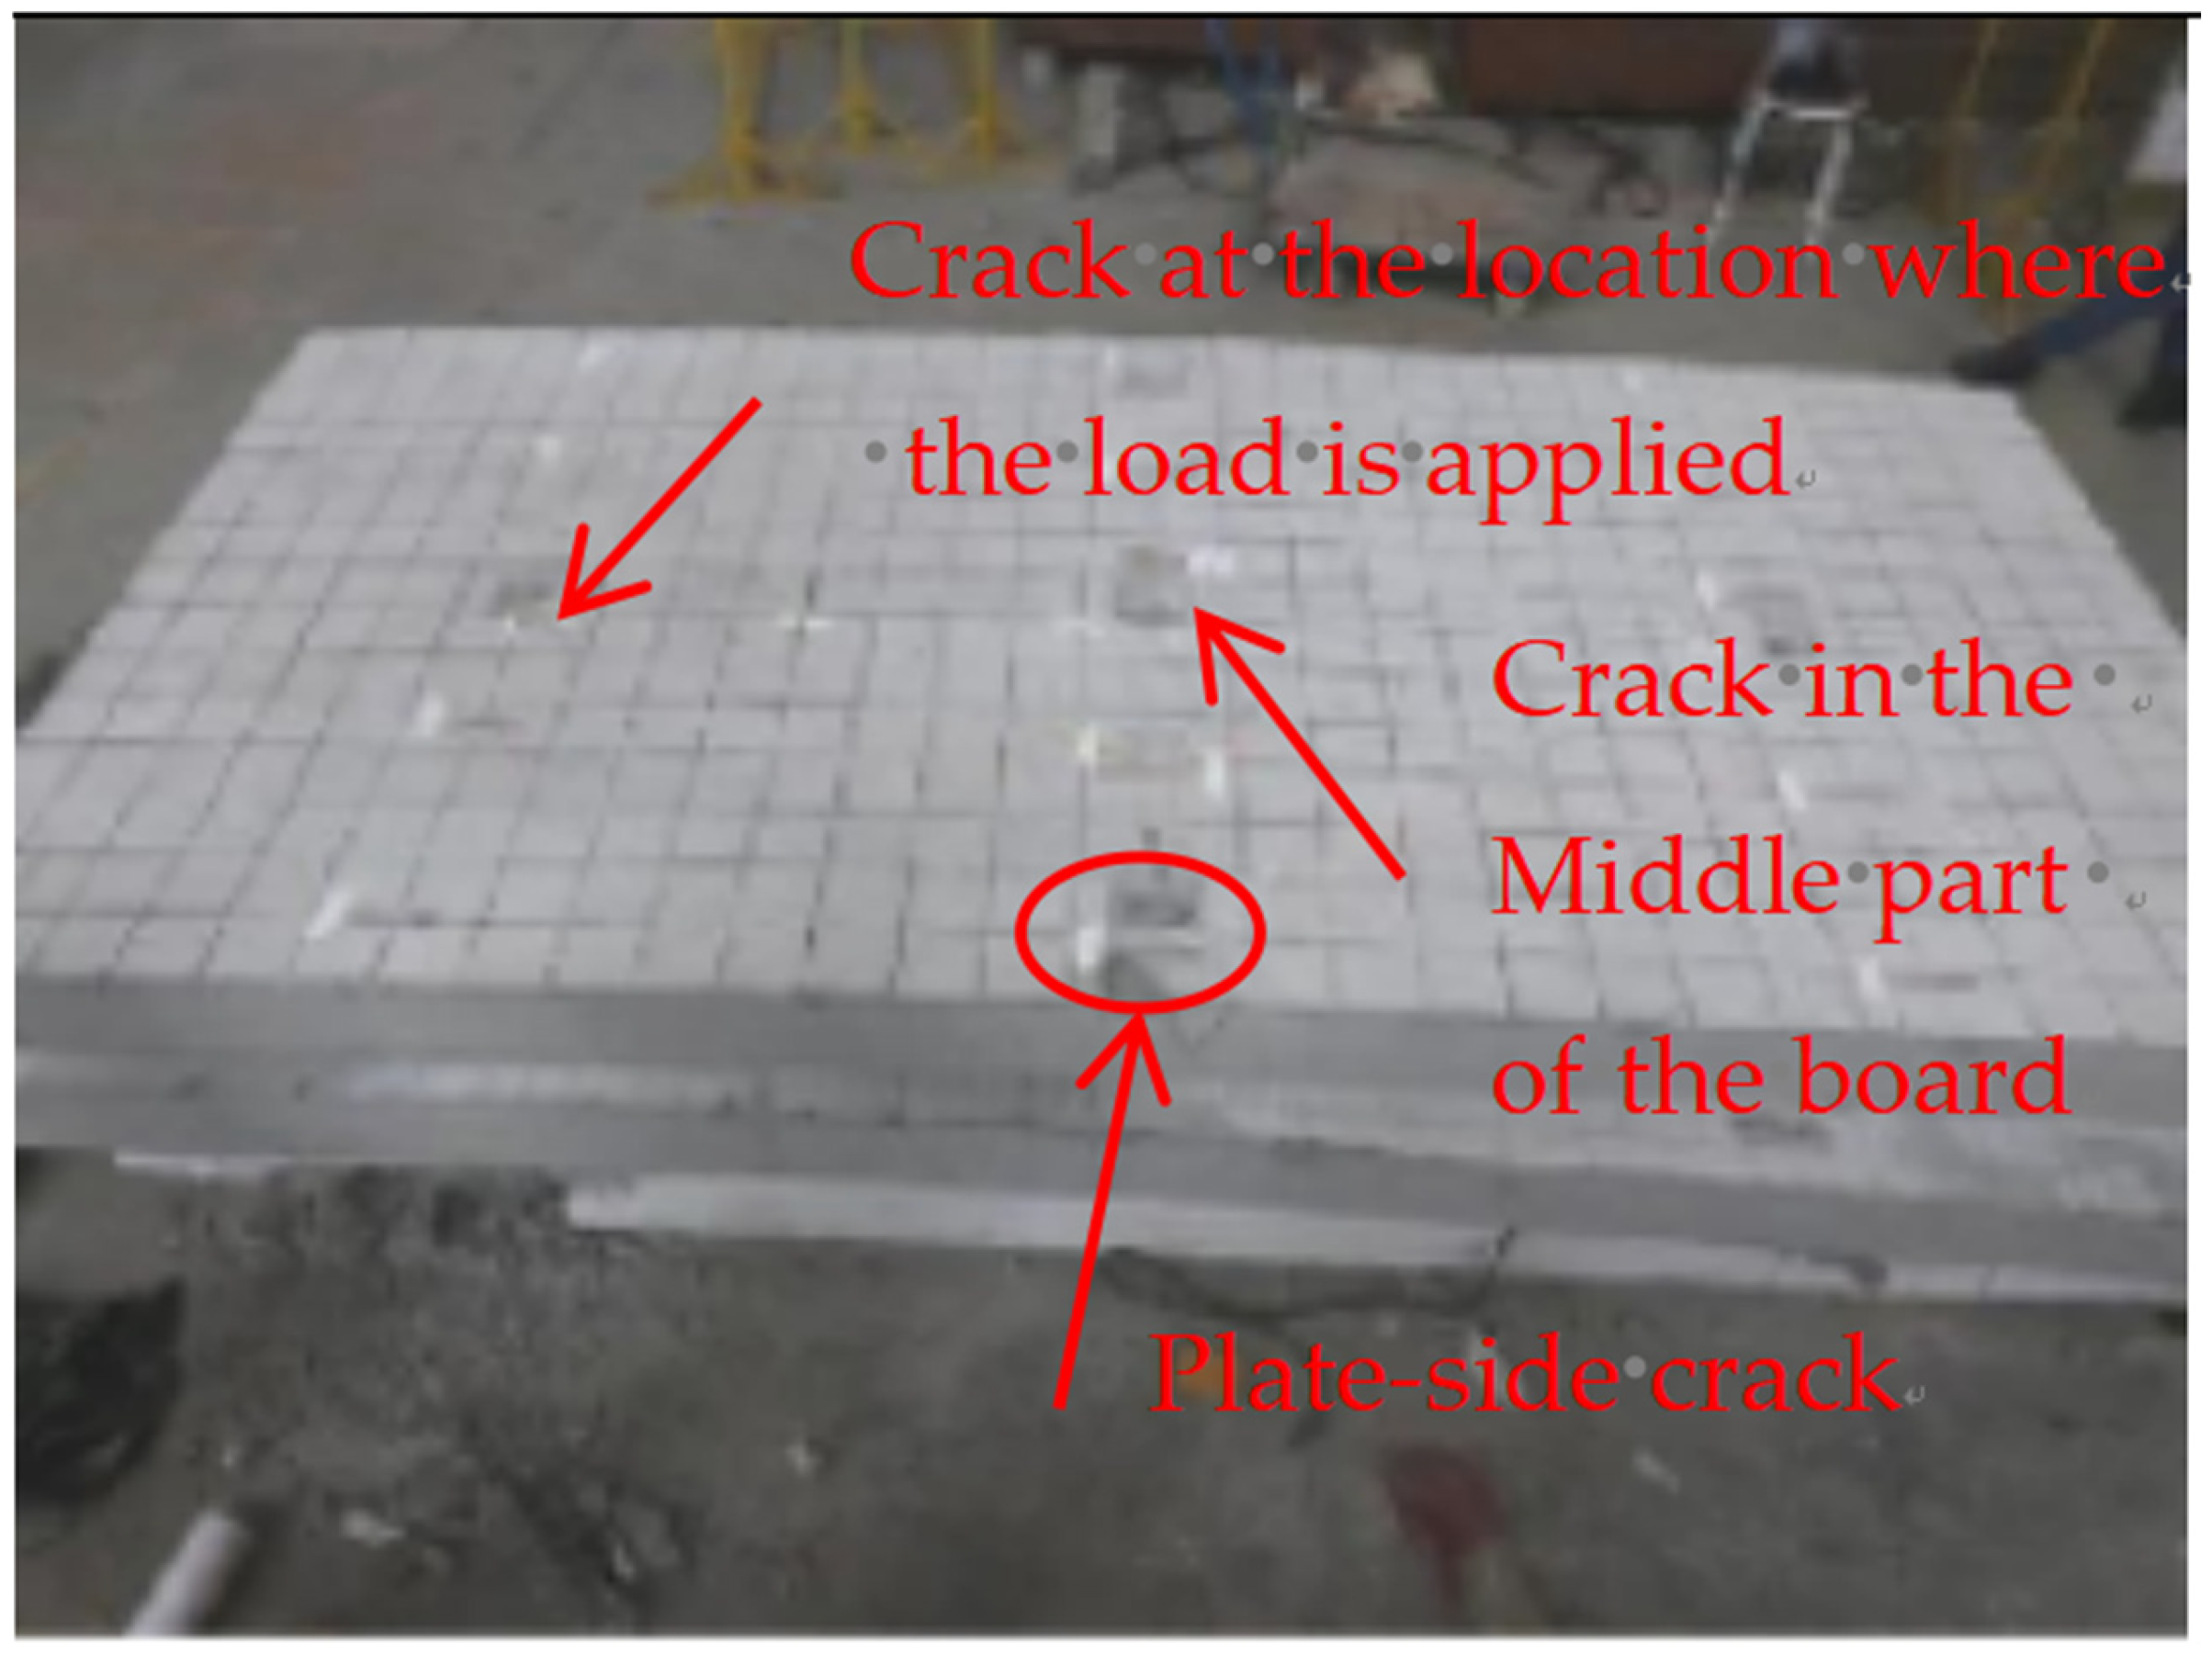
Analysis of the pavement slab reveals that under a load of F = 113 kN, fine cracks appear at the load-bearing area, as shown in
Figure 16. When the load reaches 430 kN, the prefabricated pavement slab fails, and the calculation is terminated; this is illustrated in
Figure 17. The crack distribution pattern matches the actual measured results, with cracks concentrated in the central region and gradually decreasing toward the sides. Furthermore, simulations conducted by replicating the static load test of the prefabricated pavement slab show that the simulated values deviate from the actual measurements by no more than 17%, indicating relatively accurate simulation results.
It should be noted, however, that the FE model tends to underestimate the deflection in the post-cracking stage (
Figure 15). This deviation arises primarily from the use of linear elastic material models for concrete after cracking, which do not capture the progressive stiffness degradation and nonlinear behavior near failure. Despite this limitation, the model predicts the cracking load and ultimate capacity with acceptable accuracy (deviations < 17%), making it suitable for preliminary design and parametric studies. As shown in
Table 4.
4.4. Static Load Analysis of Prefabricated Road Structures
4.4.1. Strain Response Analysis
Structural fatigue crack resistance design must account for bending-tensile stresses at the layer bottom; therefore, strain response analysis should be performed on prefabricated slabs.
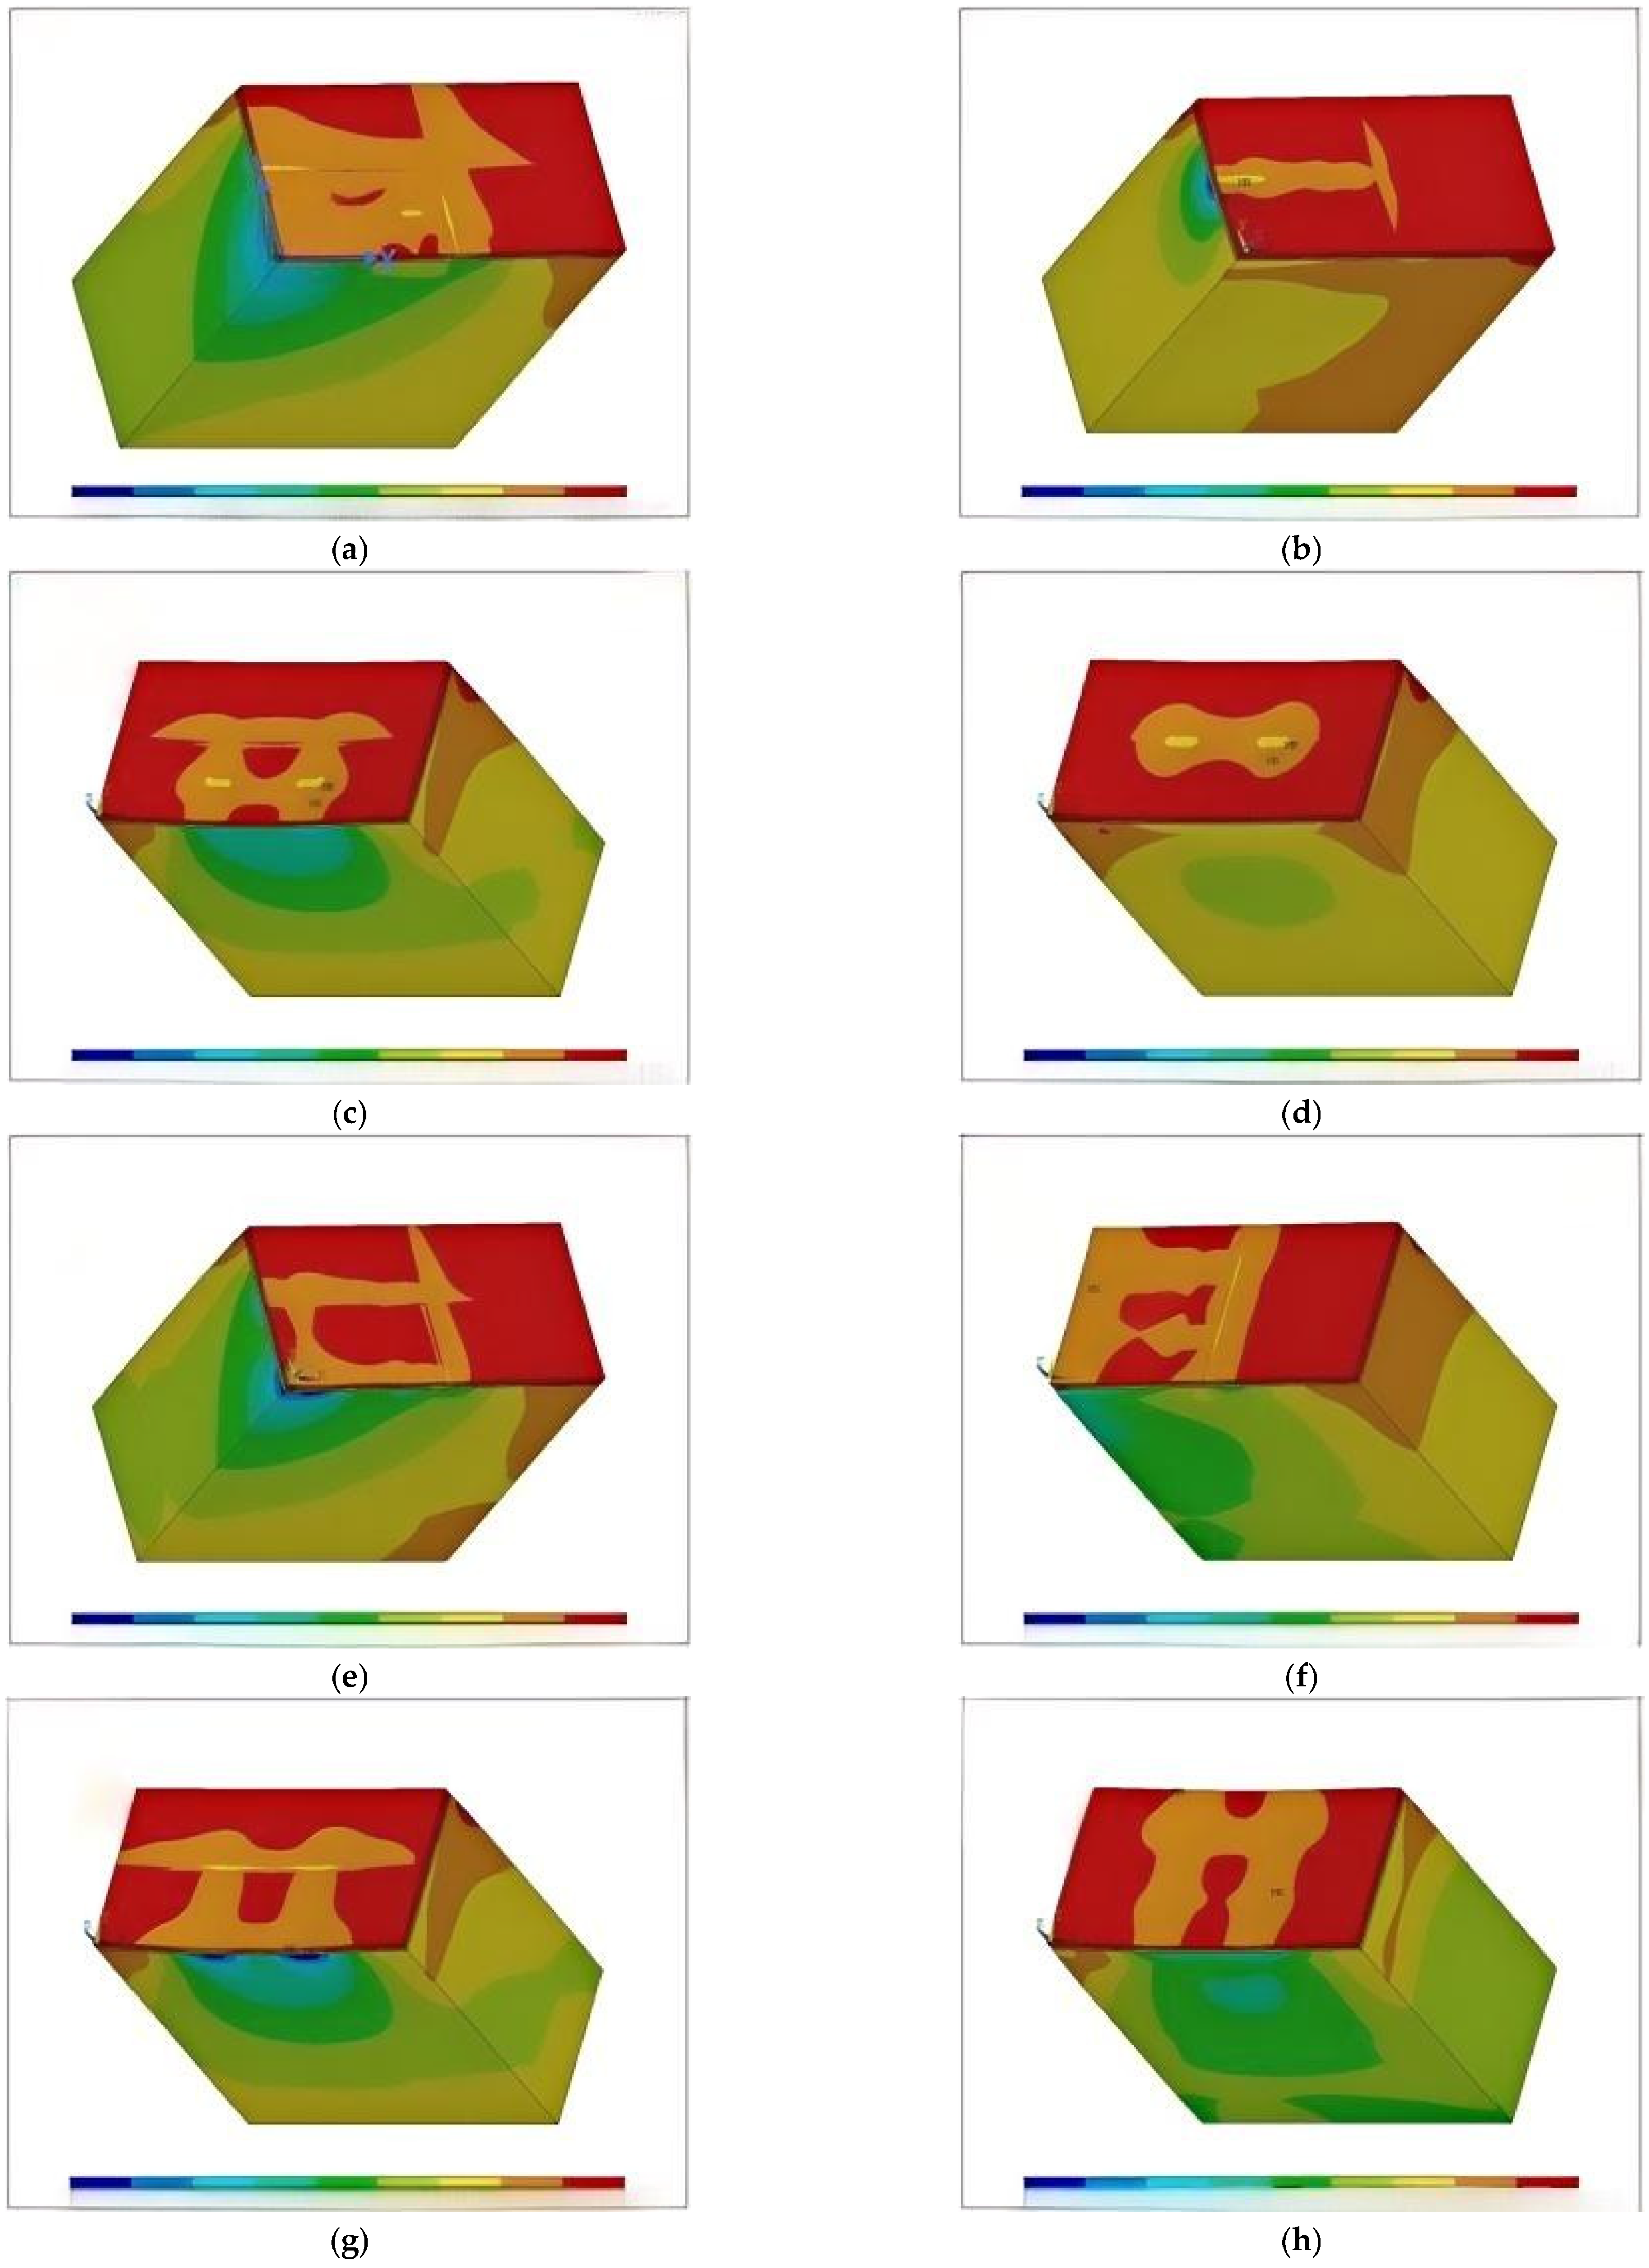
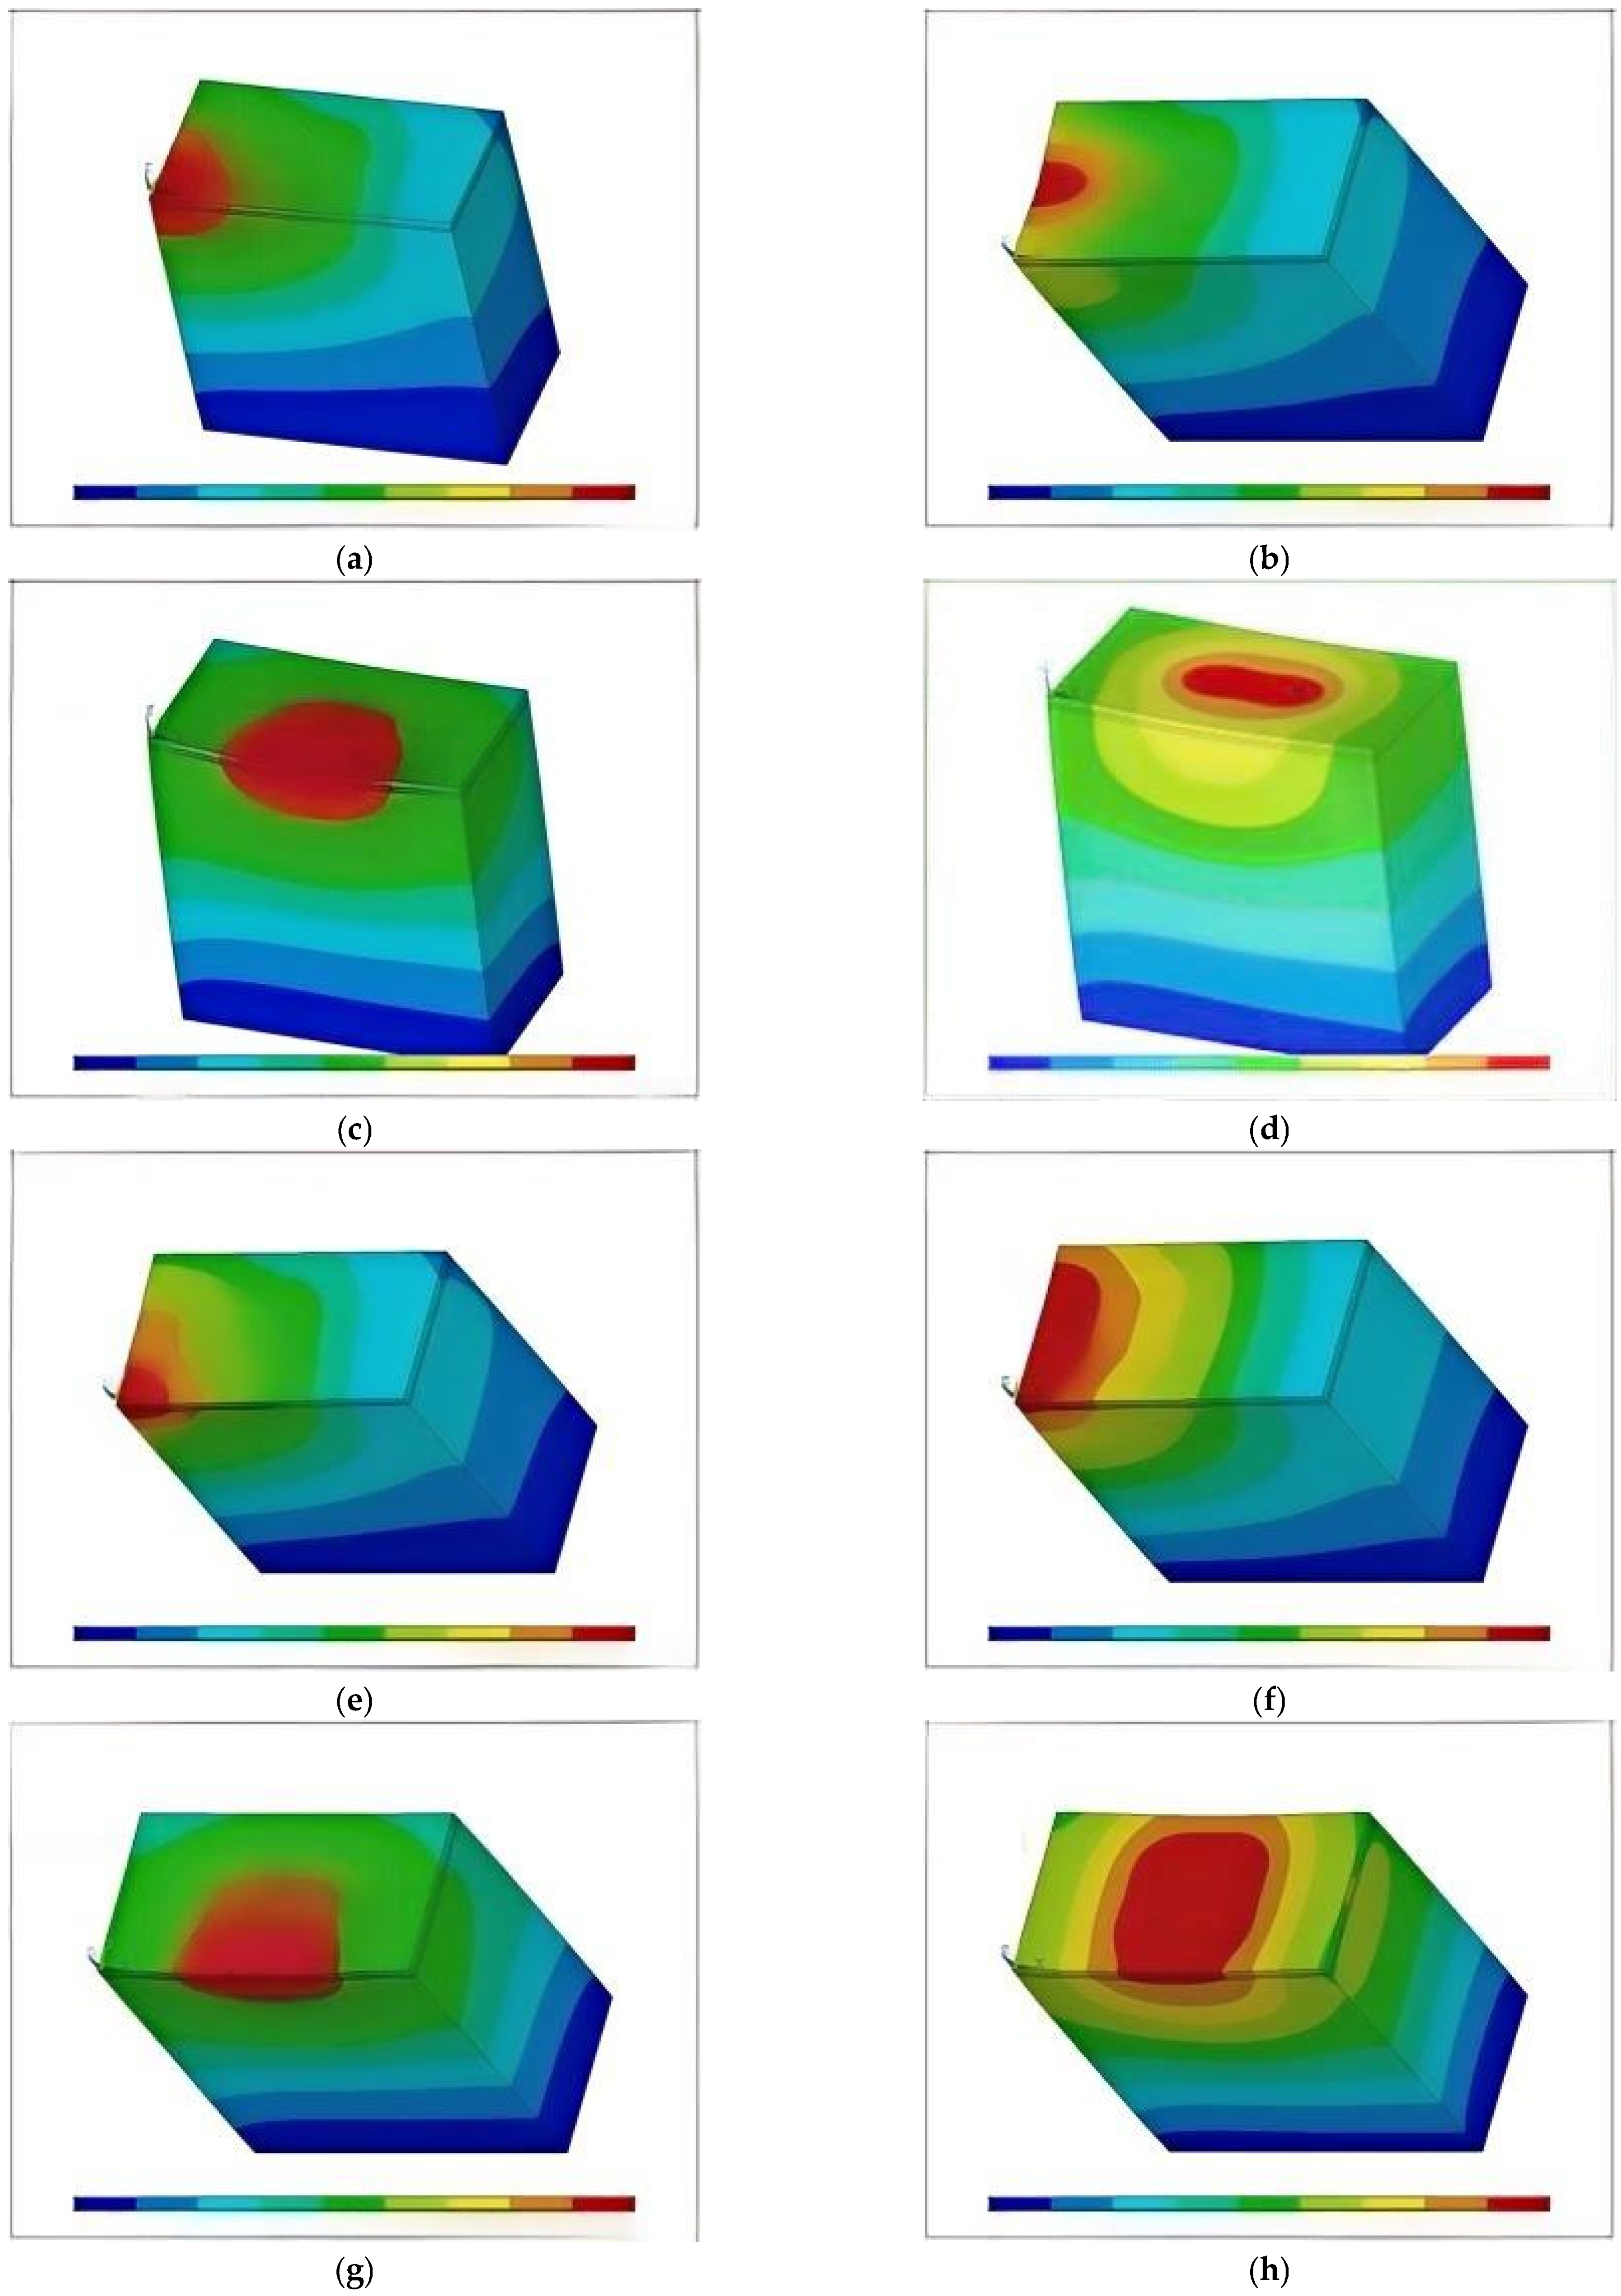
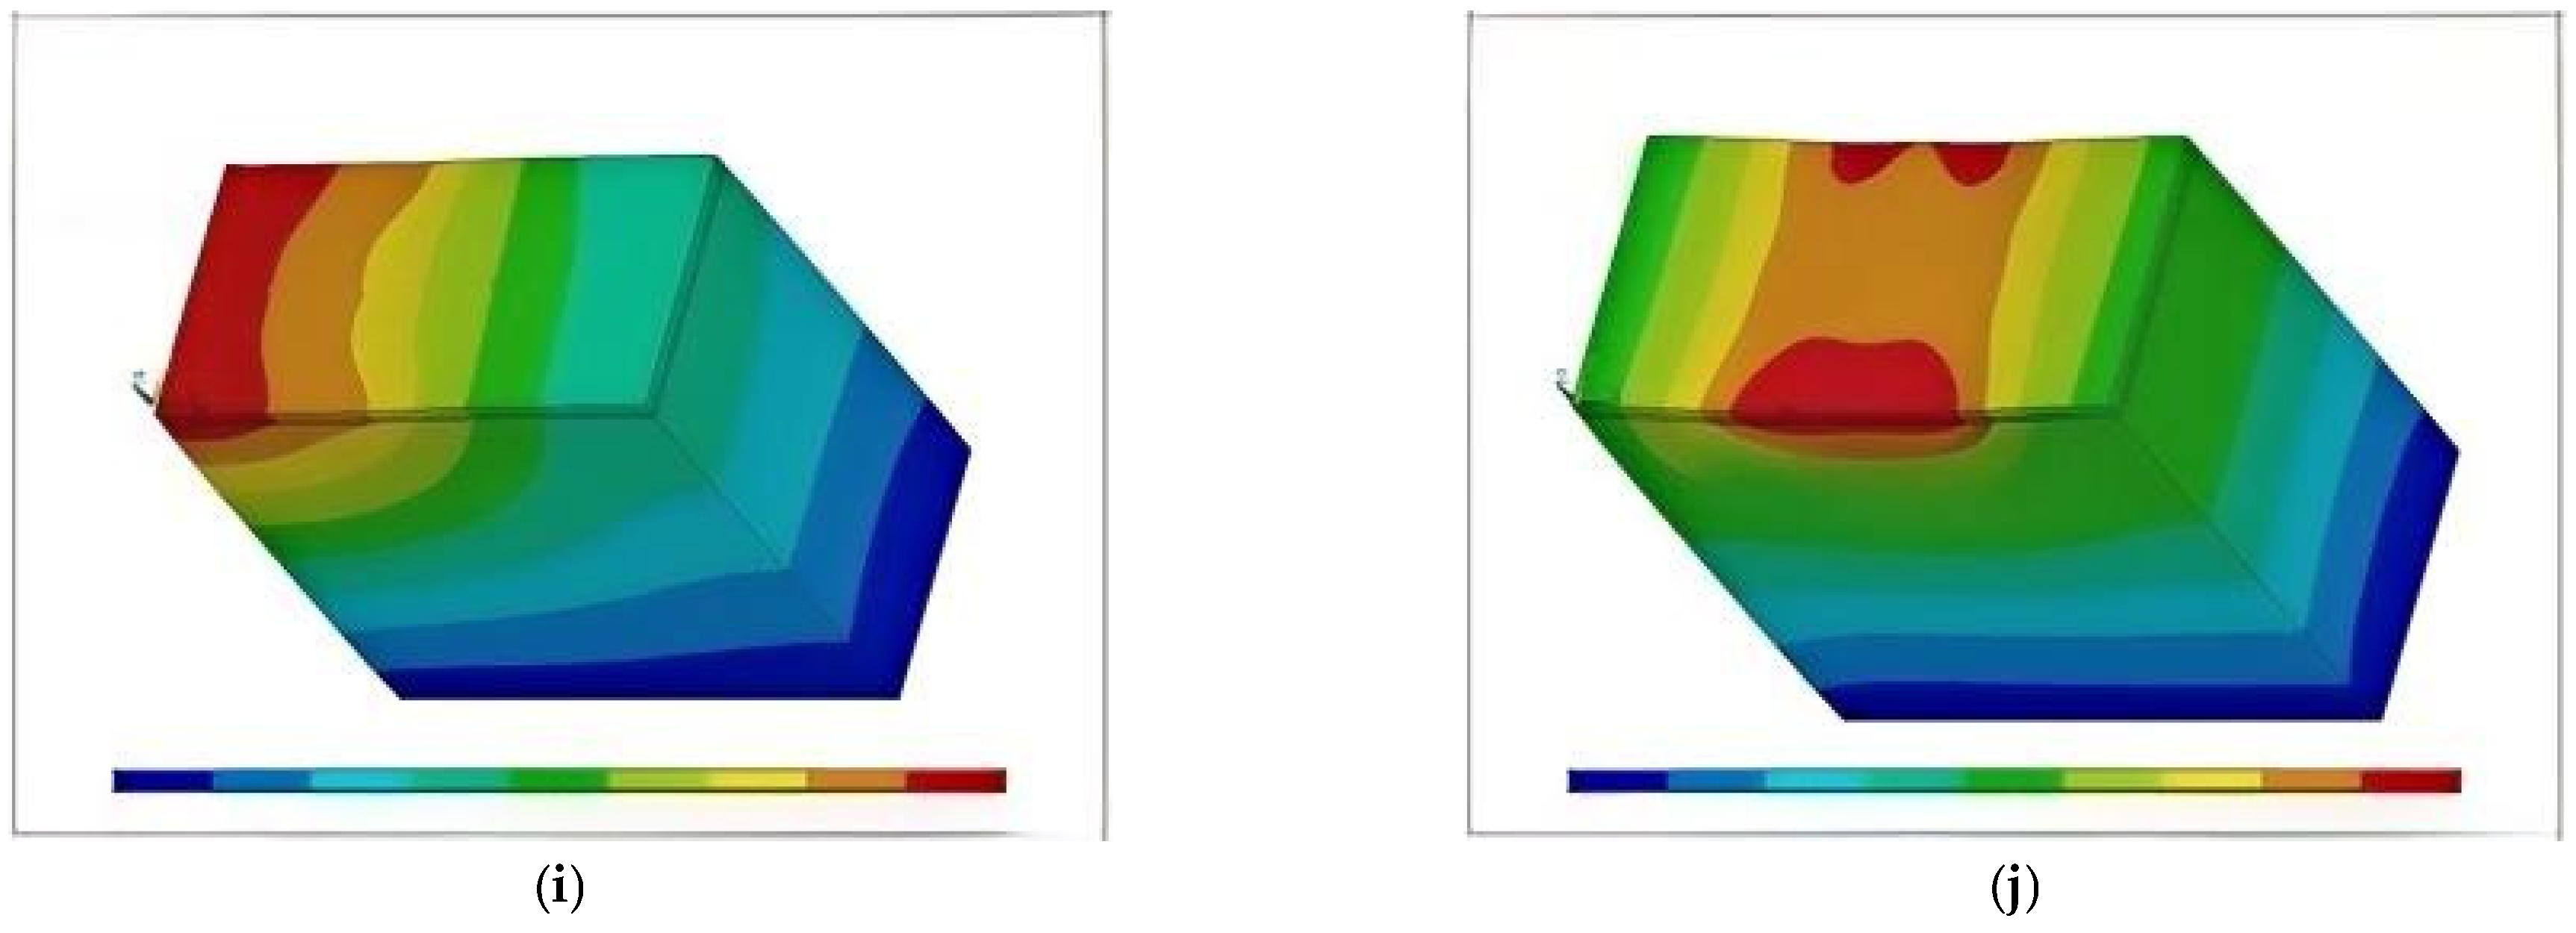
As shown in
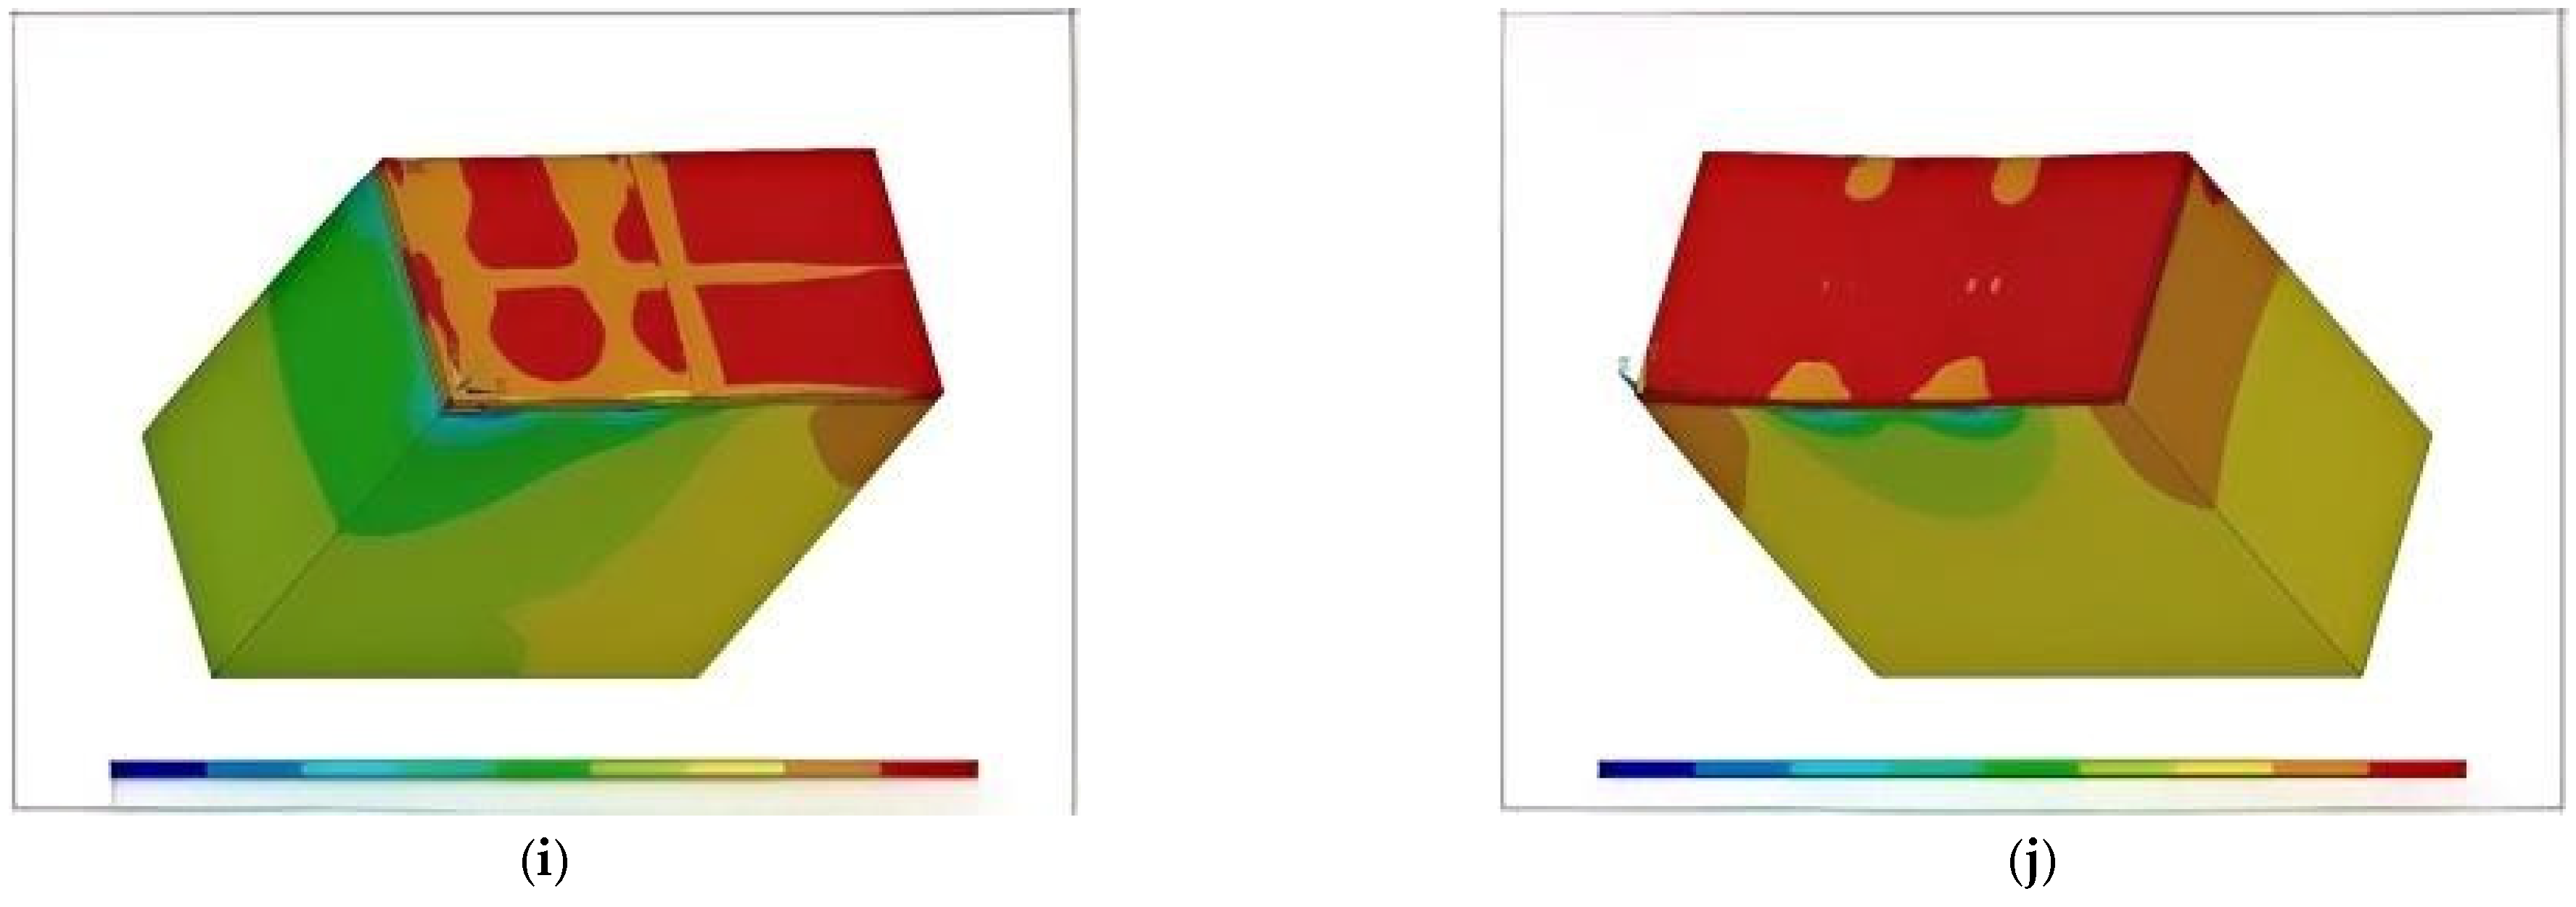
Figure 18, the prefabricated pavement slab, acting as a rigid surface layer, induces strain in the subgrade when transmitting loads downward. Since no additional subgrade layer is considered during road construction, the leveling course experiences significant strain; followed by the adjacent subgrade layer, which exhibits relatively small strain due to the rigidity of the prefabricated pavement slab. As the number of load-bearing axes increases and more loads are transferred to the subgrade, the strain decreases progressively with increasing depth, although the area subjected to strain expands.
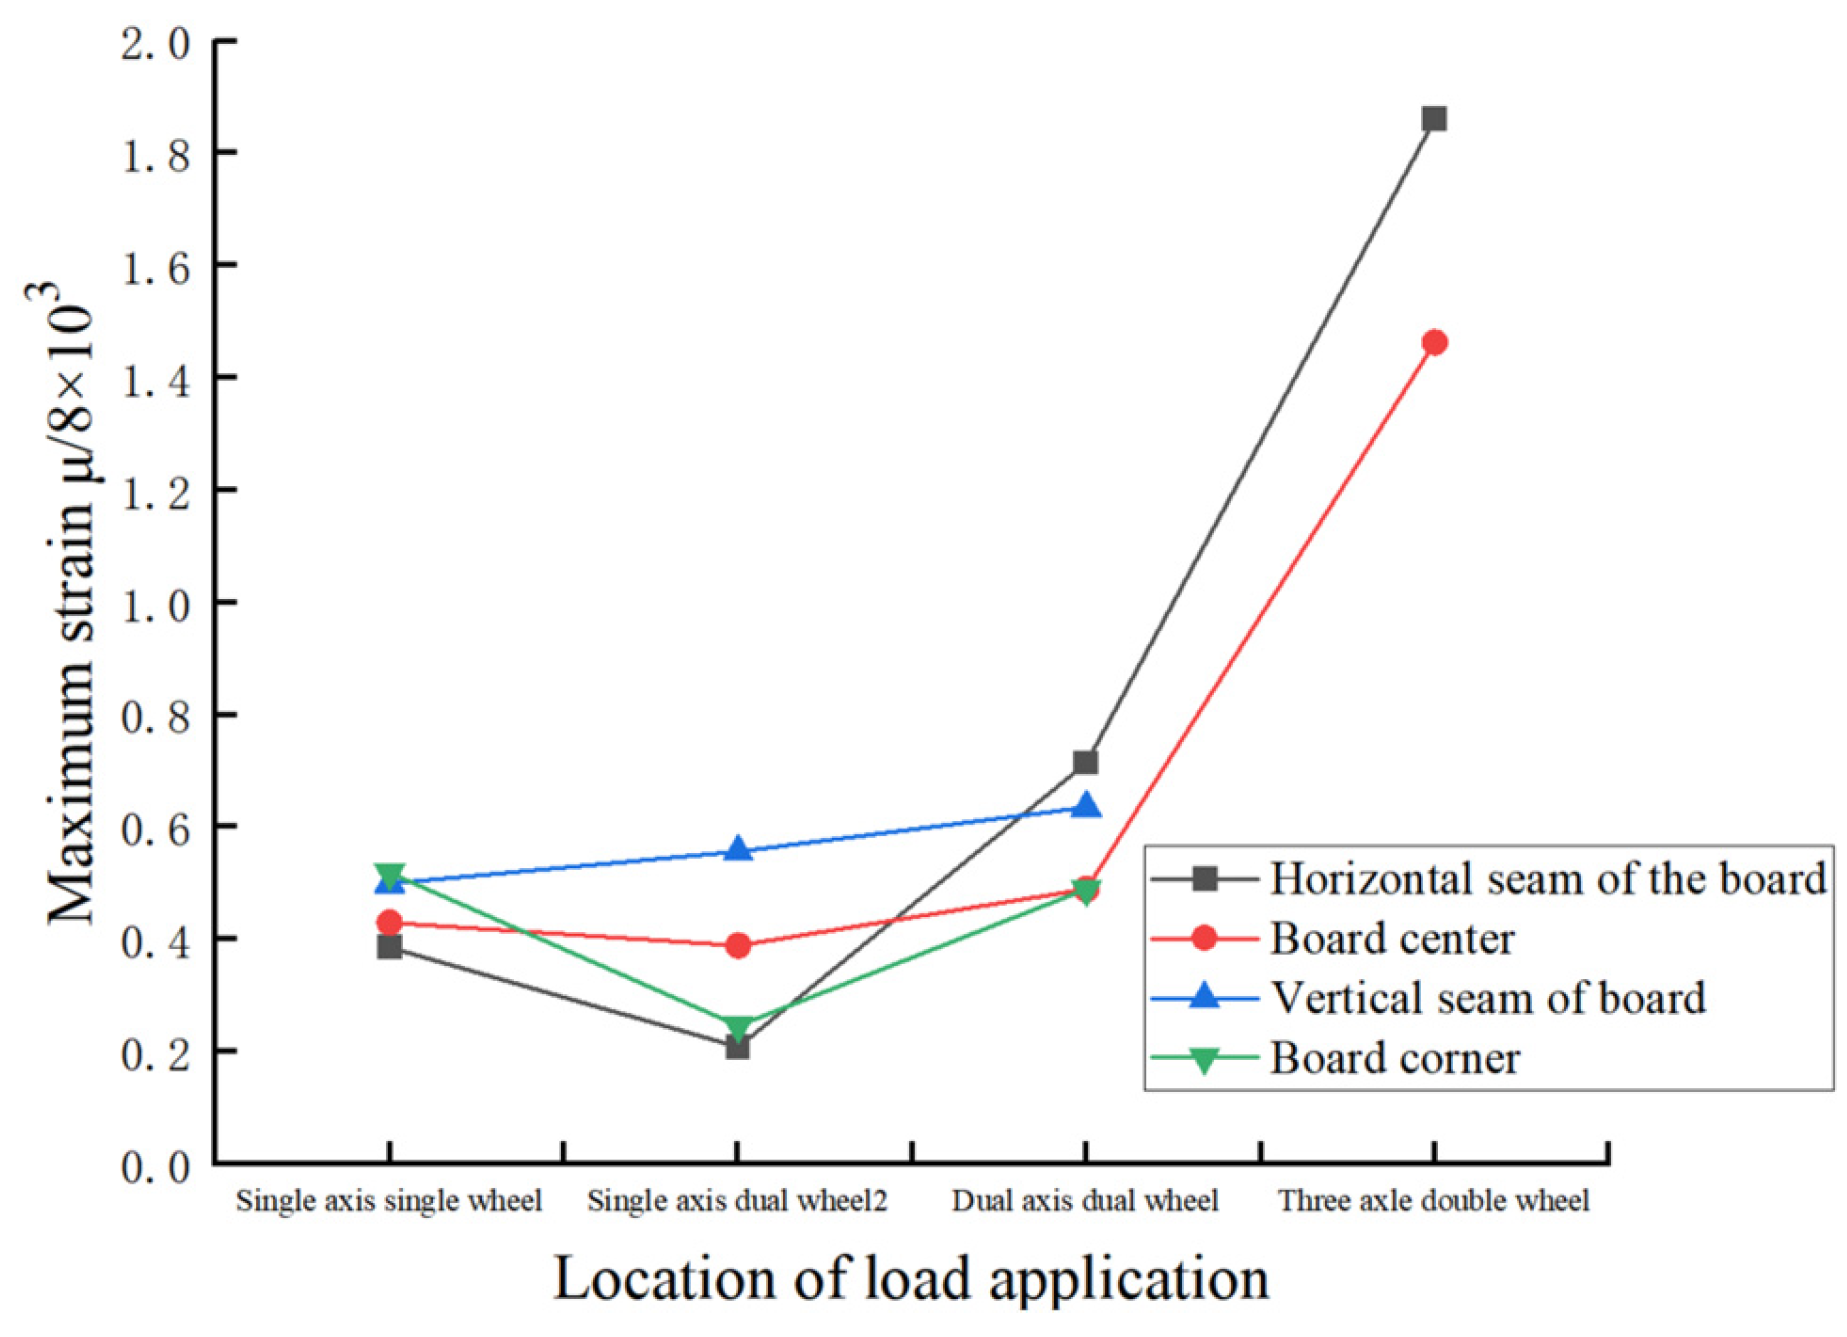
As shown in
Figure 19, the maximum strain varies depending on the vehicle’s axle configuration and load position.
4.4.2. Response Analysis of Vertical Displacement (Road Deflection)
This paper not only investigates the pavement response under dynamic and static loads but also conducts a comparative simulation of deflection values.
As shown in
Figure 20, the vertical deflection value decreases with increasing road depth, reaching its maximum at the vehicle load point on the pavement layer. The maximum strain gauge measurements of prefabricated pavement structures under different working conditions are shown in
Table 5.
As shown in
Table 6, the maximum deflection values at the bottom of the slab under different load positions show little variation. However, when a triaxial dual-wheel load is applied at the center of the precast pavement, the lateral deflection reaches 3.79 × 10
−2 mm, whereas when the load is applied at the slab joint, the maximum deflection reaches 8.64 × 10
−2 mm, indicating significant settlement at this location.
4.5. Dynamic Load Analysis of Prefabricated Road Structures
Through static analysis, loads were applied at various locations, identifying the most unfavorable load position along the vertical joints of the pavement slab. Based on these findings, dynamic loading simulations were conducted using a single-axis dual-wheel system with a travel speed of 40 km/h (the maximum speed limit for well sites) and a single-axis load of 100 kN applied to the prefabricated pavement slab to investigate the effects of dynamic loads on the pavement structure and the mechanical responses of each structural layer.
4.5.1. Response Analysis of Dynamic Deflection Values for Prefabricated Road Structures
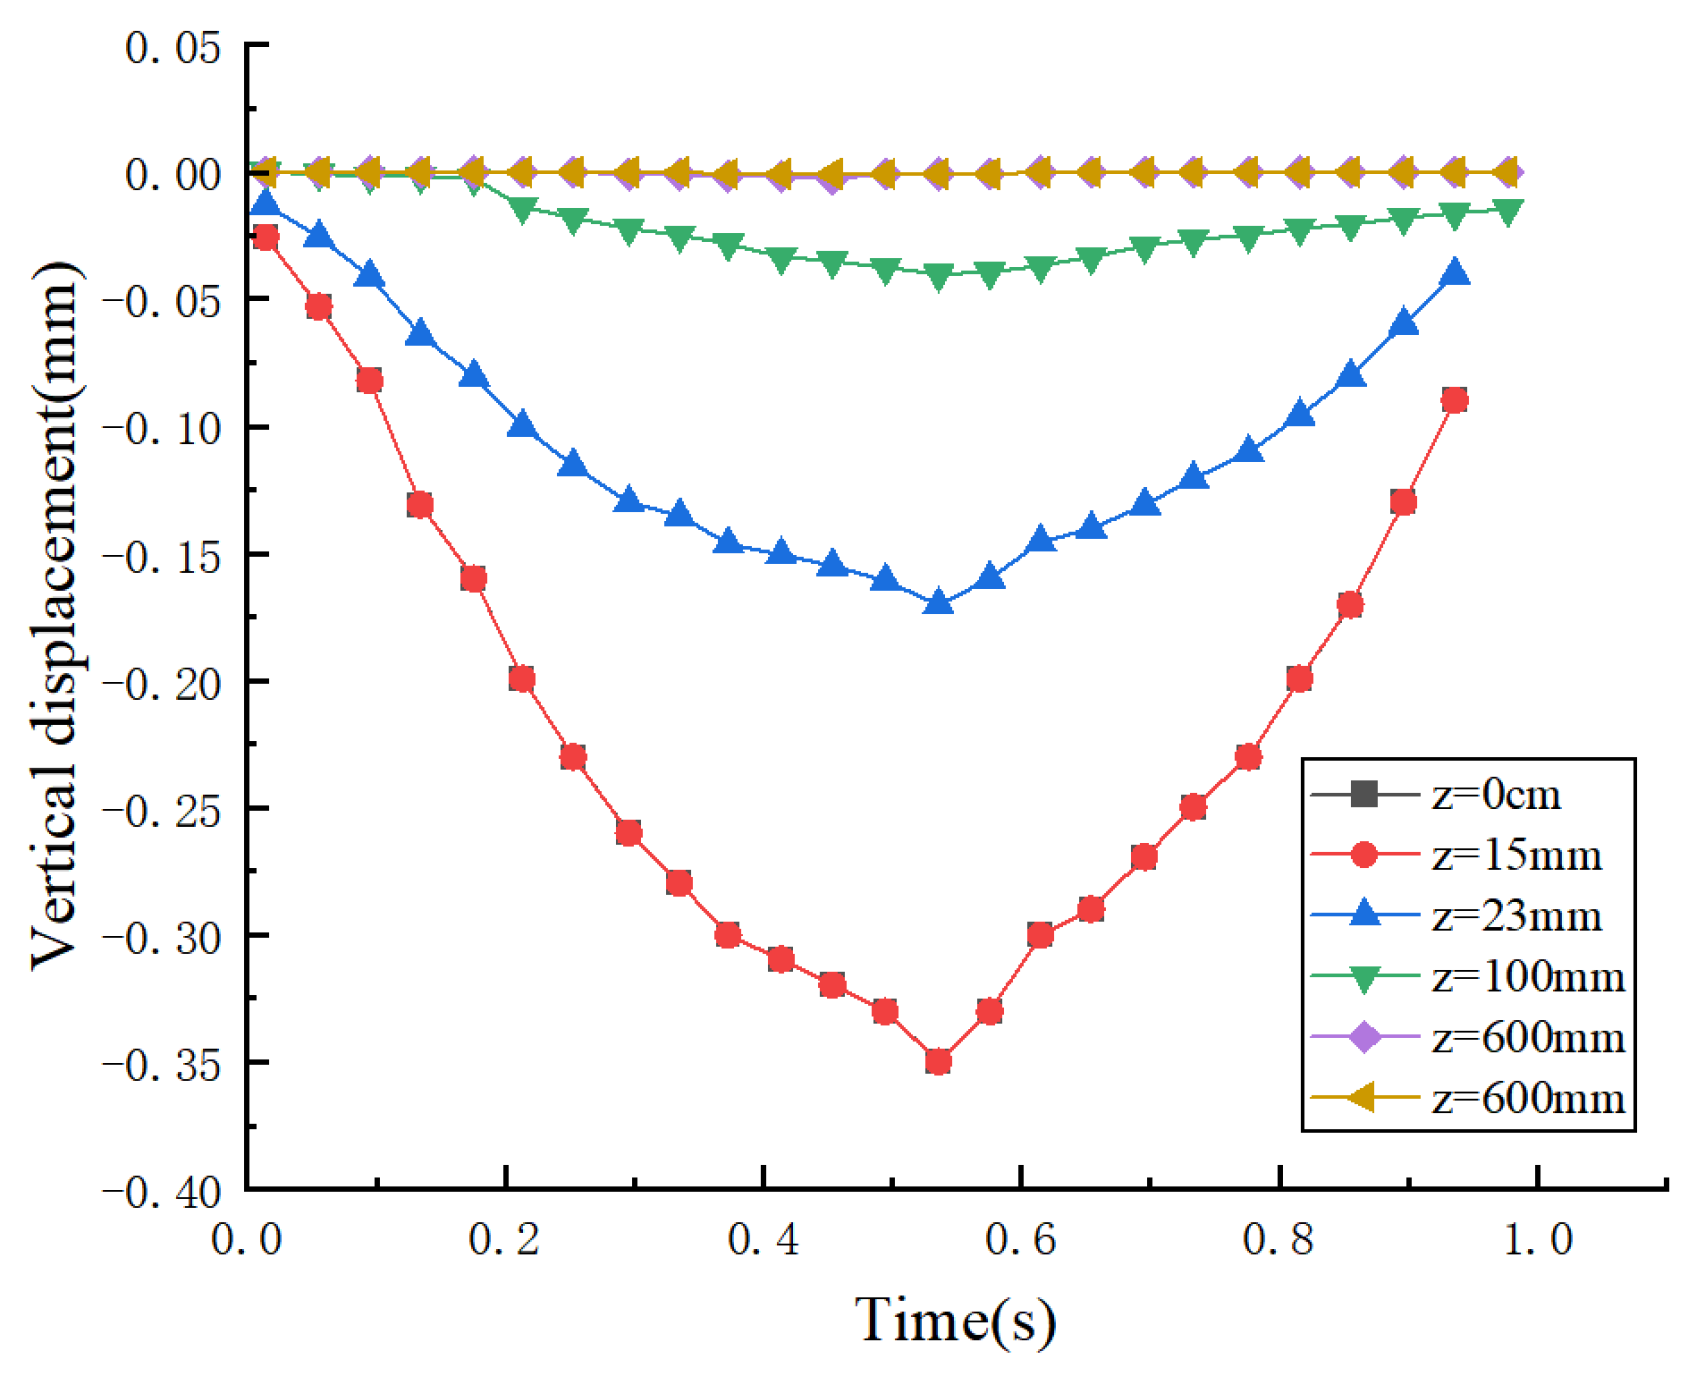
In the structural design of concrete pavements in China, vertical settlement (bending settlement) serves as a critical mechanical parameter that reflects pavement load-bearing capacity and service conditions from both structural integrity and macroscopic performance perspectives. As shown in
Figure 21, varying degrees of bending settlement are observed across all structural layers of prefabricated pavements, with the surface layer exhibiting the highest settlement, followed by the leveling course and subgrade. The maximum bending deflection for prefabricated pavement slabs reaches 0.335 mm, with consistent settlement values at both the top and bottom surfaces; the subgrade exhibits a maximum settlement of 0.156 mm at its top surface, while the surface layer’s settlement is approximately 54% higher than that of the subgrade.
It is evident that the prefabricated road slab, as a rigid surface layer, bears the majority of the loads; however, improving the compaction degree of the reinforced soil subgrade can more effectively reduce slab deflection.
4.5.2. Dynamic Stress Analysis of Prefabricated Road Structures
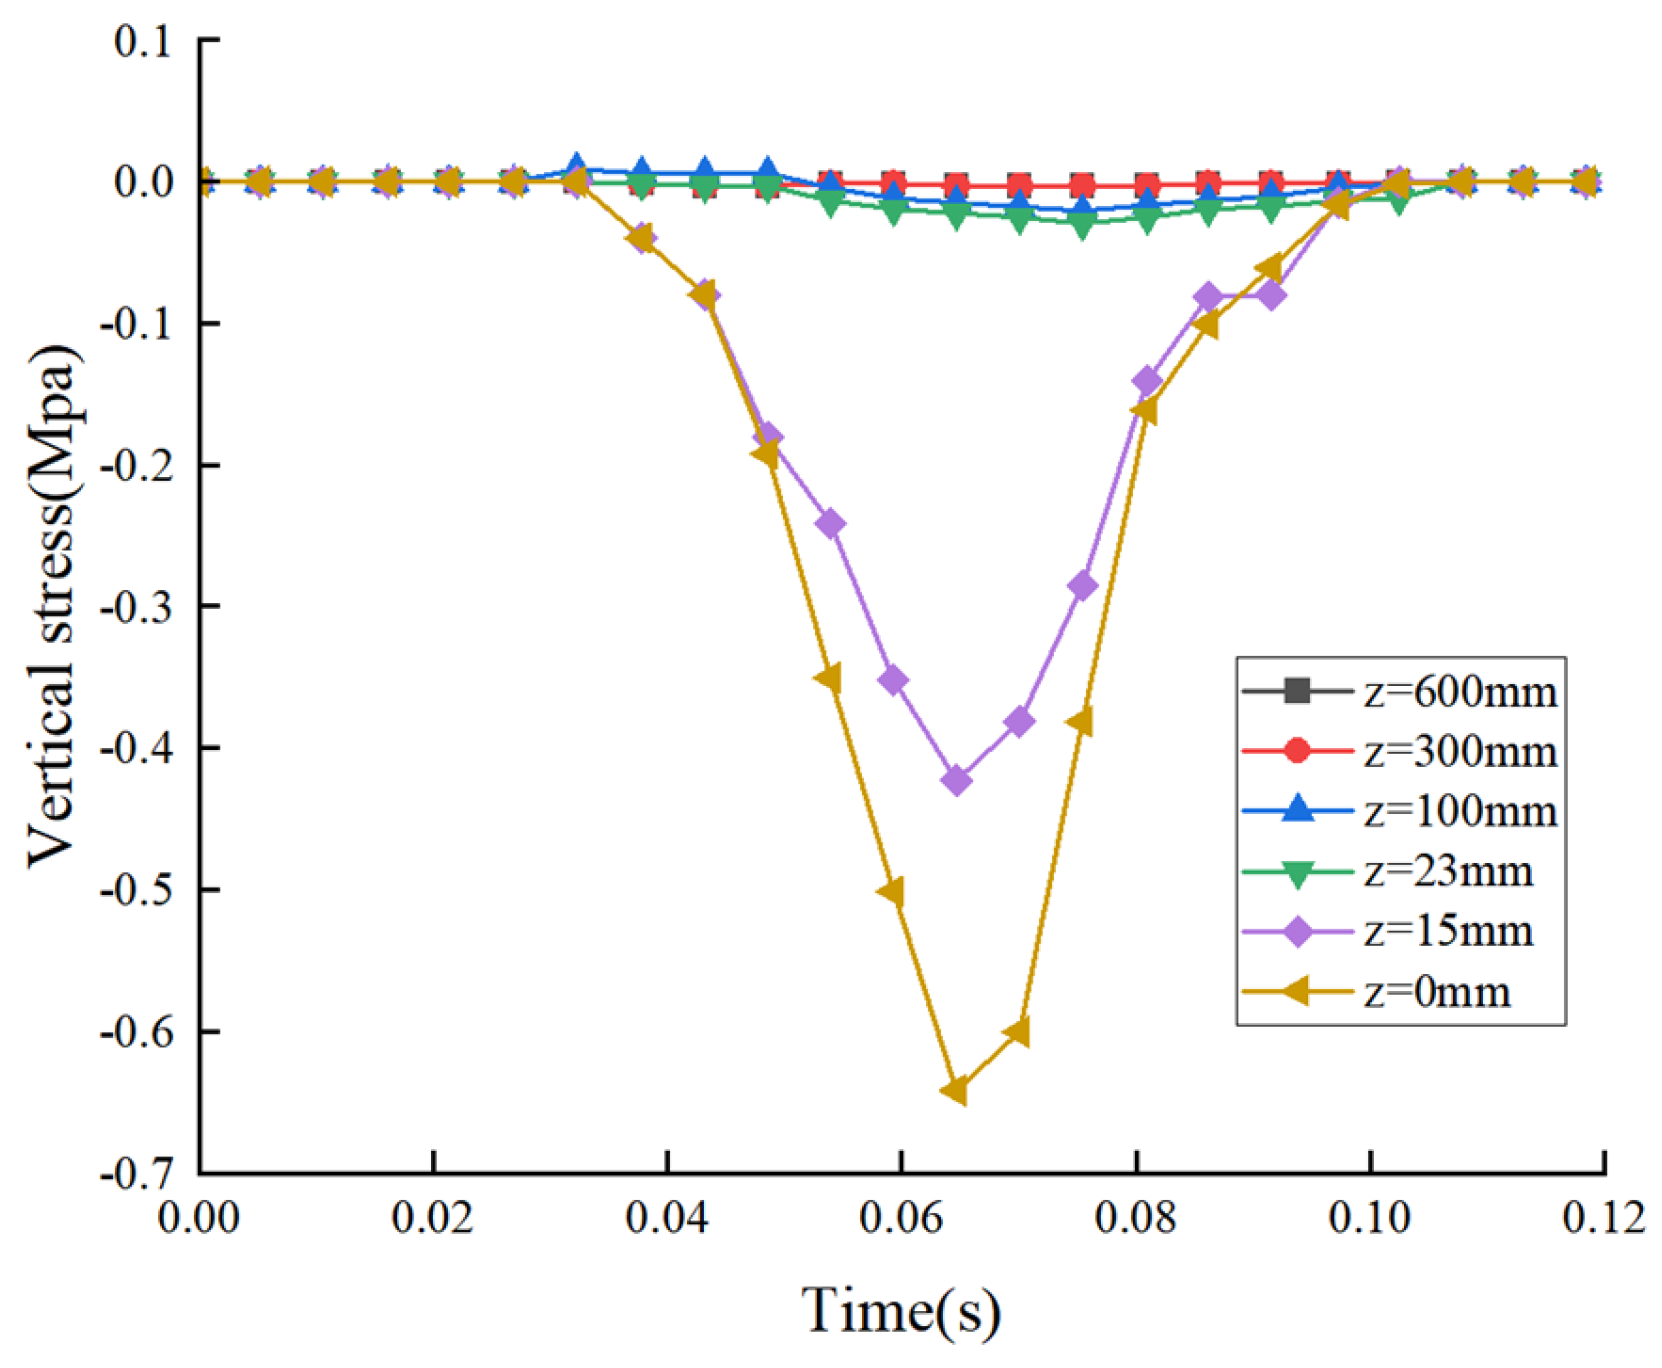
As shown in
Figure 22, when the tire travels over the prefabricated pavement slab at a speed of 40 km/h, the vertical stress decreases with increasing depth within the road structure layer, exhibiting a negative correlation. The prefabricated surface layer experiences the highest compressive stress at 0.65 MPa, followed by the top of the leveling layer at 0.428 MPa; the stress generated by the subgrade is almost negligible. The vertical stress in the prefabricated surface layer is approximately 35% that of the top of the leveling layer. This indicates that the stresses induced by the load are primarily borne by the reinforced concrete pavement surface layer; consequently, subgrade instability leads to more concentrated stress distribution on the pavement slab, ultimately resulting in its failure.
5. Conclusions
This study investigates prefabricated pavement panels used in pre-drilling engineering. Through theoretical analysis, structural design, laboratory testing, finite element simulation, and engineering application analysis, a comprehensive evaluation of their mechanical properties and practical feasibility was conducted, yielding the following conclusions:
(1) A prefabricated modular structural system for pre-drilling engineering is proposed, featuring a standardized design, factory production, rapid on-site assembly, and reusability, which effectively reduces concrete waste generation, lowers resource consumption, and decreases carbon emissions, thereby providing a new technical approach for green construction in pre-drilling projects.
(2) Through investigation of vehicle load spectra at shale gas well sites, the design axle load, overload axle load, and ultimate axle load conditions were determined; a stress model for prefabricated pavement panels was established; reinforcement design, local bearing capacity verification, and crack width analysis were completed; and the structural design and theoretical calculations for the prefabricated pavement panels were finalized.
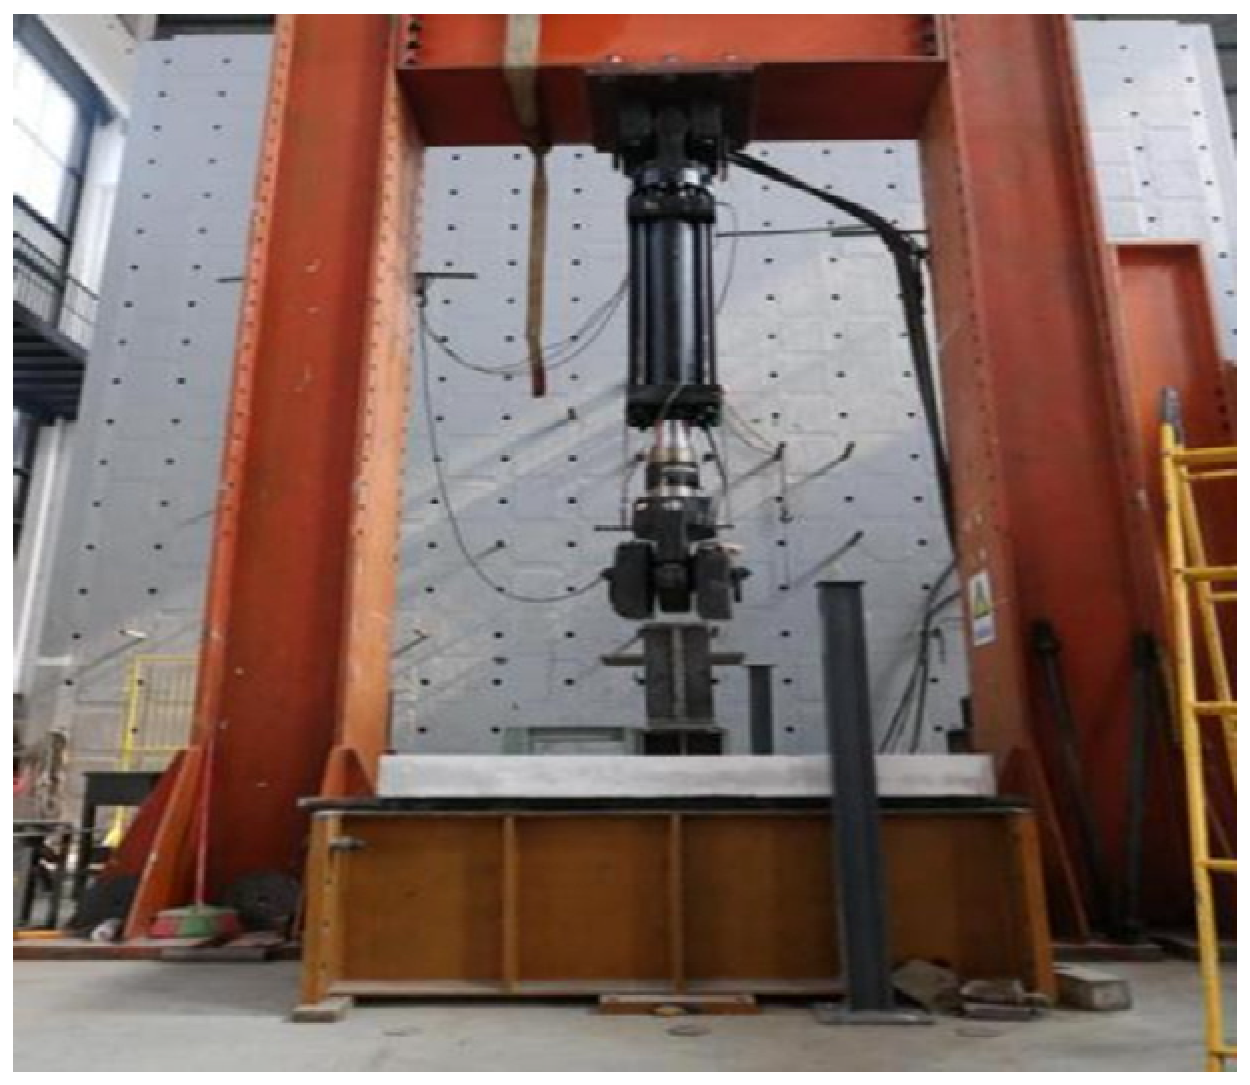
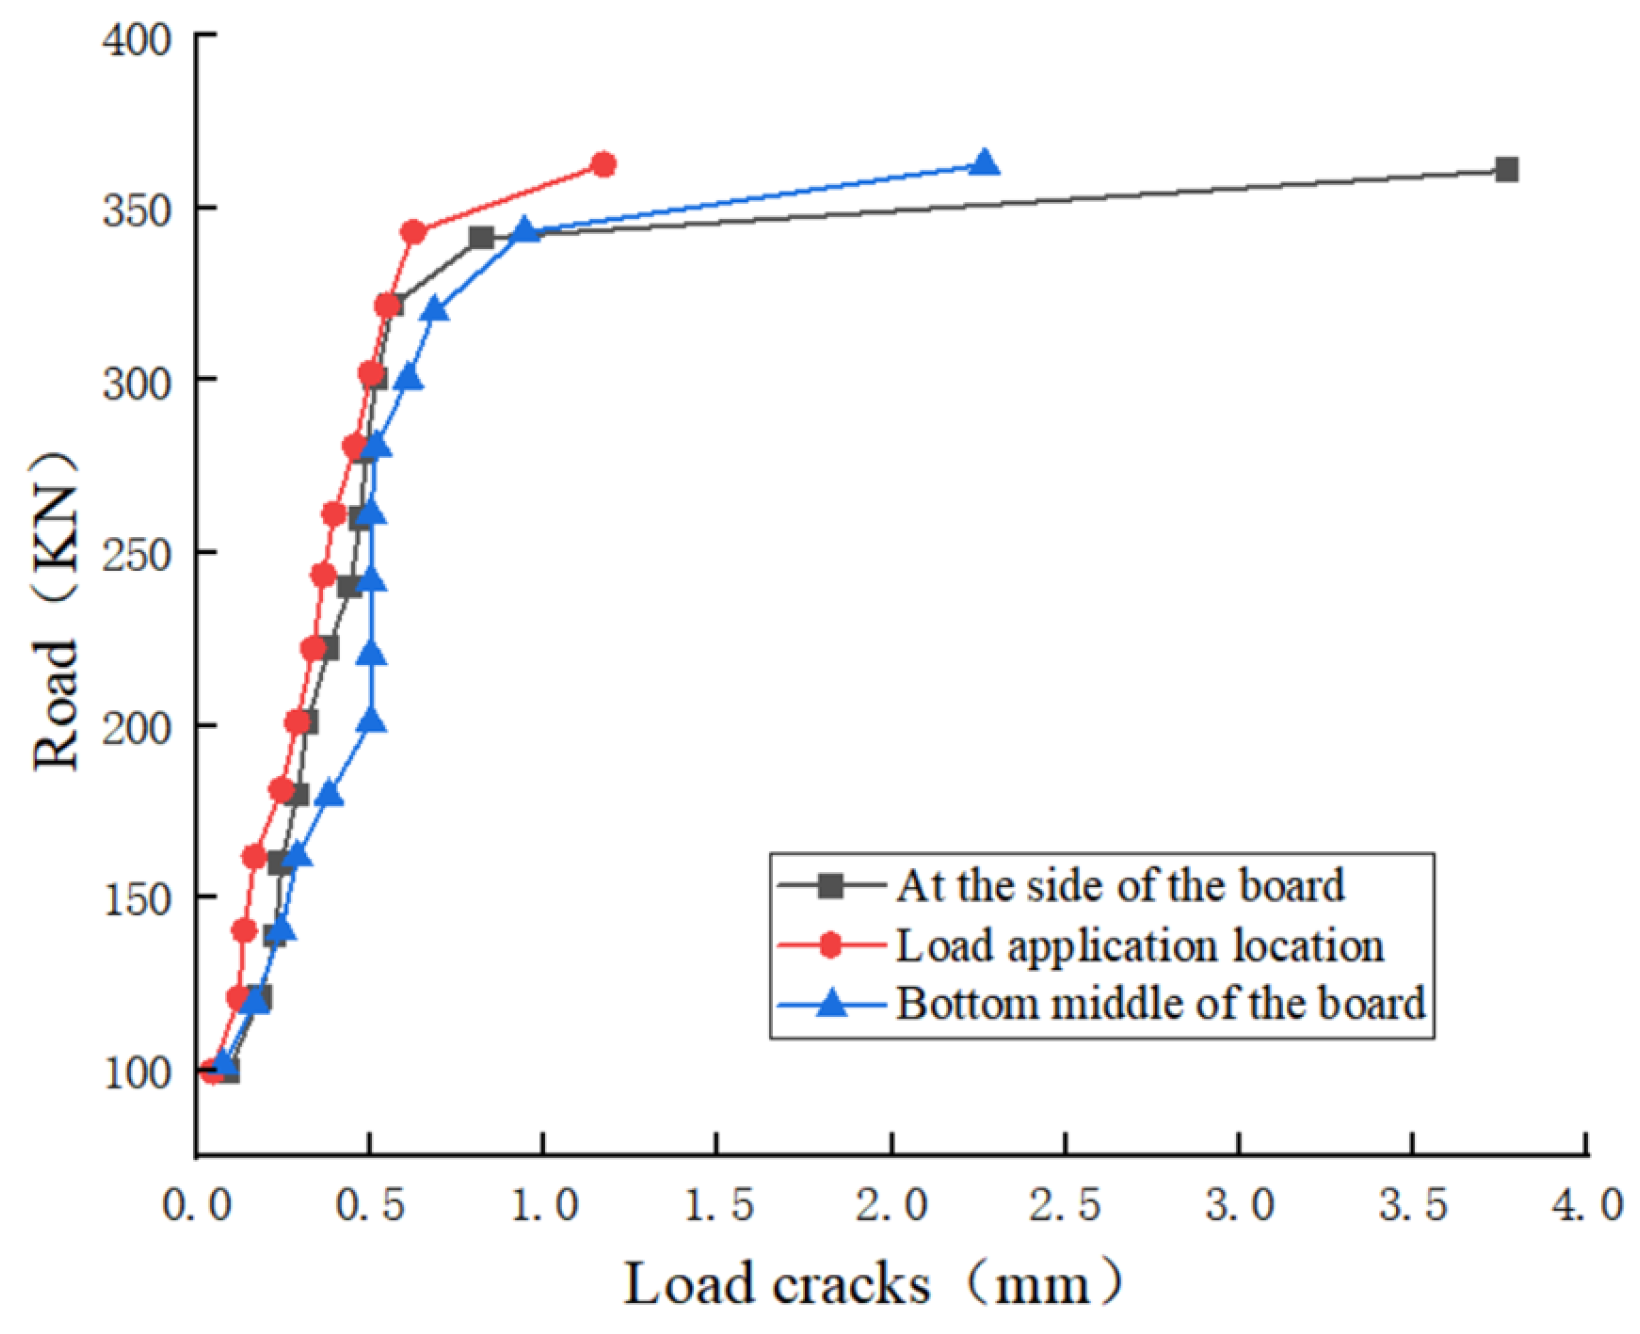
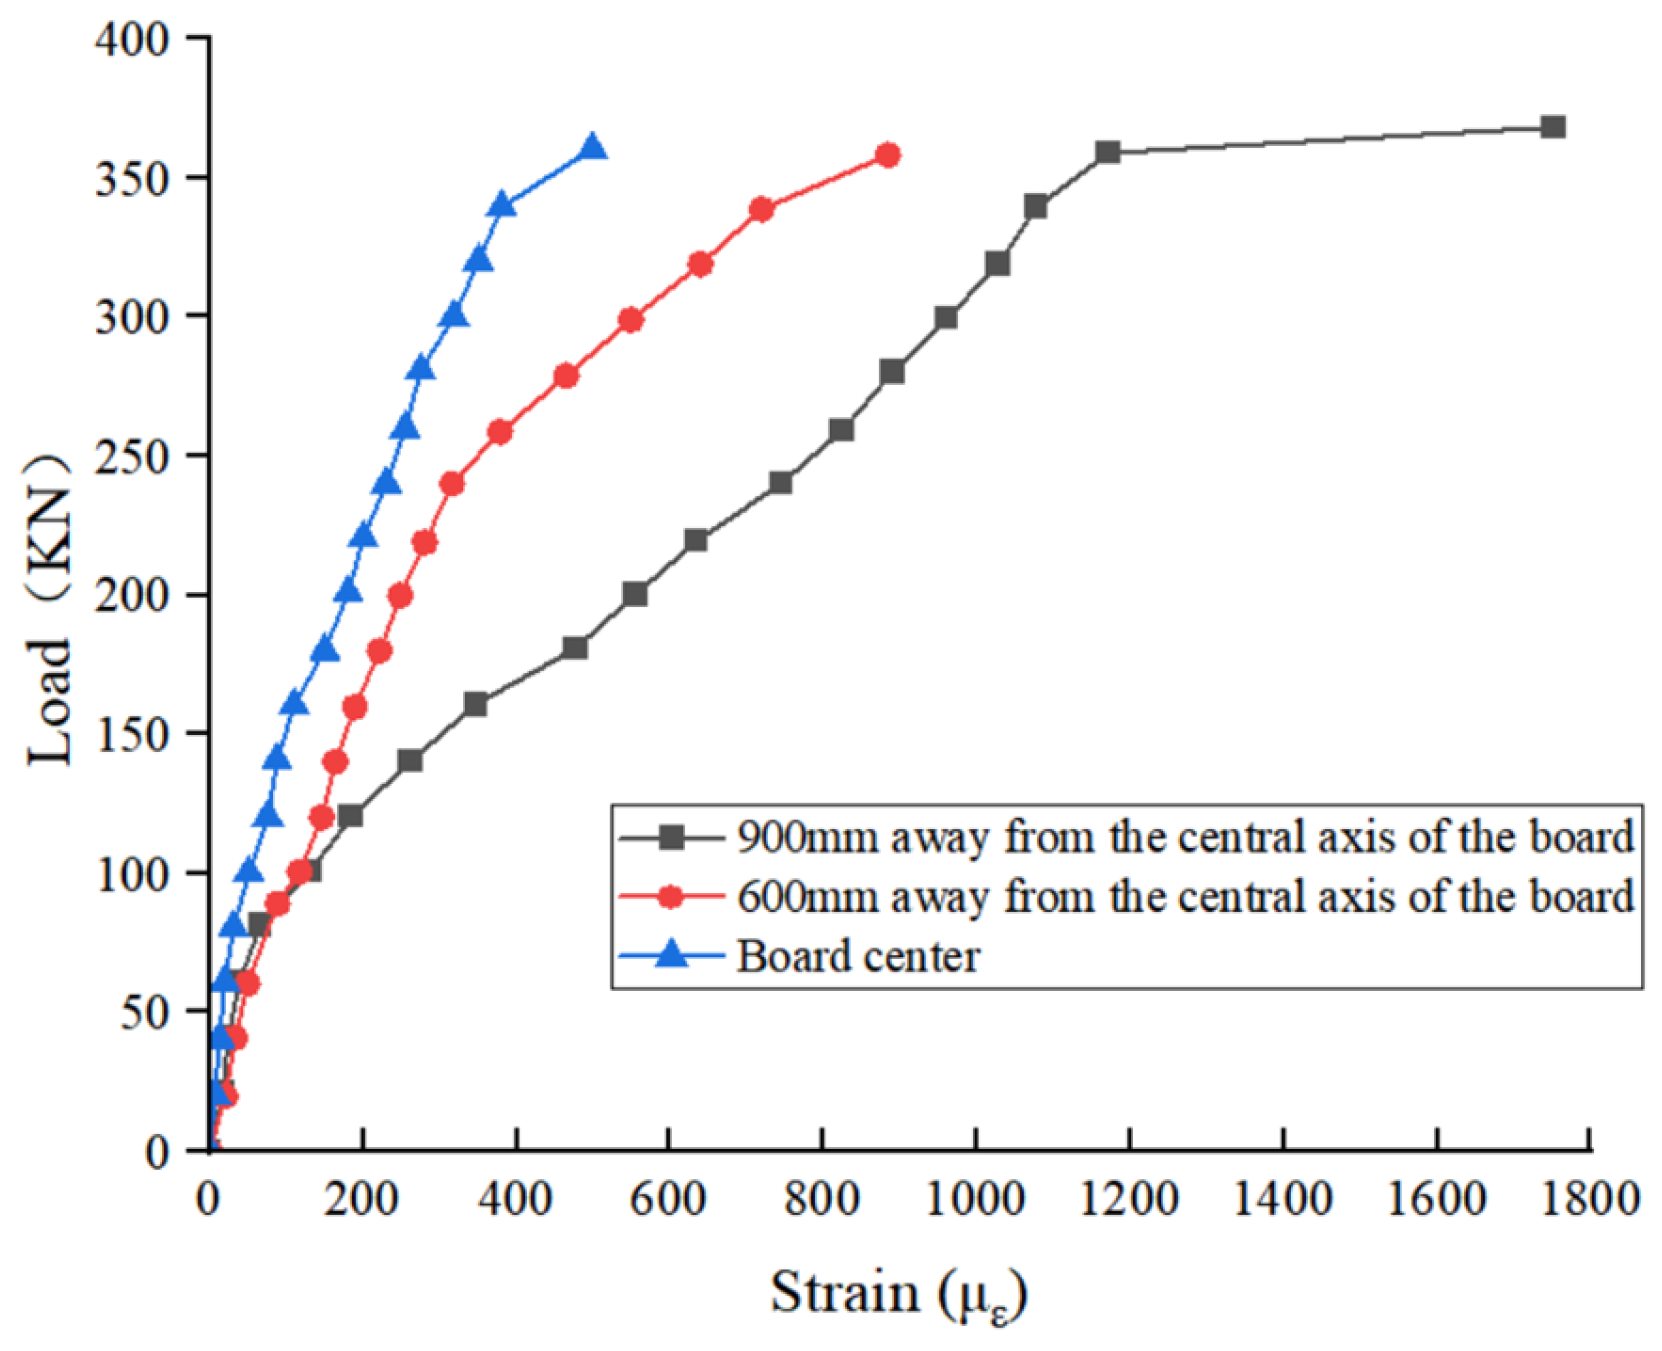
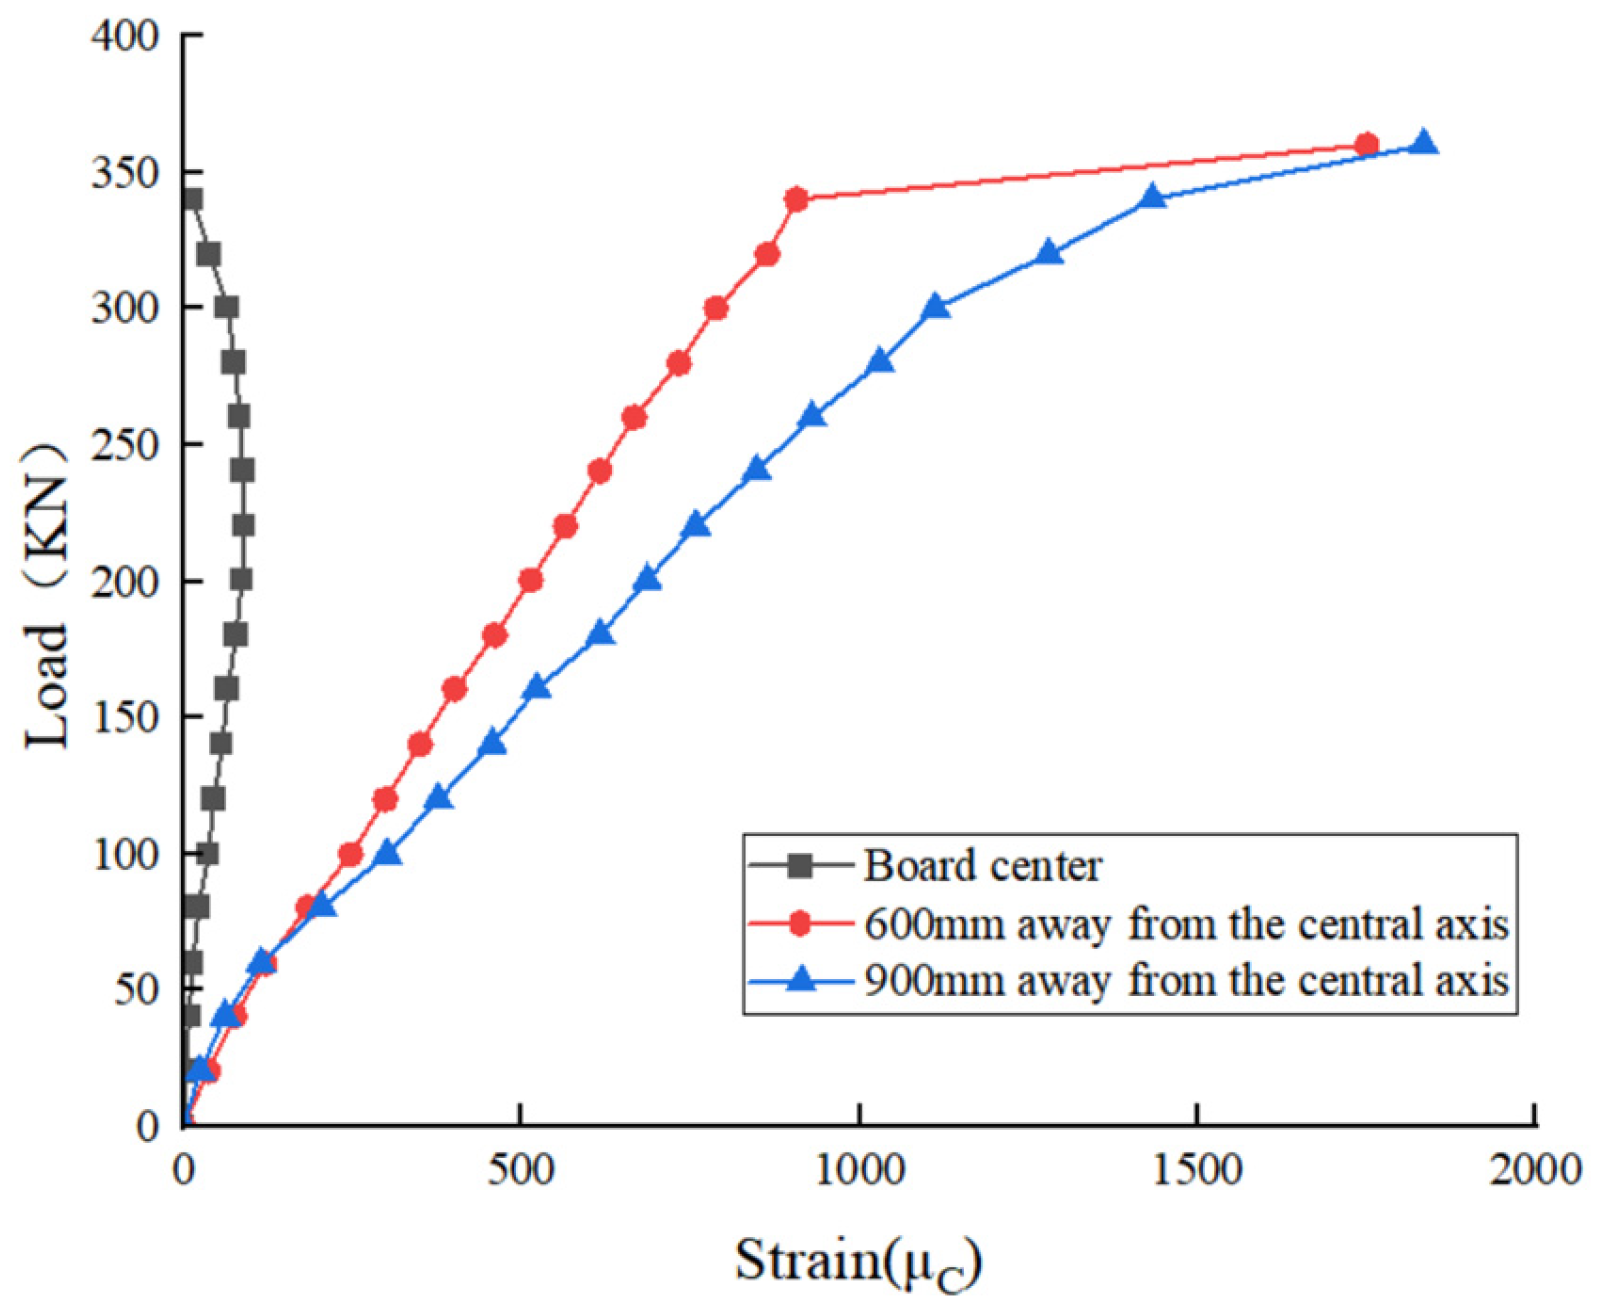
(3) Through static load limit bearing tests on prefabricated pavement panels, comprehensive monitoring was conducted throughout the process regarding deflection, crack propagation, steel bar strain, and concrete strain. The results demonstrate that these panels possess substantial safety margin and excellent load-bearing performance, fully meeting the operational requirements of heavy-duty vehicles at drilling sites.
(4) The finite element model reproduces the cracking load and ultimate capacity with moderate accuracy. A three-dimensional finite element model for the prefabricated road was developed using ANSYS, and its structural responses under static and dynamic loads were analyzed. The simulation results deviated by less than 17% from the experimental data, providing a realistic representation of the stress behavior of prefabricated pavement structures. This demonstrates that the finite element model exhibits practical usefulness for preliminary design and can serve as a theoretical basis for optimizing the design of prefabricated roads.
(5) Prefabricated modular structures offer significant economic and ecological benefits. Compared to traditional cast-in-place methods, they enable factory prefabrication, on-site assembly, and subsequent dismantling for recycling, thereby reducing environmental impact during construction, minimizing construction waste and material loss, improving construction efficiency, shortening project timelines, and mitigating the effects of rainy-season work on schedules. Furthermore, this construction approach aligns with China’s national “dual carbon” strategy and green building development requirements, making it highly suitable for widespread adoption.
(6) Regarding the experimental limitations and future work, it should be noted that the ultimate load test in this study was conducted on a single full-scale specimen; therefore, the measured value of 365 kN is not statistically representative and should not be directly used as a characteristic or design bearing capacity of this slab system. Future work should include replicate static loading tests on at least three prefabricated slabs to establish statistical characteristic parameters (mean, standard deviation, coefficient of variation) of load–deflection–crack width relationships, thereby providing more robust data for determining design values and conducting structural reliability analyses.