Article

Physical Model Study on Staged Underexcavation Rectification of an Existing Tilted High-Rise Building Using Cement-Based Materials

1
School of Civil Engineering and Architecture, Shandong University of Science and Technology, Qingdao 266590, China
2
School of Transportation and Civil Engineering, Nantong University, Nantong 226019, China
*
Author to whom correspondence should be addressed.
Coatings 2026, 16(9), 1071; https://doi.org/10.3390/coatings16091071
Submission received: 7 August 2026 / Revised: 29 August 2026 / Accepted: 7 September 2026 / Published: 9 September 2026

Highlights

What are the main findings?
  • Poor compaction (ηc = 0.86) and wetting-induced softening contributed to building inclination.
  • Staged underexcavation achieved 176 mm rectification and an 83.17% correction rate.
  • Displacement increments declined successively from 0.85 to 0.48 and 0.43 mm.
  • Staged underexcavation raised the mean correction rate from 95.73% to 98.44%.
What are the implications of the main findings?
  • Staged underexcavation improves rectification controllability in collapsible loess.
  • Inter-stage stabilization promotes gradual stress redistribution and re-equilibration.
  • Reduced stage-wise excavation volumes mitigate abrupt unloading during rectification.
  • The scheme supports controlled and precise correction of tilted high-rise buildings.

Abstract

To investigate the settlement response and rectification performance of existing tilted high-rise buildings during staged underexcavation in complex collapsible-loess areas, a severely tilted high-rise building was selected as the case study. An integrated approach combining field investigation, geotechnical testing, a 1:100 physical model test, and three-dimensional finite-element analysis was employed to investigate the causes of building inclination and the deformation response during staged underexcavation rectification. The results indicate that insufficient compaction of the inter-pile soil, together with wetting-induced collapse and mechanical softening, jointly contributed to the development of differential foundation settlement. The stage-wise rectification displacement increments during staged underexcavation decreased successively from 0.85 mm to 0.48 mm and 0.43 mm. The prototype-scale rectification displacement derived from the physical model was 176 mm, corresponding to a rectification rate of 83.17%. As underexcavation proceeded, the additional rectification response induced by each stage generally decreased, exhibiting a progressively attenuating trend. Numerical simulations yielded average rectification rates of 95.73% and 98.44% for the one-time and staged underexcavation schemes, respectively, with a final rectification displacement of 202.10 mm for the staged scheme. Under the investigated conditions, staged underexcavation exhibited better rectification performance than one-time underexcavation. The progressively reduced excavation volumes of 120, 100, and 80 m3, combined with inter-stage stabilization, promoted gradual stress redistribution and deformation adjustment of the structure–foundation–soil system, supporting the feasibility of staged underexcavation under the investigated collapsible-loess conditions. These findings provide a useful reference for the controlled and precise implementation of rectification engineering for tilted high-rise buildings in complex collapsible-loess areas.

1. Introduction

With rapid urbanization, high-rise buildings have become increasingly concentrated in urban areas, and building inclination caused by differential foundation settlement has become an increasingly important engineering concern [1]. This problem is caused by many factors, such as an insufficient bearing capacity of the foundation, variations in the stratum soil, and local damage to the structure [2]. This problem is particularly significant in soft soil, collapsible loess, karst landforms, and mining subsidence areas [3]. Once a high-rise reinforced-concrete building becomes tilted, it endangers structural safety and people’s lives and property. Furthermore, if the building is forced to be demolished and rebuilt due to continuous inclination development, it will generate a large amount of embodied carbon emissions from the production of new concrete and construction waste [4]. Therefore, investigating rectification techniques for existing high-rise reinforced-concrete buildings experiencing progressive differential settlement is of considerable theoretical and practical significance for improving engineering safety management and control.
At present, the technical methods used to rectify and rehabilitate existing buildings mainly include pile foundation reinforcement, load adjustment, jacking correction, and forced landing correction. Cho et al. [5] evaluated the remaining service life of existing reinforced-concrete buildings considering the failure probability of structural members based on the field investigation data of 21 buildings. The results provided a quantitative reference for determining the optimal timing of repair and strengthening of existing buildings. Chen et al. [6] proposed a service life model for carbonated reinforced concrete incorporating supplementary cementitious materials in which the early corrosion propagation stage was taken into account, providing a quantitative basis for longevity assessments of sustainable cement-based structural systems. Kuang et al. [7] systematically analyzed the influence of different soil parameters on the correction effect by studying the development law of the soil plastic zone after inclined hole excavation. Xiao et al. [8] pointed out that large-scale settlement and structural eccentricity were the main causes of building inclination based on a field investigation. A systematic treatment method combining settlement analysis, structural deviation correction, and foundation repair was proposed, and a practical design formula was established. Li Q M [9] emphasized that the correction of pile foundations is complex and high risk, requiring comprehensive management. The structure can be strengthened using negative friction technology. Deng et al. [10] proposed a comprehensive rectification method combining anti-dip and forced landing techniques by studying stress-controlled soil cutting, anchor cable pressure, and lime pile-steel pipe pile technology. Wang Junbo et al. [11] found that uneven settlement could be effectively suppressed by reinforcing the foundation with large-tonnage anchor static-pressure piles. Bu L et al. [12] analyzed the quality control problem during the rectification and reinforcement of building structures from the perspective of risk perception. Based on soil plasticity theory, Chen Y et al. [13] derived an analytical solution for the plastic zone of the soil hole and applied it to actual engineering correction design. Zhang X et al. [14] analyzed the deformation control effects of brick-wood structure buildings using lifting rectification and concrete-filled steel tube reinforcement. The above studies demonstrate that underexcavation rectification has evolved beyond a purely experience-based construction practice. Nevertheless, its effectiveness remains strongly influenced by site-specific geological conditions, the initial state of the foundation, the excavation sequence, and soil–foundation interactions.
When underexcavation is applied to water-sensitive collapsible-loess foundations, the problem becomes considerably more complex. Previous studies on collapsible loess have shown that wetting-induced changes in soil structure and the associated degradation of mechanical properties can significantly alter foundation-settlement behavior. However, existing research on collapsible loess has mainly focused on the mechanisms of collapse deformation, prediction of wetting-induced settlement, and hydro-mechanical responses [15,16,17], whereas studies on building rectification have largely concentrated on the mechanical behavior of excavation cavities and the design of construction parameters. Consequently, systematic research on the rectification of existing inclined buildings under complex collapsible-loess site conditions remains relatively limited, particularly with respect to the integrated evaluation of foundation degradation, stage-wise deformation responses, and engineering controllability.
Aiming to address the serious uneven settlement and inclination of an existing high-rise reinforced-concrete shear-wall building in a collapsible loess area, this paper analyzes the causes of building inclination using field tests, model tests, and numerical simulations, and the reliability and effectiveness of the staged underexcavation are evaluated. The results provide a technical reference for the design and controlled implementation of staged underexcavation rectification for existing tilted high-rise buildings under collapsible-loess conditions.

2. Engineering Situations

This study focuses on an existing Category II high-rise residential building with a total floor area of 12,170 m2 and a building height of 32.8 m [18]. The building is supported by a thick C30 concrete raft, beneath which a composite foundation consisting of immersed-tube compacted plain-concrete enlarged-head piles and soil-compaction piles is installed. The RC shear-wall superstructure and raft primarily carry and transfer the building loads, while the composite foundation further transmits and distributes these loads to the underlying ground through the combined action of the concrete piles, soil-compaction piles, and inter-pile soil. The natural subsoil profile at the site consists mainly of Holocene loess-like soil overlying Neogene strongly weathered mudstone.
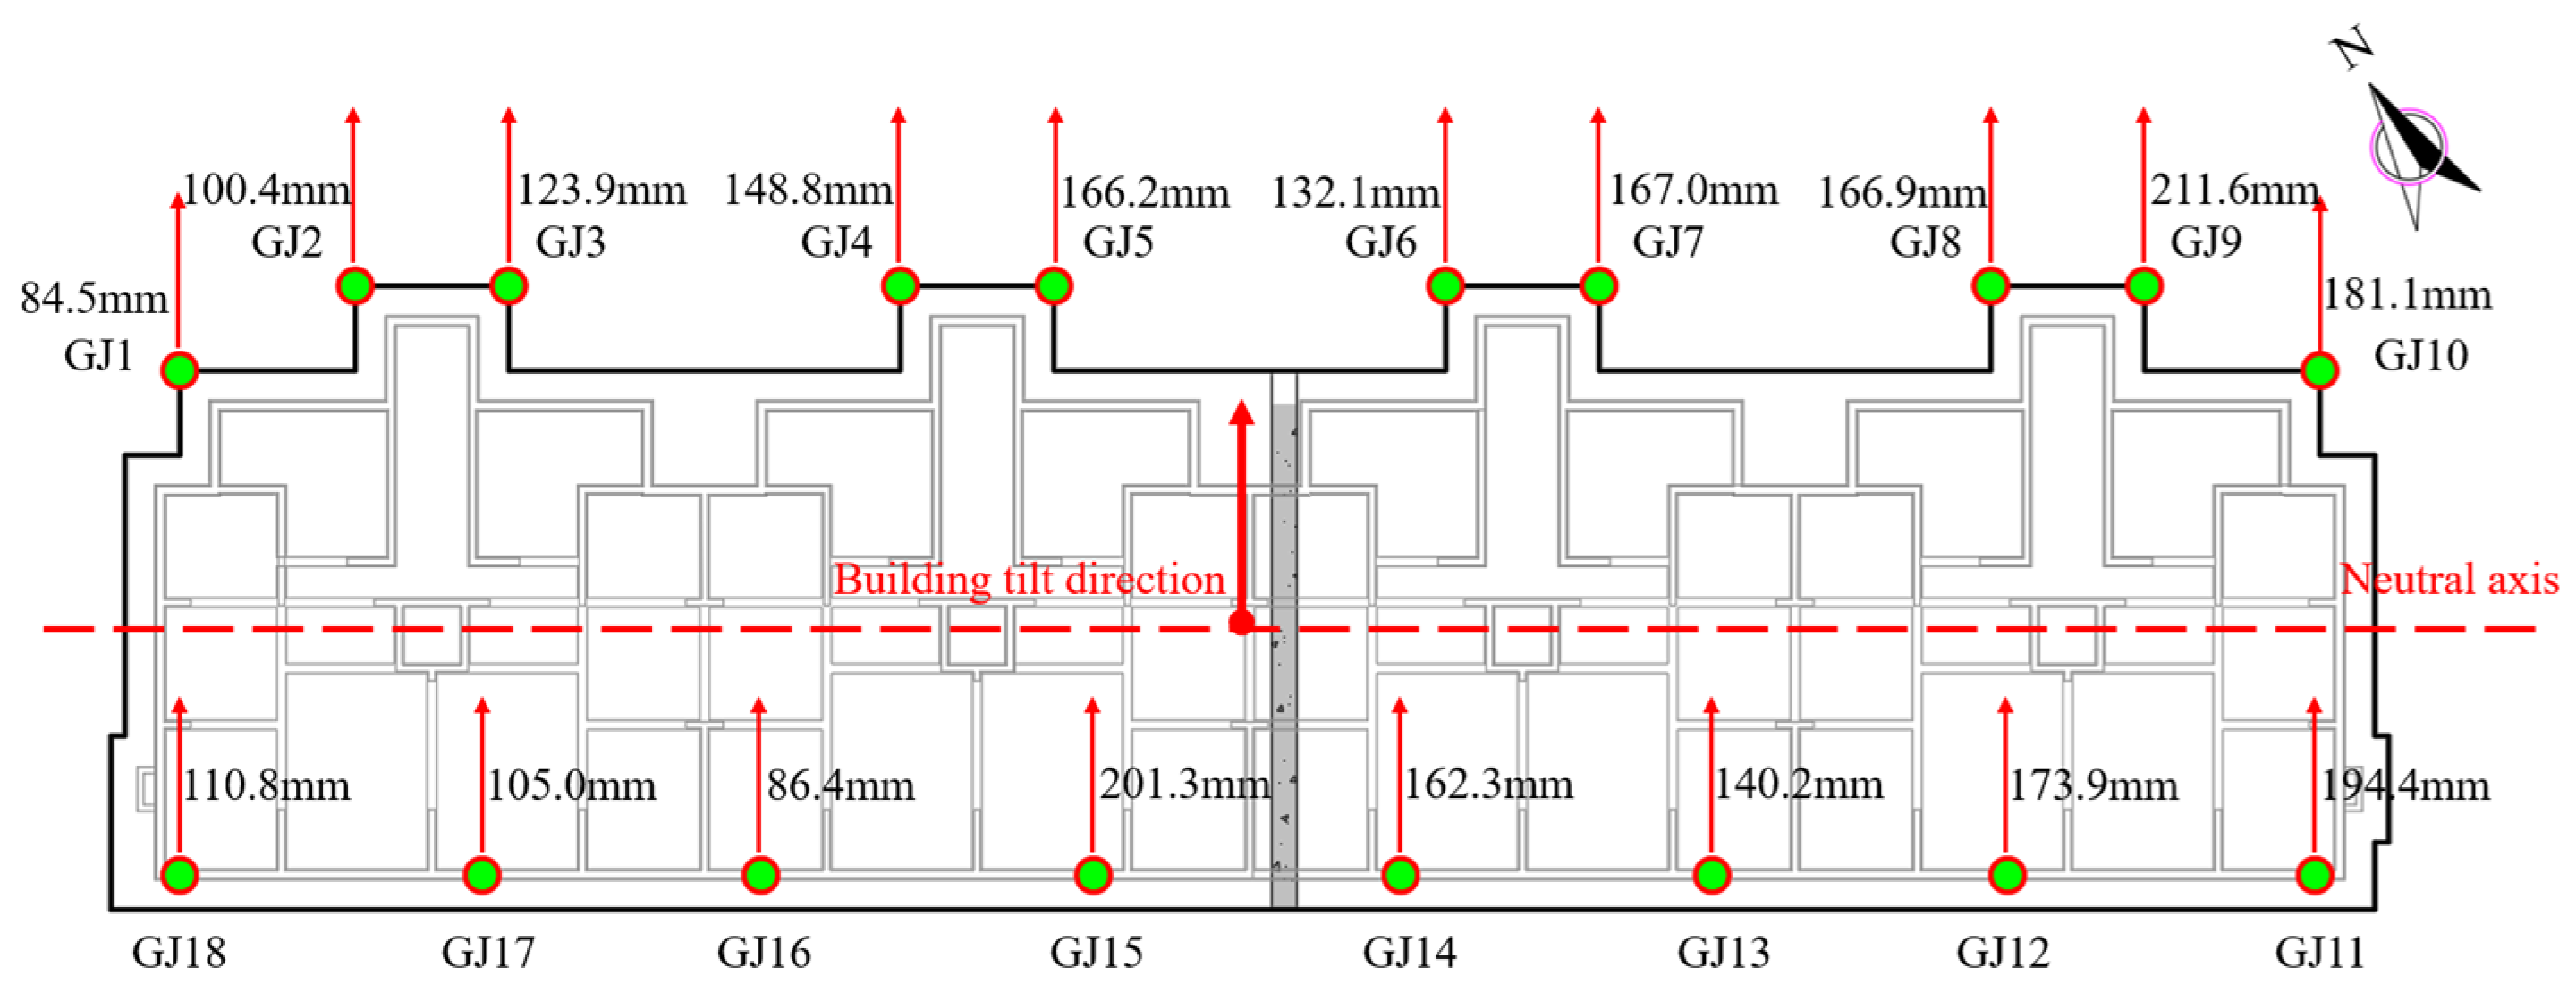
Settlement observations of the building were carried out in 2021 and 2023 utilizing 18 settlement observation points (GJ1–GJ18). The overall inclination ratios of the building were 6.13‰ and 6.45‰ in 2021 and 2023, respectively. An overall inclination control value of 3‰ [19] was adopted for the high-rise building; therefore, the inclination ratios measured during both monitoring campaigns exceeded this criterion, indicating that the overall building inclination exceeded the corresponding control requirement. Meanwhile, the maximum measured displacement increased from 201.0 mm in 2021 to 211.6 mm in 2023, corresponding to an increase of 10.6 mm, indicating that building deformation continued to develop during the monitoring interval. Therefore, corrective measures were required to reduce the excessive inclination and restore the geometric serviceability of the building. The layout of the foundation monitoring points and the corresponding cumulative settlement measured in 2023 are shown in Figure 1.

3. Field Test

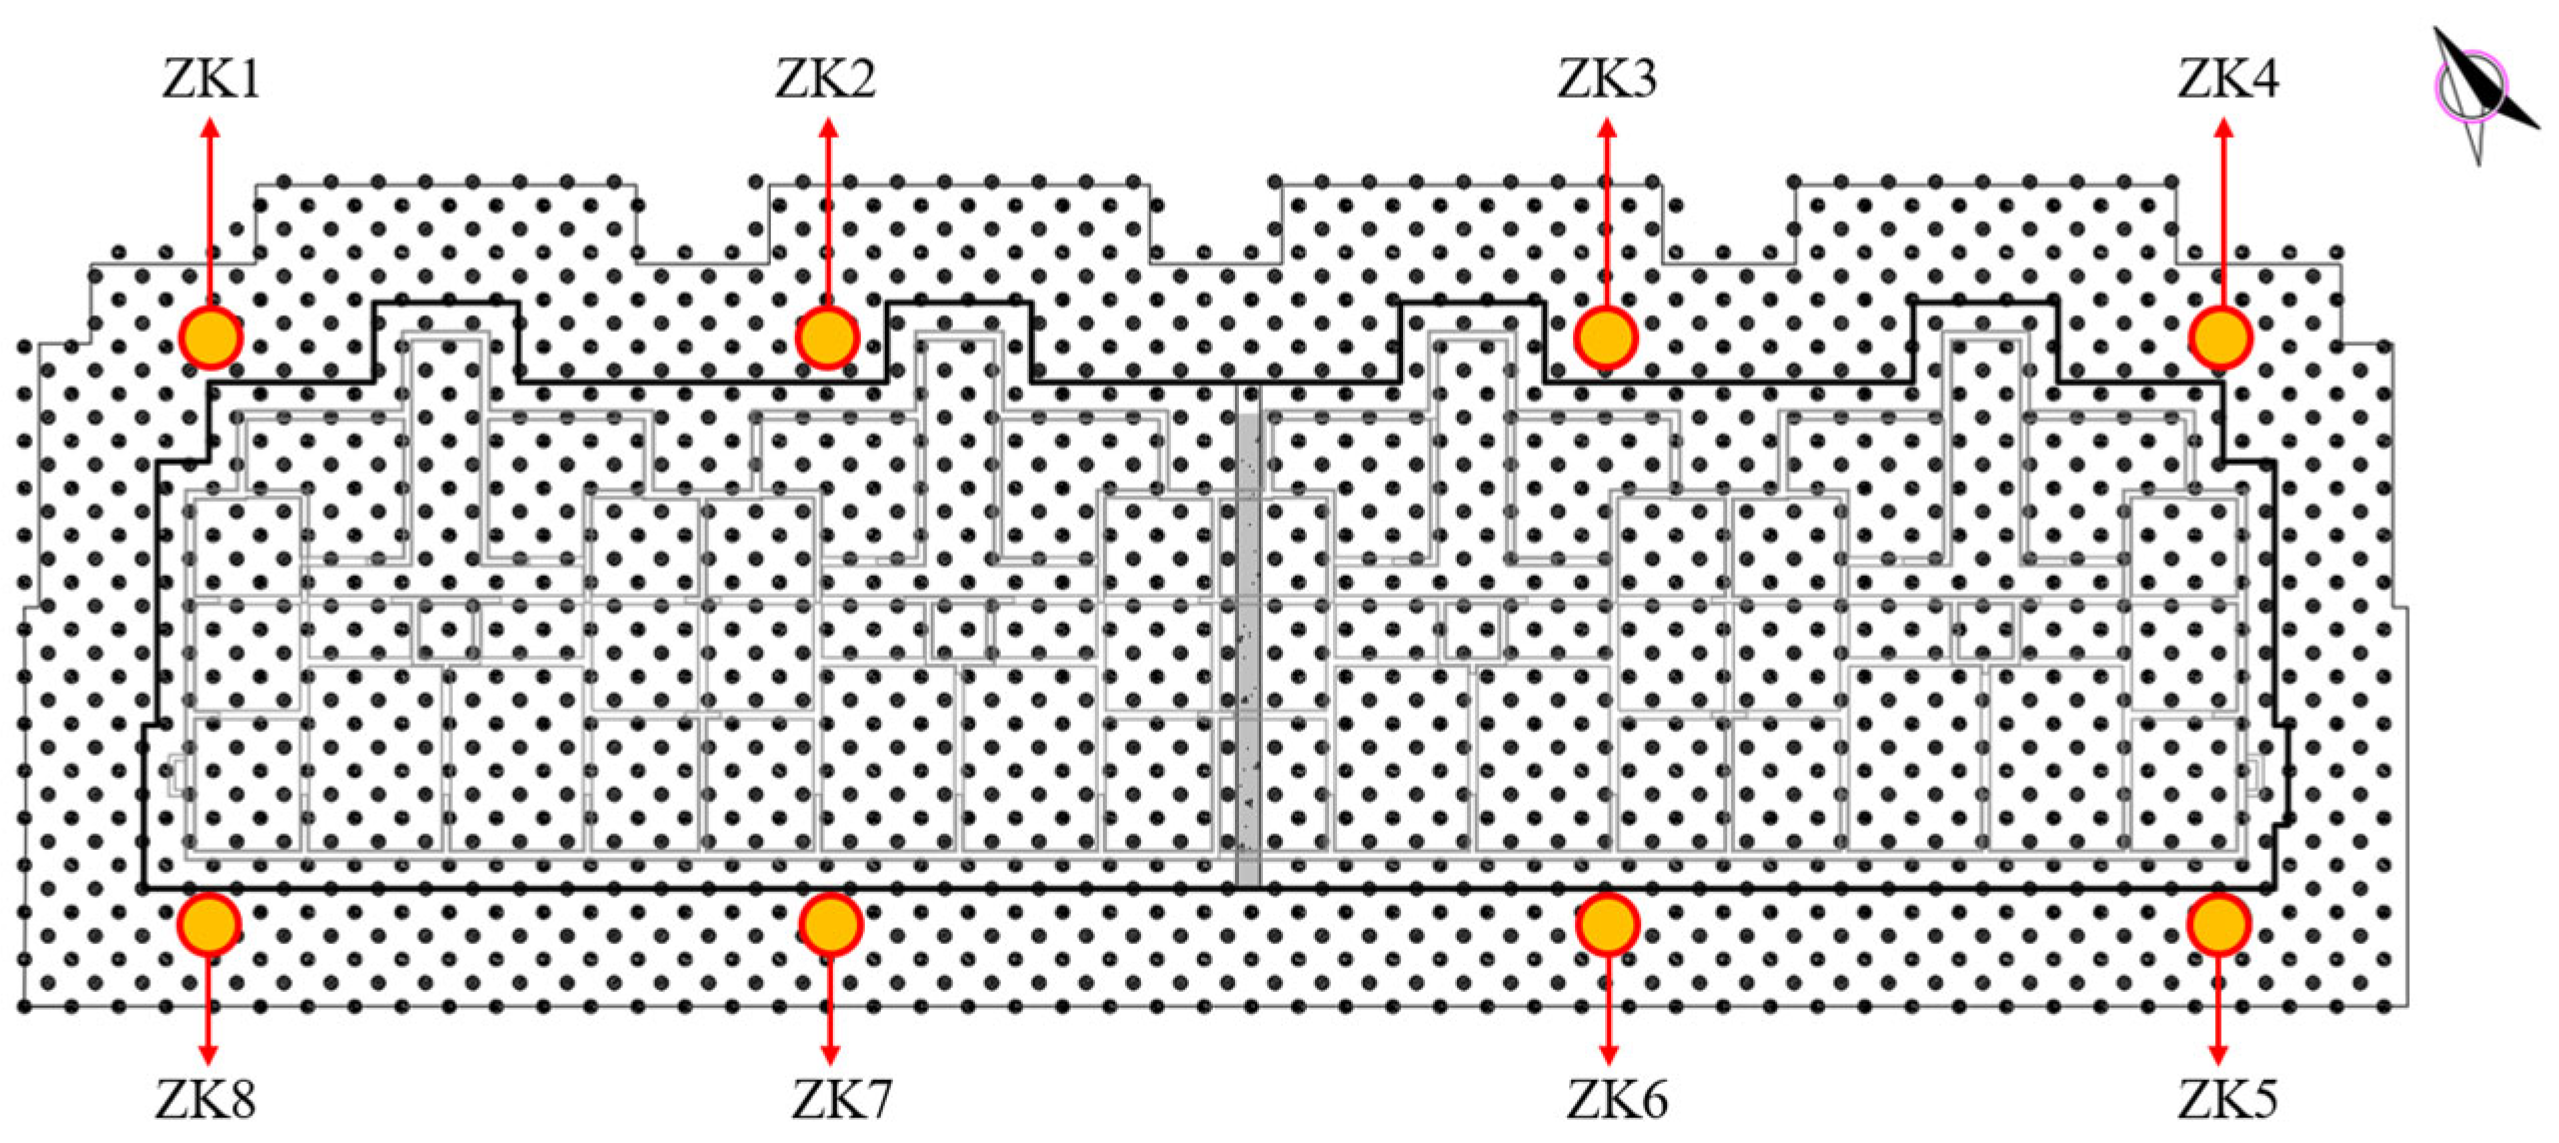
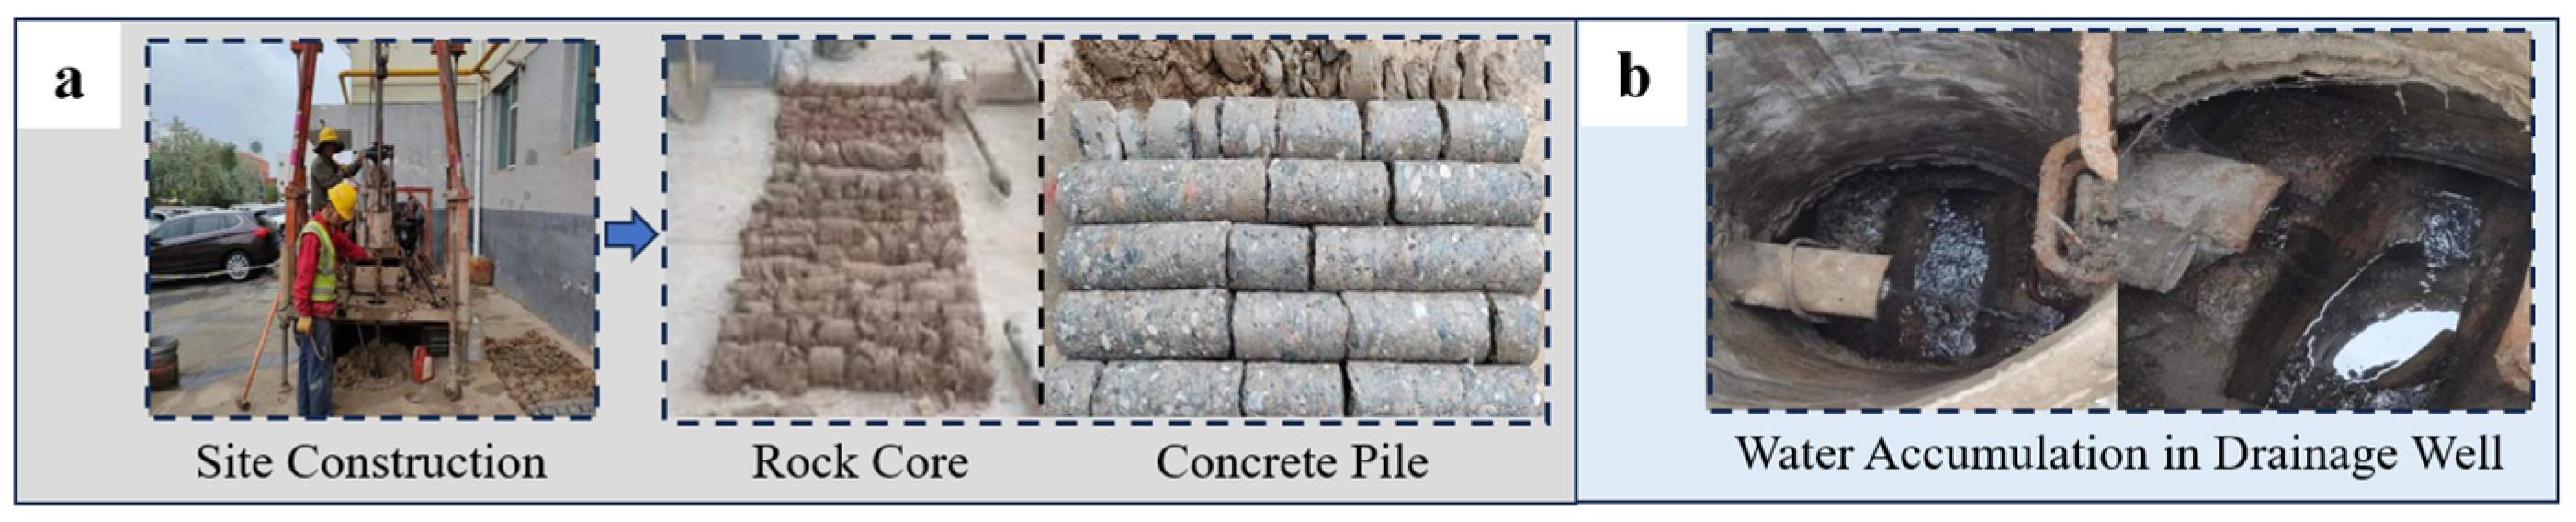
In order to identify the causes of uneven settlement and inclination of the RC shear-wall building, field geotechnical tests were carried out on the building foundation utilizing 8 boreholes (ZK1~ZK8). The drilling layout is shown in Figure 2. The foundation form, the mechanical properties of the foundation soil layer, and the surrounding environment of the building were explored and investigated. The process is shown in Figure 3.

3.1. Degree of Compaction Calculation

Considering that the most severe differential settlement of the foundation occurred at borehole ZK2, the undisturbed soil samples collected from this location were considered representative of the low-density state and wetting response characteristics of the inter-pile soil in the severely settled area. Due to limitations associated with site safety and sampling conditions, the undisturbed soil from borehole ZK2 was selected as the primary research material in this study. The compaction degree of the inter-pile soil was evaluated through standard Proctor compaction tests and in situ undisturbed soil density measurements. The test results are presented in Table 1. The average compaction coefficient of the inter-pile soil was calculated using the following equations [20]:
η c = ρ d ¯ ρ d , max
ρ d = G s ρ w 1 + e
where ηc is the compaction coefficient of the inter-pile soil; ρd is the dry density of the soil (g/cm3); ρd,max is the maximum dry density obtained from the standard Proctor compaction test (g/cm3); Gs is the specific gravity of soil solids; ρw is the density of water (g/cm3); and e is the void ratio of the soil.
The average dry density of the inter-pile soil at borehole ZK2 was 1.419 g/cm3, while the maximum dry density determined from the standard Proctor compaction test was 1.65 g/cm3. Accordingly, the average compaction coefficient of the inter-pile soil was calculated to be 0.86, which was lower than the code-specified minimum value of 0.93 [21]. This result indicates insufficient compaction of the inter-pile soil in the area experiencing severe settlement.

3.2. Water-Immersion Compression Test

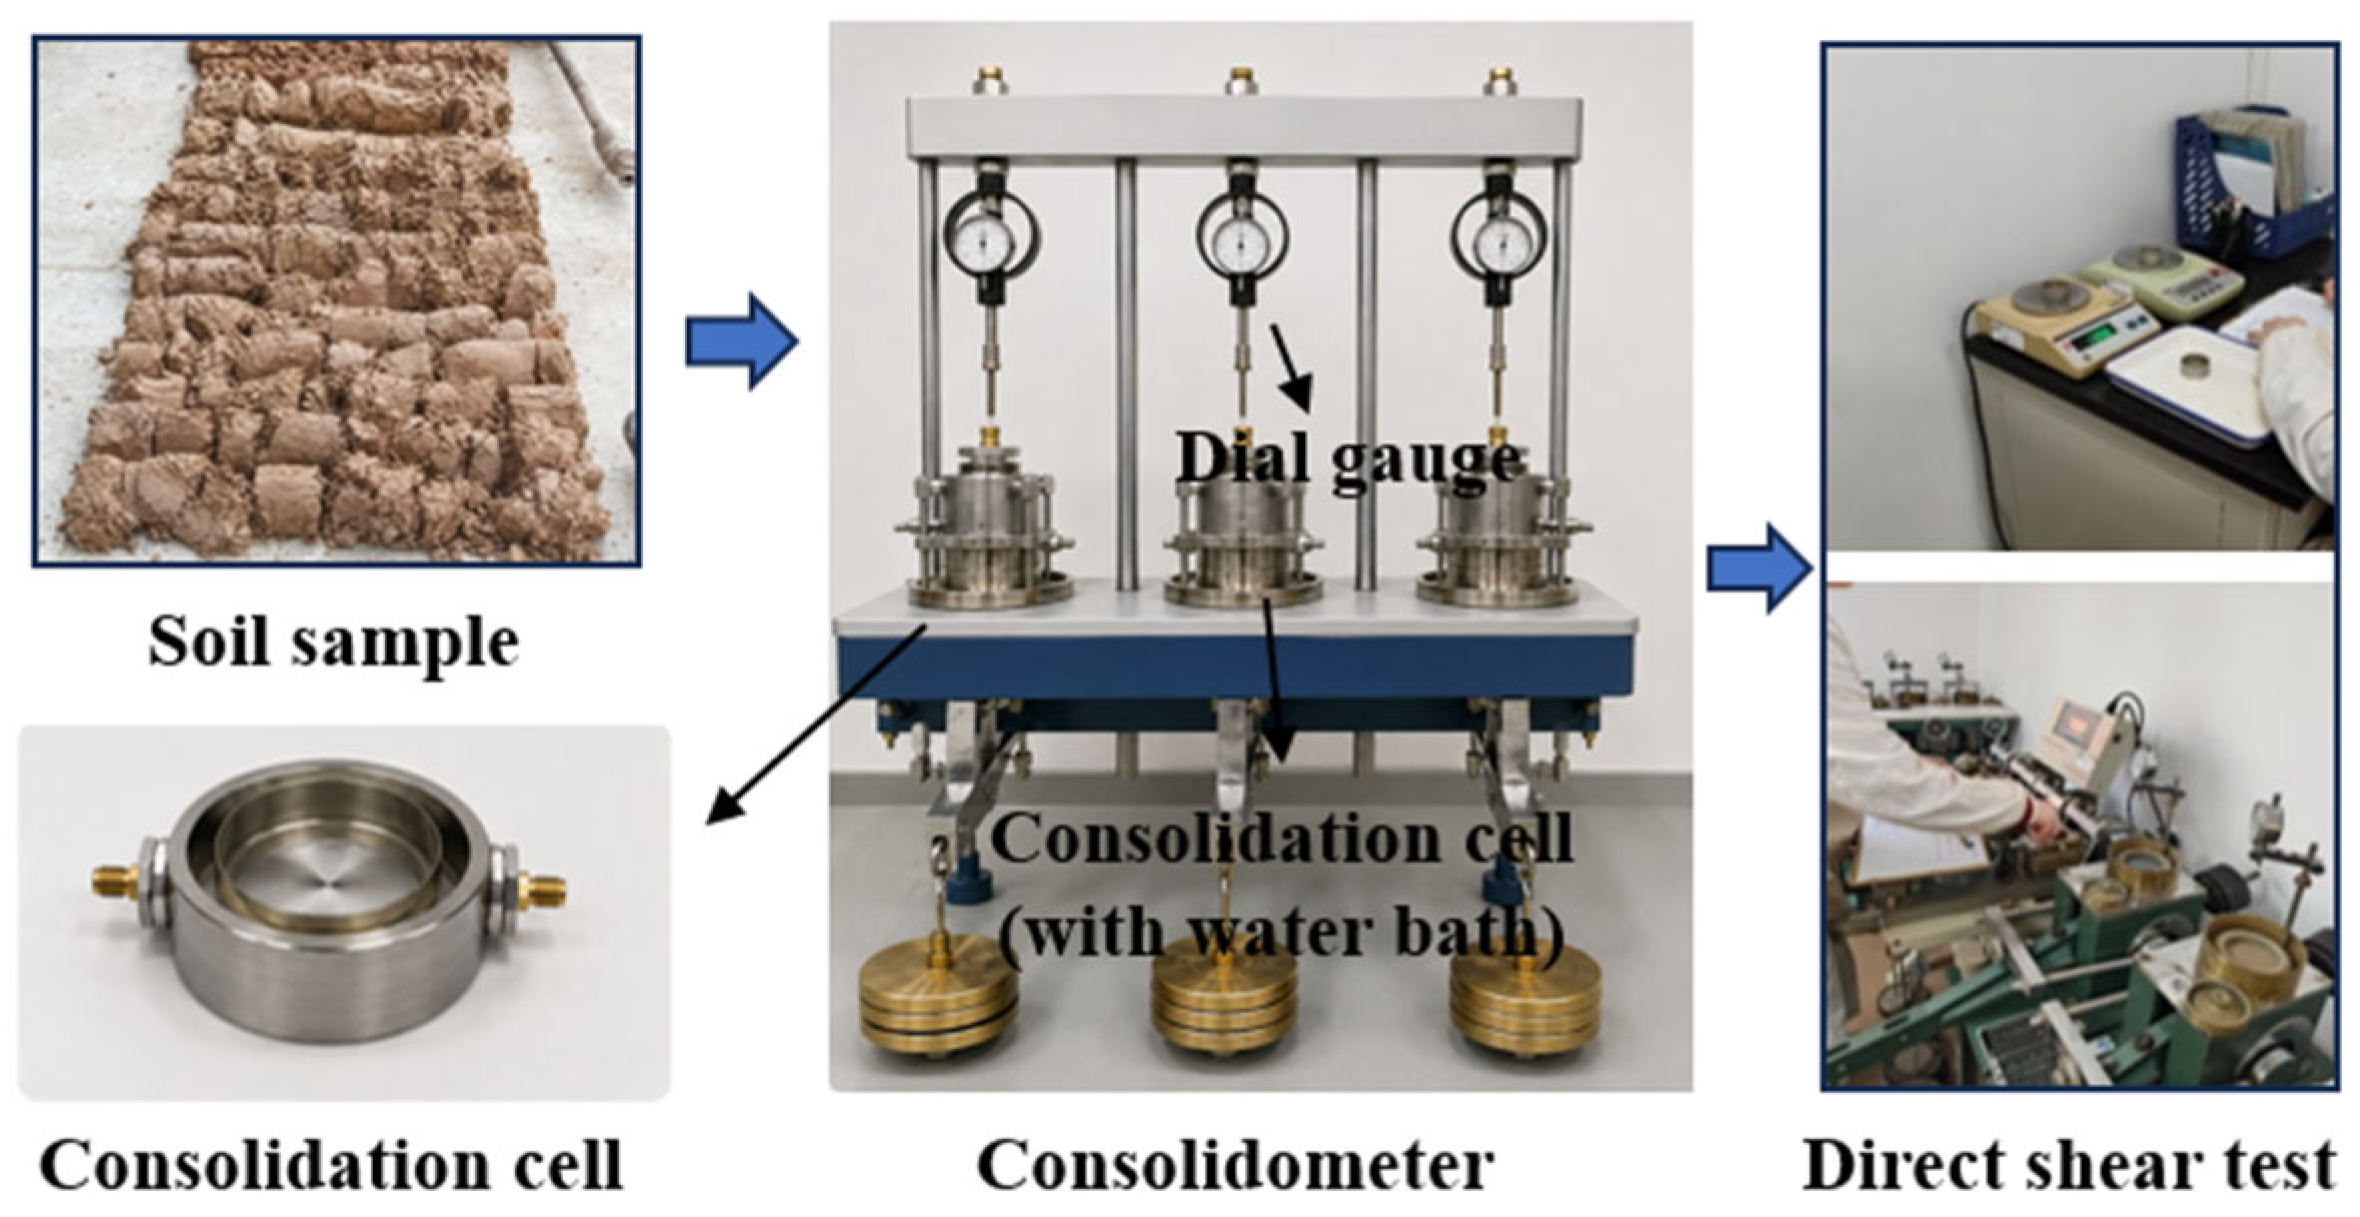
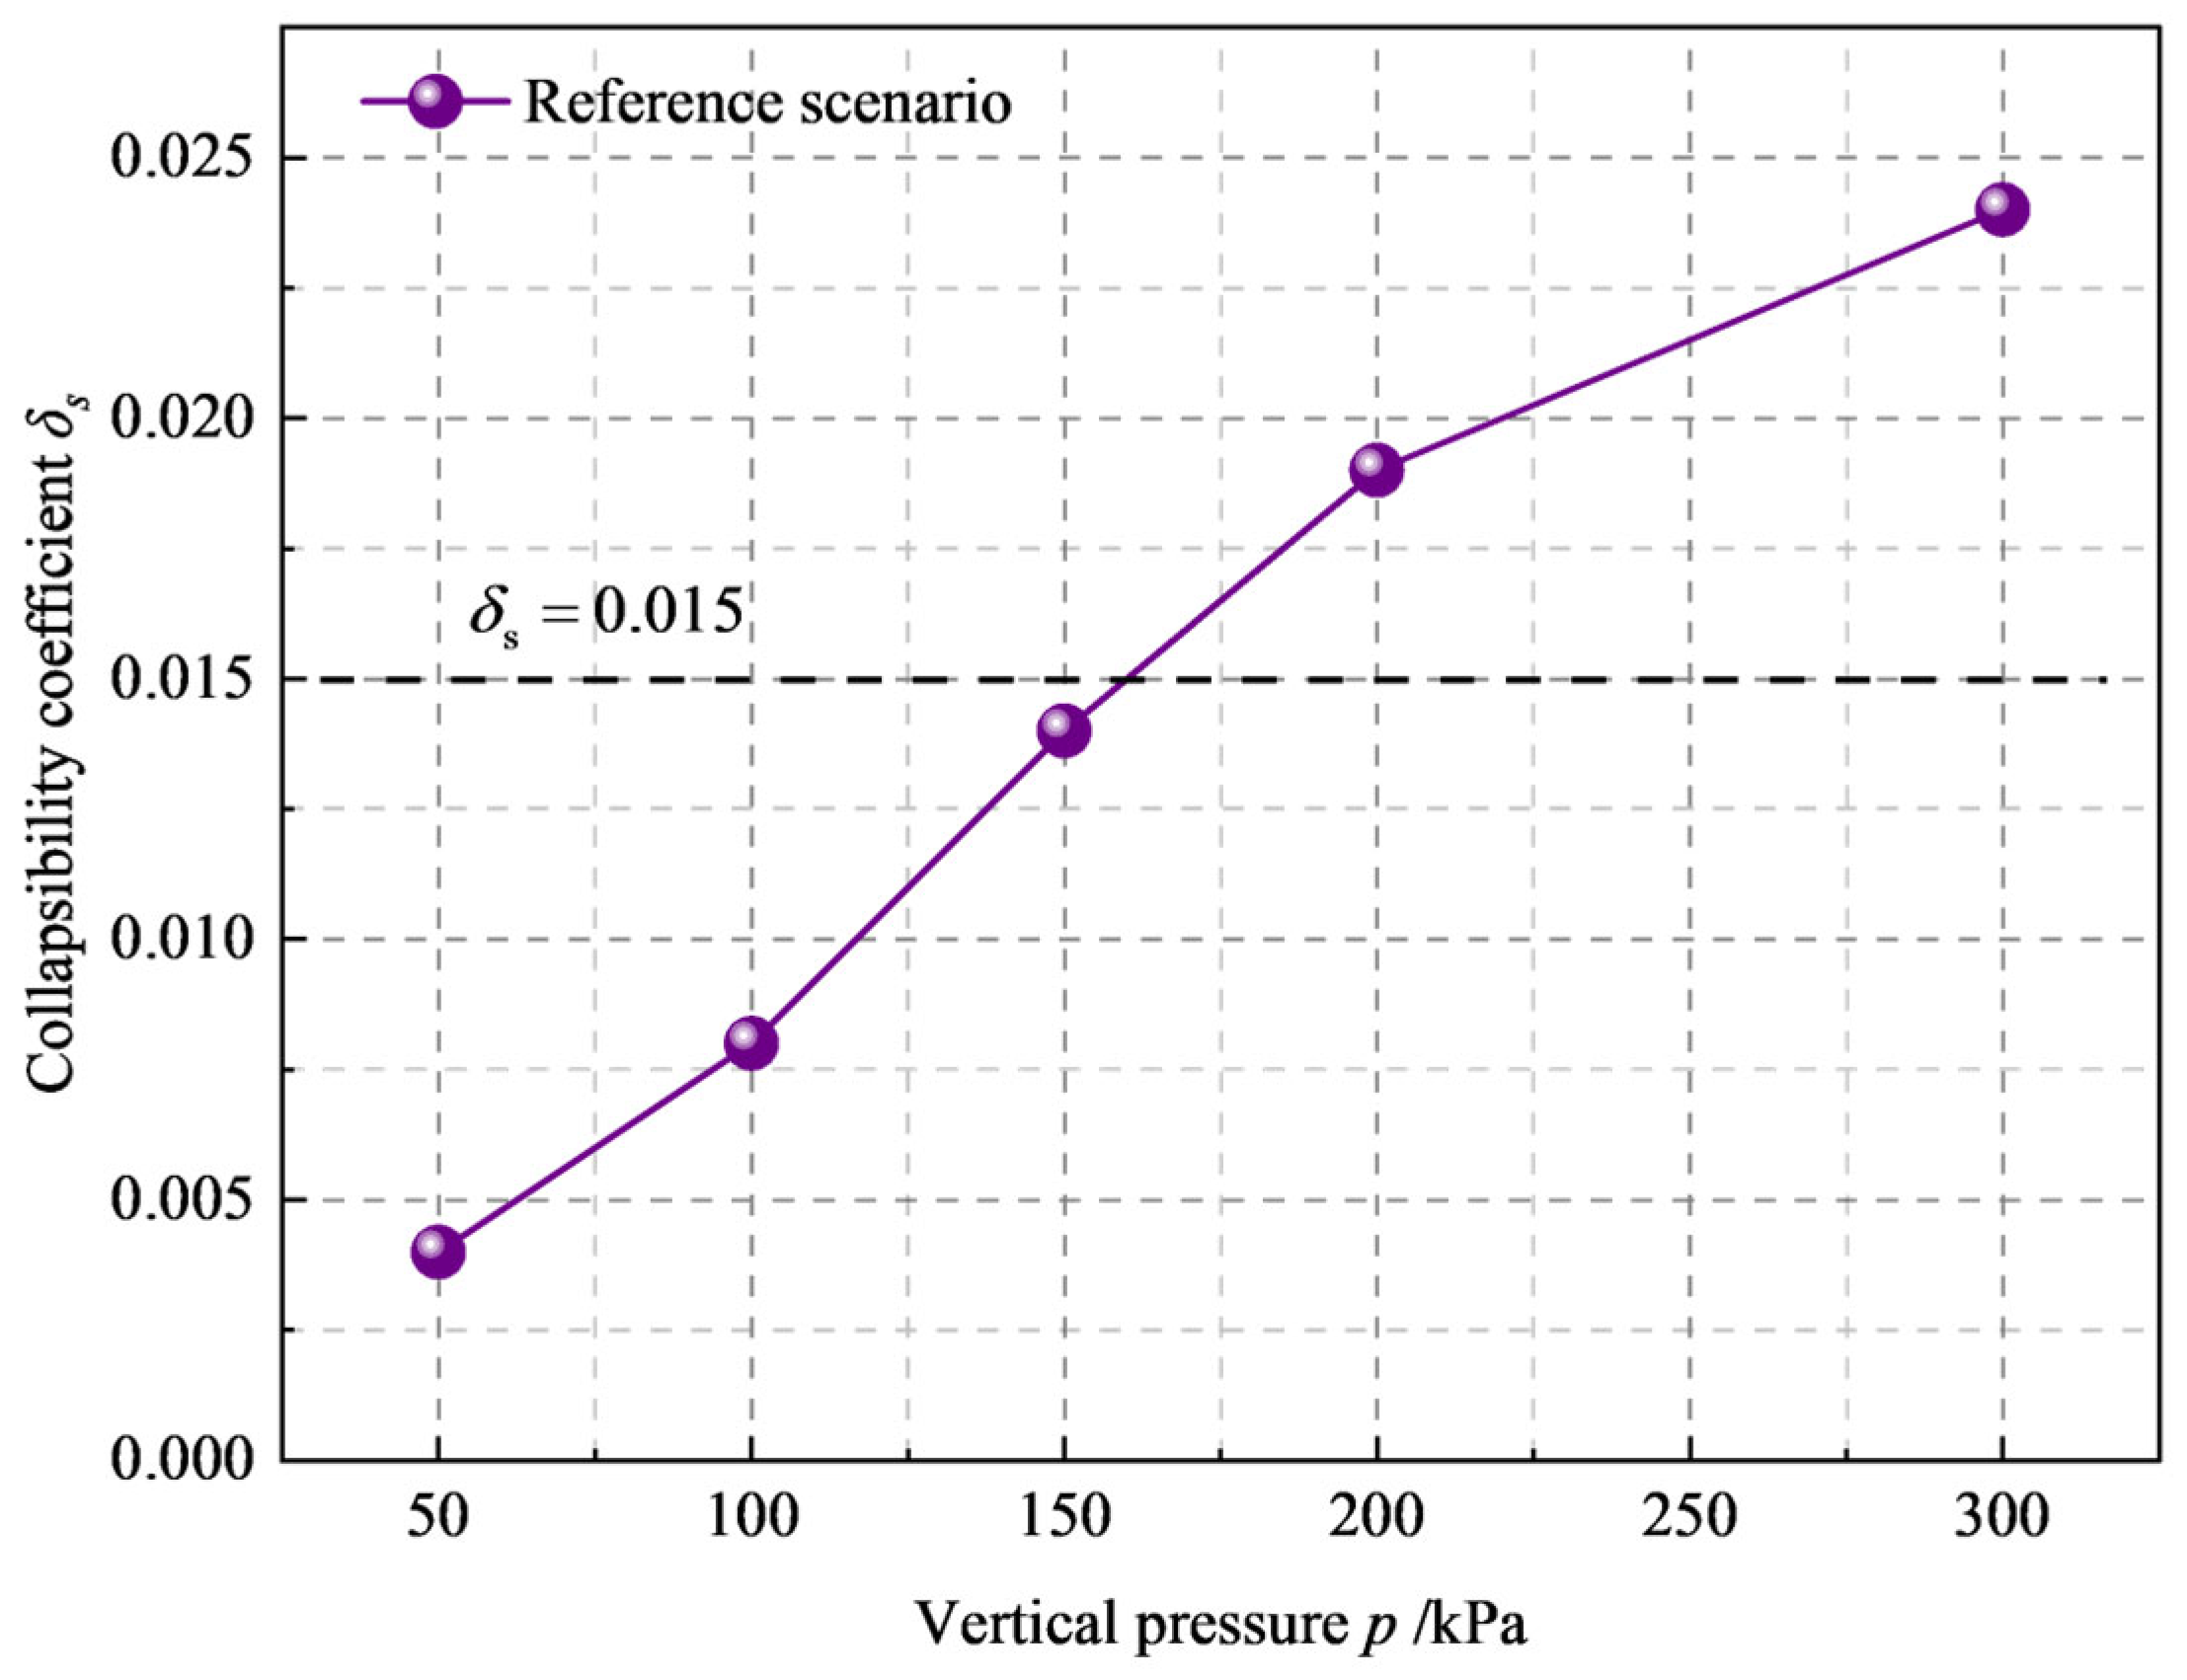
The collapsibility of the foundation soil was evaluated using a single-line water-immersion compression test. Undisturbed soil specimens were prepared using cutting rings with an inner diameter of 79.8 mm, and the initial specimen height, h0, was 20 mm. During testing, the specimens were maintained at their natural water content and loaded incrementally according to the prescribed pressure levels up to 300 kPa. After the target pressure was reached and the compression deformation had stabilized, the specimens were inundated with water. The additional vertical deformation induced by wetting was continuously monitored until the collapsible deformation became stable. The test procedure is illustrated in Figure 4, and the corresponding results are presented in Table 2 and Figure 5.
The test results showed that the specimens exhibited pronounced additional compression after inundation. The collapsibility coefficient increased from 0.004 at 50 kPa to 0.024 at 300 kPa. Under vertical pressures of 200 and 300 kPa, δs reached 0.019 and 0.024, respectively, exceeding the adopted criterion of 0.015 and indicating pronounced wetting-induced collapsible deformation under these stress levels.

3.3. Comparative Test on Natural and Saturated Soils

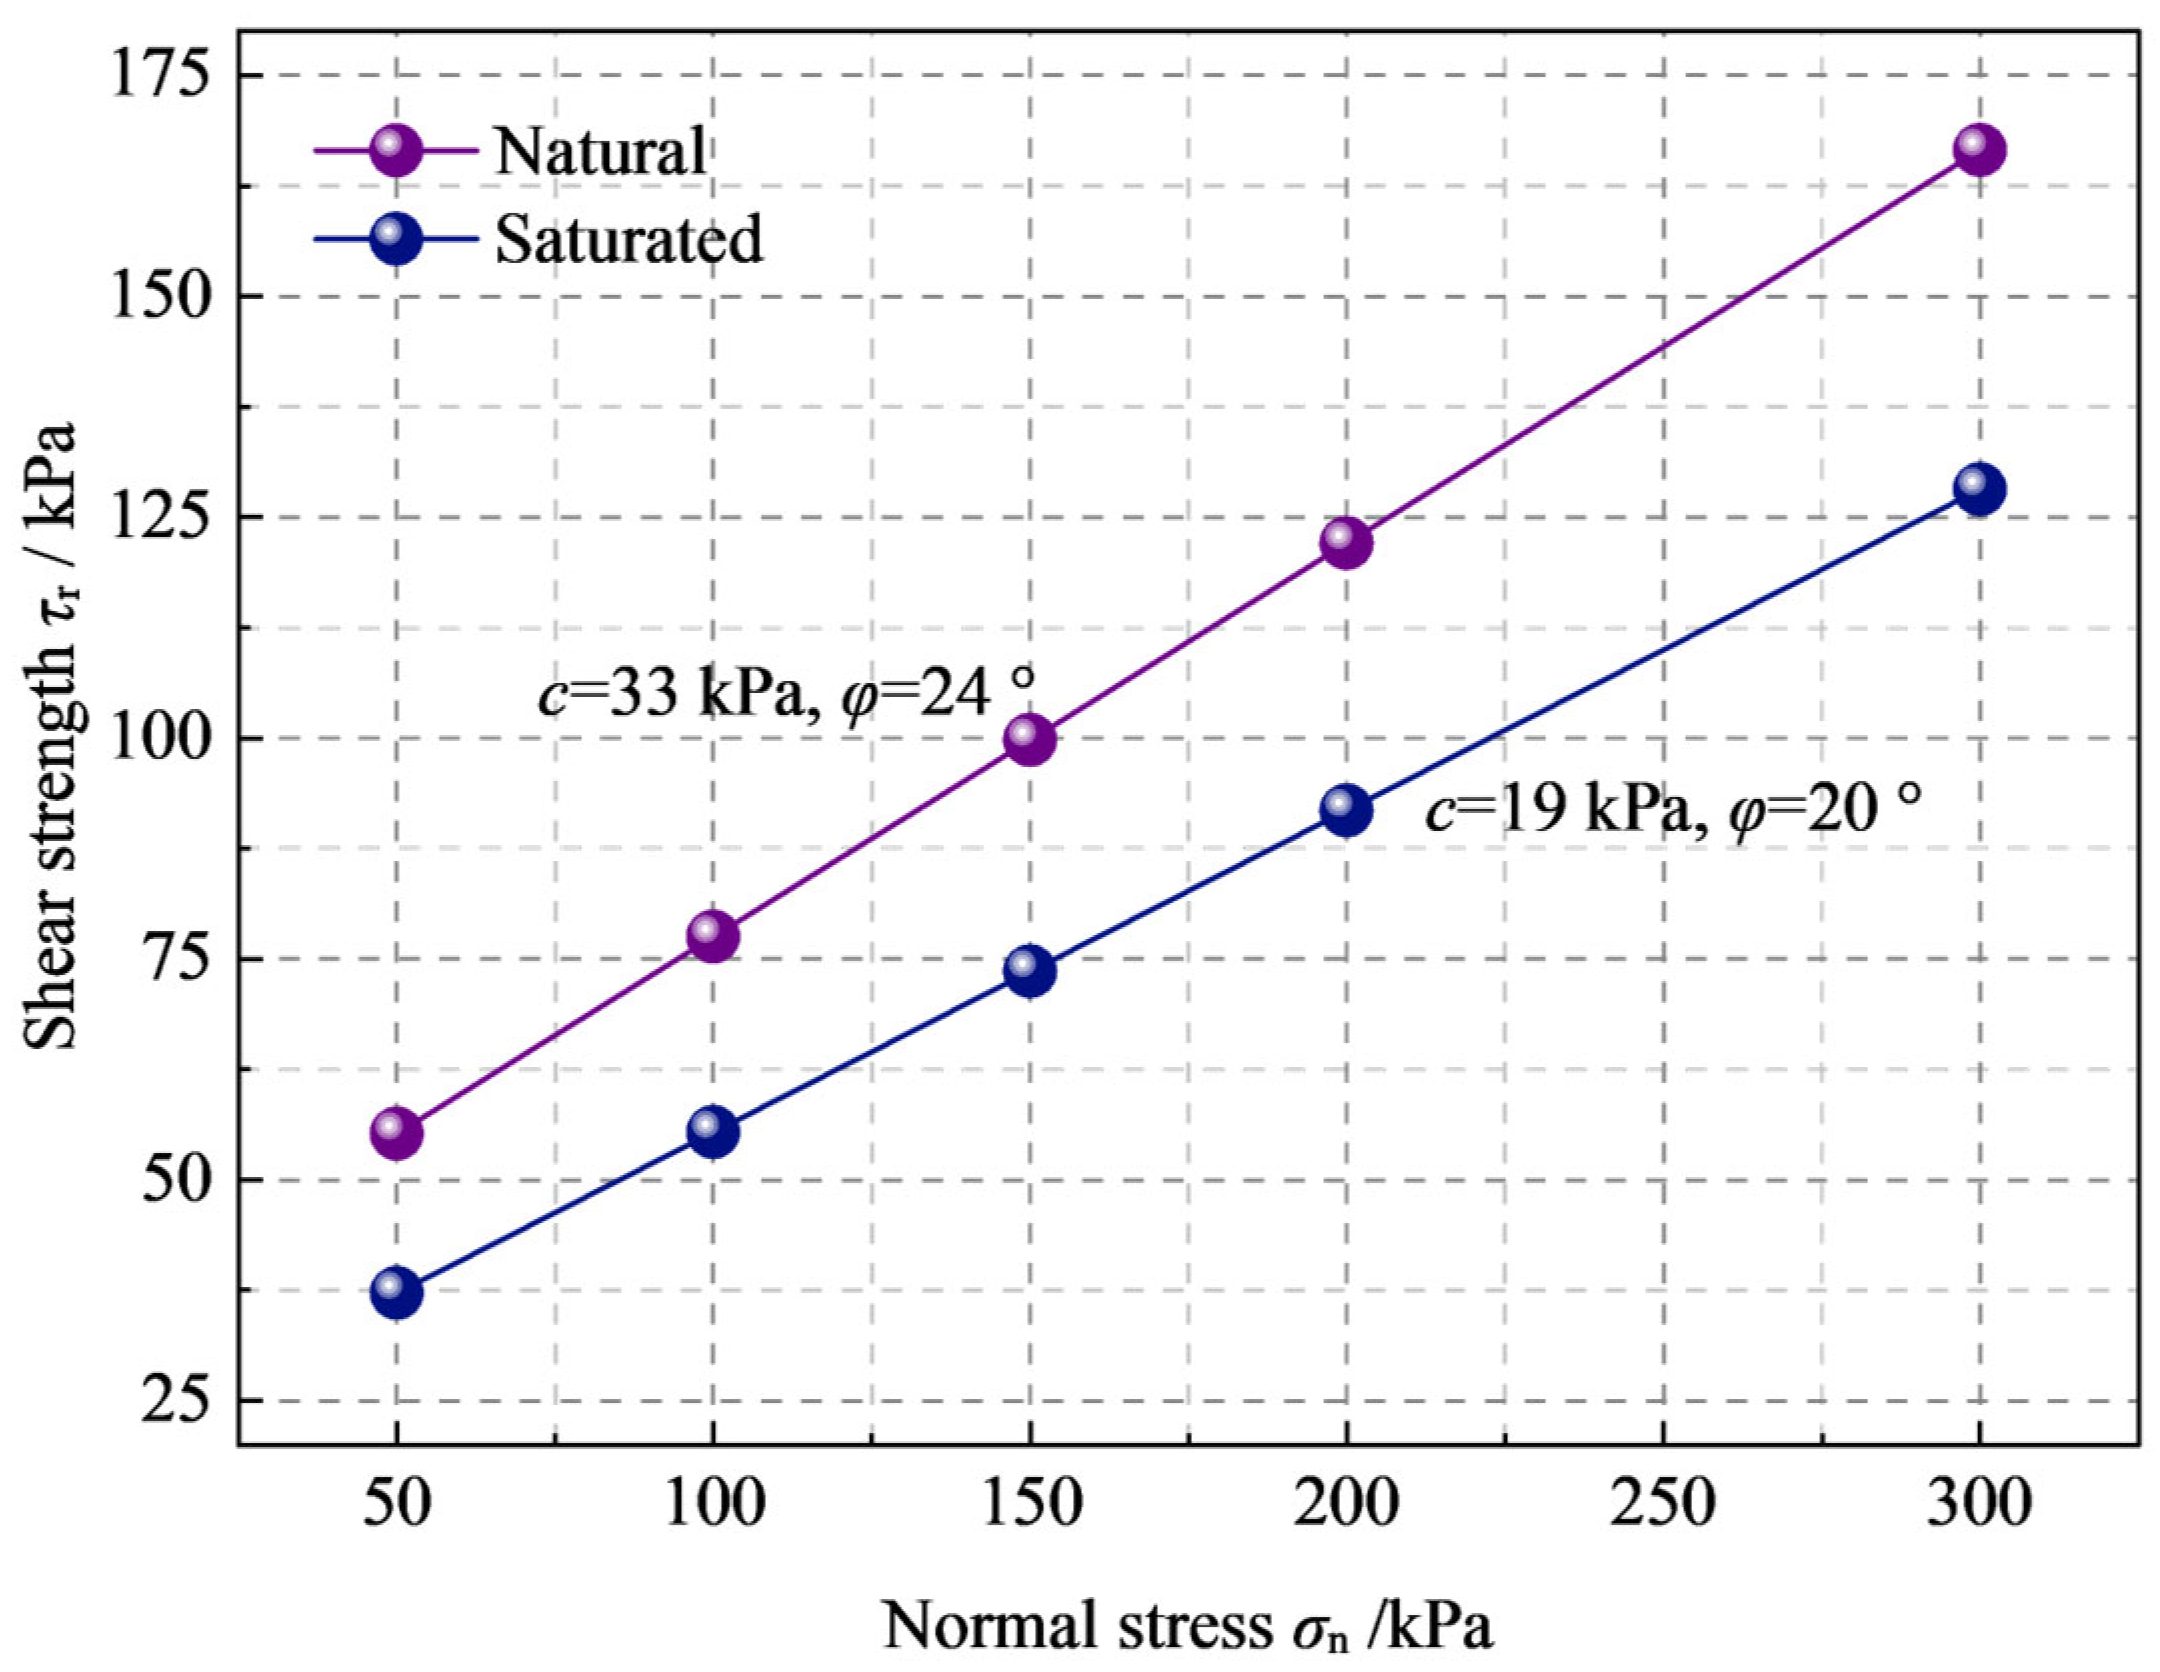
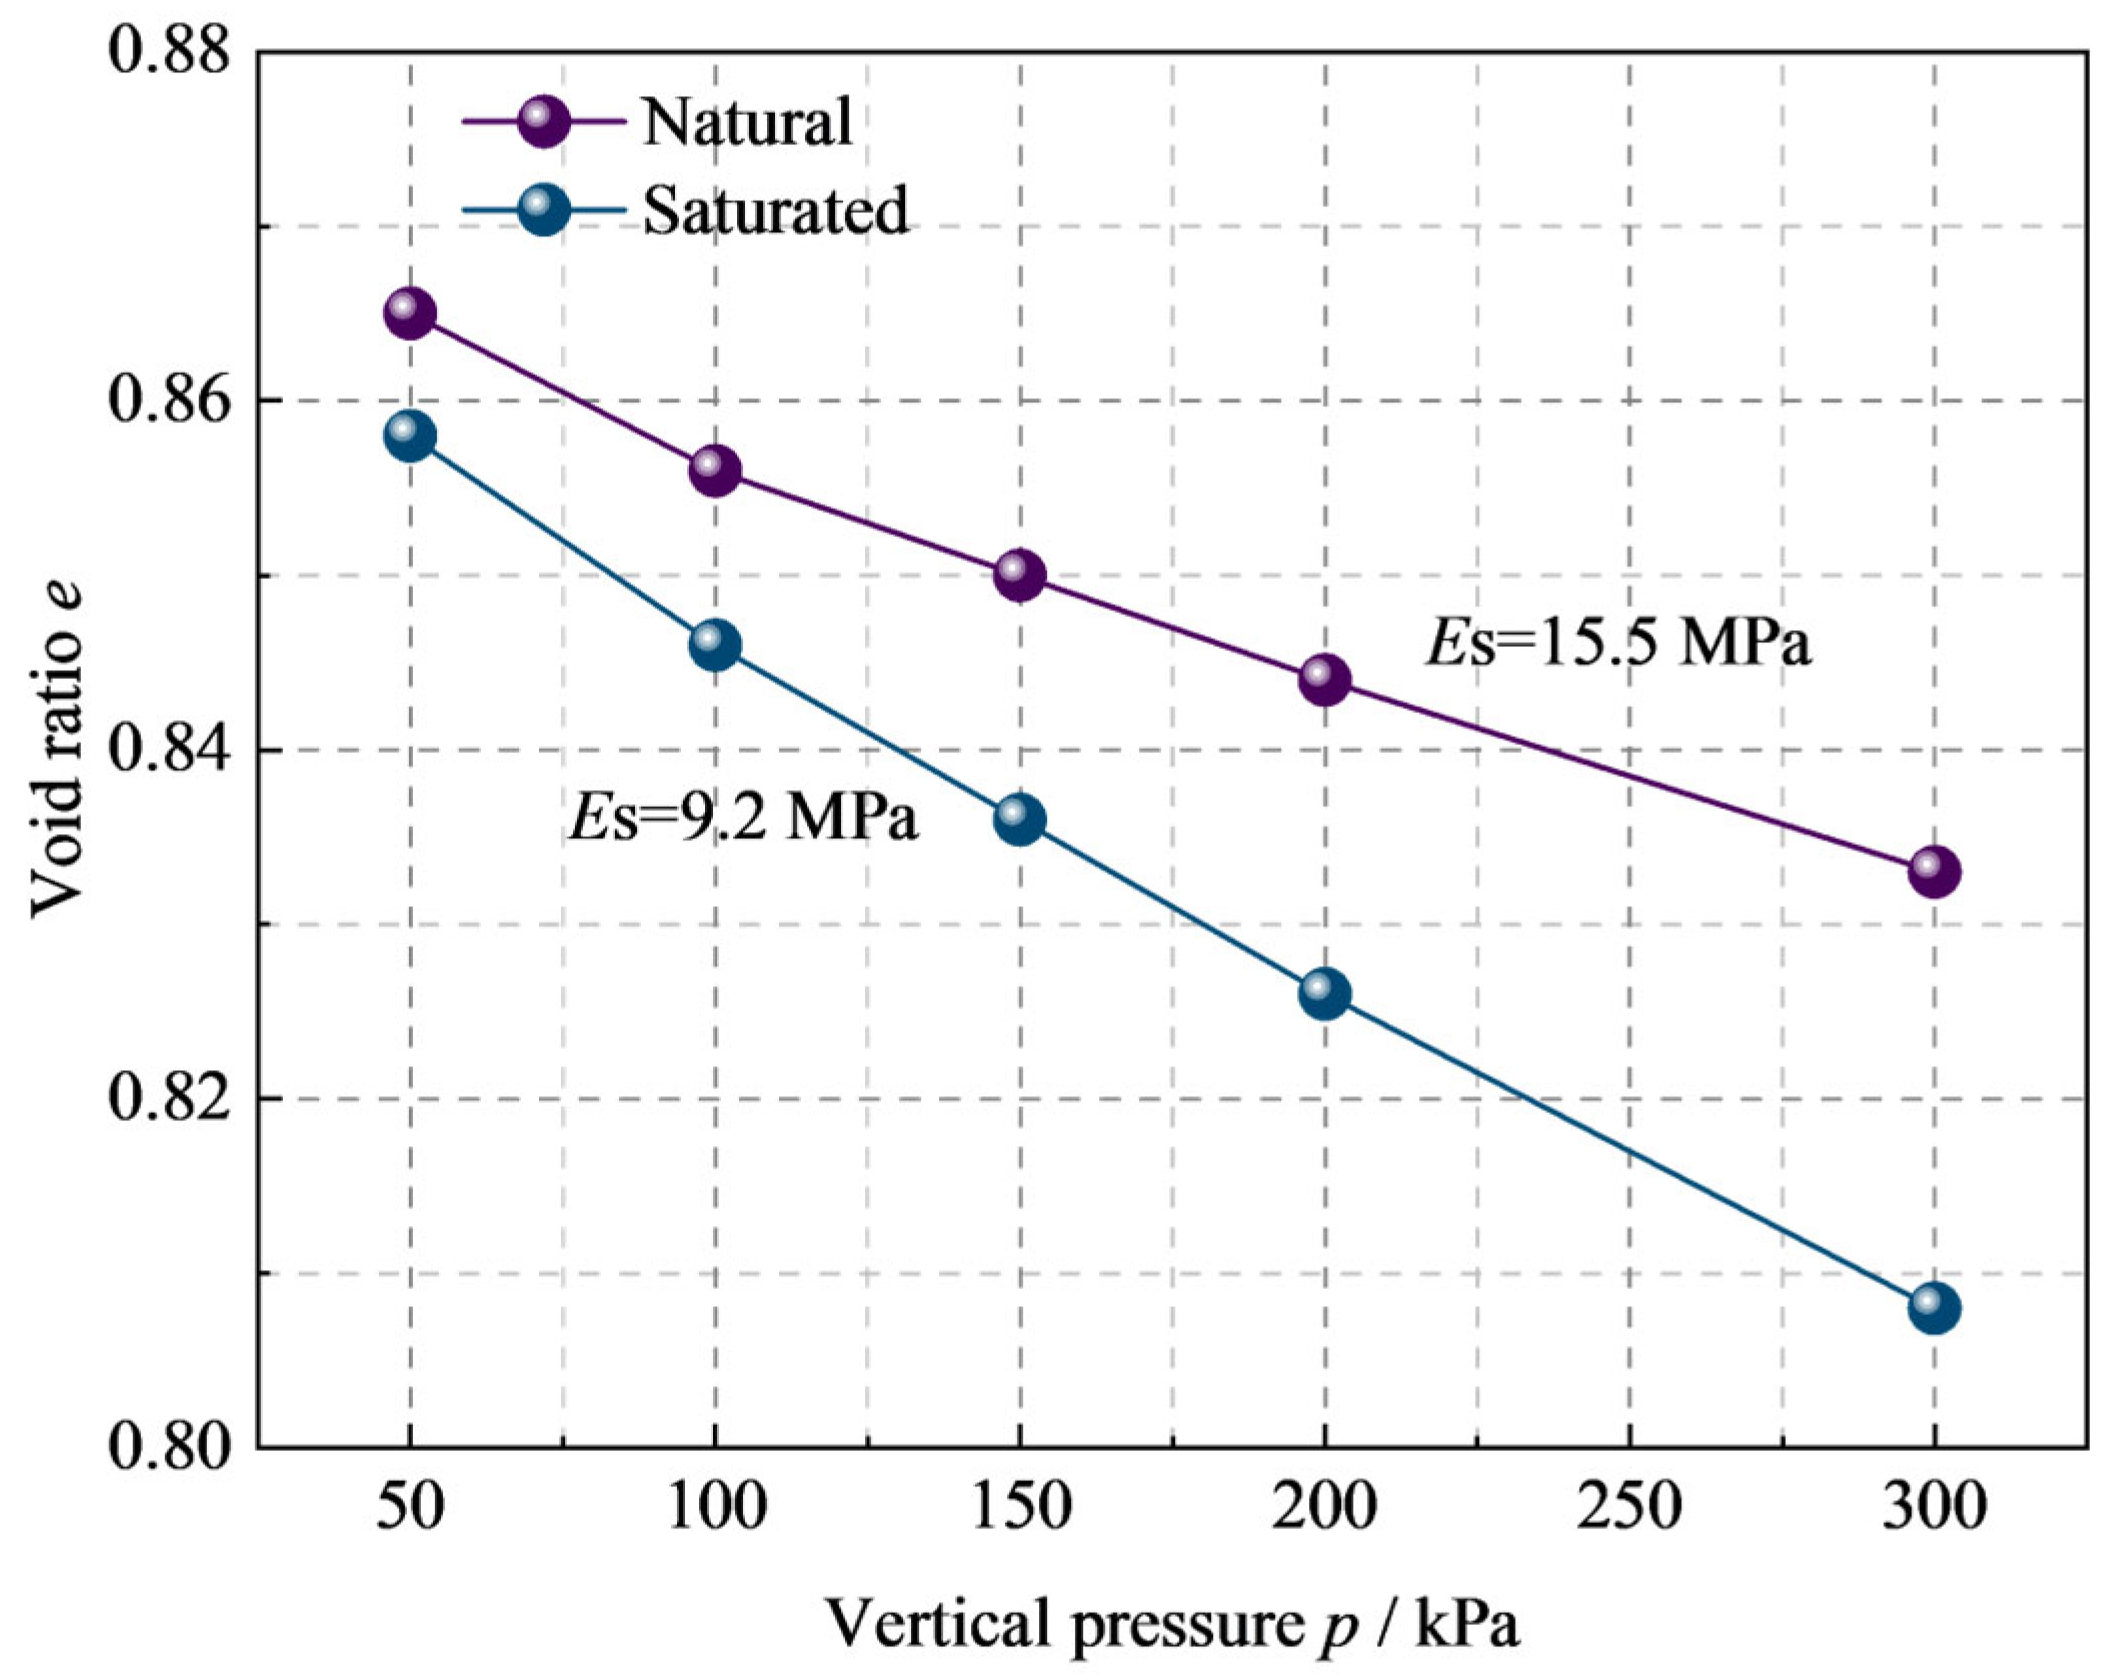
To further investigate the effects of water immersion on the mechanical properties of the foundation soil, direct shear tests and one-dimensional compression tests were conducted on undisturbed soil samples from borehole ZK2 under both natural and saturated conditions. By comparing the changes in shear strength parameters and compression deformation parameters before and after saturation, the water-induced softening characteristics of the soil were quantitatively evaluated. The test results are presented in Table 3 and Table 4 and Figure 6 and Figure 7.
The test results showed that both the shear strength and compressive stiffness of the soil decreased significantly after water immersion. Specifically, the cohesion decreased from 33 kPa to approximately 19 kPa, corresponding to a reduction of about 42.4%, while the internal friction angle decreased from 24° to approximately 20°. In addition, the compression modulus decreased from approximately 15.5 MPa to 9.2 MPa, yielding a modulus retention ratio of about 60%. These results demonstrate that water immersion markedly weakened the shear strength and resistance to compressive deformation of the soil, indicating pronounced water-induced softening behavior.
In summary, the building inclination resulted from the combined effects of structural deficiencies in the foundation soil and adverse water-related conditions. Insufficient compaction of the inter-pile soil led to a relatively low initial density and reduced structural stability of the foundation soil. Meanwhile, long-term water infiltration associated with the drainage system altered the moisture condition of the foundation soil, triggering wetting-induced collapse of the collapsible loess and further reducing its shear strength and compressive stiffness. Under the combined effects of structural weakening and water-induced mechanical degradation, the bearing performance of the foundation progressively deteriorated, leading to the accumulation of differential settlement and, ultimately, the continued inclination of the building.

4. Model Test

4.1. Similarity Relation

Based on similarity theory, a scale model was used in this test. The physical model test was conducted to investigate the deformation response and rectification effectiveness of staged underexcavation for an existing tilted high-rise building under collapsible-loess conditions. The size, geological conditions, model type, and material of the high-rise building and the production conditions were considered comprehensively [22]. Considering that the objective of this study was to investigate the deformation coordination mechanism during staged underexcavation rather than the bearing capacity of individual foundation components, an equivalent similarity approach was adopted [23]. The composite foundation system was simplified while maintaining the equivalent stiffness and deformation characteristics of the foundation–soil interaction system. The length L of the foundation soil layer, the elastic modulus E of the superstructure, the weight W of the foundation soil layer, and the cohesion c of the foundation soil were selected as the basic dimensions. The geometric similarity ratio CL = 1 × 10², the elastic modulus similarity ratio CE = 10, the unit weight similarity ratio CW = 1, the cohesion similarity ratio Cc = 10, and the similarity ratio of the remaining physical quantities were derived from the above dimensions (see Table 5).

4.2. Design of Model Test System

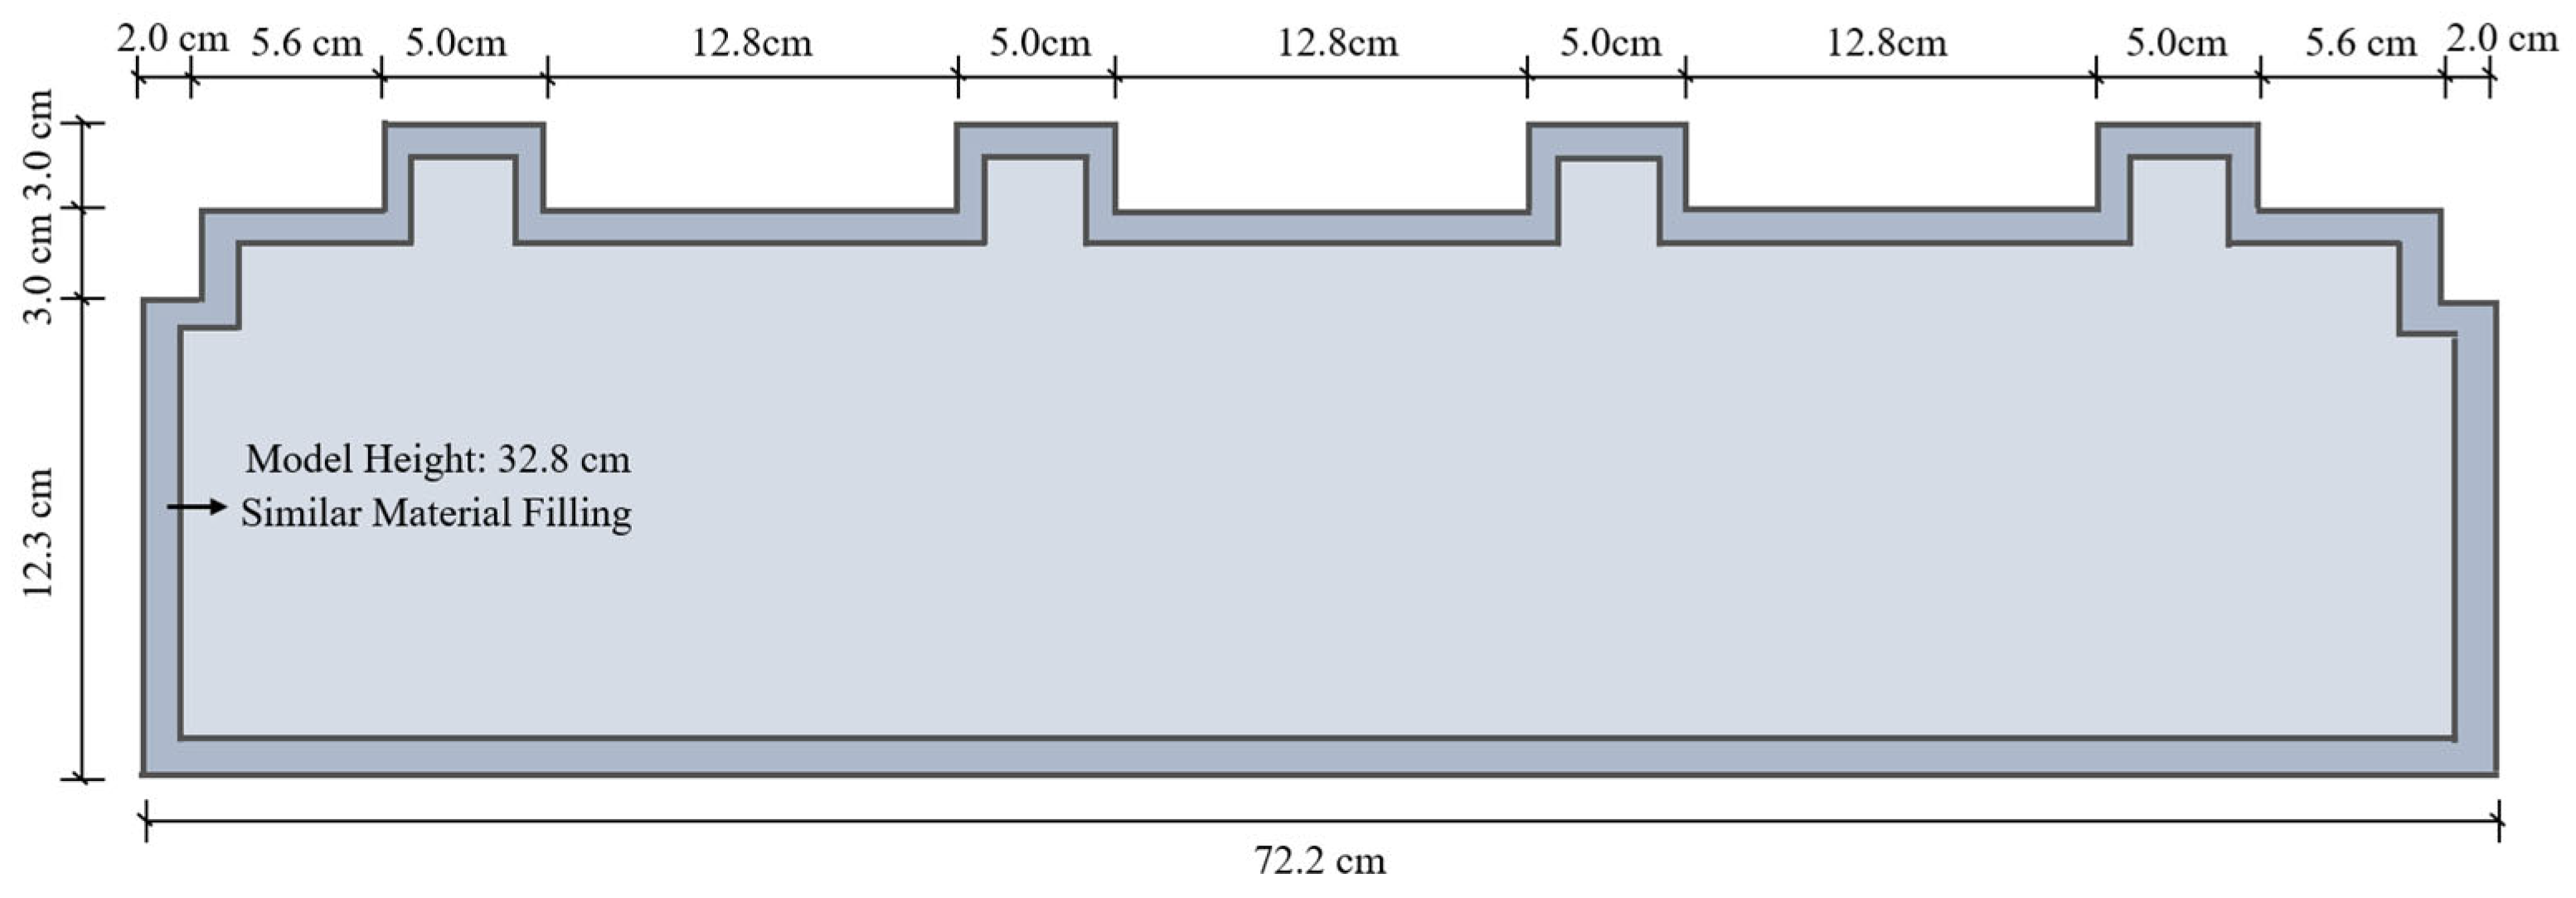
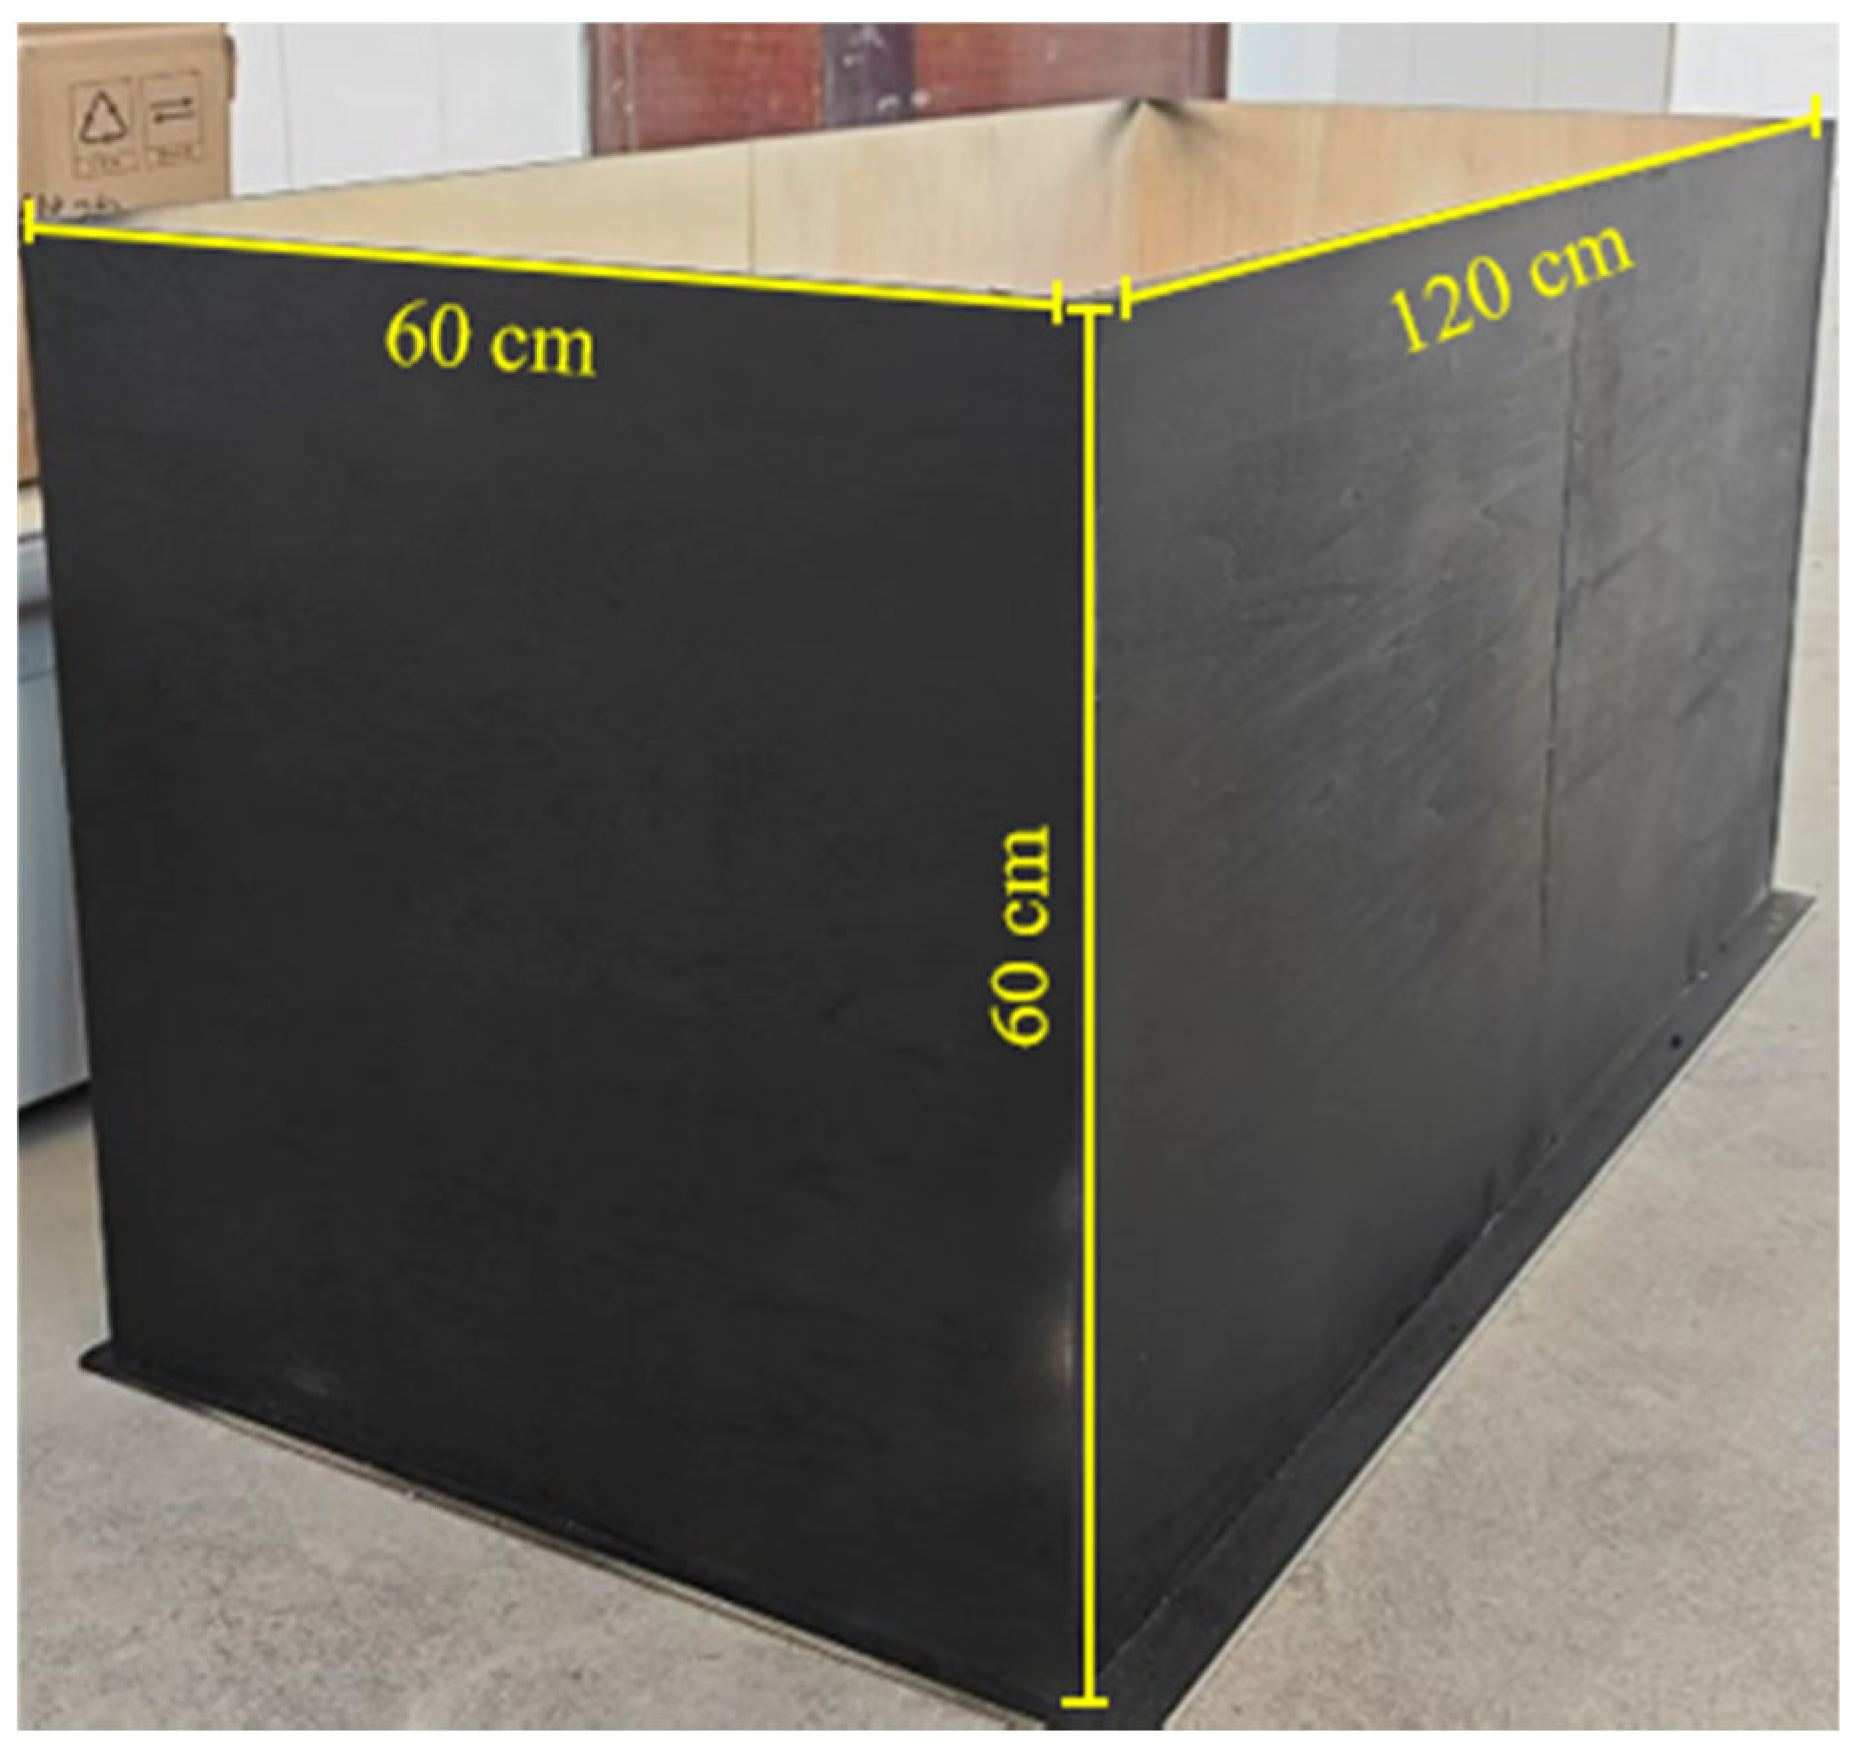
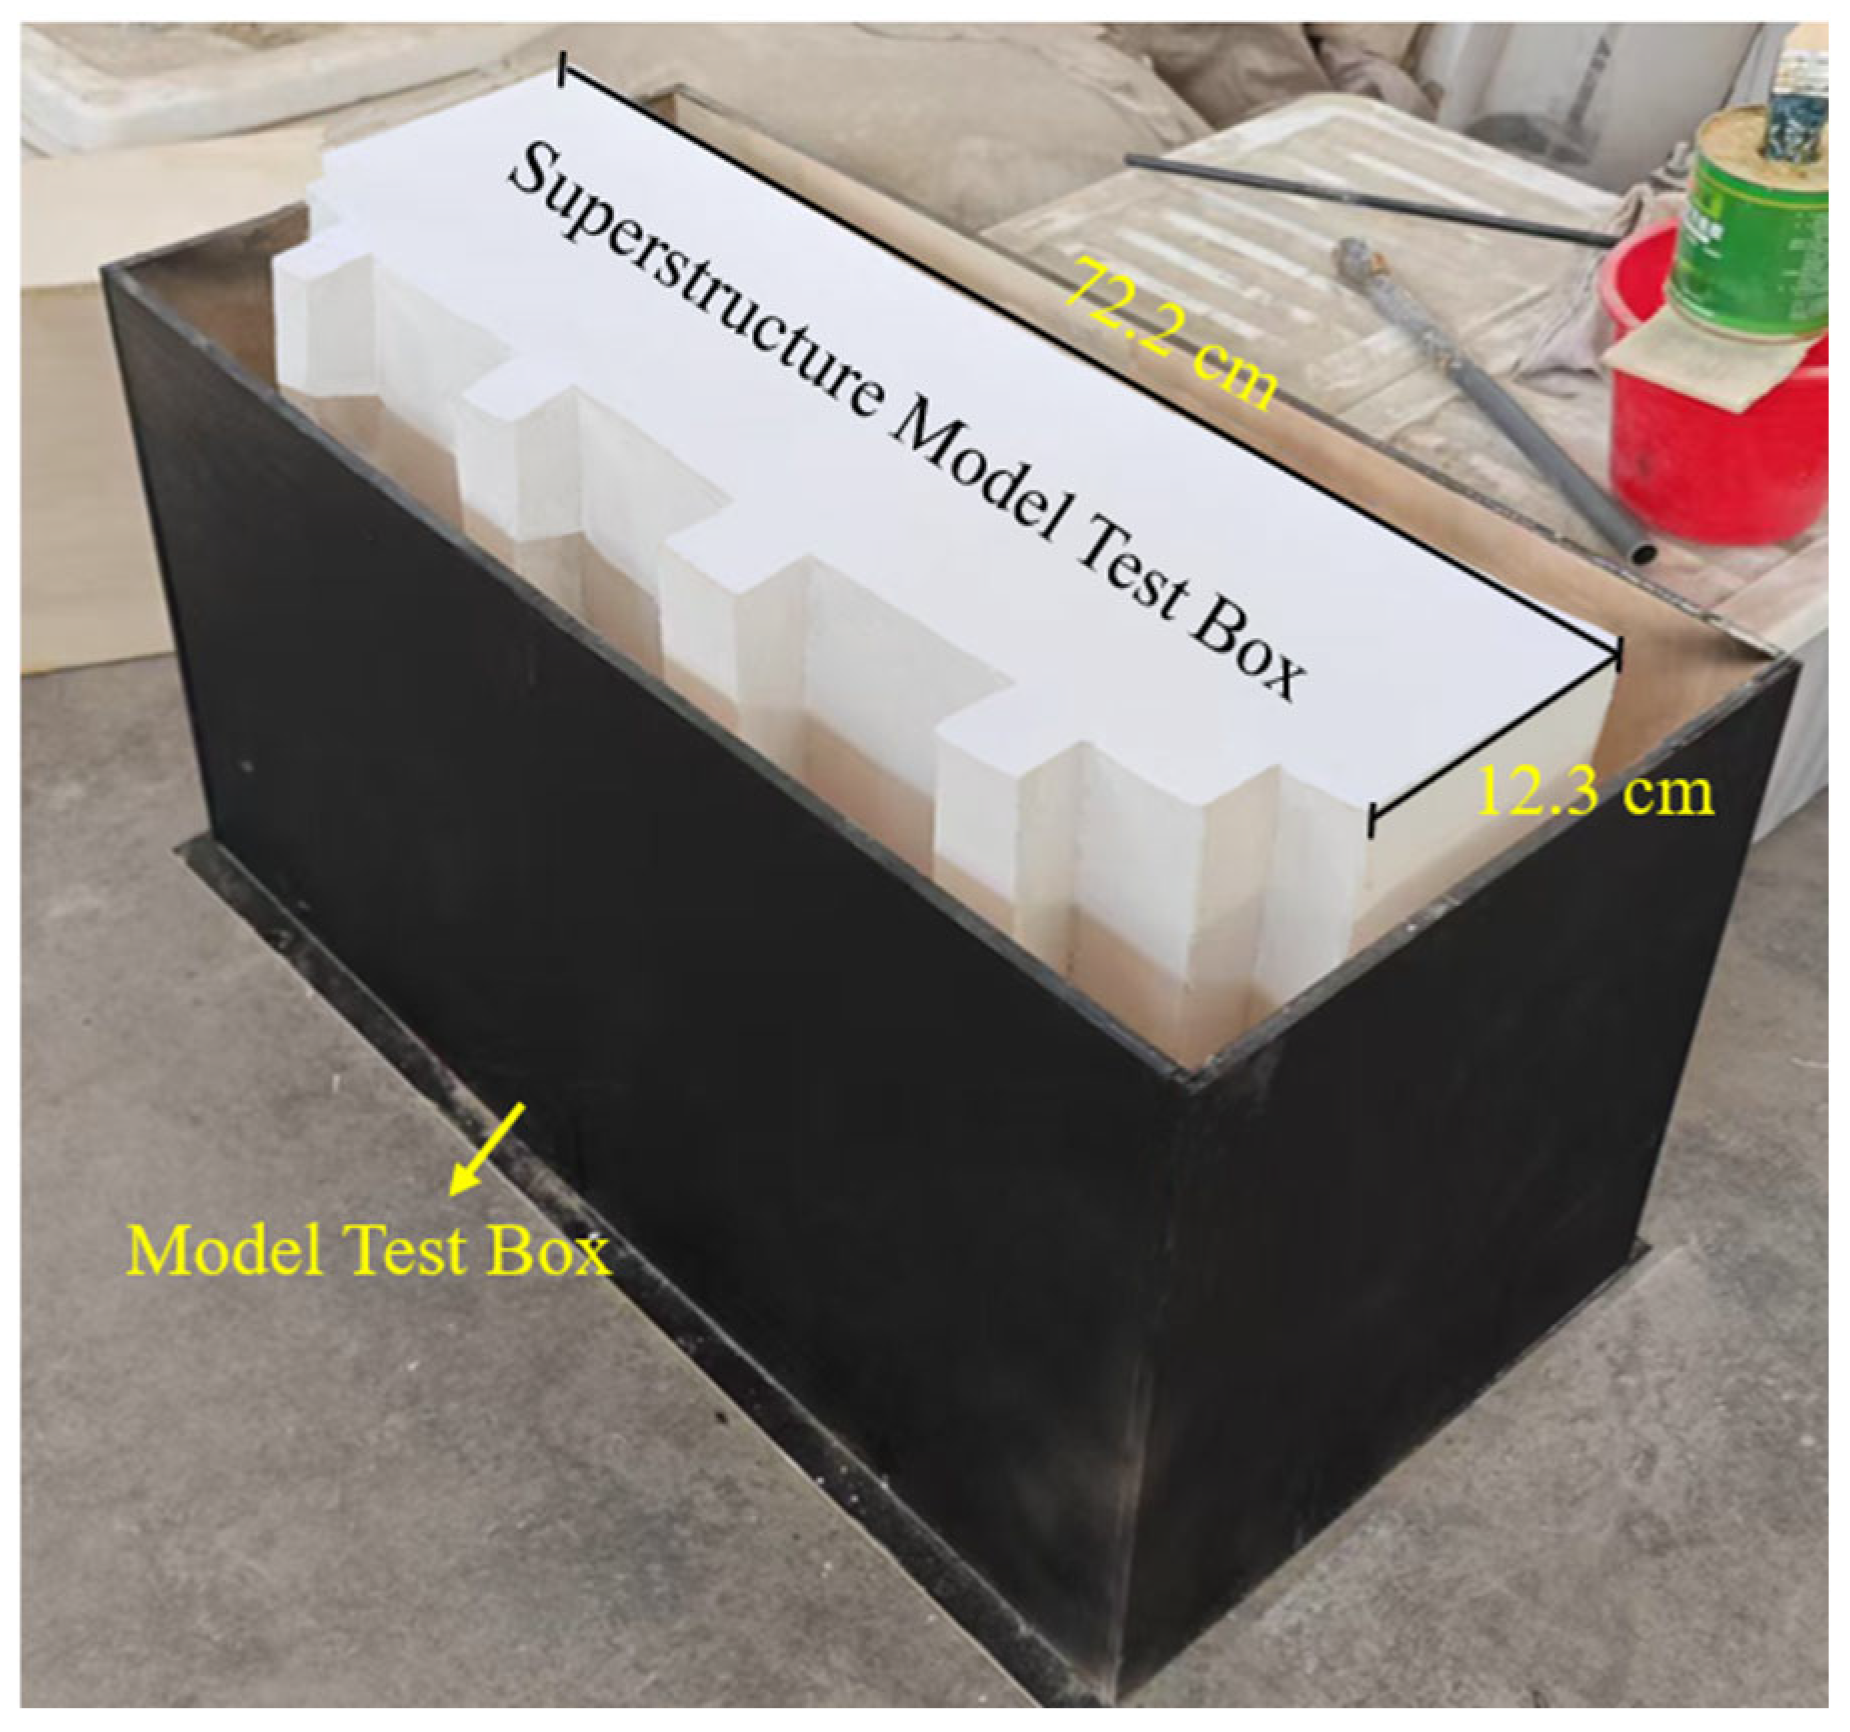
A 120 cm × 60 cm × 60 cm model test chamber (Figure 8) was designed to fill the soil layer and support the superstructure of the building. A high-strength composite plate with good isotropy and strong deformation stability was selected as the main material. At the same time, high-performance binders were used for structural bonding, and pre-stressed fixtures were used to assist curing to ensure that the connection nodes of each component met the design strength requirements. The height of the high-rise building was 32.8 m, and the height of the model building was 32.8 cm. The superstructure of the model building is shown in Figure 9 and Figure 10.

4.3. Similarity Material Preparation

(1)
Foundation Similarity Material Preparation
The prototype foundation system consists of a thick raft foundation supported by a composite foundation comprising compacted concrete piles and compacted soil piles, with the underlying geological profile mainly consisting of loess-like soil and strongly weathered mudstone. The objective of this study was to investigate the overall deformation response and correction mechanism of the building–foundation–soil interaction system during the staged underexcavation process, rather than to evaluate the load-bearing behavior of individual piles. Therefore, an equivalent simulation approach based on similarity theory was adopted to reasonably idealize the prototype foundation system. In the physical model test, the complex pile-soil composite foundation and multilayer geological structure were not reproduced individually; instead, equivalent foundation materials were employed to represent the macroscopic mechanical behavior resulting from the coupled interaction between the composite foundation and the underlying strata. Under the requirements of similarity criteria, the equivalent materials were developed by controlling key mechanical parameters, including the unit weight, cohesion, internal friction angle, and compression modulus, thereby effectively reproducing the settlement characteristics and mechanical response of the prototype foundation system.
Basic parameters such as the density and the specific gravity of the undisturbed soil were determined using the cutting ring method and the pycnometer method, respectively. The strength parameter, cohesion, was measured using the direct shear test. The test results are shown in Table 6.
According to the similarity relationship, the target values of the model test yellow clay parameters were as follows: W = 14.06 KN/m3, c = 3.3 KPa, φ = 24°, w = 14.35%, and ES = 1.55 MPa. Under the premise of meeting the weight and moisture content, the yellow clay layer in the model box was proposed to be composed of fine sand, slaked lime, sawdust, and water. The proportion of each material is shown in Table 7. The model materials meeting the target physical properties were validated using the direct shear test and confined compression test.
The physical properties of four different proportions of yellow clay similarity materials are shown in Table 8.
It can be seen from Table 8 that the physical properties of the similarity material in the ratio 4 model were closest to the physical properties of the target yellow clay, so this ratio was used for the foundation soil layer.
(2)
Structurally similar material preparation
The high-rise building was a reinforced concrete shear-wall structure. The concrete had an elastic modulus of 30 GPa. According to the similarity ratio of the elastic modulus, the elastic modulus of the structurally similar material was determined to be 3.0 GPa. The elastic modulus of a mixture of fly ash/gypsum/fine sand/water at a ratio of 25:45:30:45.5 was 3.06 GPa, which was close to 3.0 GPa.

4.4. Measuring Point Arrangement

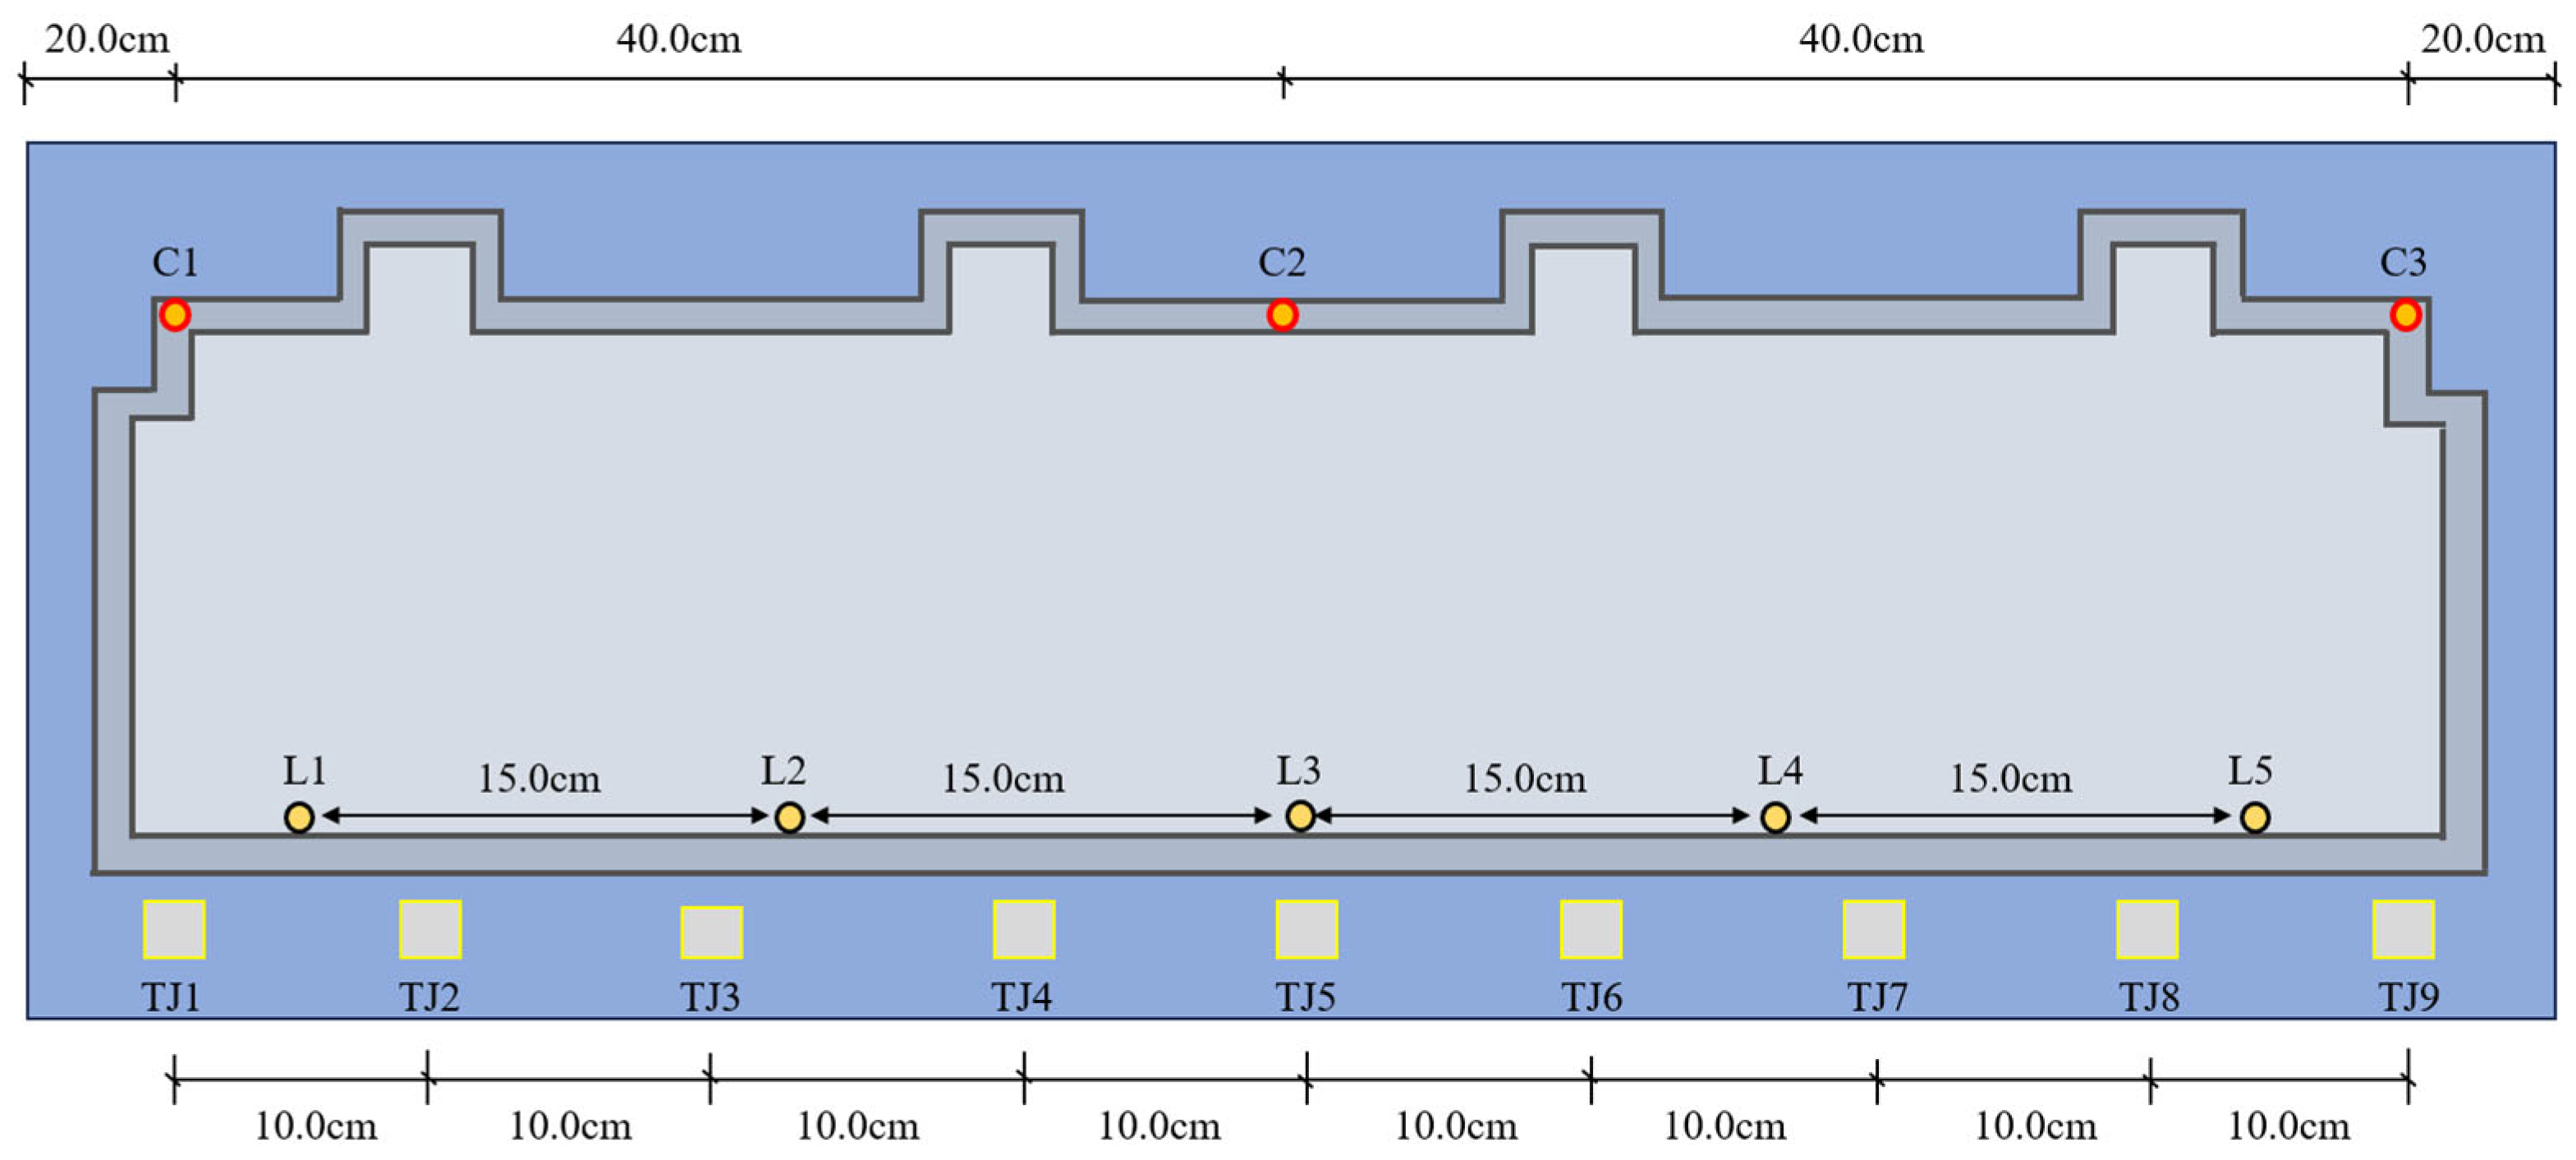
In order to study the performance of staged underexcavation on the rectification of high-rise buildings, monitoring points were arranged on both sides of the structural model. Considering that the excavation operation was conducted on one side of the excavation shafts (TJ1–TJ9), where the deformation sensitivity was relatively high and large deformation was expected to occur, real-time monitoring of the deformation response was required. Therefore, a MPS-M-1500MM-R wire displacement sensor was employed for dynamic displacement monitoring. The sensor has a measuring range of 1500 mm and a linearity accuracy of ±0.1% FS. A total of five monitoring points (L1–L5) were arranged, and the measurement system was calibrated before the commencement of the test. Meanwhile, high-precision magnetic dial indicators were installed as auxiliary measurement devices at three locations (C1–C3) to verify the reliability of the measured displacement evolution trend. The specific layout of the monitoring points is shown in Figure 11.

4.5. Test Scheme

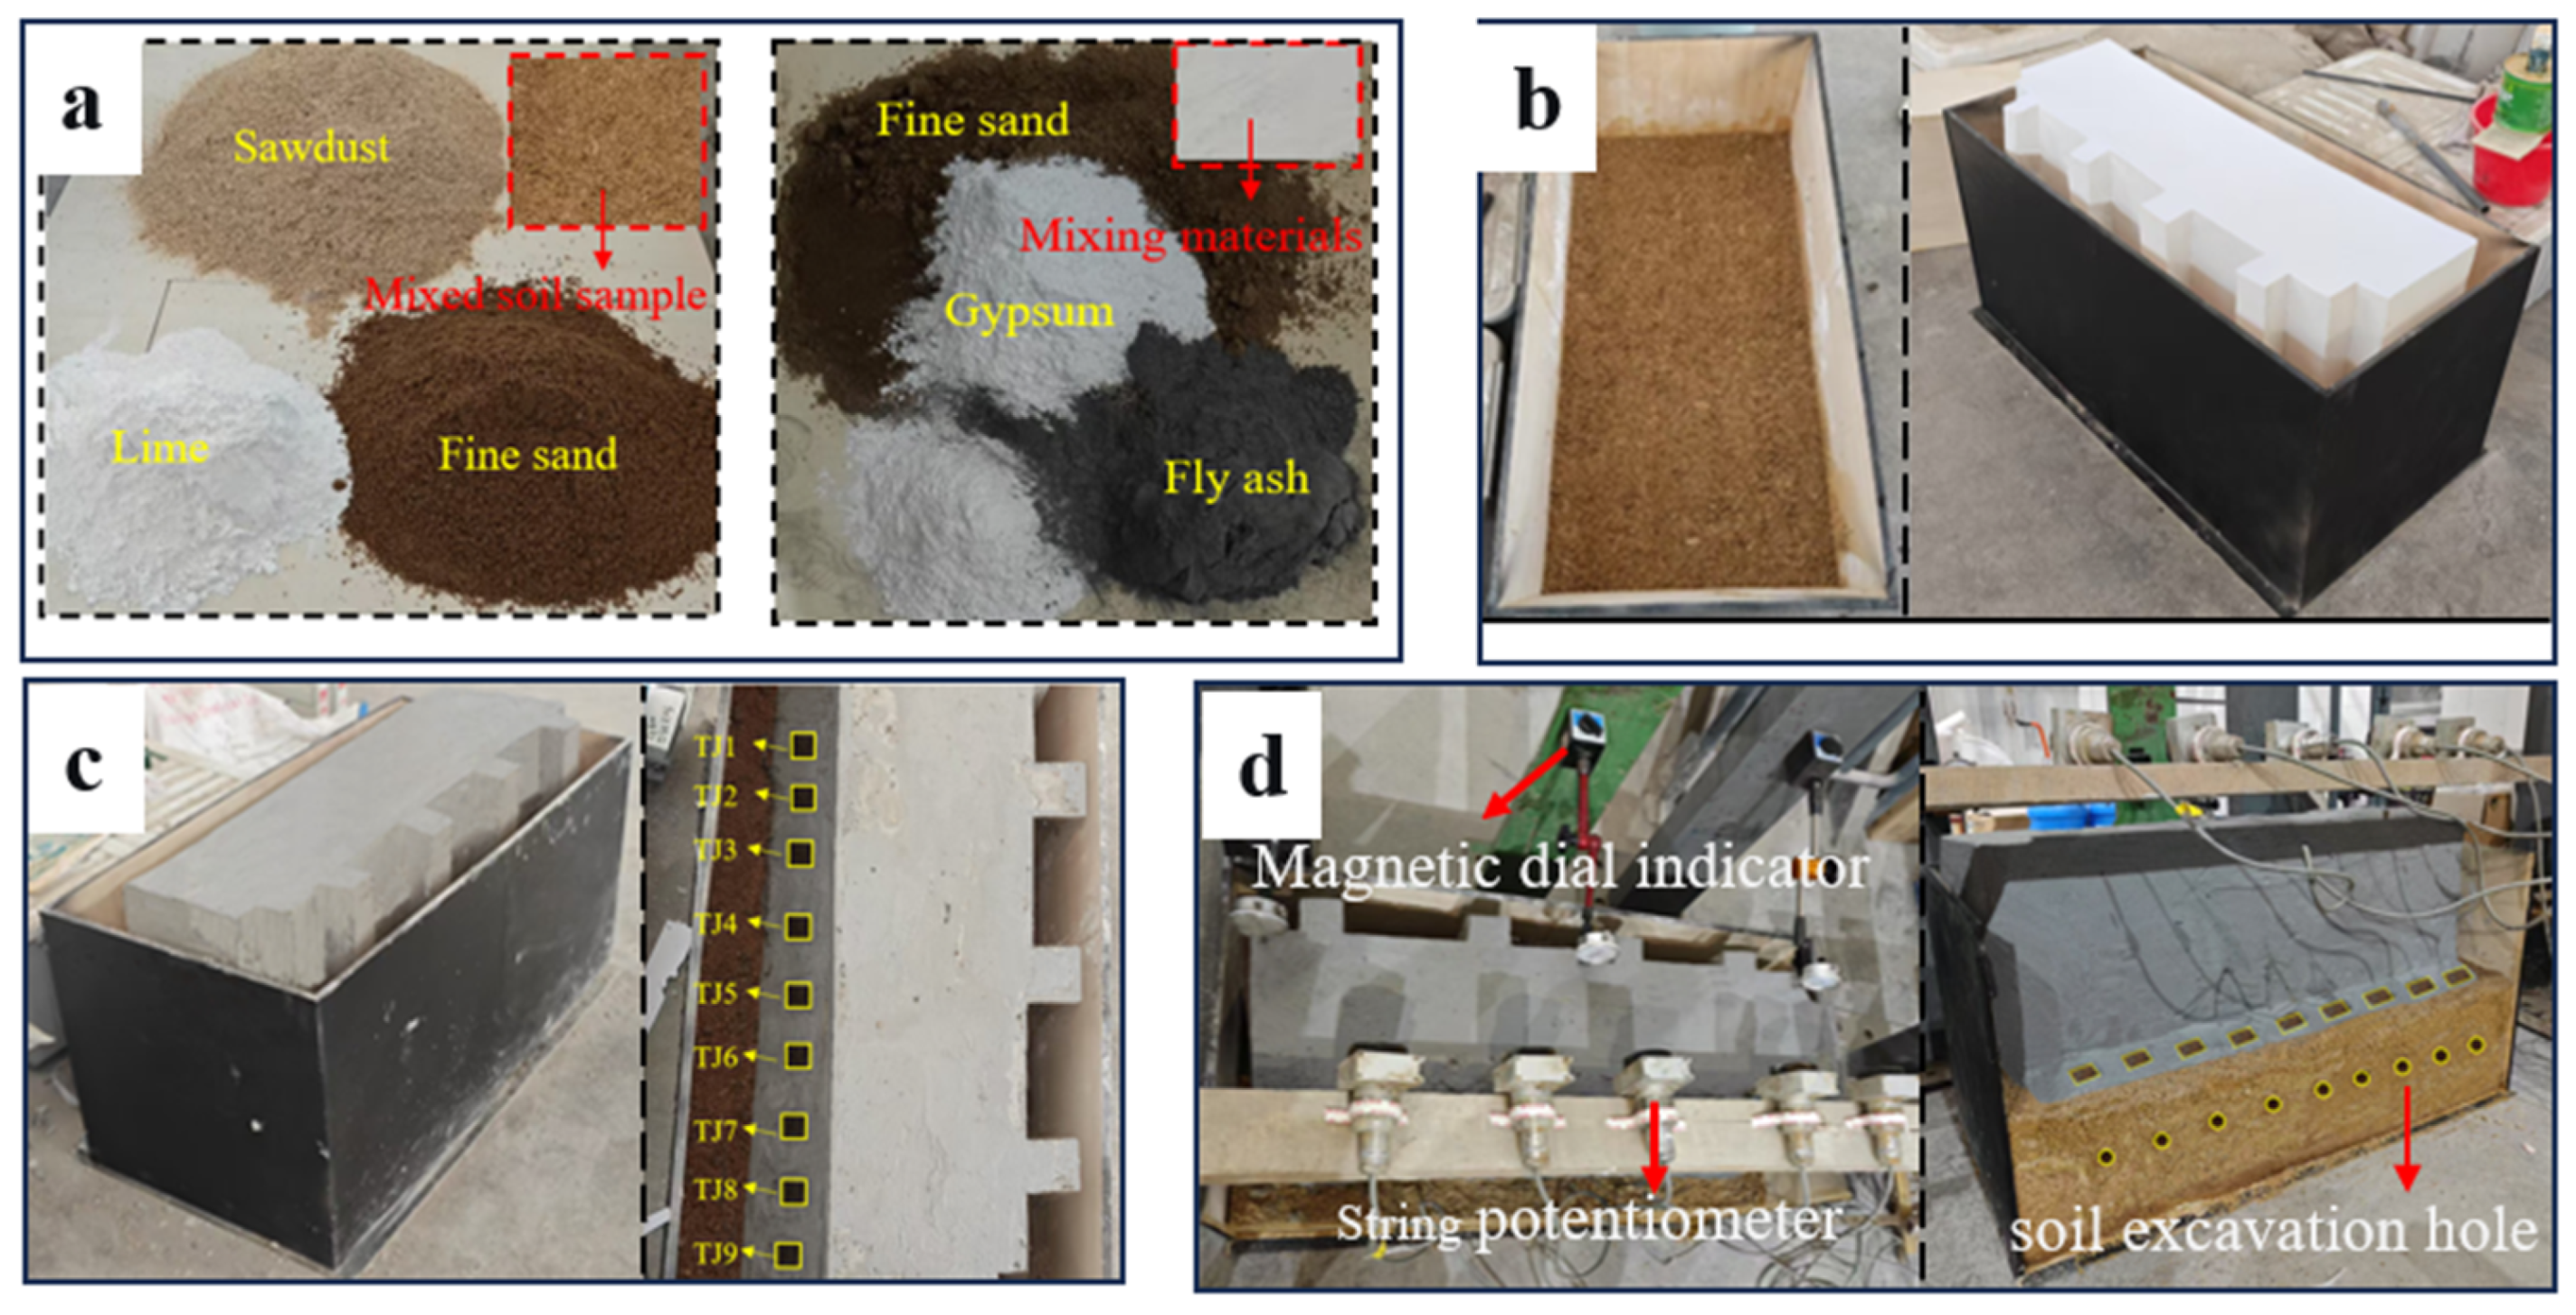
Initially, after preparing the similarity materials, the foundation soil were layered in the model box, and each layer was compacted to the design height. The density was guaranteed to meet the requirements. The upper structure was cast and molded using a plywood mold. After 14 days of maintenance, the formwork was removed and assembled with the foundation. After completion of the test model, nine simulated shafts (TJ1~TJ9) were excavated with dimensions of 30 mm × 20 mm × 60 mm. Five displacement sensors (L1–L5) and three magnetic absorption dial indicators (C1–C3) were synchronously installed to construct the displacement monitoring system.
Before conducting the staged underexcavation test, an initial inclined state corresponding to the prototype-building condition was first established in the physical model based on the measured settlement distribution characteristics. Field investigations indicated that the prototype building inclination was primarily caused by insufficient compaction of the inter-pile soil and the degradation of soil mechanical properties induced by long-term water infiltration, resulting in differential foundation settlement. Therefore, the initial deformation state was introduced by reproducing the differential settlement characteristics of the prototype foundation rather than by artificially adjusting the inclination of the superstructure. After completion of the model foundation and installation of the superstructure, the local deformation characteristics of the model foundation were controlled according to the measured settlement pattern of the prototype building, ensuring consistency in inclination direction, settlement distribution, and inclination magnitude. After the initial inclined state reached stability, the staged underexcavation test was performed to reproduce the deformation evolution and mechanical response of the actual inclined building during the correction process.
The inclination of the building was not caused by an initially inclined superstructure but instead primarily resulted from differential settlement beneath the foundation. The differential settlement induced rotation of the raft foundation and shifted the line of action of the building load relative to the foundation center, thereby generating additional bending moments and a non-uniform contact pressure distribution at the foundation–soil interface. Therefore, no external eccentric load was directly applied in the present physical model test. Instead, the differential settlement pattern of the prototype foundation was reproduced, allowing the model foundation to undergo the corresponding rotational deformation and naturally reproduce the settlement-induced load eccentricity effect.
Finally, the rear side baffle of the model box was removed to provide operational space, and the shaft excavation was completed in three stages to achieve inclination correction. In the first stage, the excavation holes were arranged at equal distances of 30 cm, and the volume of soil excavated was 1.2 × 10⁻⁴ m3. After each stage of excavation was completed, the model was left standing for 3 days. Then, the displacement response was monitored in real time using a data acquisition instrument and magnetic displacement dial indicator. In the second stage, the excavation holes were interpolated between the first row of holes to ensure uniform coverage of the disturbance area, and the volume of soil excavated was 1.0 × 10⁻⁴ m3. In the third stage, the excavation holes were optimized and reinforced in the formed excavation network, and the volume of soil excavated was 0.8 × 10⁻⁴ m3. During the test, continuous monitoring was carried out until the settlement displacement at each measuring point stabilized (the displacement change of 24 h was less than 0.01 mm). The test process is shown in Figure 12.
According to similarity theory, the geometric similarity ratio adopted in the physical model test was CL = 100, and the corresponding volume similarity ratio can be expressed as follows:
C V = C L 3 = 100 3 = 10 6
To ensure consistency between the physical model test and the prototype-scale numerical simulation, the excavation volumes in the physical model were converted into prototype-scale excavation volumes based on the volume similarity relationship. During the test, the excavation volumes in the first, second, and third stages were 1.2 × 10⁻⁴ m3, 1.0 × 10⁻⁴ m3, and 0.8 × 10⁻⁴ m3, respectively. According to the volume similarity ratio, these values correspond to prototype-scale excavation volumes of 120 m3, 100 m3, and 80 m3, respectively. Therefore, the cumulative excavation volume obtained from the physical model test was converted to 300 m3 at the prototype engineering scale, which is consistent with the excavation volume adopted in the numerical simulation.

4.6. Experiment Results and Analysis

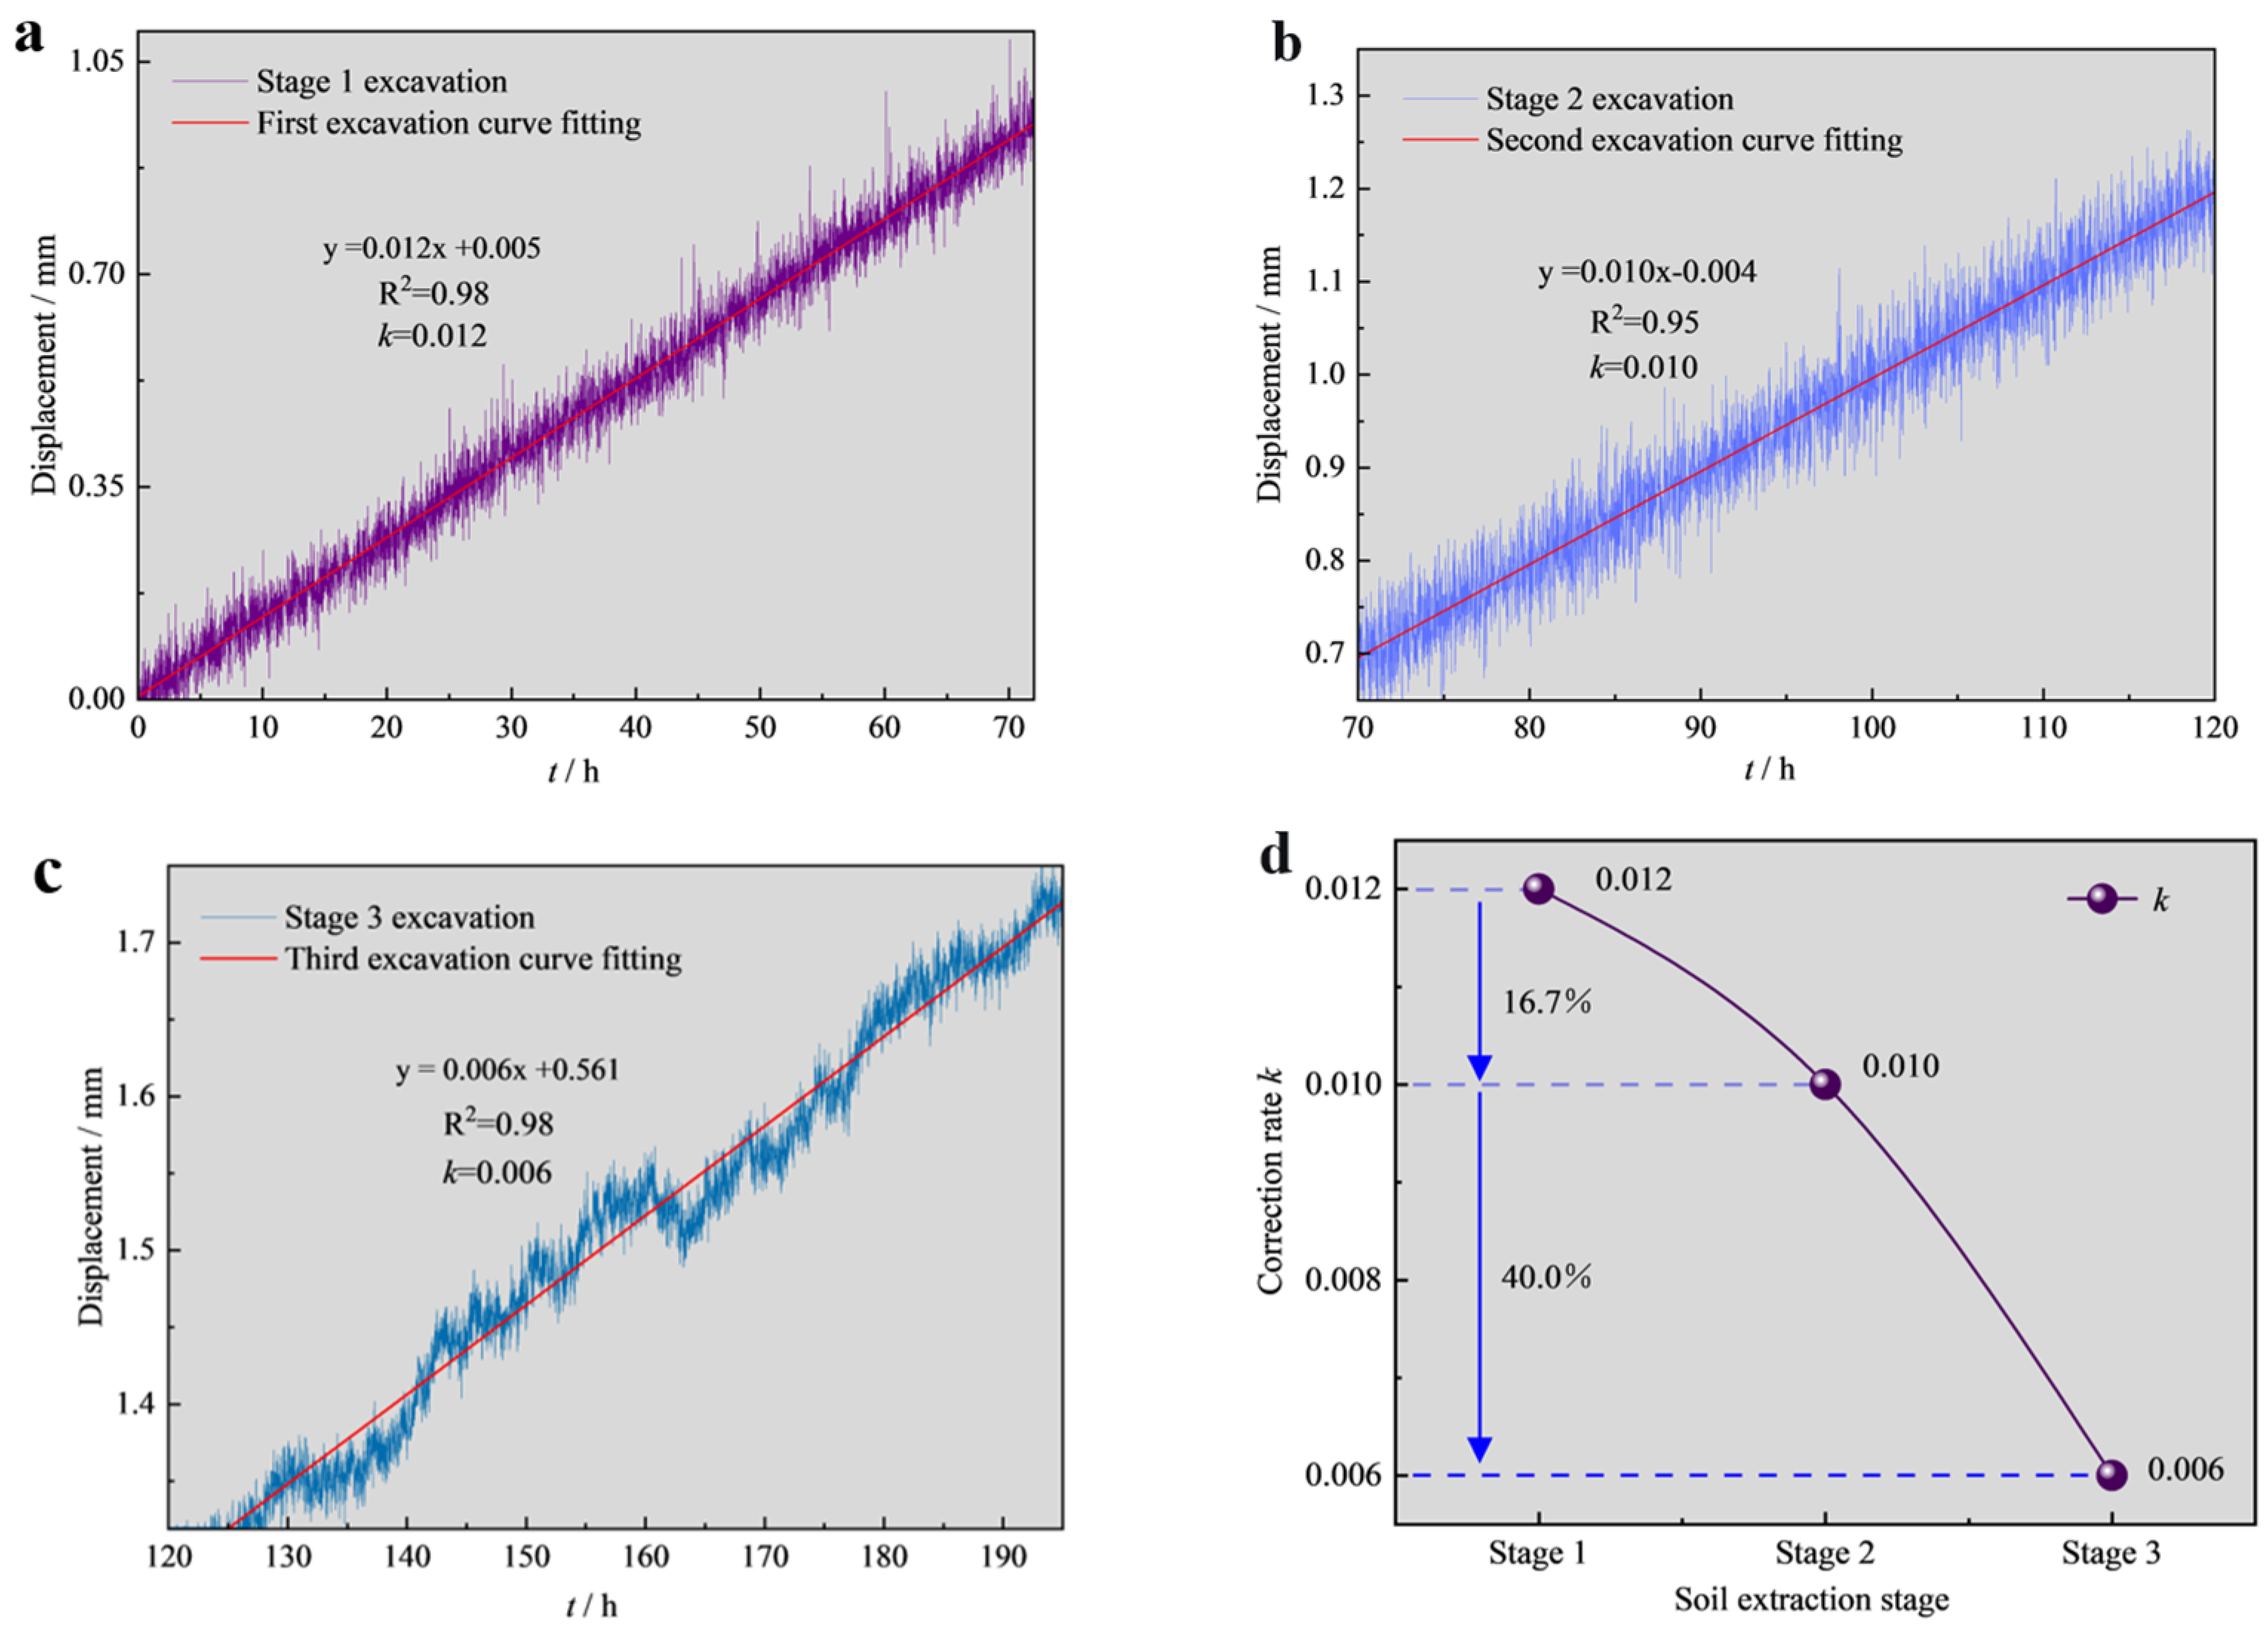
In the physical model test of staged underexcavation of high-rise buildings, the real-time monitoring and recording of the building’s back-dip deformation characteristics during the step-by-step excavation process were mainly achieved using cable displacement sensors and magnetic dial indicators. The overall deformation law of the model was quantitatively characterized by capturing the displacement changes at each measuring point. The results are shown in Figure 13.
According to the test results, the settlement of the model building after the first stage of soil excavation (1.2 × 10⁻⁴ m3) was 0.85 mm. The volume of soil extracted in the second excavation stage was adjusted to 1.0 × 10⁻⁴ m3, and the settlement increased to 1.33 mm, which was 0.48 mm higher than in the first stage. The volume of soil extracted in the third excavation stage was further reduced to 0.8 × 10⁻⁴ m3, and the settlement was 1.76 mm, which was 0.43 mm higher than in the second stage. The cumulative rectification settlement of the test was 1.76 mm, and the rectification settlement was 176 mm according to the similarity relationship. The actual maximum tilt displacement of the high-rise building was 211.6 mm (Figure 1), the correction rate was 83.17%, and the residual tilt was 16.83%. The results fell within the allowable limits of engineering control [24].
In terms of the settlement increment of each stage, the increments of the three stages were 0.85 mm, 0.48 mm, and 0.43 mm, respectively. The increment of the second stage decreased by 43.5% compared to the first stage, and that of the third stage decreased by 10.4% compared to the second stage, showing obvious nonlinear decreasing characteristics. In the initial stage, the tilt potential energy of the building was significant, and the stress concentration of the foundation was high. The first excavation caused the sudden release of stress and generated a strong rectification driving force, so the settlement response was the most sensitive. The inclination of the building gradually decreased with advancing excavation stages. The positive moment was nonlinearly attenuated, the soil damage in the excavation area accumulated, the plastic zone was penetrated, and the effective bearing capacity was significantly reduced. In addition, the building–foundation–soil system progressively approached a new equilibrium state, and the correction increment generated by each subsequent stage was reduced. The process demonstrated the characteristics of fast initial response and progressive deceleration.
Although the rectification increment decreased with successive excavation stages, staged underexcavation enabled a progressive and controllable adjustment of the building–foundation–soil system, thereby avoiding abrupt changes in the rectification response.


5. Numerical Simulation

A numerical simulation was performed to compare the mechanical response and correction performance of the one-time and staged underexcavation schemes, which could not be directly evaluated using the physical model test.
5.1. Numerical Modeling

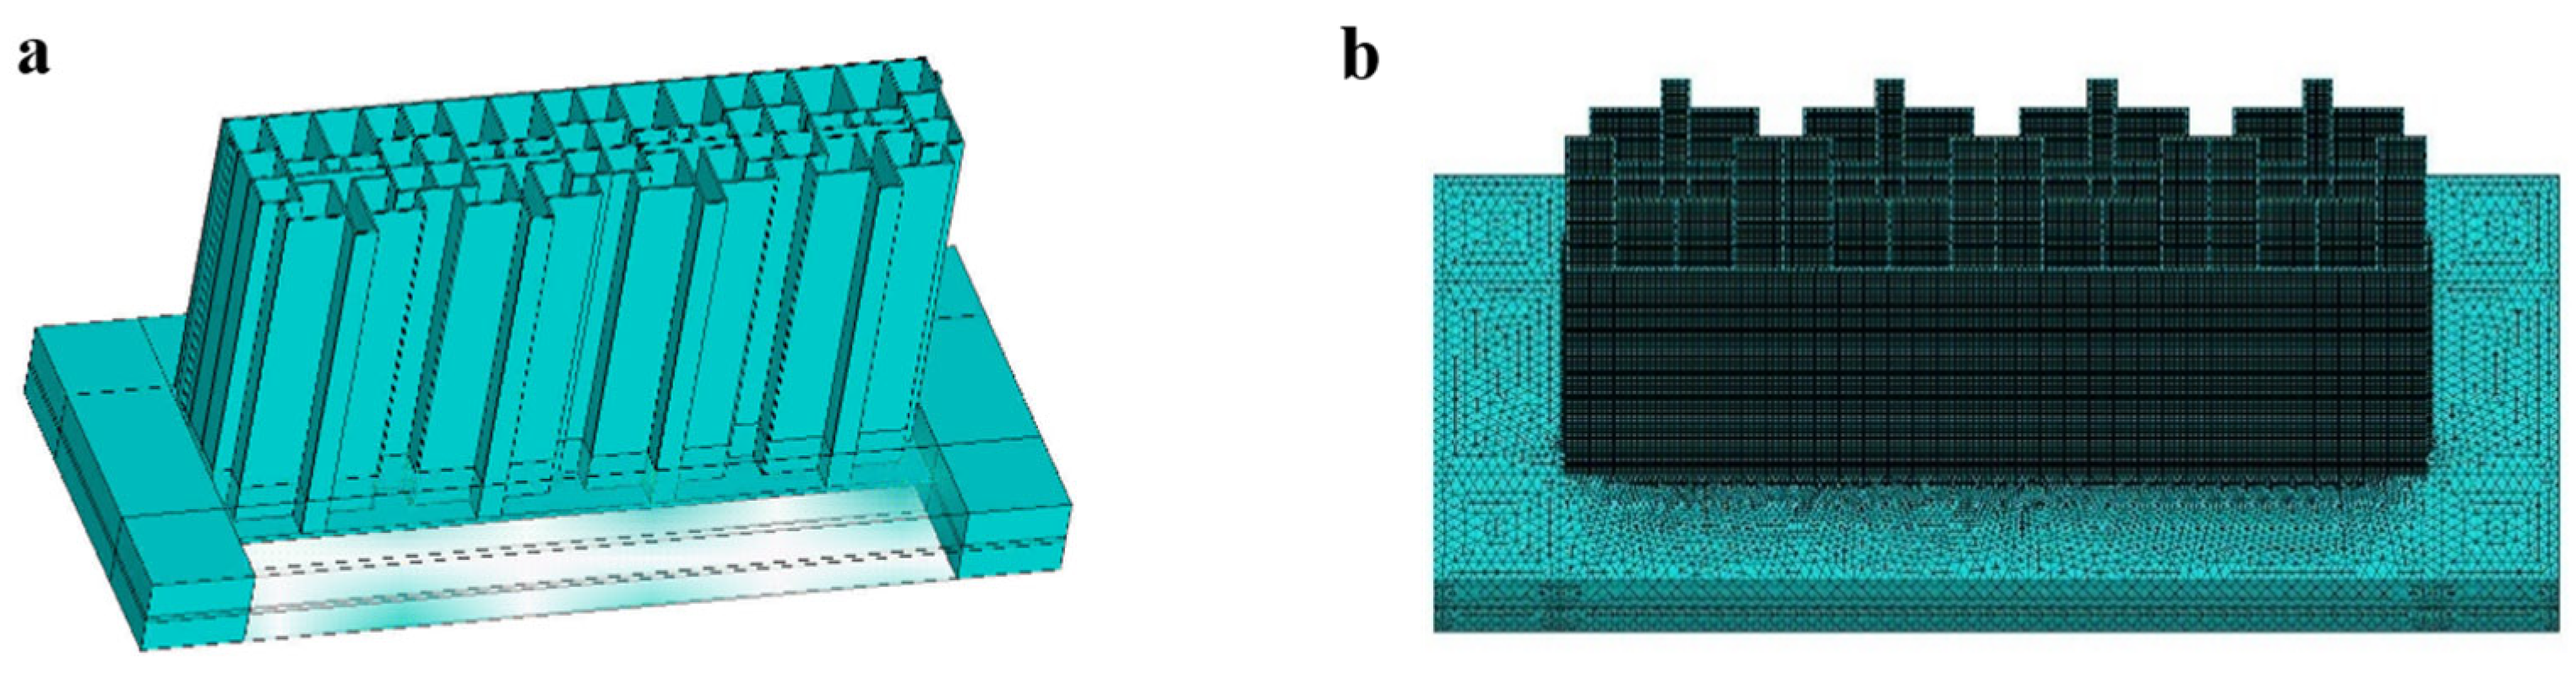
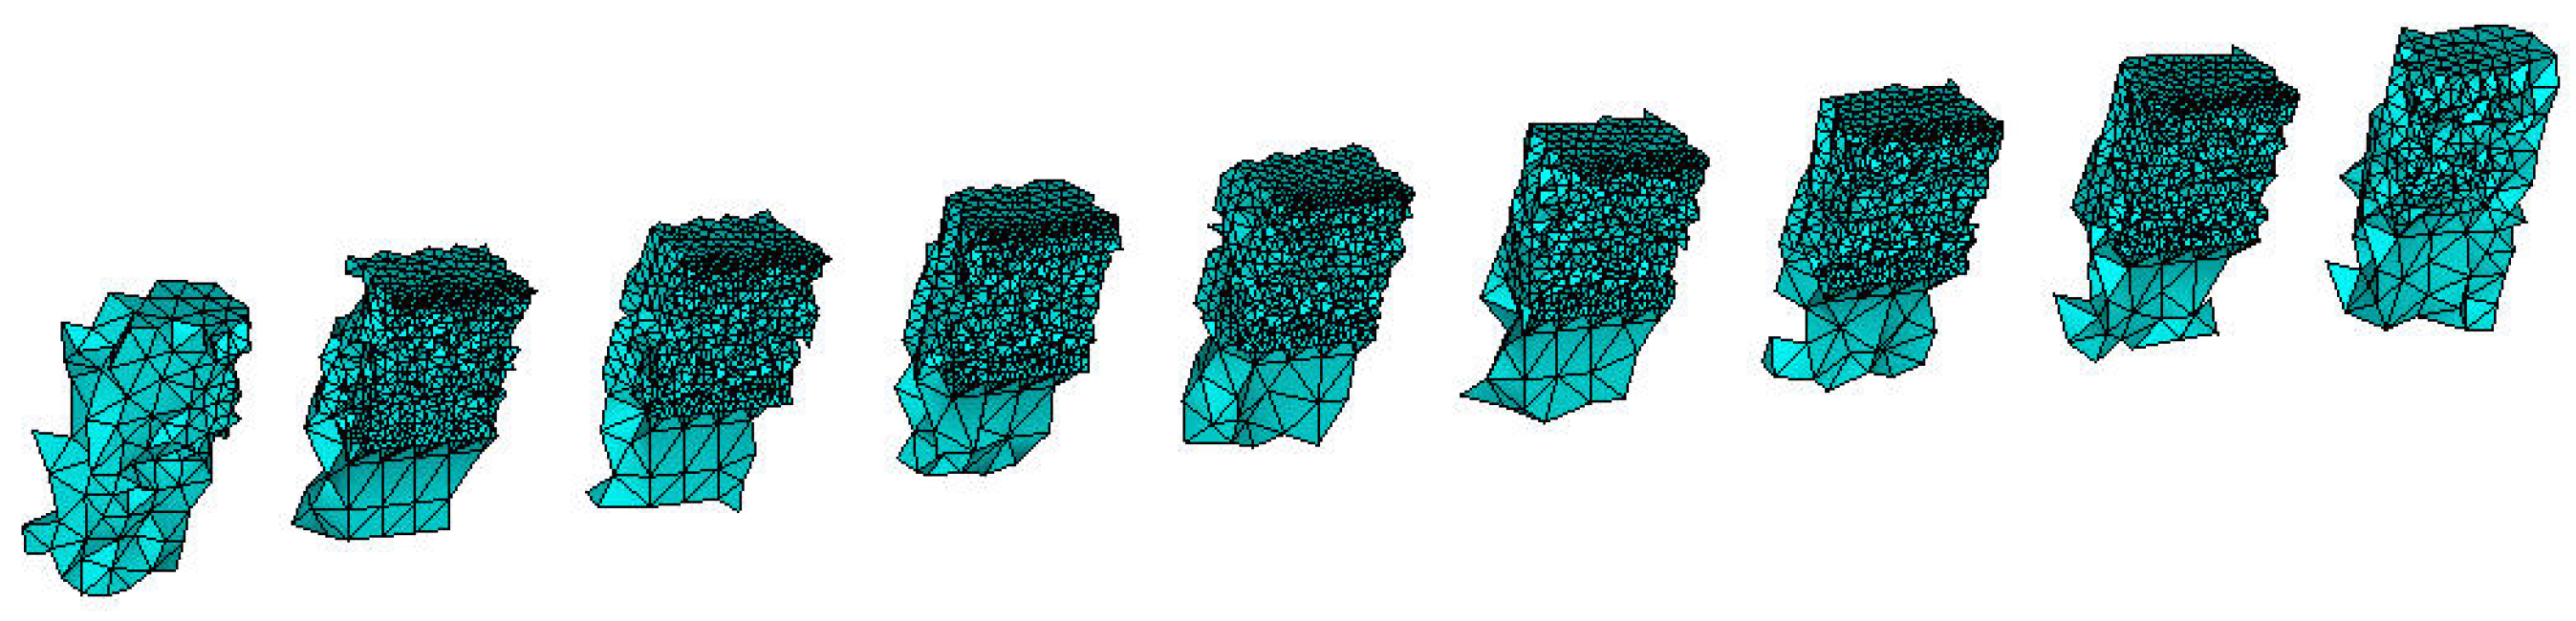
To investigate the interaction mechanism among the superstructure, foundation, and soil during the shaft excavation correction process at the prototype engineering scale, a three-dimensional finite-element model was established using ANSYS 2024 software. The numerical model was developed based on the actual engineering dimensions, with a building height of 32.8 m and soil dimensions of 91 m × 38 m × 8 m. Approximately 1.28 million finite elements were generated in the model. To ensure consistency between the physical model test and the numerical simulation, the excavation volume was converted according to similarity theory. Based on the volume similarity ratio, the cumulative excavation volume obtained from the physical model test was converted to 300 m3 at the prototype scale. Therefore, a cumulative excavation volume of 300 m3 was adopted in the numerical simulation.
The foundation soil was simulated using the Mohr–Coulomb elastoplastic constitutive model. Since this study mainly focuses on the stress redistribution, settlement deformation, and plastic zone evolution of the foundation soil induced by unloading during shaft excavation, rather than long-term consolidation or creep behavior, the Mohr–Coulomb model is considered appropriate for describing the elastoplastic response of soil under excavation disturbance. The detailed material parameters are listed in Table 9. A dilation angle of 0° was adopted, and a non-associated flow rule was applied to avoid overestimating the dilatancy behavior of loess-like soil.
The prototype foundation system consists of a 600-mm-thick raft foundation supported by cast-in-place compacted concrete piles and soil-compaction piles. Considering that the objective of this study was to investigate the overall deformation coordination mechanism of the building–foundation–soil system during shaft excavation correction, rather than the bearing behavior of individual piles, an equivalent stiffness approach was adopted to represent the foundation system and its interaction with the surrounding soil. This approach ensured that the overall stiffness and deformation characteristics of the numerical model were consistent with those of the prototype structure.
The boundary conditions of the numerical model were defined based on the assumption of a semi-infinite foundation domain. The bottom boundary was fully constrained by restricting displacements in the X, Y, and Z directions. Roller constraints were applied to the lateral boundaries, where normal displacement was restricted while tangential deformation was allowed, thereby preventing unrealistic rigid-body movement while maintaining reasonable lateral deformation of the soil mass. The top boundary was kept free to represent the actual ground surface condition.
A mesh sensitivity analysis was performed to verify the accuracy and reliability of the numerical results. Three mesh densities, namely coarse, medium, and fine meshes, were adopted, and the maximum building inclination and foundation settlement responses obtained from different mesh configurations were compared. When the difference between the results of the medium and fine meshes was less than 5%, the mesh size was considered sufficient to satisfy the accuracy requirements of the simulation. Finally, a numerical model containing approximately 1.28 million finite elements was adopted for subsequent analyses.
The overall finite-element model is shown in Figure 14. Nine soil excavation shafts (TJ1–TJ9) were arranged from east to west to simulate the excavation correction process, as shown in Figure 15.

5.2. Numerical Simulation Analysis

5.2.1. Initial Ground Stress Without Inclination

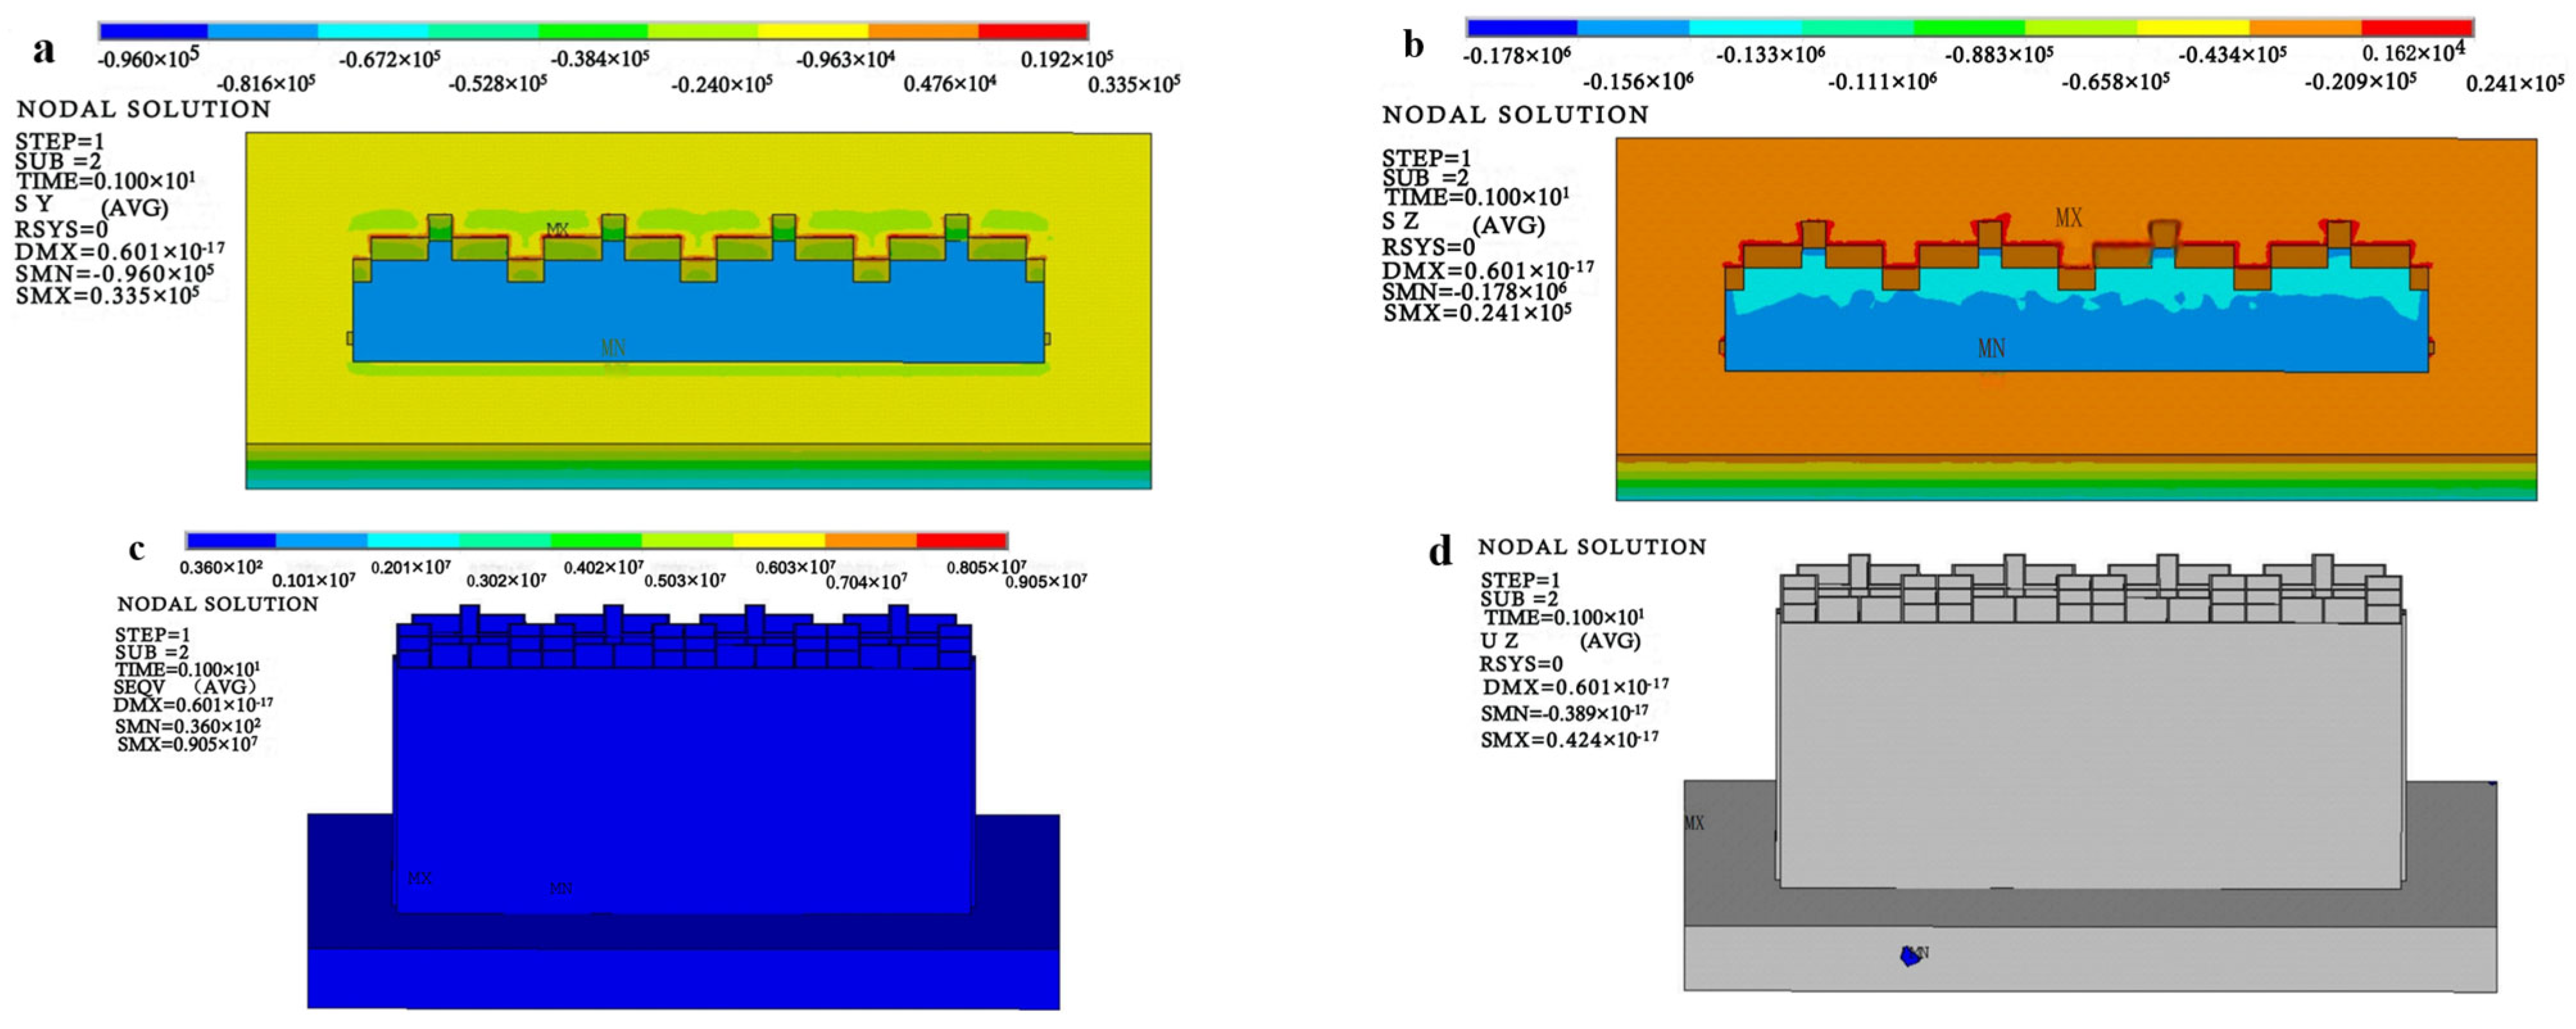
The initial geostatic stress field was established through a stress-equilibrium procedure before simulating the building inclination. The vertical initial stress was determined from the soil self-weight and increased with depth, while the horizontal stress was defined according to the adopted at-rest earth-pressure coefficient. The corresponding initial stress field was introduced into the finite-element model and equilibrated under gravity and the prescribed boundary conditions. The equilibrium calculation was continued until the residual displacement was of the order of 10−10 m, which was substantially smaller than the displacement convergence tolerance of 10−6 m. The equilibrated stress field was subsequently retained as the initial state for the building inclination and underexcavation analyses. The simulation results are shown in Figure 16.
Based on the analysis results of the initial in situ stress balance, the initial displacements of the soil layer and the superstructure in the model were controlled within the order of 10−10 m. Because this value was far less than the convergence tolerance of the finite-element calculation (10−6 m), the ground stress balance met the required accuracy for the numerical simulation. Further analysis showed that the initial in situ stress field exhibited obvious characteristics of gradient-layered distribution along the depth direction. The vertical effective stress increased linearly with the buried depth. The ratio of horizontal stress to vertical stress (lateral pressure coefficient K0) was stable in the range of 0.5~0.6 [25], which was consistent with the empirical value of the static earth-pressure coefficient of yellow clay. The initial stress state reflected the original stress environment of the foundation soil under self-weight, providing reasonable initial boundary conditions for mechanical response analysis during staged underexcavation rectification.

5.2.2. Simulation of Initial Tilt State

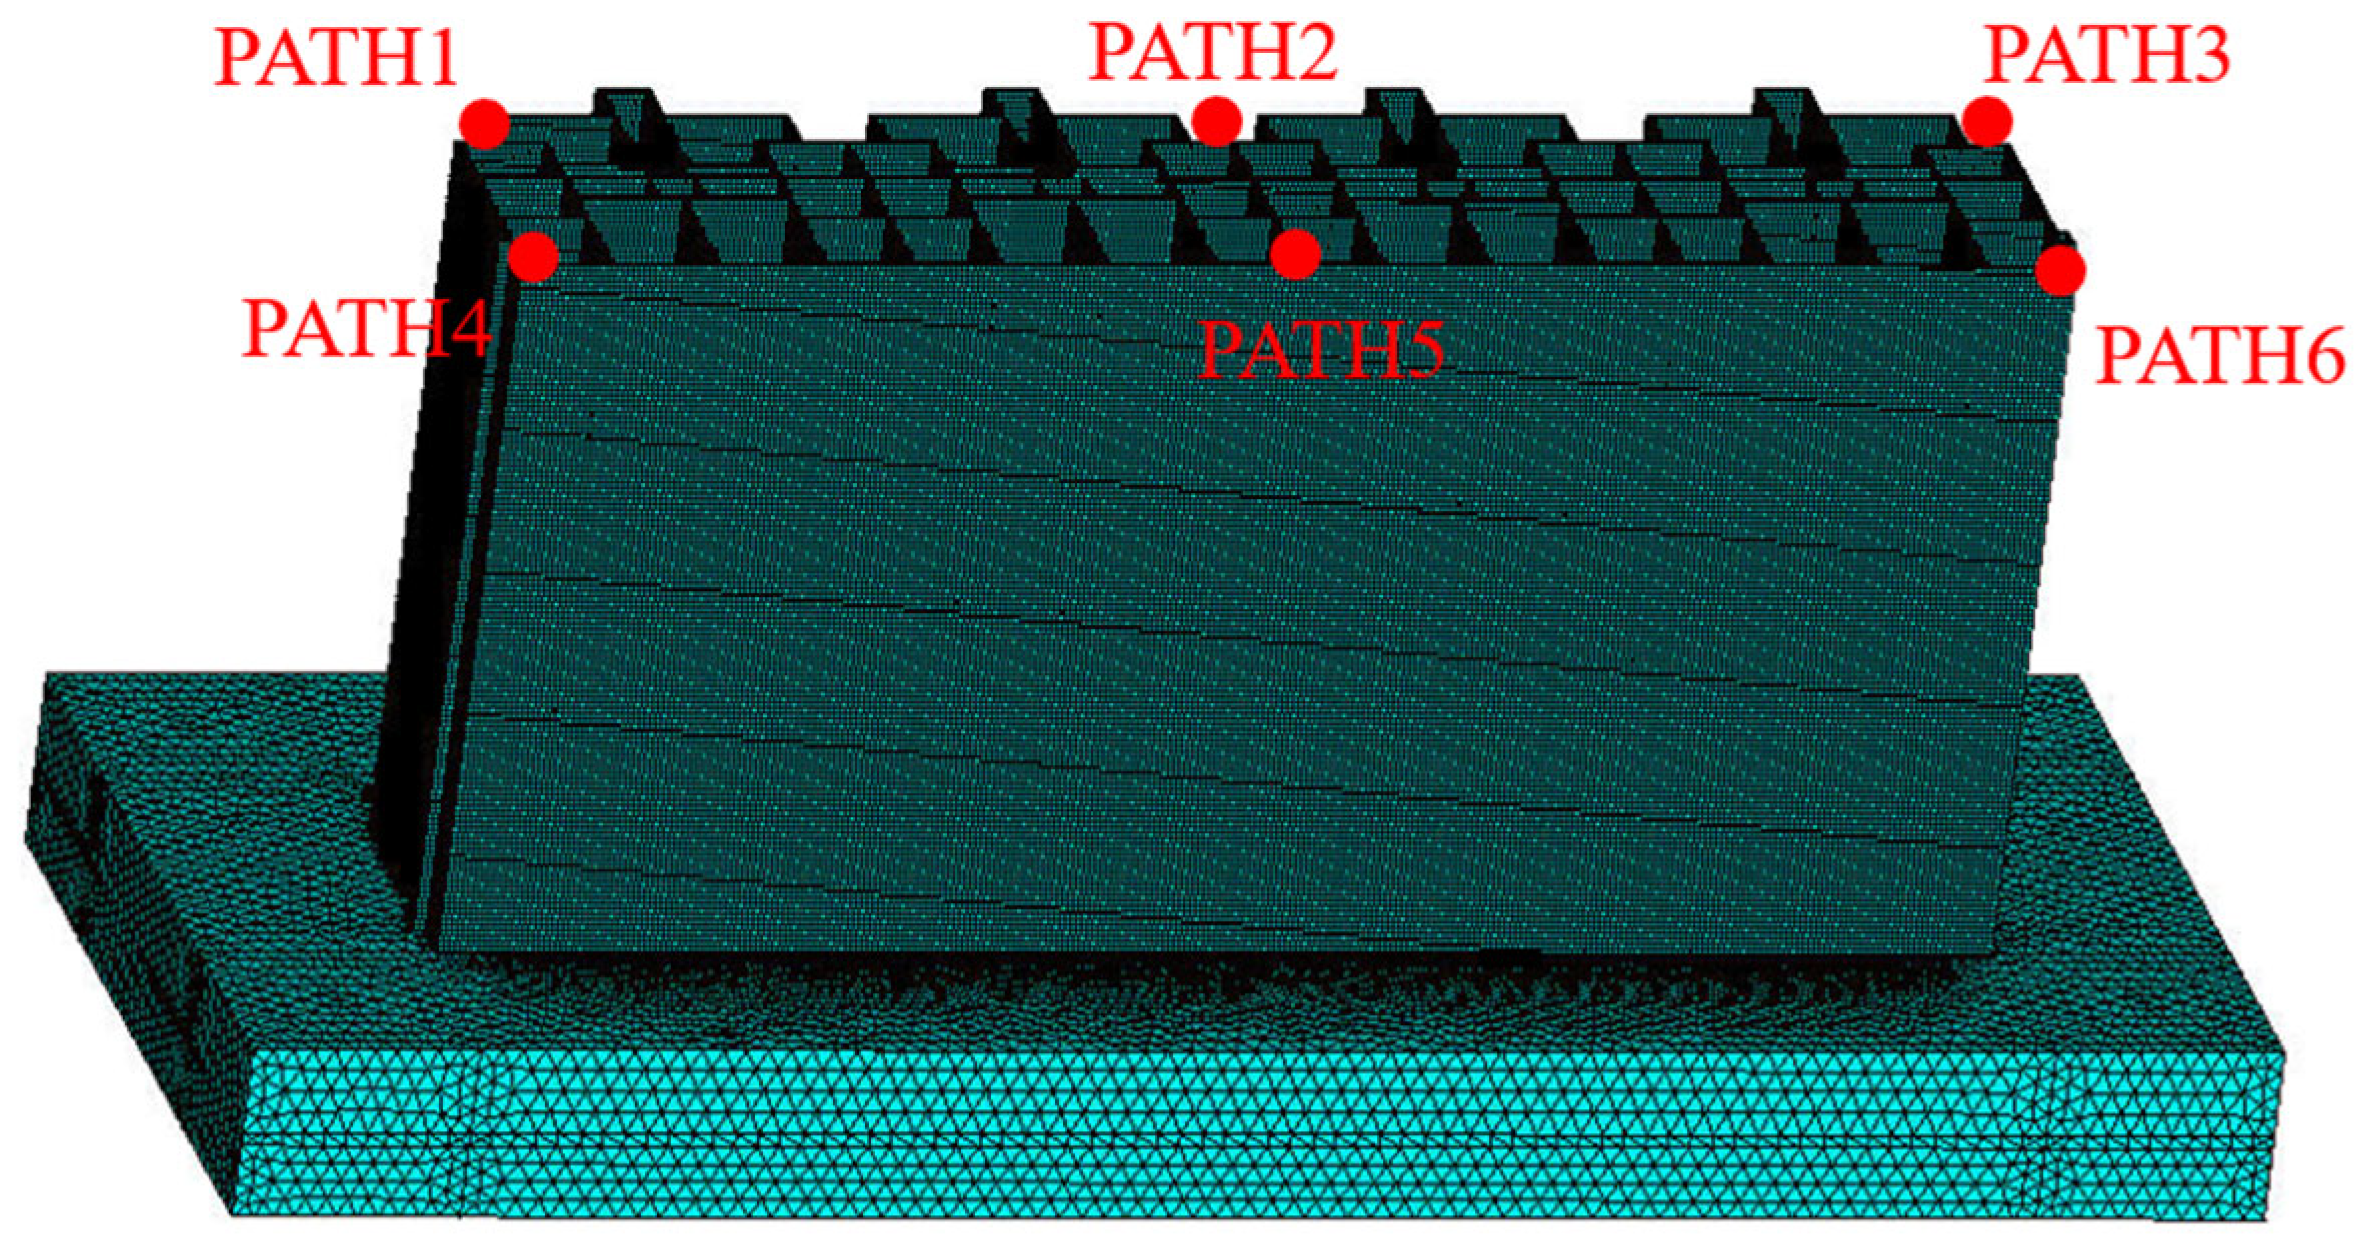
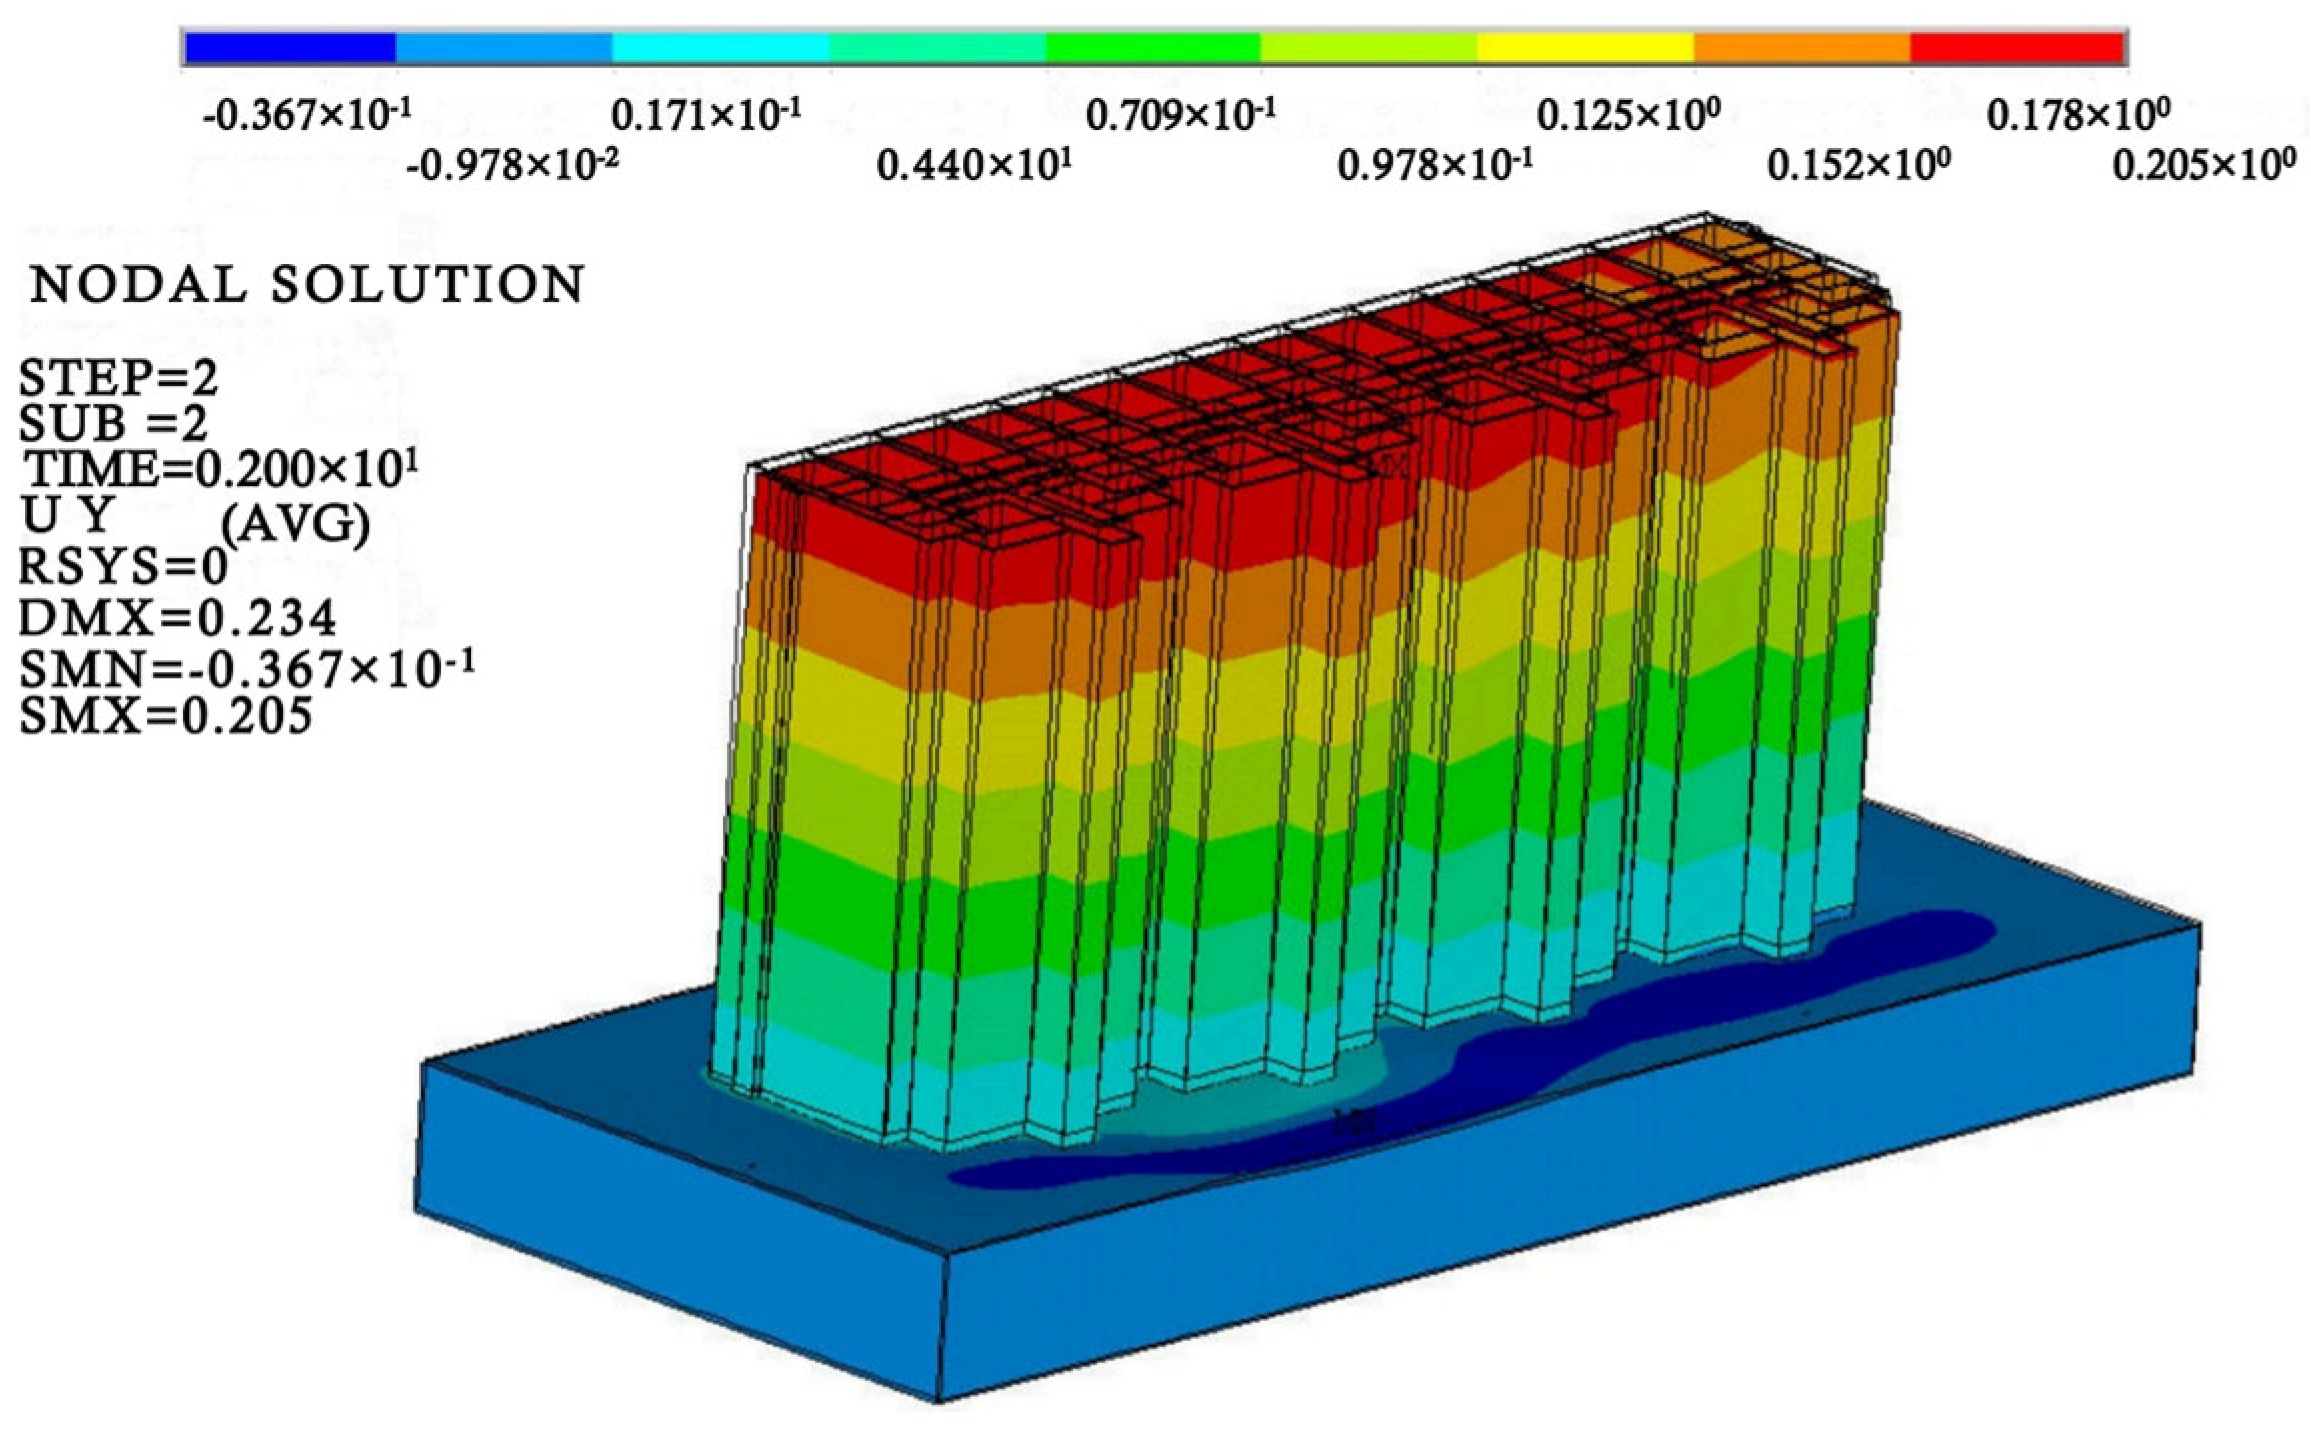
A total of six analysis paths were arranged in the numerical model based on the displacement and settlement monitoring data from 2021 to 2023 (PATH1–PATH6). Its spatial distribution is shown in Figure 17. Combined with an analysis of the causes of building tilt, the initial tilt state of the model was set to simulate the initial tilt of the actual building. The simulation results are shown in Figure 18, and the specific tilt value is shown in Table 10. The difference between the simulated building inclination value and the actual initial inclination value was 2~5 mm, which was within the allowable error range. The overall trend inclined to the northeast.

5.2.3. Analysis of Numerical Simulation Results

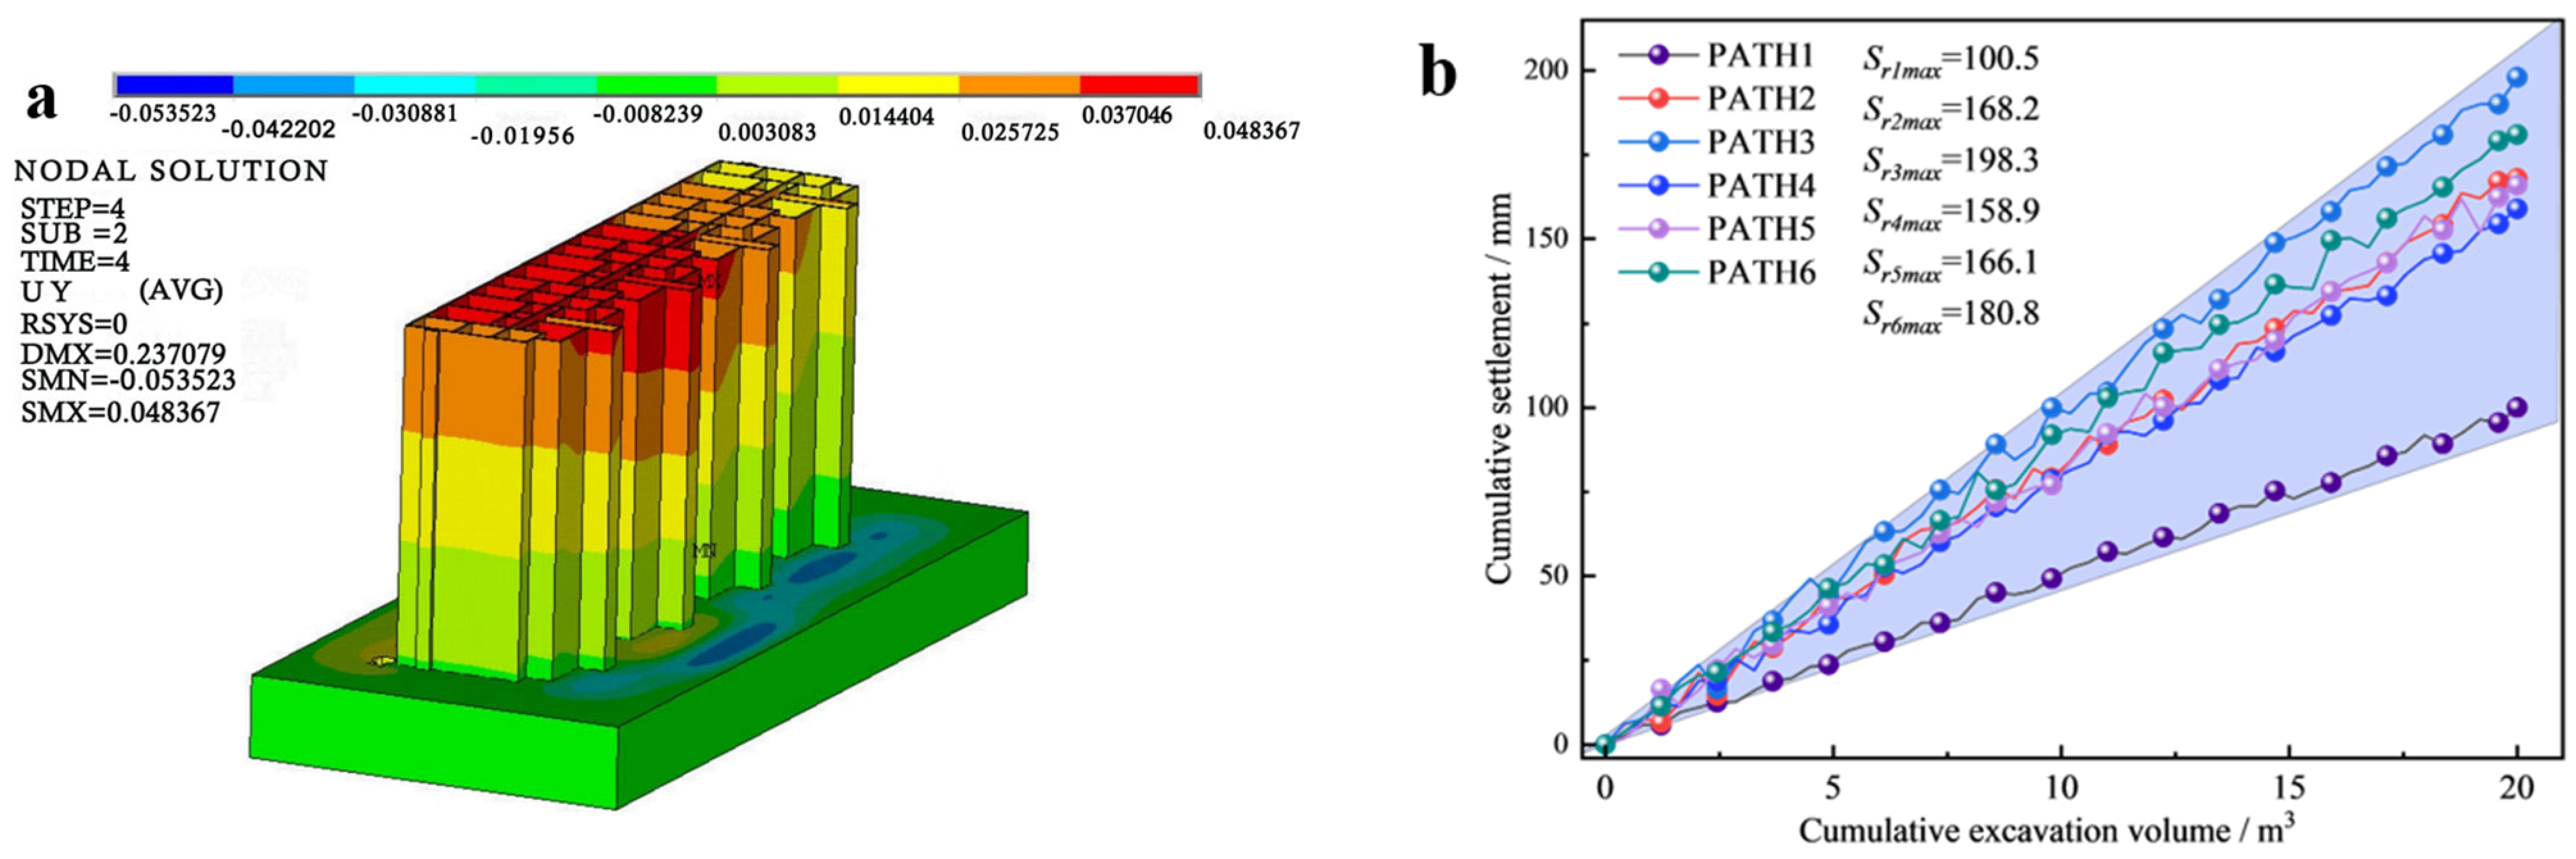
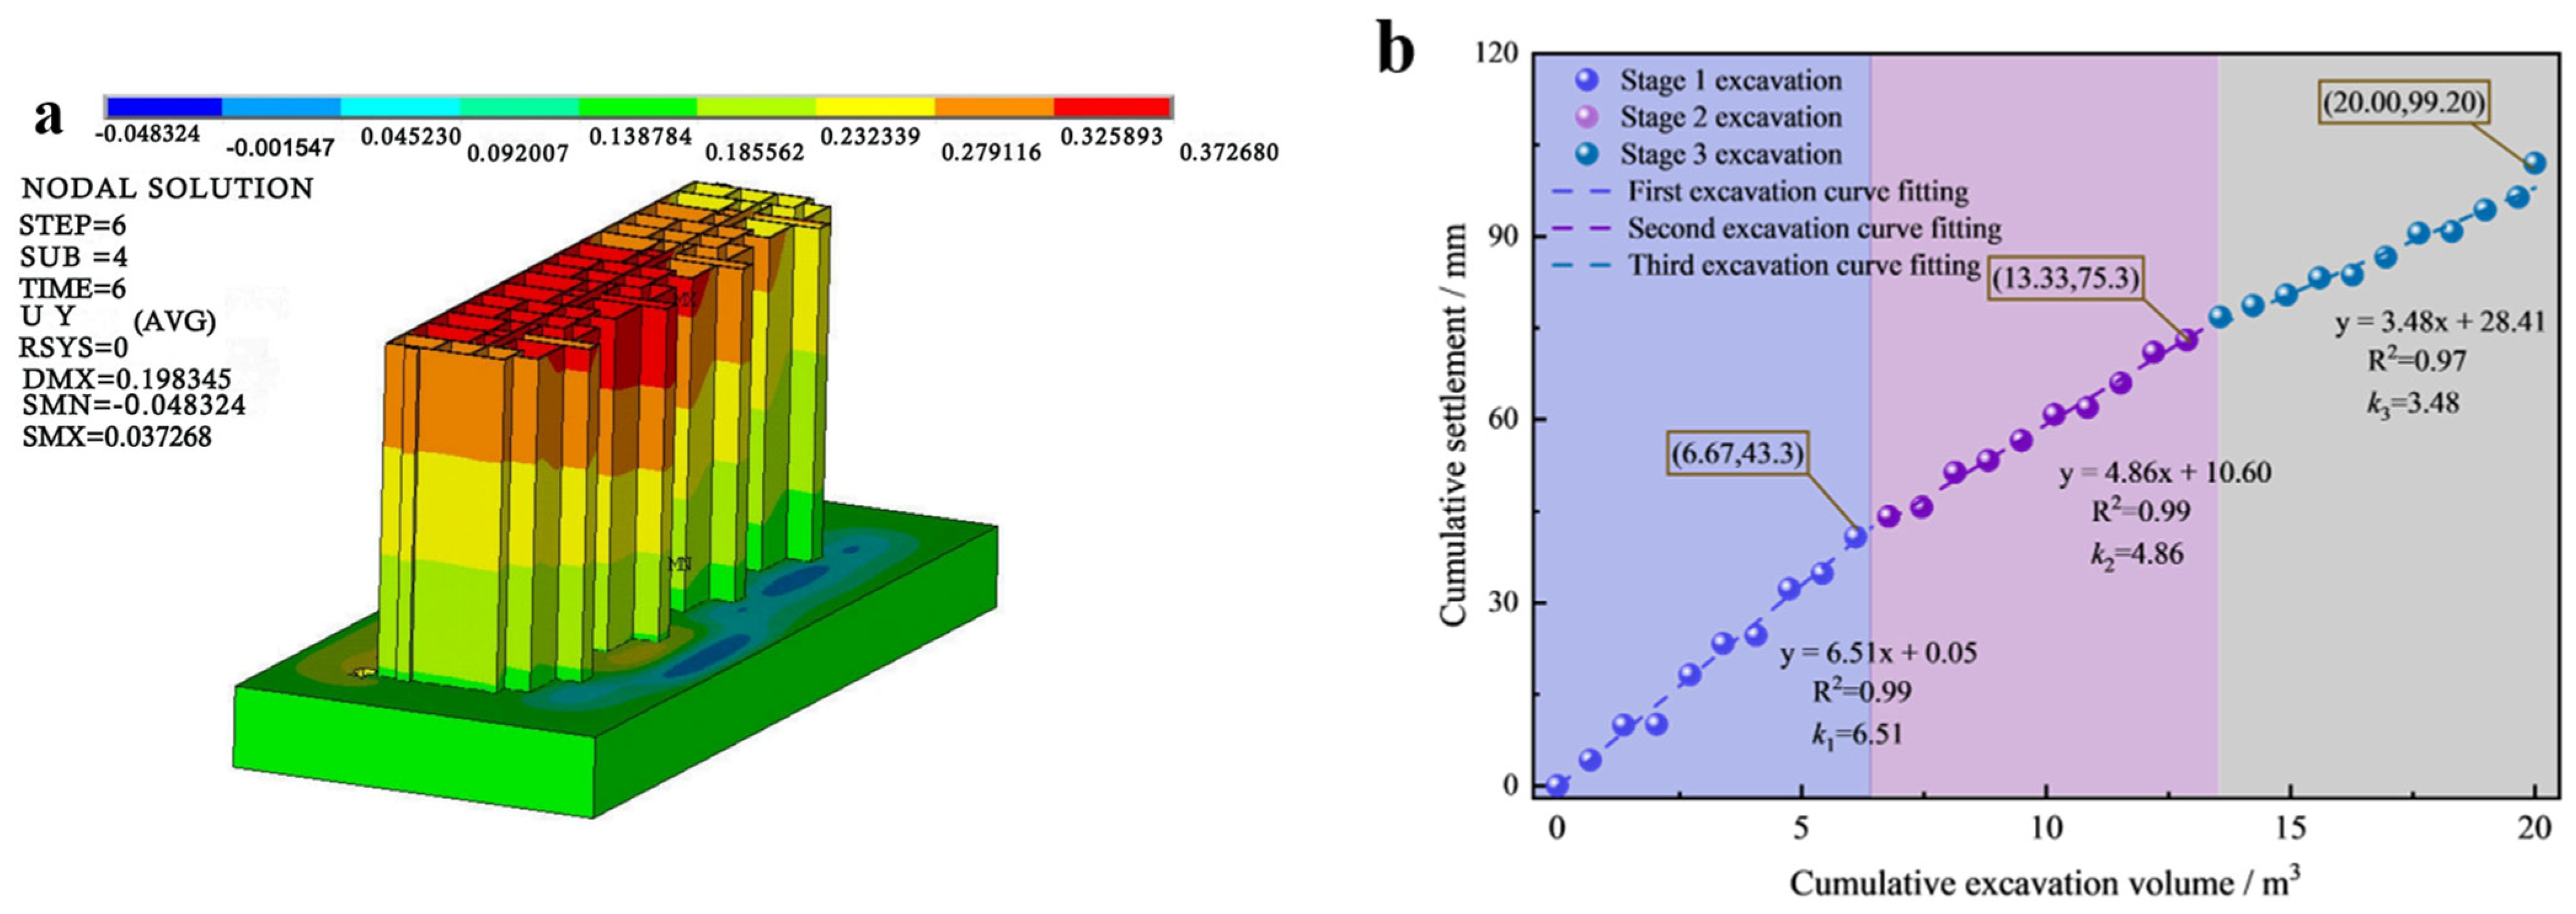
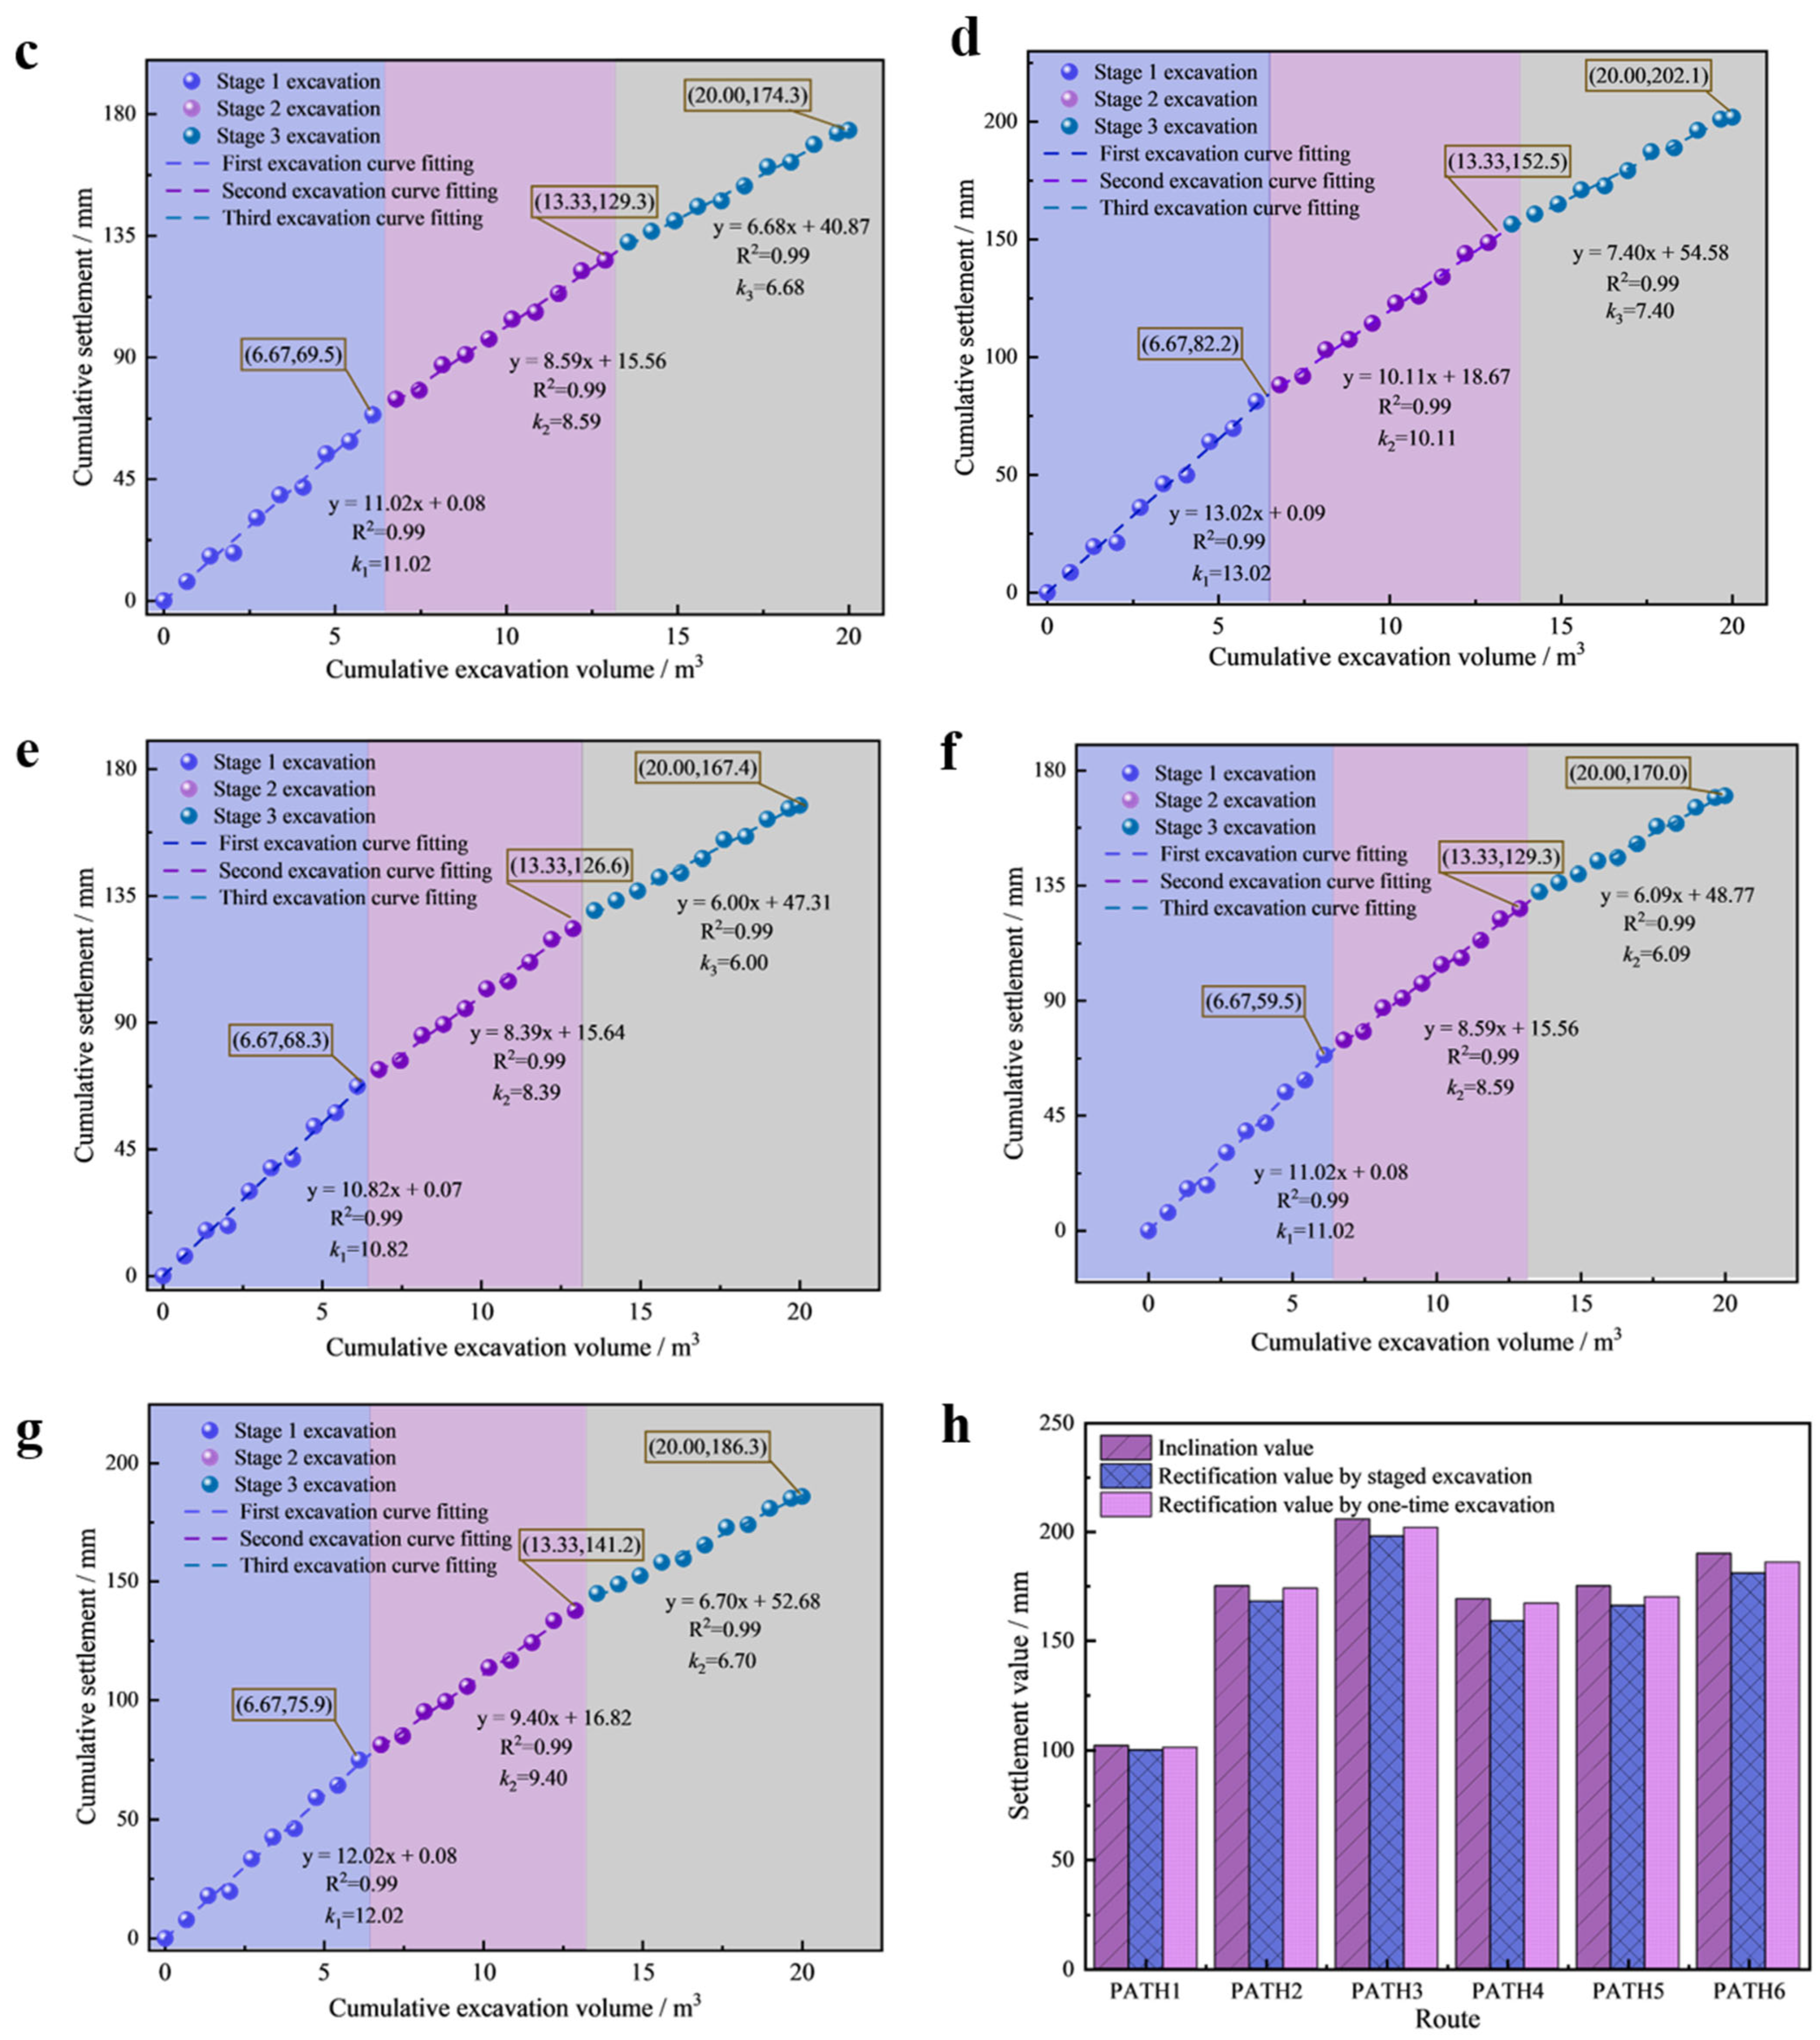
The results of one-time and staged underexcavation of the numerical model are shown in Figure 19 and Figure 20 and Table 11 and Table 12.
According to the numerical simulation results in the ideal state, under the condition of the same cumulative amount of soil (0–300 m3), different correction methods showed significant differences in the correction effect. The maximum settlement displacements of one-time and staged underexcavation were 100.0–198.1 mm and 101.3–202.1 mm, respectively. The rectification rates were 94.08%–98.04% and 97.14%–99.43%, respectively. The average rectification rates were 95.73% and 98.44%, respectively. Furthermore, the displacement increment during the second stage of staged underexcavation decreased by 14.5%–25.4% compared to the first second, and that during the third stage decreased by 22.2%–29.4% compared to the second stage. The settlement increment decreased stage by stage, showing the same nonlinear decreasing trend as observed in the model test, demonstrating obvious nonlinear decreasing characteristics.
Although the one-time underexcavation scheme offers a short construction timeline [26], rapid unloading can easily lead to elastic recovery and limit the final displacement. In the process of staged underexcavation, the structure quickly overcomes the initial structural inertia of the soil after the first stage of excavation. A significant displacement is generated. During the staged underexcavation process, staged unloading provides sufficient time for stress redistribution and deformation coordination within the foundation soil. Compared to one-time underexcavation, staged excavation reduces abrupt unloading and promotes a more gradual redistribution of stress and deformation within the foundation soil, resulting in a more progressive and controllable rectification response.

6. Discussion

6.1. Interpretation and Cross-Validation of Physical Model and Numerical Results

The maximum inclined position of the high-rise building structure was taken as the characteristic section. Comparing the results of the physical model test and the numerical simulation, the correction efficiency and accuracy of the staged underexcavation were analyzed. The results are shown in Table 13.
As shown in Table 13, both the physical model test and the numerical simulation yielded a continuous increase in correction displacement with progressive excavation stages. After the first and second excavation stages, the correction responses obtained from the two approaches showed consistent deformation trends, although the quantitative discrepancy increased after the first excavation stage. After completion of the third excavation stage, the maximum correction displacements obtained from the physical model test and the numerical simulation were 176 mm and 202.10 mm, respectively, indicating a certain discrepancy between the two methods.
The difference mainly results from the differences in scale, material representation, and foundation system characterization between the two approaches. The physical model test was conducted using a scaled model and similarity materials, and its deformation response was inevitably influenced by scale effects, uncertainties associated with material preparation, and boundary constraints. Therefore, the measured deformation behavior cannot completely reproduce that of the prototype engineering condition. By contrast, the numerical model was established at the prototype scale, with the soil behavior described using the Mohr–Coulomb elastoplastic constitutive model and the composite foundation system represented using an equivalent stiffness approach. Therefore, the numerical model provides a complementary estimate of the engineering-scale deformation response under the adopted constitutive, parameter, and boundary assumptions.
Although a relative discrepancy of approximately 14.8% was observed in the final rectification displacement, both approaches reproduced the same overall evolution trend of staged rectification [27]. This discrepancy does not indicate a failure of the numerical model because both methods reproduced the same nonlinear decreasing trend of correction increment during staged excavation [28].

6.2. Uncertainty, Model Discrepancy, and Limitations

The reliability range and limits of interpretation of the conclusions were defined through uncertainty analysis [29]. In the physical model test, the cumulative rectification displacements after the three stages of soil excavation were 0.85 mm, 1.33 mm, and 1.76 mm, respectively, corresponding to stage-wise displacement increments of 0.85 mm, 0.48 mm, and 0.43 mm. The displacement increment in the second stage decreased by 43.5% relative to that in the first stage, while that in the third stage decreased by 10.4% relative to the second stage. Accordingly, the displacement increment between two successive stages can be expressed as follows:
Δ S i = S i S i 1
where ΔSi denotes the rectification displacement increment at the i-th stage; and Si and Si−1 represent the cumulative rectification displacements measured at the end of the i-th stage and the preceding stage, respectively.
Accordingly, ΔS2 = 0.48 mm and ΔS3 = 0.43 mm. The displacement increment in the second stage was 43.5% lower than that in the first stage, whereas the increment in the third stage was 10.4% lower than that in the second stage.
These results indicate that as the staged soil excavation proceeded, the cumulative rectification displacement continuously increased, whereas the additional rectification displacement generated during each individual stage generally decreased. This suggests that the rectification response of the structure–foundation–soil system exhibited a progressively attenuating trend from one stage to the next. Therefore, this study primarily uses the overall decreasing trend in the stage-wise displacement increments as experimental evidence, rather than drawing definitive conclusions based on the relatively small percentage differences between adjacent stages.
Based on the physical model test results, prototype-scale numerical simulations were further conducted for cross-validation. According to the adopted similarity relationship, the final rectification displacement obtained from the physical model test was converted to 176 mm at the prototype scale, whereas the corresponding numerical simulation result was 202.10 mm. The relative deviation between the two results was calculated as follows:
E m = S n u m S exp S exp × 100 %
where Em denotes the relative deviation between the experimental and numerical results; and Snum and Sexp denote the final rectification displacements obtained from the numerical simulation and the physical model test converted to the prototype scale, respectively.
The resulting Em = 14.8% reflects the model discrepancy between the two research approaches in terms of the magnitude of the final displacement and should not be directly interpreted as a single measurement error or as a predefined allowable error. Considering the model-development procedures adopted in this study, the potential sources of this discrepancy include the scale effects inherent in the physical model, the equivalent approximation of the macroscopic mechanical properties of the prototype soil using analogous materials, differences in boundary conditions, and the equivalent representation of the composite foundation system in the numerical model.
Although a certain discrepancy exists in the magnitude of the final displacement, both the physical model test and numerical simulation exhibit the same overall response pattern: cumulative rectification displacement continuously develops as staged soil excavation proceeds, while stage-wise displacement increments generally decrease. This trend-level consistency provides qualitative cross-support between the physical and numerical approaches, while the quantitative discrepancy indicates that the two models should not be regarded as equivalent representations of the prototype system [30].

7. Conclusions

(1)
Insufficient compaction of the inter-pile soil, together with wetting-induced collapse and mechanical softening, jointly promoted the development of differential foundation settlement, ultimately leading to building inclination. The average compaction coefficient of the inter-pile soil was 0.860, lower than the control requirement of 0.93. The collapsibility coefficients reached 0.019 and 0.024 under vertical pressures of 200 and 300 kPa, respectively. After saturation, the cohesion decreased from 33 kPa to approximately 19 kPa, the internal friction angle decreased from 24° to approximately 20°, and the compression modulus decreased from 15.5 MPa to 9.2 MPa, demonstrating the pronounced water sensitivity and mechanical degradation of the foundation soil.
(2)
The rectification response during staged underexcavation exhibited a progressively attenuating trend. The stage-wise displacement increments decreased successively from 0.85 mm to 0.48 mm and 0.43 mm. The final prototype-scale rectification displacement was 176 mm, corresponding to a rectification rate of 83.17%. As underexcavation proceeded, the structure–foundation–soil system progressively approached a new equilibrium state, and the additional rectification deformation induced by subsequent excavation stages generally decreased.
(3)
Numerical comparison under the same cumulative excavation volume of 300 m3 indicated that staged underexcavation produced a higher average rectification rate and a more progressive deformation-adjustment process than one-time underexcavation under the adopted modeling conditions. The corresponding average rectification rates were 95.73% and 98.44%, respectively.
(4)
The prototype-equivalent soil excavation volumes for the three stages were 120 m3, 100 m3, and 80 m3, respectively, with a cumulative excavation volume of 300 m3. By progressively reducing the excavation volume and allowing the deformation to stabilize between successive stages, the structure–foundation–soil system was able to undergo gradual stress redistribution and deformation adjustment during the rectification process. These results demonstrate the engineering feasibility of the staged underexcavation rectification scheme under the investigated complex collapsible-loess conditions.

Author Contributions

Conceptualization, J.H., C.L. and Q.W.; Methodology, J.H. and C.L.; Software, J.H., C.L., S.S. and D.Q.; Validation, C.L., S.S., D.Q. and Z.H.; Formal analysis, C.L., D.Q. and Z.H.; Investigation, C.L., Q.W., H.C., S.S. and D.Q.; Resources, T.Z.; Data curation, C.L.; Writing—original draft, C.L.; Writing—review & editing, J.H.; Visualization, Q.W. and H.C.; Supervision, H.C.; Project administration, H.C. and T.Z.; Funding acquisition, T.Z. All authors have read and agreed to the published version of the manuscript.

Funding

The authors gratefully acknowledge the financial support from the Open Fund of Shandong Key Laboratory of Civil Engineering Disaster Prevention and Mitigation (CDPM2023KF09).

Institutional Review Board Statement

Not applicable.

Informed Consent Statement

Not applicable.

Data Availability Statement

The data used to support the findings of this study are available from the corresponding author upon request.

Conflicts of Interest

The authors declare no conflicts of interest.

References

  1. Zhu, Y.P.; Wang, H.M.; Yang, K.B.; Yang, X.H. Rectification and reinforcement methods for high-rise buildings with pile foundations and engineering practice. J. Build. Sci. Eng. 2018, 35, 87–94. [Google Scholar]
  2. Mo, Z.L.; Peng, X.J.; Peng, L.; Yuan, Y.Q.; Zhang, X.X.; Kang, J.W. Research and application of zonal integrated rectification technology for locally tilted buildings. Build. Struct. 2023, 53, 137–142. [Google Scholar] [CrossRef]
  3. Huang, H.; Xing, Z.; Li, Z.; Xing, X.; Jiang, M.; Huang, Q.; Huang, C.; Jiang, M.; Hui, D. Critical Review on Durable Concrete in Chloride-Containing Environments: Material Design, Monitoring, and Life-Cycle Management. Coatings 2026, 16, 558. [Google Scholar] [CrossRef] [Scilit]
  4. Cui, X. Urban High-Rise Building Asymmetric Settlement Induced by Subsurface Geological Anomalies: A Case Analysis of Mechanisms and Mitigation Strategies. Symmetry 2025, 17, 2068. [Google Scholar] [CrossRef] [Scilit]
  5. Cho, H.-C.; Lee, S.-H.; Park, M.; Kim, K.S. Remaining Service Life Evaluation of Reinforced Concrete Buildings Considering Failure Probability of Members. Int. J. Concr. Struct. Mater. 2025, 19, 17. [Google Scholar] [CrossRef] [Scilit]
  6. Chen, L.; Su, R.K.L. Service life modelling of carbonated reinforced concrete with supplementary cementitious materials considering early corrosion propagation. Constr. Build. Mater. 2024, 413, 134861. [Google Scholar] [CrossRef] [Scilit]
  7. Kuang, L.F.; Zhou, G.Q.; Wang, J.Z.; Zhu, K.P.; Shang, X.Y. Research on inclined digging technology for deviation rectification of rooting mine shaft tower. Rock Soil Mech. 2018, 39, 1422–1430. [Google Scholar] [CrossRef]
  8. Xiao, J.; Sun, J.; Jiang, Z.; Wang, Q.; Guo, D. Building Rectification by Underexcavation and Practical Design Method. J. Perform. Constr. Facil. 2022, 36, 04022060. [Google Scholar] [CrossRef] [Scilit]
  9. Li, Q.M. Research on inclined-rectifying of building with pile foundation. Jordan J. Civ. Eng. 2015, 9, 133–138. [Google Scholar]
  10. Deng, Z.D.; Sun, Q.; Wang, L.; Zhang, S.F. Mechanism analysis of integrated rectification method with anti-tilt and forced settlement and its application in high-rise building rectification. Railw. Eng. 2016, 2, 116–120. [Google Scholar] [CrossRef]
  11. Wang, J.S.; Li, F.F.; Li, F.Q.; Yang, Y.Z.; Sheng, X.Y. Design and engineering practice of large-tonnage anchor static pressure pile in rectification and reinforcement of high-rise buildings. Build. Sci. 2023, 39, 155–161. [Google Scholar] [CrossRef]
  12. Bu, L.; Yue, H. Quality Risk Perception of Rectification and Reinforcement in a High-Rise Building under Uncertainty. Buildings 2024, 14, 774. [Google Scholar] [CrossRef] [Scilit]
  13. Chen, Y.; Zhang, X. Analytical plastic solution around soil-digging holes for inclined building and its application. Int. J. Civ. Eng. 2019, 17, 245–252. [Google Scholar] [CrossRef] [Scilit]
  14. Zhang, X.; Shan, R.; Lu, M. Rectification of jacking method for brick-wooden buildings in deformation analysis with CFST reinforcement. Struct. Des. Tall Spec. Build. 2018, 27, e1439. [Google Scholar] [CrossRef] [Scilit]
  15. Wang, Y.; Li, Y. Wetting-induced collapse of loess: Tracing microstructural evolution. Eng. Geol. 2024, 340, 107673. [Google Scholar] [CrossRef] [Scilit]
  16. Leng, Y.; Peng, J.; Wang, S.; Lu, F. Development of water sensitivity index of loess from its mechanical properties. Eng. Geol. 2021, 280, 105918. [Google Scholar] [CrossRef] [Scilit]
  17. Francisca, F.M.; Giomi, I.; Rocca, R.J. Inverse analysis of shallow foundation settlements on collapsible loess: Understanding the impact of varied soil mechanical properties during Wetting. Comput. Geotech. 2024, 167, 106090. [Google Scholar] [CrossRef] [Scilit]
  18. GB 50016-2014; Code for Fire Protection Design of Buildings (Sections 1–3.3). China Planning Press: Beijing, China, 2017.
  19. JGJ 8-2016; Code for Deformation Measurement of Building. Architecture & Building Press: Beijing, China, 2016.
  20. Mujtaba, H.; Farooq, K.; Sivakugan, N.; Das, B.M. Laboratory and field investigations in granular soils to correlate relative density, relative compaction and grain size. J. S. Afr. Inst. Civ. Eng. 2020, 62, 12–21. [Google Scholar] [CrossRef] [Scilit]
  21. GB 50025-2018; Standard for Building Construction in Collapsible Loess Regions. Architecture & Building Press: Beijing, China, 2019.
  22. Yang, G.; Wu, J.; Hu, Q.; Lei, D. Real-time monitoring of changes in building tilt angle using double square artificial marks. Indoor Built Environ. 2021, 30, 777–786. [Google Scholar] [CrossRef] [Scilit]
  23. Al Heib, M.; Emeriault, F.; Nghiem, H.-L. On the use of 1g physical models for ground movements and soil-structure interaction problems. J. Rock Mech. Geotech. Eng. 2020, 12, 197–211. [Google Scholar] [CrossRef] [Scilit]
  24. JGJ 270-2012; Technical Specification for Building Inclination Rectification. Architecture & Building Press: Beijing, China, 2012.
  25. GB/T 50123-2019; Standard for Geotechnical Testing Method. Planning Press: Beijing, China, 2019.
  26. Sun, J.P.; Xiao, J.H.; Wang, Q.P. Settlement of composite foundation-A case history with reinforcement of steel pipe micro-pile. Eng. Technol. Innov. 2017, 1, 109–112. [Google Scholar] [CrossRef] [Scilit]
  27. Wu, P.; Lu, Z.; Pang, X.; Ma, Y.; Han, X.; Lyu, Y.; Li, Y. Experimental and Numerical investigation of Reinforced Soil Slopes with Vertical Rib and Inclined Reinforcement: Application to Embankment Slopes. Adv. Civ. Eng. 2026, 1, 9926650. [Google Scholar] [CrossRef] [Scilit]
  28. Gu, G.; Zhang, Z.; Huang, X.; Li, Y.; Lei, Q. A finite element-based dynamic simulation method for modeling shield-ground interactions: 3D numerical simulations with comparison to physical experiments. Comput. Geotech. 2024, 169, 106262. [Google Scholar] [CrossRef] [Scilit]
  29. Phoon, K.-K.; Cao, Z.-J.; Ji, J.; Leung, Y.F.; Najjar, S.; Shuku, T.; Tang, C.; Yin, Z.-Y.; Ikumasa, Y.; Ching, J. Geotechnical uncertainty, modeling, and decision making. Soils Found. 2022, 62, 101189. [Google Scholar] [CrossRef] [Scilit]
  30. Qaftan, O.S.; Sabbagh, T.T.; Weekes, L.; Augusthus-Nelson, L. Validation of a finite element modelling approach on soil-foundation-structure interaction of a multi-storey wall-frame structure under dynamic loadings. Soil Dyn. Earthq. Eng. 2020, 131, 106041. [Google Scholar] [CrossRef] [Scilit]
Figure 1. Layout and cumulative settlement of foundation monitoring points in 2023.
Coatings 16 01071 g001
Figure 2. Drilling plane layout diagram.
Coatings 16 01071 g002
Figure 3. On-site exploration and research: (a) core sampling; (b) utility survey.
Coatings 16 01071 g003
Figure 4. Experimental procedure.
Coatings 16 01071 g004
Figure 5. Results of water-immersion compression test.
Coatings 16 01071 g005
Figure 6. Natural saturated direct shear curves.
Coatings 16 01071 g006
Figure 7. Natural saturated e-logp curves.
Coatings 16 01071 g007
Figure 8. Model box.
Coatings 16 01071 g008
Figure 9. Superstructure schematic diagram.
Coatings 16 01071 g009
Figure 10. The upper structure plane diagram of the model.
Coatings 16 01071 g010
Figure 11. Schematic diagram of measuring point arrangement.
Coatings 16 01071 g011
Figure 12. Experimental process: (a) preparation of similarity materials; (b) model construction; (c) physical model; (d) monitoring and soil removal.
Coatings 16 01071 g012
Figure 13. The settlement displacement changes in each stage: (a) the first stage of soil displacement; (b) the second stage of soil displacement; (c) the third stage of soil displacement; (d) evolution of the fitted slope k.
Coatings 16 01071 g013
Figure 14. Numerical model: (a) finite-element integral model; (b) model grid division.
Coatings 16 01071 g014
Figure 15. Model of excavation shaft.
Coatings 16 01071 g015
Figure 16. Initial stress state: (a) horizontal stress distribution; (b) vertical pressure distribution; (c) the equivalent stress distribution; (d) initial vertical displacement results.
Coatings 16 01071 g016
Figure 17. Detection line position path distribution.
Coatings 16 01071 g017
Figure 18. Initial tilt state of the building.
Coatings 16 01071 g018
Figure 19. Rectification results of one-time underexcavation: (a) inclined state of building after one-time excavation; (b) displacement results of rectification settlement under different paths. Note: Sr1maxSr6max represents the maximum correction settlement under different paths.
Coatings 16 01071 g019
Figure 20. The rectification results of staged underexcavation: (a) step-by-step excavation soil tilt state; (b) PATH1 settlement; (c) PATH2 settlement; (d) PATH3 settlement; (e) PATH4 settlement; (f) PATH5 settlement; (g) PATH6 settlement; (h) effects of different correction schemes.
Coatings 16 01071 g020aCoatings 16 01071 g020b
Table 1. Physical state and densification characteristics of inter-pile soil at borehole ZK2.
SampleInitial Void Ratio Dry Density ρd/(g·cm−3)ηc
S10.841.4460.876
S20.871.4220.862
S30.881.4150.857
S40.911.3930.844
Average/1.4190.860
Table 2. Collapsibility Coefficient and Additional Wetting Deformation under Different Vertical Pressures.
Vertical Pressure p/kPaCollapsibility Coefficient/δsWetting-Induced Additional Deformation/mm
500.0040.08
1000.0080.16
1500.0140.28
2000.0190.38
3000.0240.48
Table 3. Direct shear test results under natural and saturated conditions.
Normal Stress/kPaNatural State/kPaSaturated State/kPaStrength Retention Rate/%
5055.2637.2067.3
10077.5255.4071.5
15099.8073.6073.7
200122.0591.7975.2
300166.57128.1977.0
Table 4. One-dimensional compression test results under natural and saturated conditions.
Pressure/kPaVoid Ratio (Natural State)Void Ratio (Saturated State)
500.8650.858
1000.8560.846
1500.8500.836
2000.8440.826
3000.8330.808
Table 5. Similarity ratio of each physical quantity in model test.
Physical QuantitySimilarity Ratio of Physical Quantity
Length of foundation soil layer LCL = 1 × 10²
Elastic modulus of superstructure ECE = 10
Unit weight of soil layer WCW = 1
Cohesion cCc = 10
Internal friction angle φCφ = 1
Compression modulus ESCE = 10
Height of foundation soil layer HCH = CL = 1 × 10²
Length of superstructure lsCls = CL = 1 × 10²
Unit weight of superstructure wsCws = CW = 1
Tilting displacement δCδ = CL = 1 × 10²
Strain εCε = 1
Stress σCσ = CE Cε = 10
Table 6. Undisturbed soil parameters.
Water Content/%Specific Gravity of Soil ParticlesDensity/kg/m3Cohesion/KPaCompression Modulus/MPaInternal Friction Angle/°
14.352.6614353315.524
Table 7. Ratios of yellow clay similarity material.
Mix Proportion No.Fine Sand/kgSlaked Lime/kgSawdust/kgWater/kg
128.875.720.395.02
228.375.521.095.02
327.775.321.895.02
427.175.222.595.02
Table 8. Physical properties of different proportions of yellow clay similarity materials.
Mix Proportion No.W/KN/m3φ/(°)c/KPaEs/MPa
116.5028.04.503.50
215.2026.03.802.50
314.5025.03.402.00
413.8124.03.031.58
Table 9. Mechanical parameters of the finite-element model.
PropertyYellow ClayConcrete
Elastic Modulus/MPa530,000
Poisson’s Ratio0.350.20
Density/kg/m314352550
Internal Friction Angle/°24/
Cohesion/KPa33/
Table 10. Initial tilt state.
PathActual Initial Tilt Value/mmModel Tilt Value/mmDeviation/mm
PATH11001022
PATH21801755
PATH32112065
PATH41731694
PATH51801755
PATH61941904
Table 11. Percentage reduction in rectification displacement increment between successive excavation stages.
Excavation StagePATH1/%PATH2/%PATH3/%PATH4/%PATH5/%PATH6/%
Stage 225.422.014.522.522.021.8
Stage 328.422.229.428.529.128.7
Table 12. Rectification efficiency of different correction methods.
PathOne-Time Underexcavation Rectification Rate/%Staged Underexcavation Rectification Rate/%
PATH198.0499.30
PATH296.0099.43
PATH396.1298.06
PATH494.0898.82
PATH594.8697.14
PATH695.2697.89
Table 13. Comparison between prototype-scale equivalent results from the physical model test and the numerical simulation.
Excavation StageModel Test Rectification/mmIncrement/mmNumerical Simulation Rectification/mmIncrement/mm
Stage 185/82.20/
Stage 213348.00152.5070.30
Stage 317643.00202.1049.60
Rectification rate/%83.17%/98.06%/
Disclaimer/Publisher’s Note: The statements, opinions and data contained in all publications are solely those of the individual author(s) and contributor(s) and not of MDPI and/or the editor(s). MDPI and/or the editor(s) disclaim responsibility for any injury to people or property resulting from any ideas, methods, instructions or products referred to in the content.