Article

Parameter Calibration of Ultra-Fine Zirconia-Based Powder Used in Thermal Barrier Coatings for Discrete Element Method (DEM) Simulation Based on an Improved Scaling Scheme

1
Functional Coating and Equipment Technology Institute, Chinese Academy of Agricultural Mechanization Sciences Group Co., Ltd., Beijing 100083, China
2
Engineering Research Center for High-Temperature Protective Coating Technology and Equipment of Machinery Industry, Beijing 100083, China
*
Author to whom correspondence should be addressed.
Coatings 2026, 16(9), 1016; https://doi.org/10.3390/coatings16091016
Submission received: 22 July 2026 / Revised: 21 August 2026 / Accepted: 24 August 2026 / Published: 26 August 2026
(This article belongs to the Section High-Energy Beam Surface Engineering and Coatings)

Highlights

What are the main findings?
  • A novel parameter calibration method for ultra-fine powder was developed.
  • An improved scaling scheme for parameter calibration of ultra-fine zirconia-based powder was developed.
  • The simulated repose angle (53.87°) agrees with the experimental measurements (50–56°, mean: 53.67°).
What are the implications of the main findings?
  • They provide a systematic method reference for the parameter calibration of ultra-fine powder.
  • The calibrated parameters provide reference values for DEM simulations of similar static or quasi-static conditions.
  • They demonstrate the feasibility of the proposed scaling scheme for angle of repose-based parameter calibration of ultra-fine zirconia-based powder.

Abstract
Ultra-fine zirconia-based powder used in thermal barrier coatings is a core raw material for high-performance coatings, but its small particle size causes clogging during discharge. The discrete element method (DEM) can simulate powder flow and is an effective numerical tool to study clogging, yet discrete element parameters of this powder are lacking. In this work, irregular particles were simplified as soft spheres and scaled from D50 = 1.2 µm to D50 = 240 µm using an improved scaling scheme derived from classical particle scaling and similarity principles. The Hertz-Mindlin with Johnson-Kendall-Roberts Version 2 (JKR V2) contact model in EDEM was adopted, with the angle of repose as the calibration response. The two-level fractional factorial design showed that the particle-particle coefficient of static friction had the largest absolute main effect, followed by JKR surface energy and the particle-stainless steel coefficient of static friction. Steepest ascent tests determined optimal ranges: 0.7–0.9 for particle-particle static friction and 0.17–0.27 for JKR surface energy; the particle-stainless steel friction was fixed at its median of 0.45. An orthogonal test combined with linear interpolation yielded the calibrated parameter combination: 0.8 and 0.19, respectively. The simulated angle of repose was 53.87°, which lies within the experimentally measured range of 50–56° and differs by 0.37% from the experimental mean of 53.67°, showing good agreement between the simulation and experiment under the present calibration condition. The calibrated parameters may provide reference values for DEM simulations of similar static or quasi-static conditions; however, their applicability to other granular flow conditions, including discharge, requires further independent validation.

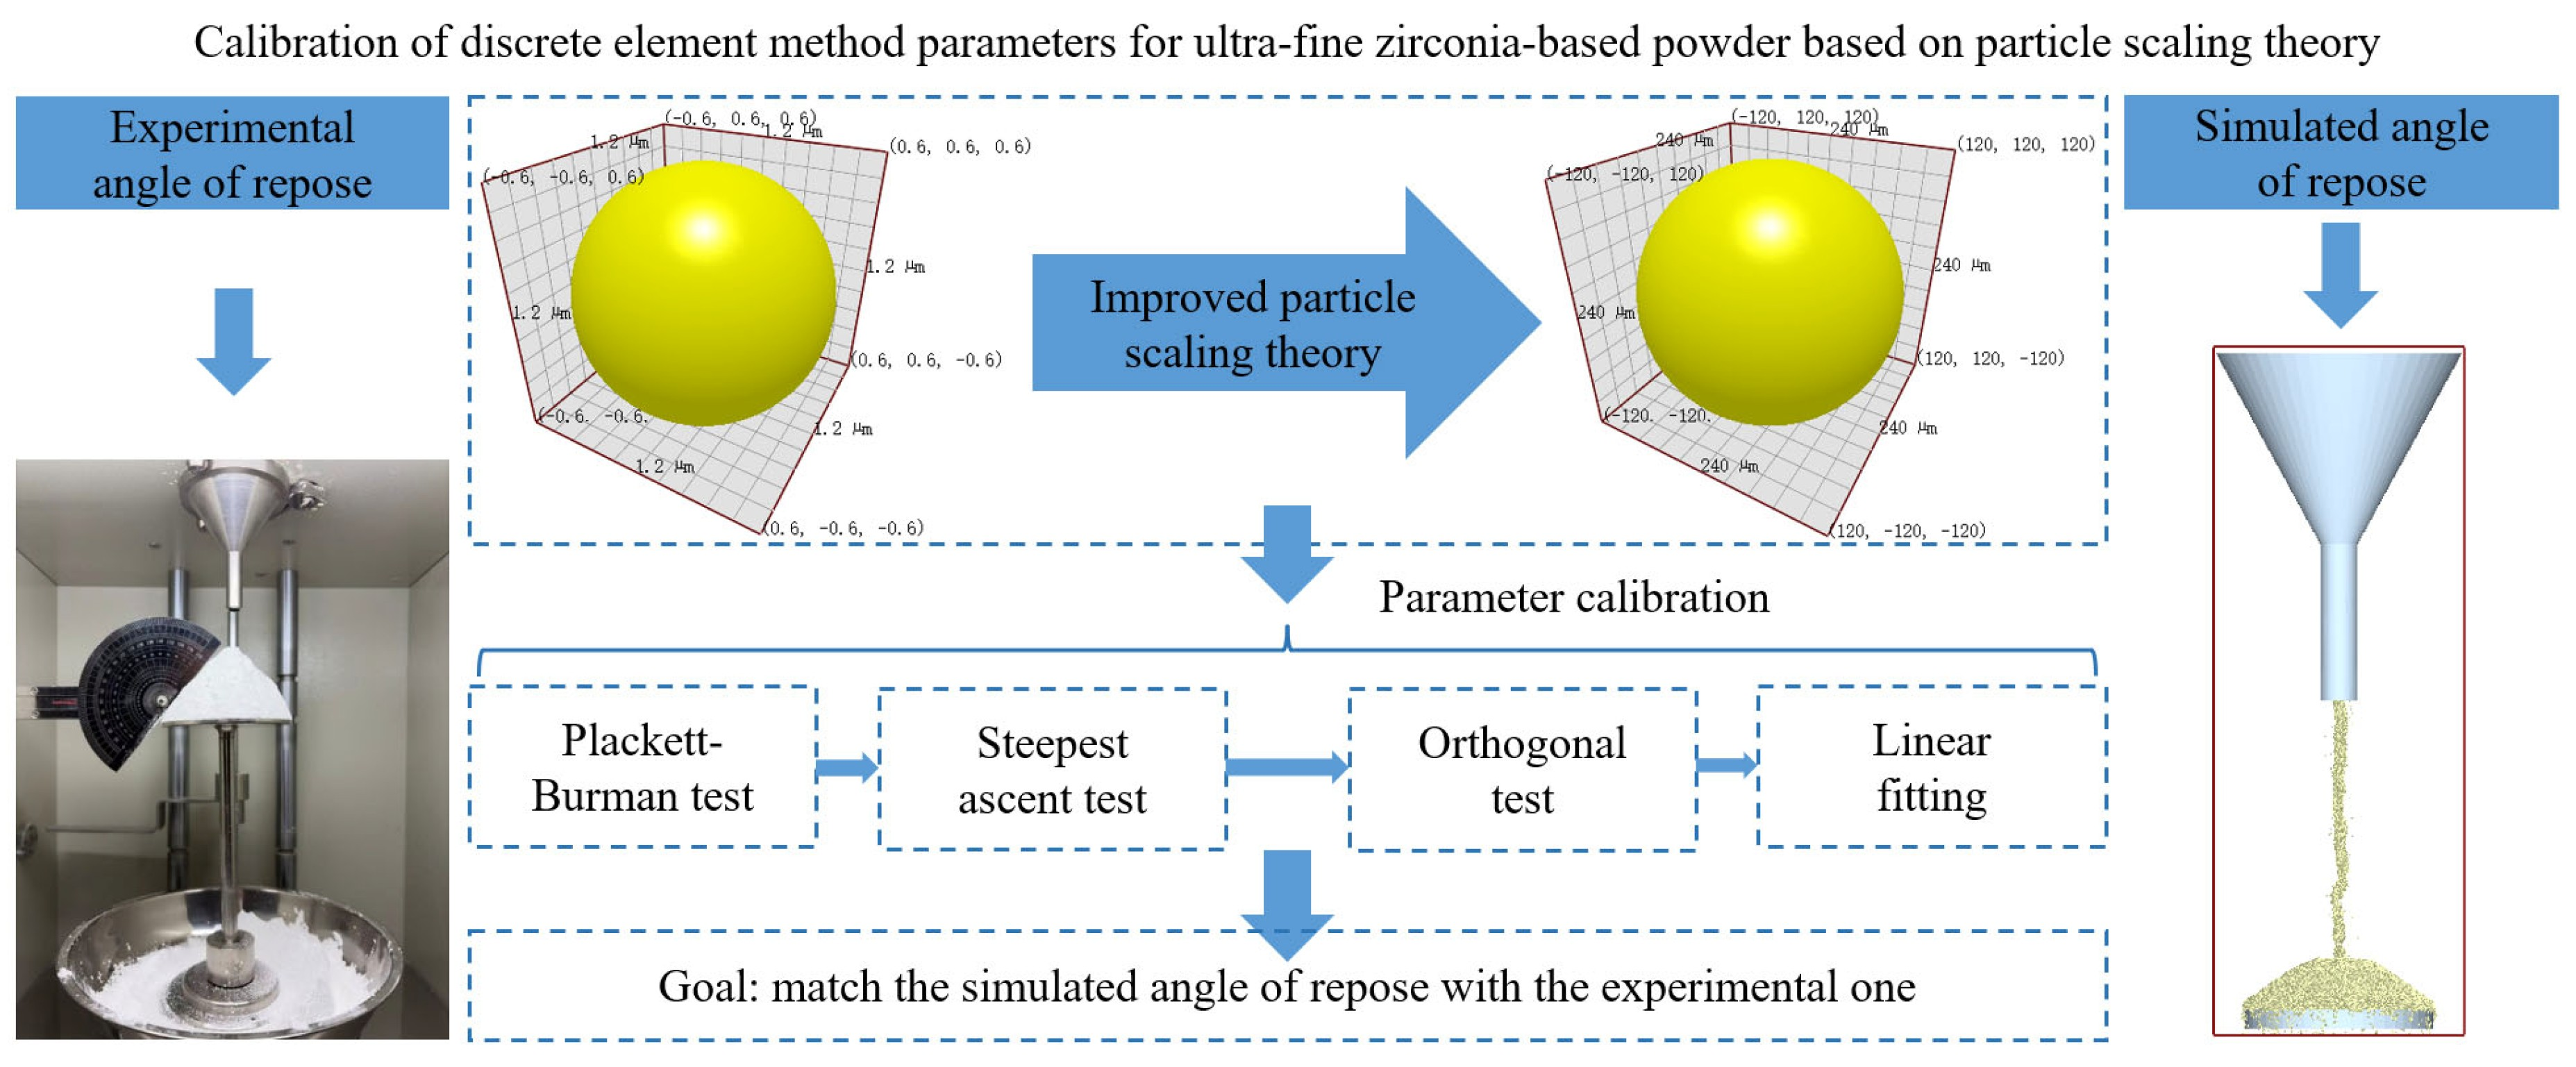
Graphical Abstract

1. Introduction

Thermal barrier coatings (TBCs) are widely applied to the surfaces of hot-end components such as aero-engines and gas turbines. They insulate the hot-end components from high-temperature combustion gases, effectively reducing the surface temperature of the metal substrate and preventing direct erosion of the metal substrate by hot gases, thereby protecting the hot-end components, improving thermal efficiency, and extending the service life of these components [1,2,3,4]. Zirconia-based ceramics, owing to their excellent high-temperature resistance, low thermal conductivity, and good chemical stability, have made zirconia-based powder the preferred raw material for the ceramic layer of thermal barrier coatings [5,6]. In recent years, with the rapid development of coating preparation technologies, processes, and coating materials, ultra-fine powders, as key raw materials for preparing high-performance thermal barrier coatings, have exhibited excellent properties that can significantly enhance coating insulation, corrosion resistance, and service life [7,8,9,10]. However, due to their extremely high specific surface area and strong inter-particle forces (such as van der Waals forces and electrostatic forces), such powders are highly prone to agglomeration, arching, and wall adhesion, resulting in very poor flowability [11], which has become one of the key bottlenecks in preparing high-quality thermal barrier coatings.
The discrete element method (DEM) [12,13,14] provides an effective means to deeply investigate particle interactions and static or quasi-static flow behavior of ultra-fine zirconia-based powder during discharge processes. Currently, DEM has been widely used in research on particle behavior in agriculture, industry, and pharmaceuticals [15,16,17,18,19]; however, studies on ultra-fine powders remain relatively scarce. The particle size of such powder is typically below 10 µm, featuring a large specific surface area and significant inter-particle interactions. Direct DEM simulation would require an extremely large number of particles, making the calculation computationally prohibitive on a conventional workstation. While significant progress has been made in DEM simulations for micron- and millimeter-sized particles, a critical gap remains for ultra-fine cohesive powders (e.g., D50 < 10 µm), where the interplay between strong adhesive forces and particle-scale mechanics is not well captured by existing models. Although some studies have investigated other types of fine powders, there is a notable lack of systematic parameter calibration strategies specifically tailored to ultra-fine zirconia-based powders used in TBCs, which possess unique physical and chemical characteristics.
Particle scaling theory, which reasonably scales up the original particle size and reduces the number of discrete elements in the model, can effectively overcome the computational bottleneck in simulating ultra-fine particles. This method has been validated in simulation studies of fine particulate materials such as ultra-fine iron tailings, flour, and wheat flour, confirming its scientific validity and feasibility [20,21,22]. Applying particle scaling theory to DEM simulations of ultra-fine zirconia-based powder for thermal barrier coatings offers a promising solution to the computational challenge. However, after particle size scaling, the discrete element parameters change accordingly and are difficult to measure directly by conventional experimental methods. There is an urgent need to determine accurate parameters through virtual calibration to ensure simulation accuracy. Nevertheless, existing calibration methods are often case-specific and lack a generalized framework for ultra-fine powders, particularly in addressing the distortion of adhesive forces caused by particle scaling under constant gravitational conditions, a challenge that remains largely unresolved in the literature.
To obtain calibrated discrete element parameters for ultra-fine zirconia-based powder used in thermal barrier coatings and to support further investigation of particle interactions and static or quasi-static flow behavior, this study develops and adopts an improved scaling scheme based on dimensional analysis and similarity theory [23,24,25]. The novelty of this work lies in two key aspects: (i) the development of a dedicated scaling scheme for the quasi-static angle of repose test, in which the gravitational field is kept constant and the resulting change in the relative importance of adhesion is compensated for through systematic parameter calibration; and (ii) the proposal of a multi-step calibration methodology integrating design of experiments with linear interpolation to efficiently determine a calibrated discrete element parameter combination. Irregularly shaped ultra-fine zirconia-based particles are simplified as soft spherical particles and then scaled. The Hertz-Mindlin with JKR V2 contact model in EDEM is adopted, and the angle of repose is used as the calibration response [26,27]. The two-level fractional factorial design is used to rank the relative main-effect magnitudes of the model parameters. The parameters with the highest-ranked absolute main effects are then selected for the steepest ascent test to determine appropriate parameter ranges. An orthogonal test combined with local linear interpolation is subsequently used to obtain the calibrated parameter combination. The resulting parameters may provide reference values for DEM simulations under similar static or quasi-static conditions; however, their applicability to other granular flow conditions, including discharge, requires further independent validation.

2. Materials and Measurement of Physical Property Parameters

2.1. Acquisition of Test Materials

Raw material: ultra-fine zirconia-based powder used in thermal barrier coatings produced by smelting and crushing from Zhengzhou Zhenzhong Electric Fusion New Materials Co., Ltd. (Zhengzhou, China). The main components of the powder were measured by X-ray fluorescence spectrometry (XRF) as ZrO2 + HfO2 (91.84%) and Y2O3 (7.79%). The powder bulk density was 2.05 g/cm3. The particle size distribution of the raw material, measured using a BT-9300H laser particle size analyzer (Bettersize Instruments Ltd., Dandong, China), is shown in Table 1.
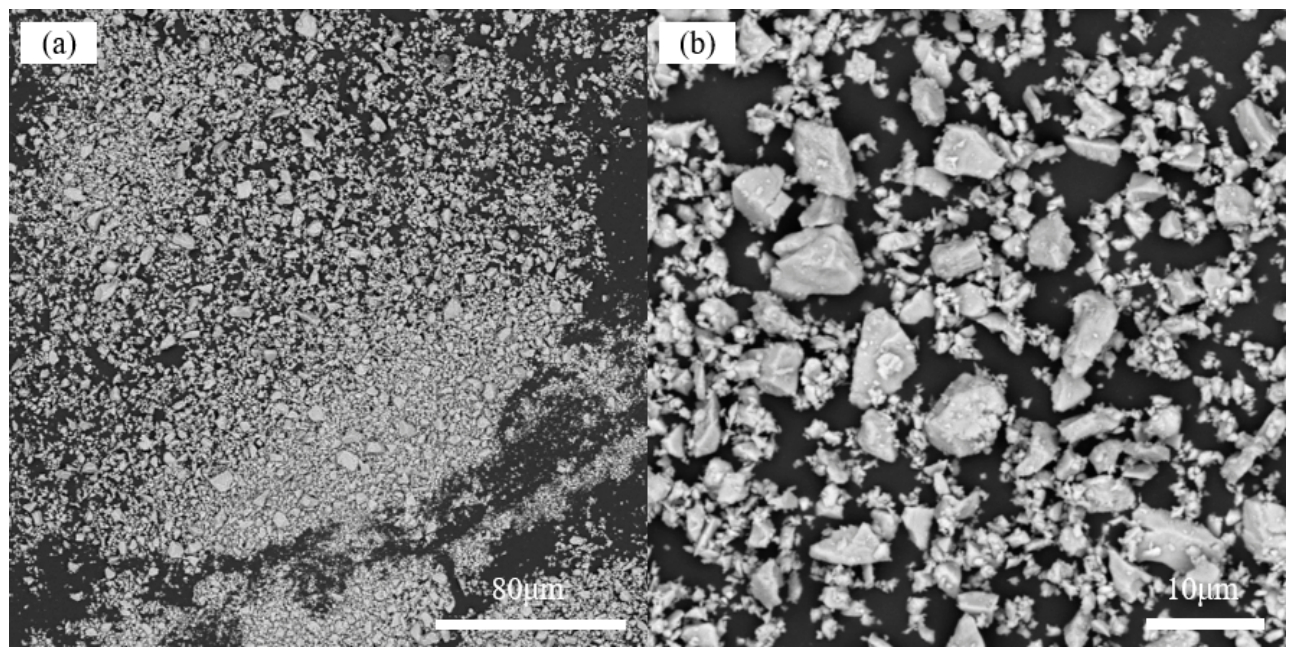
To intuitively characterize the micromorphology of the powder used in the experiment, Figure 1 presents scanning electron microscope (SEM) images of the powder particles at different magnifications. Figure 1a (1000× magnification, scale bar: 80 μm) reveals that the powder system exhibits an irregular block-like structure with varying particle sizes, characterized by a notably broad particle size distribution, and the particle packing is accompanied by a large number of fine powders. Further observation of the fine characteristics of individual particles through Figure 1b (5000× magnification, scale bar: 10 μm) indicates that the particle morphology is highly irregular, with rough and angular surfaces. Additionally, a large number of submicron and even nano-scale debris particles are tightly adhered to the surfaces of the larger particles.

2.2. Measurement of Physical Property Parameters of the Powder

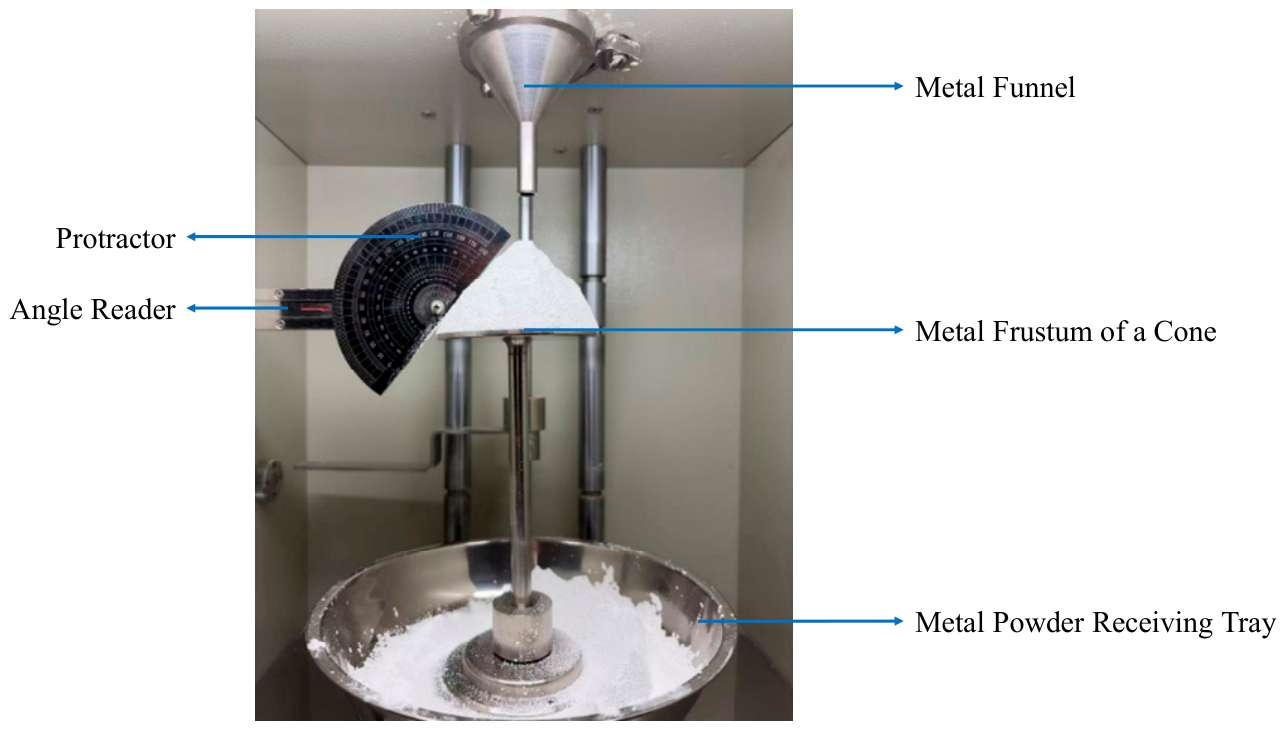
According to the determination of angle of repose (injection onto a limited base method) specified in Section 4.5 of the current national standard GB/T-16913-2008 (Methods of dust property test) [28] and relevant literature on angle of repose measurement of bulk materials [29], the angle of repose of the ultra-fine zirconia-based powder was measured. The measurement apparatus for angle of repose is shown in Figure 2. The inner diameter of the metal funnel outlet was 6 mm; the upper inner diameter was 50 mm; the cone height was 40 mm; the metal frustum of a cone had a diameter of 80 mm, and the distance from the metal funnel outlet to the upper surface of the metal frustum of a cone was 65 mm. First, the ultra-fine zirconia-based powder was dried at 105 °C for 4 h. During the measurement, the powder was slowly poured into the metal funnel, and a glass rod was used to gently stir the powder to prevent zirconia particles from clogging the metal funnel outlet. After a certain amount of powder overflowed from the metal frustum of a cone, the addition of powder was stopped. When the height of the powder pile no longer changed, a protractor was placed on the left side of the metal frustum of a cone close to the powder pile to measure the angle of repose. The angle of repose was measured once at three different positions, giving values of 50°, 55°, and 56°, respectively. The mean value was 53.67°. The measured values ranged from 50° to 56°, indicating a certain spatial variability in the experimental repose angle. Therefore, the mean value of 53.67° was used as the calibration target, while the measured range was also considered when evaluating the agreement between simulation and experiment.

3. Particle Scaling Theory and the Scenario-Specific Scaling Scheme Adopted in This Study

The ultra-fine zirconia-based powder has a particle size of D50 = 1.2 µm. Direct discrete element method simulation would involve a huge number of particles and incur extremely high computational costs. Particle scaling theory, based on dimensional analysis and similarity theory, can scale up the particle size and greatly reduce the computational load while maintaining the similarity of macroscopic flow characteristics. It is an effective method to overcome the computational bottleneck in DEM simulation of ultra-fine powders.
In this study, classical particle scaling theory is used as the theoretical basis, while scenario-specific modifications and simplifications are introduced for the quasi-static pile-formation process of the angle of repose test, forming an improved scaling scheme for the present calibration problem.

3.1. Dimensional Analysis

To ensure the rationality and validity of discrete element method simulation, when simplifying and scaling the particles, the simulation parameters must be adjusted accordingly so that the scaled particle model can reproduce the dynamic and static characteristics of the original physical system as closely as possible, thereby reducing simulation errors caused by particle size scaling. This can be achieved by introducing a scale factor to establish the proportional relationships of various physical quantities between the original physical model and the scaled model [24].
q ¯ = λ q · q
where q ¯ is any parameter of the scaled model; q is any parameter of the original physical model; and λ q is the scale factor.
In a mechanical system where other physical phases such as thermal, electrical, and magnetic effects are not considered, there are three fundamental physical quantities: length L, density ρ , and time T. The scale factors for the three fundamental quantities can be chosen as: λ L   =   h ;   λ ρ   =   1 ;   λ T   =   h . The other parameters of the model can be expressed as:
λ q = λ L a · λ ρ b · λ T c = h i
where h is the scale factor; a, b, and c are constants; and i is any number from 0, 1, 2, …, n.
For the mass M   =   ρ · V , it holds that:
M = ρ · L 3 λ M = λ ρ · λ L 3 = h 3
Except for a few independent fundamental quantities, the scale factors of other physical quantities are derived based on their dimensional relationships with the fundamental physical quantities (following the same derivation process as for mass M), as shown in Table 2.
Through dimensional analysis, it can be found that some parameters: density D , Poisson’s ratio ν , Young’s modulus E, and shear modulus G are independent of the scale factor h. Therefore, these intrinsic parameters can remain the same in the scaled model as in the original physical model.

3.2. Similarity Theory

Feng et al. [23] developed a similarity theory for discrete element method simulation modeling by drawing on the similarity principles in traditional fluid mechanics. According to this theory, before and after particle scaling, the material particles must satisfy geometric similarity, mechanical similarity, and dynamic similarity. This theory applies equally to spherical and non-spherical particles. To simplify the analysis, the irregularly shaped ultra-fine zirconia-based powder particles are considered as soft spherical particles for analysis.

3.2.1. Geometric Similarity Theory

The primary condition for similarity theory is to fully comply with the classical geometric similarity theory, i.e., the original physical model and the scaled model should have an identical particle packing structure, and the particle size and characteristic dimensions of the model region differ only by a uniform scaling factor [23,30].
Let the scaling factor be h, and let Rp and Rm represent the radii of any particle in the original physical model and the scaled model, respectively, and Dp and Dm represent the characteristic lengths of the two models, respectively. Then the geometric similarity theory can be expressed as:
R m R p = D m D p = h
i.e., the corresponding geometric dimensions in the two models are proportional, and the scaling factor is h.

3.2.2. Mechanical Similarity Theory

Under the premise that the geometric similarity theory is satisfied (i.e., the particle packing structure is consistent and all length dimensions are strictly scaled by the scaling factor h), this theory essentially requires that the constitutive relationship of particle interactions be scale-invariant. Its applicability covers all contact modes, including normal, tangential, and rotational contacts, as well as complex interactions such as cohesion and liquid bridges [23,31].
Now consider an arbitrary particle with radius Rp in the original physical model. Its motion in one principal direction is governed by Newton’s second law:
M p · u p ¨ + F p ( u p , R p ) = Q p ( t )
where Mp is the mass of the particle, up and u p ¨ are the displacement and acceleration in the relevant direction, respectively, F p ( u p , R p ) is the interaction force between neighboring particles, and Qp is the net external force acting on the particle.
This equation actually simplifies the original physical model in two respects:
(1) It represents the motion of a particle in any one direction among the six degrees of freedom (three translational and three rotational);
(2) F p ( u p , R p ) represents the resultant force of all interactions with neighboring particles.
Considering a quasi-static condition in the mechanical similarity theory, the inertial term M p u p ¨ in Equation (5) can be neglected, and the equation then becomes:
F p ( u p , R p ) = Q p ( t )
To establish mechanical similarity at the particle scale, the following characteristic quantities and dimensionless variables need to be introduced:
The characteristic length, area, and volume are defined as:
L p = 2 · R p
A p = L p 2
V p = L p 3
Particle strain, stress, and strain energy density are defined as:
ε p = u p L p
σ p = F p ( u p , R p ) A p
e p ( ε p , R p ) = 0 ε p σ p d ε
Therefore, Equation (6) can be substituted into the particle stress formula for calculation, yielding:
σ p = q p
where
q p = Q p ( t ) A p
Similarly, the corresponding equation for a particle with radius Rm in the scaled model can be expressed as:
σ m = q m
where
q m = Q m ( t ) A m
We now point out that if the particle strain, stress, and strain energy functions are the same in the two models, then the models are mechanically similar. Therefore, the mechanical similarity theory requires that:
ε p = ε m
σ p = σ m
e p = e m
And
q p = q m
The following conditions must be satisfied to meet the mechanical similarity theory by transforming Equations (17)–(20) into their counterparts in the original physical quantities and combining them with the geometric similarity theory:
ε p = ε m u p L p = u m L m L m L p = u m u p = h
σ p = σ m F p ( u p , R p ) A p = F m ( u m , R m ) A m F m ( u m , R m ) F p ( u p , R p ) = A m A p = h 2
e p = e m 0 ε p σ p d ε = 0 ε m σ m d ε
q p = q m Q p ( t ) A p = Q m ( t ) A m Q m ( t ) Q p ( t ) = A m A p = h 2
When gravity is considered in the original physical model, it can be obtained that:
Q m ( t ) Q p ( t ) = M m g M p g = V m V p = h 3
It can be seen that Equation (25) contradicts Equation (24). When gravity is considered, the scaling factor for external forces (h3) is inconsistent with that in mechanical similarity theory (h2). To satisfy the similarity conditions, the gravitational field in which the scaled model resides must be altered. The theoretical derivation shows that the scaled model should be placed under a modified gravitational acceleration gm as follows:
g m = g / h

3.2.3. Dynamic Similarity Theory

When the inertial forces of particles cannot be neglected, additional conditions must be satisfied to ensure that the calculation results of the scaled model can be transformed by scaling to correspond to the results of the actual original physical model. These additional conditions constitute the dynamic similarity theory. The dynamic similarity theory is defined as follows: all forces (inertial, internal, and external) acting on particles in the original physical model and the scaled model should be in the same proportion [25]. Referring to the dynamic equation of a particle, Equation (5), the dynamic similarity theory therefore requires:
M m · u m ¨ M p · u p ¨ = F m ( u m , R m ) F p ( u p , R p ) = Q m ( t ) Q p ( t ) = h 2
According to
M m M p = h 3
The condition for ensuring that the original physical model and the scaled model are completely equivalent under general dynamic conditions is:
u m ¨ u p ¨ = 1 h

3.3. Scenario-Specific Modification and Simplification

3.3.1. Parameter Retention Principle Based on Dimensional Analysis

According to the conclusion of dimensional analysis in Section 3.1, the scale factors of some parameters (density, Poisson’s ratio, Young’s modulus, shear modulus) are 1, independent of the particle scaling factor h. Therefore, in full compliance with the theoretical requirements, the present study keeps the above parameters unchanged before and after scaling, directly adopting measured values and literature values without any correction, ensuring that the material properties satisfy dimensional consistency.

3.3.2. Modifications and Simplifications Based on Similarity Theory

Targeting the quasi-static pile formation process in the angle of repose test, this study introduces three scenario-specific modifications and simplifications based on classical similarity theory, forming a dedicated scaling scheme suitable for ultra-fine zirconia-based powder:
(1) Geometric similarity theory requires that the particle packing structure be identical between the original physical model and the scaled model, and that the particle size and characteristic dimensions of the model region follow a uniform scaling factor h. The modification adopted in this study is as follows: keep the main geometric dimensions of the simulation model consistent with the experimental apparatus, except that the base-plate diameter is reduced from 80 mm to 50 mm to reduce computational cost [32], and scale the particle size of the ultra-fine zirconia-based powder from D50 = 1.2 µm to D50 = 240 µm. Since the angle of repose in this study is dominated by friction and adhesion between particles and is weakly correlated with equipment absolute dimensions, this modification is expected to have a limited influence on the simulated angle of repose while greatly reducing the computational load.
(2) Mechanical similarity theory requires that the gravitational field in which the scaled model resides be altered, i.e., the gravitational acceleration should be corrected. The present study simplifies this treatment: keep the gravitational field g in the scaled model (simulation model) unchanged, i.e., retain the standard gravitational acceleration as a modeling parameter.
However, a critical issue arises from this simplification. As can be seen from the Bond number formula:
B O = ρ · g · L char 2 γ
where ρ denotes the density difference, g is the gravitational acceleration, L char is the characteristic particle length, and γ represents the JKR surface energy parameter. It should be emphasized that the surface energy γ is a contact/material parameter and does not itself scale linearly with particle radius. In JKR contact theory, the characteristic adhesive (pull-off) force is proportional to the product of the effective particle radius and the JKR surface energy, i.e., F adh R * · γ . Therefore, when the particle radius is scaled by a factor of h while the gravitational acceleration and surface energy parameter are kept unchanged, the particle weight scales approximately as h3, whereas the characteristic JKR adhesive force scales approximately as h. Consequently, the relative contribution of gravity compared with adhesion increases approximately as h2, consistent with the radius-squared dependence represented by Equation (30). Thus, retaining the same JKR surface energy parameter after particle scaling would reduce the relative importance of interparticle adhesion.
Accordingly, the JKR surface energy parameter of the scaled particles is recalibrated through virtual calibration in the present study. The gravitational acceleration g is kept constant throughout the calibration process and is not included as an optimization variable. Therefore, the calibrated parameter set should be interpreted as an equivalent numerical parameter set corresponding to the specified gravitational condition and the present DEM model.
(3) Dynamic similarity theory introduces inertial forces and applies to the construction of dynamic models. The simulation model constructed in this study is for the formation process of the angle of repose, which is essentially quasi-static stacking with negligible inertial forces. Therefore, it is unnecessary to introduce dynamic similarity theory.

3.4. Final Particle Scaling Scheme Adopted in This Study

(1) The scale factors of some parameters (density, Poisson’s ratio, Young’s modulus, shear modulus) are taken as measured values of the material;
(2) Particle size: the particle size of the ultra-fine zirconia-based powder is scaled from D50 = 1.2 µm to D50 = 240 µm. The main geometric dimensions of the angle-of-repose apparatus are kept consistent with the experimental setup, except that the base-plate diameter is reduced from 80 mm to 50 mm to reduce computational cost [32].
(3) The gravitational field g in the scaled model (simulation model) is kept unchanged.

4. Parameter Calibration

4.1. Contact Model Adapted to Particle Contact Characteristics

In parameter calibration, it is necessary to simulate both free contact between particles and constrained contact between particles and rigid equipment walls. Therefore, contact models with corresponding characteristics are adopted as follows:
(1) For particle-particle contact, the ultra-fine zirconia-based powder is a cohesive ultra-fine powder. The Hertz-Mindlin with JKR V2 contact model is selected. This model is a combination of the Hertz-Mindlin contact model and the JKR cohesion model. It is a cohesive contact model that takes into account the van der Waals forces in the contact area and introduces the surface energy parameter to characterize the adhesion effect between particles, matching the contact characteristics of ultra-fine particles that are prone to agglomeration [33,34,35].
(2) For particle-geometry boundary contact, the Hertz-Mindlin (no-slip) contact model is selected. The geometric boundary is a rigid wall (without deformation), and a “no-slip” constrained contact state needs to be simulated between particles and the wall. This model simplifies the tangential constraint conditions and can accurately describe the normal compression and tangential non-slip contact behavior between particles and rigid geometric surfaces, which is suitable for the rigid contact characteristics between the equipment wall and particles.

4.2. EDEM Simulation Model Establishment

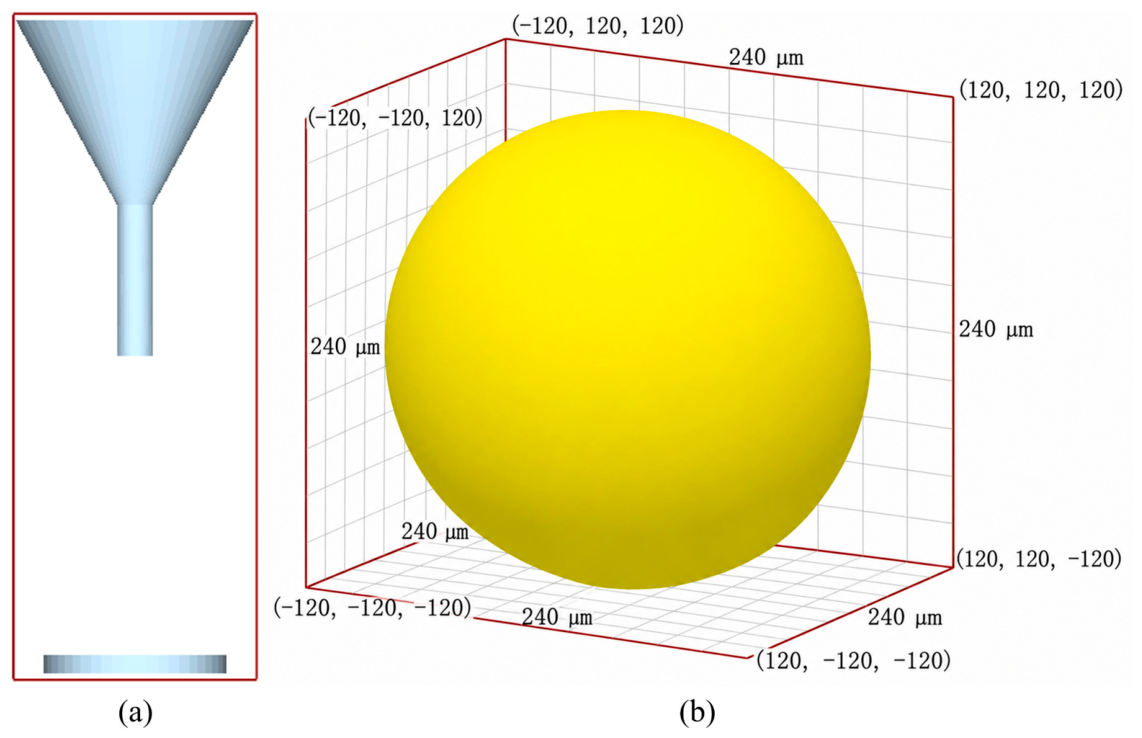
Referring to the angle of repose measurement apparatus shown in Figure 2, the apparatus was modeled in the three-dimensional modeling software SolidWorks (Dassault Systèmes SolidWorks Corporation, Waltham, MA, USA). A glass rod was used only for auxiliary dredging during physical feeding to avoid powder blockage, and it does not contact the stable powder heap in the later stacking stage; hence, the glass rod geometric structure is omitted in the simulation without affecting the final repose angle result. Since the angle of repose of the powder is independent of the diameter of the base plate [32], the diameter of the base plate was set to 50 mm to shorten the simulation calculation time, while other dimensional parameters were kept consistent with those of the apparatus in Figure 2. The three-dimensional model was imported into EDEM 2025 software (Altair Engineering Inc., Troy, MI, USA), as shown in Figure 3a. The ultra-fine zirconia-based powder was set as a single sphere with D50 = 240 µm, as shown in Figure 3b.

4.3. Simulation Parameters

4.3.1. Scaling Factor Parameter

Referring to relevant literature on particle scaling in discrete element method simulations, the particle size of the ultra-fine zirconia-based powder was appropriately scaled by a factor of 200, from D50 = 1.2 µm to D50 = 240 µm [24]. The scaling factor was determined according to Equation (31) and Table 3 (after scaling, parameter calibration is necessary to ensure that the simulation results reflect the flow characteristics of the real powder) to reduce computational cost.
S n = D R
where Sn is the scale number, D represents the characteristic dimension in the original physical model (i.e., the outlet size of the model, 6 mm), and R represents the radius of the original powder particles (i.e., 0.6 µm). The calculation gives Sn = 10,000, corresponding to Sn > 103 in Table 3.
For Macro-scale (industrial) problems, due to limited computational resources, effective modeling via the discrete element method is not yet feasible; techniques such as scaling (with mandatory parameter calibration) must be employed to reduce computational cost. When Sn is reduced to 102, and the typical number of particles is below 106, conventional DEM modeling becomes feasible [24].
Therefore, the powder particles were scaled to R = 120 µm, i.e., a particle size of 240 µm, giving Sn = 50. At this point, the typical number of particles required is about 105, which falls within the Micro-scale category (Sn < 102 and the typical number of particles <106), thus allowing conventional DEM modeling.

4.3.2. Quantitative Assessment of Computational Benefits

To quantitatively evaluate the computational advantage of the particle scaling strategy adopted in this work, we compared the model scale and resource consumption before and after scaling. The original industrial-scale problem, using real particle sizes, would require approximately 109 particles, making conventional DEM simulation infeasible on a single workstation. After scaling the particle radius to 120 µm, the typical particle count decreased to about 105, i.e., a reduction by four orders of magnitude. Under the hardware configuration of an Intel i9-14900K processor (Intel Corporation, Santa Clara, CA, USA) with an NVIDIA RTX 5090 GPU (NVIDIA Corporation, Santa Clara, CA, USA), the simulation time per case dropped from being infeasible to roughly 6 h. This scaling not only made routine DEM modeling feasible, but also greatly reduced computational costs.

4.3.3. Other Simulation Parameters

The discrete element parameter types in the simulation test of ultra-fine zirconia-based powder include intrinsic parameters, contact parameters, and contact model parameters (JKR surface energy). Referring to domestic and international literature on the setting of discrete element method simulation parameters for ultra-fine powders and stainless steel, combined with particle scaling theory and related research on powders, the intrinsic parameters of the ultra-fine zirconia-based powder were set as follows: density 5600 kg/m3, Poisson’s ratio 0.3, shear modulus 60 MPa. The intrinsic parameters of stainless steel were set as follows: density 7800 kg/m3, Poisson’s ratio 0.3, shear modulus 70,000 MPa. The contact parameters and contact model parameters of the material, especially for ultra-fine powders, vary significantly with powder density, shape, particle size, etc., and are difficult to obtain directly through experimental tests or literature review. Therefore, they are calibrated through virtual tests.
Among them, the shear modulus of powder particles was set to 60 MPa, which is much lower than the intrinsic shear modulus of dense zirconia ceramics. This setting is an equivalent soft particle treatment commonly used in DEM simulations, rather than representing the true mechanical properties of the material. If the high shear modulus (several thousand MPa) of dense ceramics were directly adopted, the particle contact stiffness would be extremely large, forcing the simulation time step to be compressed to a very small value, and the computational load for particle generation and packing would increase exponentially, making it impossible for an ordinary workstation to complete the angle of repose simulation with millions of particles. Appropriately reducing the shear modulus can increase contact deformation, significantly increase the simulation time step, and greatly reduce computational cost. Referring to the research of Lu et al. [36], the artificial softening of particle shear modulus is a widely adopted strategy to improve computational efficiency in DEM simulations. It has been verified that the reduction in contact stiffness has negligible influence on particle velocity and macroscopic particle accumulation morphology. The distortion induced by softening treatment only exists in thermally coupled simulations with inter-particle heat transfer calculation, which is not involved in the quasi-static repose angle simulation of this study. Therefore, the shear modulus was set to 60 MPa to balance calculation cost and simulation accuracy.
The ultra-fine zirconia-based powder has a small particle size and is similar to dust. Referring to discrete element method simulation studies of other similar powder materials and using the Generic EDEM Material Model (GEMM) database built into EDEM, the ranges of the simulation parameters used in the model were obtained, as shown in Table 4.
The particle generation method was set to “Dynamic”, with a total of 1 × 10⁶ particles generated at a rate of 1 × 10⁵ particles per second. The simulation time was 10 s, and the Rayleigh Percentage was set to 20%. The solver adopted the Euler time integration scheme with an automatic time step disabled. The fixed integration time step was set to 7.78 × 10⁻⁷ s. After the powder generation was completed, the powder was allowed to settle on the base plate for 2 s, and then the simulation was terminated.

4.4. Angle of Repose Measurement

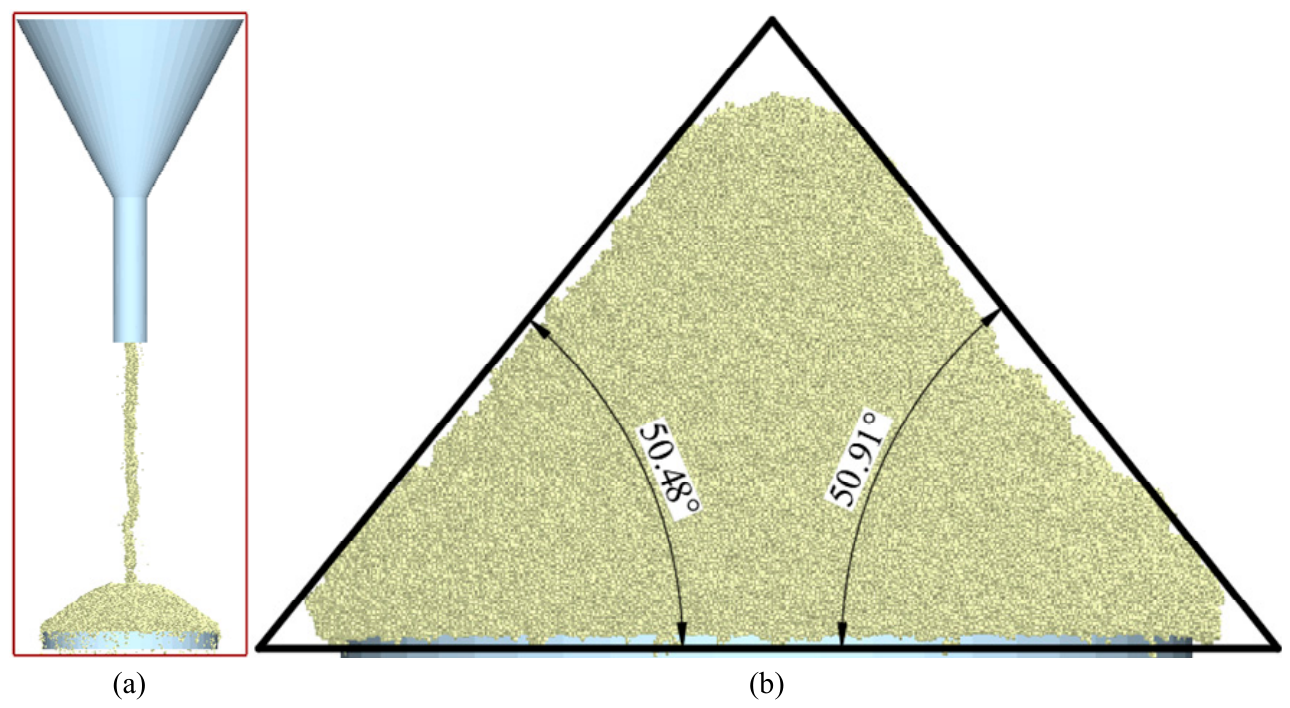
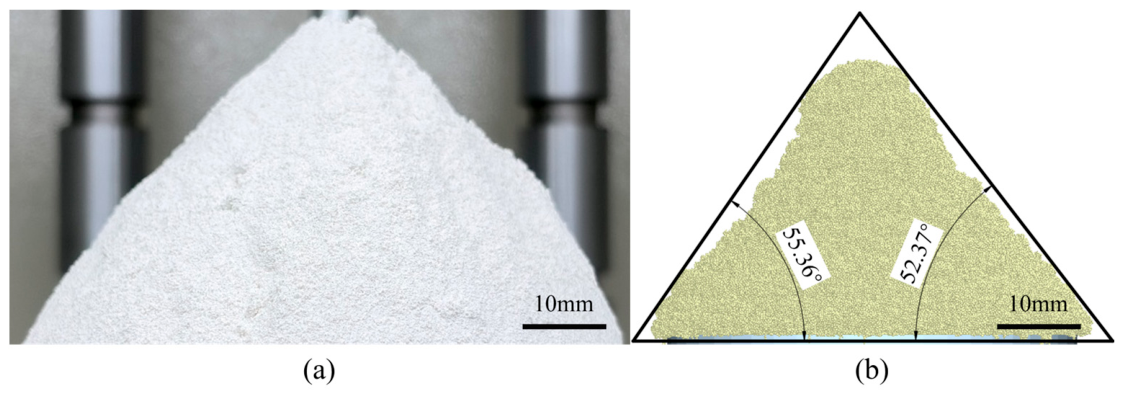
To reduce the measurement error of the angle of repose, a screenshot was captured after the simulation, and the repose angle was determined accordingly. The simulation process is shown in Figure 4a, and the post-processed measurement of the angle of repose is shown in Figure 4b.

4.5. Simulation Test Design

4.5.1. The Two-Level Fractional Factorial Design

The two-level fractional factorial design performs analysis by selecting partial factor level combinations. Under the premise that interactions between various parameters are temporarily ignored, this design can compare the relative magnitude of the effect of all parameters on the repose angle. The test factors and their low and high level values are listed in Table 5. For each parameter, the low level is taken as the minimum value of its range in Table 4, and the high level is set to twice the low-level value. The complete test scheme and simulated repose angle results are shown in Table 6.
A total of 12 simulation runs were arranged in this study. For Runs 11 and 12, the powder spread and overflowed the base after falling, failing to form a measurable stable conical powder pile. Only valid data from the remaining 10 groups were adopted for subsequent calculation. The main effect of each parameter was solved according to the two-level factor main effect formula Equation (32). All parameters were ranked by the absolute values of main effects to quantitatively compare their relative action magnitude on the repose angle [25].
E = θ + θ
where
θ + = S + n +
θ = S n
where E is the main effect value; θ + is the average of the high-level response values; θ is the average of the low-level response values; S+ is the sum of the high-level response values; n+ is the number of high-level values; S is the sum of the low-level response values; and n is the number of low-level values.
Table 7 summarizes the calculated main effect magnitudes. Among all tested parameters, the particle-particle coefficient of static friction (B) has the largest absolute main effect value. The JKR surface energy (G) and particle-stainless steel coefficient of static friction (E) show relatively large absolute main effect values. The remaining parameters have comparatively small absolute main effect magnitudes.

4.5.2. Steepest Ascent Test

The steepest ascent test can accurately reflect the optimal range of test parameters and further narrow down the optimal response interval of the parameters. Based on the main effect ranking obtained from the two-level fractional factorial design, the three factors with the largest absolute main effect values (B, G, and E) were selected for the steepest ascent test. The step sizes were determined according to the main effect values obtained from the two-level fractional factorial design: 0.1 for B, 0.05 for G, and −0.05 for E. The remaining parameters were set to their middle levels: 0.225 for A, 0.225 for C, 0.15 for D, and 0.075 for F. The design and results of this steepest ascent test are shown in Table 8. When parameter E was set to excessively low values, the powder spread and overflowed the base after falling, failing to form a measurable stable conical powder pile. Therefore, parameter E was fixed at its median value of 0.45 while the other parameters were kept unchanged.
Although the particle-stainless steel coefficient of static friction shows a relatively large main effect value, it serves as a boundary parameter of the test apparatus rather than an intrinsic property of the powder. Numerous DEM studies confirm its reasonable value range of 0.40–0.50 [15,19], so the median value 0.45 is selected and fixed in this study. As presented in Table 8, when this particle-stainless steel coefficient of static friction is set below 0.25, the powder spreads and overflows the base after falling without forming a measurable stable conical pile, which renders the steepest ascent test invalid.
A new steepest ascent test was then conducted only for parameters B and G. The test design and results are shown in Table 9.
According to Table 9, as the values of parameters B and G increase, the simulated angle of repose also increases. The relative error first decreases and then increases. The values of parameters in run No. 5 give the smallest relative error of the angle of repose. Therefore, the orthogonal test took the values of run No. 5 as the center point, the values of run No. 4 as the low level, and the values of run No. 6 as the high level. With parameters B and G as two factors, an orthogonal test with two factors and three levels was constructed to further refine the parameter values.

4.5.3. Orthogonal Test and Linear Interpolation

In the steepest ascent test, although the relative error of the angle of repose obtained using the parameter values of run No. 5 was reduced to 5.46%, there still existed a certain gap compared with the ideal calibration error. Therefore, with parameters B and G as two research factors, the values of run No. 5 were taken as the center point, the values of run No. 4 as the low level, and the values of run No. 6 as the high level. An orthogonal test with two factors and three levels was constructed to further refine the parameter values within the selected parameter interval.
The first two columns of the L9(34) orthogonal table (four factors with three levels) were used to design this orthogonal test. The design and results of the orthogonal test are shown in Table 10.
From the data in Table 10, it can be seen that the error of test No. 4 showed a decreasing trend compared with the data after the steepest ascent test, but there was still a certain gap from the ideal calibration error. Therefore, a linear interpolation method was adopted to further reduce the error. Among them, tests No. 4 and No. 5 showed relatively small errors. Within the local parameter interval between tests No. 4 and No. 5, the simulated angle of repose crosses the experimental mean value of 53.67°, indicating that the absolute calibration error decreases and then increases within this interval. This provides favorable conditions for further determining the calibrated parameters through linear interpolation.
It should be noted that this local linear interpolation is not derived from physical theory but is based on the two data points of tests No. 4 and No. 5. In these two tests, only the JKR parameter varied while all other six influencing factors remained constant. Therefore, within this local parameter interval, the relationship between the angle of repose and the JKR parameter can be approximated as linear, serving as a practical data-fitting and parameter-interpolation approach. The local interpolation result was subsequently checked by an additional DEM simulation performed at the interpolated JKR value.
Based on the two test points (tests No. 4 and No. 5) with only the JKR parameter varied, a linear interpolation between the angle of repose and the JKR parameter can be established within this local interval, expressed as:
y = 97.4 · x + 35.172
where x is the value of the JKR parameter and y is the value of the angle of repose.
Substituting the experimental mean repose angle of 53.67° into the equation gives x = 0.19. Based on this local linear interpolation, a JKR parameter value of 0.19 is selected as the calibrated value.
It is worth noting that this simplified linear interpolation cannot fully reflect the inherent nonlinear relationship and parameter interaction between the static friction coefficient and JKR surface energy as implied in Table 10. This two-point interpolation is only used for rapid local parameter calibration in this study.

4.6. Determination of the Calibrated Parameter Combination

Based on the above calibration procedure, the calibrated parameter combination is determined as shown in Table 11.
Using the calibrated parameter combination, the simulated angle of repose was 53.87°, which falls within the experimental range of 50–56° and differs by 0.37% from the experimental mean of 53.67°. Considering the variability in the experimental measurements, this result indicates good agreement between the simulation and experiment under the present calibration condition. Figure 5 shows a comparison between the simulation test and the experimental test. In Figure 5, the base-plate diameter is 80 mm for the experimental case (a) and 50 mm for the simulation model (b). A 10 mm scale bar is provided in both sub-figures to enable direct visual comparison of geometric dimensions. It can be seen that the simulation model is a geometrically scaled-down representation of the experimental system.
The calibrated parameters in this study are equivalent numerical parameters matched to the simplified DEM model rather than intrinsic physical properties of the powder itself. The calibrated parameters may provide reference values for similar static or quasi-static conditions, whereas their applicability to other granular flow conditions requires further independent validation.

5. Conclusions

(1) Based on the improved scaling scheme, the particle size of the ultra-fine zirconia-based powder used in thermal barrier coatings was scaled from D50 = 1.2 µm to D50 = 240 µm. The discrete element parameters of the scaled powder particles were calibrated using the “Hertz-Mindlin with JKR V2” contact model in EDEM software. The main effect values obtained from the two-level fractional factorial design were used to quantify and rank the relative influence of each parameter on the angle of repose. Among the tested parameters, the particle-particle coefficient of static friction showed the largest absolute main effect, followed by JKR surface energy and the particle-stainless steel coefficient of static friction.
(2) A steepest ascent test was conducted for the three key parameters screened out from the two-level fractional factorial design. The results showed that when the coefficient of static friction between powder particles and the stainless steel container surface was set too low, a valid angle of repose could not be formed. Therefore, this parameter was first adjusted to the median value between the high and low levels to satisfy the basic test conditions. Subsequently, a new steepest ascent test was conducted for the remaining two parameters, and the optimal ranges of these parameters were determined.
(3) Within the optimal ranges of the above-determined parameters, an orthogonal test with two factors (particle-particle coefficient of static friction and JKR surface energy) and three levels was designed. The orthogonal test results were analyzed using local linear interpolation, and the calibrated parameter combination was subsequently determined.
(4) Using the calibrated parameter combination, the simulated angle of repose was 53.87°, which falls within the experimental range of 50–56° and differs by 0.37% from the experimental mean of 53.67°. Considering the variability in the experimental measurements, this result indicates good agreement between the simulation and experiment under the present calibration condition and supports the applicability of the calibrated parameter combination for the angle of repose simulation. The calibrated parameters may provide a reference for DEM simulations of similar static or quasi-static processes; however, their applicability to other granular flow conditions, such as discharge, requires further independent validation.

Author Contributions

Conceptualization, J.N. and F.K.; methodology, J.N., F.K., Y.Z. and H.G.; software, J.N.; validation, J.N.; formal analysis, J.N.; investigation, J.N., Y.Z., H.G. and X.L.; resources, Q.H.; data curation, J.N.; writing—original draft preparation, J.N.; writing—review and editing, J.N. and J.W.; visualization, J.N.; supervision, J.W.; project administration, J.W. and Q.H. All authors have read and agreed to the published version of the manuscript.

Funding

This research received no external funding.

Institutional Review Board Statement

Not applicable.

Informed Consent Statement

Not applicable.

Data Availability Statement

The data presented in this study are available on request from the corresponding author.

Conflicts of Interest

Authors Jiakun Niu, Jinjiang Wang, Qing He, Fuming Kuang, Yusheng Zhang, Huanyu Gu and Xinyu Li were employed by the company Chinese Academy of Agricultural Mechanization Sciences Group Co., Ltd. The authors declare that the research was conducted in the absence of any commercial or financial relationships that could be construed as a potential conflict of interest.

References

  1. Ashofteh, A.; Rajabzadeh, M. Advances in thermal barrier coatings modeling, simulation, and analysis: A review. J. Eur. Ceram. Soc. 2024, 44, 116693. [Google Scholar] [CrossRef] [Scilit]
  2. Rosado, E.; Cañas, E.; Recio, P.; Sánchez, E.; Moreno, R. ZrSiO4/ZrO2 thermal barrier coatings produced by suspension plasma spraying. J. Eur. Ceram. Soc. 2024, 44, 460–470. [Google Scholar] [CrossRef] [Scilit]
  3. Sezavar, A.; Sajjadi, S.A. A review on the performance and lifetime improvement of thermal barrier coatings. J. Eur. Ceram. Soc. 2025, 45, 117274. [Google Scholar] [CrossRef] [Scilit]
  4. Altaf, S.F.; Rahman, A.; Wani, M. Nanostructured thermal barrier coatings: Enhancing performance for high-temperature applications: A comprehensive review. Surf. Interfaces 2025, 72, 107033. [Google Scholar] [CrossRef] [Scilit]
  5. Morelli, S.; Bursich, S.; Bolelli, G.; Puddu, P.; Rossi, E.; Mecca, F.G.; Bortolotti, L.; Lusvarghi, L. Thermal conductivity and micromechanical properties of plasma-sprayed yttria-stabilized zirconia thermal barrier coatings. Surf. Coat. Technol. 2025, 513, 132498. [Google Scholar] [CrossRef] [Scilit]
  6. Liu, Y.; Zhang, W.; Wang, W.; Li, H.; Wang, J.; Li, K.; Liu, P.; Han, X.; Zhang, C.; Tu, S. Optimization design of dual-ceramic layers based on micro-nano dual-scale layers to improve the resistance of Yb2O3-Y2O3 co-stabilized ZrO2 TBCs to calcium-magnesium-alumino-silicate (CMAS) corrosion. Ceram. Int. 2025, 51, 53737–53747. [Google Scholar] [CrossRef] [Scilit]
  7. Sezavar, A.; Sajjadi, S.A.; Babakhani, A.; Peng, R.L.; Yuan, K. Oxidation behavior of a nanostructured compositionally graded layer (CGL) thermal barrier coating (TBC) deposited on IN-738LC. Surf. Coat. Technol. 2019, 374, 374–382. [Google Scholar] [CrossRef] [Scilit]
  8. Xue, Z.; Zhu, Y.; Yu, H.; Shi, M.; Liu, X.; Zhang, S. Nano-agglomerated powder and thermal shock cycling property of 8YSZ nano-structured thermal barrier coating. Surf. Coat. Technol. 2022, 433, 128173. [Google Scholar] [CrossRef] [Scilit]
  9. Özçelik, A.; Akdoğan Eker, A.; Karabaş, M.; Avci, A.; Küçükyildirim, B.O. Enhanced CMAS and hot corrosion degradation of YSZ thermal barrier coating with nano powders. Surf. Coat. Technol. 2024, 481, 130624. [Google Scholar] [CrossRef] [Scilit]
  10. Zhou, J.; Zheng, N.; Liu, C.; Wu, Y.; Omran, M.; Tang, J.; Zhang, F.; Chen, G. Crystal growth mechanism of nano nSc-Y/ZrO2 ceramic powders prepared by co-precipitation method. Ceram. Int. 2025, 51, 11878–11888. [Google Scholar] [CrossRef] [Scilit]
  11. Fotovat, F.; Bi, X.T.; Grace, J.R. Electrostatics in gas-solid fluidized beds: A review. Chem. Eng. Sci. 2017, 173, 303–334. [Google Scholar] [CrossRef] [Scilit]
  12. Cundall, P.A.; Strack, O.D.L. A discrete numerical model for granular assemblies. Géotechnique 1979, 29, 47–65. [Google Scholar] [CrossRef] [Scilit]
  13. Shi, Q.; Sakai, M. Recent progress on the discrete element method simulations for powder transport systems: A review. Adv. Powder Technol. 2022, 33, 103664. [Google Scholar] [CrossRef] [Scilit]
  14. Maraveas, C.; Tsigkas, N.; Bartzanas, T. Agricultural processes simulation using discrete element method: A review. Comput. Electron. Agric. 2025, 237, 110733. [Google Scholar] [CrossRef] [Scilit]
  15. Kumar, R.; Li, Z.; Guzman, H.R.; Chiarella, R.A. Particle-level insights into the powder flow behavior of the fette 1200i tablet press feed frame using the discrete element method (DEM). Powder Technol. 2024, 439, 119728. [Google Scholar] [CrossRef] [Scilit]
  16. Gallego, I.; Salloum, N.; Gatti, F.; Brinz, T.; Sommerfeld, M.; Kruggel-Emden, H. Analysis of particle motion and mixing in the powder chamber of a capsule filling machine with different stirrer designs using DEM simulations. Powder Technol. 2025, 464, 121261. [Google Scholar] [CrossRef] [Scilit]
  17. Rhymer, D.; Ingram, A.; Windows-Yule, C.R.K. A barrel shape study for a twin-screw conveyor using the discrete element method. Powder Technol. 2025, 455, 120744. [Google Scholar] [CrossRef] [Scilit]
  18. Pezo, M.; Pezo, L.; Lončar, B.; Kojić, P.; Ilić, M.; Jovanović, A. Granular flow in screw conveyors: A review of experiments and discrete element method (DEM) studies. Powder Technol. 2025, 459, 121040. [Google Scholar] [CrossRef] [Scilit]
  19. Zhang, S.; Cao, W.; Liu, W.; Li, L.; Chen, J.; Yang, T.; Duan, X.; Law, C.L.; Guo, M.; Zhang, D.; et al. Discrete element method investigation of rice motion characteristics in a rice mill of vertical disc-type sand roller: Influence of roller speed and filling level. Powder Technol. 2026, 470, 122022. [Google Scholar] [CrossRef] [Scilit]
  20. Li, Y.X.; Li, F.X.; Xu, X.M.; Shen, C.P.; Meng, K.P.; Chen, J.; Chang, D. Parameter calibration of wheat flour for discrete element method simulation based on particle scaling. Trans. Chin. Soc. Agric. Eng. 2019, 35, 320–327, (In Chinese with English abstract). [Google Scholar]
  21. Zhang, J.; Chang, Z.; Niu, F.; Chen, Y.; Wu, J.; Zhang, H. Simulation and validation of discrete element parameter calibration for fine-grained iron tailings. Minerals 2022, 13, 58. [Google Scholar] [CrossRef] [Scilit]
  22. Chen, S.; Jiang, L.; Lin, X.; Tang, X.; Liu, X.; Zhang, L. Calibration tests for the contact parameters of flour particle using discrete element method. Trans. Chin. Soc. Agric. Eng. 2024, 40, 69–76, (In Chinese with English abstract). [Google Scholar]
  23. Feng, Y.T.; Loughran, J. On upscaling of discrete element models: Similarity principles. Eng. Comput. 2009, 26, 599–609. [Google Scholar] [CrossRef] [Scilit]
  24. Feng, Y.T.; Owen, D.R.J. Discrete element modelling of large scale particle systems—I: Exact scaling laws. Comput. Part. Mech. 2014, 1, 159–168. [Google Scholar] [CrossRef] [Scilit]
  25. Wang, Y.; Mora, P.; Liang, Y. Calibration of discrete element modeling: Scaling laws and dimensionless analysis. Particuology 2022, 62, 55–62. [Google Scholar] [CrossRef] [Scilit]
  26. Coetzee, C.J. Review: Calibration of the discrete element method. Powder Technol. 2017, 310, 104–142. [Google Scholar] [CrossRef] [Scilit]
  27. Fang, W.; Wang, X.; Han, D.; Chen, X. Review of material parameter calibration method. Agriculture 2022, 12, 706. [Google Scholar] [CrossRef] [Scilit]
  28. GB/T 16913-2008; Methods of Dust Property Test. Standards Press of China: Beijing, China, 2008.
  29. Beakawi Al-Hashemi, H.M.; Baghabra Al-Amoudi, O.S. A review on the angle of repose of granular materials. Powder Technol. 2018, 330, 397–417. [Google Scholar] [CrossRef] [Scilit]
  30. Jiang, S.; Ye, Y.; Tan, Y.; Liu, S.; Liu, J.; Zhang, H.; Yang, D. Discrete element simulation of particle motion in ball mills based on similarity. Powder Technol. 2018, 335, 91–102. [Google Scholar] [CrossRef] [Scilit]
  31. Yun, T.; Park, H. Applicability evaluation of similarity principle in discrete element analysis. In International Conference on Discrete Element Methods; Springer: Singapore, 2016; pp. 117–123. [Google Scholar]
  32. Wang, Q.Z.; Yang, M.; Xiang, J.T.; Zhang, Q.L.; Zhang, W.J.; Li, X.; Hu, J.M. Discrete element parameters calibration of Hippophae rhamnoides based on particle scaling theory. Agric. Res. Arid Areas 2024, 42, 284–292, (In Chinese with English abstract). [Google Scholar]
  33. Johnson, K.L.; Kendall, K.; Roberts, A.D. Surface energy and the contact of elastic solids. Proc. R. Soc. Lond. A 1971, 324, 301–313. [Google Scholar] [CrossRef] [Scilit]
  34. Zhou, J.; Zhang, L.; Hu, C.; Li, Z.; Tang, J.; Mao, K.; Wang, X. Calibration of wet sand and gravel particles based on JKR contact model. Powder Technol. 2022, 397, 117005. [Google Scholar] [CrossRef] [Scilit]
  35. Yang, L.; Li, J.; Lai, Q.; Zhao, L.; Li, J.; Zeng, R.; Zhang, Z. Discrete element contact model and parameter calibration for clayey soil particles in the southwest hill and mountain region. J. Terramech. 2024, 111, 73–87. [Google Scholar] [CrossRef] [Scilit]
  36. Lu, L.; Gu, Z.; Lei, K. An inter-particle contact area and time restoration for softening treatment in thermal discrete element modeling. Europhys. Lett. 2009, 87, 44004. [Google Scholar] [CrossRef] [Scilit]
Figure 1. SEM images of ultra-fine zirconia-based powder at different magnifications: (a) 1000× magnification; (b) 5000× magnification.
Coatings 16 01016 g001
Figure 2. Measurement apparatus for angle of repose.
Coatings 16 01016 g002
Figure 3. (a) EDEM simulation model of the angle of repose measurement apparatus. (b) Single-sphere particle model after scaling.
Coatings 16 01016 g003
Figure 4. (a) EDEM simulation process of angle of repose formation. (b) Post-processing measurement of the simulated angle of repose.
Coatings 16 01016 g004
Figure 5. (a) Experimental angle of repose; (b) simulated angle of repose.
Coatings 16 01016 g005
Table 1. Particle size distribution of ultra-fine zirconia-based powder.
Particle Size DistributionValue/μm
D100.272
D250.492
D501.200
D753.059
D905.101
Table 2. Scale factors of other physical quantities.
ParameterDimensionScale FactorCategory
Length (L)LhFundamental
Density (D) ρ 1Fundamental
Time (T)ThFundamental
Mass (M) ρ · L 3 h 3 Material
Poisson’s Ratio ( ν ) ε t / ε l 1Material
Young’s Modulus (E) ρ · L 2 · T 2 1Material
Shear Modulus (G) ρ · L 2 · T 2 1Material
Force (F) ρ · L 4 · T 2 h 2 Force
Stress ( σ ) ρ · L 2 · T 2 1Force
Strain ( ε ) σ / E 1Force
Table 3. Scale classification of particle systems [24].
ScaleScale Number SnTypical Number of Particles
Micro-scale<102<106
Meso-scale102–103106–109
Macro-scale (industrial)>103>109
Table 4. Parameters required in DEM simulation.
ParameterValue
Density of powder/(kg·m−3)5600
Poisson ratio of powder0.3
Shear modulus of powder/(MPa)60
Particle-particle coefficient of restitution (P-PcoR)0.15–0.75
Particle-particle coefficient of static friction (P-PcoSF)0.2–1.16
Particle-particle coefficient of rolling friction (P-PcoRF)0.15–0.3
Density of stainless steel/(kg·m−3)7800
Poisson ratio of stainless steel0.3
Shear modulus of stainless steel/(MPa)70,000
Particle-stainless steel coefficient of restitution (P-SScoR)0.1–0.4
Particle-stainless steel coefficient of static friction (P-SScoSF)0.3–0.7
Particle-stainless steel coefficient of rolling friction (P-SScoRF)0.05–0.3
JKR surface energy (JKR)/(J·m−2)0.01–0.5
Table 5. List of the two-level fractional factorial design parameters.
NumberParameterLow LevelHigh Level
AParticle-particle coefficient of restitution (P-PcoR)0.150.3
BParticle-particle coefficient of static friction (P-PcoSF)0.20.4
CParticle-particle coefficient of rolling friction (P-PcoRF)0.150.3
DParticle-stainless steel coefficient of restitution (P-SScoR)0.10.2
EParticle-stainless steel coefficient of static friction (P-SScoSF)0.30.6
FParticle-stainless steel coefficient of rolling friction (P-SScoRF)0.050.1
GJKR surface energy/(J·m−2)0.010.02
Table 6. Design and results of the two-level fractional factorial design.
Serial NumberABCDEFGAngle of Repose θ/deg
1−11−111−1126.46
211−1−1−11−125.30
3−1111−1−1−122.76
411−1111−121.15
51−1−1−11−1119.16
6111−1−1−1125.68
7−1−1−1−1−1−1−118.52
81−1111−1−118.71
9−111−111122.42
10−1−11−111−119.68
11−1−1−11−111Not formed
121−111−111Not formed
Table 7. Main effect analysis of parameters in the two-level fractional factorial design.
Test ParametersS+n+ θ + Sn θ EOrdering
A110.00522.000109.84521.9680.0327
B143.77623.96276.07419.0184.9441
C109.25521.850110.59522.118−0.2685
D89.08422.270130.76621.7930.4774
E127.58621.26392.26423.065−1.8023
F88.55422.138131.29621.8820.2566
G93.72423.430126.12621.0202.4102
Table 8. Design and results of steepest ascent test.
Serial NumberP-PcoSFJKRP-SScoSFAngle of Repose θ/deg
10.40.020.3Formed
20.50.070.25Formed
30.60.120.2Not formed
40.70.170.15Not formed
50.80.220.1Not formed
60.90.270.05Not formed
Table 9. Design and results of the second steepest ascent test.
Serial NumberP-PcoSFJKRAngle of Repose θ/degRelative Error/%
10.40.0226.9949.71
20.50.0732.2539.91
30.60.1240.9523.70
40.70.1750.206.47
50.80.2256.605.46
60.90.2760.1112.00
Table 10. Orthogonal experimental design and results.
Serial NumberP-PcoSFJKRAngle of Repose θ/degRelative Error/%
10.70.1750.206.47
20.70.2257.036.26
30.70.2758.208.44
40.80.1751.733.61
50.80.2256.605.46
60.80.2758.959.84
70.90.1750.376.15
80.90.2256.515.29
90.90.2760.1112.00
Table 11. Calibrated parameter combination.
NumberParameterValue
AParticle-particle coefficient of restitution (P-PcoR)0.225
BParticle-particle coefficient of static friction (P-PcoSF)0.8
CParticle-particle coefficient of rolling friction (P-PcoRF)0.225
DParticle-stainless steel coefficient of restitution (P-SScoR)0.15
EParticle-stainless steel coefficient of static friction (P-SScoSF)0.45
FParticle-stainless steel coefficient of rolling friction (P-SScoRF)0.075
GJKR surface energy/(J·m−2)0.19
Disclaimer/Publisher’s Note: The statements, opinions and data contained in all publications are solely those of the individual author(s) and contributor(s) and not of MDPI and/or the editor(s). MDPI and/or the editor(s) disclaim responsibility for any injury to people or property resulting from any ideas, methods, instructions or products referred to in the content.