1. Introduction
As the core basic component of electronic control systems, the dimensional accuracy and molding stability of relay injection-molded parts directly determine the electrical performance and service reliability of relays [
1,
2,
3]. During the injection molding production of relays, the mold is subjected to extreme service conditions for long periods: on one hand, high-glass-fiber-reinforced engineering plastics fill the mold at high temperature and high pressure, causing continuous abrasive wear on the mold cavity, leading to dimensional deviations and excessive product burrs [
4,
5,
6]; on the other hand, cyclic thermal stress accelerates fatigue failure of the mold surface, ultimately resulting in premature mold scrap. Traditional uncoated molds have short service lives, high maintenance costs, and rapid performance degradation under high-temperature, high-wear conditions, making it difficult to meet the production demands of the relay industry for long durability, high precision, and high stability. Therefore, developing high-performance, wear-resistant coatings specifically for relay injection molds has become a key technical challenge that needs to be urgently addressed [
7,
8,
9,
10,
11,
12].
Hard coatings for injection mold protection have undergone multiple generations of development. The first-generation coatings are represented by binary nitrides such as CrN and TiN. CrN coatings exhibit good toughness and excellent thermal fatigue resistance, but their hardness is typically only approximately 20 GPa, and the hardness degrades significantly at elevated temperatures, making it difficult to resist the continuous plowing action of glass fibers for prolonged periods. TiN coatings, although possessing relatively high hardness (approximately 25 GPa) and good versatility, have a relatively high friction coefficient (approximately 0.6–0.7) and are susceptible to oxidative softening during high-temperature service, which limits their application in high-temperature injection molding conditions [
13,
14,
15]. The second-generation coatings introduced Al elements to form ternary nitrides, such as TiAlN and AlCrN, utilizing solid-solution strengthening and age-precipitation effects to significantly enhance hardness and thermal stability. Among these, AlCrN coatings, through the substitutional solid solution of Al atoms into the CrN lattice, achieve a microhardness exceeding 30 GPa and exhibit superior hardness retention and high-temperature oxidation resistance compared to TiAlN at elevated temperatures—rendering them more reliable under the sustained thermo-mechanical coupling conditions of injection molding environments [
16,
17]. In contrast, although TiAlN exhibits higher initial hardness, its hardness degradation rate is faster during prolonged high-temperature service, and its thermal shock resistance is inferior to that of AlCrN. In recent years, DLC (diamond-like carbon) coatings have attracted attention due to their extremely low friction coefficient (below 0.2), but their poor thermal stability (structural transformation occurs above 300 °C) and weak adhesion to steel substrates make them incapable of withstanding the high temperature, high pressure, and glass-fiber impact during injection molding. Although multilayer PVD coatings (such as CrN/AlCrN or TiN/TiAlN multilayer structures) can balance toughness and hardness, their preparation processes are complex and costly, and stress matching issues at the multilayer interfaces may lead to early delamination failure [
18,
19,
20]. Considering hardness, high-temperature performance, adhesion strength, and manufacturing cost comprehensively, AlCrN coatings demonstrate the most balanced advantages in the field of injection mold protection and are an ideal candidate for life extension coatings [
21,
22].
However, during the preparation of AlCrN coatings by multi-arc ion plating, process parameters such as duty cycle, arc current, and negative bias voltage directly determine the coating’s microstructure, residual stress, and overall performance [
23]. Improper parameter matching can lead to defects such as large particles, pits, and insufficient adhesion, severely affecting the coating’s actual service performance on molds. Current research on AlCrN coatings is mostly focused on general cutting tools, while studies on process optimization and performance matching specifically for the service conditions of relay injection molds (high-glass-fiber erosion, thermo-mechanical cyclic coupling) remain scarce. In particular, it should be noted that most existing studies adopt a single indicator (such as hardness or friction coefficient alone) for parameter screening, neglecting the mutual constraints among hardness, adhesion strength, and friction coefficient [
24]. Moreover, the lack of service life verification based on actual production molds results in a significant gap between laboratory optimization results and industrial applications [
25].
To address the above issues, this paper focuses on the service requirements of relay injection molds, aiming to improve mold wear resistance and extend service life, and carries out a full-chain study of AlCrN coatings: using duty cycle, arc current, and negative bias voltage as variables, the influence of process parameters on the surface morphology during coating growth is analyzed. A three-factor, three-level orthogonal experiment is designed, with friction coefficient, film-substrate adhesion, and surface hardness as core evaluation indicators, to screen out the optimal preparation process for AlCrN coatings. Subsequently, a comparative injection production cycle test between uncoated molds and molds with AlCrN coating under optimized process parameters is conducted to clarify the performance advantages of the AlCrN coating and quantify the improvement in relay injection mold service life, verifying the industrial application feasibility of AlCrN coatings. This study can provide a theoretical basis and technical support for the life extension design of relay injection molds and promote the large-scale application of coating technology in the field of precision injection molds.
2. Materials and Methods
2.1. Orthogonal Optimization Experiment Design
In this experiment, ELMAX mold steel specimens of size 20 mm × 20 mm × 5 mm were used. The hardness of the specimens before deposition was 7.22 GPa, and the average friction coefficient against a SiC grinding ball was 0.521. A JMU-FCVA600 magnetic filter cathodic arc deposition equipment(JMU-FCVA600 jointly developed by Beijing Normal University and Jimei University, Beijing, China) was used. The cathode arc source was configured with four arc targets, arranged uniformly and alternately distributed on the inner wall of the furnace chamber. The targets were AlCr alloy targets prepared by powder metallurgy, with an Al/Cr ratio of 2. The target purity was 99.9% (3 N). Before deposition, the substrates were polished using 120# to 2000# sandpaper and W2.5 diamond polishing paste and then cleaned with an ultrasonic cleaning device and dried.
The key process parameters in magnetic filter cathodic vacuum arc coating technology include duty cycle, N
2 partial pressure (N
2 flow rate), arc current, negative bias voltage, and deposition temperature. Based on experience, the N
2 flow rate was set to 35 sccm and the deposition temperature to 350 °C. Duty cycle (30%, 50%, and 70%), arc current (40 A, 60 A, and 80 A), and negative bias voltage (90 V, 110 V, and 130 V) were selected as the three factors for a three-level orthogonal experiment. The specific experimental schemes for the orthogonal experiment are shown in
Table 1.
2.2. Microstructure Morphology Analysis Method
In this study, a Phenom-XL scanning electron microscope (SEM, FEI Electron Optics B.V., Eindhoven, The Netherlands) was used to observe the surface morphology of the coatings. To understand the elemental composition distribution of the coatings, semi-quantitative elemental analysis was performed using an energy-dispersive X-ray spectrometer (EDS) attached to the Phenom-XL SEM. By combining morphological observation and elemental analysis, the coating performance was comprehensively evaluated.
2.3. Phase Structure Analysis Method
The phase composition of the coatings was analyzed using a Rigaku Smart Lab X-ray diffractometer (XRD, Rigaku Corporation, Akishima, Tokyo, Japan). The test parameters were set as follows: Cu Kα radiation (λ = 0.154 nm), operating voltage of 40 kV, current of 40 mA, scanning step of 0.02°, and scanning speed of 3°/min.
2.4. Surface Hardness Analysis Method
Surface hardness was tested using an NHT2 nanoindenter (Anton Paar GmbH, Graz, Austria) equipped with a Berkovich diamond indenter. The test was performed in load control mode, with a loading rate of 5 mN/min, an unloading rate of 5 mN/min, and a holding time of 10 s. To ensure that the measured results reflected the intrinsic hardness of the coating rather than substrate effects, the maximum indentation depth was set to not exceed 10% of the coating thickness, in accordance with the ISO 14577 standard [
26]. For specimens with thinner coatings, a lower maximum load (2 mN) was adopted to ensure that the indentation depth met the above requirement; for specimens with thicker coatings, a maximum load of 5 mN was used. Five test points were randomly selected for each specimen, and the hardness values were calculated from the unloading curves according to the Oliver–Pharr method, with the arithmetic mean taken as the final hardness value.
2.5. Adhesion Strength Analysis Method
Coating adhesion was tested using a WS-2005 nanoindenter (Lanzhou Zhongke Kaihua Technology Development Co., Ltd., Lanzhou, China) by scratch testing. The adhesion strength of the coatings was characterized by the indentation method. The load at which obvious coating damage (such as delamination, cracking, etc.) began to occur was defined as the critical load, denoted as . The critical load value was selected to represent the adhesion strength of the coating. The test parameters were as follows: load range 0–150 N, scratch speed 5 mm/min, and loading speed 100 N/min.
2.6. Friction and Wear Analysis Method
Friction and wear tests were performed using an HT-600 friction (Lanzhou Zhongke Kaihua Technology Development Co., Ltd., Lanzhou, China) and wear tester, with the average friction coefficient of the coatings as the primary evaluation indicator. The test employed a SiC grinding ball with a diameter of 5 mm as the counterbody material, with an applied load of 30 N, a rotational speed of 400 r/min, and a sliding duration of 30 min. After the test, the wear morphologies were further analyzed by SEM and EDS.
2.7. Production Cycle Comparison Method
In this study, an ARBUEDO MARS-3A170 (Zhejiang Arbueo Intelligent Equipment Manufacturing Co., Ltd., Taizhou, China) injection molding machine was used for production cycle testing of relay components. The mold had two cavities (one mold, two cavities). For each test, one cavity of the mold was coated with AlCrN, while the other cavity was left uncoated as a control. The part flash height was inspected every 5000 cycles, and a flash height ≥ 0.1 mm was used as the criterion for mold failure. Four repeated verification tests were conducted under the same mold and molding material conditions, and the average value was taken as the mold service life.
3. Results
3.1. Coating Surface Elemental Analysis
The surface atomic contents of the AlCrN coating specimens are shown in
Table 2.The Al/Cr ratio of the targets used in the experiment was 2, but the Al/Cr ratios of all nine groups of coatings were less than 2, indicating that the segregation phenomenon occurred. The Al/Cr ratios of groups a, d, and g ranged from 0.93 to 1.09; those of groups b, e, and h ranged from 1.13 to 1.17; and those of groups c, f, and i were 1.27. This indicates that the Al/Cr ratio is more closely related to the process parameter of arc current, and the Al/Cr ratio gradually increases with increasing arc current.
3.2. Coating Phase Structure Analysis
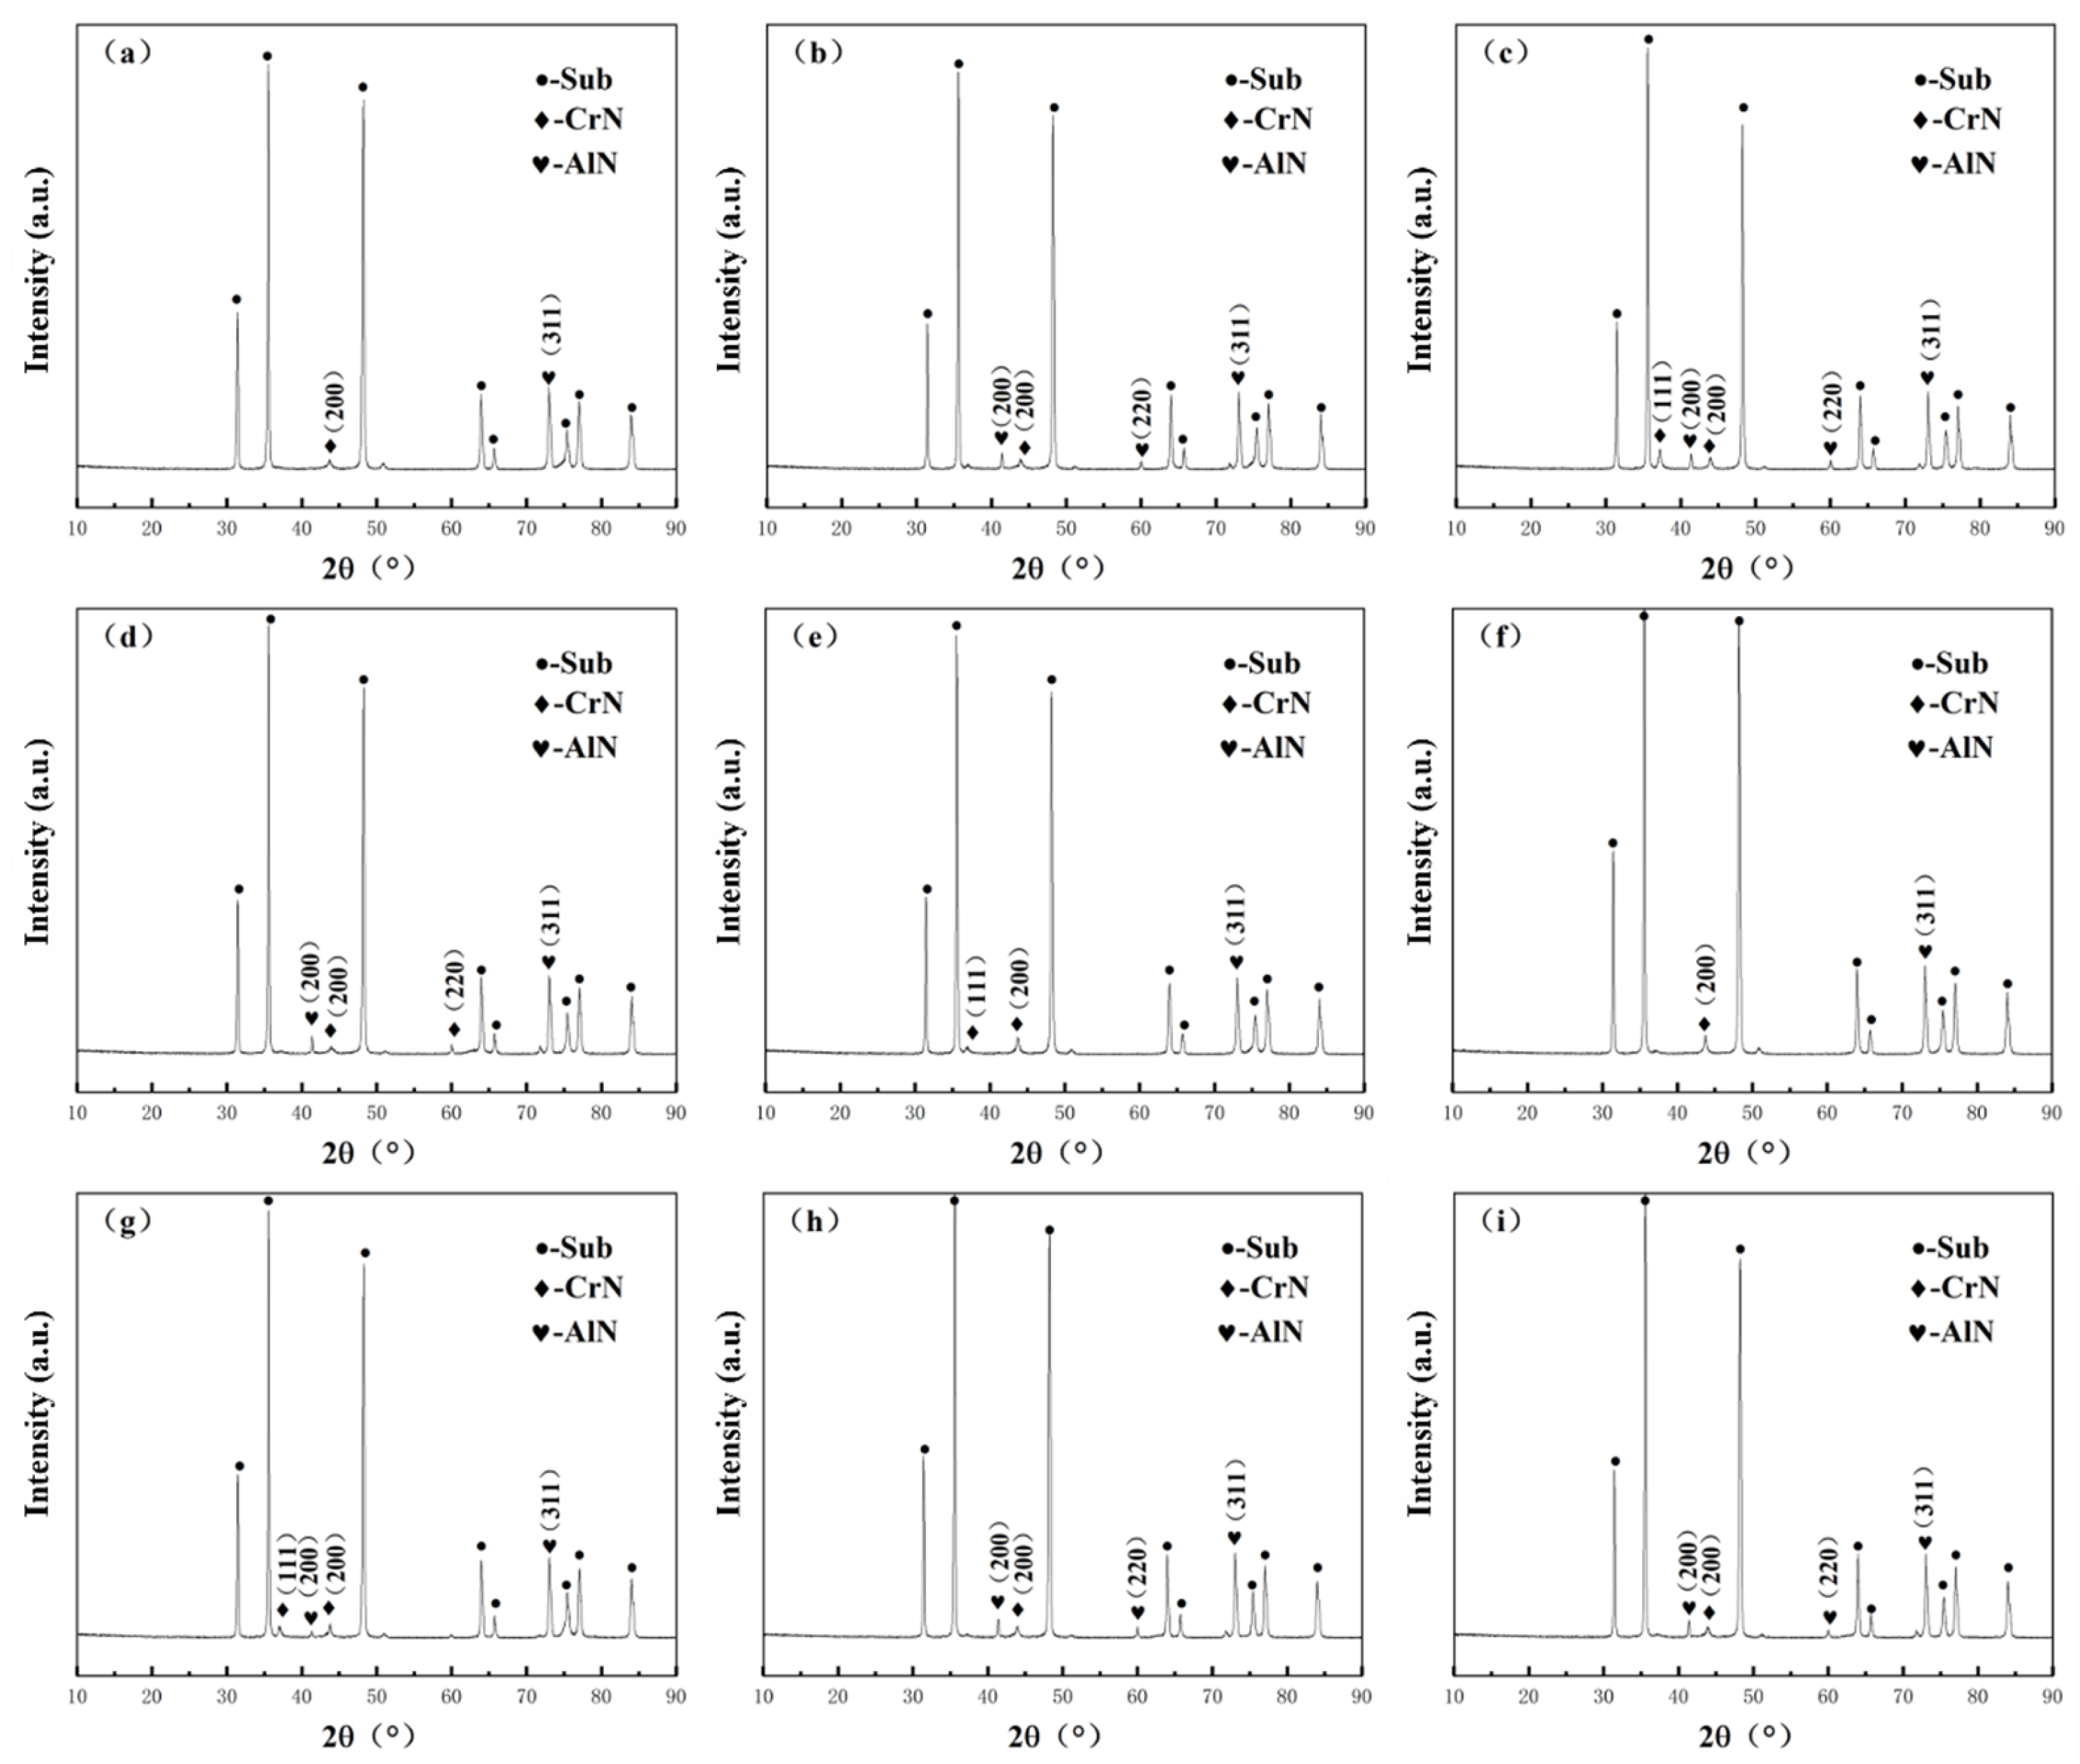
The surface XRD patterns of the AlCrN coating specimens are shown in
Figure 1. From the diffraction patterns, it can be observed that all nine groups of coatings deposited under different process parameters exhibited phases such as CrN, AlN, and the substrate, showing generally similar trends. Variations in process parameters did not cause significant changes in the diffraction peak intensities.
During the coating deposition process, the concentration of active atoms on the coating surface was significantly higher than that in the interior. This is mainly attributed to the strong diffusivity of active nitrogen atoms, which readily penetrate the coating and react with metal atoms to form stable CrN and AlN phases. In some diffraction patterns, the AlN (200) and CrN (111) diffraction peaks were not observed. This may be because the deposition time was relatively short, and the active nitrogen atoms did not fully react with Al and Cr atoms to form these phases.
3.3. Coating Surface Morphology Analysis
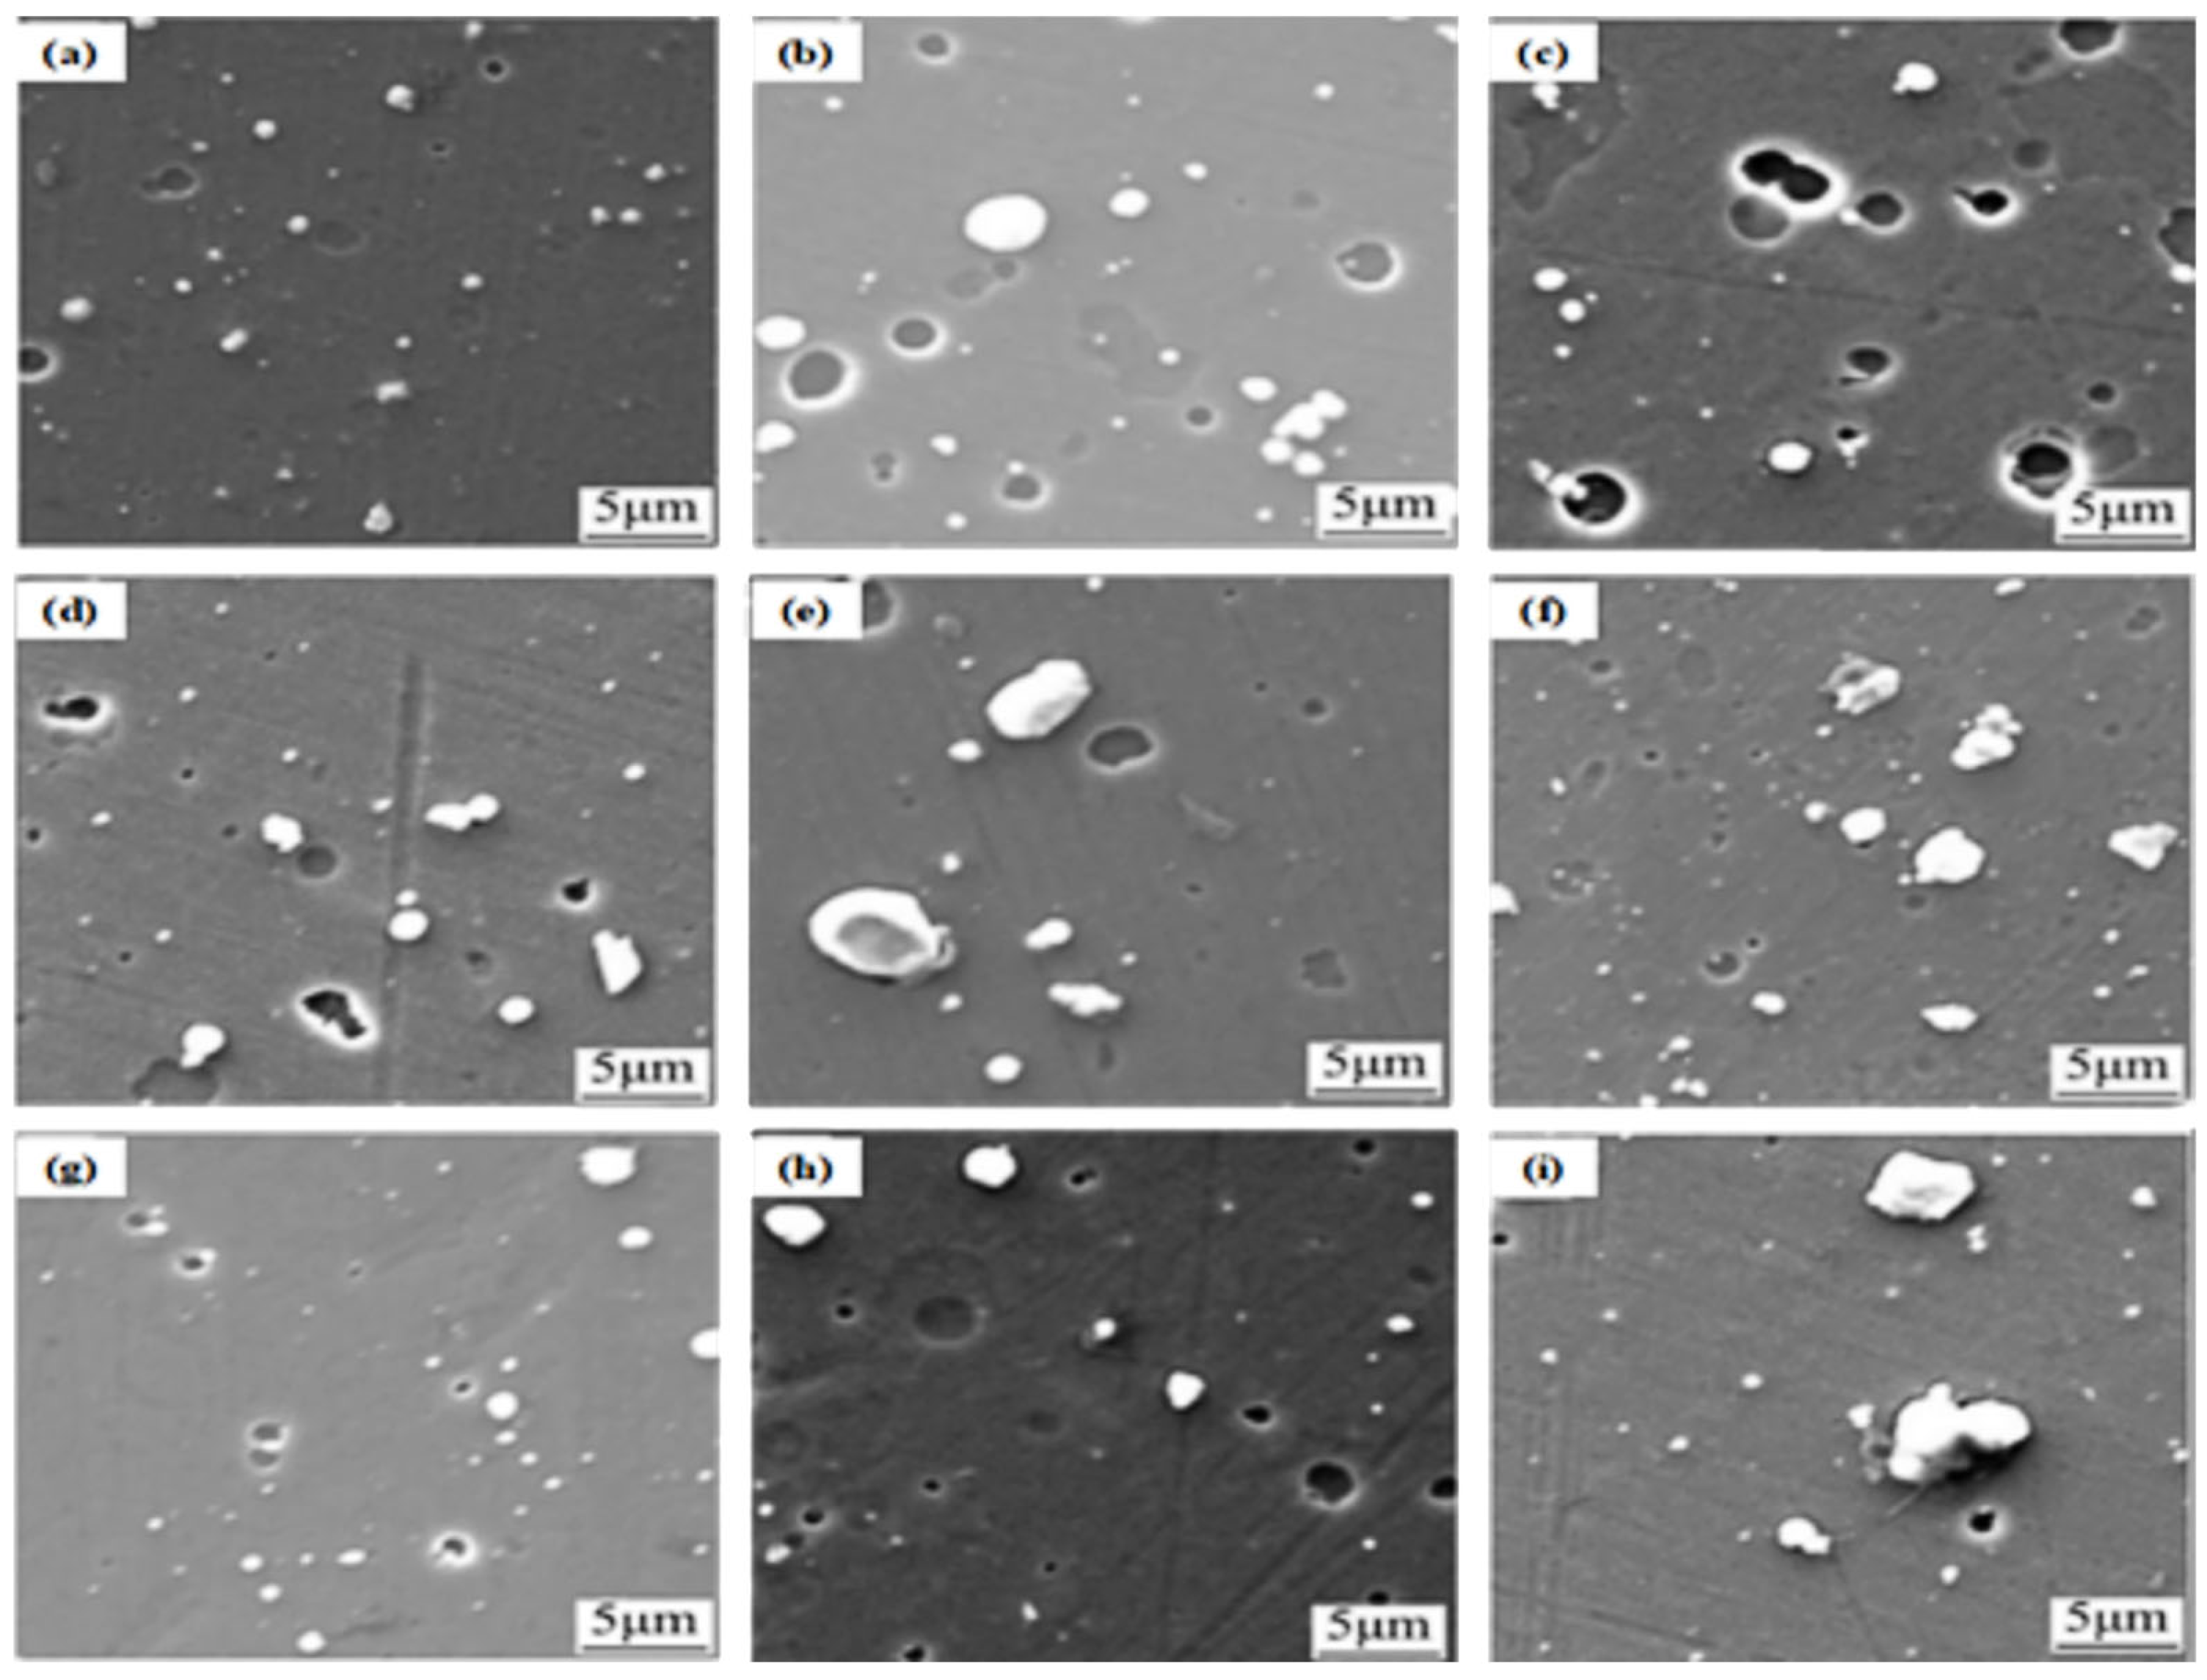
From the SEM surface morphologies shown in
Figure 2, it can be observed that all nine groups of AlCrN coatings exhibit typical arc evaporation deposition surface characteristics, with the main defect types being white particles (droplet condensates) and light-colored pits (particle detachment or back-sputtering traces) on the surface. Comparing the images of each group, it can be observed that when the duty cycle increases from 30% (groups a, b, and c) to 70% (groups g, h, and i), the distribution density of white particles and pits on the surface visually shows an increasing trend. As the arc current increases from 40 A (groups a, d, and g) to 80 A (groups c, f, and i), the size of the particles significantly enlarges, and the dimensions of the pits also expand accordingly. When the negative bias voltage increases from 90 V (groups a, e, and i) to 130 V (groups c, d, and h), the particle size of the white particles decreases, but the number of pits visually increases. These phenomena can be respectively attributed to the following: increasing the duty cycle shortens the pulse off-time, leading to insufficient cooling of arc spots and intensified target material splashing; increasing the arc current results in higher arc spot energy and more intense molten splashing while also increasing the probability of large particle detachment forming pits; increasing the negative bias voltage enhances ion bombardment energy, increasing the probability of particles being sputtered and removed, but the strong bombardment also tends to cause local back-sputtering, forming pits. It should be noted that, due to the limitations of SEM image resolution and sample size considerations, this study did not perform quantitative image statistical analysis on particle size distribution, areal density, or pit area fraction. The above visual observation trends are only intended as a qualitative reference for the influence of process parameters on surface morphology.
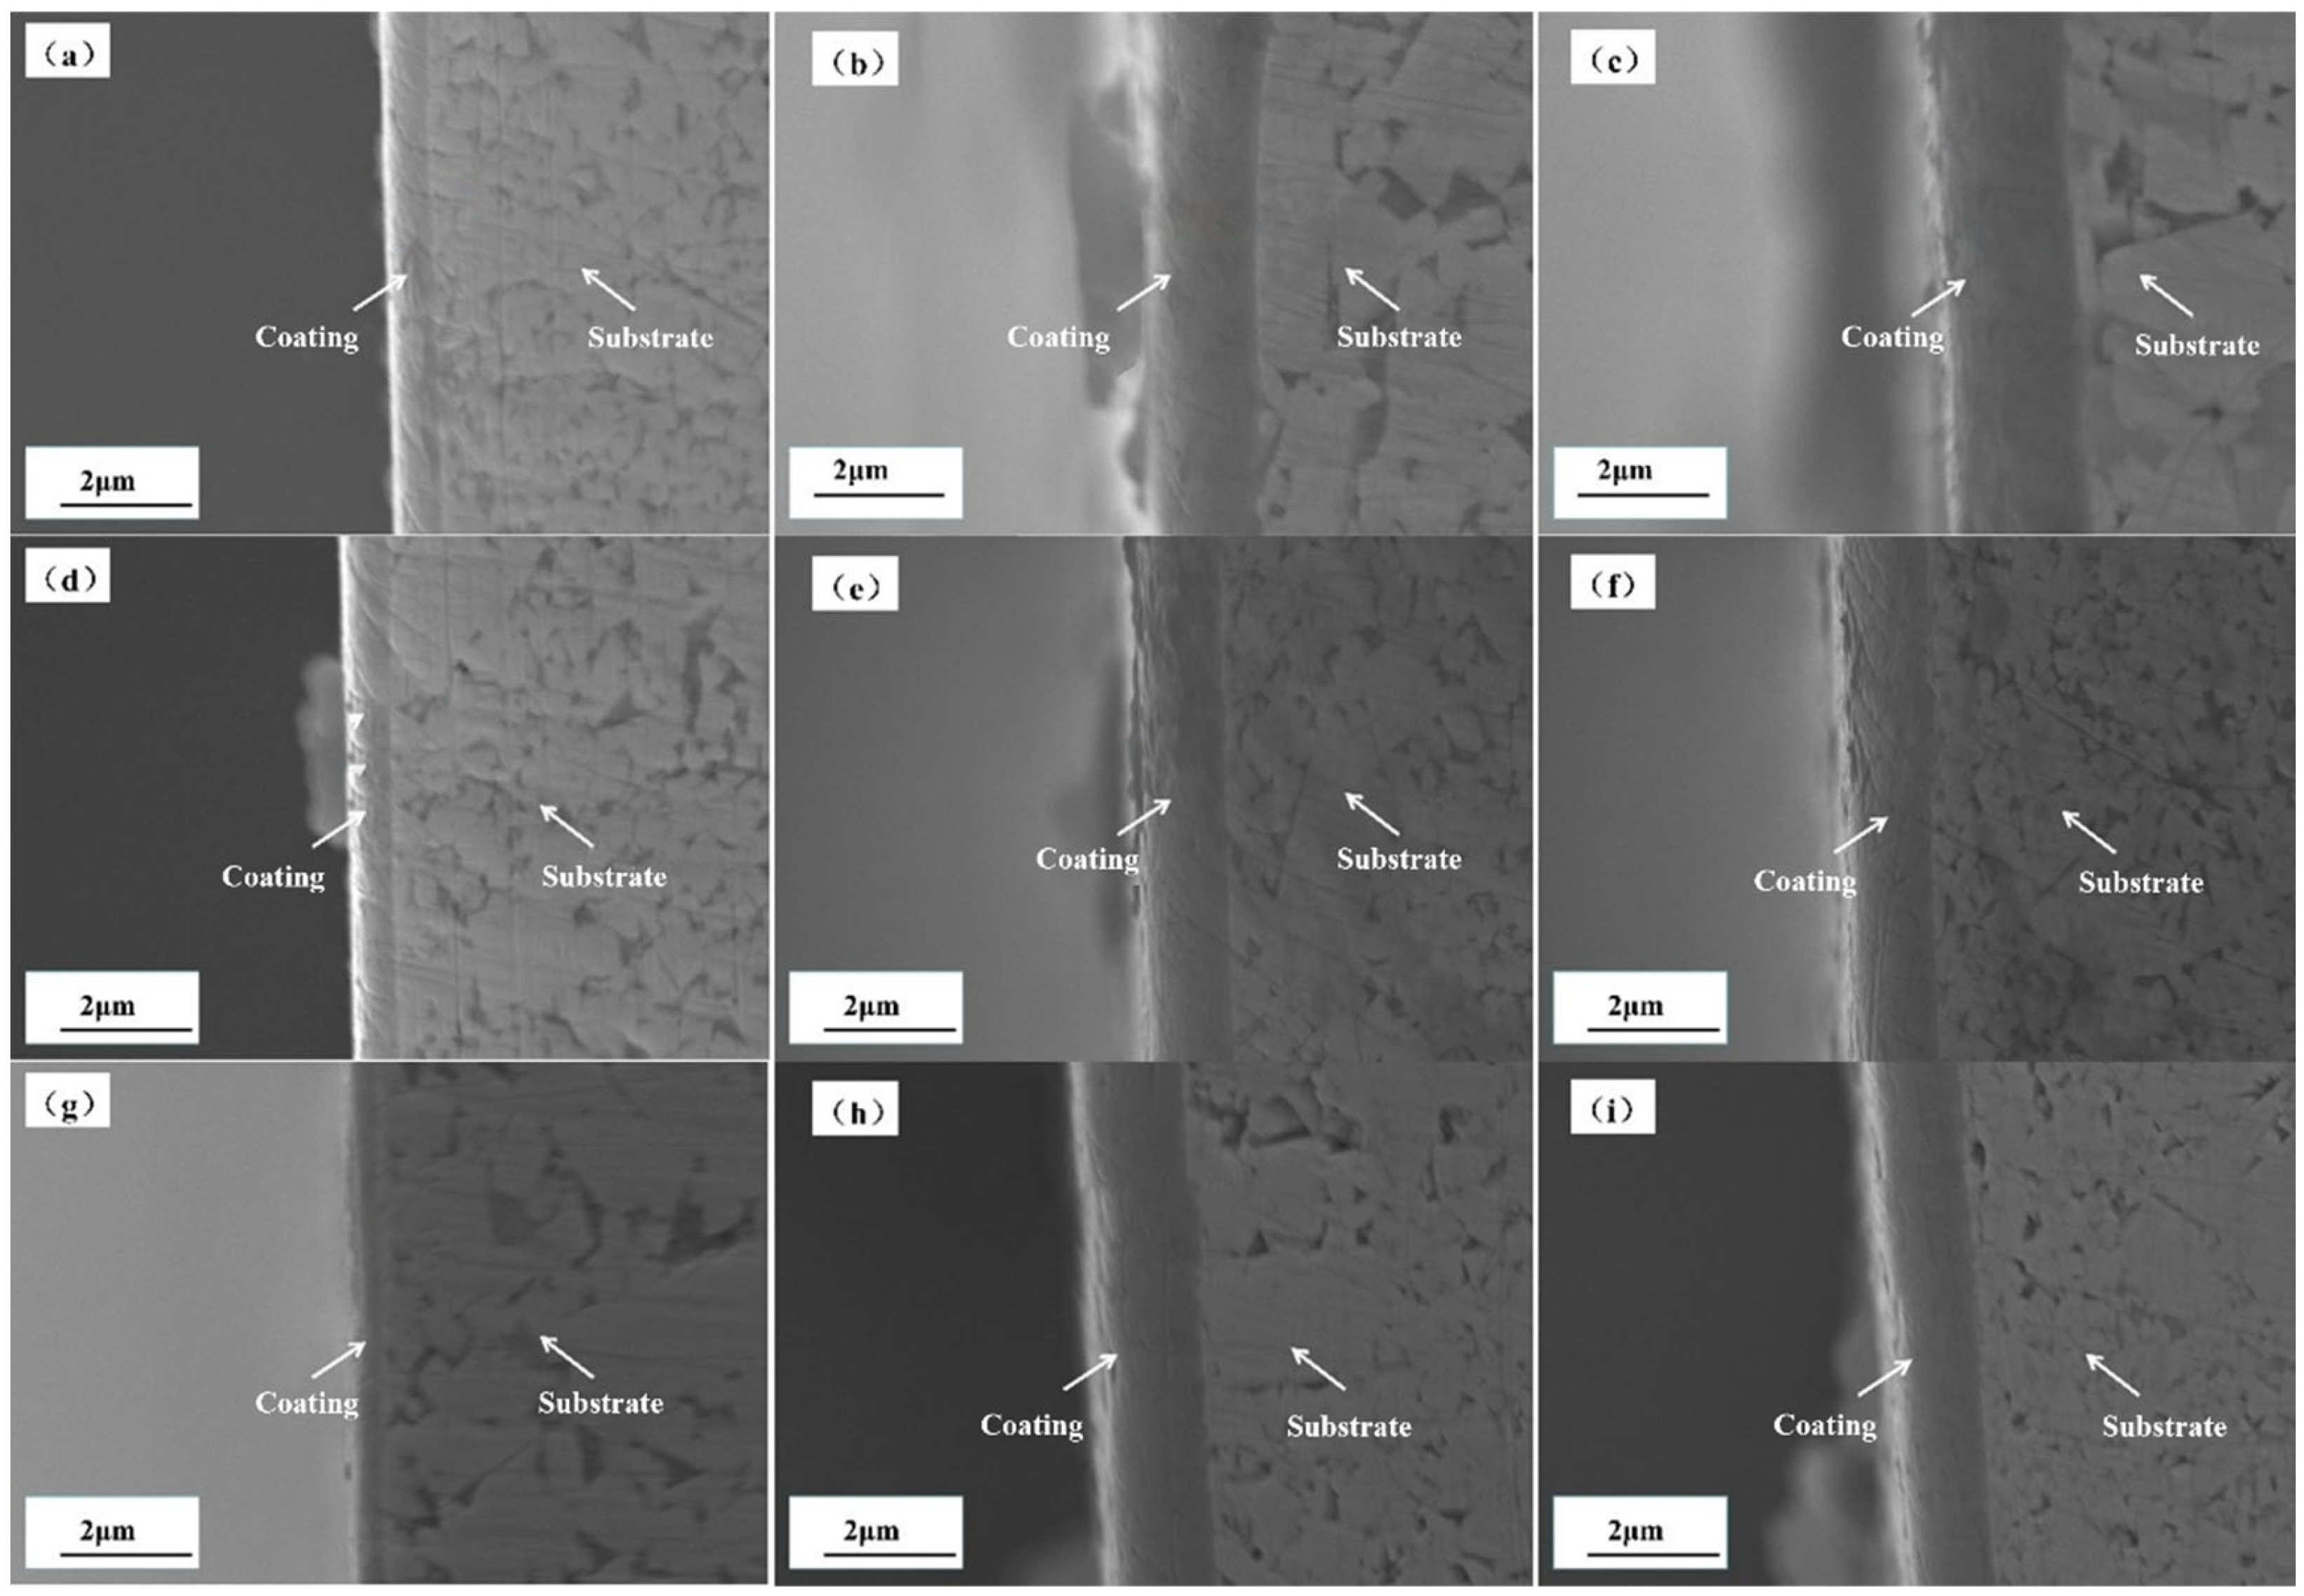
Figure 3 shows the cross-sectional morphologies of the nine groups of AlCrN coating specimens observed under a scanning electron microscope. The coating thicknesses of the AlCrN specimens are shown in
Table 3. Specimens a, d, and g all have an arc current of 40 A, and their coating thicknesses are significantly thinner than those of the other specimens, indicating that the arc current is strongly correlated with coating thickness, and increasing the arc current correspondingly increases the coating thickness. Specimens g, h, and i have a duty cycle of 70%; the cross-sections of these three specimens are denser and smoother compared to the other specimens, indicating that a higher duty cycle significantly contributes to the improvement of coating density.
3.4. Coating Performance Analysis
3.4.1. Coating Surface Hardness Analysis
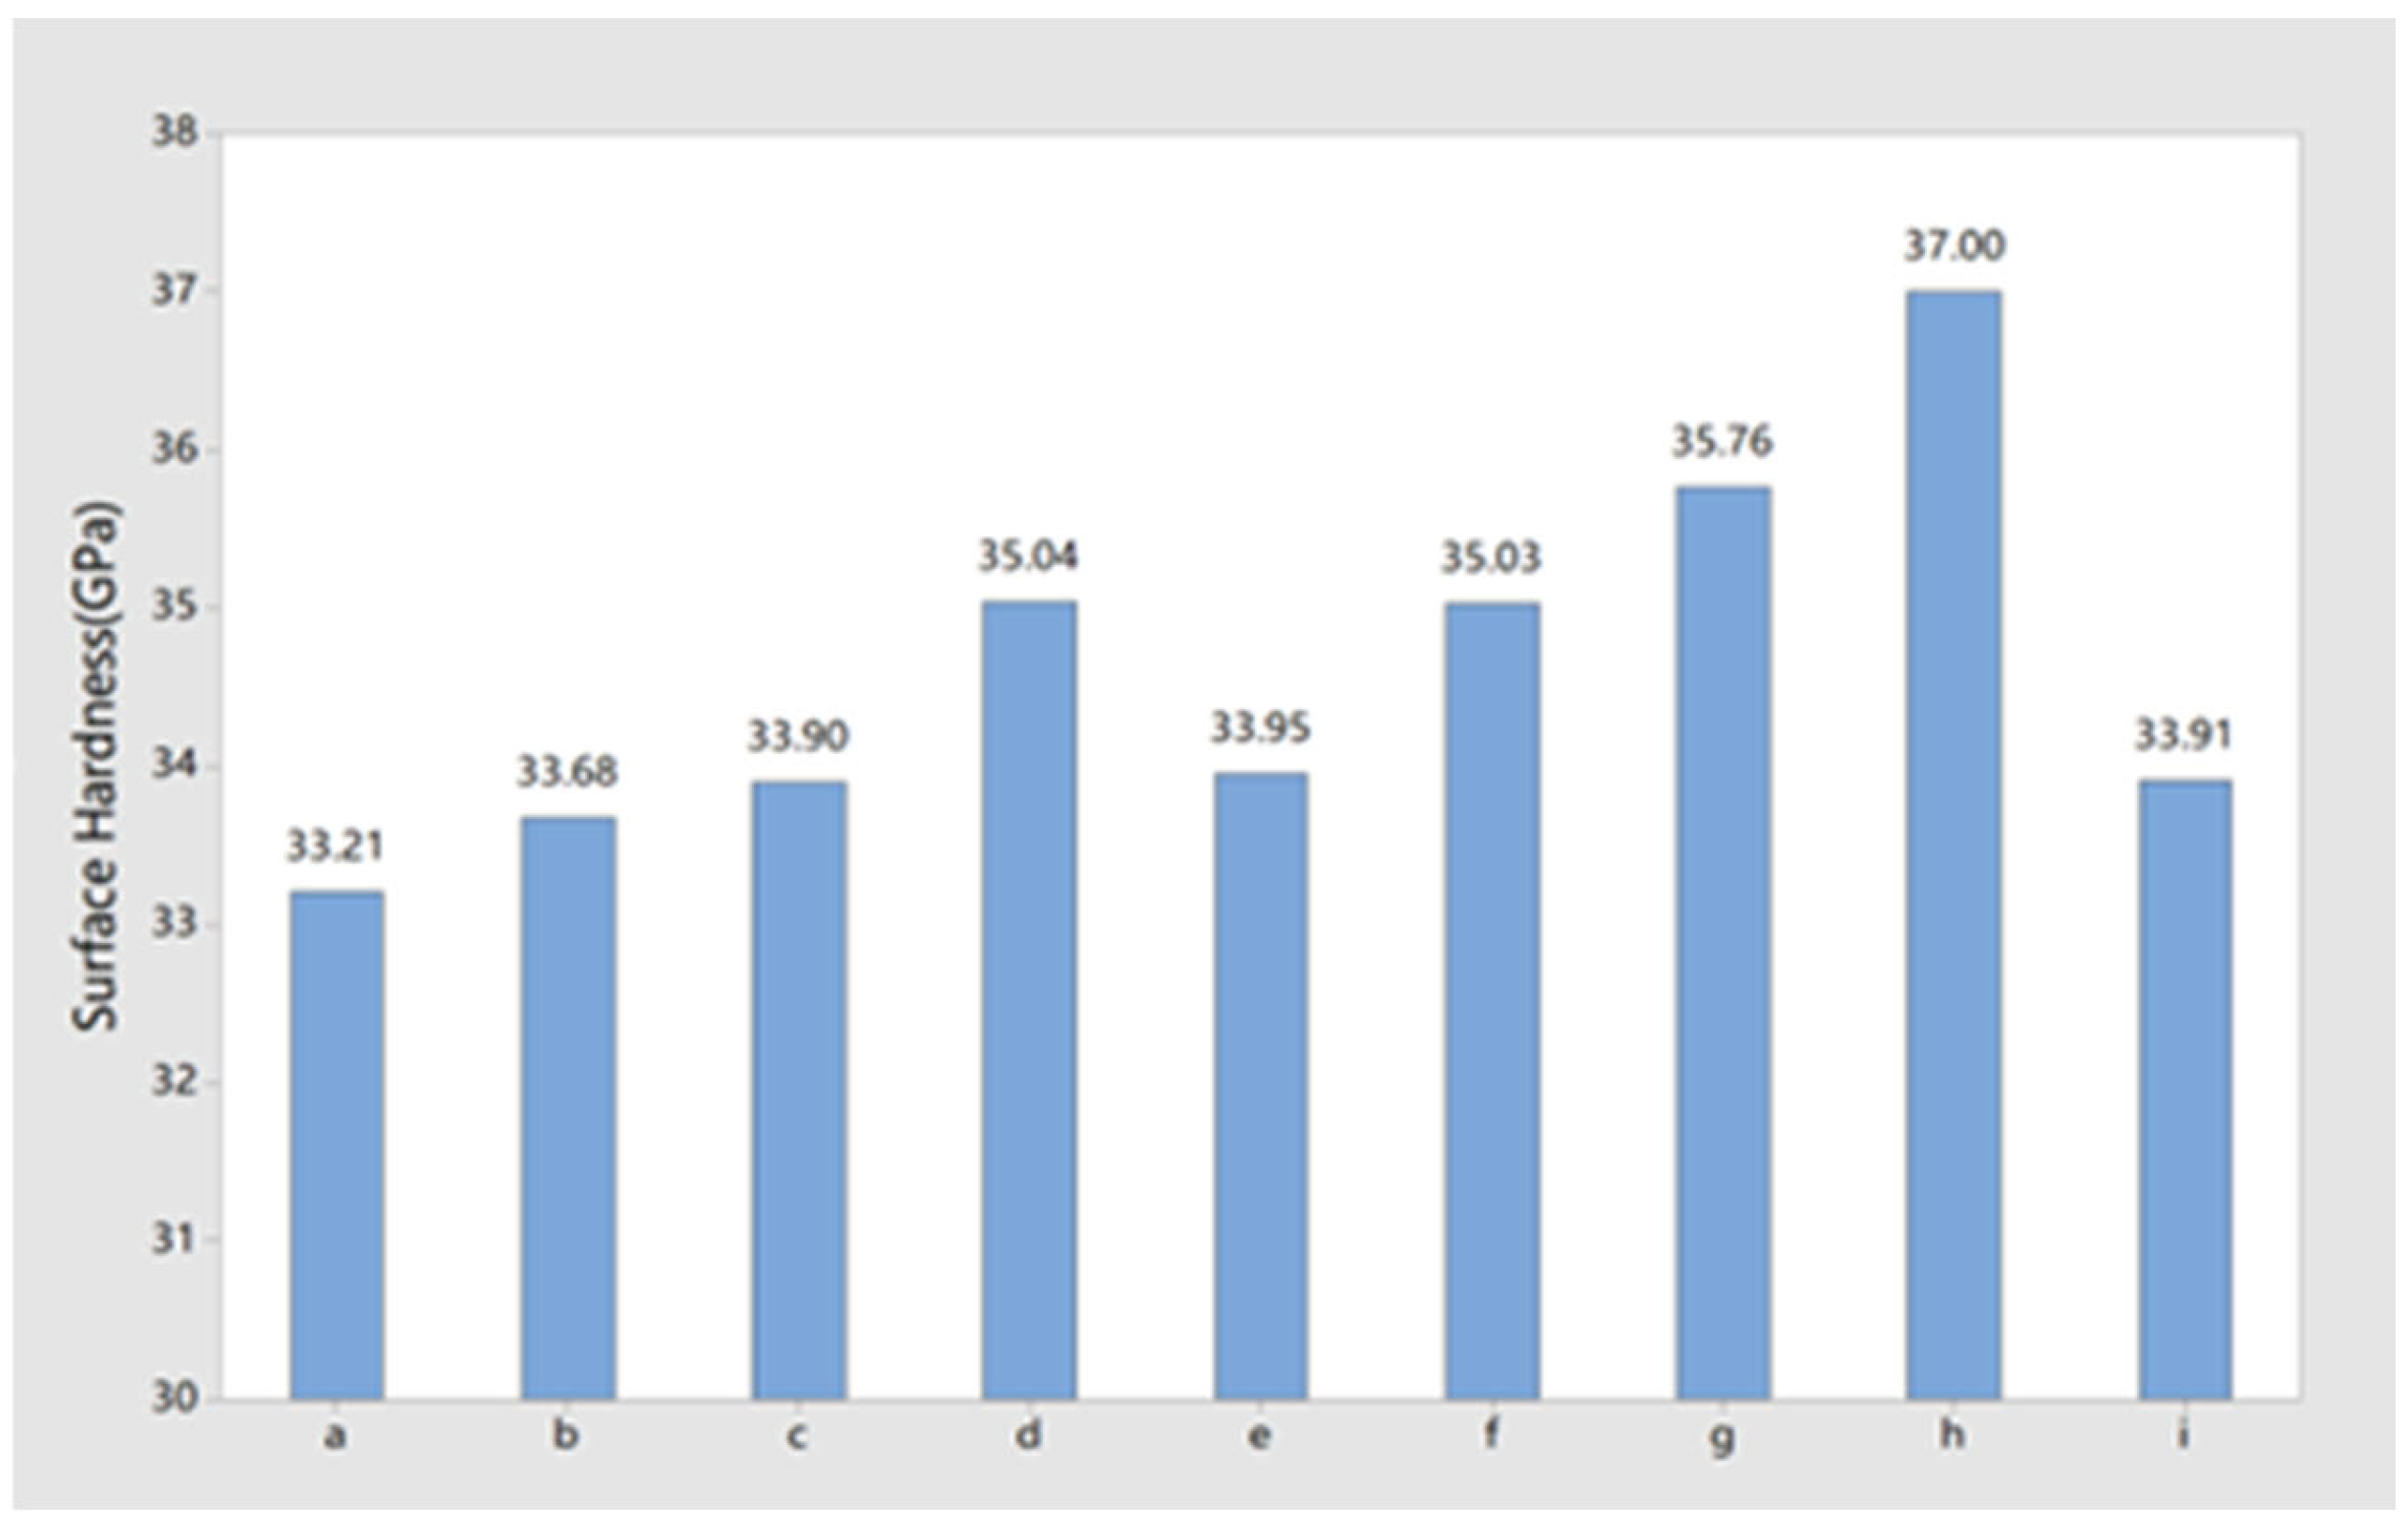
The surface hardness of the nine groups of specimens is shown in
Figure 4. After deposition of AlCrN coatings on the substrate surface, the surface hardness of the substrate increased from 7.22 GPa to a range of 33.21 GPa to 37.00 GPa. The duty cycle had a more significant effect on coating hardness; as the duty cycle increased from 30% to 70%, the coating hardness increased. This is mainly attributed to the fact that a higher duty cycle increases the deposition rate and energy input per unit time, promoting coating densification and thereby significantly improving the coating hardness.
3.4.2. Adhesion Strength Analysis
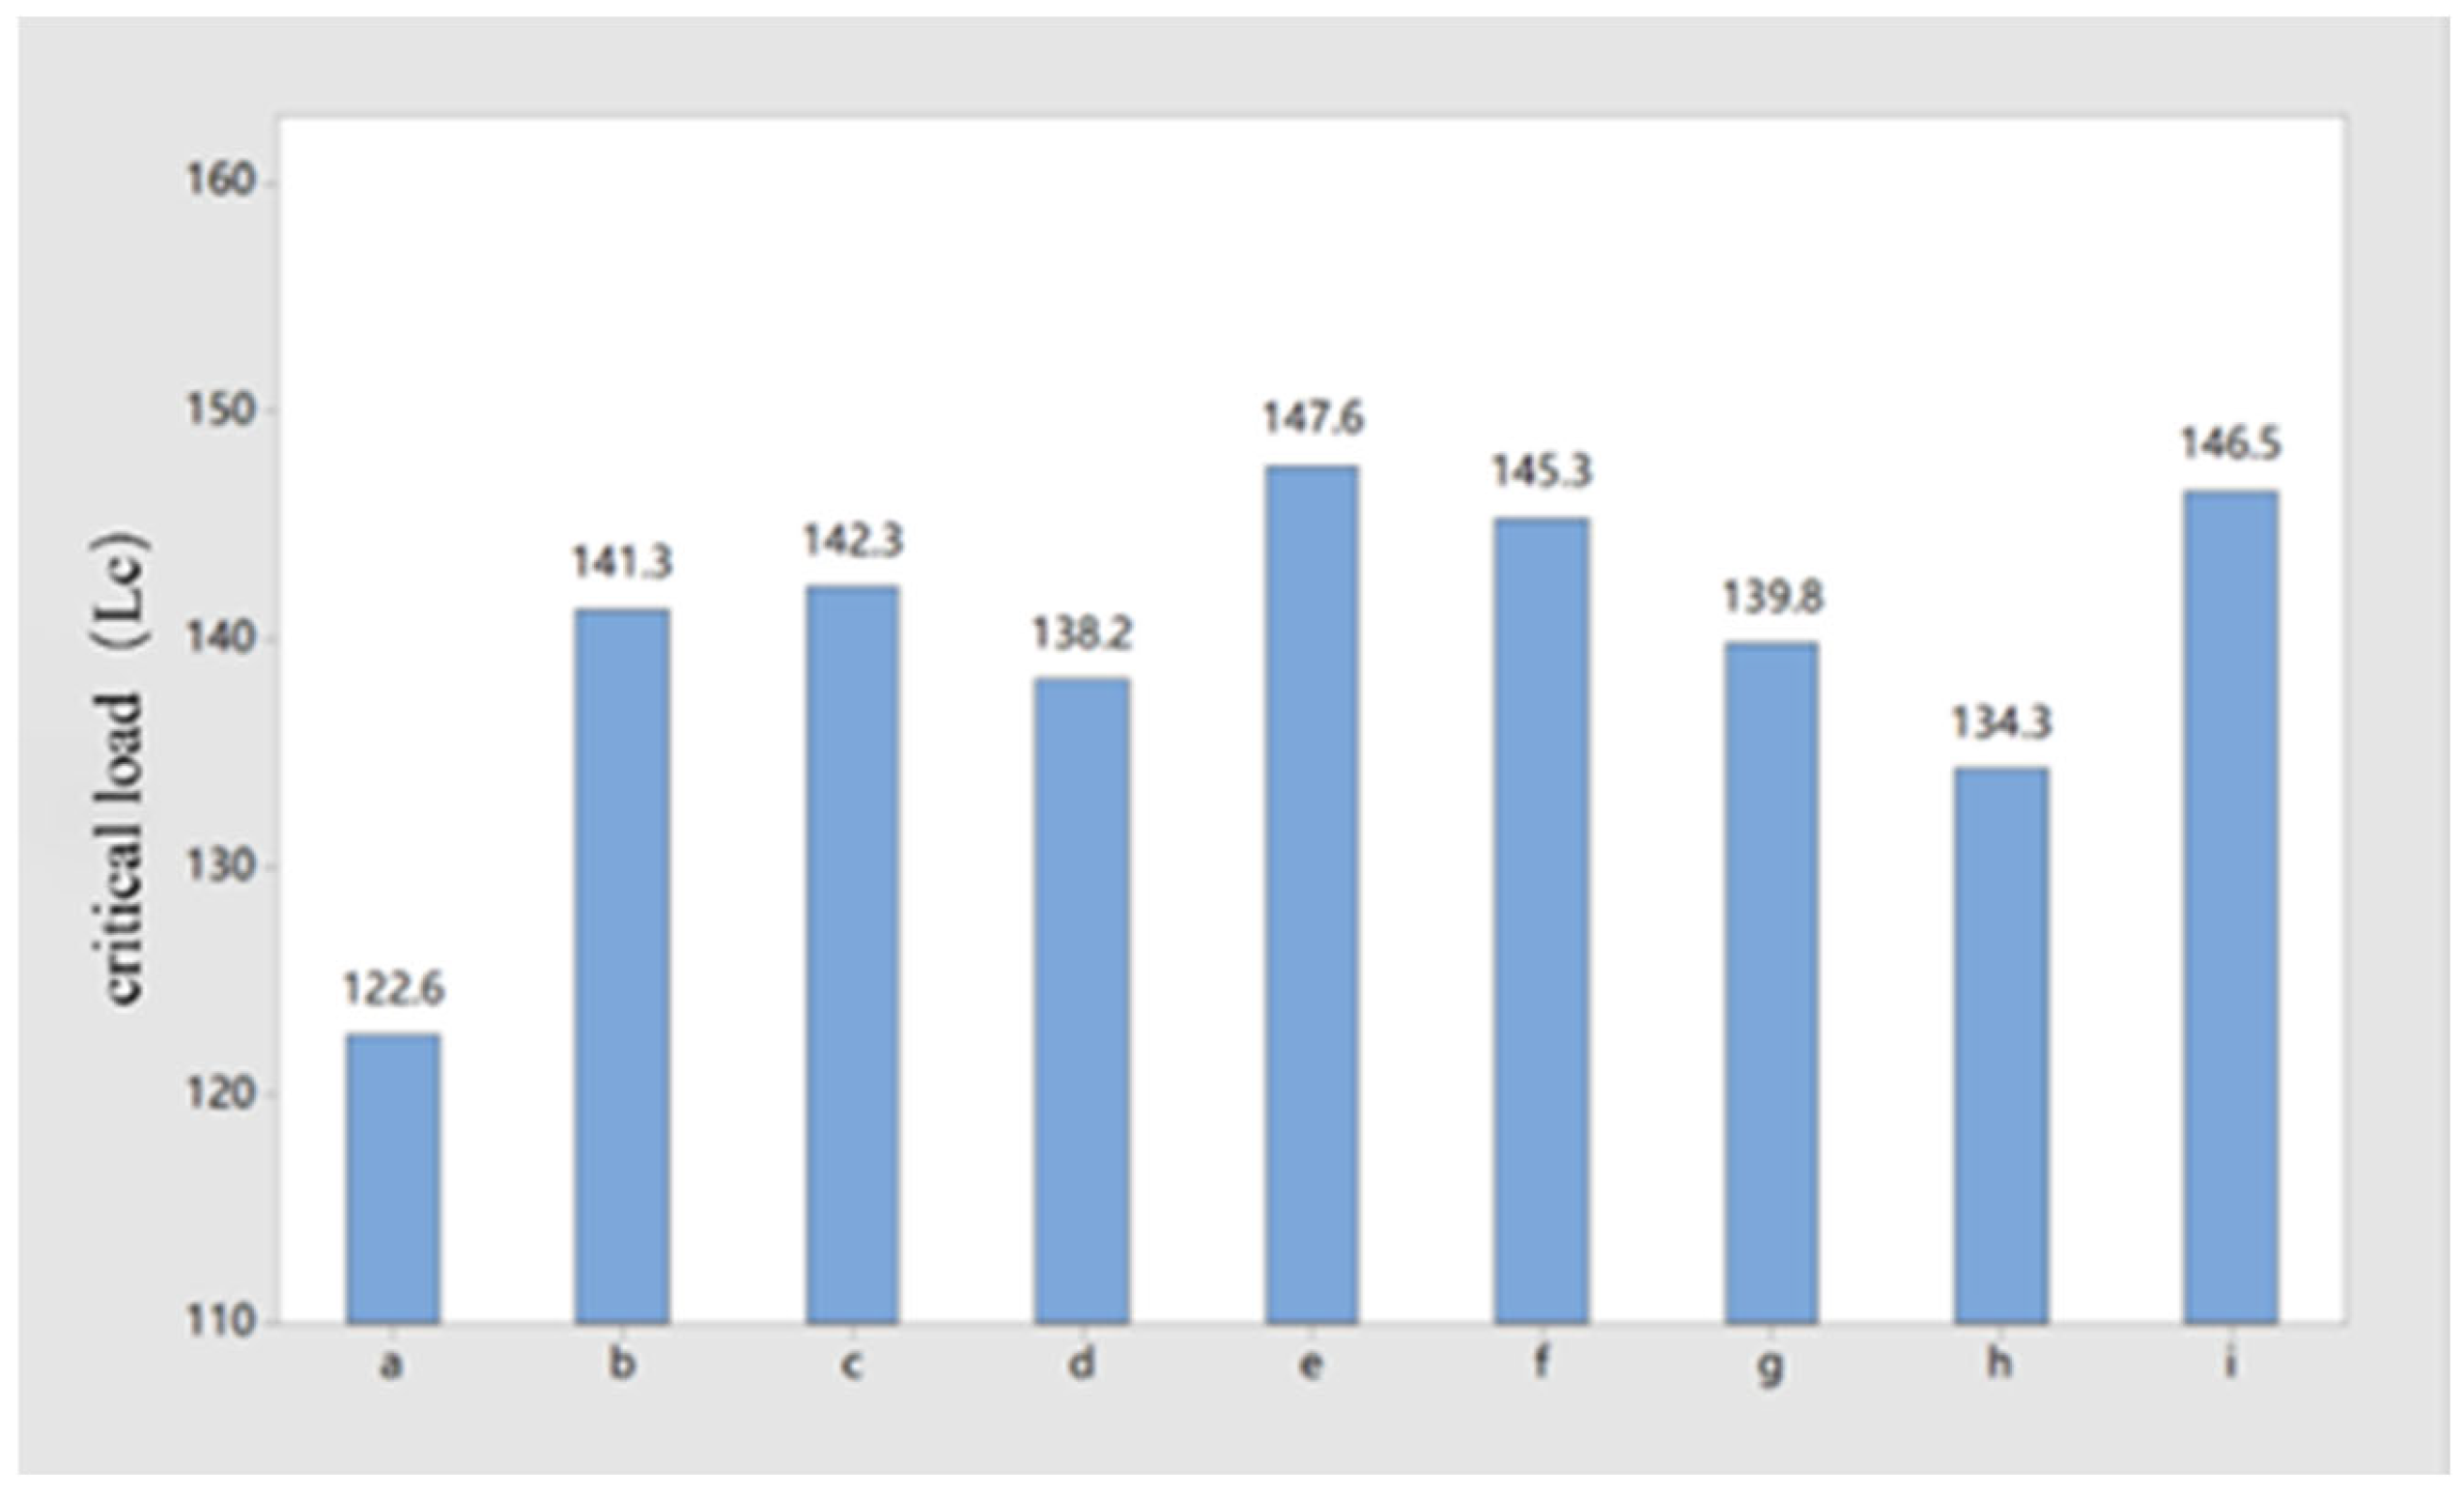
The critical loads of the nine groups of specimens are shown in
Figure 5. Specimens a, d, and h exhibited critical loads below 139 N, indicating that the adhesion strengths of the coatings in these three groups were the poorest. Specimens b, c, and g showed critical loads around 140 N, indicating that the adhesion strengths of the coatings in these three groups were good. Specimens e, f, and i exhibited critical loads exceeding 145 N, indicating that the adhesion strengths of the coatings in these three groups were the best.
3.4.3. Friction and Wear Results Analysis
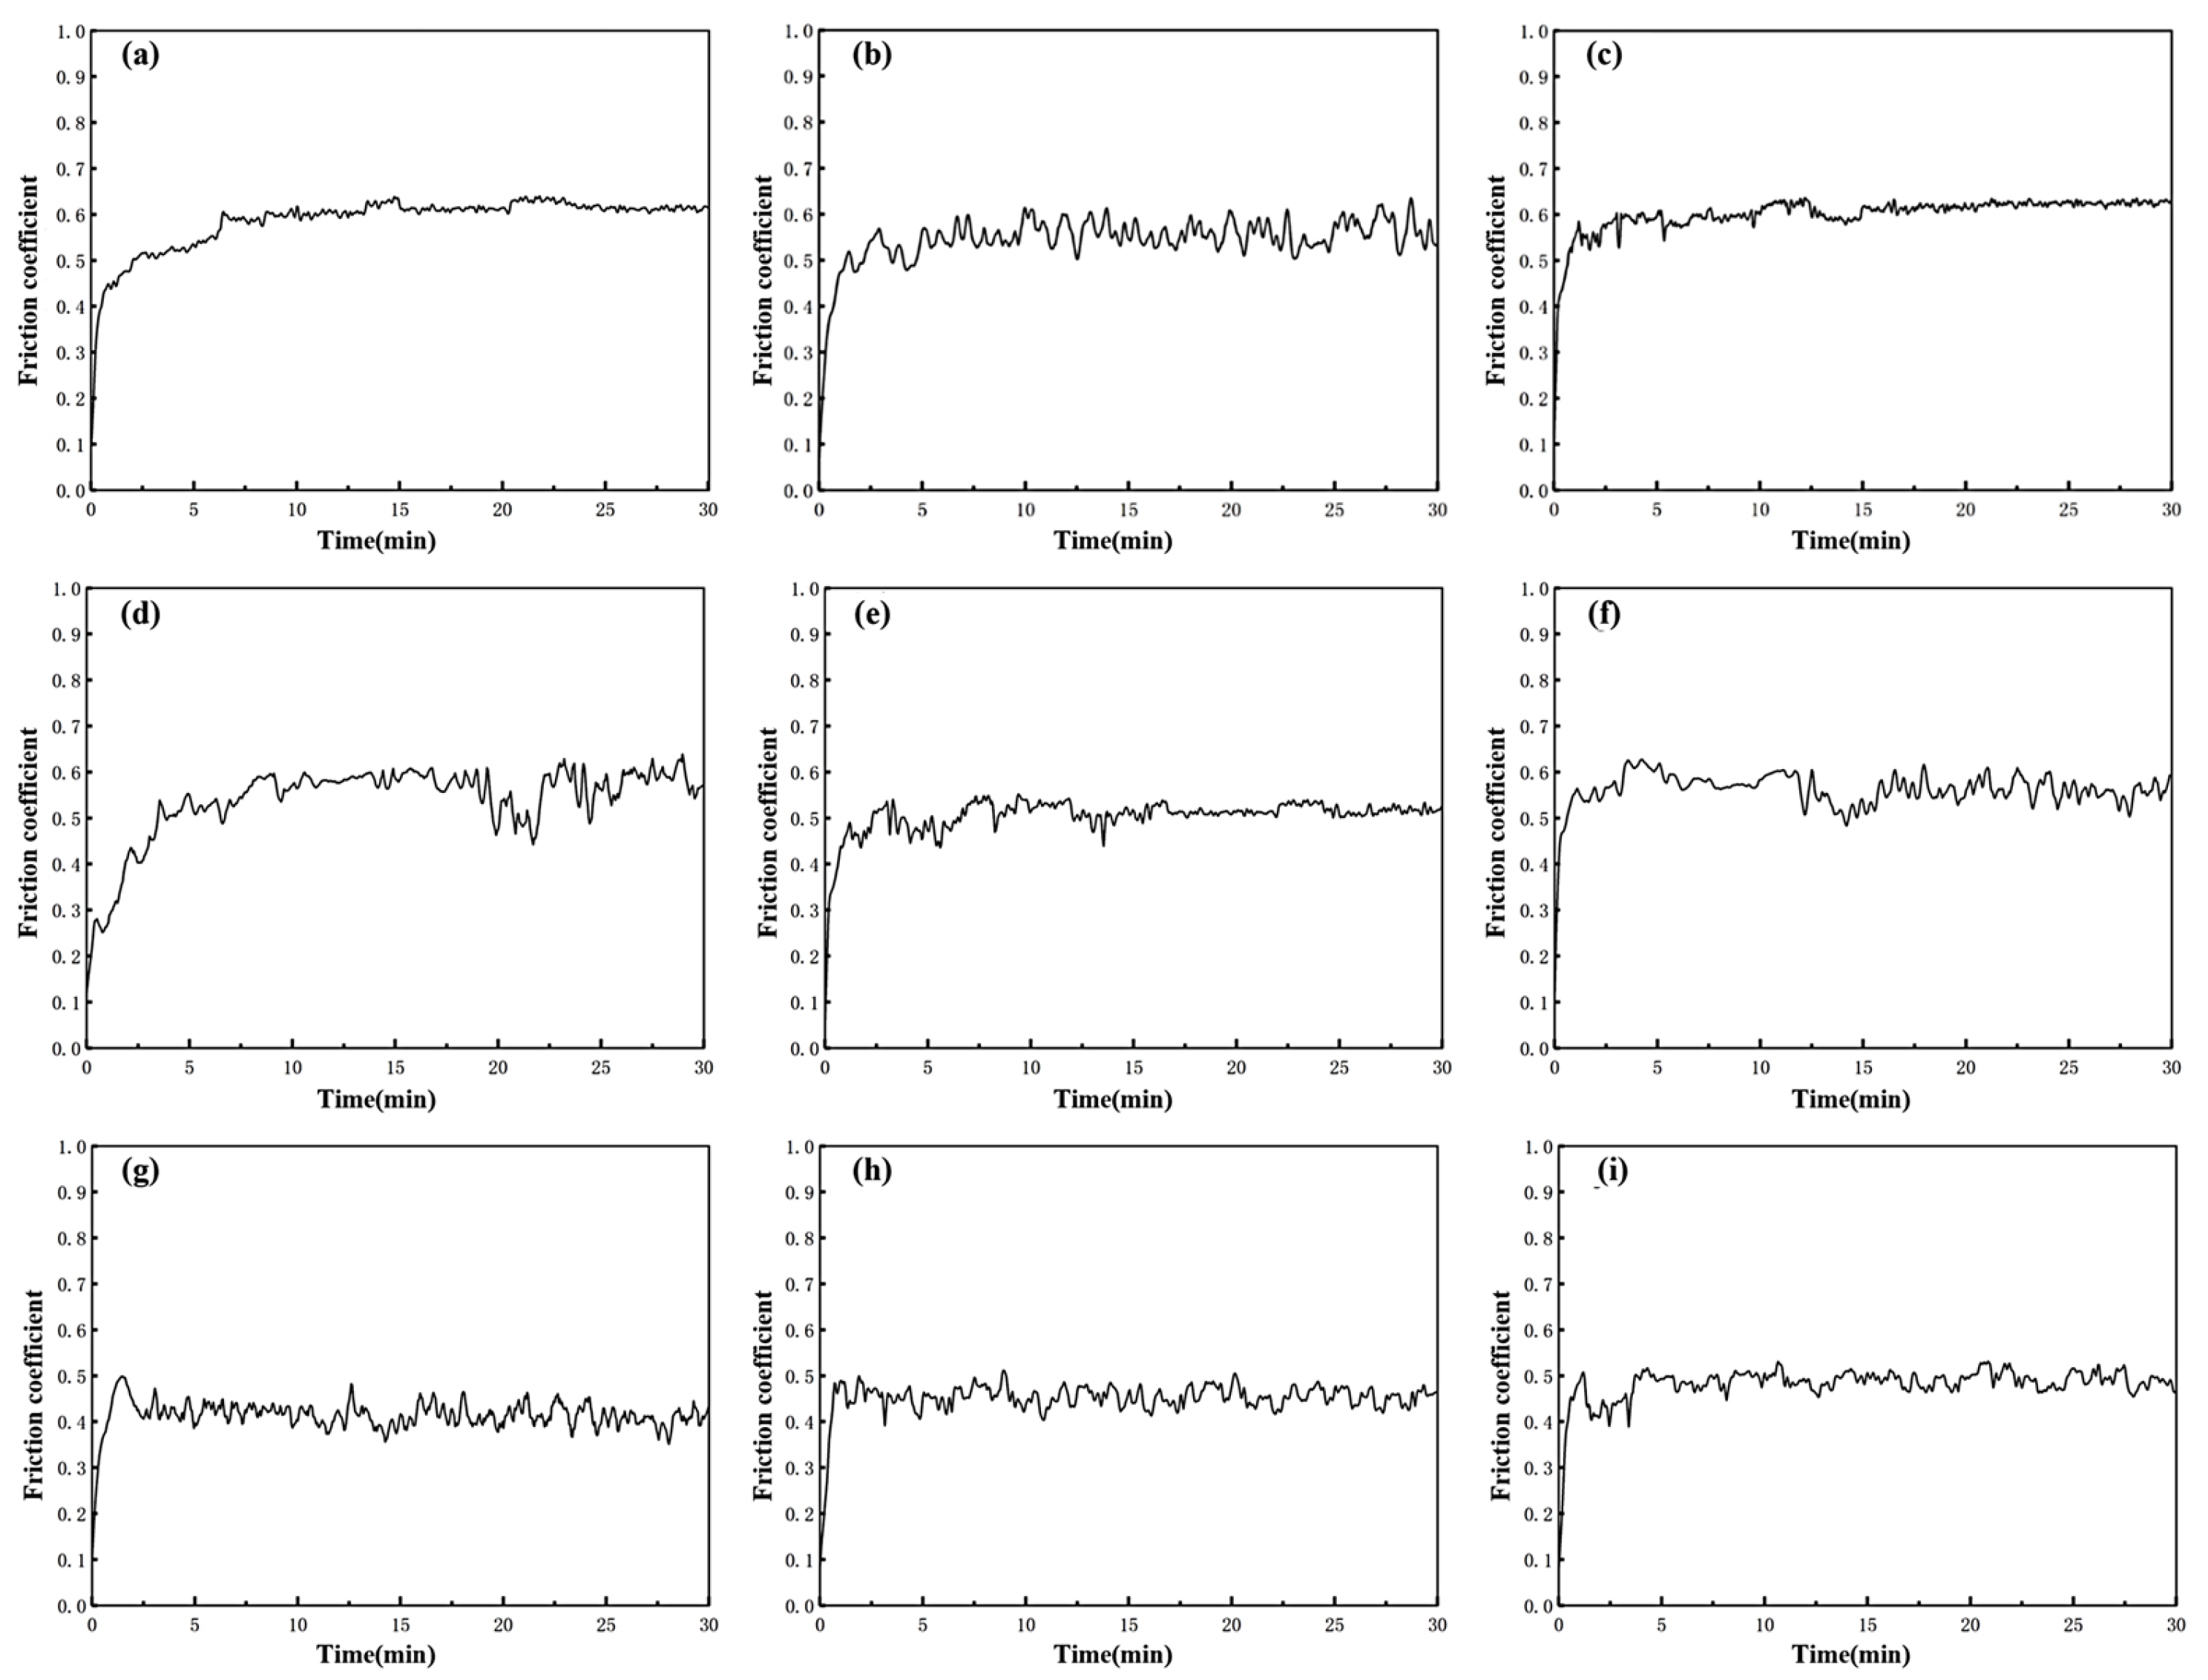
The instantaneous friction coefficient curves and the average friction coefficients of the nine groups of specimens are shown in
Figure 6 and
Table 4, respectively. In the early stage of the test, the friction coefficient rose sharply and then gradually stabilized as the test progressed, which is attributed to the initial increase caused by surface contaminants. After calculation, the average friction coefficients of the nine groups of AlCrN coating specimens were 0.581, 0.543, 0.586, 0.538, 0.496, 0.532, 0.435, 0.446, and 0.486, respectively.
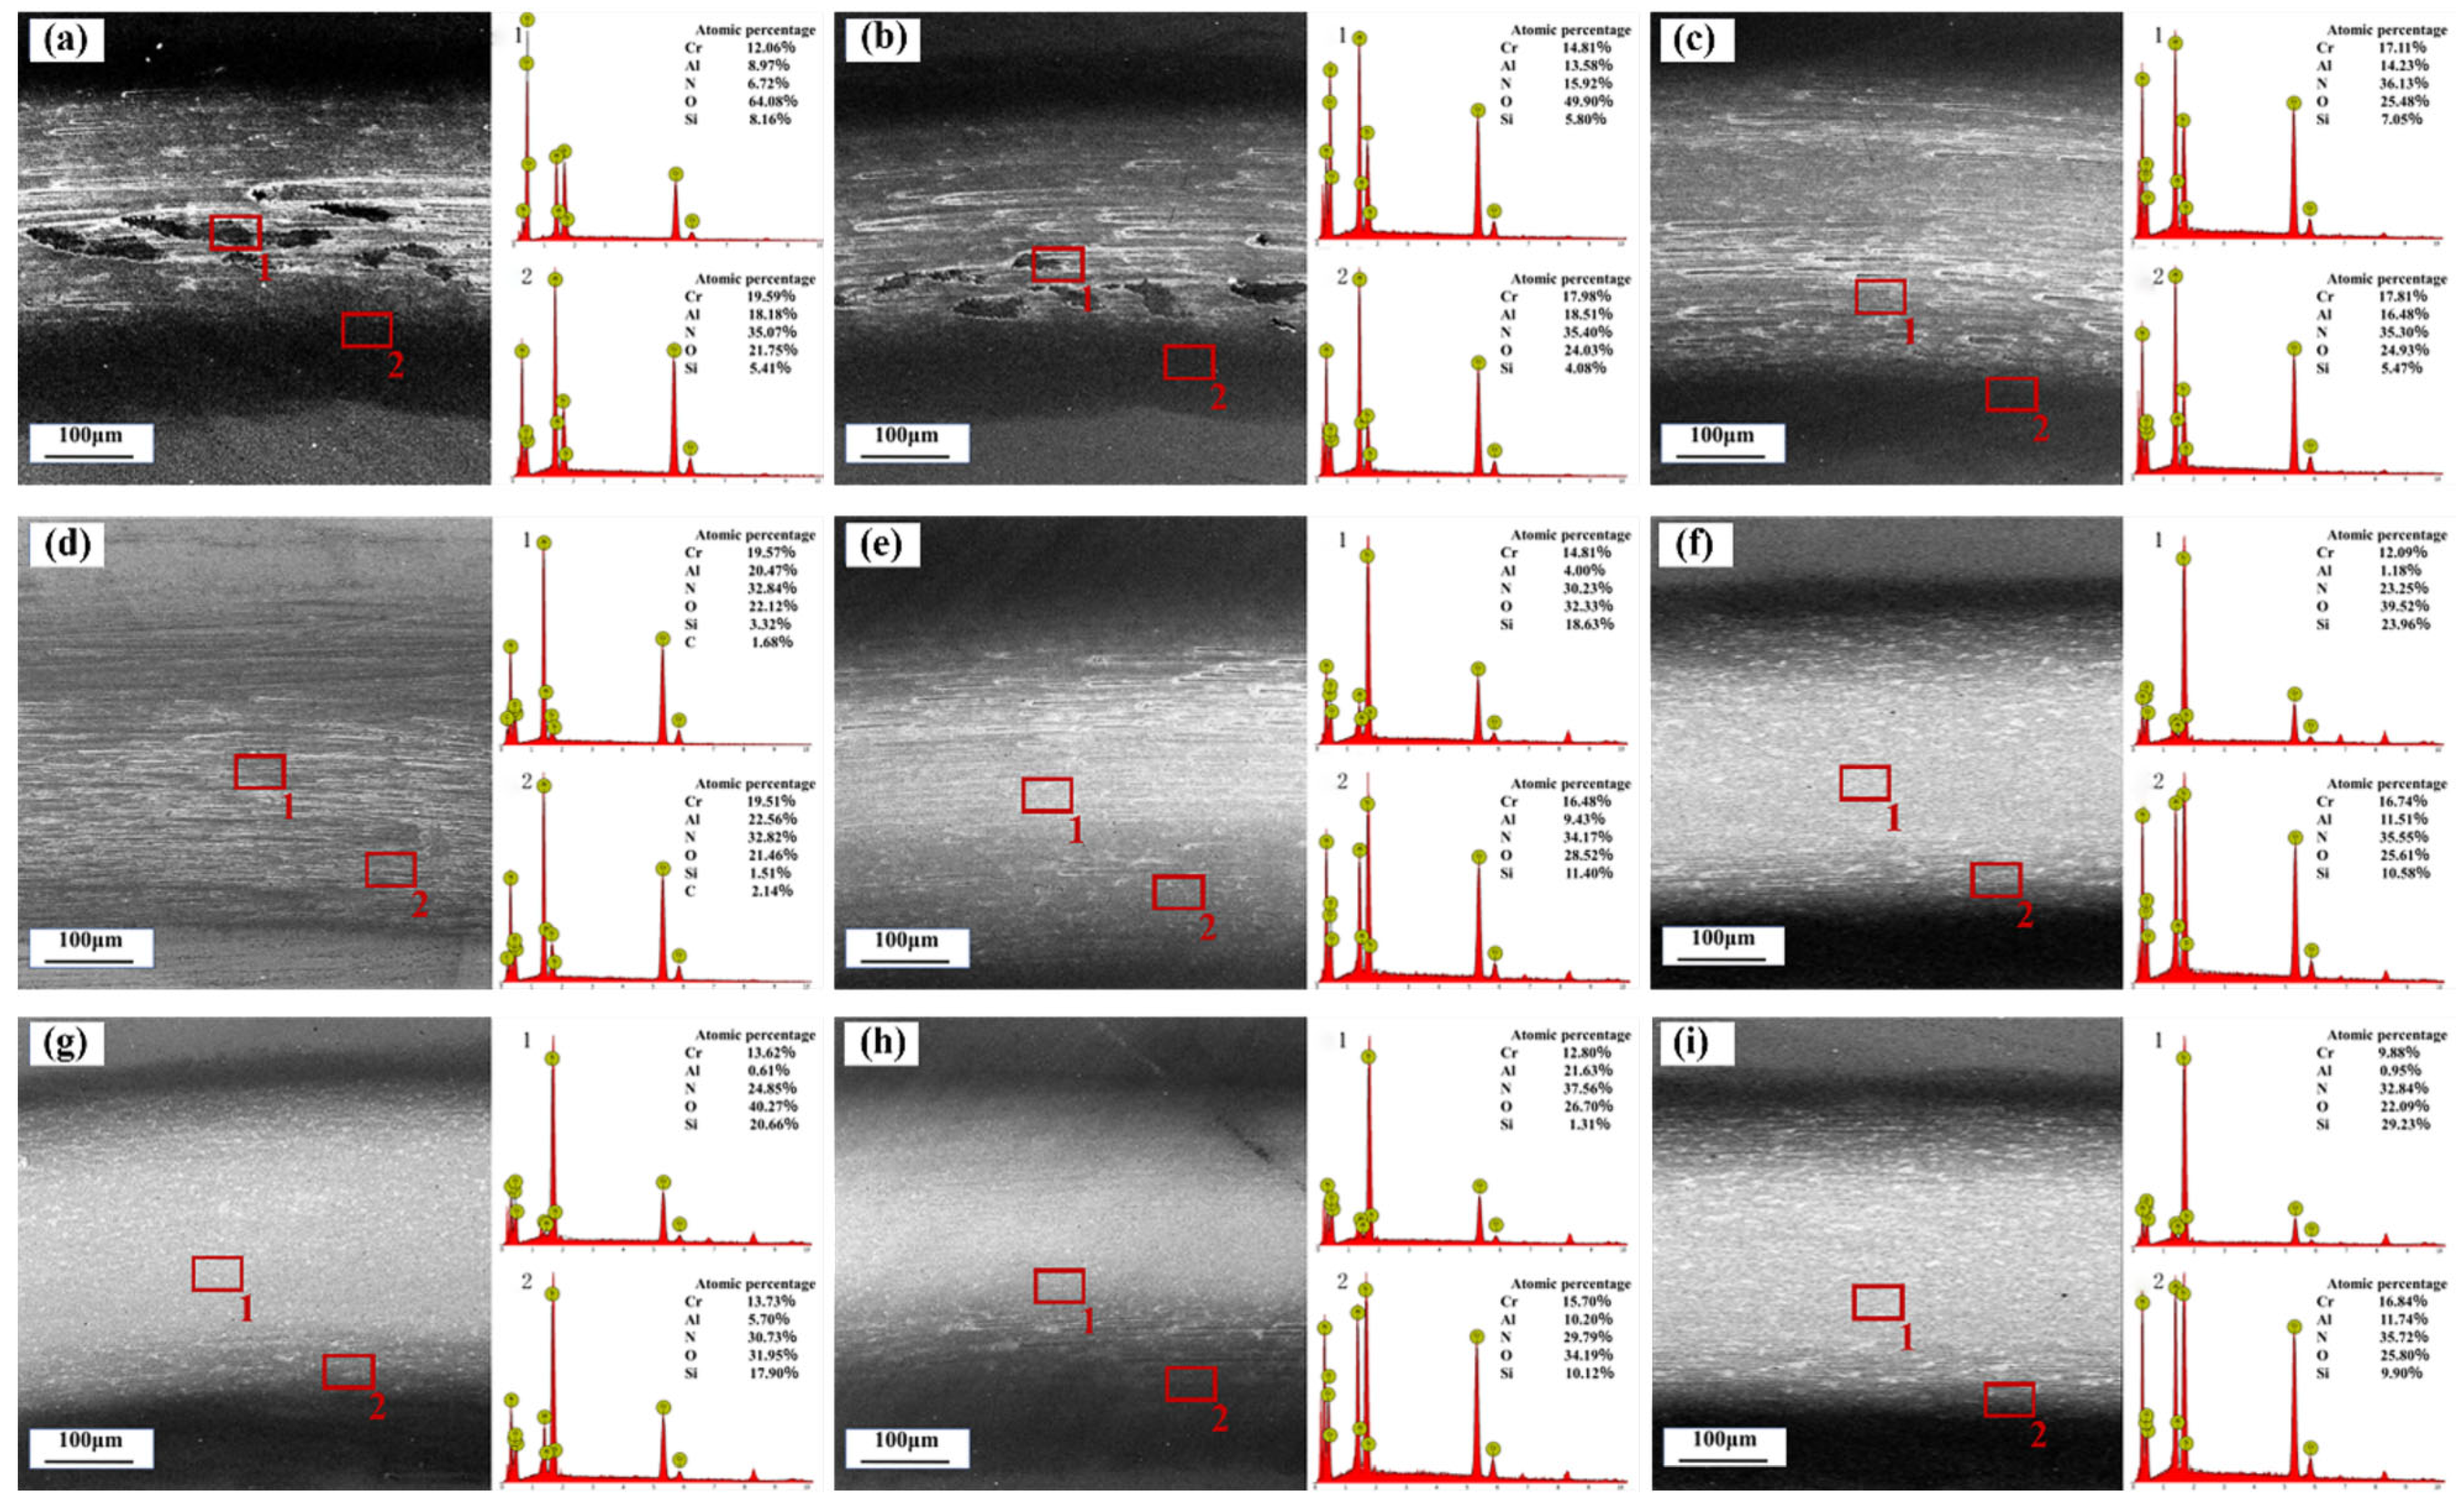
Figure 7 Friction and wear morphologies of the nine groups of AlCrN coating specimens. Wear tracks of varying widths appeared on the specimen surfaces. To further analyze the wear types, two points within the wear tracks were selected for EDS analysis.
Fine particles were observed on the worn surfaces of all specimens, exhibiting characteristics of abrasive wear. EDS analysis detected the presence of elements originating from the SiC ball as well as oxygen on the surfaces of all AlCrN coating specimens, indicating that adhesive wear and oxidative wear occurred during the sliding process. For specimens a, b, and c, the wear debris was mainly distributed in the central region, accompanied by a large amount of adhered material. EDS analysis showed that the oxygen content in these specimens was significantly higher than that in the other specimens, indicating that these specimens suffered the most severe oxidative wear.
By comparison, it was found that increasing the duty cycle reduced the wear of the AlCrN coating specimens. This may be attributed to the fact that coatings deposited at higher duty cycles can achieve superior oxidation resistance and wear resistance, effectively suppressing the occurrence of wear.
3.5. Orthogonal Experimental Results and Analysis
3.5.1. Orthogonal Experimental Results
After conducting hardness tests, adhesion strength tests, and friction and wear tests on the specimens, range analysis was performed on the results to determine the degree of influence of each factor on the performance indicators of the AlCrN coatings, as well as the optimal schemes. As can be seen from the tables, the optimized process parameters derived from the individual analysis of each indicator are inconsistent. Therefore, it is necessary to comprehensively consider the primary and secondary influences of the factors to determine the optimal coating process parameters. The individually optimized parameters for each performance indicator are summarized as follows: surface hardness, adhesion strength, and average friction coefficient. The orthogonal experimental results are shown in
Table 5.
3.5.2. Range Analysis of Coating Surface Hardness
To study the influence of each parameter on hardness, range analysis was performed on the hardness results.
,
, and
are the average hardness values for each of the three levels of each influencing factor. The R value reflects the maximum range among
,
, and
. The results are shown in
Table 6.
The range
indicates the magnitude of the influence of the factor on hardness, and the K value indicates the influence of each level on hardness. The results in
Table 6 show that the ranking of parameters influencing surface hardness is duty cycle > negative bias voltage > arc current. The optimal process scheme for surface hardness is
, i.e., a duty cycle of 70%, an arc current of 60 A, and a negative bias voltage of 130 V.
3.5.3. Range Analysis of Adhesion Strength
The range R indicates the magnitude of the influence of the factor on adhesion strength, and the K value indicates the influence of each level on adhesion strength. The results in
Table 7 show that the ranking of parameters influencing adhesion strength is arc current > duty cycle > negative bias voltage. The optimal process scheme for adhesion strength is
, i.e., a duty cycle of 50%, an arc current of 80 A, and a negative bias voltage of 110 V.
3.5.4. Range Analysis of Average Friction Coefficient
The range
indicates the magnitude of the influence of the factor on the average friction coefficient, and the K value indicates the influence of each level on the average friction coefficient. The results in
Table 8 show that the ranking of parameters influencing the average friction coefficient is duty cycle > arc current > negative bias voltage. The optimal process scheme for the average friction coefficient is
, i.e., a duty cycle of 70%, an arc current of 60 A, and a negative bias voltage of 110 V.
3.6. Process Parameter Optimization
Using the range analysis of the orthogonal experiment and an equal-weight multi-index weighting method, the three core indicators were subjected to multi-objective optimization to determine the optimal process parameters. Surface hardness and adhesion strength are higher-is-better indicators (higher values correspond to better coating performance), while the friction coefficient is a lower-is-better indicator (lower values correspond to better coating performance). , and are the normalized values of hardness, adhesion strength, and friction coefficient, respectively. S is the equal-weight weighted score. The formulas are as follows:
Higher-is-better normalization formula:
Lower-is-better normalization formula:
Equal-weight weighted comprehensive score:
: original measured value of the -th indicator for the -th test;
: maximum value of the -th indicator among all tests;
: minimum value of the -th indicator among all tests;
: normalized value of the -th indicator for the -th test;
: number of performance evaluation indicators (in this paper, : surface hardness, adhesion strength, average friction coefficient);
: comprehensive score for the -th test.
Calculations were performed according to the formulas, and the comprehensive scores for the nine tests are shown in
Table 9.
The average scores per level in the orthogonal experiment are shown in
Table 10. Using the equal-weight weighted comprehensive score
, the average score per level
was further calculated, and
was used as the indicator for selecting the optimal level (a larger
indicates better coating performance).
Formula for average score per level:
: comprehensive score of the -th test ();
: any factor under consideration (A: duty cycle, B: arc current, C: negative bias);
: the -th level of factor ();
: number of times each level of factor appears repeatedly in the test (in this paper, );
: average comprehensive score of the -th level of factor .
Table 10.
Average scores per level from orthogonal experiment.
Table 10.
Average scores per level from orthogonal experiment.
| Factor | Avg. Score Level 1 | Avg. Score Level 2 | Avg. Score Level 3 | Optimal Level |
|---|
| | |
|---|
| A () | 0.240 | 0.551 | 0.729 | (70%) |
| B () | 0.424 | 0.594 | 0.502 | (60 A) |
| C () | 0.403 | 0.585 | 0.532 | (110 V) |
In summary, the optimized deposition process parameters for AlCrN are a duty cycle of 70%, an arc current of 60 A, and a negative bias voltage of 110 V. Specimens were trial-produced using the optimized process parameters and tested for surface hardness, adhesion strength, and average friction coefficient. The results are shown in
Table 11. Compared to untreated specimens, the surface hardness increased by 399%, the adhesion strength was at a relatively high level among the other nine specimens, and the average friction coefficient was at a relatively low level among the nine specimens. The theoretical performance of the coating was significantly improved compared to before optimization.
3.7. Injection Production Cycle Comparison
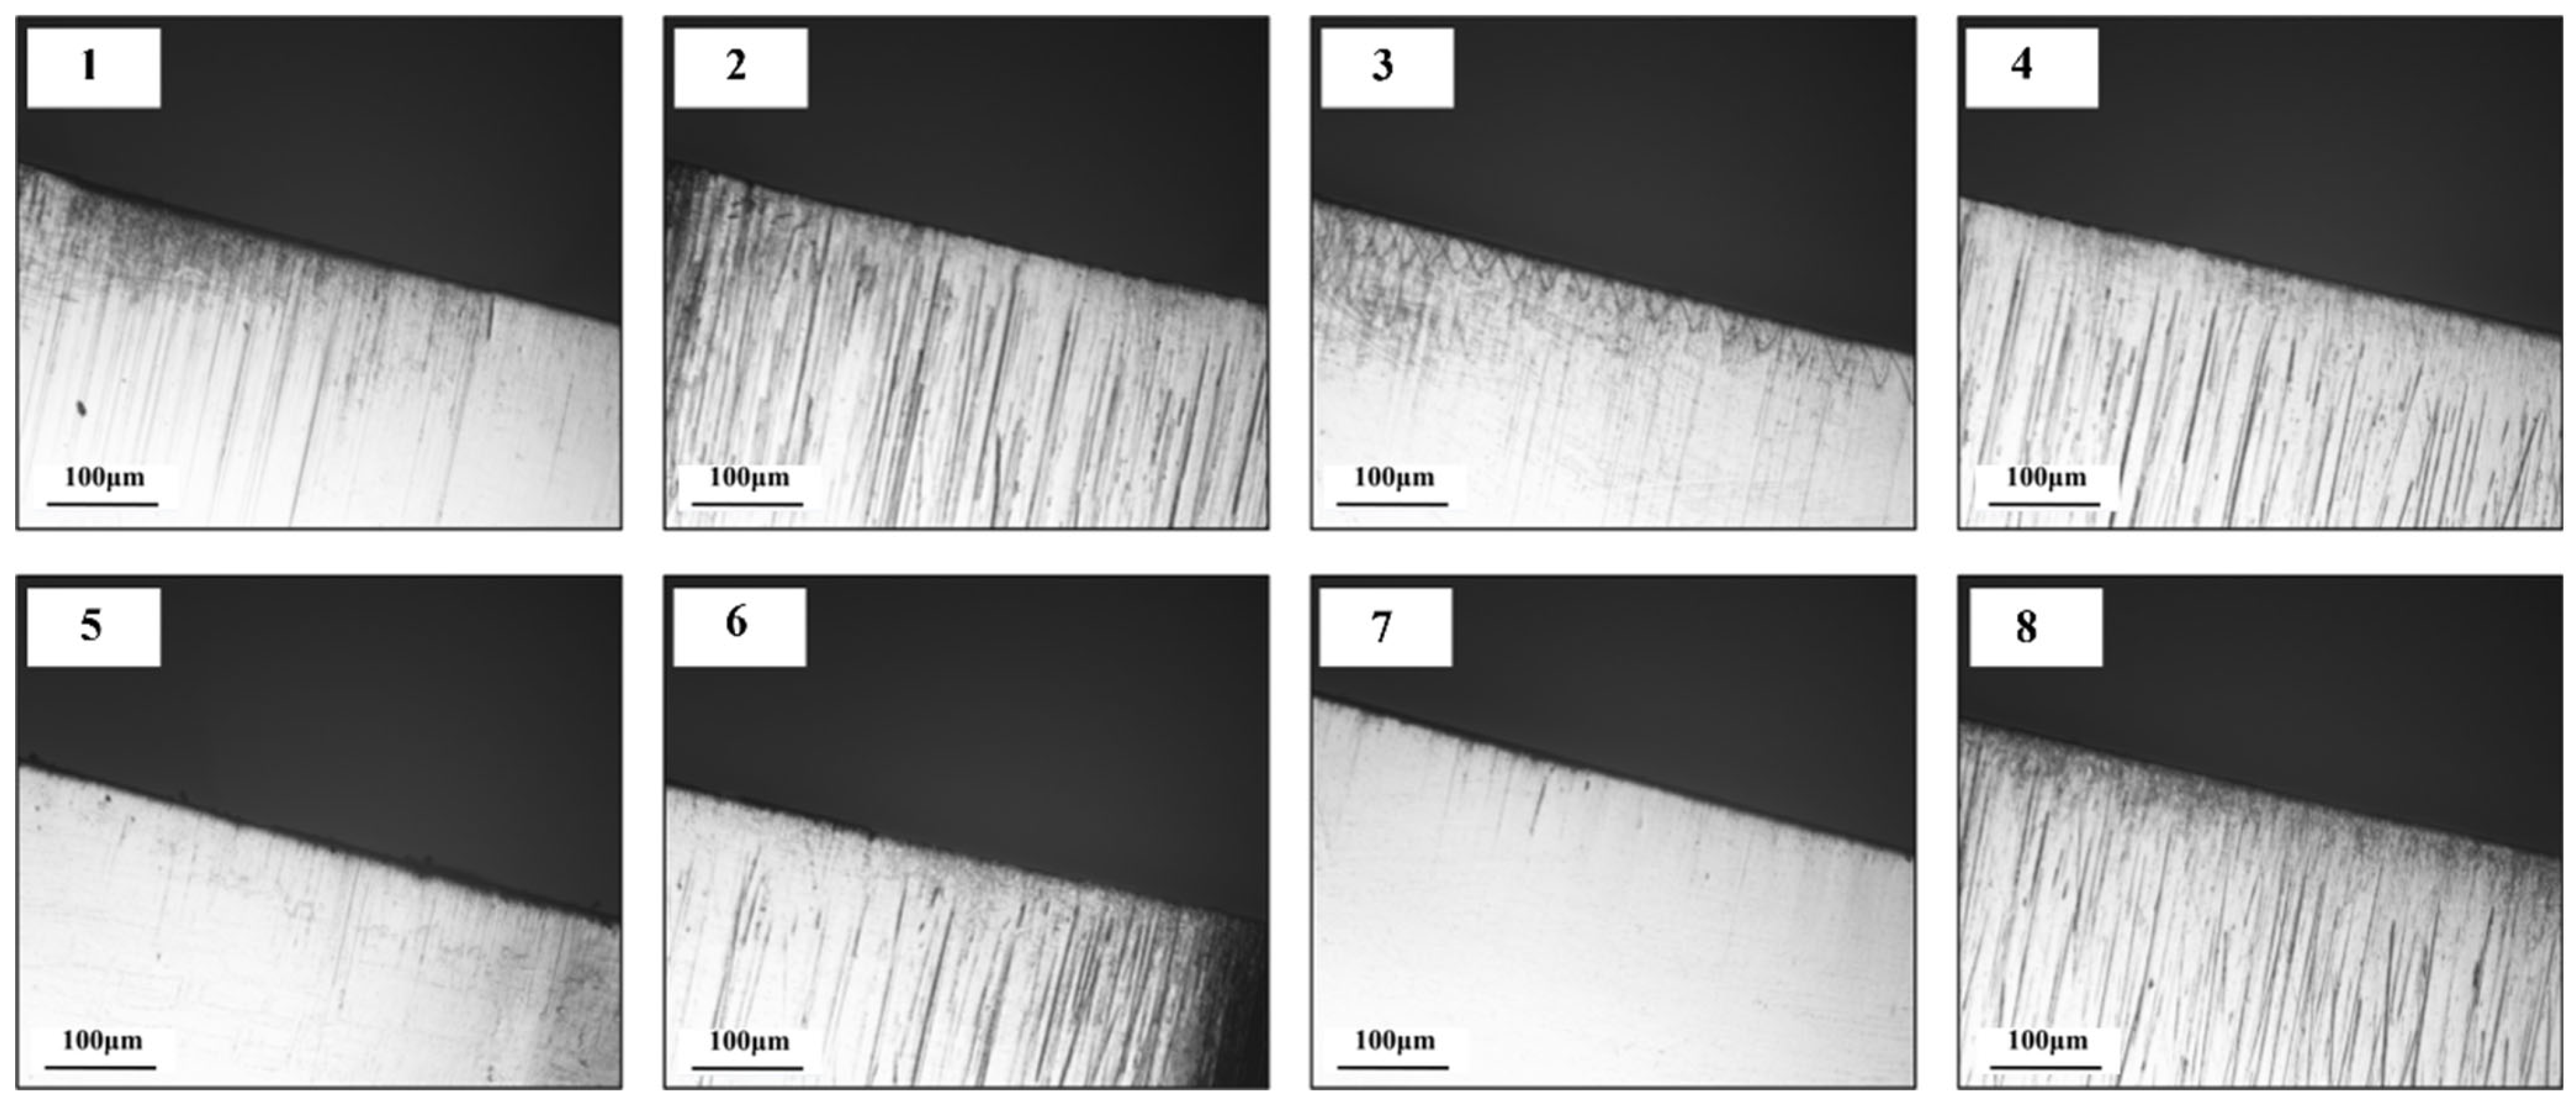
The service lives of AlCrN-coated molds and uncoated molds were compared on a relay component mold with two cavities (one mold, two cavities). Molds in experiments 1, 3, 5, and 7 were coated with AlCrN using the optimal deposition process parameters, while molds in experiments 2, 4, 6, and 8 were left uncoated as the control group. The part flash height ≥ 0.1 mm was used as the criterion for mold failure. Four identical experiments were performed for each condition, and the average values were taken. The comparison of the service life between the AlCrN-coated and uncoated molds is shown in
Table 12.
In the experiments, specimens 1, 2, 3, 4, 5, 6, 7, and 8 were produced under the same conditions. When the uncoated specimens 2, 4, 6, and 8 reached cycle counts of 34,580, 36,660, 32,720, and 31,980, respectively, the produced parts exhibited flash heights of 0.122 mm, 0.118 mm, 0.132 mm, and 0.126 mm, exceeding the part control standard. Therefore, molds 2, 4, 6, and 8 were judged to have failed. The
Figure 8 shows a comparison of the surface wear conditions between the AlCrN-coated molds and the uncoated molds when specimens 2, 4, 6, and 8 failed. The surfaces of the uncoated molds exhibited severe glass-fiber plowing grooves, while the surfaces of the AlCrN-coated molds only showed slight scratches, minor pitting on the edges, and slight sinking. The wear resistance of the AlCrN-coated molds was significantly better than that of the uncoated mold cavities.
The non-failed molds 1, 3, 5, and 7 continued to be produced. When they reached cycle counts of 128,740, 121,020, 128,940, and 133,580, respectively, the produced parts exhibited flash heights of 0.118 mm, 0.123 mm, 0.112 mm, and 0.128 mm, exceeding the part control standard, and were therefore judged as failed. The test ended at this point. Based on the average service life, the AlCrN coating extended the mold service life by approximately 277%.
4. Discussion
In this study, increasing the duty cycle improved coating density and hardness but also increased surface defects. This is consistent with the results of Singh et al. using pulsed arc ion plating; however, in HiPIMS (High-Power Impulse Magnetron Sputtering) technology, a low duty cycle instead resulted in higher hardness, indicating that the underlying mechanism of duty cycle effects differs fundamentally depending on the deposition technique [
27]. The arc current showed a strong positive correlation with coating thickness, but excessively high arc current led to particle coarsening and an increased number of pits and exerted the greatest influence on adhesion strength. Ahmad et al. also found that the optimal adhesion strength was achieved at an arc current of 80 A [
28]. Increasing the negative bias voltage refined the particles and enhanced hardness, but excessive bias voltage reduced adhesion strength due to over-bombardment, which is consistent with the findings of Gilewicz et al., who also confirmed the existence of an optimal bias voltage range [
29].
Compared with similar coatings reported in the literature, the optimized coating in this study achieved a hardness of 36.04 GPa, which is at a relatively high level for AlCrN coatings, approaching the 37.5 GPa reported for HiPIMS processes and significantly superior to the 17–23.6 GPa obtained by conventional cathodic arc evaporation. The adhesion strength of 143.87 N is substantially higher than the 73.3–108 N reported in the literature, which may be attributed to the high surface quality of the ELMAX substrate and the multi-index optimization strategy [
30,
31]. The friction coefficient of 0.422 is also at a relatively low level. These comparisons indicate that, through reasonable multi-index orthogonal optimization, comprehensive performance close to that of advanced processes can be achieved on conventional multi-arc ion plating equipment [
32].
In the injection molding cycle tests, the coated mold exhibited a 277% improvement in service life, which is mainly attributed to a triple mechanism: the high hardness (36.04 GPa) effectively resists abrasive plowing by glass fibers; the high adhesion strength (143.87 N) ensures that the coating does not delaminate under cyclic thermal stress; and the low friction coefficient (0.422) reduces interfacial shear forces, thereby decreasing the wear rate [
33]. This improvement is at the upper end of the 2–3 times range reported in industrial practice, validating the engineering effectiveness of the optimized scheme. However, this study did not address high-temperature oxidation performance or thermal fatigue resistance and was limited to a single mold product. Future work should be extended to a wider range of injection molding conditions and coating systems.
5. Conclusions
During the preparation of AlCrN coatings by multi-arc ion plating, the duty cycle, arc current, and negative bias voltage significantly influenced the coating structure and properties. Increasing the duty cycle improved coating density and hardness but also increased surface defects. Increasing the arc current increased the coating thickness but caused particle coarsening. Increasing the negative bias voltage refined the particles but increased the number of pits, while the adhesion strength increased first and then decreased with increasing negative bias voltage.
Through a three-factor, three-level orthogonal experiment and a multi-index equal-weight weighting method, the optimal process parameters were determined as a duty cycle of 70%, an arc current of 60 A, and a negative bias voltage of 110 V. The optimized coating achieved a hardness of 36.04 GPa (an increase of 399%), an adhesion strength of 143.87 N, and a friction coefficient of 0.422.
Production cycle verification demonstrated that the AlCrN-coated mold achieved an average service life of 128,070 cycles, representing a 277% improvement over the uncoated mold (33,985 cycles). The coated mold surface exhibited only slight scratches, while the uncoated mold showed severe glass-fiber plowing grooves.
Through the synergistic effects of high hardness for abrasive wear resistance, high adhesion strength for interfacial delamination resistance, and low friction coefficient for friction reduction, the AlCrN coating significantly extended the service life of relay injection molds under high-temperature glass-fiber erosion conditions. This study provides a quantifiable process optimization scheme and industrial validation data for extending the service life of injection molds.
It should be noted that the evaluation of the friction and wear performance of the coatings in this study was primarily based on the friction coefficient, SEM observation of wear morphologies, and EDS elemental analysis. Quantitative indicators such as wear track profilometry (e.g., wear track width, depth, wear volume, and specific wear rate) were not assessed. Therefore, the discussion on the improvement of wear resistance remains predominantly qualitative and lacks comprehensive quantitative wear data support. This limitation is mainly attributed to the constraints of experimental equipment and testing conditions. Relevant quantitative characterization will be further improved in subsequent studies.