Article

Effects of Al2O3 Particle Size on Multi-Mode Erosion Failure Mechanisms of EB-PVD YSZ Thermal Barrier Coatings Under Simulated Aero-Engine Conditions

1
Surface Engineering Institution, AECC Beijing Institute of Aeronautical Materials, Beijing 100095, China
2
AECC Key Laboratory of Advanced Corrosion and Protection on Aviation Material, AECC Beijing Institute of Aeronautical Materials, Beijing 100095, China
3
Fundamental Science Laboratory on Aerospace Protective Coatings, AECC Beijing Institute of Aeronautical Materials, Beijing 100095, China
4
School of Materials Science and Engineering, Shanghai Jiao Tong University, Shanghai 200240, China
*
Authors to whom correspondence should be addressed.
Coatings 2026, 16(7), 852; https://doi.org/10.3390/coatings16070852
Submission received: 22 May 2026 / Revised: 13 July 2026 / Accepted: 14 July 2026 / Published: 16 July 2026

Abstract

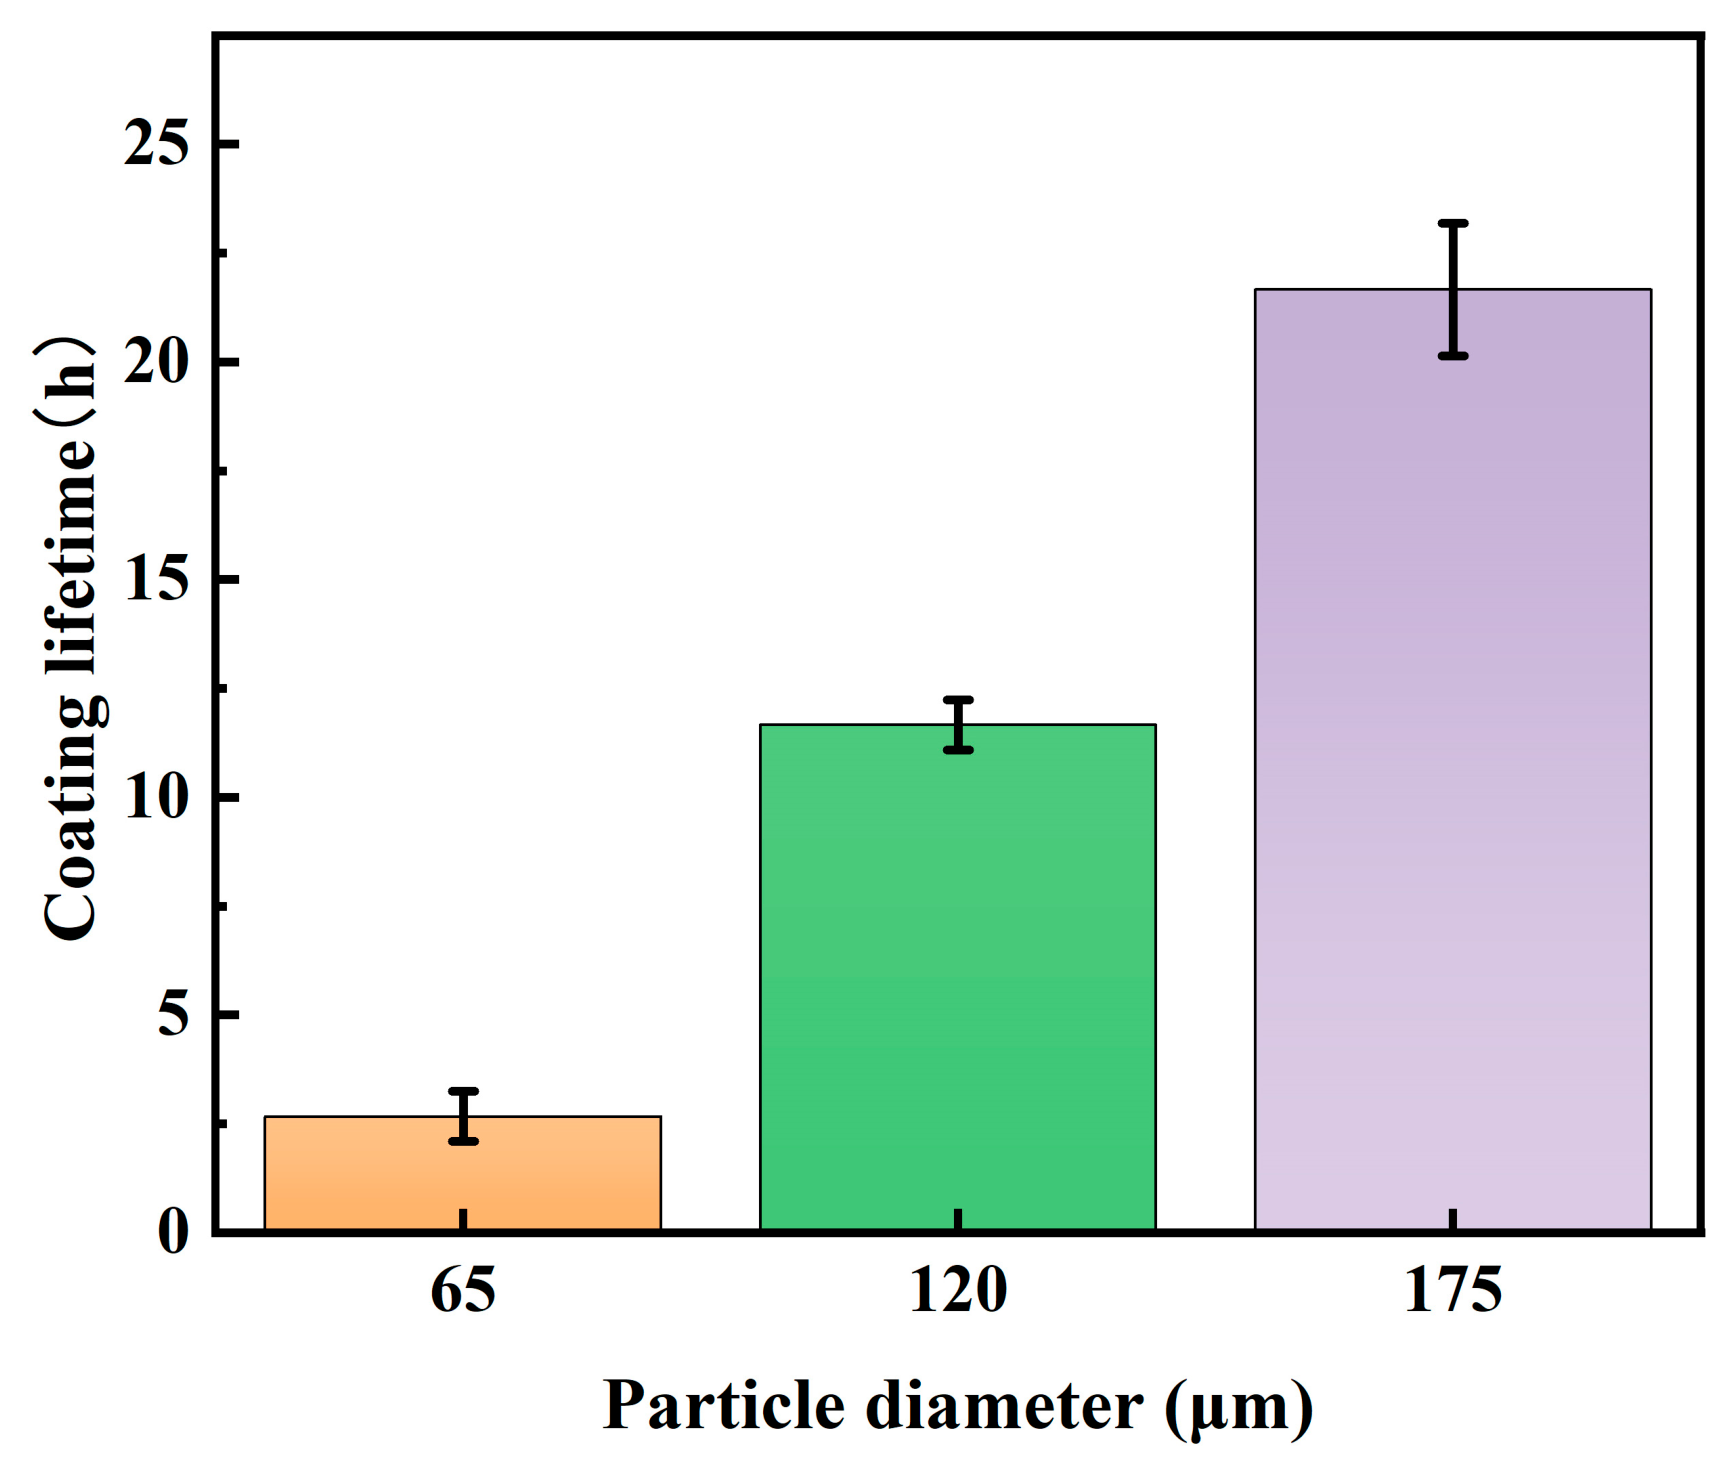
To investigate the influence of particle size on the erosion damage behavior and failure mechanisms of thermal barrier coatings (TBCs) in a simulated aero-engine erosion environment, erosion tests were conducted using Al2O3 particles of different sizes (65 μm, 120 μm, and 175 μm) under a nominal gas-flow condition of Mach 0.4 at 1150 °C with custom-built multi-factor coupled erosion test equipment. TBCs were prepared using electron beam physical vapor deposition (EB-PVD). By combining macroscopic/microscopic morphology, composition, white-light interferometry, and Raman residual stress testing, the damage evolution and failure behavior of TBCs under different particle size conditions were analyzed. The results indicate that particle size has a significant effect on the erosion behavior of thermal barrier coatings. Under erosion conditions involving 65, 120, and 175 μm particles, the erosion rates were 10.83, 4.19, and 2.05 g/kg, with corresponding coating lifetimes of approximately 3, 12, and 22 h. As particle size increases, the erosion rate decreases and the coating lifetime increases. Under small 65 μm particles, the coating exhibits high-frequency continuous micro-cutting. The ceramic layer rapidly thins, leading to localized penetration. Under erosion by 120 μm particles, the coating exhibits a composite damage mechanism involving cutting, compaction, and brittle fracture. Under large-particle impacts of 175 μm, the damage mechanism is dominated by localized brittle fracture and spalling induced by high-energy impacts. Although the single-impact energy of large-particle impacts is higher, the lower particle number density results in a discrete distribution of damage zones, leading to a lower material removal rate. The Raman test results further indicate that, after 2 h of erosion, the differences in residual stress in the TGO layer were relatively small across different particle size conditions, suggesting that the early degradation process of the coating is primarily controlled by the mechanical removal of the ceramic surface layer rather than by the evolution of TGO stress. No statistically significant difference in TGO residual stress was observed among different particle sizes after 2 h of erosion (p > 0.05). Not only is the erosion life of EB-PVD YSZ TBCs is influenced by the impact energy of individual particles, but more importantly, it is also closely related to particle number density, impact frequency, and the spatial distribution of damage.

1. Introduction

Thermal barrier coatings (TBCs) are a widely used high-temperature protective coating in advanced aircraft engines. As thermal insulation coatings, they are extensively used to protect the surfaces of hot-end components such as combustion chambers and turbine blades in aircraft turbine engines. The use of thermal barrier coating technology not only significantly increases the operating temperature of aircraft engines but also enhances the blades’ resistance to oxidation and corrosion during high-temperature service [1,2]. TBCs consist of a ceramic top coating (TC) and a metallic bond coating (BC). Under high-temperature conditions, Al diffuses outward from the bond coating, forming a dense layer of Al2O3 oxide (TGO). TGO enhances resistance to high-temperature oxidation. As the critical functional layer, the ceramic top coating is directly exposed to severe environments. Leveraging its excellent high-temperature resistance and low thermal conductivity, it primarily provides thermal insulation and protection [3,4,5].
Although TBCs effectively protect hot-end components, damage and failure are inevitable during long-term, complex service. Among these, erosion damage is one of the key factors leading to early failure of TBCs and a shortened engine lifetime. Erosion damage refers to mechanical damage caused by solid particles carried in the air that continuously impact the coating surface when driven by high-velocity gas flows [6,7]. This damage is cumulative and irreversible, gradually compromising the structural integrity of the coating and ultimately leading to coating spalling and the loss of thermal protection [8,9,10]. Therefore, in-depth research into the erosion damage behavior and failure mechanisms of TBCs has significant theoretical and engineering value for optimizing coating design, enhancing erosion resistance, and extending engine service life.
In recent years, extensive studies [11,12,13,14,15] have systematically investigated the particle erosion behavior of YSZ TBCs and doped YSZ TBCs prepared by EB-PVD (electron beam physical vapor deposition). They found that the erosion failure modes of EB-PVD coatings are influenced by multiple factors, including the physical parameters of the eroding particles (size, density, etc.), operating conditions (temperature, velocity, impact angle, etc.), and the microstructure and mechanical properties of the coating itself (fracture toughness, elastic modulus, etc.), and proposed various failure mechanisms. These works provided important insights for understanding the erosion failure mechanisms of TBCs.
Among the factors influencing erosion damage to TBCs, particle size represents a critical parameter that has a significant impact on the extent of coating damage and failure mechanisms. Particles of different sizes exert distinct effects on the microstructure of the coating, leading to varying damage characteristics and failure modes. However, current research in this area remains limited. On the one hand, due to technical limitations of previous erosion testing equipment, it has been impossible to simulate real erosion environments where multiple factors, such as high temperature, velocity, and thermal cycling, are coupled, resulting in significant differences between erosion test results and actual engine operating conditions. Liu et al. [16] used a multi-factor coupling device to study the thermal shock failure mechanism of YSZ thermal barrier coatings under conditions close to actual service conditions. Wang et al. [17,18] investigated the erosion behavior of novel La2(Zr0.7Ce0.3)2O7 (LZC) and LZC/YSZ TBCs under room-temperature and high-temperature gas flows containing solid particles, exploring the erosion performance of the LZC base coating and the influence of the bilayer structure on erosion damage. Although the above studies provide important references for simulating the erosion failure mechanisms and performance optimization of thermal barrier coatings under real operating conditions, less systematic research has been conducted on the failure evolution patterns under different physical parameters of eroding particles of YSZ coatings, the most widely used type prepared by the EB-PVD method. On the other hand, existing studies have not sufficiently explored the damage evolution patterns, differences in failure mechanisms, and intrinsic correlations of TBCs under erosion by particles of different sizes. In particular, the effects of particles of different sizes on their columnar crystal structure, the stress state of the TGO layer, and erosion rates remain unclear.
Based on the current state of research and existing issues outlined above, this study aims to elucidate the influence of particle size on the evolution of erosion damage and failure mechanisms in EB-PVD YSZ thermal barrier coatings under simulated aircraft engine service conditions. This study will conduct a systematic investigation into the evolution of the coating’s surface and cross-sectional topography, changes in residual stress within the TGO layer, erosion rates, and coating lifespan during the erosion process by particles of different sizes. This study further elucidates the effect of particle size on the erosion failure behavior of thermal barrier coatings. The results provide theoretical and experimental support for the design of erosion-resistant thermal barrier coatings and the service-life assessment of aircraft engines.

2. Materials and Methods

2.1. Materials

The substrate material used in the experiment was the single crystal superalloy DD6. The bond coating was made of NiCoCrAlYHf (HY5), and the top coating was 6%–8% (by mass) yttria-partially-stabilized zirconia (YSZ). The nominal compositions of the DD6 alloy and the HY5 bond coating provided by the material supplier are listed in Table 1, which was reproduced from Ref. [19]. The specimen dimensions were 20.0 mm × 10.0 mm × 1.0 mm. Although flat specimens were adopted to ensure repeatability and eliminate geometric effects, actual turbine blades possess complex curvatures that may alter particle trajectories and local impact conditions. Future work will prepare curved specimens matching the curvature of real turbine blades to further reveal the erosion damage mechanism of thermal barrier coatings under service close-to-real working conditions.
Al2O3 particles were selected as the eroding particles for the erosion test. Al2O3 particles were selected because they are representative of hard oxide particles commonly encountered in aero-engine service environments. In addition, Al2O3 possesses high hardness, excellent thermal stability, and good chemical stability at elevated temperatures, making it one of the most widely used standard erodent materials in high-temperature erosion studies. Using Al2O3 also facilitates comparison with previous literature.
Three groups of particles with nominal particle sizes of 65 μm, 120 μm, and 175 μm were selected. The particle size distributions were measured using a laser particle size analyzer (Bettersize Instruments Ltd., Dandong, China) via ultrasonic dispersion in anhydrous ethanol. The characteristic particle size parameters D10, D50, and D90 were obtained from the particle volume distribution, as shown in Table 2, where D10, D50, and D90 represent the particle diameters corresponding to cumulative particle volume fractions of 10%, 50%, and 90%, respectively. Span is calculated as Equation (1) to describe the width of particle size distribution.
S p a n = D 90 D 10 D 50
Only the particle size distribution of the Al2O3 was characterized in the present study, whereas the particle morphology was not analyzed. Since particle morphology may influence erosion behavior, its potential effect could not be evaluated in the present work. Future studies will combine SEM observations to investigate the influence of particle morphology on the erosion mechanisms of EB-PVD YSZ thermal barrier coatings.

2.2. Coating Preparation

In this study, a HY5 bond coating was prepared on the substrate surface using the vacuum arc deposition (AIP PVD, A-1000) process. Prior to deposition, the vacuum chamber was evacuated to a vacuum level below 5 × 10⁻³ Pa under a high-purity argon protective atmosphere. The arc current was set to 80–100 A. A negative bias of −50 to −100 V was applied to the substrate to enhance ion bombardment, thereby improving coating density and interfacial bonding strength. During deposition, the substrate temperature was maintained at 400–500 °C. The distance between the target and the substrate was approximately 200 mm. The deposition rate was approximately 0.3–0.5 μm/min. The deposition time was 100 min, resulting in a HY5 bond coating thickness of approximately 40 μm. The sample was then annealed for 3 h at 900 ± 10 °C under vacuum to promote diffusion and improve the bond strength between the bonded layer and the substrate. Finally, an EB-PVD YSZ ceramic top coat was deposited using an EB-PVD system (UE-207 S). During deposition, the substrate temperature was controlled at 900–1000 °C to promote the formation of a columnar crystal structure. The electron beam power was maintained within the range of 20–30 kW. To ensure uniform coating thickness, the substrate rotated at a speed of 10–20 rpm. The deposition rate was maintained at 4–5 μm/min. The deposition time was 25 min, resulting in a ceramic top coat thickness of approximately 120 μm.

2.3. Solid Particle Erosion Test

Based on the current state of research and its limitations, this study conducted relevant research by simulating the actual operating conditions of aero-engines using multi-factor coupled erosion test equipment, as shown in Figure 1 (MK Technology GmbH, BTR-MK, Grafschaft, Germany), which was adapted from Ref. [19]. The equipment can simulate a multi-factor coupled erosion environment involving high temperature, high velocity, thermal cycling, and particle impact, effectively addressing the shortcomings of previous equipment and enabling tests that closely simulate real-world erosion conditions.
The multi-factor coupled erosion test system primarily consists of a particle supply system, a combustion chamber system, a loading system, and a control system. Particles are continuously fed by the feeding device. The particle supply system is designed around a rotating metering disc with a groove. Particles fall from the powder feed bottle and are evenly distributed in the groove by a slide. As the disc rotates, the particles are carried by the airflow into the powder feed tube and ultimately enter the combustion chamber. The test temperature is controlled by the heating system with a temperature control accuracy of ±5 °C. Erosion tests are conducted under nominal gas-flow conditions of Mach 0.4. The test system uses nominal airflow conditions as the control parameter and does not directly measure the actual particle impact velocity.
The primary objective of this test is to simulate actual erosion service conditions. It reproduces the damage mechanisms, such as impact, cutting, and material spalling, caused by high-temperature, high-velocity gas flows entraining particles on the coating surface. Compared to traditional erosion test equipment operating under a single condition, this system can simultaneously apply high-temperature gas erosion and dynamic thermal cycling. The particle acceleration behavior more closely resembles actual operating conditions in aircraft engines, enabling precise simulation of the stress and damage states of coatings under complex environmental conditions.
Based on the design principles of this equipment and calibration data obtained from representative operating conditions, this study selected a test temperature of 1150 °C and a nominal gas-flow condition of Mach 0.4 to conduct particle erosion tests. The temperature was selected to closely approximate the severe operating temperatures experienced by TBCs in actual use. The erosion test parameters are shown in Table 4, which was adapted from Ref. [19]. Al2O3 particles were selected as the eroding particles for the tests. To investigate the effect of particle size on coating erosion damage, three groups of particles with different diameters were selected, 65 μm, 120 μm, and 175 μm. During the tests, the eroding particles were continuously impacted onto the surface of the coating specimens at a rate of 0.2 g/min. The mass flow rate of abrasive particles was fixed at 0.2 g/min for all erosion tests. The particle mass flow rate was controlled by the particle feeder and calibrated before each test by collecting the discharged particles over a fixed time interval and determining the mass using an analytical balance. Assuming spherical Al2O3 particles, the mass of a single particle was calculated based on the density of 3.95 g/cm3. The particle impact frequency as shown in Table 3 was derived as the total number of incident particles per unit time. The relevant formulas are given as follows:
Mass of a single particle m p :
m p = ρ π D 3 6
where ρ = 3.95   g / cm 3 is the density of alumina, and D represents the particle diameter.
Particle impact frequency f (total number of incident particles per unit time):
f = m m p = 6 m ρ π D 3
where m = 0.2   g / min is the abrasive mass flow rate.
Table 3. Calculated particle impact frequency under different particle sizes at 1150 °C and Mach 0.4 (nominal gas flow).
Particle Size (μm)Particle Impact Frequency f (Particles/s)
655.86 × 10³
1209.33 × 102
1753.01 × 102
Although larger abrasive particles deliver higher-impact kinetic energy, the particle impact frequency declines with increasing particle size. Under a fixed abrasive mass flow rate of 0.2 g/min, the impact frequency for 65 μm particles is approximately 5.86 × 10³ particles·s−1, nearly 19 times that of 175 μm particles (3.01 × 10² particles·s−1). When 65 μm particles erode the coating, more particles strike the coating surface per unit time, promoting continuous removal of the ceramic layer, accelerating coating thinning. This eventually results in a higher erosion rate and a significantly shortened service lifetime of the thermal barrier coating.
The impact angle was fixed at 90°. This study selected a 90° normal impact angle as the test condition because ceramic thermal barrier coatings exhibit typical brittle fracture characteristics and typically sustain the most severe erosion damage under normal impact conditions. To highlight the effect of particle size on erosion behavior and minimize interference from the impact angle variable as much as possible, the impact angle was fixed at 90° in this study. The specimens were mounted vertically on a specially designed fixture and mechanically clamped using a screw-fastened holding plate. The nozzle diameter was 50 mm, and the stand-off distance between the nozzle exit and the specimen surface was 100 mm. The specimen dimensions and nozzle geometry were optimized such that the entire specimen surface was located within the effective working region of the flame nozzle, thereby providing relatively uniform temperature, gas-flow velocity, and particle impact conditions across the specimen surface. This configuration effectively minimized edge effects associated with non-uniform flow fields and temperature gradients, thereby improving the repeatability and reliability of the erosion experiments.
The erosion tests were conducted under a nominal gas-flow condition of Mach 0.4. Mach 0.4 refers to the calibrated nominal gas flow of the high-temperature erosion test system. In the present study, the particle impact velocity was not directly measured. Owing to the strong gas–particle coupling under the employed erosion conditions, the nominal gas-flow condition was adopted as the reference condition for comparative analysis. Accordingly, the Hertzian contact analysis was performed using the nominal Mach 0.4 condition to estimate the contact characteristics of particles with different sizes. The calculated contact parameters are intended for comparative analysis rather than an exact prediction of the actual particle impact conditions.
The erosion tests were conducted under cyclic thermal conditions. Each test cycle consisted of 55 min of erosion at 1150 °C, followed by 5 min of forced-air cooling, resulting in a total cycle duration of 60 min. After heating commenced, the specimen surface temperature reached 1150 °C within approximately 15 s. The specimen was maintained at 1150 °C during the subsequent 55 min erosion stage. Upon completion of the erosion period, heating was terminated, and the specimen holder was rapidly transferred to the cooling position. The specimen was then cooled by compressed air through a cooling nozzle. The surface temperature decreased to room temperature within approximately 20 s, and the remaining cooling period ensured complete thermal equilibration before the next heating cycle.
The specimen surface temperature was continuously monitored using a non-contact infrared thermometer throughout the erosion tests to ensure that the prescribed thermal cycle was maintained.
To investigate the damage evolution of TBCs during erosion, this study conducted comparative tests with two erosion durations of 2 h and 3 h. The 2 h and 3 h erosion tests corresponded to two and three thermal cycles. After the respective erosion periods, the specimens were collected for analysis.
To ensure the reliability and reproducibility of the experimental results, the erosion tests were repeated three times under the same operating conditions. The erosion rates and residual stress results presented in this paper are the averages of these three independent experiments. The erosion rates of the specimens were calculated using Equation (4). Calculating the erosion rate based on the mass loss of the TBCs is the most commonly used method for evaluating the rate of coating erosion damage [20]. This method provides the most accurate and rapid assessment of the rate at which coating material is lost due to erosion, thereby evaluating the level of TBC degradation. The mass of all samples was measured using an analytical balance before and after the erosion tests.
E r o s i o n   r a t e ( g kg ) = m a s s   l o s s   o f   t h e   s a m p l e m a s s   o f   e r o d e n t
Table 4. The main erosion parameters. Adapted from Ref. [19].
Test ParametersTest Conditions
Test temperature1150 °C
Gas velocity0.4 Mach (nominal gas flow)
Particle feeding rate0.2 g/min
Erodent materialAl2O3 particles
Particle diameterApproximately 65 μm/120 μm/175 μm
Impact angle90°
To determine the erosion lifetime of the coatings, additional long-term erosion tests were conducted under the same experimental conditions. The coating lifetime was defined as the time required for penetration of the ceramic top coat and exposure of the bond coat. During testing, the coating surface was examined at intervals of 1 h, and the lifetime was determined from the corresponding failure time.

2.4. Characterization

Surface topography was characterized using a white-light scanning interferometer (CONTOUR X-200, Bruker, Billerica, MA, USA). The measurement mode was vertical scanning interferometry (VSI), with a 10× objective lens.
Cross-sectional and surface microstructure morphology, together with elemental distribution analysis, were performed via a field-emission scanning electron microscope equipped with energy-dispersive X-ray spectroscopy (FE-SEM-EDS, ZEISS Sigma 300, Carl Zeiss AG, Oberkochen, Germany). The accelerating voltage was set to 15 kV, working distance was 8–10 mm, secondary electron mode was adopted for surface morphology observation, and backscattered electron mode was used for cross-sectional interface analysis; EDS elemental mapping was acquired with a dwell time of 500 μs per point.
Non-destructive quantitative residual stress testing of the thermally grown oxide (TGO) layer was carried out using a confocal micro-Raman spectrometer (Renishaw inVia, Wotton-under-Edge, UK). A 532 nm green solid-state laser was selected as the excitation light source with a 50× long-working-distance objective lens, and exposure time of 10 s per acquisition.
For mass loss measurement of eroded specimens, an electronic analytical balance (Mettler Toledo ME204E, Zurich, Switzerland) with a measurement precision of 0.1 mg was adopted.
All erosion experiments were repeated three times under identical conditions. The erosion rate, remaining coating thickness, and TGO residual stress reported in this study are presented as the mean ± standard deviation (SD) of three independent specimens. The error bars shown in the corresponding figures represent one standard deviation.

3. Results

3.1. Macro Surface Morphology of Coatings

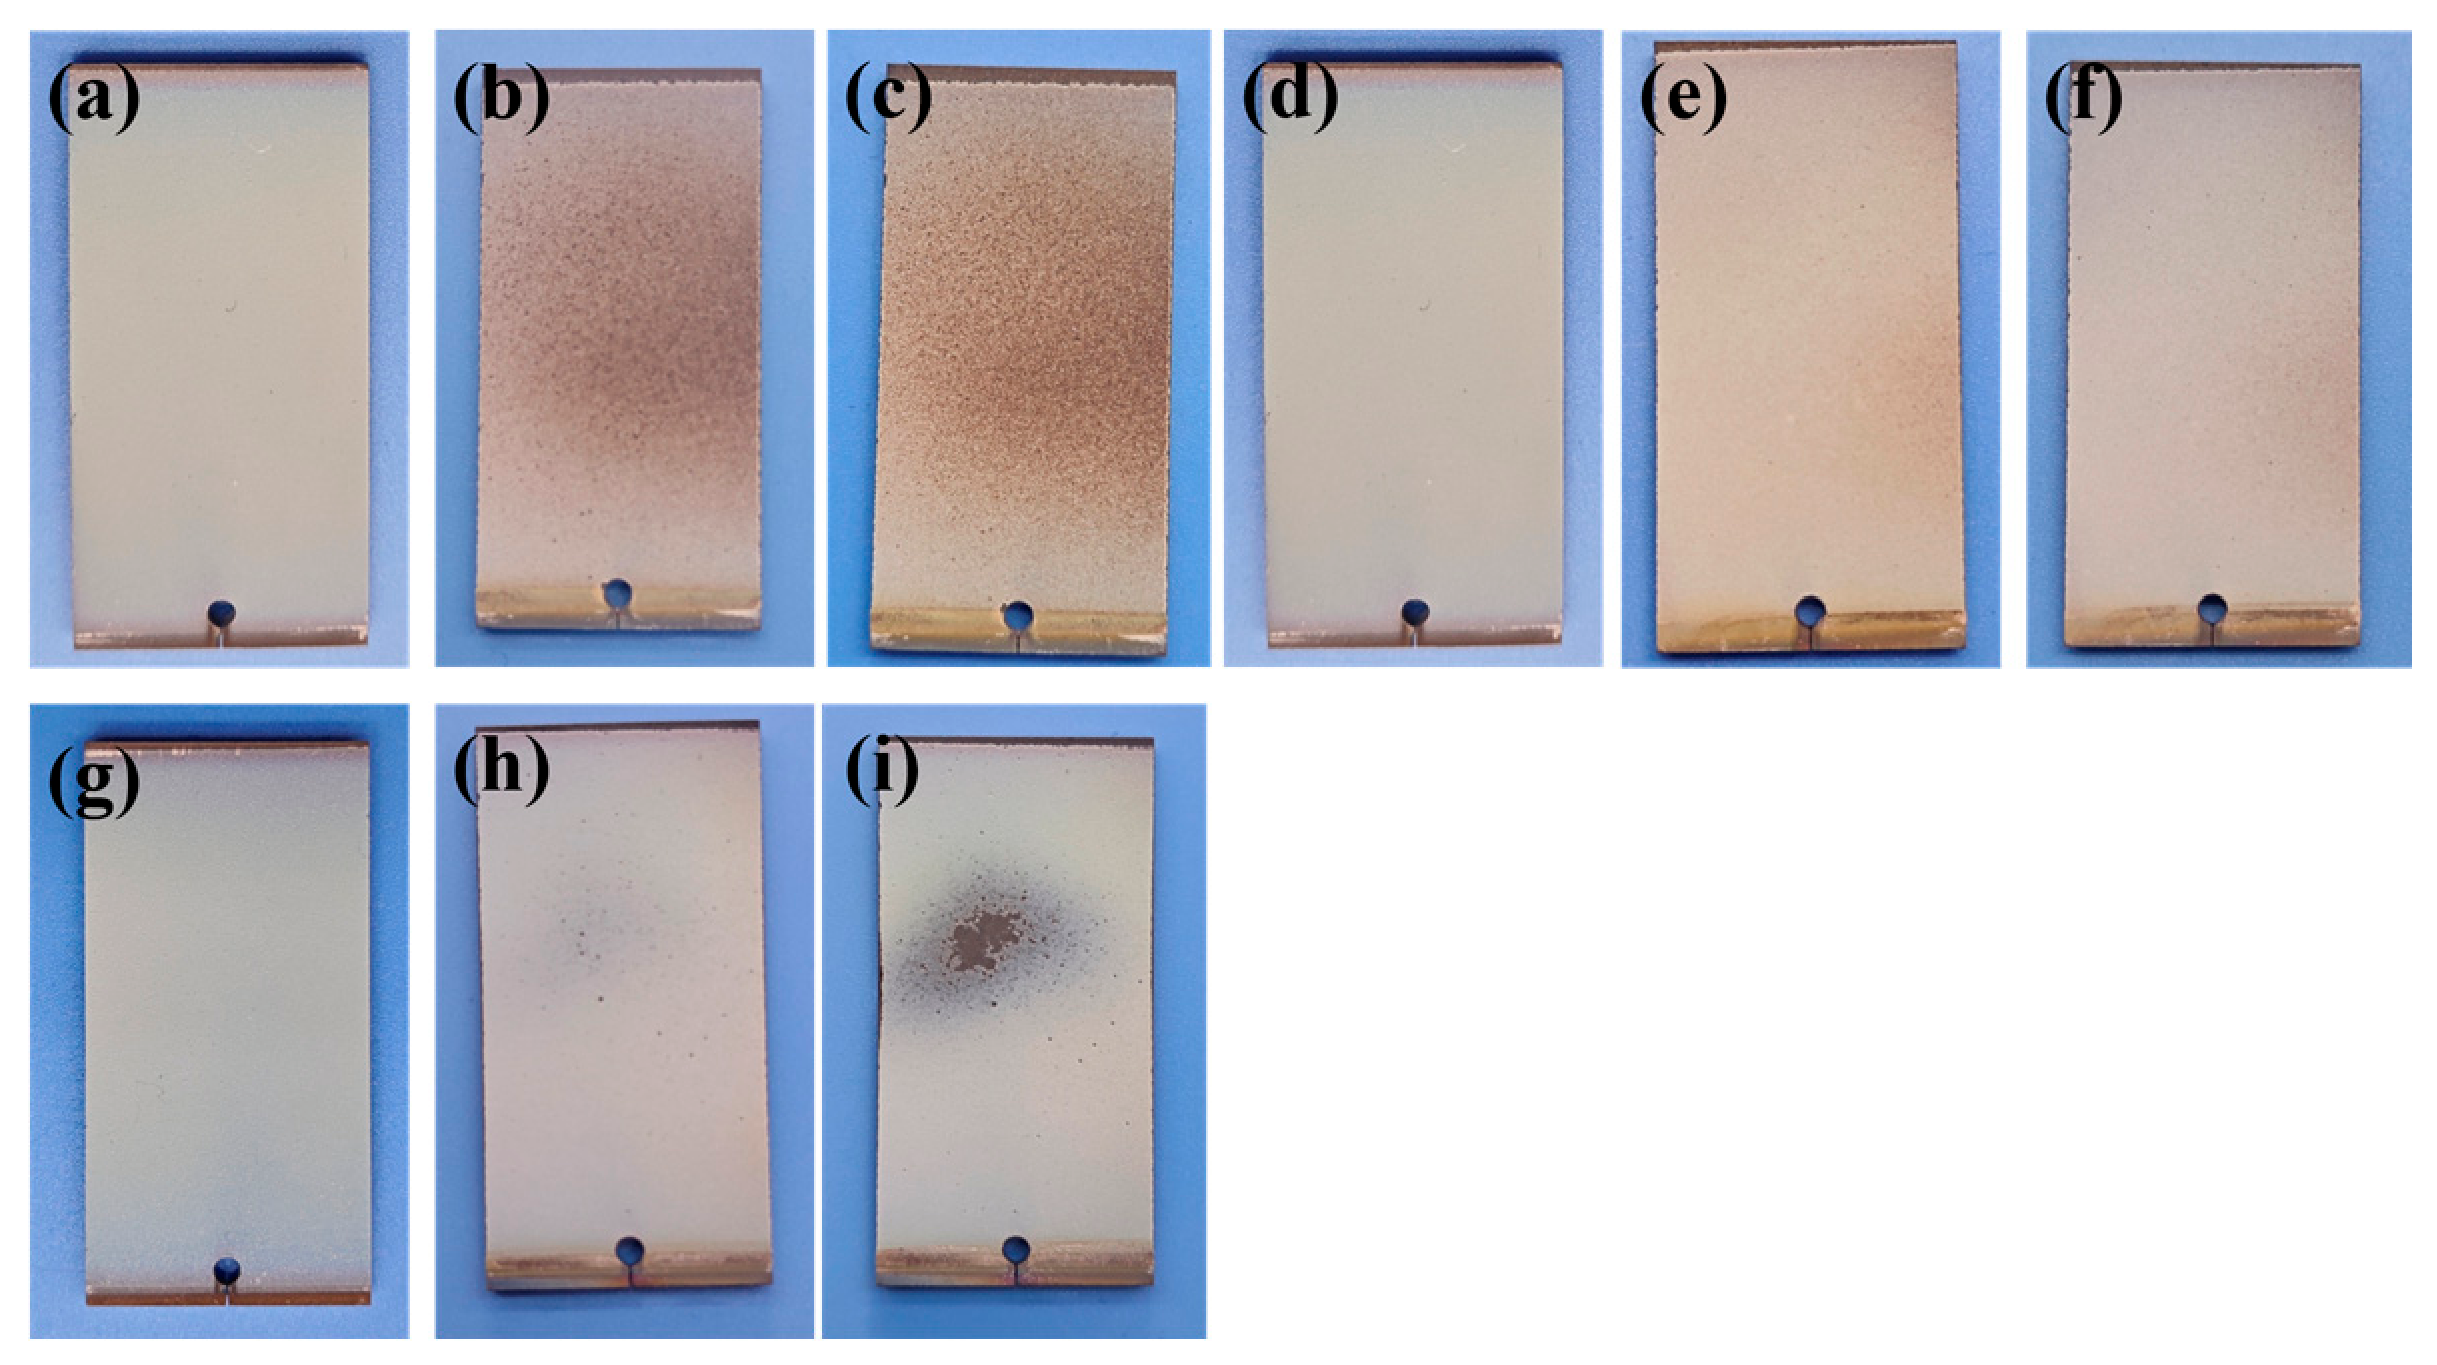
Figure 2 shows the macroscopic evolution of the coating surface during the erosion process with three different particle sizes (175 μm, 120 μm, and 65 μm) under operating conditions of 1150 °C and 0.4 Mach (nominal gas flow). For each particle size, the photographs were taken from the same specimen after successive erosion durations, allowing the damage evolution to be directly observed. As shown in the figure, the surfaces of as-deposited specimens (a), (d), and (g) all exhibit a uniform bluish-white color with consistent luster, and no obvious defects or color variations are observed. This indicates that the initial quality of the YSZ coatings prepared by EB-PVD was good.
As the erosion duration increased, the coating surfaces exhibited distinctly different damage evolution characteristics across the three particle sizes. As shown in Figure 2b,c, after 2 h of erosion by 175 μm particles, the coating surface changed from a blue-white appearance to large areas of light reddish-brown, and the surface roughness increased. However, no locally visible pits or spalling were observed. This indicates that under the impact of large particles, large-area wear occurred on the coating surface. After 3 h of erosion, no local pits or macroscopic spalling were observed on the coating surface, and the macroscopic morphology remained intact. This indicates that at the macroscopic scale, the erosion of the thermal barrier coating under 175 μm particle impact primarily presented as extensive surface damage. The energy from a single large particle impact was dispersed over a larger area, resulting in a macroscopically diffuse and widely distributed damage pattern. As shown in Figure 2e,f, the morphological evolution of erosion caused by 120 μm particles is similar to that of 175 μm particles, with the surface gradually changing from blue-white to light reddish-brown. Similarly, no locally visible pits or spalling were observed on the coating surface, and the macroscopic morphology remained intact. As shown in Figure 2h,i, the evolution of the coating surface morphology under 65 μm particle erosion differed significantly from the previous two groups. After 2 h of erosion, the coating surface remained blue-white, but localized areas of grey-black spalled spots were already observable on the specimen surface. After 3 h of erosion, an oval-shaped black damaged area formed on the coating surface, surrounded by a gray transition zone. The diameter of the damaged area on the coating surface was approximately 1.5 mm. This indicates that the top coating had peeled off, exposing the black underlying TGO or bond coating, resulting in coating failure. This may be due to the fact that, under high-speed, dense impacts, the energy of small particles is more concentrated on the weak areas of the thermal barrier coating, causing the tips of the YSZ columnar crystals to fracture and peel off, exposing the underlying TGO or bond coating, which macroscopically appears as “small-area but deep” localized damage.
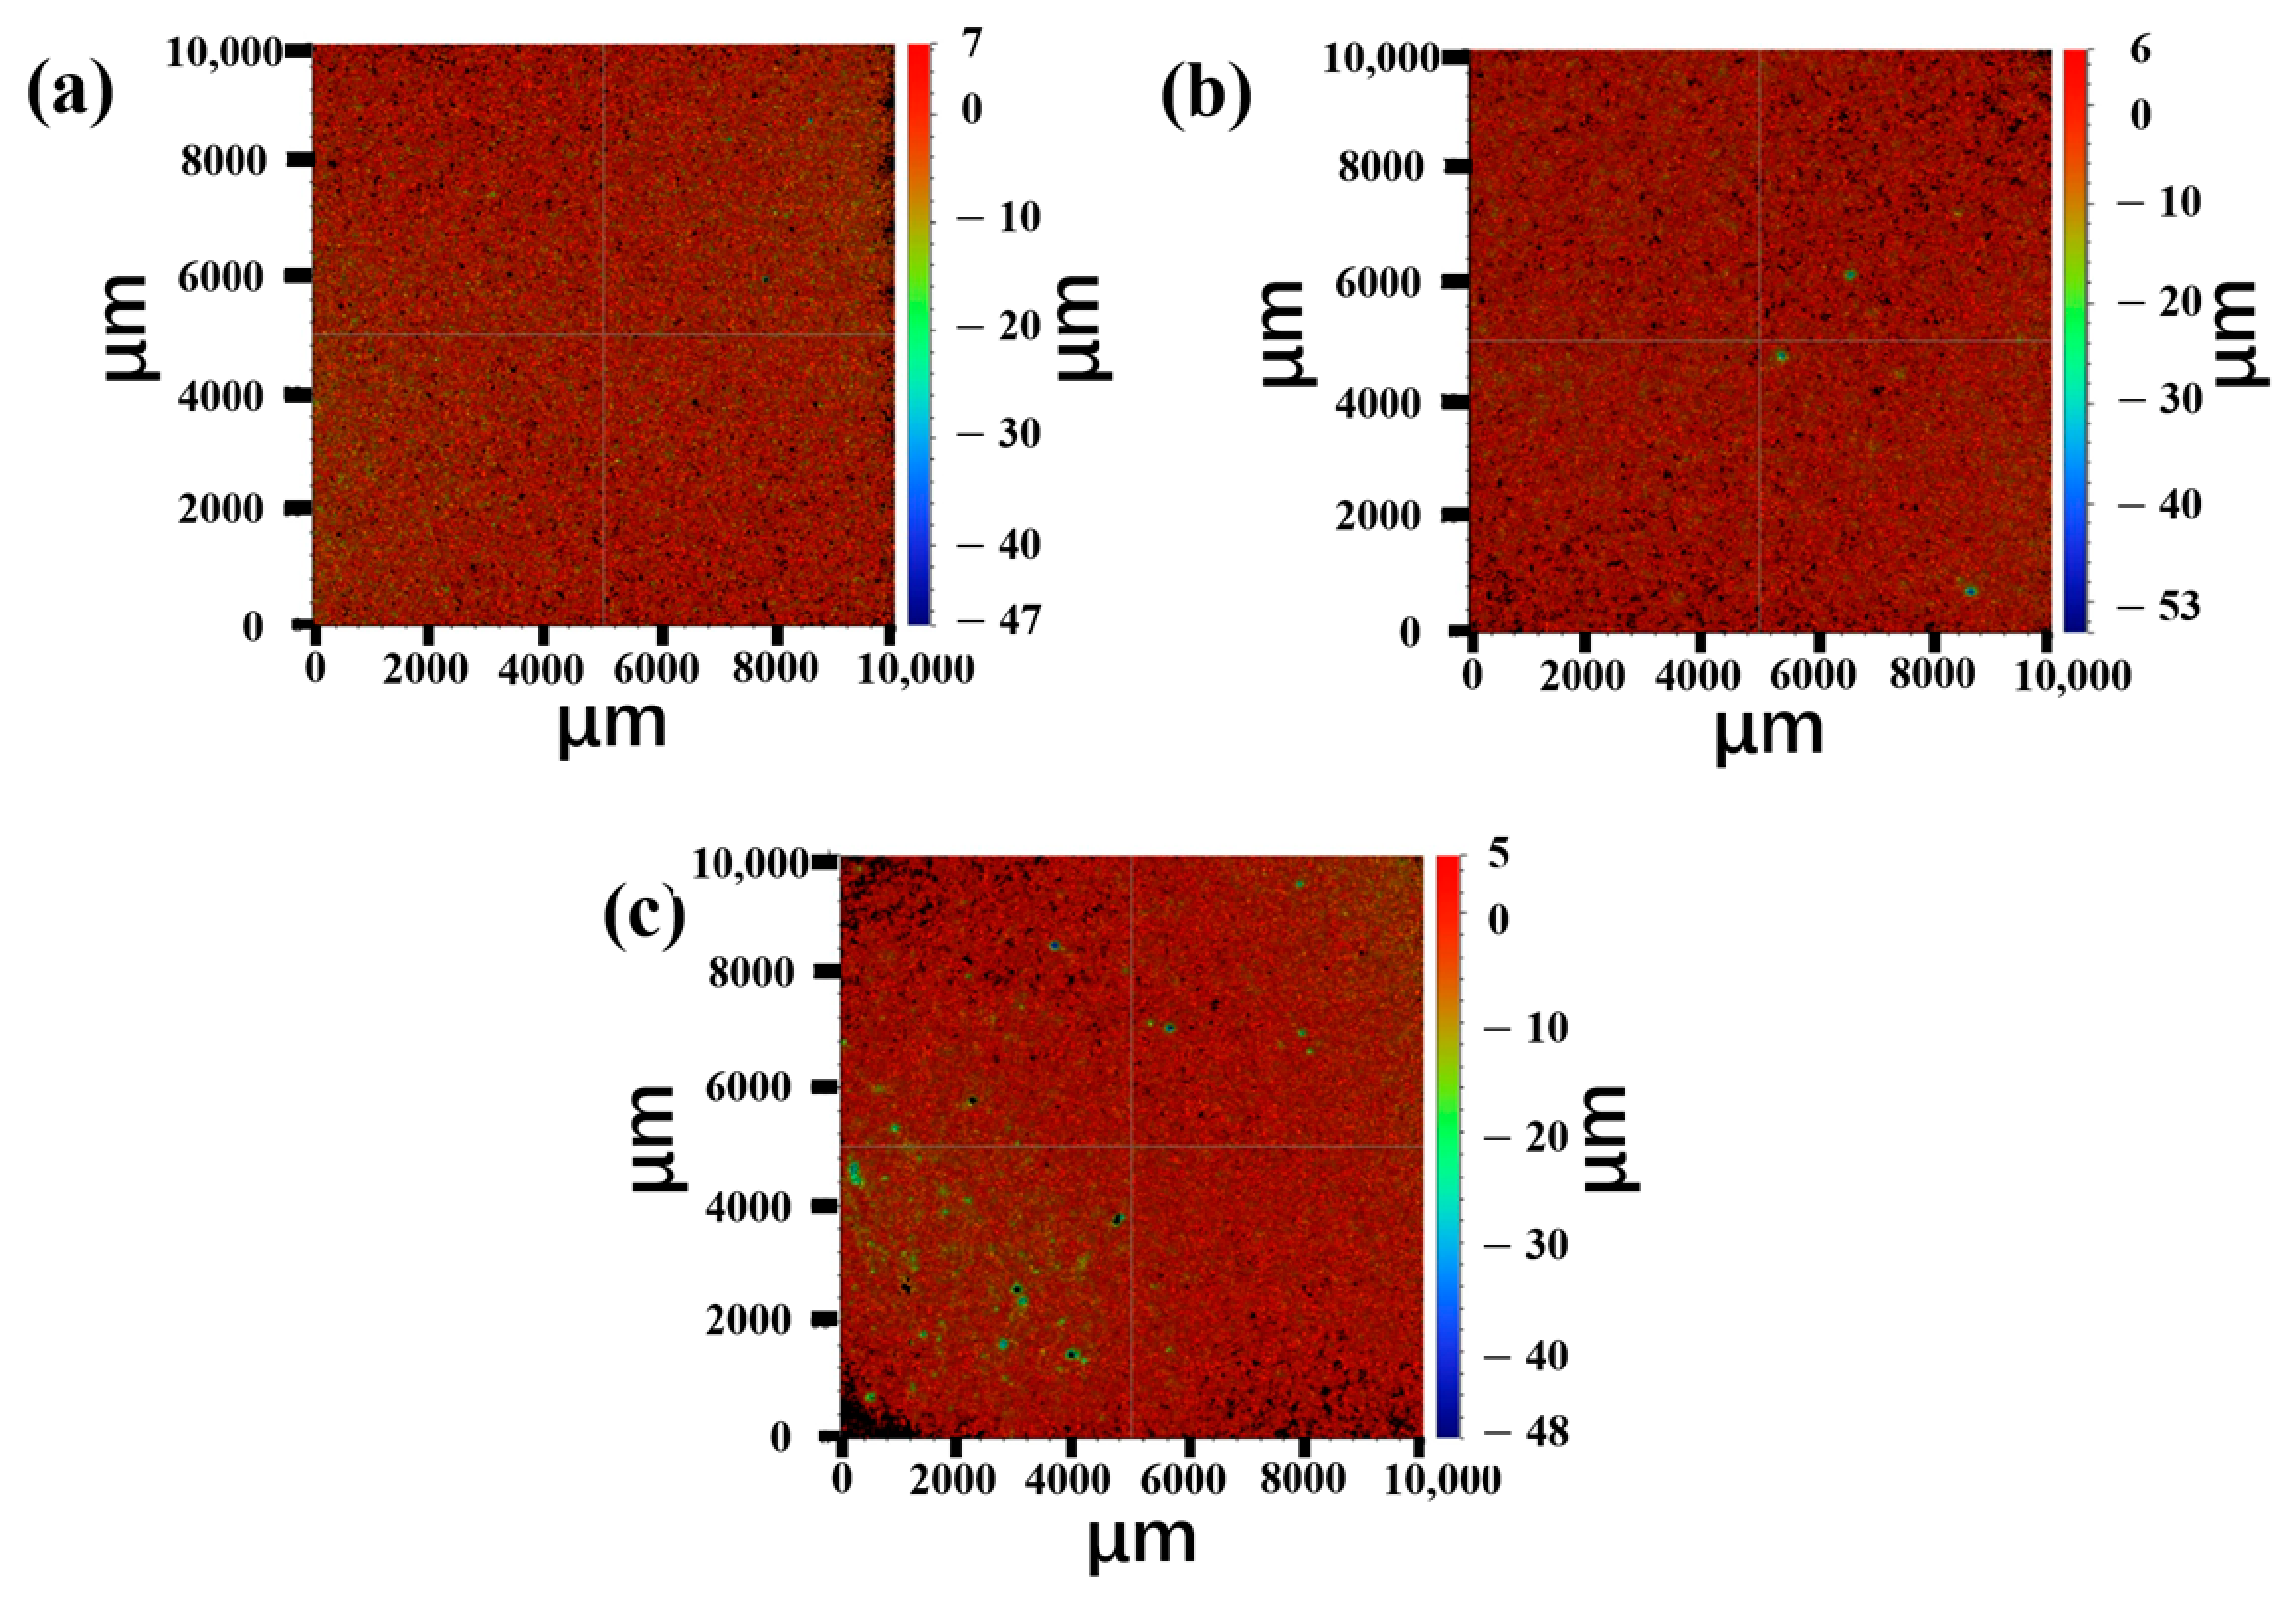
The surface topography of the eroded YSZ thermal barrier coating was characterized using white-light interferometric microscopy, as shown in Figure 3. The extent of surface damage to the YSZ coating varied depending on the particle size used in the erosion process. The sample surface sustained severe damage when exposed to 65 μm particles. Samples subjected to erosion by 120 μm and 175 μm particles exhibited extensive, uniformly distributed damage.
Differences in macroscopic morphology may be attributed to the coupling effect between particle kinetic energy and the effective contact area. Under conditions of equal mass flow, larger particles possess higher individual energy but occur in smaller numbers; however, each impact covers a larger area, leading to macroscopically uniform damage. Smaller particles, on the other hand, have a higher number density and occur more frequently. Impact points are more likely to overlap in weak areas of the coating, inducing cumulative damage at the tips of columnar crystals.

3.2. Microscopic Surface Topography of the Coating

3.2.1. As-Deposited Surface Microstructure

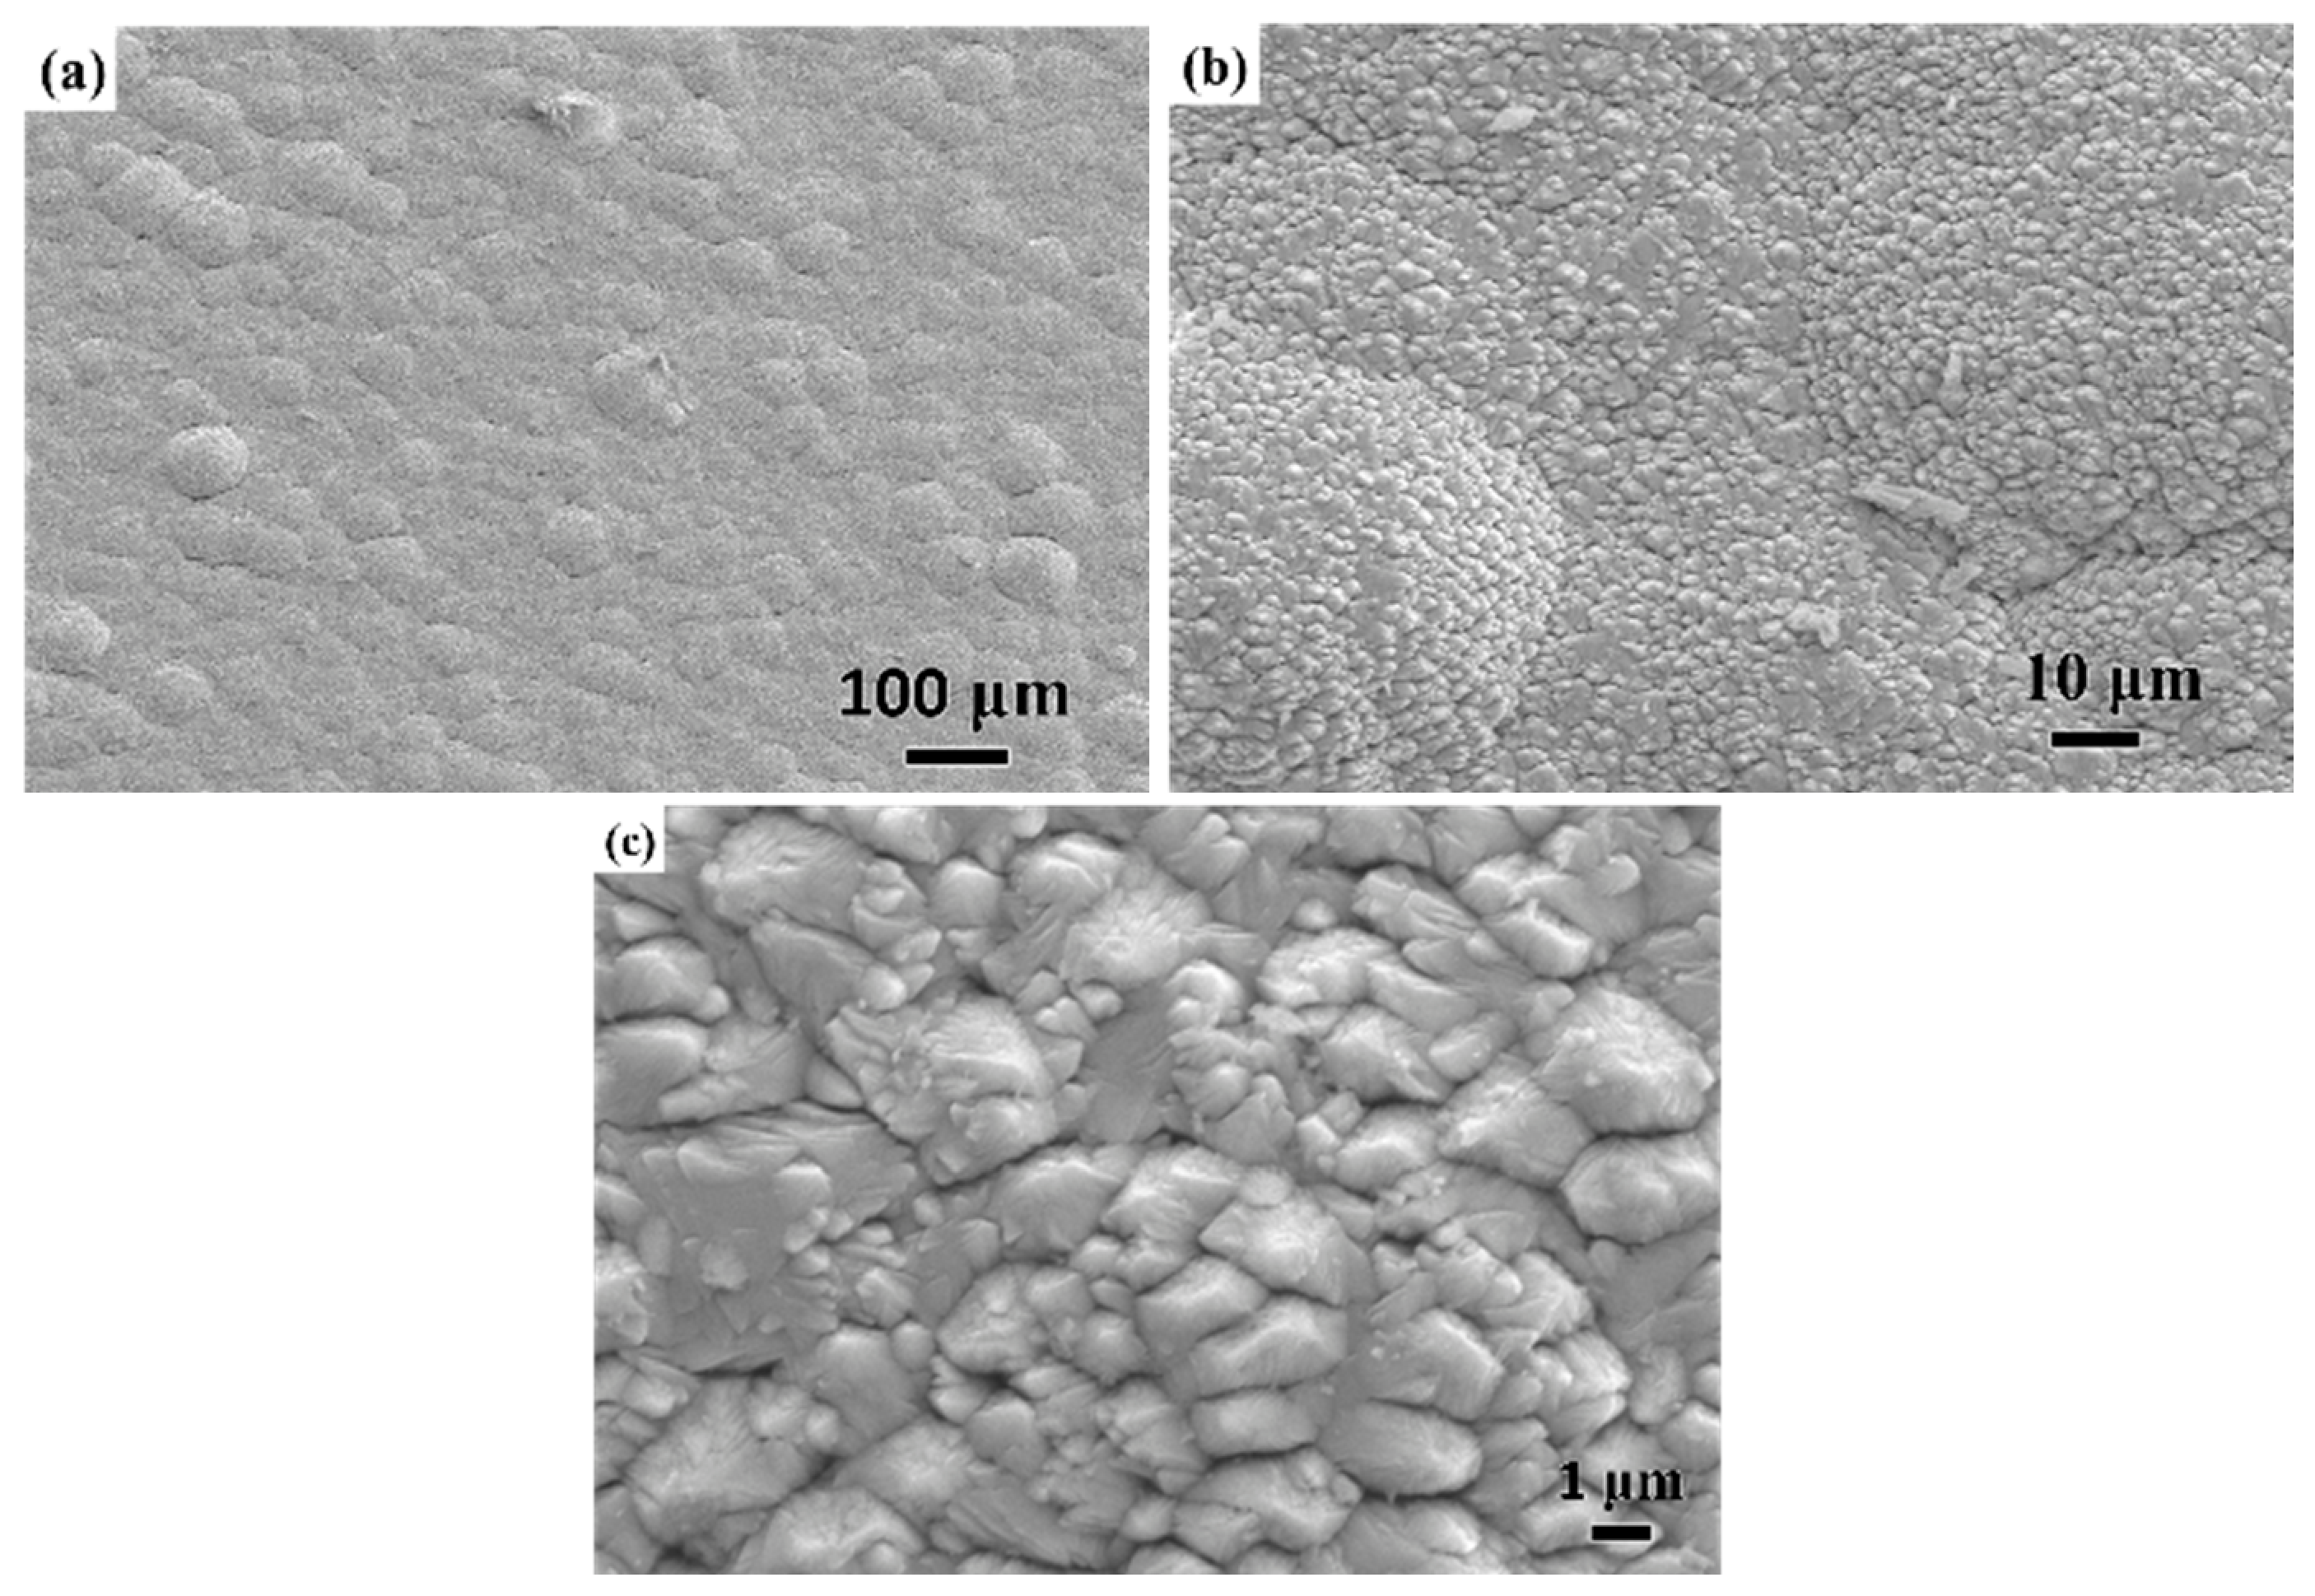
Figure 4a–c show the surface morphology of the deposited YSZ thermal barrier coating. It can be observed that the coating surface exhibits a distinct “cauliflower-like” structure, with the tops of the columnar crystals appearing pyramid-shaped. This is the typical morphology of TBCs prepared by the EB-PVD process. Studies [21,22] have shown that during the EB-PVD deposition process, atomic migration and deposition tend to grow along a certain angle rather than completely perpendicular to the substrate surface. This preferential growth pattern with divergent characteristics leads to the formation of a loose cauliflower-like structure in the coating. Due to the presence of pores within this structure and its relatively loose arrangement, the coating exhibits low overall bond strength and poor structural stability [23]. Under the continuous impact of high-speed gas flows and solid particles, these weak regions at the tops of the columnar crystals are prone to fracture and delamination, leading to the formation of localized pits on the coating surface.

3.2.2. Micro-Surface Morphology During Erosion

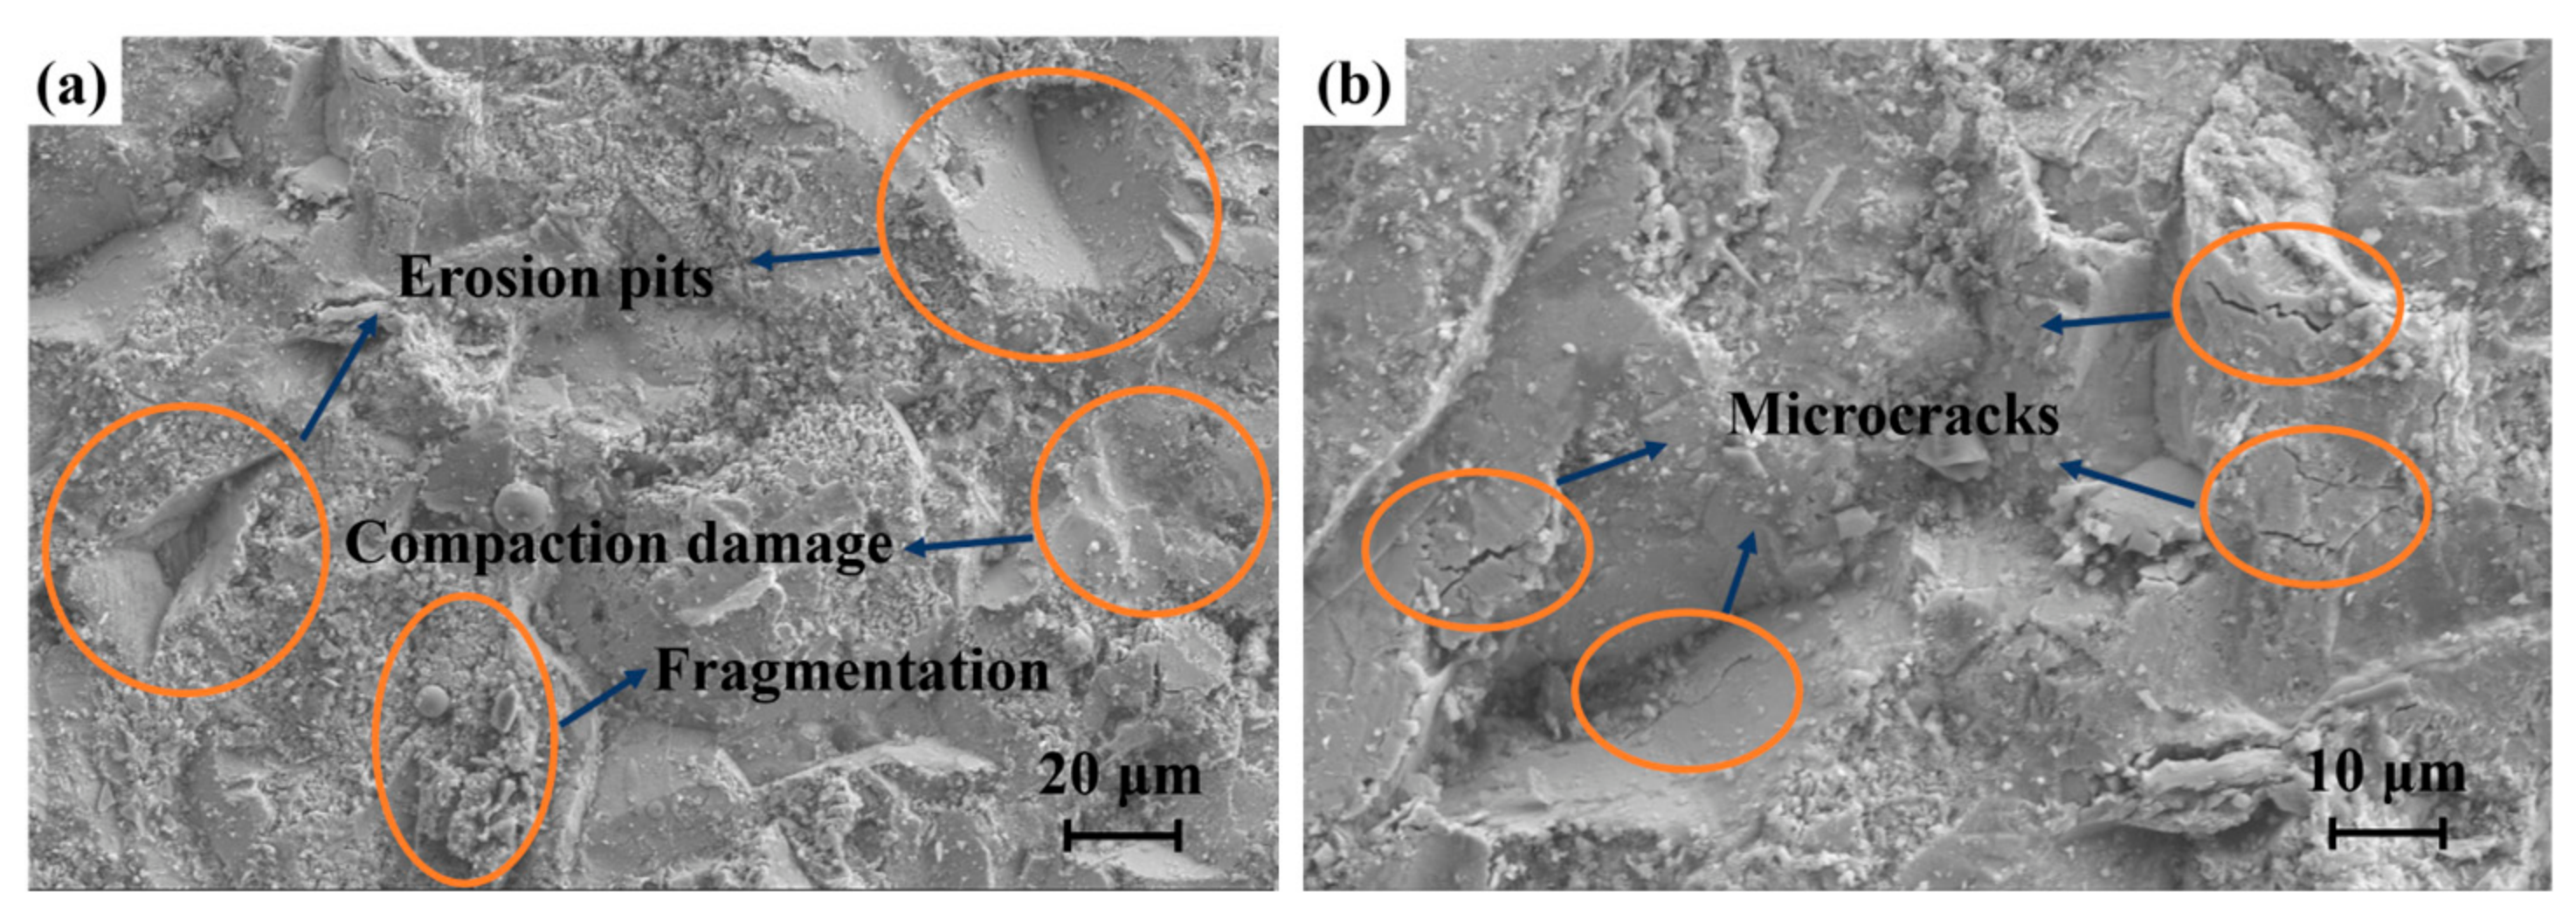
Surface SEM observations and EDS elemental mapping analyses were performed on specimens eroded for 2 h and 3 h using three different particle sizes (175 μm, 120 μm, and 65 μm). Figure 5 shows the surface morphology of TBCs after 2 h of erosion with 175 μm particles at 1150 °C and Mach 0.4 (nominal gas flow). It can be observed that the pyramidal morphology at the tips of the columnar crystals on the ceramic-layer surface has completely disappeared. As shown in Figure 5a, various typical damage features are present on the coating surface. These primarily include: (1) erosion pits: most pits are wedge-shaped; (2) compaction damage: the originally loose columnar crystal structure of the coating surface has been compacted by repeated impacts, with numerous fragments distributed on it; (3) coating fragmentation: numerous block-like fragments are present on the coating surface, stacked and interlaced with one another, indicating that the material has peeled off from the surface layer via brittle fracture. Figure 5b shows the SEM morphology of the coating surface at a higher magnification. It can be observed that the coating surface contains numerous microcracks. Quantitative statistics based on three random visual fields indicates that the averaged crack density reached 58,620 ± 3040 cracks/mm2, and the average crack length was 4.36 ± 0.39 μm. These cracks typically originate at the coating’s inherent microdefects. During particle impact, stress concentrations occur at these locations. When the accumulated stress exceeds the fracture strength of the YSZ material, it induces brittle fracture, forming microcracks. Under continuous particle impact, the microcracks gradually propagate along the columnar grain boundaries, inducing localized brittle fracture and material detachment at the tops of the “cauliflower-like” crystal columns, ultimately forming erosion pits on the coating surface [24].
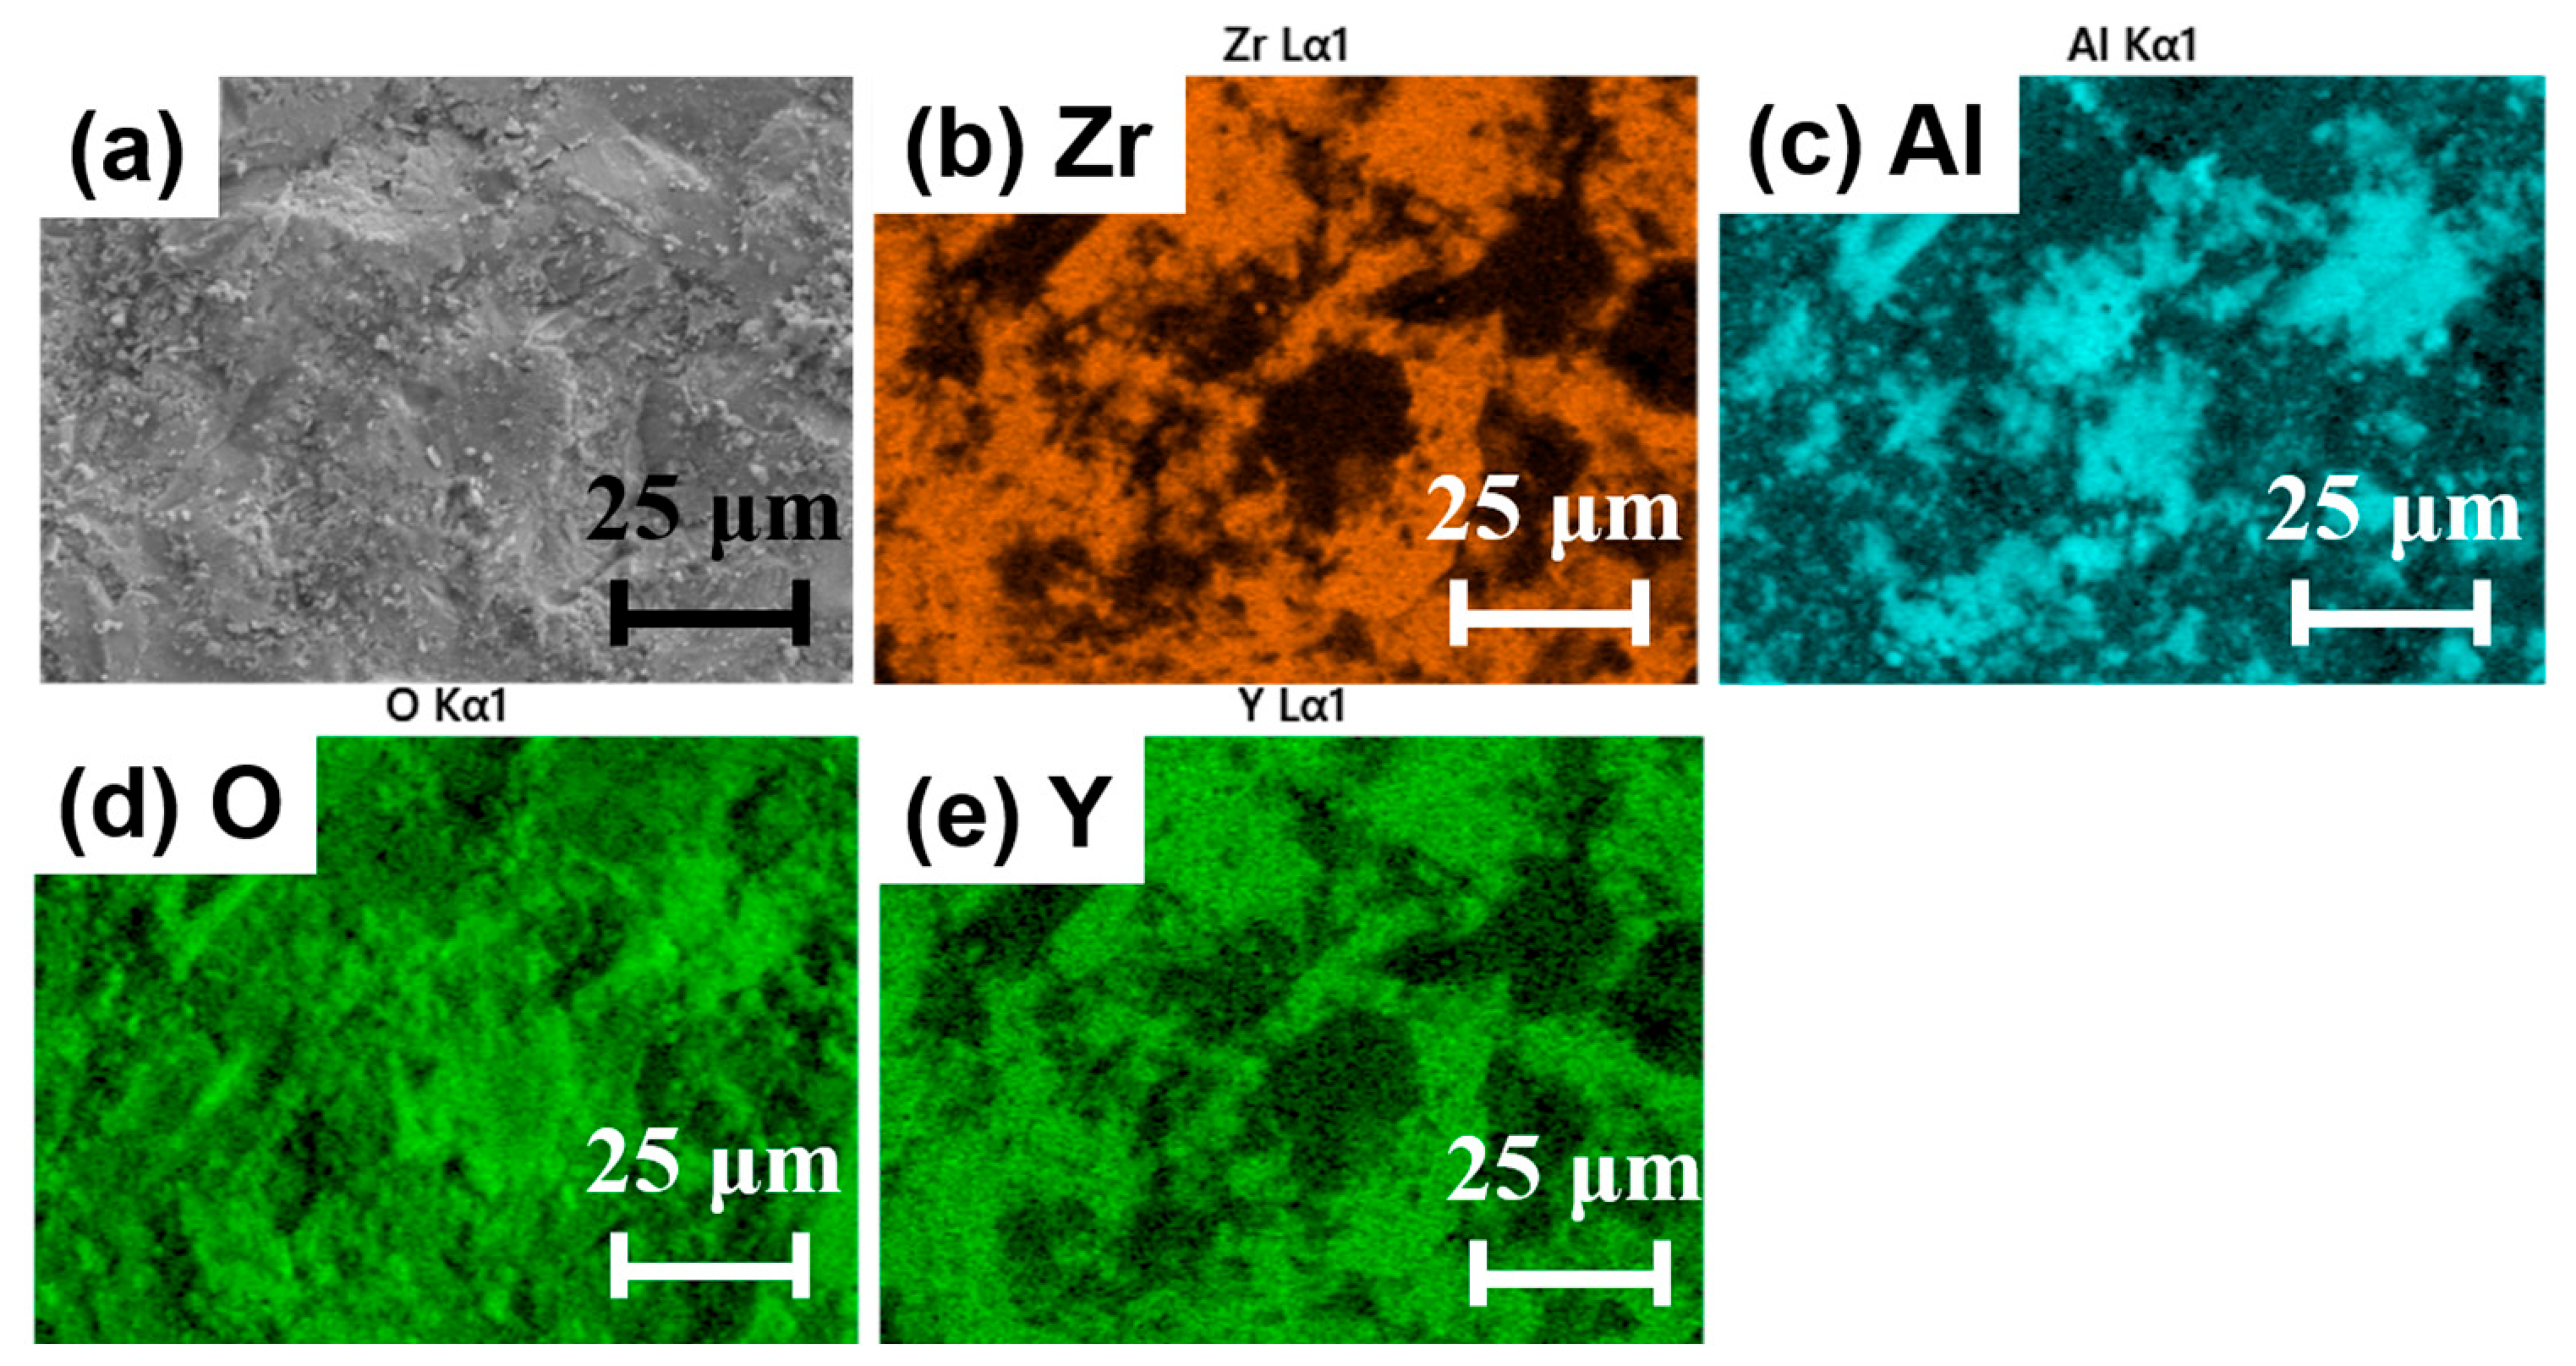
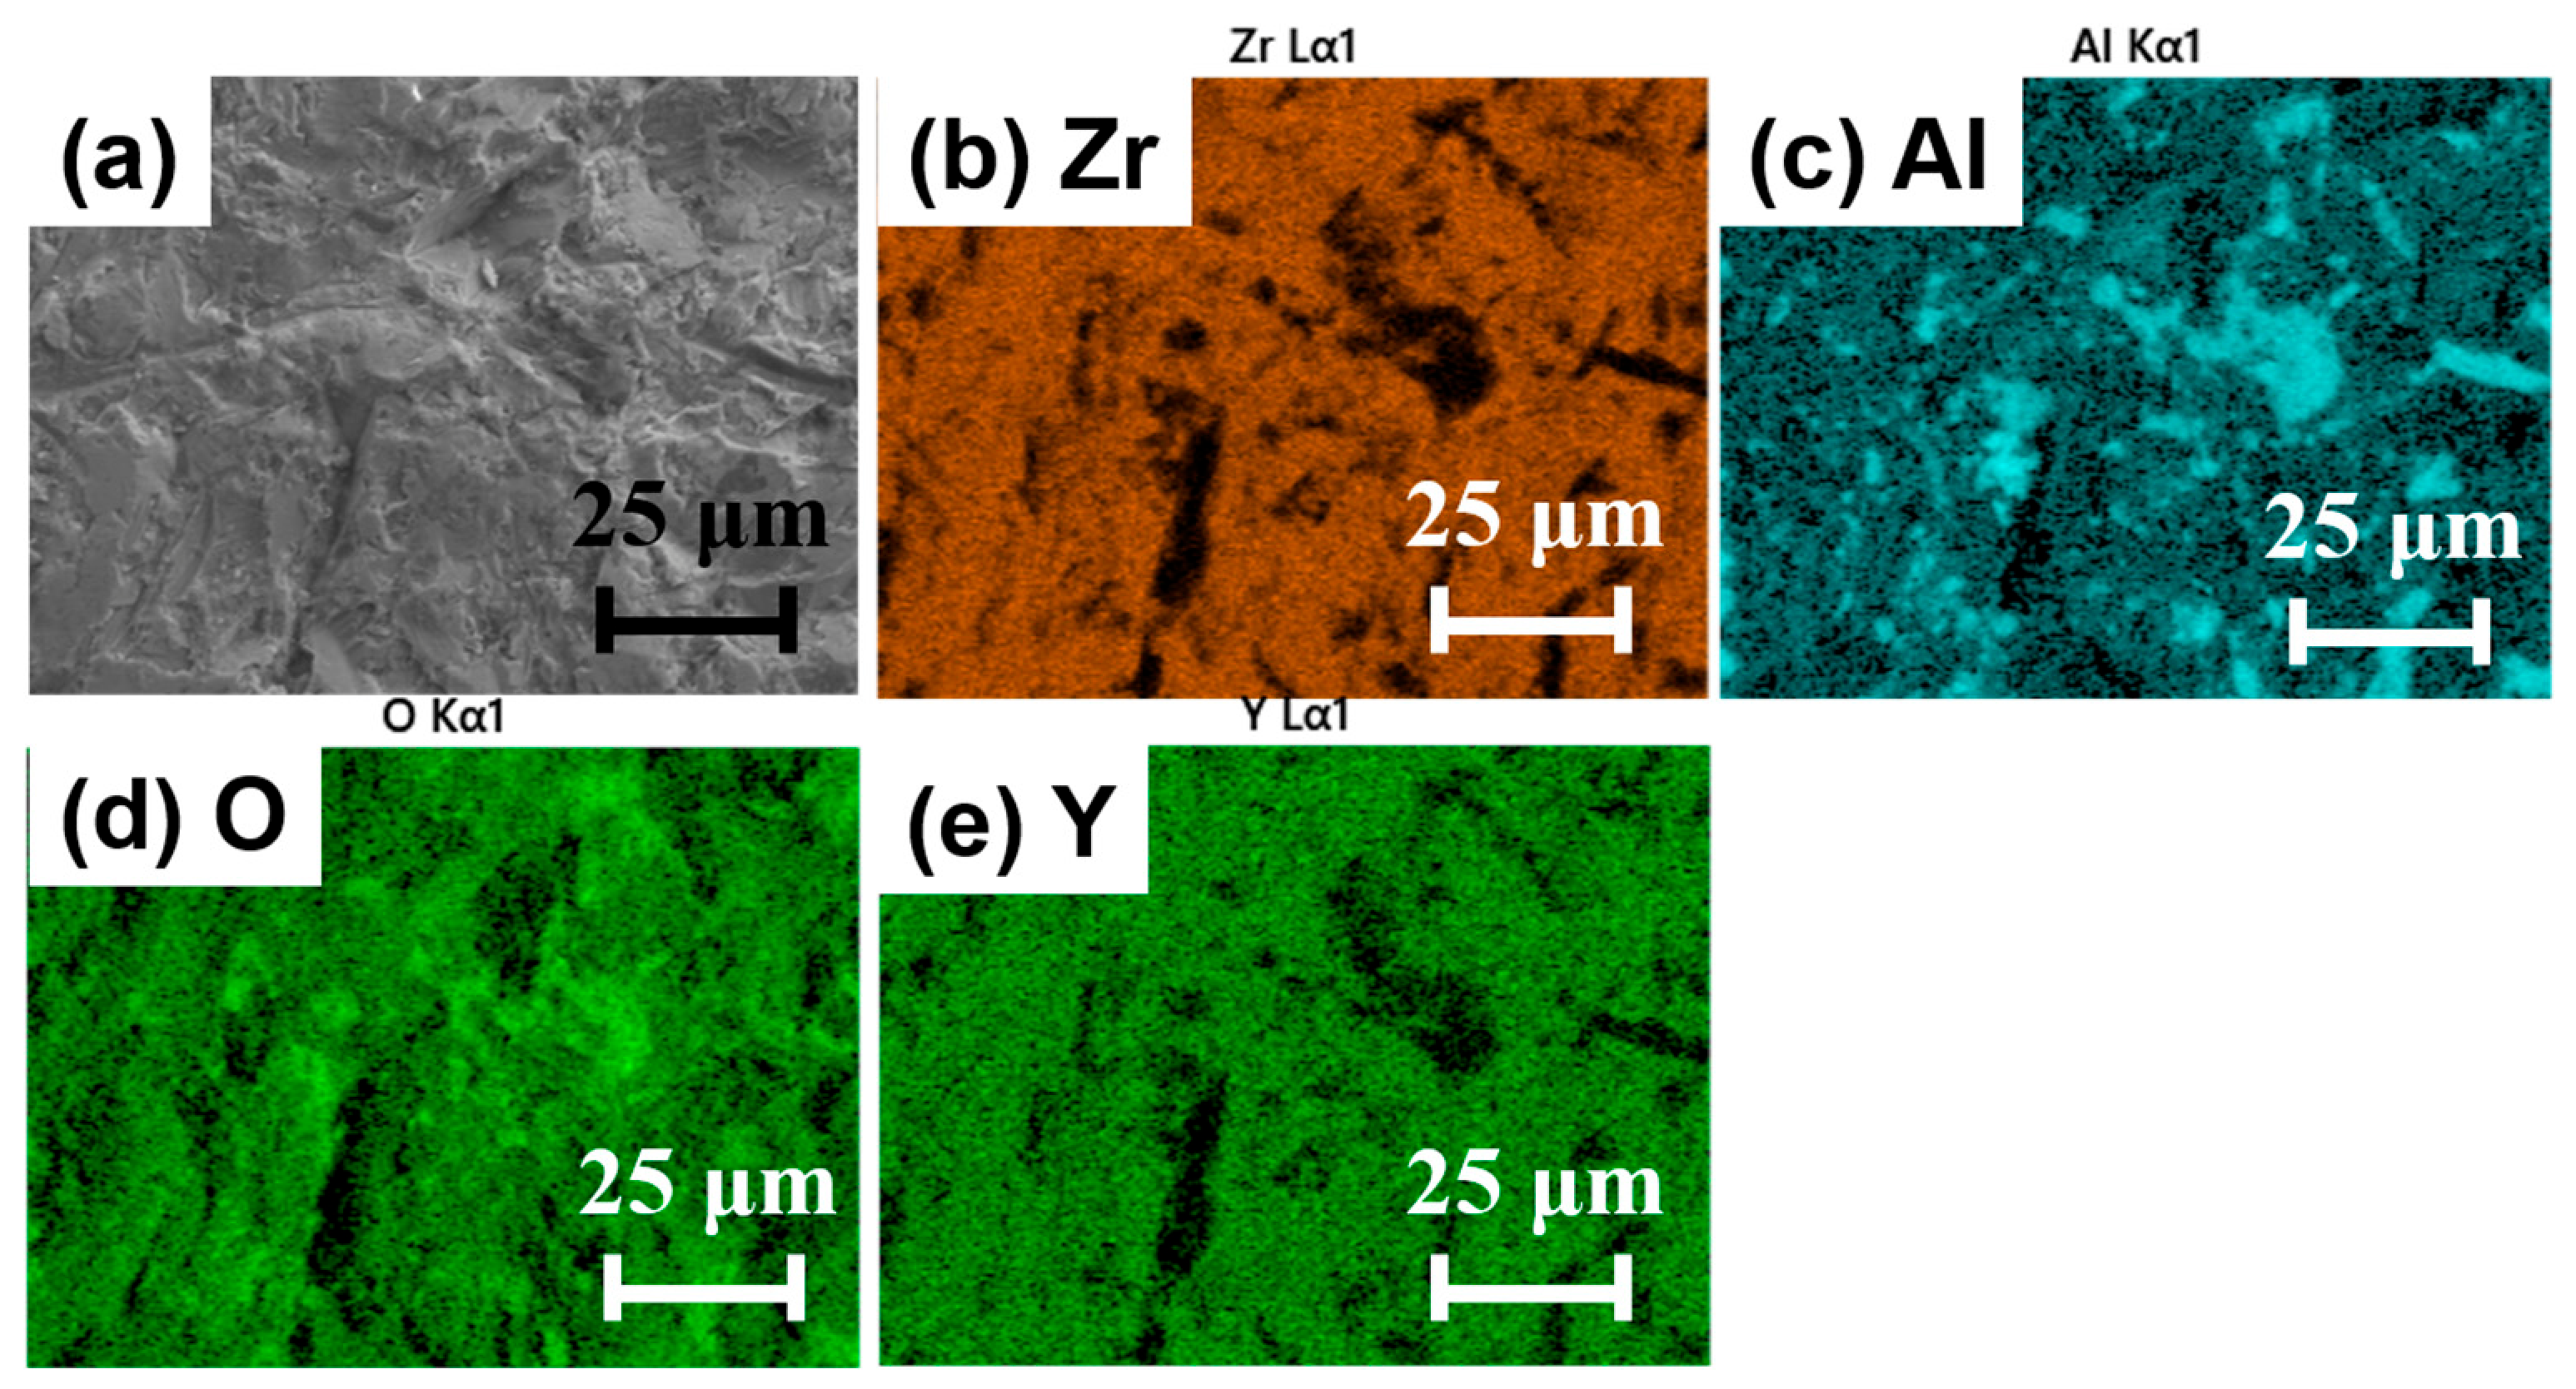
Figure 6 shows the EDS elemental distribution on the coating surface after 2 h of erosion at a particle size of 175 μm. It can be seen that the detected elements include Zr, Y, O, and Al. Among these, Zr, Y, and O are characteristic elements of the YSZ coating. The regions of signal absence in the elemental distribution maps of Zr and Y correspond to the locations of pits and fractured areas observed in the SEM morphology. The Al elemental distribution map shows distinct localized enrichment. The two patterns are complementary. The Al present in the Al-enriched regions likely originates from Al2O3 particles embedded and retained within the pits of the coating.
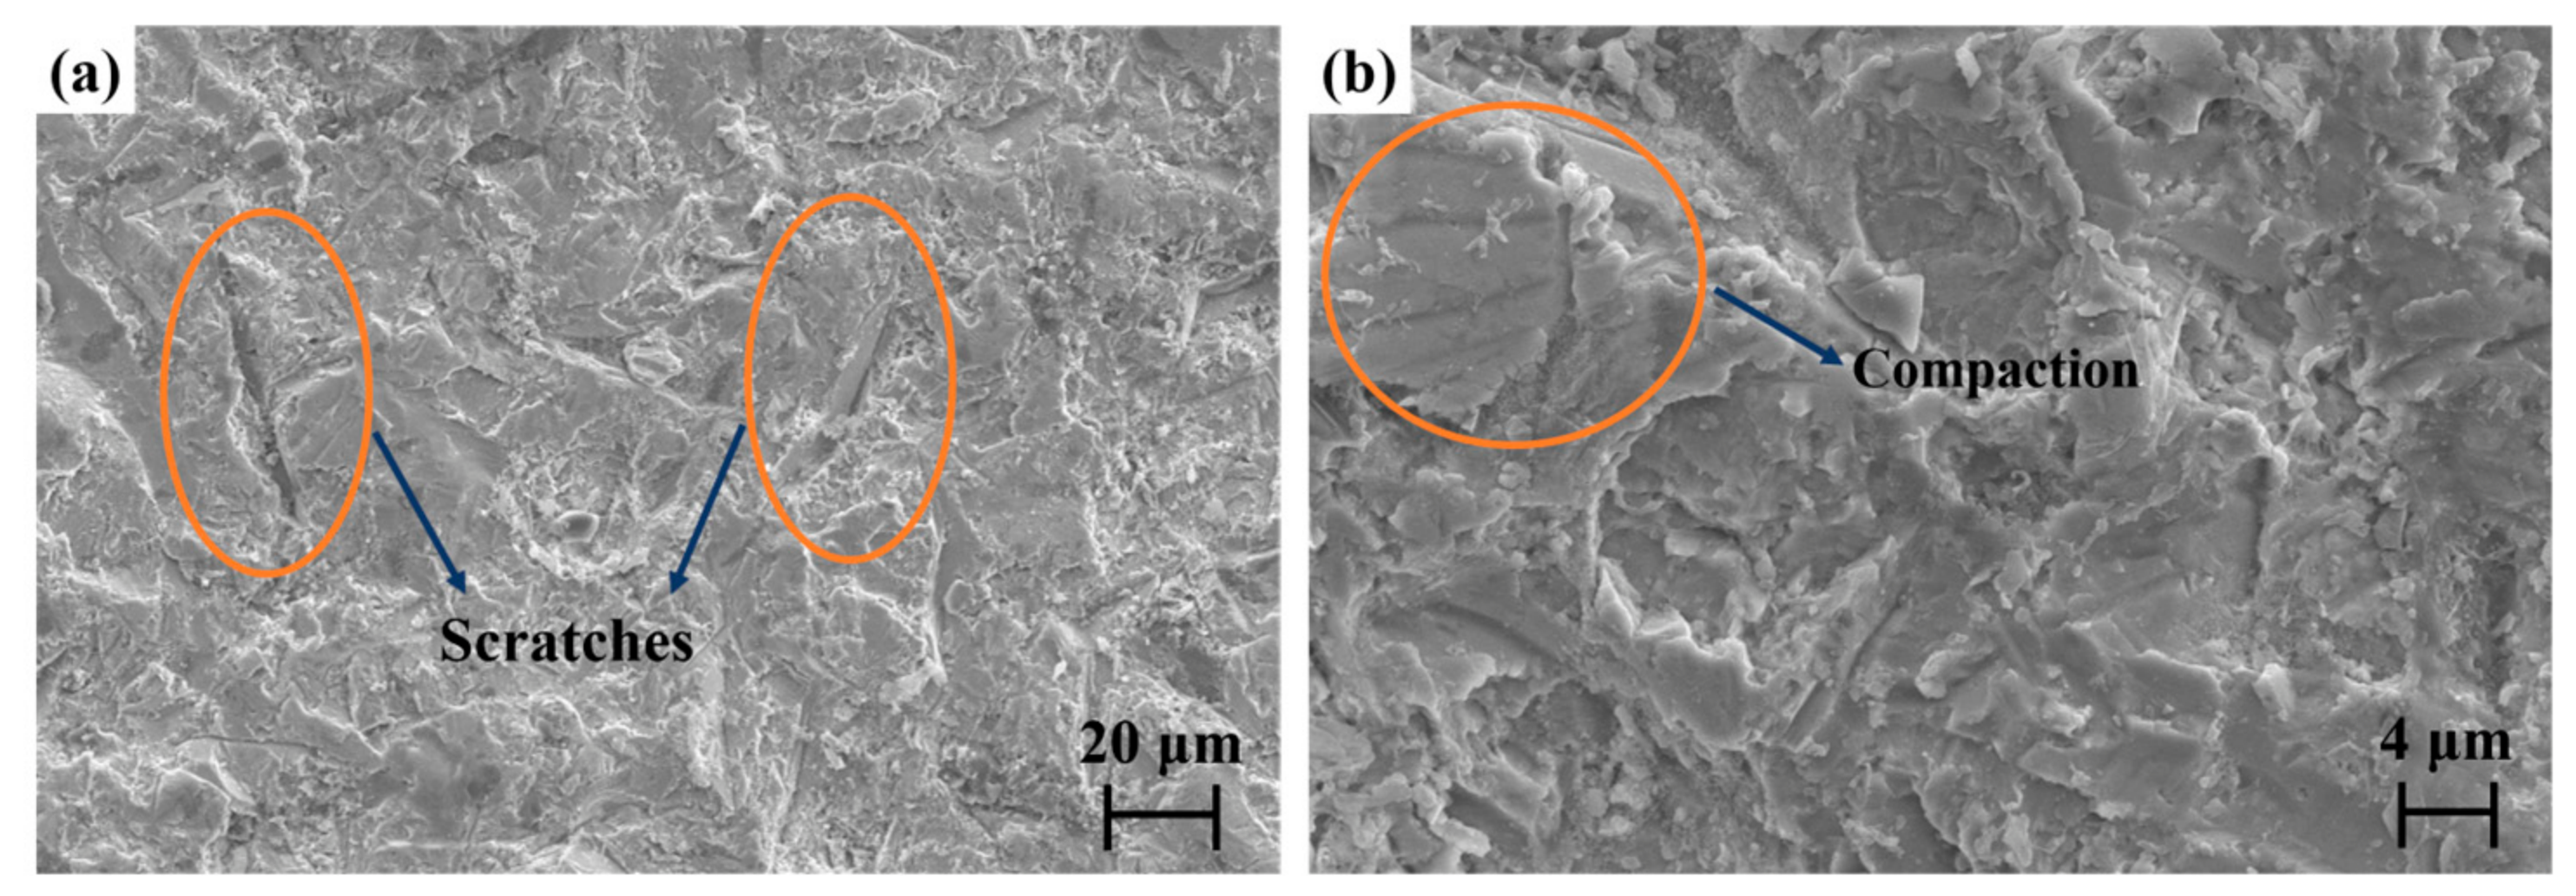
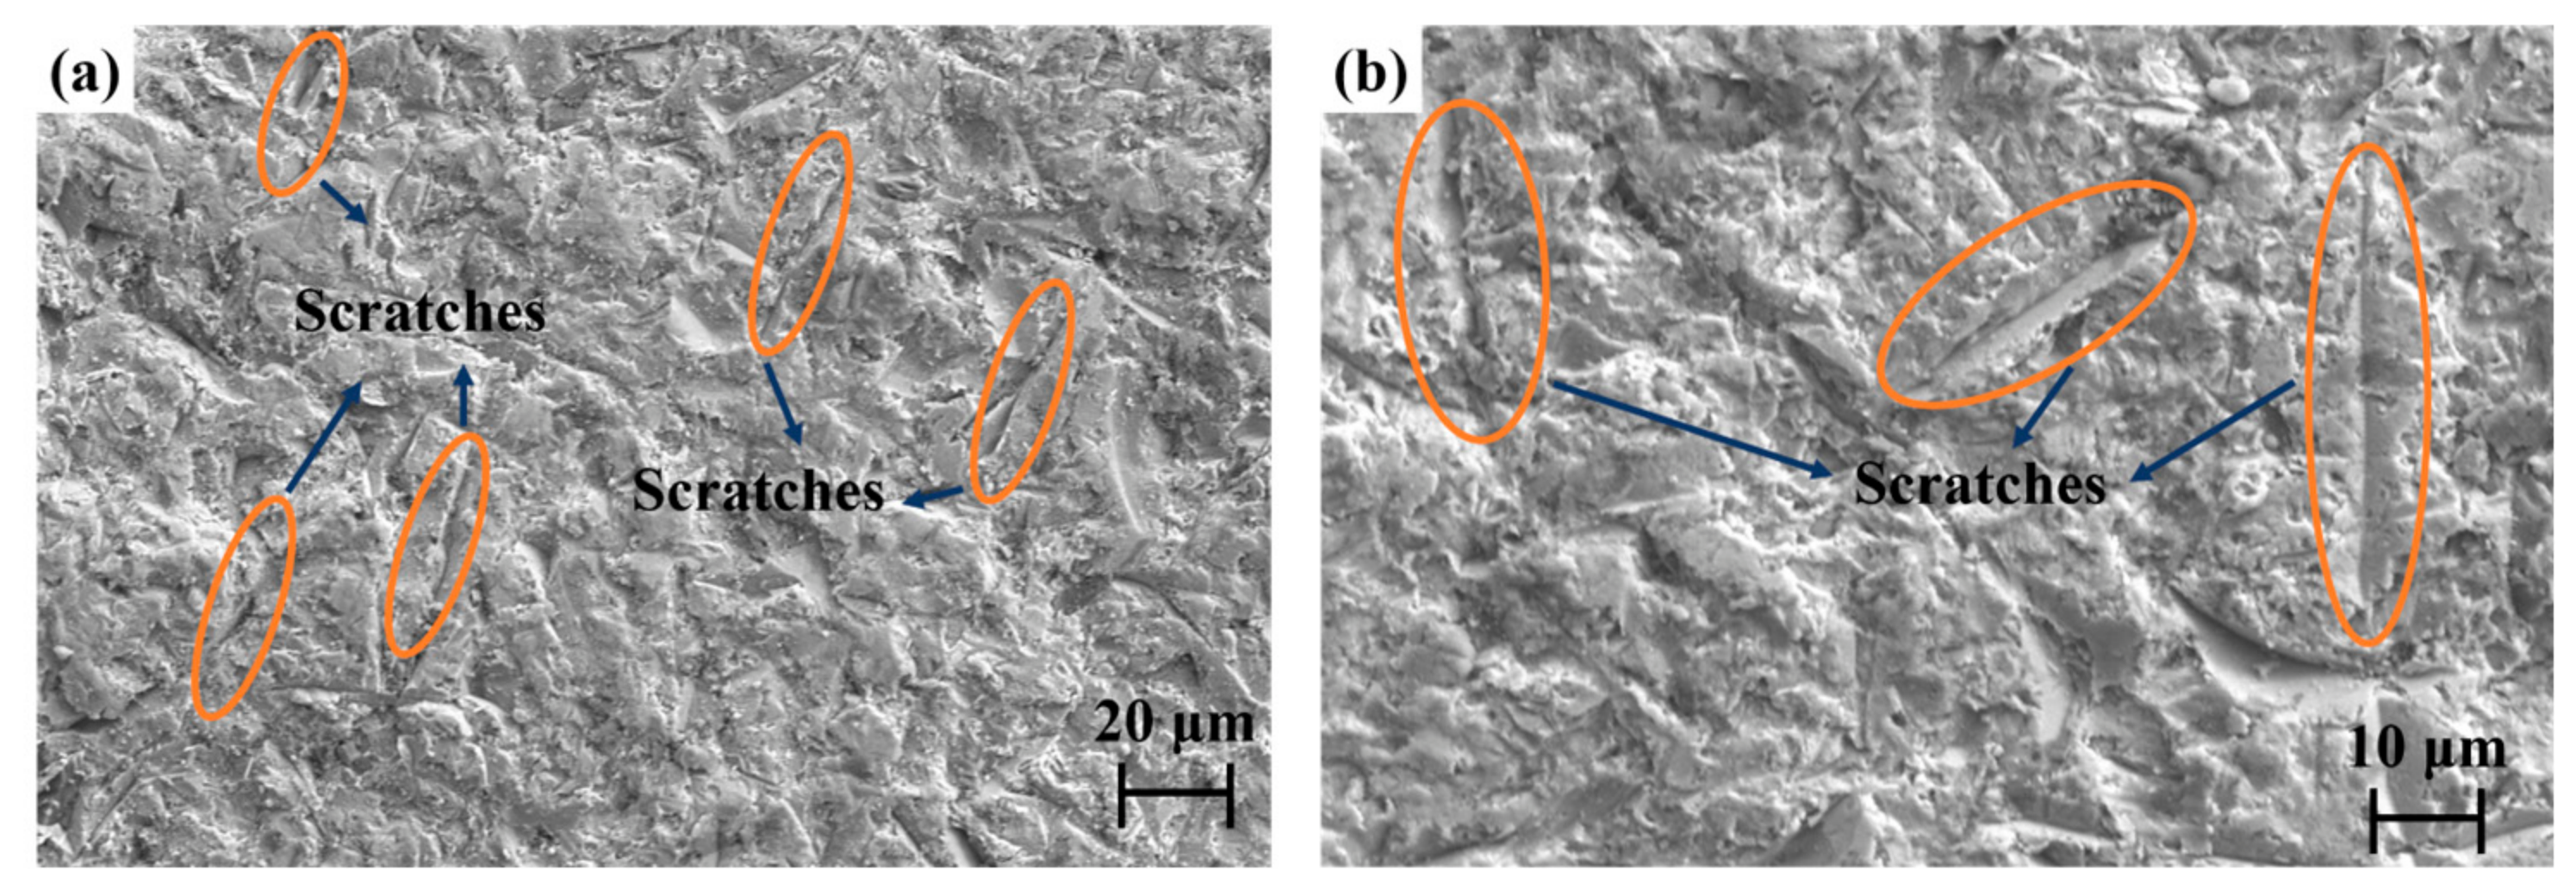
Figure 7 shows the SEM morphology after 2 h of erosion with 120 μm particles. Surface damage to the coating includes scratches, compaction damage, and shallow pits. Compared to the surface morphology resulting from erosion with 175 μm particles (Figure 5), the morphology in this group exhibits distinct characteristics. It can be observed that the overall surface topography of the coating is relatively smooth. The tips of the prismatic grains have been flattened and compacted. Long, narrow scratches are distributed across the coating surface; these scratches are approximately 20–40 μm in length, oriented randomly, and contain accumulations of fractured material, exhibiting a typical plastic cutting morphology [15].
Figure 8 shows the EDS elemental distribution map after 2 h of erosion with 120 μm particles. The detected elements include Zr, Y, O, and Al. Among these, Zr, Y, and O are characteristic elements of the YSZ coating. Compared to the elemental distribution on the surface eroded by 175 μm particles (Figure 6), the distribution of Zr is relatively uniform, with only narrow dark bands aligned with the scratch orientation visible at the scratch locations. The Al signal exhibits a weak, diffuse distribution across the coating surface, with only minor localized aggregations; no significant, large localized bright spots of Al aggregation were observed under the 175 μm particle erosion conditions. The Al is likely derived primarily from Al2O3 particles. Compared to the 175 μm particle erosion, although a certain amount of Al2O3 particles remains on the coating surface, they are predominantly attached in a shallow, uniform layer.
Figure 9 shows the SEM morphology after 2 h of erosion with 65 μm particles. Extensive plastic deformation and compaction have occurred on the coating surface. The structures at the tips of the columnar crystals have been largely smoothed out. The overall surface exhibits a fine, densely textured pattern with gently undulating patterns. Compared to the SEM morphology after 2 h of erosion with 120 μm particles, the coating surface after 2 h of erosion with 65 μm particles exhibits a greater number of scratches that are more densely distributed. At the same time, the scratches are narrower and shallower. No significant accumulation of fractured material was observed within the scratches.
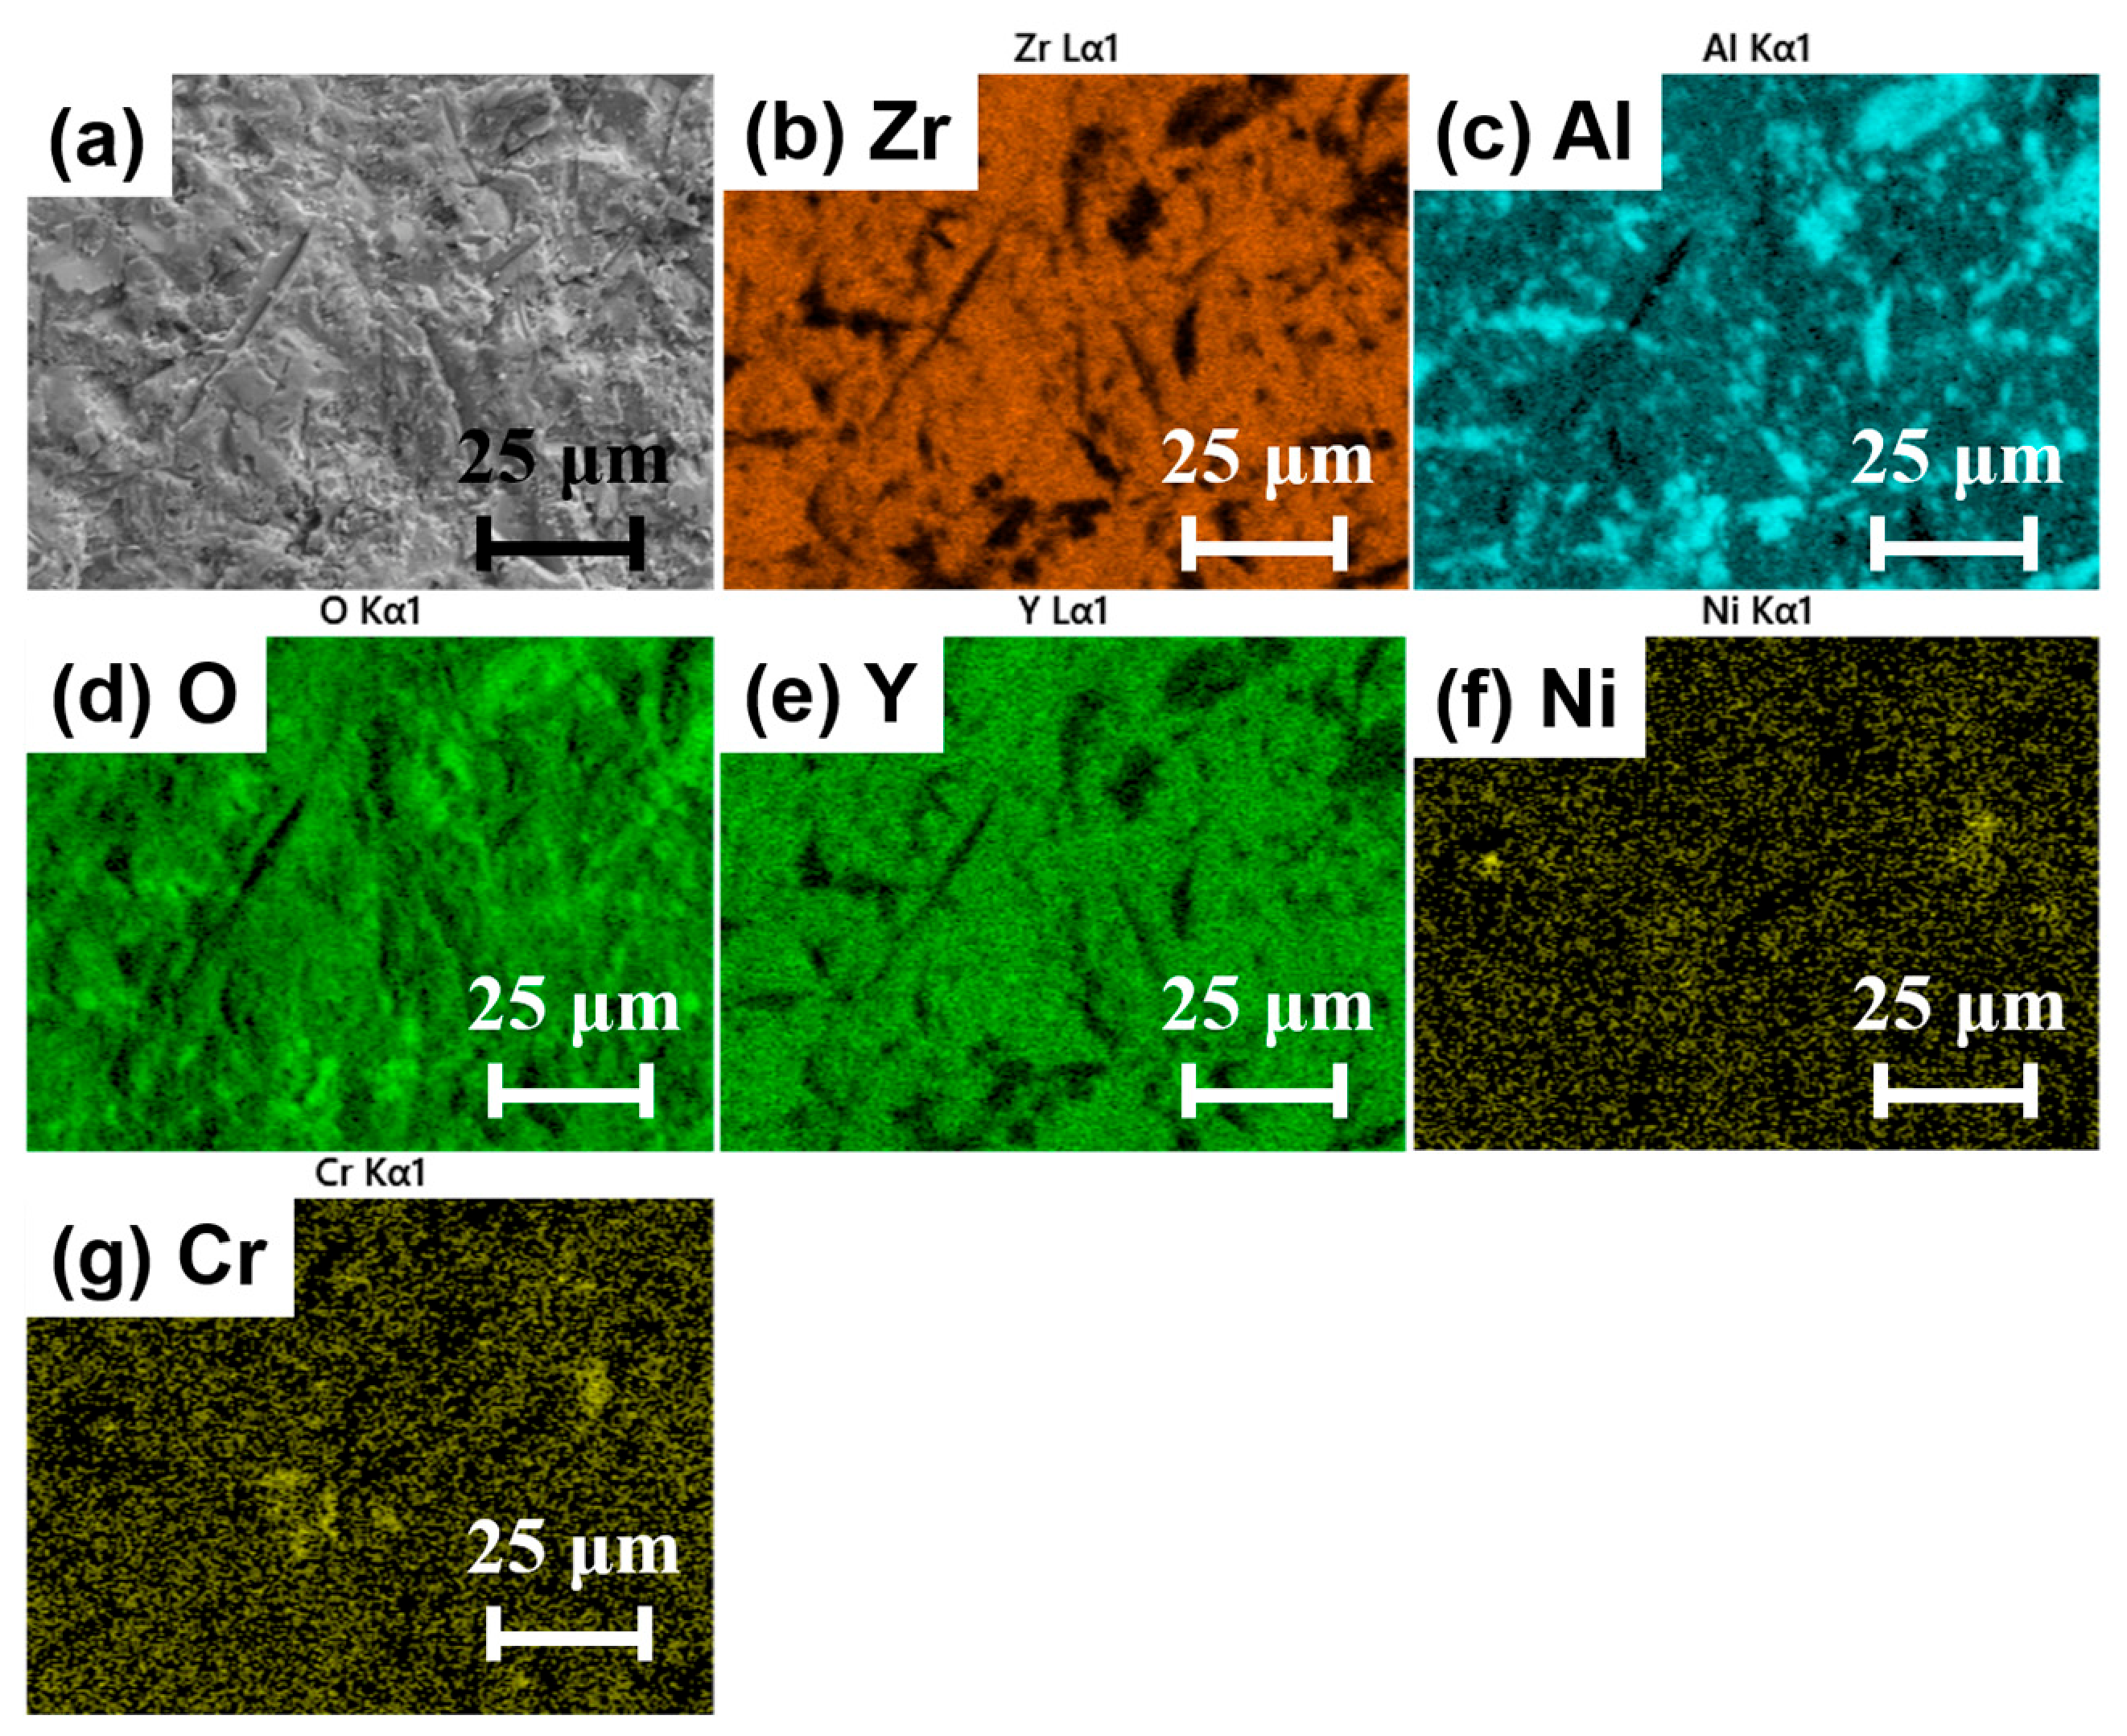
Figure 10 shows the EDS elemental distribution for this group. The detected elements are Zr, Y, O, Al, Cr, and Ni. Although the Cr and Ni signals are relatively weak, they are detectable in the EDS image. This indicates that after 2 h of erosion, the ceramic surface layer of the YSZ coating continued to thin, with the residual thickness approaching the EDS signal penetration depth. Elements in the underlying bonding layer are now detectable.
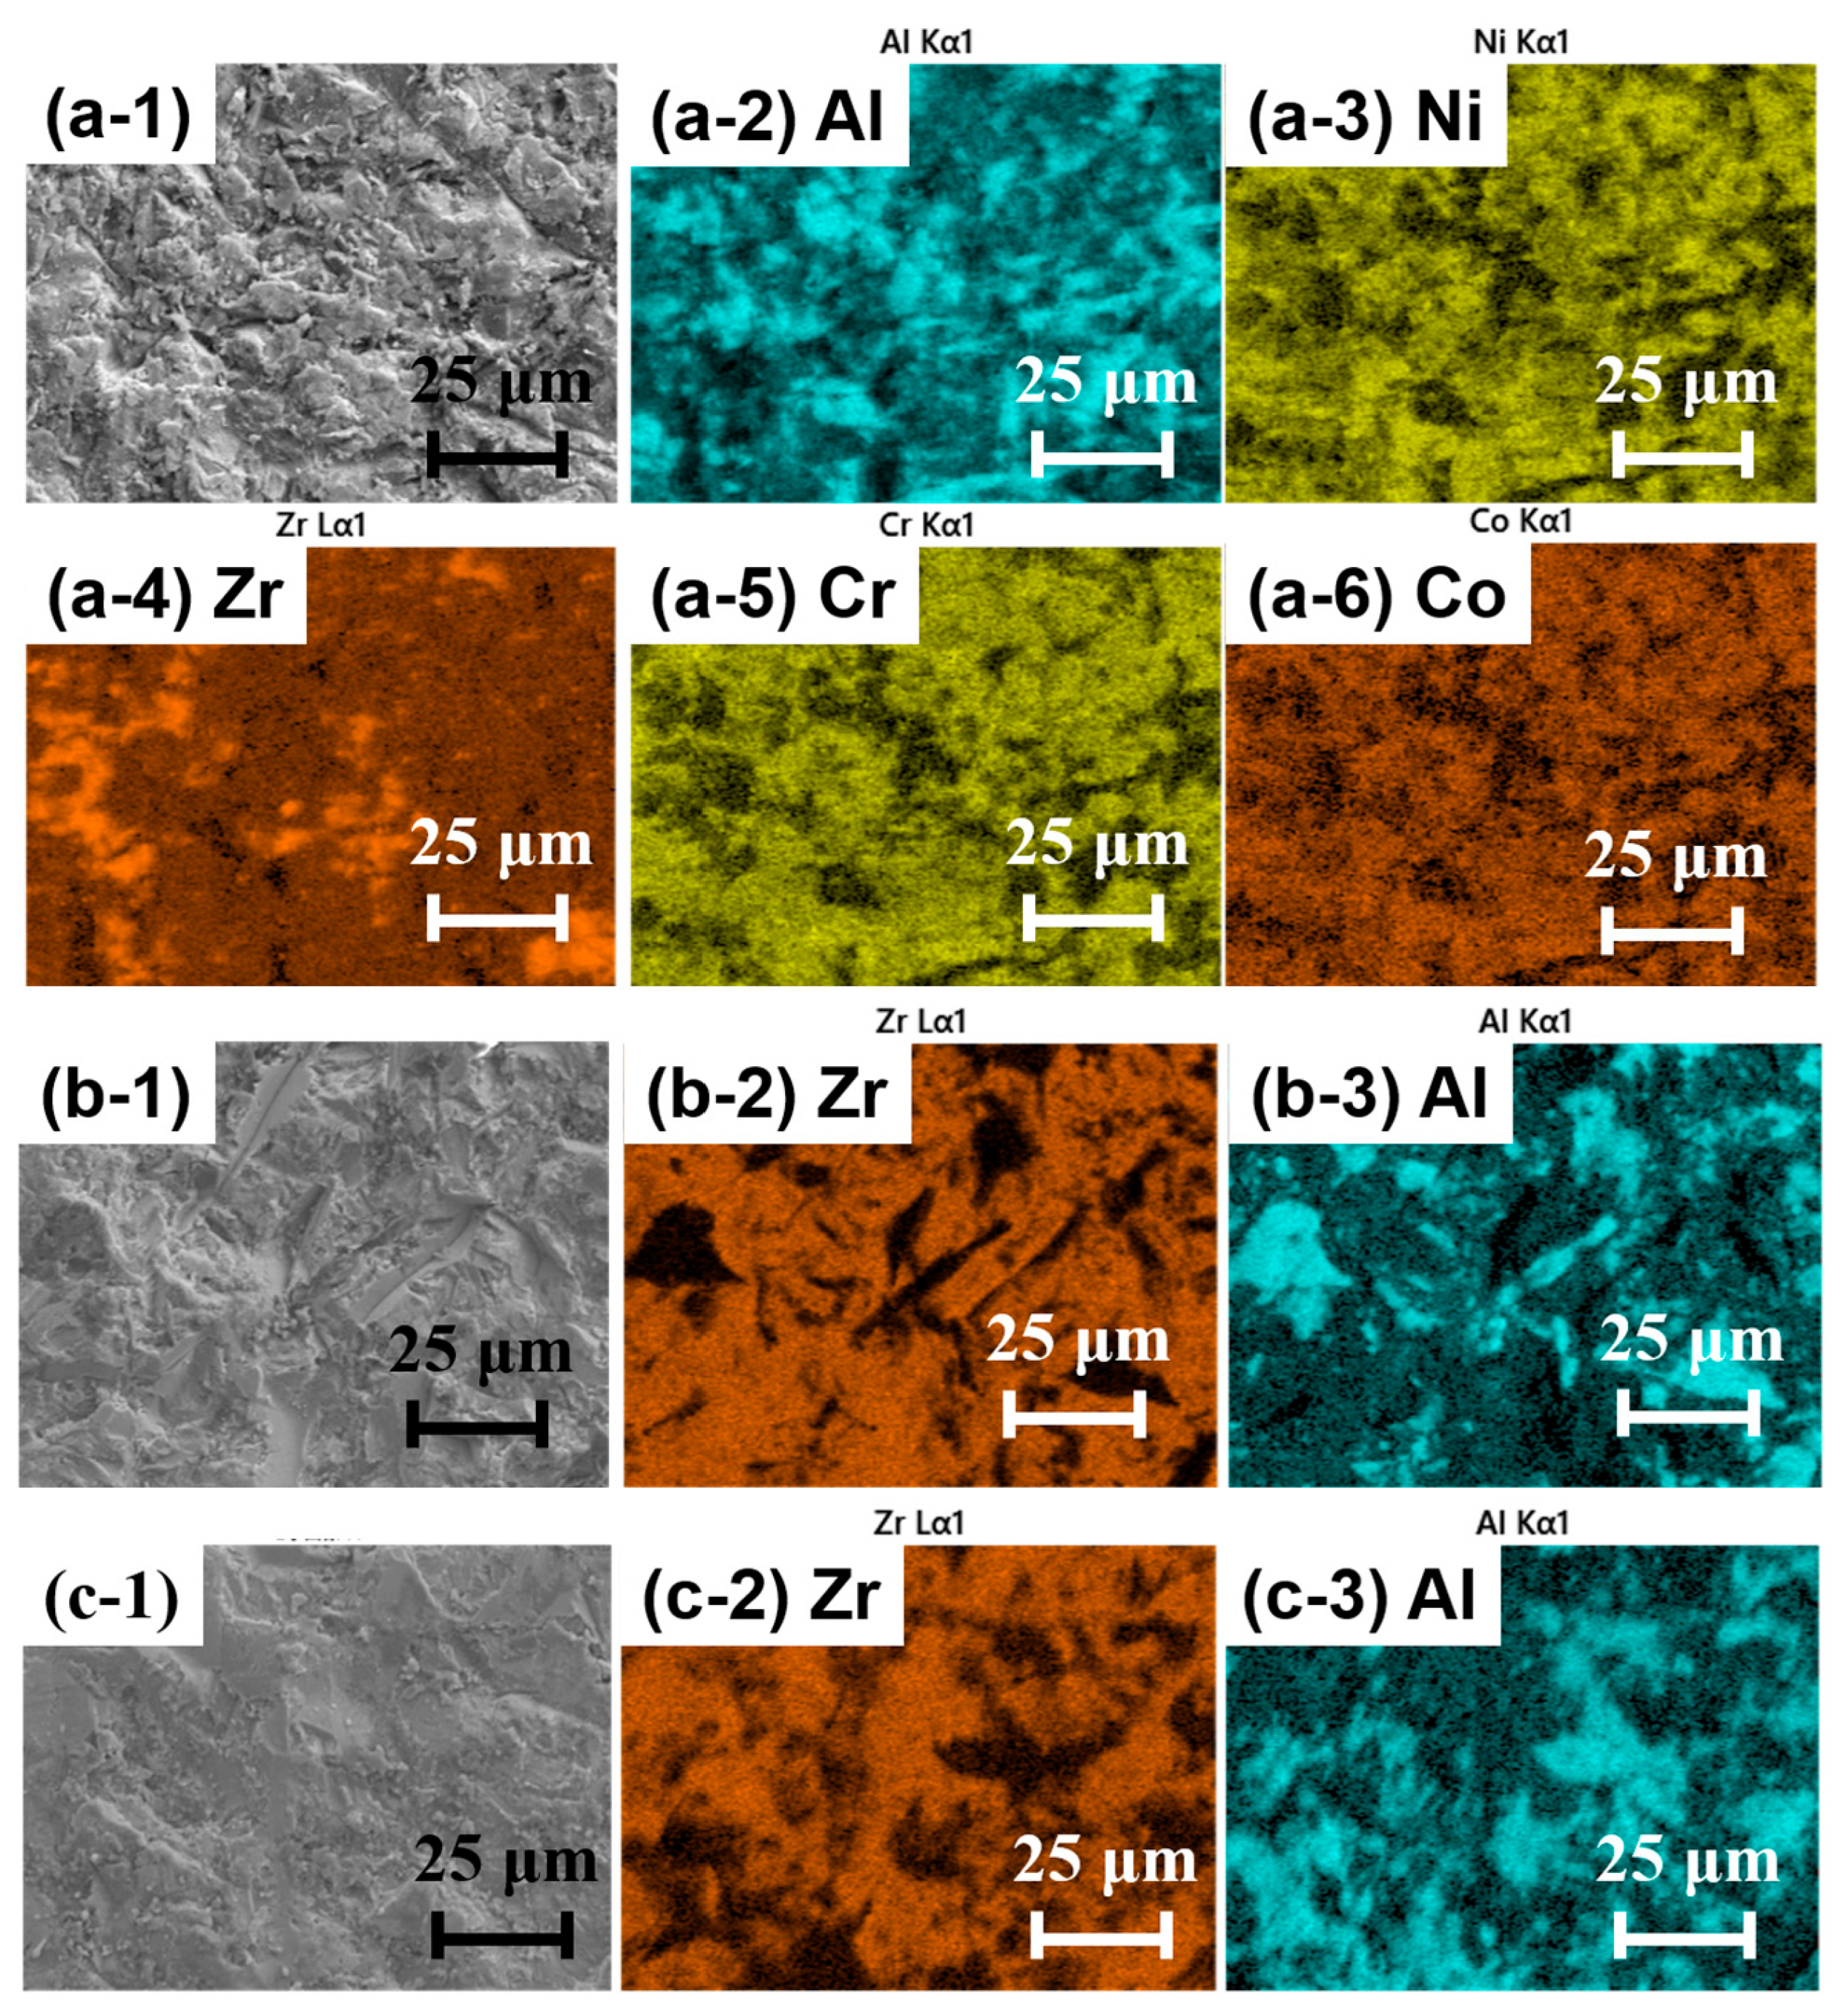
Figure 11 is the EDS elemental distribution on the coating surface after 3 h of erosion at three different particle sizes. As shown in Figure 11a, five elements (Zr, Al, Ni, Cr, and Co) were detected on the eroded coating surface at the 65 μm particle size. The three characteristic elements of the bond coating (Ni, Cr, and Co) exhibit a uniform distribution over a large area, while the Zr signal is weakened. This result indicates that, after 3 h of erosion, the small 65 μm particles penetrated the top coating of YSZ TBCs, exposing a large area of the bond coating (NiCoCrAlYHf). Consequently, the coating failed and essentially lost its protective function. This result is consistent with the morphological observations from the 65 μm particle size group after 3 h of erosion (Figure 2i). The black damaged regions observed macroscopically are a direct indication of the bonding layer being exposed. The high-frequency cumulative impacts of small-diameter particles on the coating surface caused the most severe localized penetrating damage. Figure 11b,c show the EDS elemental distributions on the coating surface after 3 h of erosion with 120 μm and 175 μm particles. Compared to the results from the 65 μm particle group, no signals for Ni or Cr were detected. This indicates that the main body of the coating remained intact after 3 h of erosion, and the protective function of the YSZ coating was generally well maintained.

3.3. Cross-Sectional Microstructure of the Coating

3.3.1. As-Deposited Cross-Sectional Microstructure

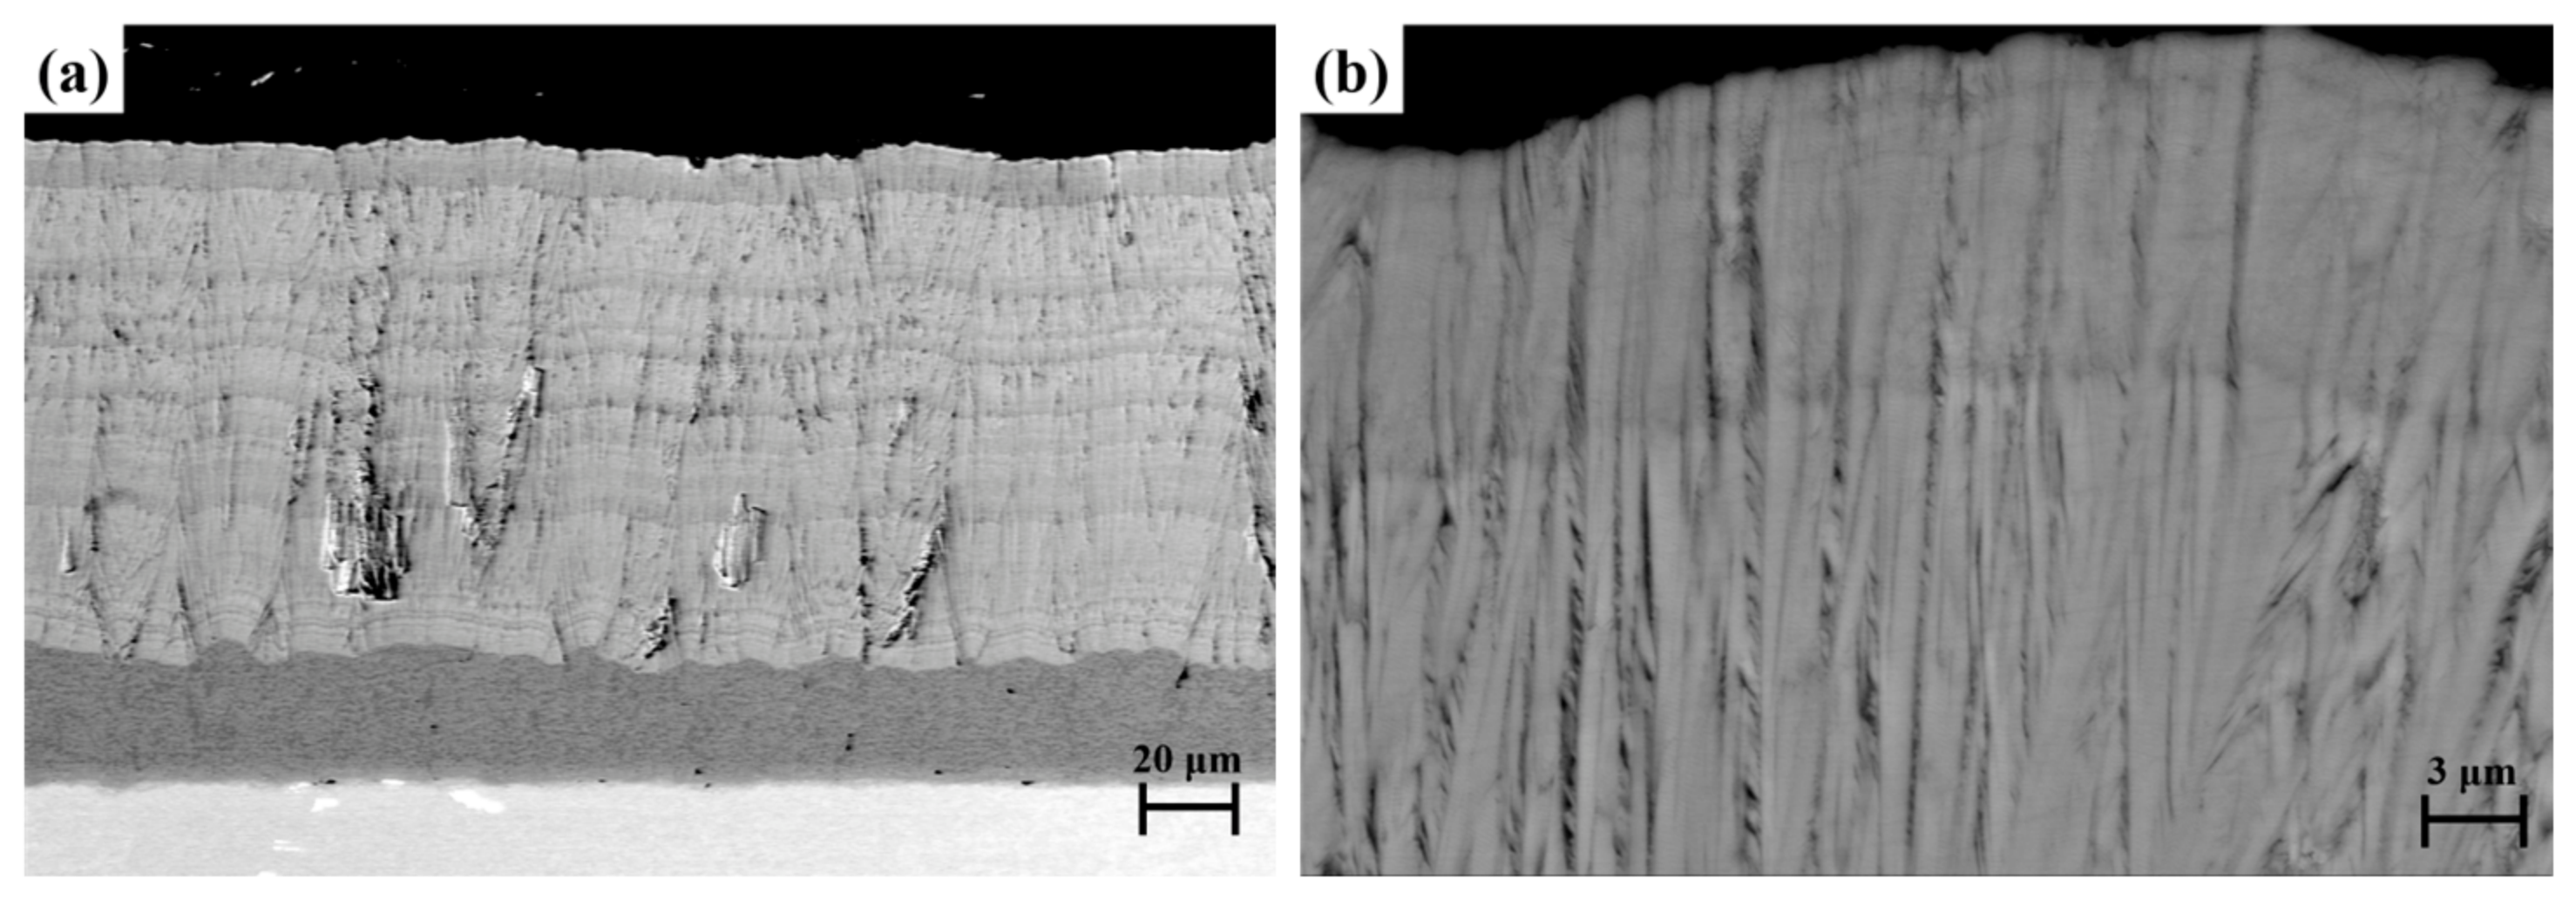
The cross-sectional morphology of the as-deposited EB-PVD YSZ TBCs is shown in Figure 12. The top coating is approximately 120 μm thick. It can be observed that the coating consists of numerous columnar grains growing perpendicular to the bonding layer. The orientation of the columnar grains is clearly defined. This is a typical microstructural feature formed by the EB-PVD process [25]. A certain number of gaps are retained between the columnar crystals. These gaps can release part of the thermal mismatch stress during thermal cycling, thereby conferring good strain tolerance and thermal shock resistance on the coating [26]. This contributes to improving the service stability and lifetime of TBCs.
Further magnification reveals that numerous fine, feather-like substructures are distributed within individual columnar crystals, as shown in Figure 12b. This feather-like microstructure complicates the heat transfer pathways, enhancing phonon scattering and thereby reducing the thermal conductivity of the top coating, which improves the coating’s thermal insulation performance [27].

3.3.2. Cross-Sectional Morphology During Erosion

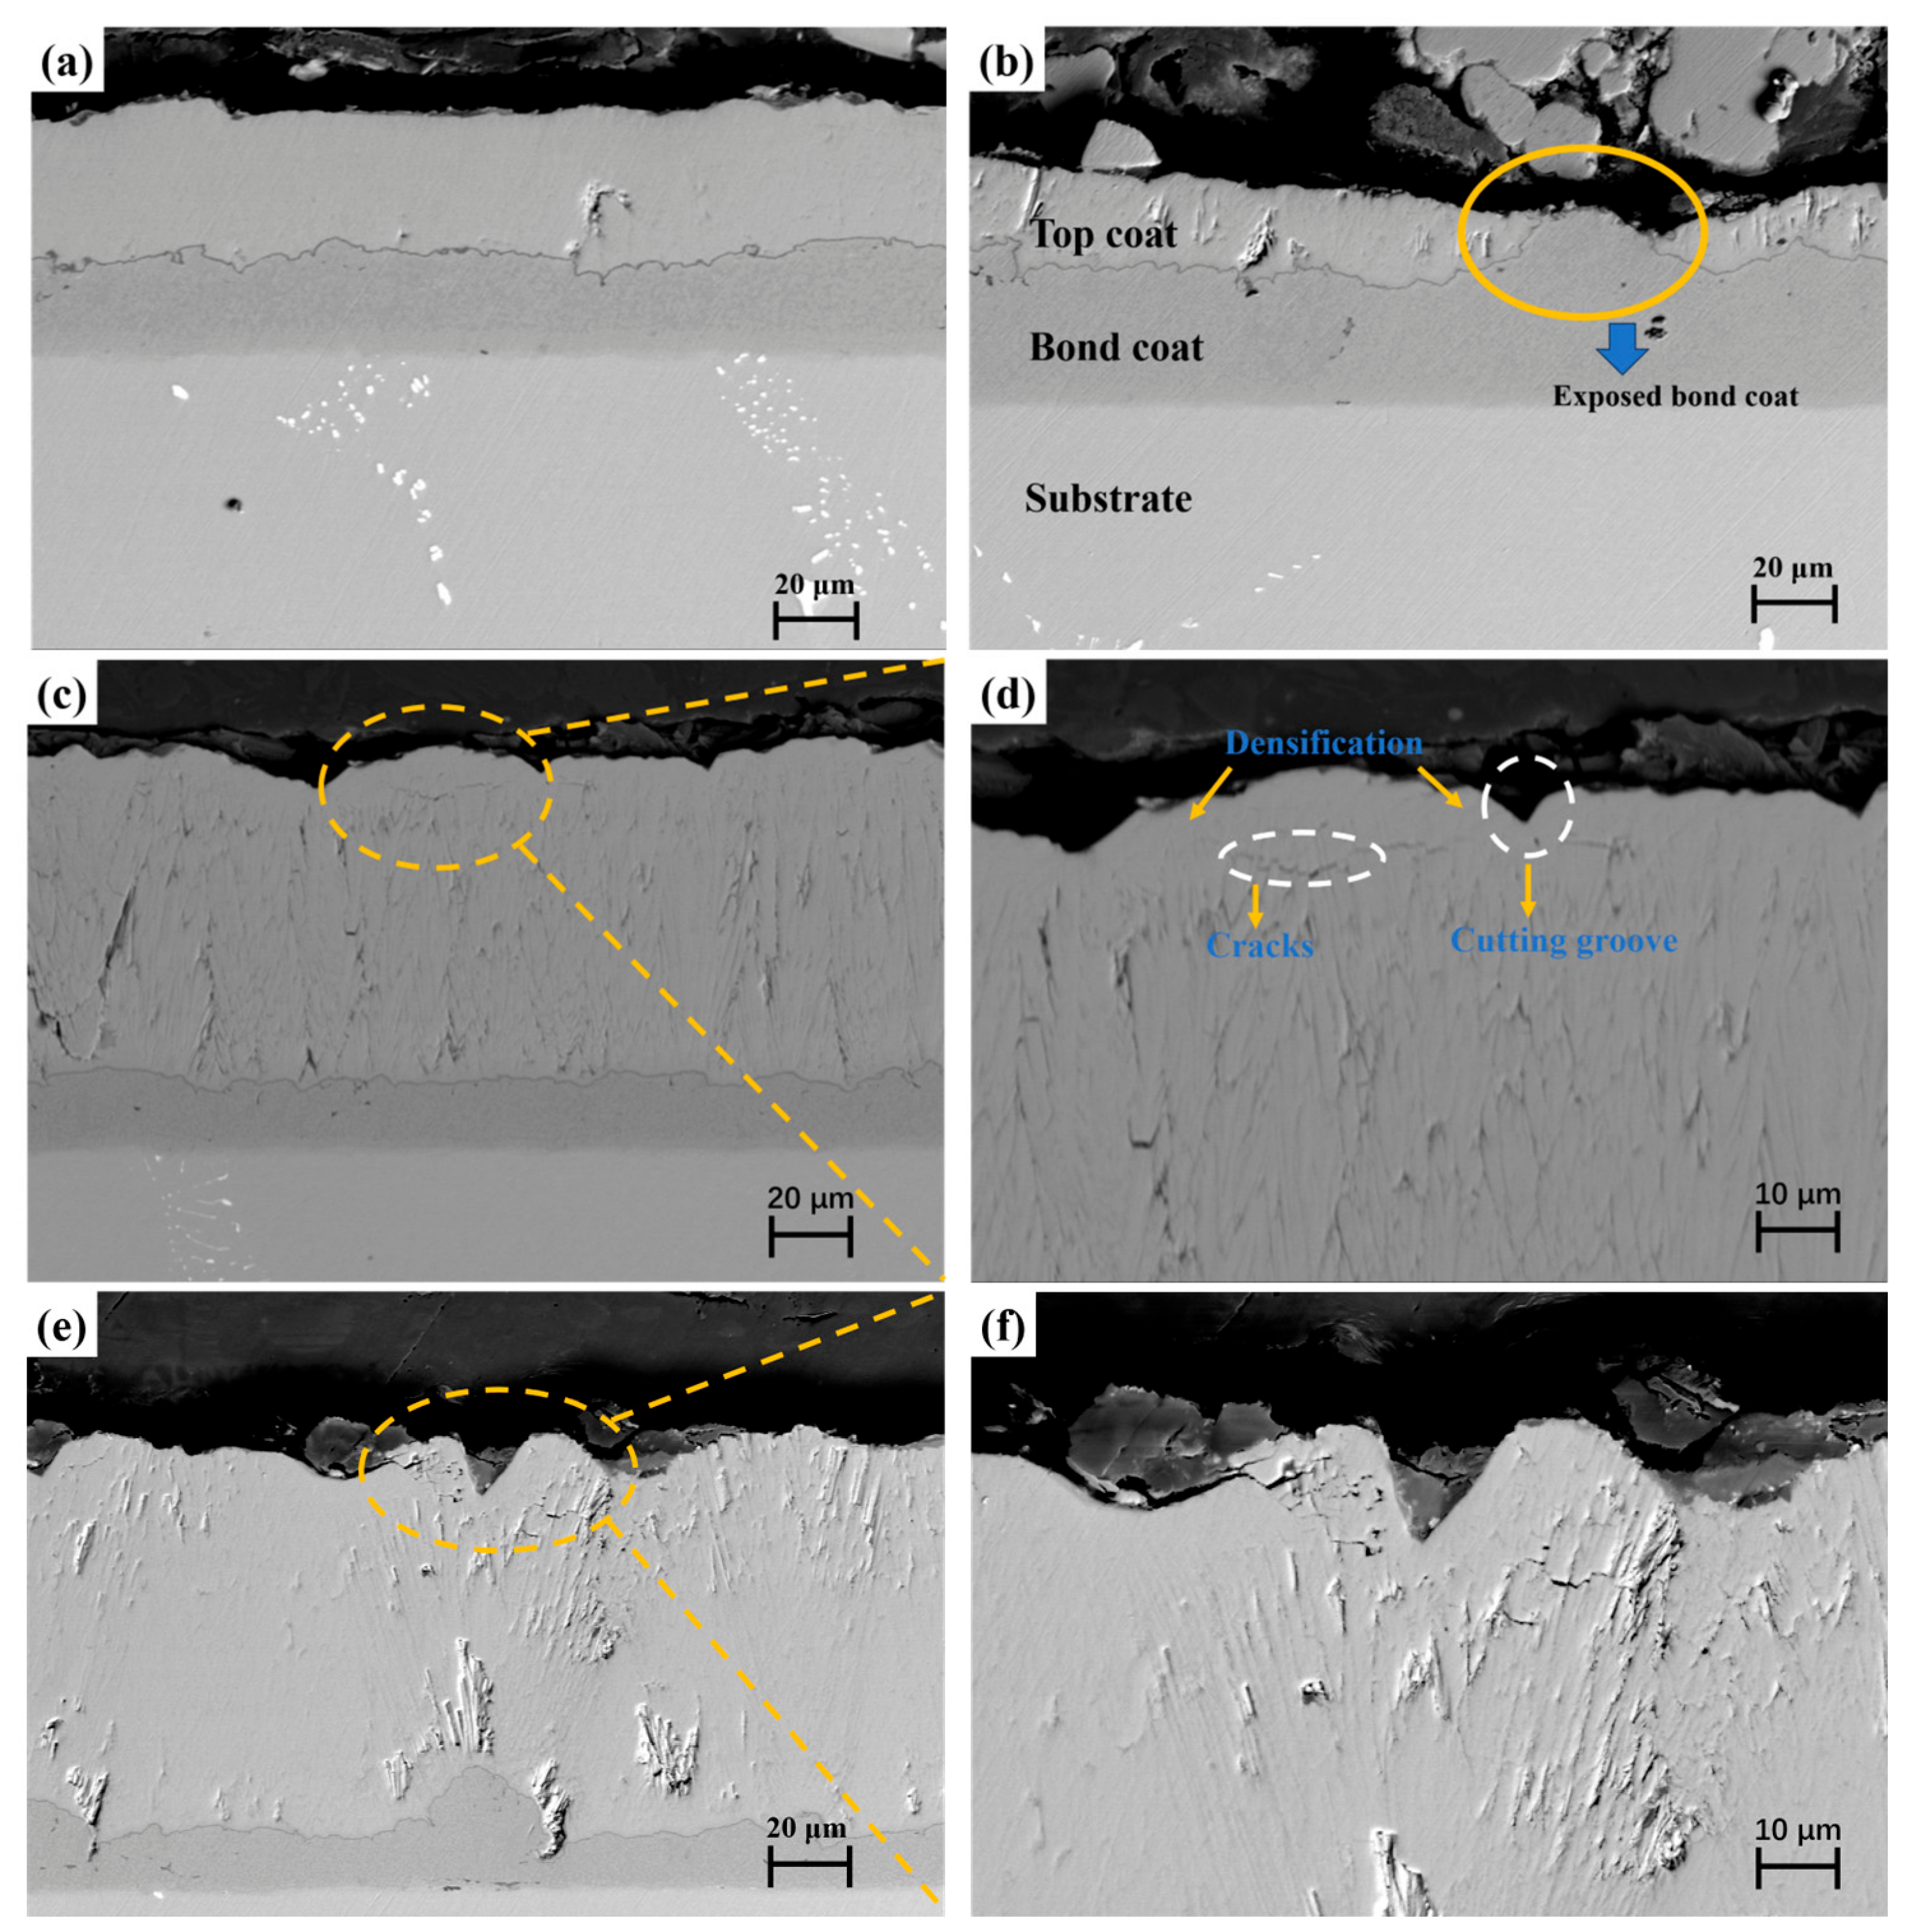
Figure 13a,b show the cross-sectional morphology of EB-PVD YSZ TBCs after erosion by 65 μm fine particles. It can be observed that significant material removal has occurred at the top of the ceramic layer. The cross-section exhibits relatively smooth cutting features. This indicates that the material removal mechanism is primarily driven by high-frequency continuous micro-cutting. Through progressive erosion, the coating thickness gradually decreases. Under the same particle mass flow rate conditions, the number of small diameter particles increases significantly. The coating surface is subjected to more frequent and continuous impacts. Since the impact energy of individual particles is relatively low, it is difficult to directly induce large-scale brittle fracture. Therefore, the particles primarily remove material from the tops of the columnar grains through repeated micro-cutting. This causes the original “cauliflower-like” tops of the columnar grains to be gradually flattened, ultimately forming a relatively smooth cross-sectional morphology of the eroded surface. This coating failure mechanism corresponds to the surface microstructure.
In Figure 13b, the bond coating is already exposed in localized areas. This indicates that the top coating has been locally penetrated under continuous erosion. This is consistent with the results of the surface composition distribution map of TBCs after 2 h of erosion with 65 μm particles (Figure 10). It can be observed that the surface irregularities near the exposed areas have become more pronounced. Studies [28] have shown that there is a mismatch in the coefficients of TBCs. During repeated heating and cooling cycles, the coating is subjected to significant stress, causing plastic flow in the bonding layer and resulting in interfacial wrinkling [29]. This instability in the interfacial geometry amplifies local stress concentrations at the peaks, further accelerating crack initiation and propagation at the interface.
Overall, the damage mechanisms of EB-PVD YSZ thermal barrier coatings under erosion by small-diameter particles primarily involve micro-cutting caused by continuous high-frequency particle impacts and the progressive flattening of columnar crystal tips.
Figure 13c,d show the cross-sectional morphology of TBCs after erosion by 120 μm medium-size particles. As can be seen in Figure 13c, the top coating exhibits a more apparent undulating appearance. The material is removed unevenly. Compared to the coating morphology under small-particle erosion, typical grooves can be observed. As particle erosion continues, microcracks propagate along grain boundaries, leading to brittle fracture and spalling at the “cauliflower-like” tips, ultimately forming cutting grooves [30]. Due to localized stress concentration, these grooved areas are also more prone to becoming crack initiation sites. Additionally, surface densification is clearly observable in Figure 13d. The tops of the columnar grains undergo compaction under repeated impact. The original intergranular voids gradually shrink, forming densified surface regions [31]. Microcrack initiation and propagation can also be observed within the columnar grains. This is primarily due to the transmission of large-impact loads into the interior, which induces crack formation. At the same time, surface densification weakens the inherent strain buffering capacity of the EB-PVD columnar structure, further promoting crack propagation [12].
For erosion by particles of medium size, the damage mechanism shifts from progressive removal primarily driven by micro-cutting under fine 65 μm particle conditions to a composite damage mode involving the combined effects of cutting, compaction, and localized brittle fracture.
Figure 13e,f show the cross-sectional morphology of TBCs after erosion by 175 μm large particles. Compared with the other two particle sizes, the larger particle size significantly increases the kinetic energy per impact, generating extremely high stresses in localized areas upon particle impact, which causes brittle fracture at the tips of the columnar grains. Consequently, the surface erosion pits formed after impact by the 175 μm particles are deeper and exhibit distinct features of columnar grain fracture and block-like spalling.
At this stage, the damage mechanism shifts to brittle fracture and localized spalling induced by high-energy impact. Although the extent of localized damage is significantly greater than that caused by small and medium particles, the overall thinning of TBCs is relatively minor because the damaged areas are more dispersed. Consequently, the coating does not typically fail completely as rapidly as it does under small-particle erosion.
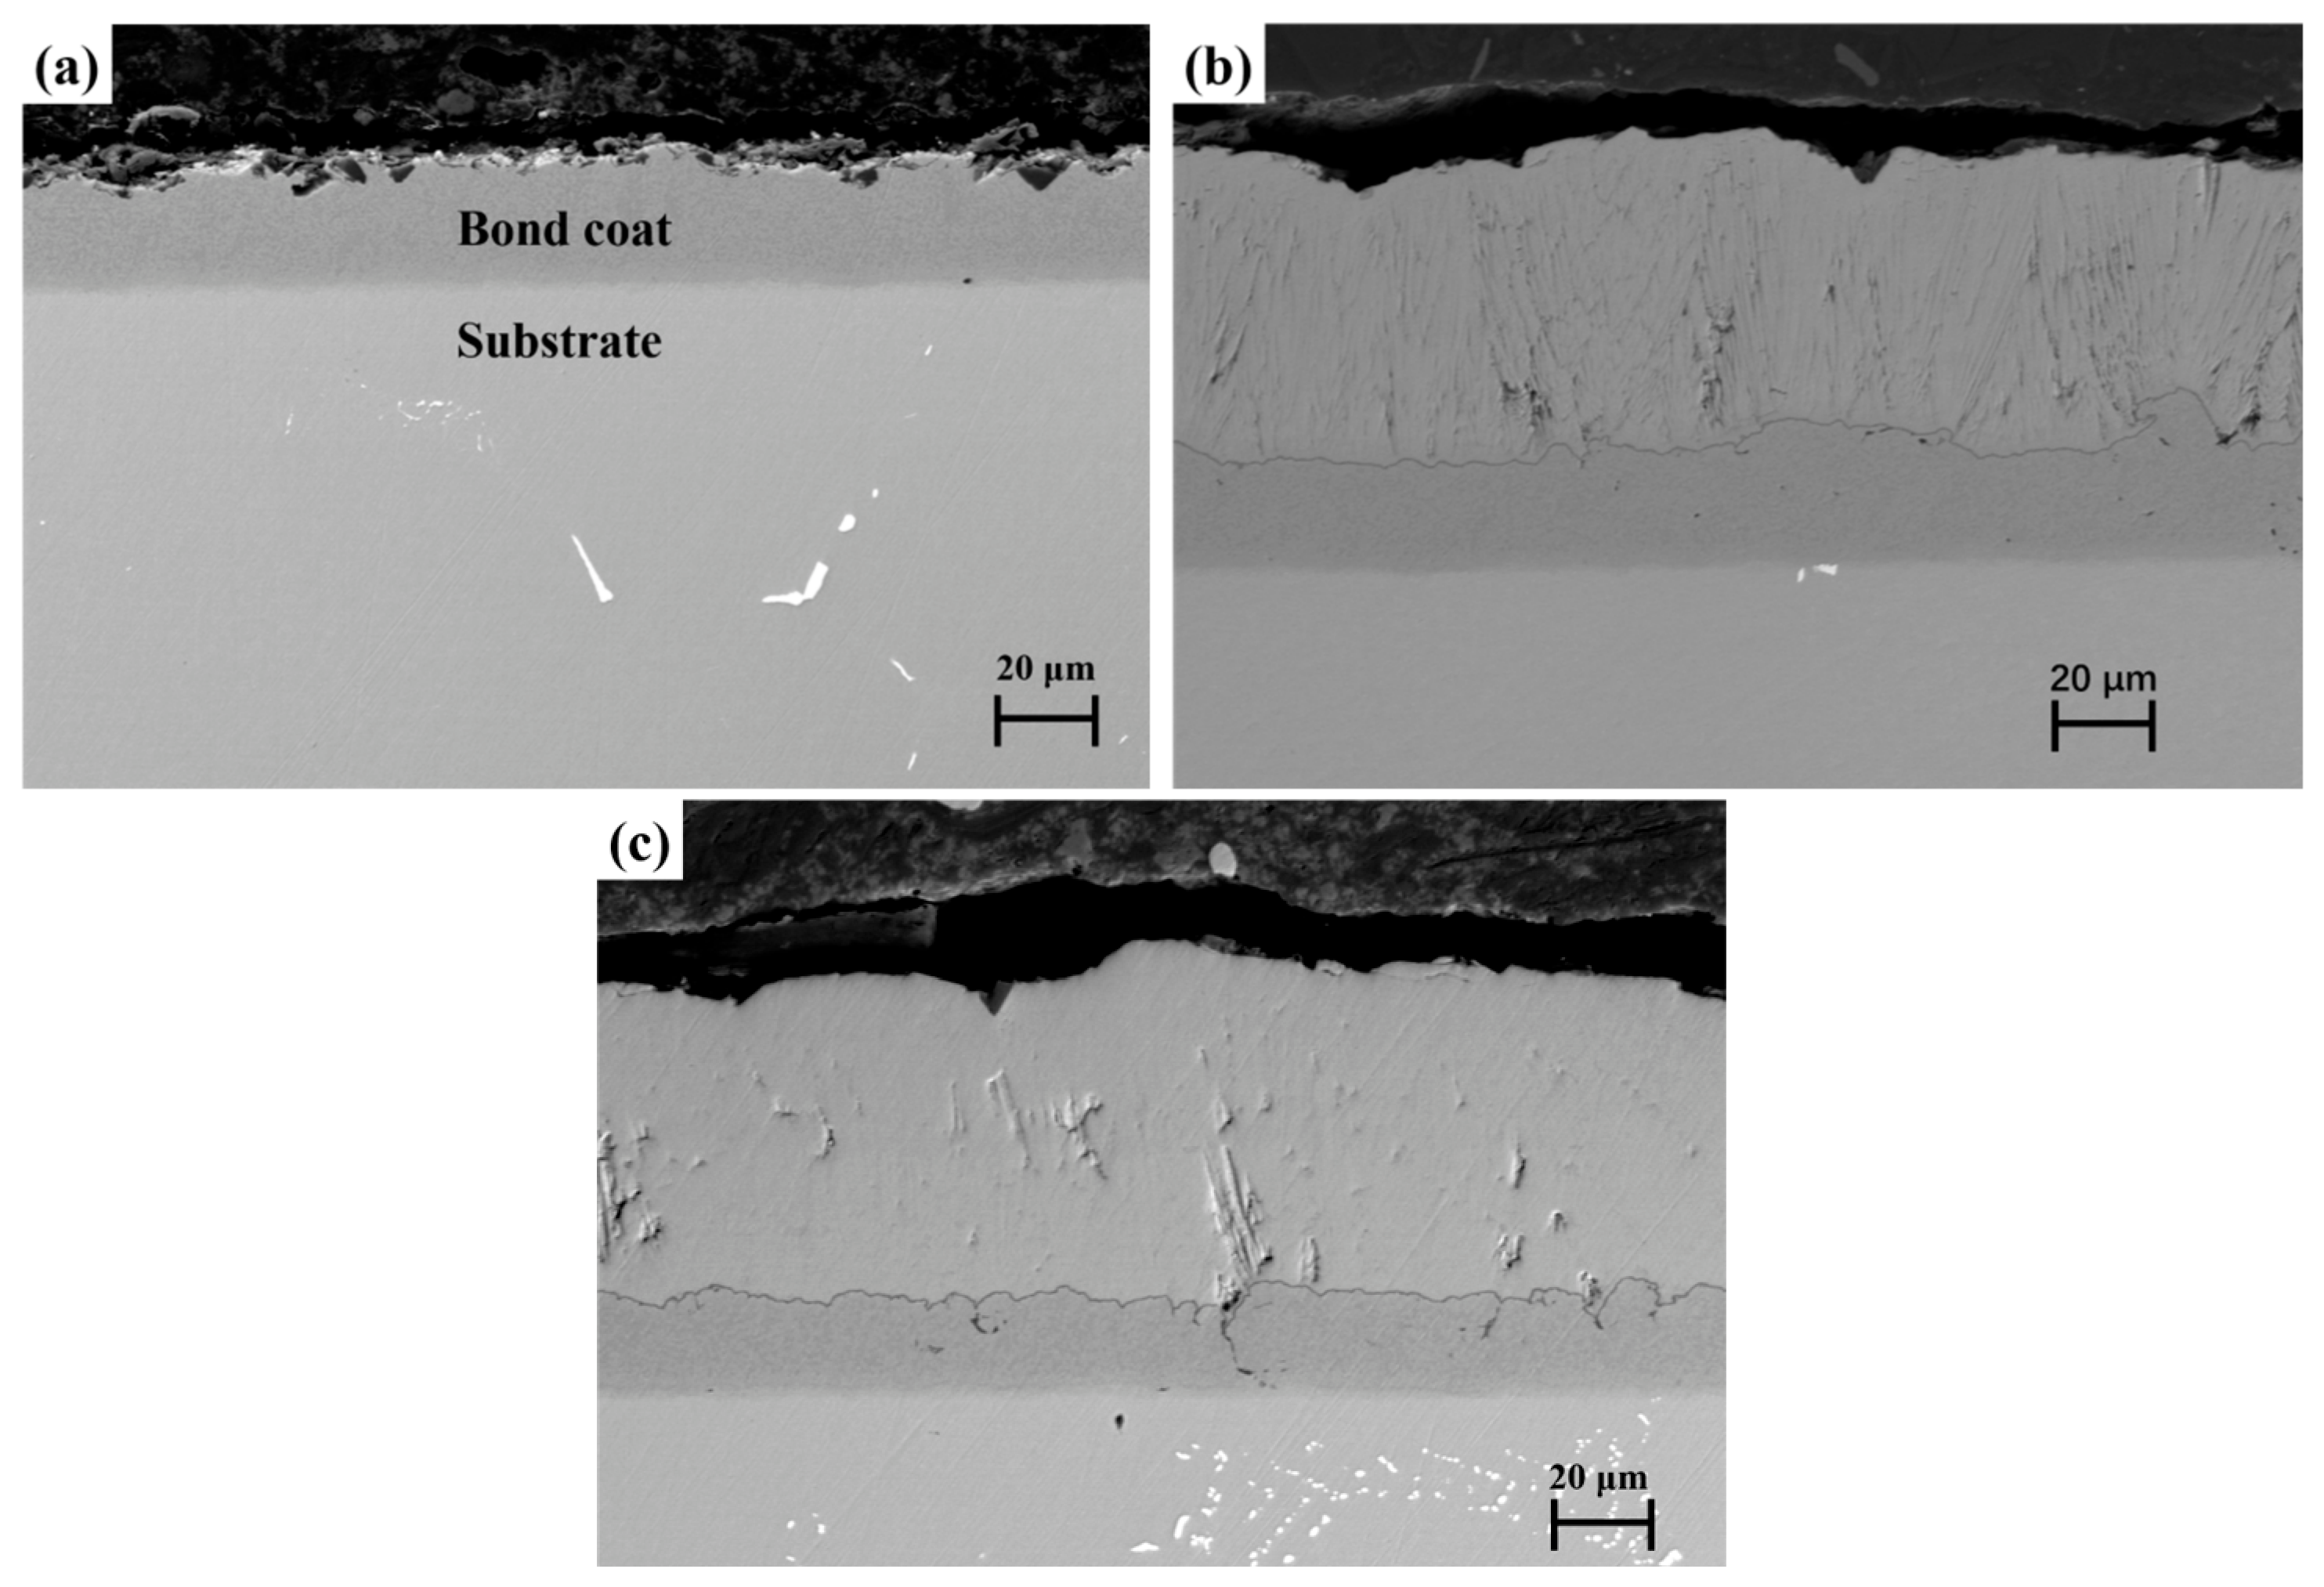
Figure 14a–c show the cross-sectional morphologies of TBCs after 3 h of erosion by 65 μm, 120 μm, and 175 μm Al2O3 particles. It can be seen that there are significant differences. As shown in Figure 14a, after 3 h of erosion by 65 μm particles, the top coating was almost completely removed. In contrast, as shown in Figure 14b,c, the top coating retained a relatively intact columnar crystal structure after erosion by 120 μm and 175 μm particles.
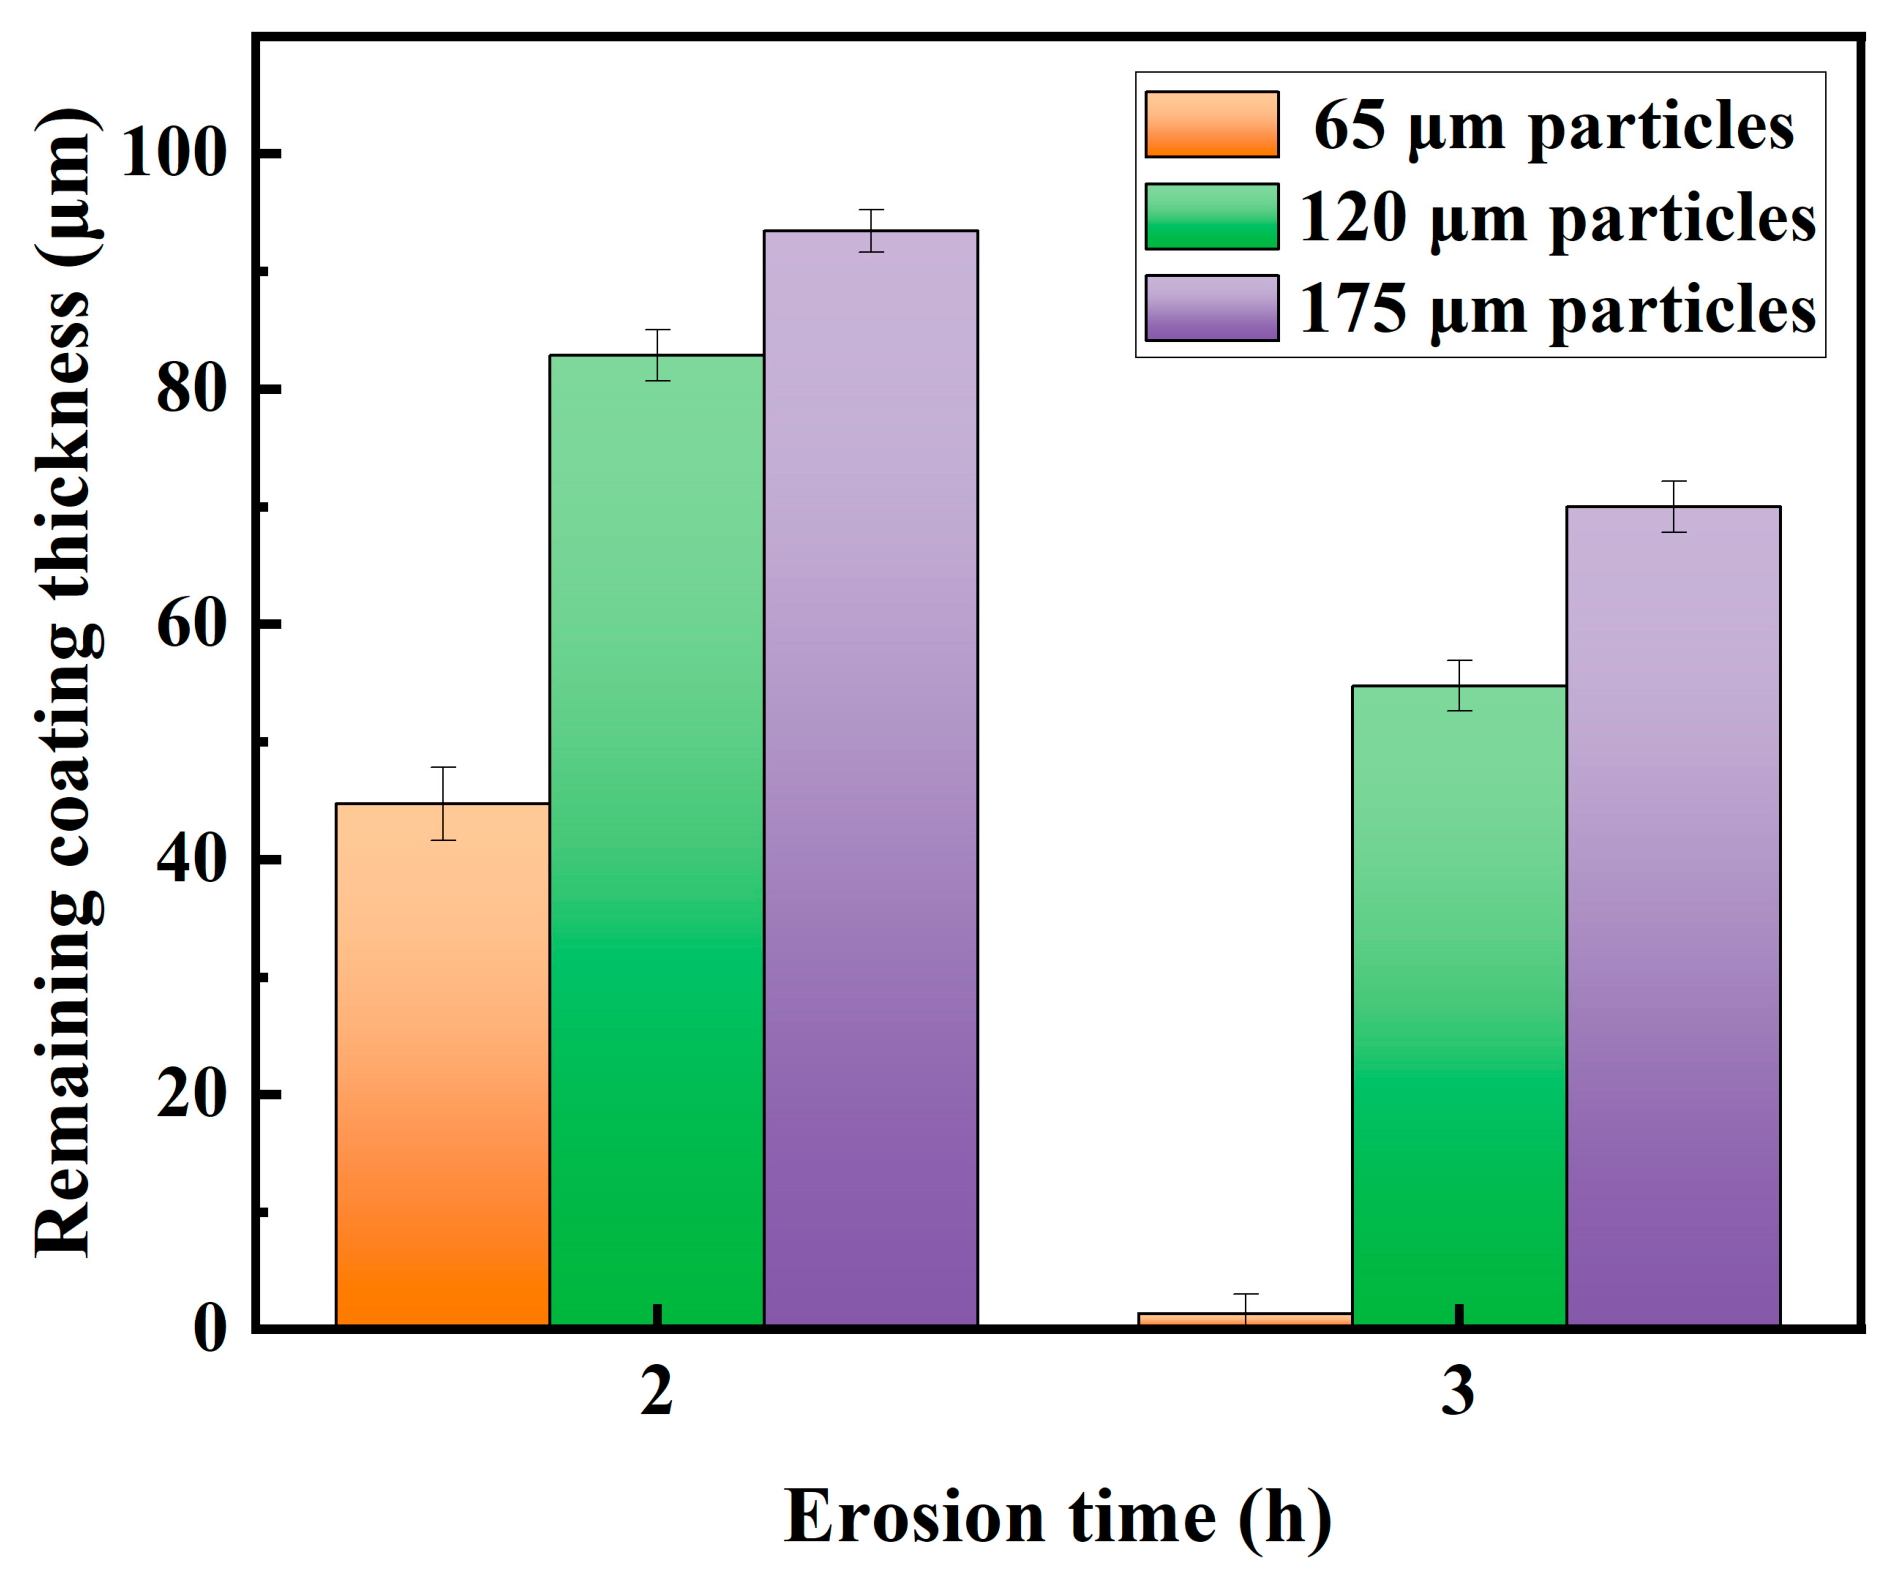
Figure 15 shows the variation in the residual thickness of TBCs over different erosion durations with three particle sizes. The thinning behavior of the coating exhibits significant differences. After 2 h of erosion, the residual thickness of the top coating was approximately 40 μm, 80 μm, and 90 μm under the action of 65 μm, 120 μm, and 175 μm particles. After 3 h of erosion, the remaining thickness decreased further. The top coating was completely removed by the 65 μm particles, while the coatings exposed to 120 μm and 175 μm particles retained approximately 50 μm and 70 μm. The results indicate that the erosion resistance of the coating improved significantly as particle size increased.

3.4. Residual Stress Evolution in the TGO Layer

One of the primary causes of TBC delamination failure during high-temperature testing is thermal stress resulting from thermal expansion mismatch between the coating layers. Elastic stresses generated by high-velocity gas impact, combined with TGO growth stresses, promote the initiation and propagation of cracks in the coating [32]. Therefore, residual stress in the TGO layer is a critical parameter determining the interfacial stability and service life of thermal barrier coatings. When compressive or tensile stresses in the TGO layer exceed the interfacial bond strength, this can easily induce interfacial crack propagation and ceramic-layer delamination [33]. By measuring the residual stresses in the TGO layer under erosion conditions involving different particle sizes, the mechanism by which particle size influences the failure behavior of thermal barrier coatings can be further elucidated.
Raman spectroscopy testing of TBCs is a non-destructive testing method based on lattice vibration characteristics. The Raman measurements were performed directly on the top surface of the coating without sectioning the specimens. The basic principle is that internal stresses in the material cause changes in lattice spacing and atomic bond lengths, resulting in a shift in the positions of characteristic Raman peaks [34]. For TGO, the primary component is α-Al2O3. Since α-Al2O3 exhibits distinct Raman peaks, the residual stress state within the TGO layer can be characterized by measuring the shift in these characteristic peaks. In addition, the columnar EB-PVD YSZ coating is sufficiently transparent to the excitation laser, allowing the Cr3+ fluorescence from the α-Al2O3 TGO layer to be collected through the ceramic coating. The residual stress in the TGO layer can be measured nondestructively without removing the ceramic top coat.
When the TGO layer is under compressive stress, the lattice spacing decreases, and the Raman peak shifts toward higher wavenumbers. Under tensile stress, the lattice spacing increases, and the Raman peak shifts toward lower wavenumbers. Based on the linear relationship between the Raman peak shift and stress, a stress calculation equation can be derived [35].
Δ ω = Π   ·   σ
where σ represents the residual stress in the TGO layer, Δω represents the shift in the Raman peak position relative to the stress-free state, and Π represents the Raman stress coefficient (5.07 cm−1/GPa).
The map scanning method enables more accurate measurement of the residual stress distribution in TGO [16]. A 532 nm laser was employed as the excitation source. Undoped, annealed, stress-relieved single-crystal sapphire was selected as the reference sample. According to the literature [34], the R2 fluorescence peak of Cr3+ ions in the α-Al2O3 layer of TGO is used as a characteristic peak for stress analysis. Three spectra were acquired, and the average peak position was used for residual stress calculation. The R2 fluorescence peak position was determined using the peak-fitting routine implemented in the Renishaw WIRE software (Version 5.7), and the fitted peak center was used for residual stress calculation. The average peak position of R2 at 14,432 cm−1 was taken as the zero-stress reference peak position. According to the adopted sign convention, compressive stress is expressed as a negative value, whereas tensile stress is expressed as a positive value.
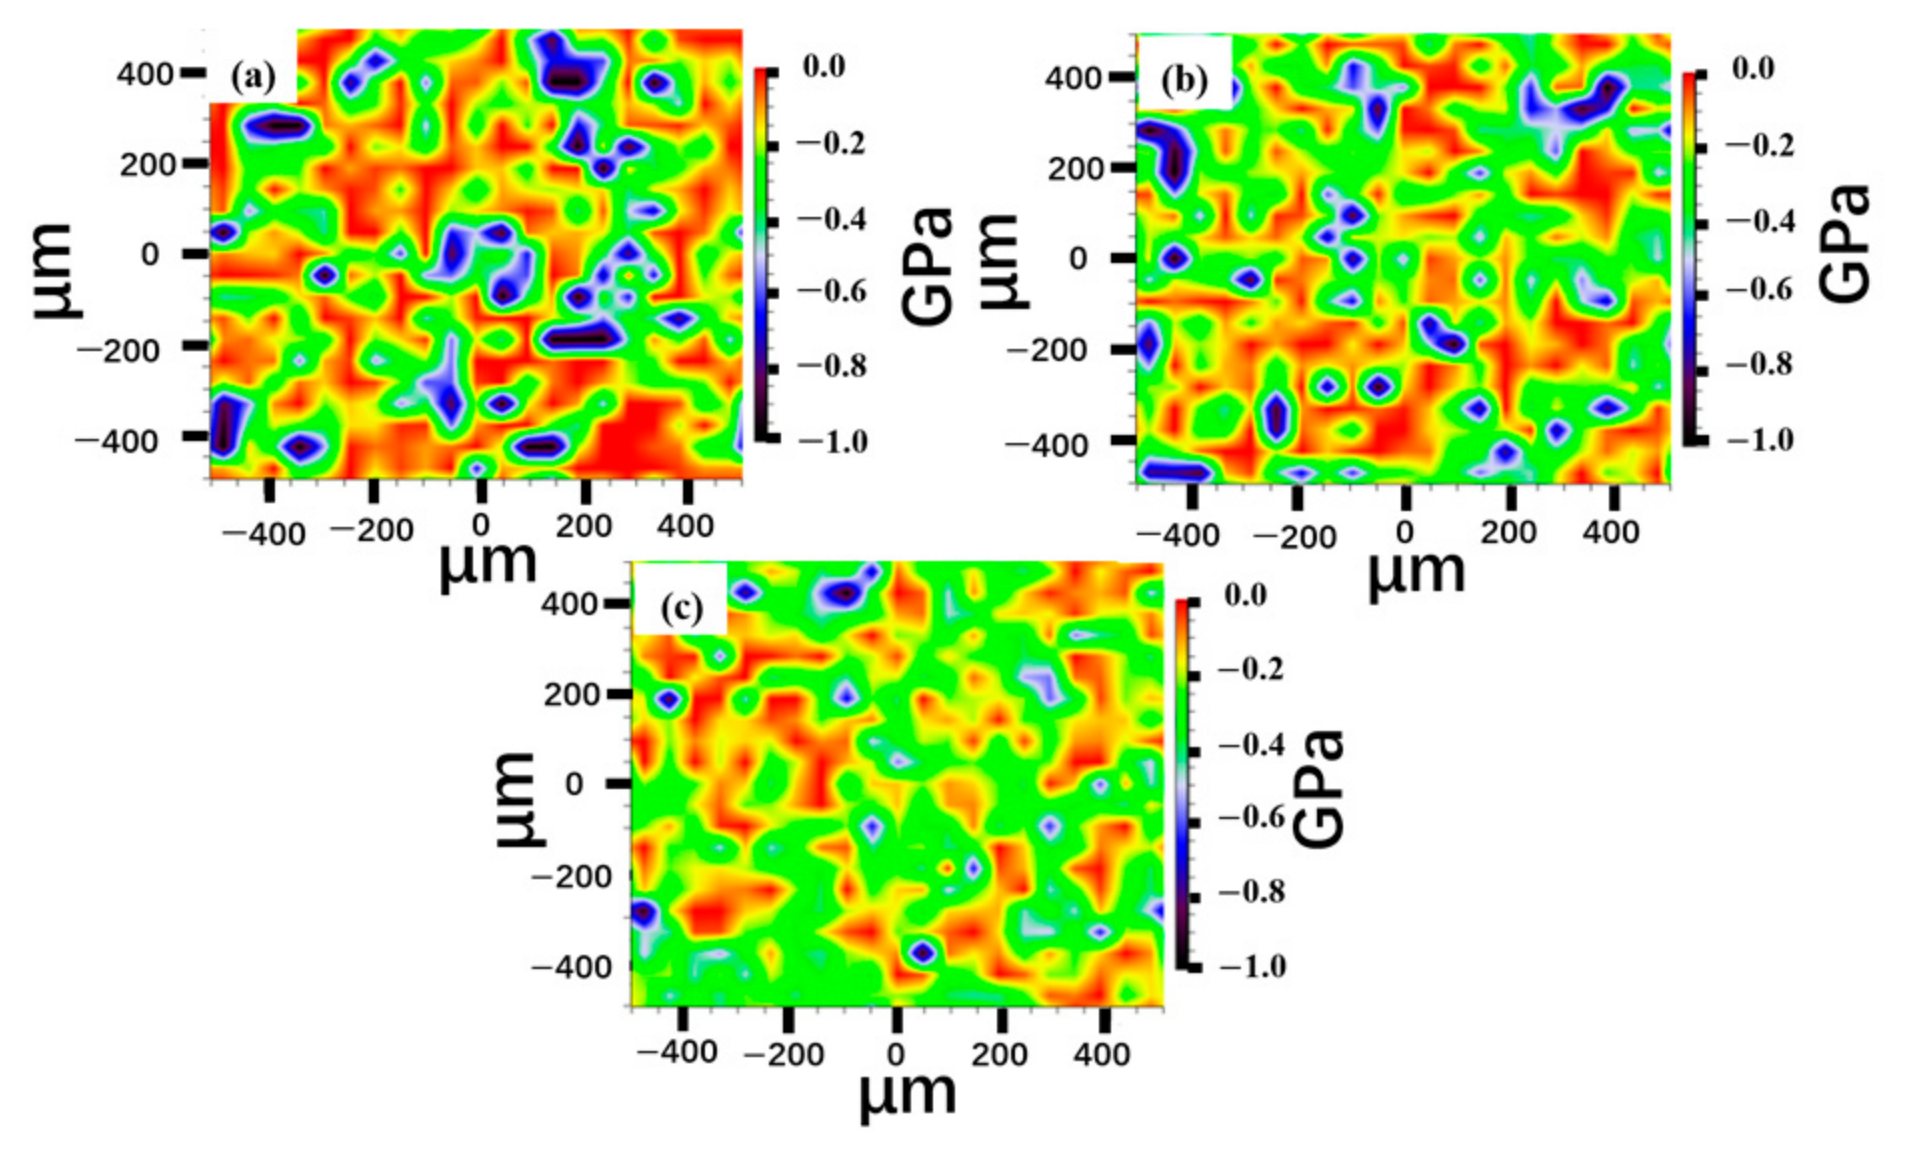
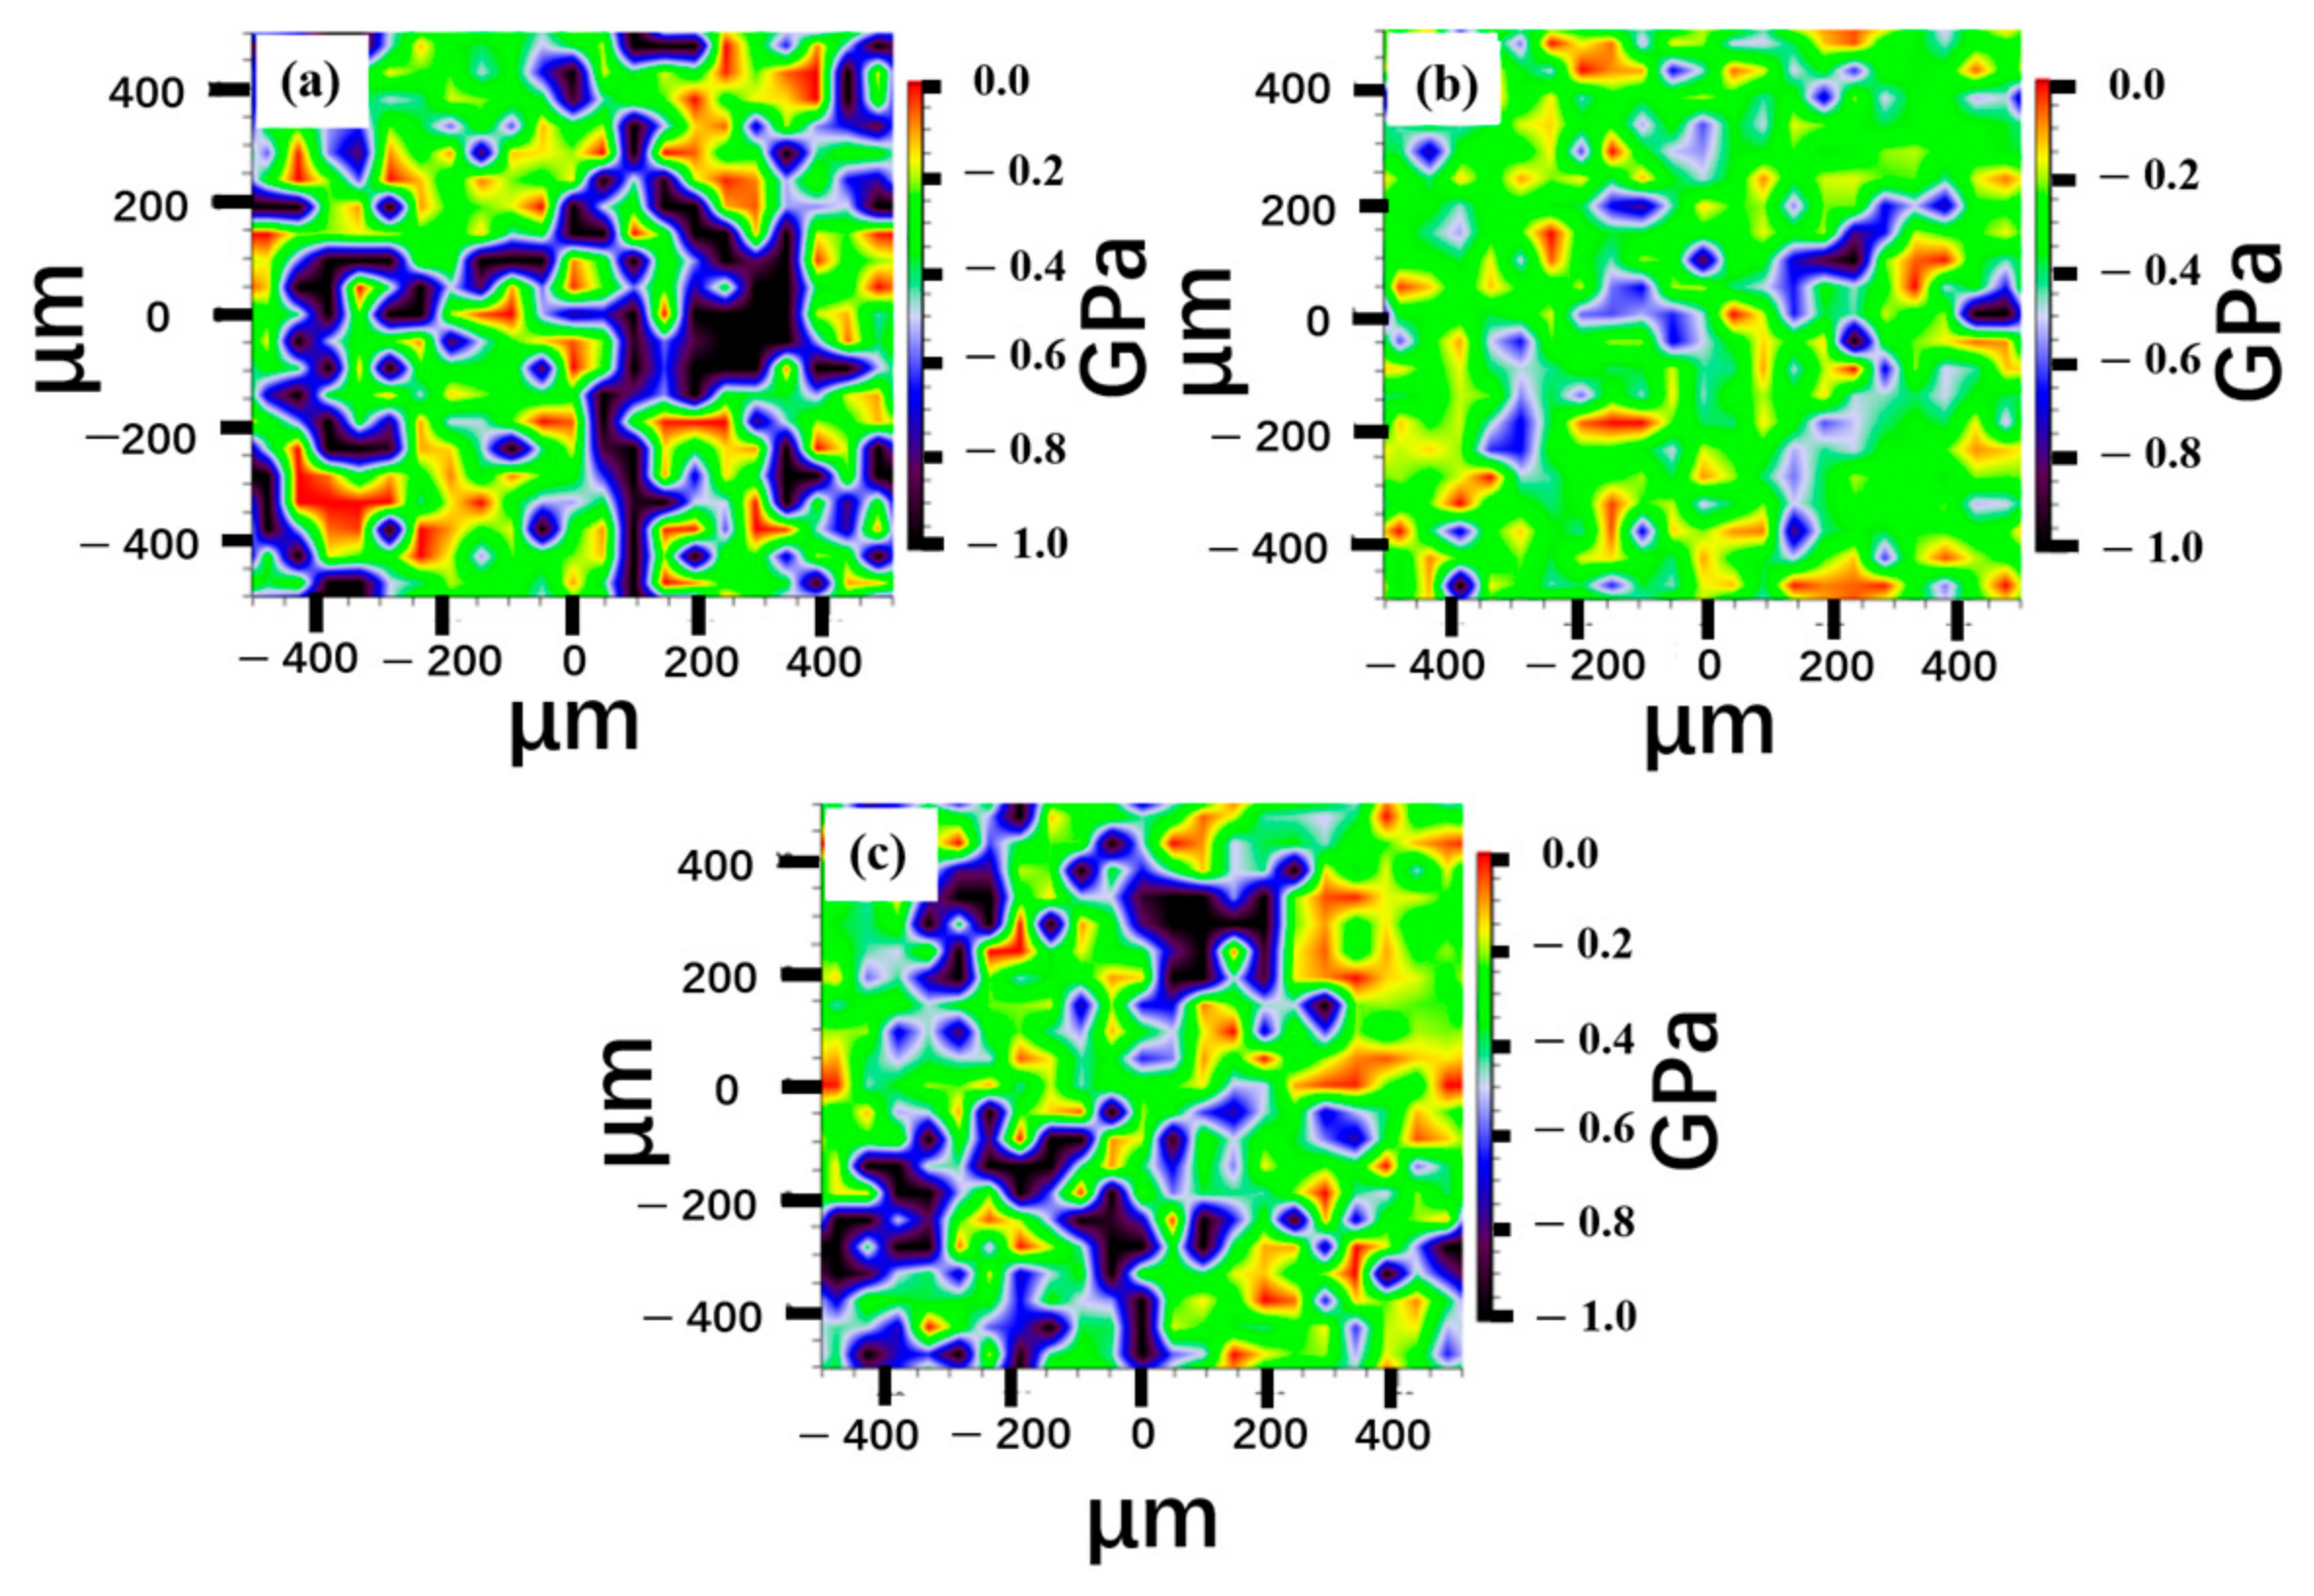
Figure 16 shows a stress distribution contour plot covering a 1 mm × 1 mm area. The measurement spots were spaced 50 μm × 50 μm apart, resulting in a total of 441 data points within the region of interest for statistical analysis of the residual stress. The scanned area was located in the central region of the eroded surface to minimize edge effects and ensure representative residual stress measurements.
The data show that the residual stresses in the TGO are all compressive stresses (“-“). The redder the color, the lower the compressive stress. The bluer the color, the higher the compressive stress. The color variations in the stress contour plot reflect the differences in the measured residual stresses at various locations within the TGO.
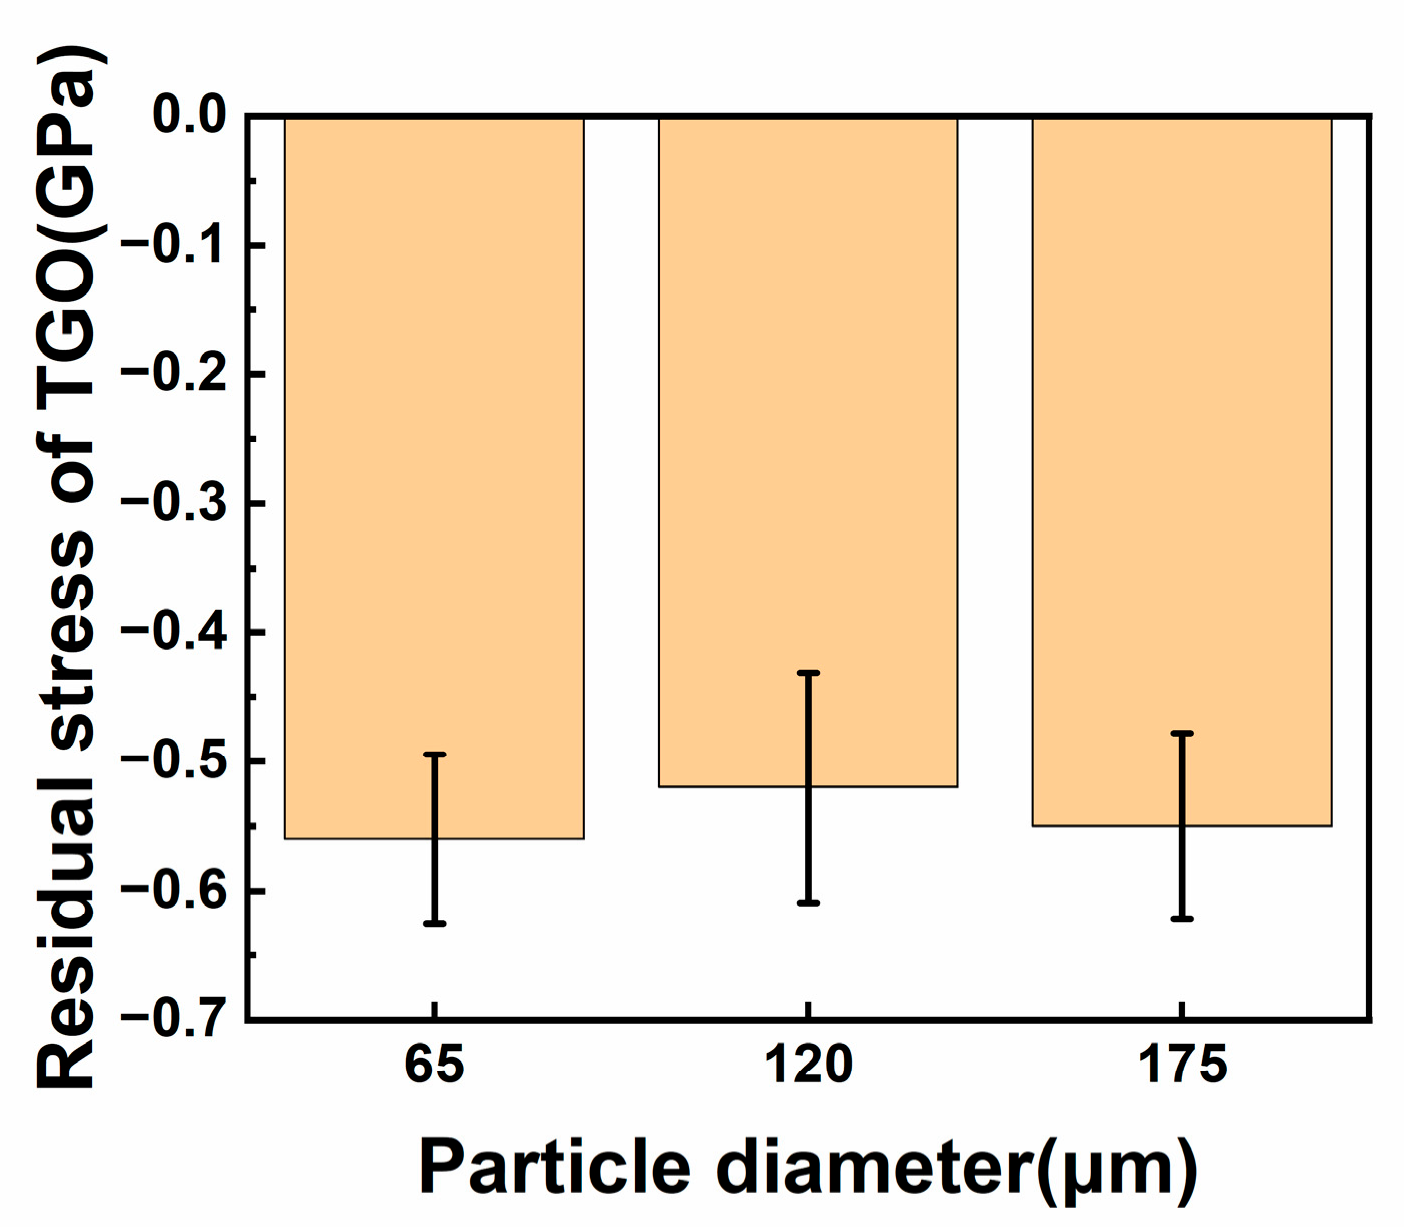
Figure 17 shows the TGO residual stress of different particle sizes after 2 h of erosion. The average TGO residual compressive stress of specimens eroded by 65 μm, 120 μm and 175 μm particles were −0.56 ± 0.07 GPa, −0.52 ± 0.09 GPa and −0.55 ± 0.07 GPa. One-way ANOVA was performed to evaluate inter-group statistical differences, and the result p > 0.05 reveals that abrasive particle size exerted no significant effect on the average residual compressive stress of TGO. The test results indicate that, after 2 h of erosion, there was little difference in the residual stress of the TGO layer under the impact of particles of different sizes. This suggests that particle size does not significantly affect the stress state of the TGO. The reason is that, at this stage, the TGO is still in its early growth phase. The oxide layer is relatively thin, thermal growth stresses are small, and the additional stresses introduced by the impact of particles of different sizes have not yet accumulated significantly.
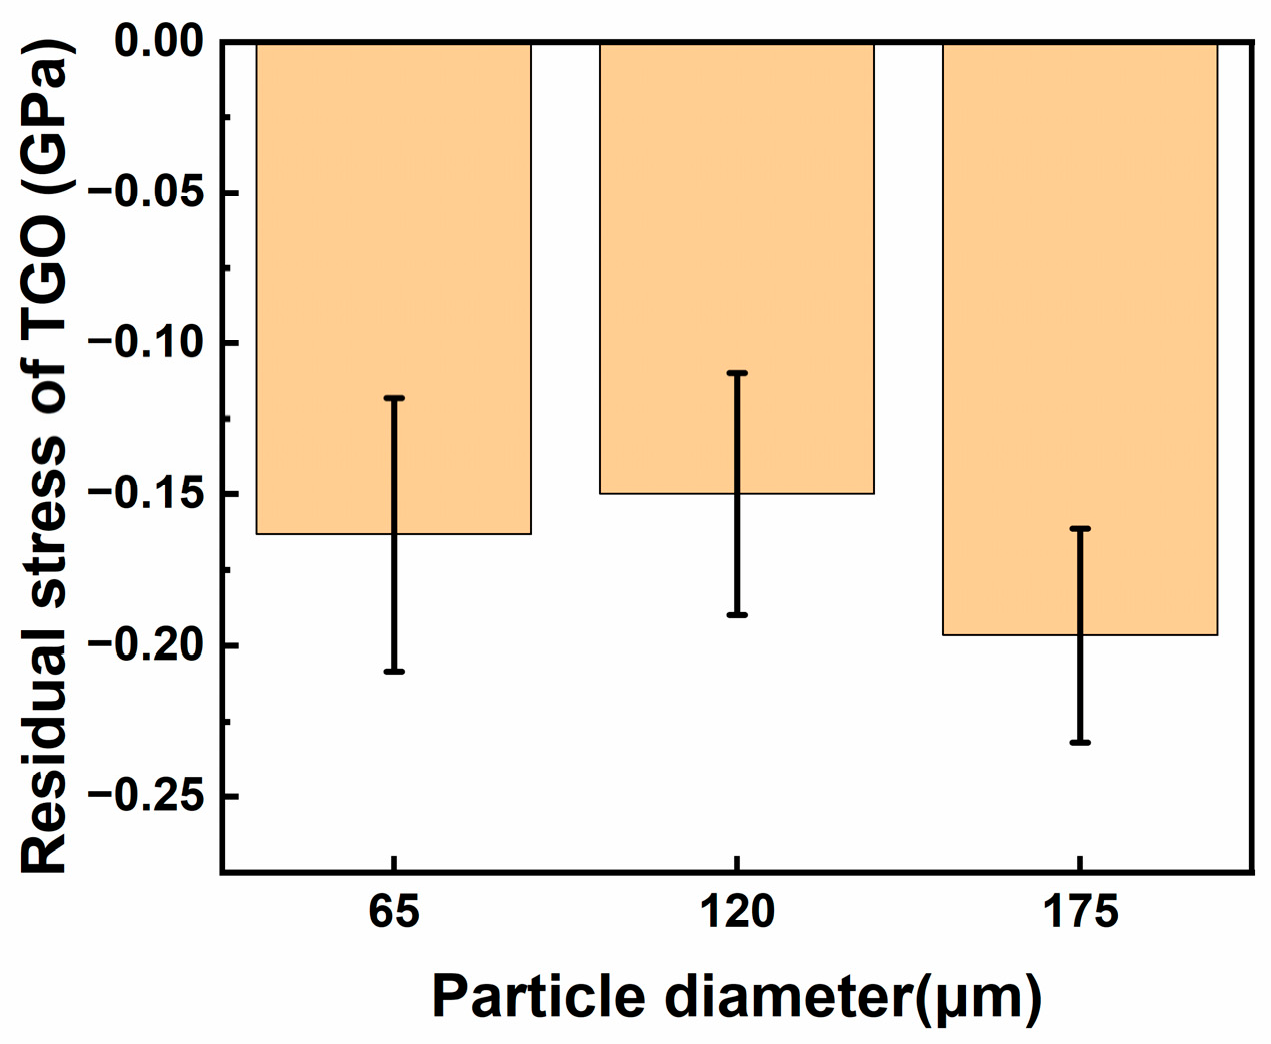
To further elucidate the relationship between the evolution of residual stress in the TGO layer and coating failure, Raman residual stress surface scans were performed on specimens at the coating failure stage. As shown in Figure 18 and Figure 19, the average residual stresses in the TGO layer under erosion conditions with 65 μm, 120 μm, and 175 μm particles were approximately −0.16 GPa, −0.15 GPa, and −0.19 GPa, respectively. Compared to the early stages of erosion, the residual compressive stress in the TGO layer decreased under all three conditions. Local cracking and spalling of the ceramic layer during the failure stage promoted stress redistribution and release, leading to the dissipation of residual stress. Although there were significant differences in erosion lifetimes corresponding to the three particle sizes, the residual stresses in the TGO layer during the failure stage were all at similar levels, indicating that TGO residual stress was not the primary factor determining the differences in erosion lifetimes among the different particle sizes. The differences in lifetimes caused by different particle sizes primarily stemmed from variations in particle impact frequency, contact scale, and material removal rate.
Therefore, although particles of different sizes differed in terms of impact energy and contact mode, their impact on the overall residual stress state of the TGO remained limited, resulting in the residual stresses measured under the three particle size conditions being essentially similar.

4. Discussion

Failure Process and Mechanisms of EB-PVD Thermal Barrier Coating in Simulated Aero-Engine Erosion Environment

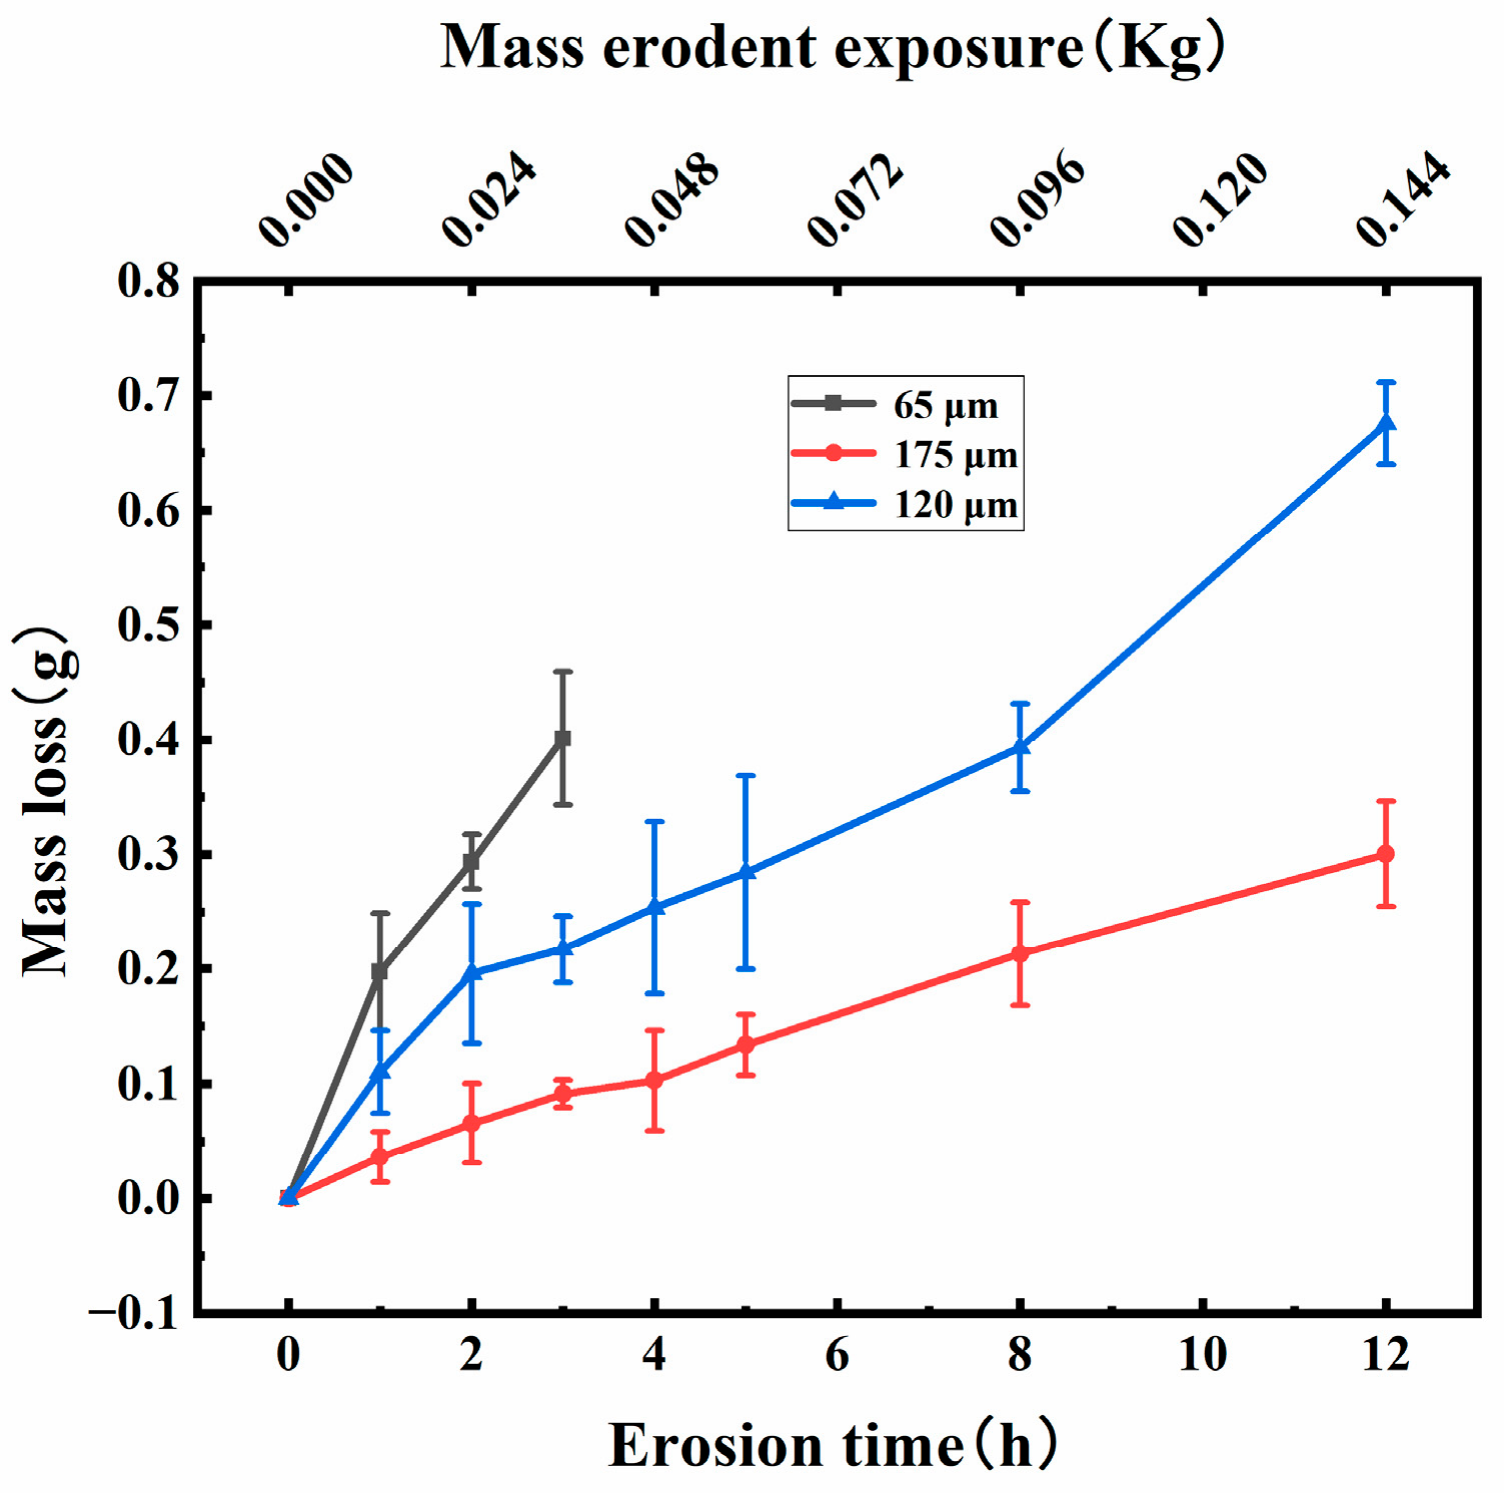
Figure 20 shows the changes in mass loss of the coating samples under combined erosion by high-temperature gas and solid particles at different particle sizes. To facilitate comparison between the particle feeding process and exposure duration, both erosion time and cumulative erodent mass exposure are presented on the x-axis. After 3 h of erosion, the mass loss of specimens eroded by 65 μm is 0.402 g. After 12 h of erosion, the mass loss of specimens eroded by 120 μm and 175 μm alumina particles is 0.678 g and 0.301 g.
The trends in the curves indicate that the coating exhibits different mass loss rates at different particle sizes. At a particle size of 65 μm, the mass loss of the thermal barrier coating is significantly greater than that at 120 μm and 175 μm. Based on the mass loss of the coating and the mass consumption of the eroding particles, and using Equation (4) as a reference, the erosion rates of the coating for the three different particle sizes can be calculated. The coating erosion rates are 10.83 ± 1.10, 4.19 ± 0.11, and 2.05 ± 0.24 g/kg for particle sizes of 65, 120, and 175 μm. The relationship among the erosion rates of the coating for the three particle sizes is 65 μm > 120 μm > 175 μm. This result is consistent with the remaining coating thickness results shown in Figure 15. Figure 21 shows the coating lifespan under erosion conditions with different particle sizes. The coating lifetime is 3 h for the 65 μm particle size, the coating fails after 12 h of erosion for the 120 μm particle size, and the coating lifetime reaches 22 h for the 175 μm particle size. As the particle size increases from 65 μm to 175 μm, the coating lifetime increases from approximately 3 h to 22 h, demonstrating a clear trend of extended lifetime.
To place the present results in context, the measured erosion rates were compared with those reported in previous studies on EB-PVD YSZ thermal barrier coatings. Wellman et al. reported steady-state erosion rates ranging from approximately 11 to 51 g/kg for EB-PVD TBCs tested using 90–125 μm Al2O3 particles at 850 °C and 100 m/s, depending on coating microstructure. More recently, Wang et al. reported an erosion rate of approximately 3.61 g/kg for conventional EB-PVD YSZ coatings tested at 1250 °C under a 0.4 Mach gas flow. The erosion rates obtained in the present study (10.83 ± 1.10, 4.19 ± 0.11, and 2.05 ± 0.24 g/kg) fall within the range reported for EB-PVD YSZ coatings under high-temperature erosion conditions. The observed differences are likely associated with variations in testing temperature, particle size, impact velocity, coating microstructure, and erosion methodology. More importantly, unlike previous studies that mainly focused on coating composition or microstructure, the present work systematically reveals the influence of particle size on erosion behavior under identical mass flow rate and high-temperature conditions, providing new insight into the relationship between particle number flux, damage evolution, and coating failure mechanisms.
Wellman, Nicholls, and others [8,36,37,38,39] proposed using the ratio of the contact footprint diameter to the columnar grain diameter (D/d) to describe the erosion failure mechanism of EB-PVD thermal barrier coatings, where the contact footprint size is typically estimated based on Hertz’s contact theory. Studies have shown that when D/d < 2, near-surface crack propagation is the dominant mechanism. When D/d ranges from 2 to 12, the mechanism is primarily compaction. When the ratio exceeds 12, the mechanism manifests as foreign particle damage. Although the D/d classification proposed by Wellman and Nicholls was originally developed primarily from room-temperature erosion observations, it has been widely adopted as a qualitative framework for interpreting erosion damage in EB-PVD TBCs. Subsequent studies on high-temperature erosion have shown that temperature-dependent deformation, stress relaxation and densification introduce additional damage mechanisms that are not fully captured by the original D/d classification. Therefore, in the present study, the D/d concept is employed only as a qualitative guide for interpreting the observed damage morphology rather than as a rigorous quantitative criterion.
In this study, based on Hertz’s theory of dynamic contact [32,40], the contact scale during the interaction between aluminum oxide particles of different sizes and a thermal barrier coating was estimated. As described in Section 2, the erosion tests were conducted under a calibrated nominal gas-flow condition of Mach 0.4. The actual particle impact velocity was not directly measured in the present work. Owing to the strong gas–particle coupling under the employed erosion conditions, the calibrated nominal gas-flow condition was adopted as the reference condition for Hertzian contact analysis. Therefore, the calculated contact parameters are intended for comparative analysis of particles with different sizes rather than an exact prediction of the actual particle impact conditions. Assuming spherical Al2O3 particles, the maximum Hertzian contact radius can be expressed as Equation (6).
m = 4 3 π R 3 ρ
where m is the particle mass, R is the particle radius, and ρ is the particle density.
According to Hertzian elastic contact theory, the maximum contact radius can be given by Equation (7).
a = ( 15 m v r 2 R 2 16 E ) 1 / 5
where a is the maximum contact radius, m is the particle mass, R is the particle radius, v r is the reference velocity corresponding to the calibrated nominal Mach 0.4 gas-flow condition, and E is the equivalent elastic modulus of the particle/coating system.
The equivalent elastic modulus can be given by Equation (8).
1 E = 1 ν p 2 E P + 1 ν C 2 E C
where E p and ν p are the elastic modulus and Poisson’s ratio of the Al2O3 particles, respectively, while E c and ν c are those of the YSZ top coat.
The corresponding contact footprint diameter is defined as Equation (9).
D = 2 a
In the calculation, the density, elastic modulus, and Poisson’s ratio of Al2O3 particles were taken as 3900 kg m−3, 380 GPa, and 0.22, respectively, whereas the elastic modulus and Poisson’s ratio of the YSZ top coat were assumed to be 60 GPa and 0.23, respectively. Under the calibrated nominal gas-flow Mach 0.4 reference condition, the nominal contact footprint diameters for particles with diameters of 65 μm, 120 μm, and 175 μm were estimated to be approximately 22 μm, 36 μm, and 50 μm, respectively. It should be emphasized that the contact footprint calculated in this study is a nominal comparative parameter estimated under the calibrated gas-flow condition. It is intended to illustrate the relative influence of particle size on the contact characteristics and to provide a theoretical basis for interpreting the observed erosion mechanisms, rather than representing the actual contact footprint under the true particle impact conditions.
The diameter of the EB-PVD YSZ columnar grains ranges from 5 μm to 10 μm; therefore, the ratio of the contact footprint diameter to the columnar grain diameter (D/d) lies between 2 and 12. According to the literature [39], at all three diameters, the coating exhibits compaction damage with densification at the top of the coating and no severe deformation of the coating itself, representing an intermediate transition mechanism between erosion and FOD. The experimental results of this study show good agreement with this theory. However, unlike previous studies, this work further integrates the macroscopic and microscopic morphologies of the coating, as well as the evolution of coating lifespan and mass loss, thereby enriching the erosion failure theory under the particle size effect of EB-PVD thermal barrier coatings when the ratio of contact footprint diameter to columnar grain diameter (D/d) ranges from 2 to 12.
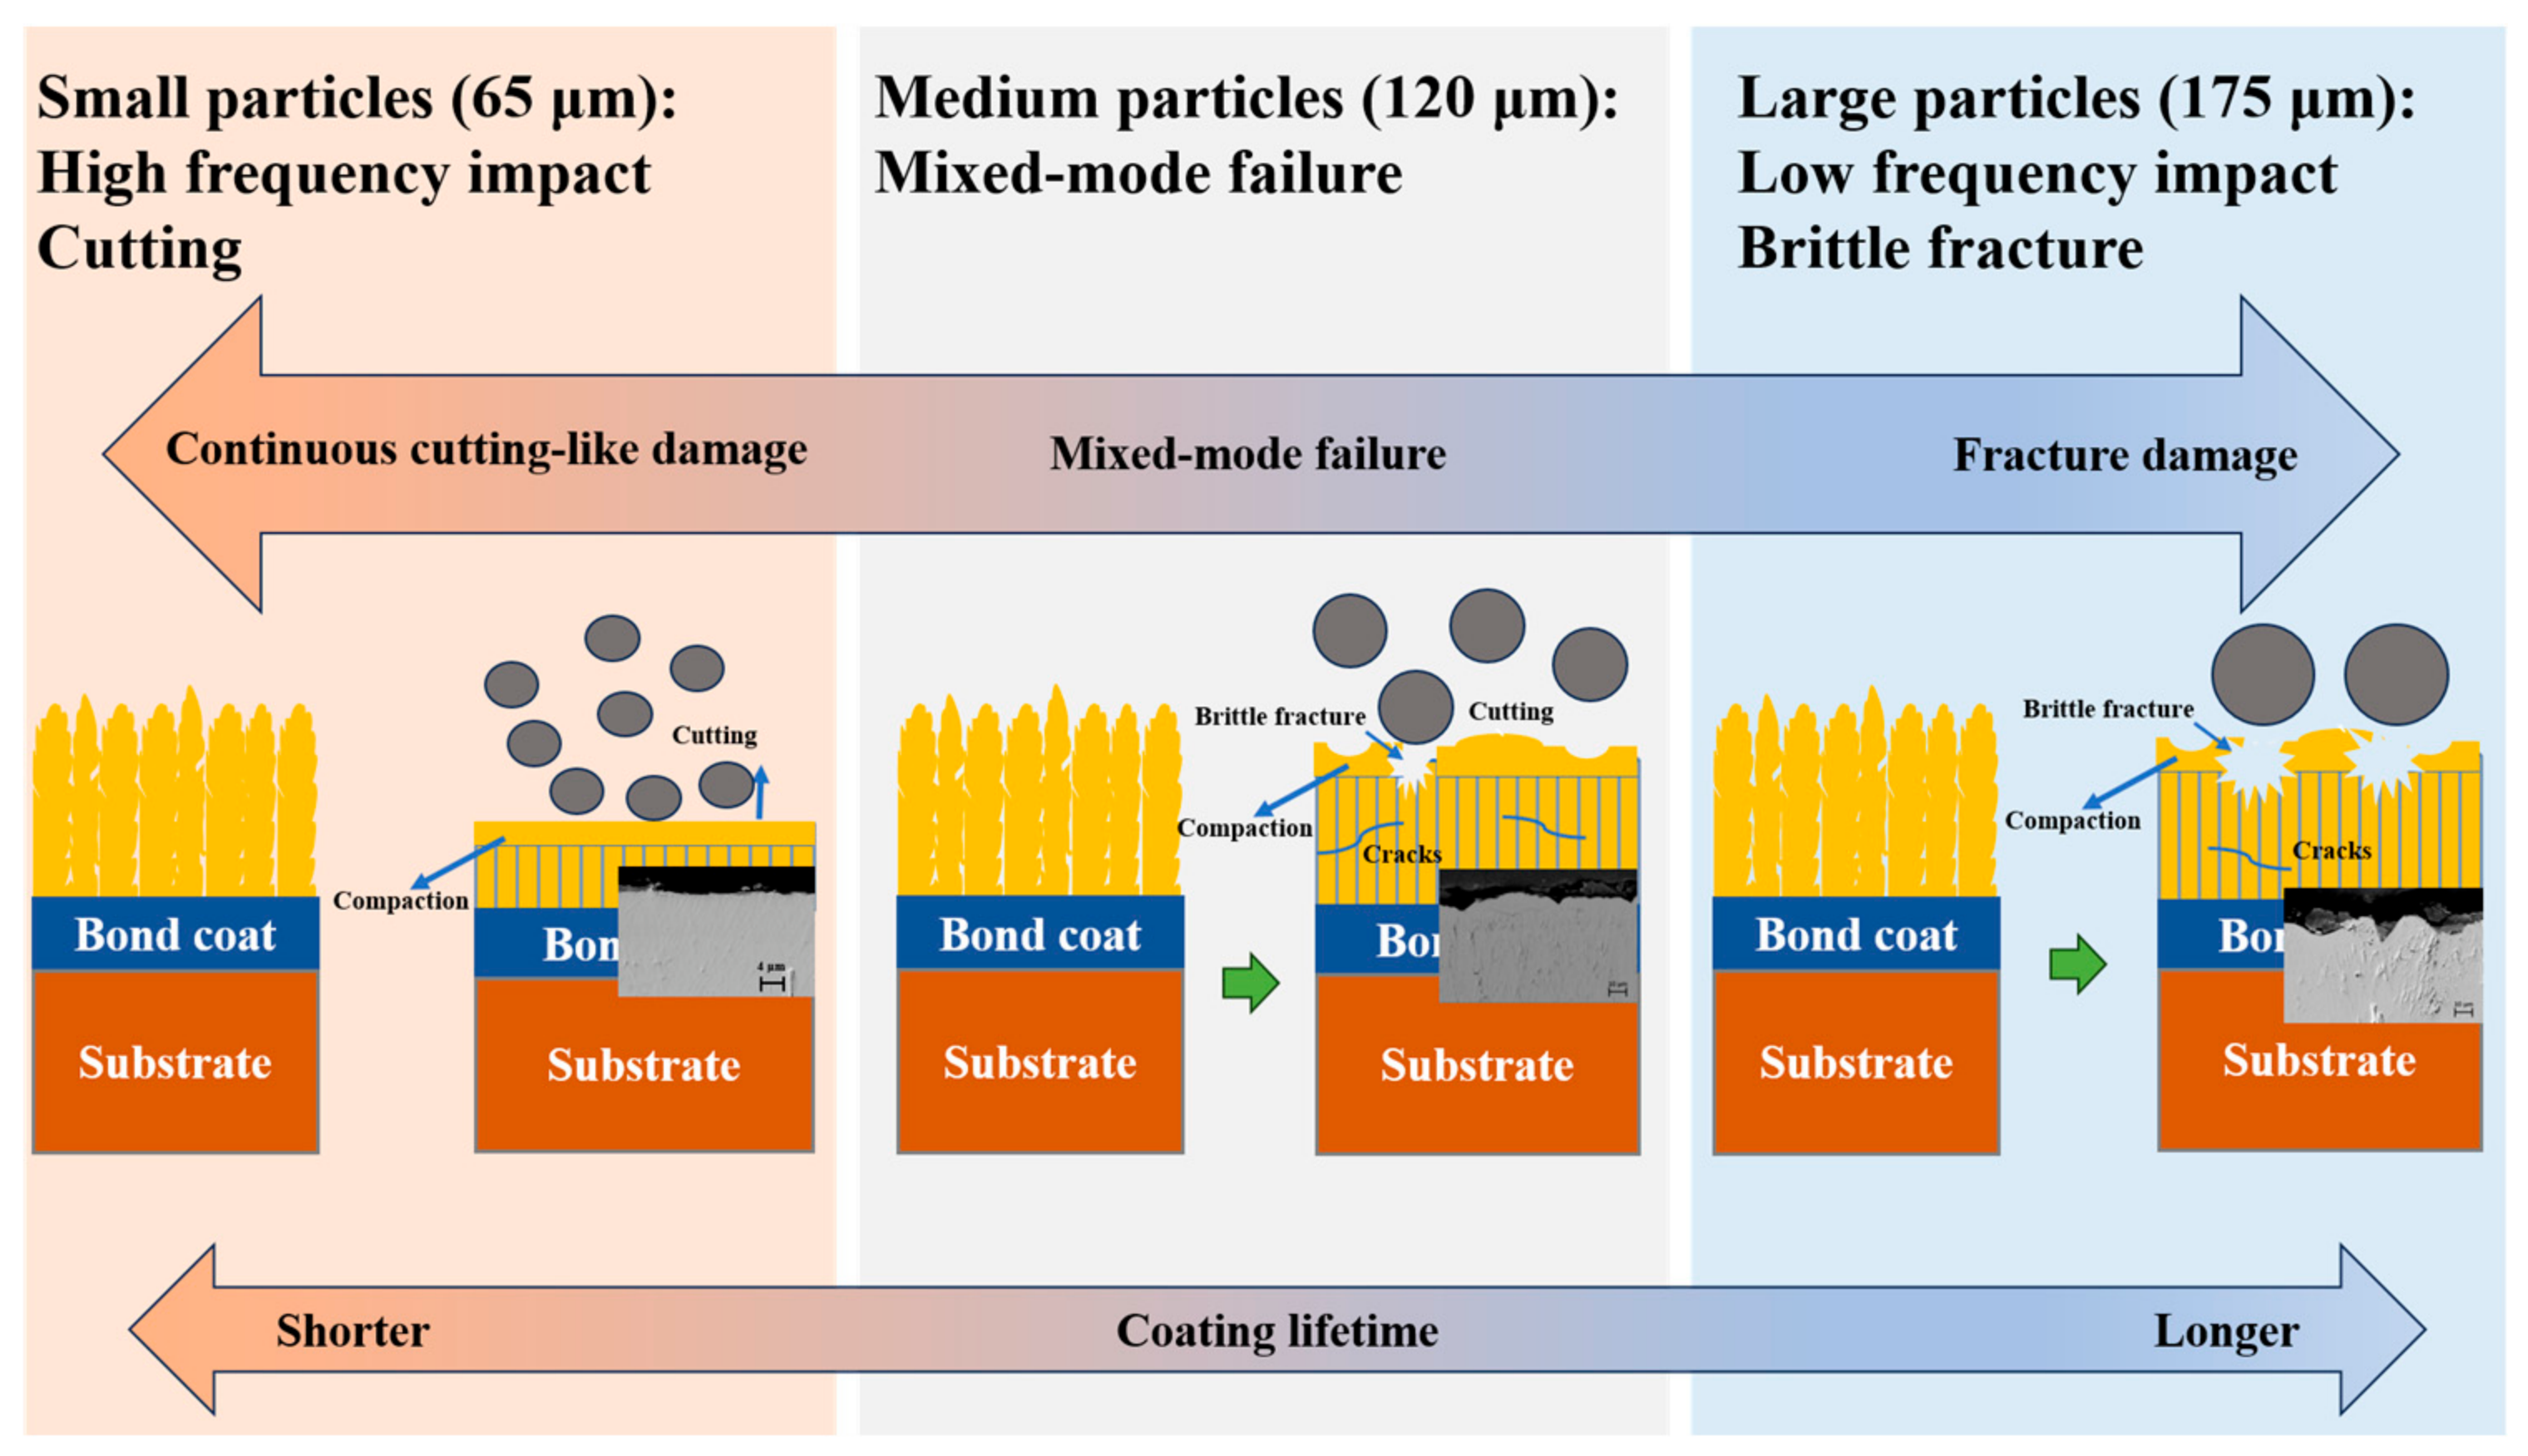
The erosion mechanism determined through the analysis of coating erosion failure is shown in Figure 22. During the erosion process by small-diameter particles of 65 μm, although the energy of a single impact is low, the high particle number density results in a significant increase in the number of particles participating in the impact per unit time under the same mass flow rate, causing the coating surface to continuously endure high-frequency repetitive impacts. Numerous fine particles continuously perform micro-cutting on the tops of columnar crystals, causing the material to be removed layer by layer in a continuous and nearly uninterrupted manner. The damage mechanism of the coating primarily manifests as micro-cutting caused by high-frequency continuous particle impacts. Local penetration of the coating occurs within a short period of time. In contrast, erosion by large-particle impacts manifests more as low-frequency, high-energy localized brittle fracture. Erosion by 120 μm medium-sized particles primarily exhibits a composite damage mechanism involving the combined effects of cutting, compaction, and localized brittle fracture. Under erosion by large 175 μm particles, the effect of localized impact fracture becomes more pronounced; at this point, the coating damage mechanism shifts to one dominated by high-energy impact-induced brittle fracture and localized spalling. Although a single impact can form deep cracks, localized collapse, or even block-like spalling, the relatively small number of particles results in a widely dispersed damage zone. Unlike the continuous, uniform erosion of the entire ceramic-layer thickness caused by high-frequency erosion from small particles, large areas still retain an intact columnar crystal structure. Consequently, the overall material removal rate is relatively low.
This result further illustrates that not only is the erosion life of thermal barrier coatings controlled by the impact energy of individual particles, but also, more importantly, it is closely related to particle number density, impact frequency, and the uniformity of damage distribution across the surface. The high-frequency micro-cutting mechanism caused by small-particle sizes exerts a stronger cumulative damage effect on EB-PVD YSZ thermal barrier coatings, resulting in a shorter coating life. The findings of this study provide important insights for analyzing the failure behavior of thermal barrier coatings caused by particles of different sizes under aeroengine service conditions.
Another possible factor contributing to the reduced erosion damage under large-particle conditions is the particle–particle interaction during the erosion process. Because large particles occupy a greater volume under the same mass flow rate, the number density decreases considerably. Meanwhile, collisions or interference between incoming and rebounding particles may become more significant, resulting in a partial shielding effect that reduces the effective particle flux reaching the coating surface. Although this phenomenon could further contribute to the lower erosion rate observed for the 175 μm particles, the present experimental setup did not directly measure particle trajectories or particle–particle interactions. Therefore, this explanation should be regarded as a possible contributing mechanism rather than definitive evidence.
Particle fragmentation may occur during high-temperature and high-velocity impact. Alumina particles are brittle in nature and may experience fracture or secondary breakage upon collision with the coating surface, leading to the generation of smaller debris. Although particle fragmentation was not directly measured in this study, its potential effect on the effective particle size distribution and local impact conditions should be acknowledged. This may introduce additional complexity in interpreting the relationship between nominal particle size and erosion behavior.

5. Conclusions

Using self-developed multi-factor coupled erosion test equipment, we investigated the influence of particle size on the erosion damage behavior and failure mechanisms of EB-PVD YSZ TBCs, leading to the following conclusions:
(1)
Under erosion by Al2O3 particles of different sizes, the EB-PVD YSZ TBCs exhibited distinctly different damage evolution patterns. As the particle size increased from 65 μm to 175 μm, the coating erosion rate decreased from 10.83 ± 1.10 g/kg to 2.05 ± 0.24 g/kg, and the coating lifespan increased from approximately 3 h to 22 h, demonstrating significantly enhanced erosion resistance.
(2)
Under different particle size conditions, the residual stress in the TGO layer showed little variation after 2 h of erosion. This indicates that, during the early erosion stage, the removal of surface material caused by mechanical impact is the dominant factor affecting coating failure, while the influence of TGO-layer stress on the particle size effect is relatively limited.
(3)
Under erosion by small 65 μm particles, the high particle number density and high impact frequency resulted in coating damage primarily characterized by high-frequency continuous micro-cutting. The tops of the columnar crystals were gradually flattened, ultimately leading to rapid thinning of the ceramic layer and localized penetration failure. Under erosion by medium-sized 120 μm particles, the coating exhibited a composite damage mode involving the combined action of multiple mechanisms. Under erosion by large 175 μm particles, the damage mechanism shifted to primarily high-energy impact-induced brittle fracture and block-like spalling. Although the degree of local damage was high, the overall thinning rate of the ceramic layer was low due to the small number of particles and the discrete nature of the damaged areas; consequently, the coating exhibited a longer service life.
The findings of this study provide valuable guidance for the application of TBCs in practical service environments involving particle erosion.

Author Contributions

Conceptualization, W.Y. and R.M.; methodology, L.H.; software, S.L.; validation, H.C., D.L. and W.Y.; formal analysis, H.C. and X.Z.; data curation, W.Y.; writing—original draft preparation, W.Y. and D.L.; writing—review and editing, W.Y., X.Z. and H.C.; supervision, R.M.; project administration, Liu Delin. All authors have read and agreed to the published version of the manuscript.

Funding

This research was funded by AECC Beijing Institute of Aeronautical Materials under Grant No. KJSJ220543.

Institutional Review Board Statement

Not applicable.

Informed Consent Statement

Not applicable.

Data Availability Statement

The data presented in this study are available on request from the corresponding author.

Conflicts of Interest

The authors declare no conflicts of interest.

References

  1. Mehboob, G.; Liu, M.-J.; Xu, T.; Hussain, S.; Mehboob, G.; Tahir, A. A review on failure mechanism of thermal barrier coatings and strategies to extend their lifetime. Ceram. Int. 2020, 46, 8497–8521. [Google Scholar] [CrossRef] [Scilit]
  2. Chen, L.B. Yttria-stabilized zirconia thermal barrier coatings—A review. Surf. Rev. Lett. 2006, 13, 535–544. [Google Scholar] [CrossRef] [Scilit]
  3. Hua, J.-J.; Zhang, L.-P.; Liu, Z.-W.; Wang, Y.-Z.; Lin, C.-C.; Zeng, Y.; Zheng, X.-B. Progress of research on the failure mechanism of thermal barrier coatings. J. Inorg. Mater. 2012, 27, 680–686. [Google Scholar] [CrossRef] [Scilit]
  4. Li, X.; Zhang, W.; Cai, X. Mechanical evaluation of thermal barrier coatings by indentation: A review. J. Mater. Res. Technol. 2024, 30, 5402–5416. [Google Scholar] [CrossRef] [Scilit]
  5. Li, H.; Yang, S.; Li, X.; Li, W. Failure mechanisms and surface treatment processes of thermal barrier coatings: Review. Chin. J. Aeronaut. 2024, 37, 20–40. [Google Scholar] [CrossRef] [Scilit]
  6. Mahade, S.; Ruelle, C.; Curry, N.; Holmberg, J.; Bjorklund, S.; Markocsan, N.; Nylen, P. Understanding the effect of material composition and microstructural design on the erosion behavior of plasma sprayed thermal barrier coatings. Appl. Surf. Sci. 2019, 488, 170–184. [Google Scholar] [CrossRef] [Scilit]
  7. Zhang, X.-F.; Zhou, K.-S.; Zhang, J.-F.; Han, T.; Song, J.-B.; Liu, M. Erosion failure mechanism and model establishment of thermal barrier coatings based on roughness. J. Inorg. Mater. 2014, 29, 294–300. [Google Scholar] [CrossRef]
  8. Lima, R.S.; Guerreiro, B.M.H.; Aghasibeig, M. Microstructural Characterization and Room-Temperature Erosion Behavior of As-Deposited SPS, EB-PVD and APS YSZ-Based TBCs. J. Therm. Spray Technol. 2018, 28, 223–232. [Google Scholar] [CrossRef] [Scilit]
  9. Prashar, G.; Vasudev, H.; Thakur, L. A comprehensive review on the hot corrosion and erosion performance of thermal barrier coatings. Prot. Met. Phys. Chem. Surf. 2023, 59, 461–492. [Google Scholar] [CrossRef] [Scilit]
  10. Padture, N.P.; Gell, M.; Jordan, E.H. Thermal barrier coatings for gas-turbine engine applications. Science 2002, 296, 280–284. [Google Scholar] [CrossRef] [Scilit] [PubMed]
  11. Yang, L.; Li, H.L.; Zhou, Y.C.; Zhu, W.; Wei, Y.G.; Zhang, J.P. Erosion Failure Mechanism of EB-PVD Thermal Barrier Coatings with Real Morphology. Wear 2017, 392–393, 99–108. [Google Scholar] [CrossRef] [Scilit]
  12. Wellman, R.G.; Nicholls, J.R. Erosion, Corrosion and Erosion–Corrosion of EB PVD Thermal Barrier Coatings. Tribol. Int. 2008, 41, 657–662. [Google Scholar] [CrossRef] [Scilit]
  13. Beake, B.D.; Isern, L.; Zhang, H.; Chalk, C.; Goodes, S.R.; Johnson, D.; Forcen, K.A.; Nicholls, J.R.; Gee, M.G. Damage Mechanisms in Solid Particle Impact and Erosion Testing of Thermal Barrier Coatings. Surf. Coat. Technol. 2025, 517, 132844. [Google Scholar] [CrossRef] [Scilit]
  14. Guo, L.; Li, Y.; Yan, K. Corrosion Behavior of Gd2Zr2O7 Thermal Barrier Coatings under Fe-Containing Environmental Sediment Attack. J. Adv. Ceram. 2024, 13, 447–462. [Google Scholar] [CrossRef] [Scilit]
  15. Presby, M.J.; Stokes, J.L.; Harder, B.J.; Lee, K.N.; Hoffman, L.C. High-Temperature Solid Particle Erosion of Environmental and Thermal Barrier Coatings. Coatings 2023, 13, 902. [Google Scholar] [CrossRef] [Scilit]
  16. Liu, D.; Mu, R.; He, L.; Li, S.; Yang, W. Failure Behaviour of EB-PVD YSZ Thermal Barrier Coatings under Simulated Aero-Engine Operating Conditions. Surf. Coat. Technol. 2023, 474, 130027. [Google Scholar] [CrossRef] [Scilit]
  17. Wang, L.; He, L.; Xu, Z.; Zhang, R.; Mu, R. Erosion Behavior of YSZ, LZC, and LZC/YSZ Double-Ceramic-Layers Thermal Barrier Coatings by EB-PVD under High-Temperature Gas Streams with Entrained Solid Particles. Surf. Interfaces 2026, 87, 109073. [Google Scholar] [CrossRef] [Scilit]
  18. Wang, L.; He, L.; Zhang, R.; Xu, Z.; Mu, R. Particle Erosion Behavior of La2(ZrxCe1−x)2O7/YSZ Double Ceramic Layers TBCs Deposited by Electron Beam-Physical Vapor Deposition. Wear 2025, 566–567, 205763. [Google Scholar] [CrossRef] [Scilit]
  19. Yang, W.; Mu, R.; He, L.; Li, S.; Cai, H.; Liu, D. Failure Mechanisms of EB-PVD Thermal Barrier Coating in Simulated Aero-Engine Erosion Environment. Coatings 2026, 16, 574. [Google Scholar] [CrossRef] [Scilit]
  20. Steinberg, L.; Naraparaju, R.; Heckert, M.; Mikulla, C.; Schulz, U.; Leyens, C. Erosion Behavior of EB-PVD 7YSZ Coatings under Corrosion/Erosion Regime: Effect of TBC Microstructure and the CMAS Chemistry. J. Eur. Ceram. Soc. 2018, 38, 5101–5112. [Google Scholar] [CrossRef] [Scilit]
  21. Schulz, U.; Schmücker, M. Microstructure of ZrO2 thermal barrier coatings applied by EB-PVD. Mater. Sci. Eng. A 2000, 276, 1–8. [Google Scholar] [CrossRef] [Scilit]
  22. Yamaguchi, N.; Wada, K.; Kimura, K.; Matsubara, H. Microstructure modification of yttria-stabilized zirconia layers prepared by EB-PVD. J. Ceram. Soc. Jpn. 2003, 111, 883–889. [Google Scholar] [CrossRef] [Scilit]
  23. Clarke, D.R.; Levi, C.G.; Evans, A.G. Enhanced zirconia thermal barrier coating systems. Proc. Inst. Mech. Eng. Part A J. Power Energy 2006, 220, 85–92. [Google Scholar] [CrossRef] [Scilit]
  24. Chen, W.L.; Wu, H.J.; Liu, M.; Xiao, X.L. Erosion Behavior of PS-PVD Thermal Barrier Coatings and the Effect of Composite Coating (PS-PVD + APS) Thickness. Mater. Sci. Forum 2020, 993, 1095–1103. [Google Scholar] [CrossRef] [Scilit]
  25. Kulkarni, A.A.; Herman, H.; Almer, J.; Lienert, U.; Haeffner, D. Depth-resolved porosity investigation of EB-PVD thermal barrier coatings using high-energy X-rays. J. Am. Ceram. Soc. 2004, 87, 268–274. [Google Scholar] [CrossRef] [Scilit]
  26. Qiu, S.-Y.; Wu, C.-W.; Huang, C.-G.; Ma, Y.; Guo, H.-B. Microstructure dependence of effective thermal conductivity of EB-PVD TBCs. Materials 2021, 14, 1838. [Google Scholar] [CrossRef] [Scilit] [PubMed]
  27. Kumar, N.; Gupta, M.; Mack, D.E.; Mauer, G.; Vassen, R. Columnar thermal barrier coatings produced by different thermal spray processes. J. Therm. Spray Technol. 2021, 30, 1437–1452. [Google Scholar] [CrossRef] [Scilit]
  28. Zhang, B.; Chen, K.; Baddour, N. The effect of interfacial roughness on residual stresses in electron beam-physical vapor deposition of thermal barrier coatings. Coatings 2021, 11, 341. [Google Scholar] [CrossRef] [Scilit]
  29. Chen, Y.; Zhao, X.; Bai, M.; Yang, L.; Li, C.; Wang, L.; Carr, J.A.; Xiao, P. A mechanistic understanding on rumpling of a NiCoCrAlY bond coat for thermal barrier coating applications. Acta Mater. 2017, 128, 31–42. [Google Scholar] [CrossRef] [Scilit]
  30. Wellman, R.G.; Nicholls, J. A mechanism for the erosion of EB PVD TBCs. Mater. Sci. Forum 2001, 369–372, 531–538. [Google Scholar] [CrossRef] [Scilit]
  31. Fleck, N.A.; Zisis, T. The erosion of EB-PVD thermal barrier coatings: The competition between mechanisms. Wear 2010, 268, 1214–1224. [Google Scholar] [CrossRef] [Scilit]
  32. Zhen, Z.; Qu, C.; Fu, D. Characterization of the internal stress evolution of an EB-PVD thermal barrier coating during a long-term thermal cycling. Materials 2023, 16, 2910. [Google Scholar] [CrossRef] [Scilit] [PubMed]
  33. Stein, Z.; Naraparaju, R.; Schulz, U.; Tetard, L.; Raghavan, S. Residual stress effects of CMAS infiltration in high temperature jet engine ceramic coatings captured non-destructively with confocal Raman-based 3D rendering. J. Eur. Ceram. Soc. 2023, 43, 1579–1589. [Google Scholar] [CrossRef] [Scilit]
  34. Tanaka, M.; Hasegawa, M.; Dericioglu, A.F.; Kawawa, Y. Measurement of residual stress in air plasma-sprayed Y233–Z2O2 thermal barrier coating system using micro-Raman spectroscopy. Mater. Sci. Eng. A 2006, 419, 262–268. [Google Scholar] [CrossRef] [Scilit]
  35. Rossmann, L.; Northam, M.; Sarley, B.; Chernova, L.; Viswanathan, V.; Harder, B.; Raghavan, S. Investigation of TGO stress in thermally cycled plasma-spray physical vapor deposition and electron-beam physical vapor deposition thermal barrier coatings via photoluminescence spectroscopy. Surf. Coat. Technol. 2019, 378, 125047. [Google Scholar] [CrossRef] [Scilit]
  36. Wellman, R.G.; Nicholls, J.R.; Murphy, K. Effect of Microstructure and Temperature on the Erosion Rates and Mechanisms of Modified EB PVD TBCs. Wear 2009, 267, 1927–1934. [Google Scholar] [CrossRef] [Scilit]
  37. Wellman, R.G.; Deakin, M.J.; Nicholls, J.R. The Effect of TBC Morphology and Aging on the Erosion Rate of EB-PVD TBCs. Tribol. Int. 2005, 38, 798–804. [Google Scholar] [CrossRef] [Scilit]
  38. Wellman, R.G.; Deakin, M.J.; Nicholls, J.R. The Effect of TBC Morphology on the Erosion Rate of EB PVD TBCs. Wear 2005, 258, 349–356. [Google Scholar] [CrossRef] [Scilit]
  39. Wellman, R.G.; Nicholls, J.R. A Review of the Erosion of Thermal Barrier Coatings. J. Phys. D Appl. Phys. 2007, 40, R293–R305. [Google Scholar] [CrossRef] [Scilit]
  40. Liu, S.B.; Peyronnel, A.; Wang, Q.J.; Keer, L.M. An extension of the Hertz theory for three-dimensional coated bodies. Tribol. Lett. 2005, 18, 303–314. [Google Scholar] [CrossRef] [Scilit]
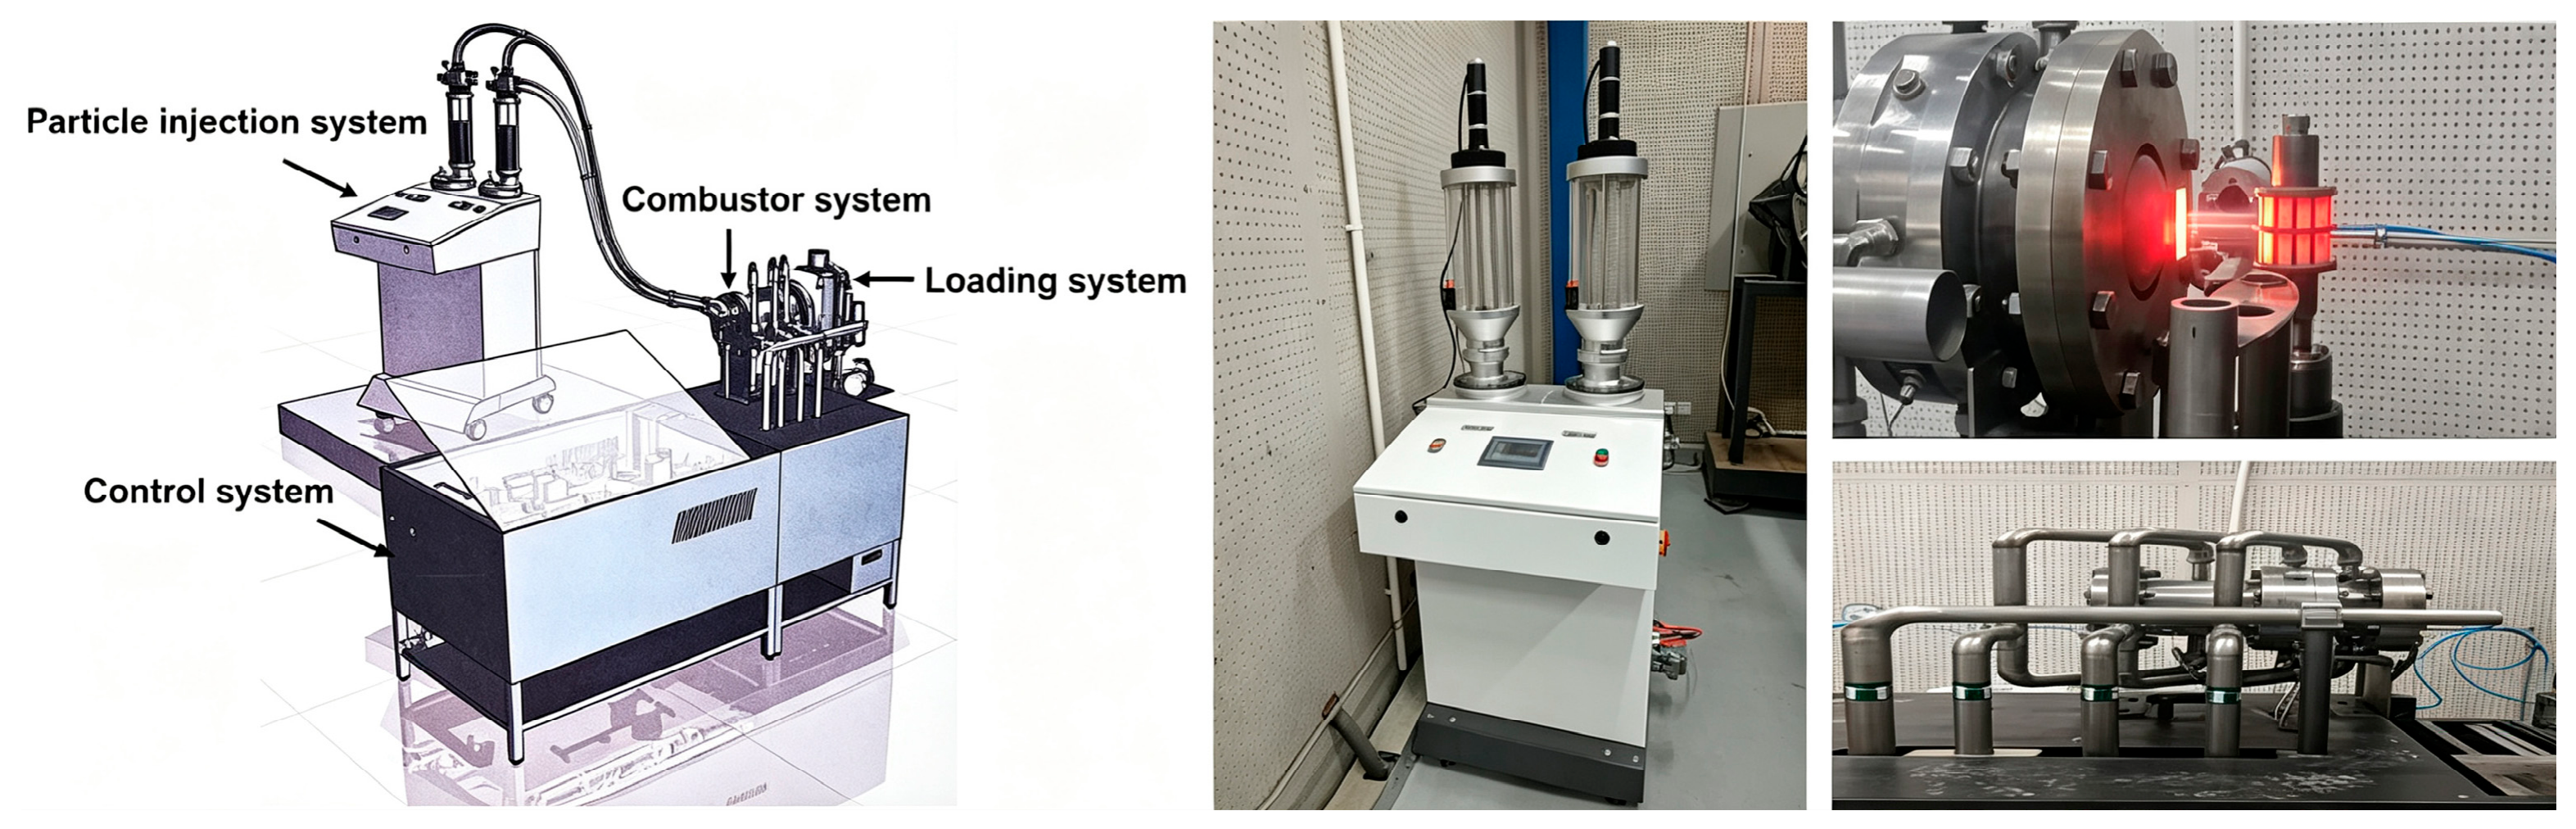
Figure 1. Multi-factor coupled test equipment. Adapted from Ref. [19].
Coatings 16 00852 g001
Figure 2. Macroscopic surface morphology of the thermal barrier coating during erosion at 1150 °C and Mach 0.4 (nominal gas flow): (a) as-deposited TBCs with 175 μm particle size; (b) eroded for 2 h with 175 μm particle size; (c) eroded for 3 h with 175 μm particle size; (d) as-deposited TBCs with 120 μm particle size; (e) 2 h of erosion with 120 μm particles; (f) 3 h of erosion with 120 μm particles; (g) as-deposited TBCs with 65 μm particles; (h) 2 h of erosion with 65 μm particles; (i) 3 h of erosion with 65 μm particles.
Coatings 16 00852 g002
Figure 3. Surface morphology of YSZ thermal barrier coatings after 2 h of erosion at different particle sizes under 1150 °C and Mach 0.4 (nominal gas flow): (a) 175 μm; (b) 120 μm; (c) 65 μm. The scanned area for each image was 10 mm × 10 mm. The height scale is shown by the color bar.
Coatings 16 00852 g003
Figure 4. Surface morphology of deposited YSZ: (a) overview morphology; (b) cauliflower-like surface morphology; (c) pyramidal tops of columnar crystals morphology.
Coatings 16 00852 g004
Figure 5. Surface morphology of TBCs after 2 h of erosion with 175 μm particles at 1150 °C and Mach 0.4 (nominal gas flow): (a) low-magnification SEM image; (b) high-magnification SEM image.
Coatings 16 00852 g005
Figure 6. Composition distribution on the surface of TBCs after 2 h of erosion with 175 μm particles at 1150 °C and Mach 0.4 (nominal gas flow): (a) SEM image; (b) Zr (orange); (c) Al (cyan); (d) O (green); (e) Y (green).
Coatings 16 00852 g006
Figure 7. Surface morphology of TBCs after 2 h of erosion with 120 μm particles at 1150 °C and Mach 0.4: (a) low-magnification SEM image; (b) high-magnification SEM image.
Coatings 16 00852 g007
Figure 8. Composition distribution on the surface of TBCs after 2 h of erosion with 120 μm particles at 1150 °C and Mach 0.4 (nominal gas flow): (a) SEM image; (b) Zr (orange); (c) Al (cyan); (d) O (green); (e) Y (green).
Coatings 16 00852 g008
Figure 9. Surface morphology of TBCs after 2 h of erosion with 65 μm particles at 1150 °C and Mach 0.4: (a) low-magnification SEM image; (b) high-magnification SEM image.
Coatings 16 00852 g009
Figure 10. Composition distribution on the surface of TBCs after 2 h of erosion with 65 μm particles at 1150 °C and Mach 0.4 (nominal gas flow): (a) SEM image; (b) Zr (orange); (c) Al (cyan); (d) O (green); (e) Y (green); (f) Ni (yellow); (g) Cr (yellow).
Coatings 16 00852 g010
Figure 11. Composition distribution on the surface of TBCs after 3 h of erosion with different particle sizes at 1150 °C and Mach 0.4 (nominal gas flow): (a) 65 μm; (b) 120 μm; (c) 175 μm. (a-1/b-1/c-1) are SEM morphology images. Element mapping color definition: Al (cyan, a-2/b-3/c-3), Ni (yellow, a-3), Zr (orange-brown, a-4/b-2/c-2), Cr (yellow, a-5), Co (brown, a-6).
Coatings 16 00852 g011
Figure 12. Cross-sectional microstructure of the deposited thermal barrier coating: (a) overall view; (b) feather-like structure.
Coatings 16 00852 g012
Figure 13. Cross-sectional morphology of TBCs after 2 h of erosion at different particle sizes under 1150 °C and Mach 0.4 (nominal gas flow): (a,b) 65 μm particle size; (c,d) 120 μm particle size; (e,f) 175 μm particle size.
Coatings 16 00852 g013
Figure 14. Cross-sectional morphology of TBCs after 3 h of erosion at different particle sizes under 1150 °C and Mach 0.4 (nominal gas flow): (a) 65 μm; (b) 120 μm; (c) 175 μm.
Coatings 16 00852 g014
Figure 15. Remaining thickness of TBCs after different erosion durations at 1150 °C and Mach 0.4 (nominal gas flow).
Coatings 16 00852 g015
Figure 16. Stress distribution contour map within 1 mm × 1 mm area of different particle sizes after 2 h of erosion: (a) 65 μm; (b) 120 μm; (c) 175 μm. The color bar represents residual stress (GPa).
Coatings 16 00852 g016
Figure 17. TGO residual stress of different particle sizes after 2 h of erosion at 1150 °C and Mach 0.4 (nominal gas flow).
Coatings 16 00852 g017
Figure 18. Stress distribution contour map within 1 mm × 1 mm area of different particle sizes at the coating failure stage: (a) 65 μm; (b) 120 μm; (c) 175 μm. The color bar represents residual stress (GPa).
Coatings 16 00852 g018
Figure 19. TGO residual stress of different particle sizes at the coating failure stage under 1150 °C and Mach 0.4 (nominal gas flow).
Coatings 16 00852 g019
Figure 20. Mass loss evolution of TBCs during erosion under different particle sizes at 1150 °C and Mach 0.4 (nominal gas flow). The lower x-axis represents erosion time, while the upper x-axis indicates the corresponding cumulative erodent mass exposure.
Coatings 16 00852 g020
Figure 21. Erosion lifetime of EB-PVD YSZ TBCs under different particle sizes at 1150 °C and Mach 0.4 (nominal gas flow).
Coatings 16 00852 g021
Figure 22. Schematic illustration of the erosion damage and failure mechanisms of EB-PVD YSZ TBCs under different particle sizes at 1150 °C and Mach 0.4 (nominal gas flow).
Coatings 16 00852 g022
Table 1. The chemical compositions of DD6 and NiCoCrAlYHf (mass fraction/%). “Bal.” indicates that Ni constitutes the remaining composition required to reach 100 wt.%. Reproduced from Ref. [19].
SampleNiCoCrAlYHfWTaRe
DD6Bal.8.5–9.53.8–4.85.2–6.2--7.0–9.06.0–8.51.6–2.4
NiCoCrAlYHf coatingBal.10.0–15.018.0–23.08.0–12.00.1–0.50.2–0.6---
Table 2. Particle size distribution parameters of alumina erosion particles.
Nominal Size (μm)D10 (μm)D50 (μm)D90 (μm)Span
6545.262.682.10.59
12085.3123.8150.20.52
175130.2171.4215.30.50
Disclaimer/Publisher’s Note: The statements, opinions and data contained in all publications are solely those of the individual author(s) and contributor(s) and not of MDPI and/or the editor(s). MDPI and/or the editor(s) disclaim responsibility for any injury to people or property resulting from any ideas, methods, instructions or products referred to in the content.