4.1. Roughness Modeling and Statistical Significance
Data Acquisition: A comprehensive surface roughness dataset was obtained, covering a broad range of cutting regimes based on a Full Factorial Design of 150 experimental runs, each replicated seven times to ensure statistical reliability.
Machinability: The results confirm that the Ra values fall within the fine precision class (below 1.6 µm). This indicates the excellent machinability of the Al 7136-T76511 alloy, characteristic of aluminum alloys processed under High-Speed Machining (HSM) conditions.
Predictive Modeling: A Multiple Regression Model was developed to express the arithmetic mean roughness (Ra) as a function of the machining parameters.
Goodness-of-Fit: The model’s accuracy was validated by a high coefficient of determination (R2), demonstrating that the model reliably accounts for the observed roughness variability.
Statistical Significance: The Analysis of Variance (ANOVA) confirmed the statistical significance of the factors (p < 0.05) in their influence on Ra.
Factor Influence: It was demonstrated that Cutting Speed is the dominant factor, accounting for over 80% of the total roughness variation (
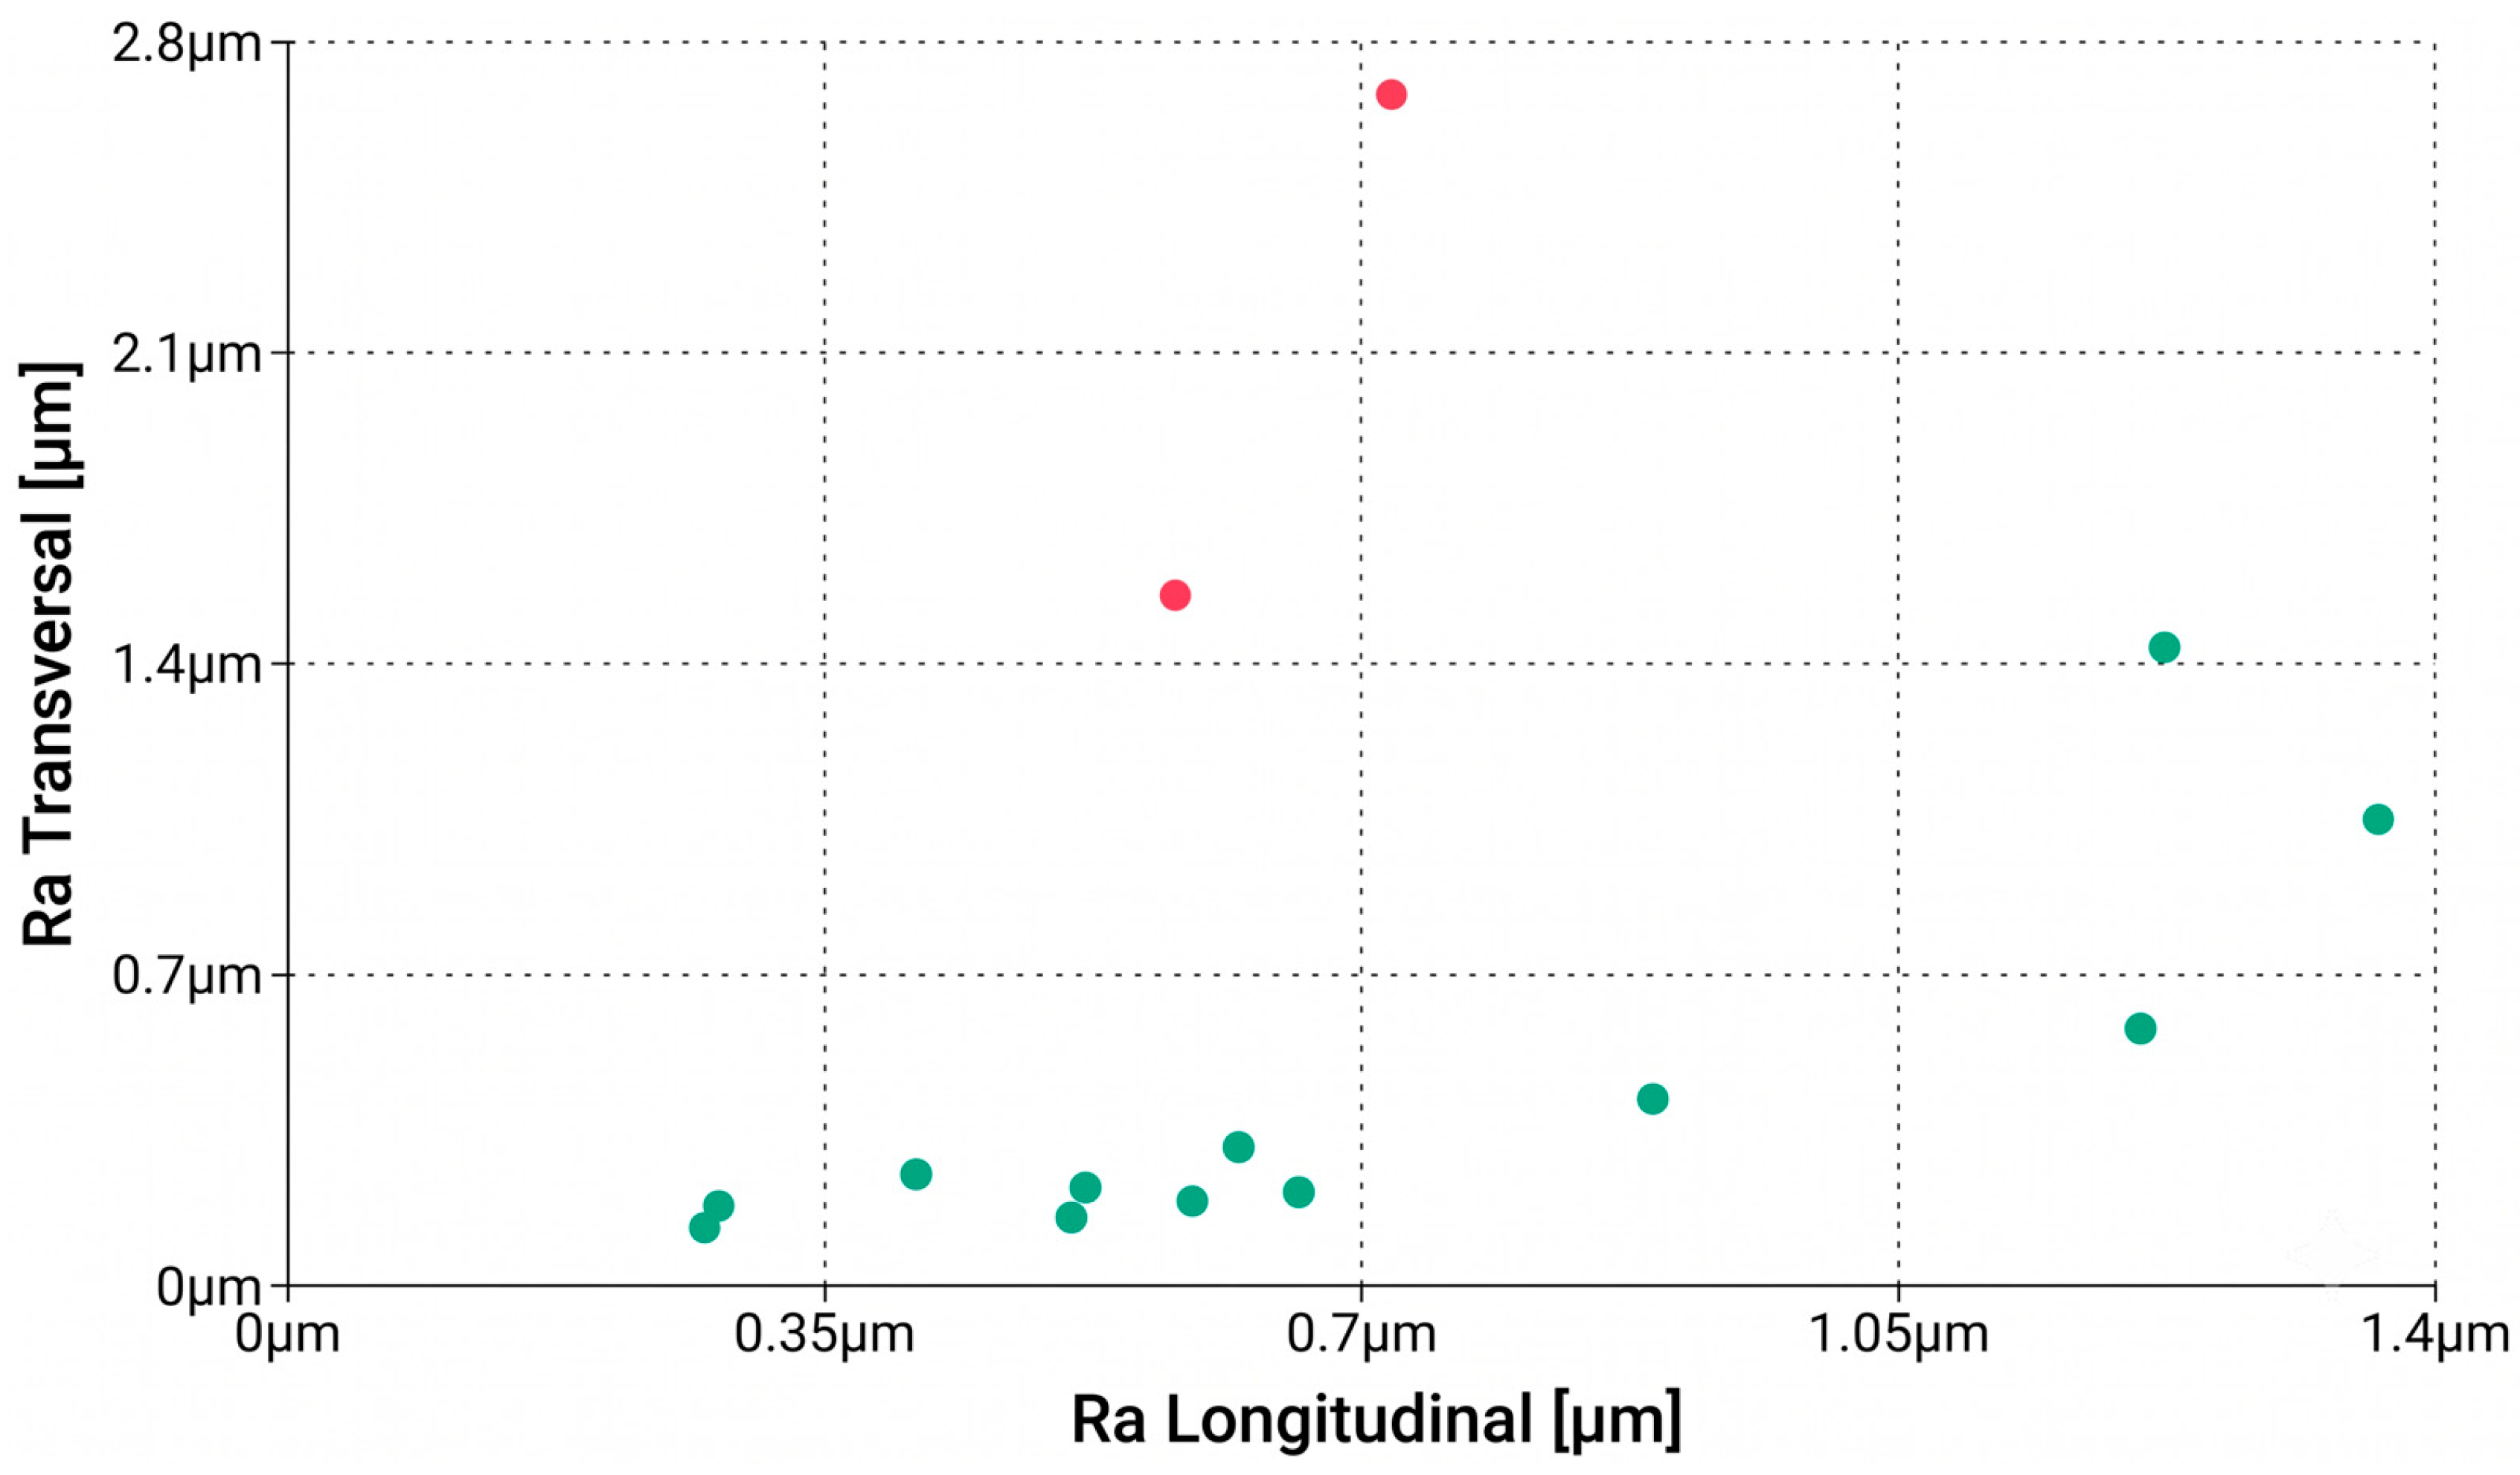
Table 4). This finding contradicts hypotheses specific to low-speed milling (
vc), where feed per tooth (
fz) is typically the primary determinant. In this HSM study, the feed per tooth (
fz) and axial depth of cut (ap) exerted a significantly lower influence.
Based on the experimental data, the mathematical models expressing the relationship between cutting parameters (where A is cutting speed, B is depth of cut, and C is feed per tooth), and surface roughness were established as follows:
Equation (1) (Longitudinal Ra):
Equation (2) (Transversal Ra):
It should be noted that the regression coefficients in Equations (1) and (2) exhibit significant variations in their numerical magnitude. This behavior is a direct consequence of establishing the empirical framework in natural, un-coded engineering scales. Because the physical operational windows of the input variables differ by several orders of magnitude—specifically, the cutting speed A operates at high values (400 ≤ vc ≤ 710 m/min) while the feed per tooth C is a fractional setting (0.04 ≤ fz ≤ 0.18 mm/tooth)—the model automatically adjusts the coefficient scales to preserve strict dimensional homogeneity and mathematical accuracy.
4.2. Trend Evaluation and Identification of the Optimal Regime
The general trend observed is that an increase in cutting speed (vc) led to a decrease in Ra. This phenomenon is attributed to the thermal and mechanical stabilization of the process under HSM (High-Speed Machining) conditions, where cutting forces and friction between the chip and the machined surface are reduced, thereby minimizing the formation of a Built-Up Edge (BUE).
To provide comprehensive statistical validation for the multiple regression equations, full Analysis of Variance (ANOVA) was executed at a 95% confidence level (α = 0.05).
Table 4 and
Table 5 deliver the exhaustive breakdown of the degrees of freedom (DF), adjusted sum of squares (Adj SS), adjusted mean squares (Adj MS), sequential F-statistical values, and individual
p-values for the longitudinal and transversal parameters, respectively:
As demonstrated by the exhaustive statistics in
Table 4 and
Table 5, all individual high-order interaction components achieve critical significance thresholds (
p ≤ 0.001), mathematically justifying their inclusion in the final natural-scale modeling equations (Equations (1) and (2)).
To formally assess the predictive accuracy of the generated empirical models outside the primary training dataset, 5 independent confirmatory cutting runs were executed at random parameters. The verification matrix compares the empirical profilometric values against the values calculated via Equations (1) and (2):
The evaluation yields a Mean Absolute Error (MAE) of 7.01% for the confirmation data grid, establishing acceptable mathematical stability for mapping the global surface topography trends.
In evaluating the overarching statistical architecture of the developed regression models, certain boundary conditions inherited from the foundational database configuration must be explicitly delineated. These mathematical equations represent the empirical screening response surfaces established and derived from the primary author’s published open-access doctoral research monograph [
22]. Within the operational parameters of that baseline setup, the multi-variable mathematical matrices were computed using natural, un-coded physical units with standard residual pooling. Consequently, separate Lack-of-Fit tests, Adjusted
R2 and Predicted
R2 values, and formal residual diagnostic loops (such as homoscedasticity and error independence tracking) were not partitioned within the baseline screening matrix, representing an intrinsic limitation of the untransformed dataset. However, to ensure rigorous statistical transparency and fully satisfy academic validation requirements, the comprehensive Analysis of Variance (ANOVA) arrays have been fully integrated in
Table 4 and
Table 5, demonstrating that all high-order interaction terms achieve critical significance thresholds (
p ≤ 0.001). Furthermore, the empirical framework has been successfully validated against an independent verification dataset (
Table 6), yielding a robust Mean Absolute Error (MAE) of 7.01%. This confirmation phase mathematically safeguards the predictability and consistency of the current models as a reliable macro-topographical substrate mapping framework.
The specific set of parameters that yielded the lowest average roughness, indicating excellent surface quality, was identified (
Table 7).
4.4. Critical Analysis of Anomalies (Dynamic Instability)
Within the unstable resonance zone (
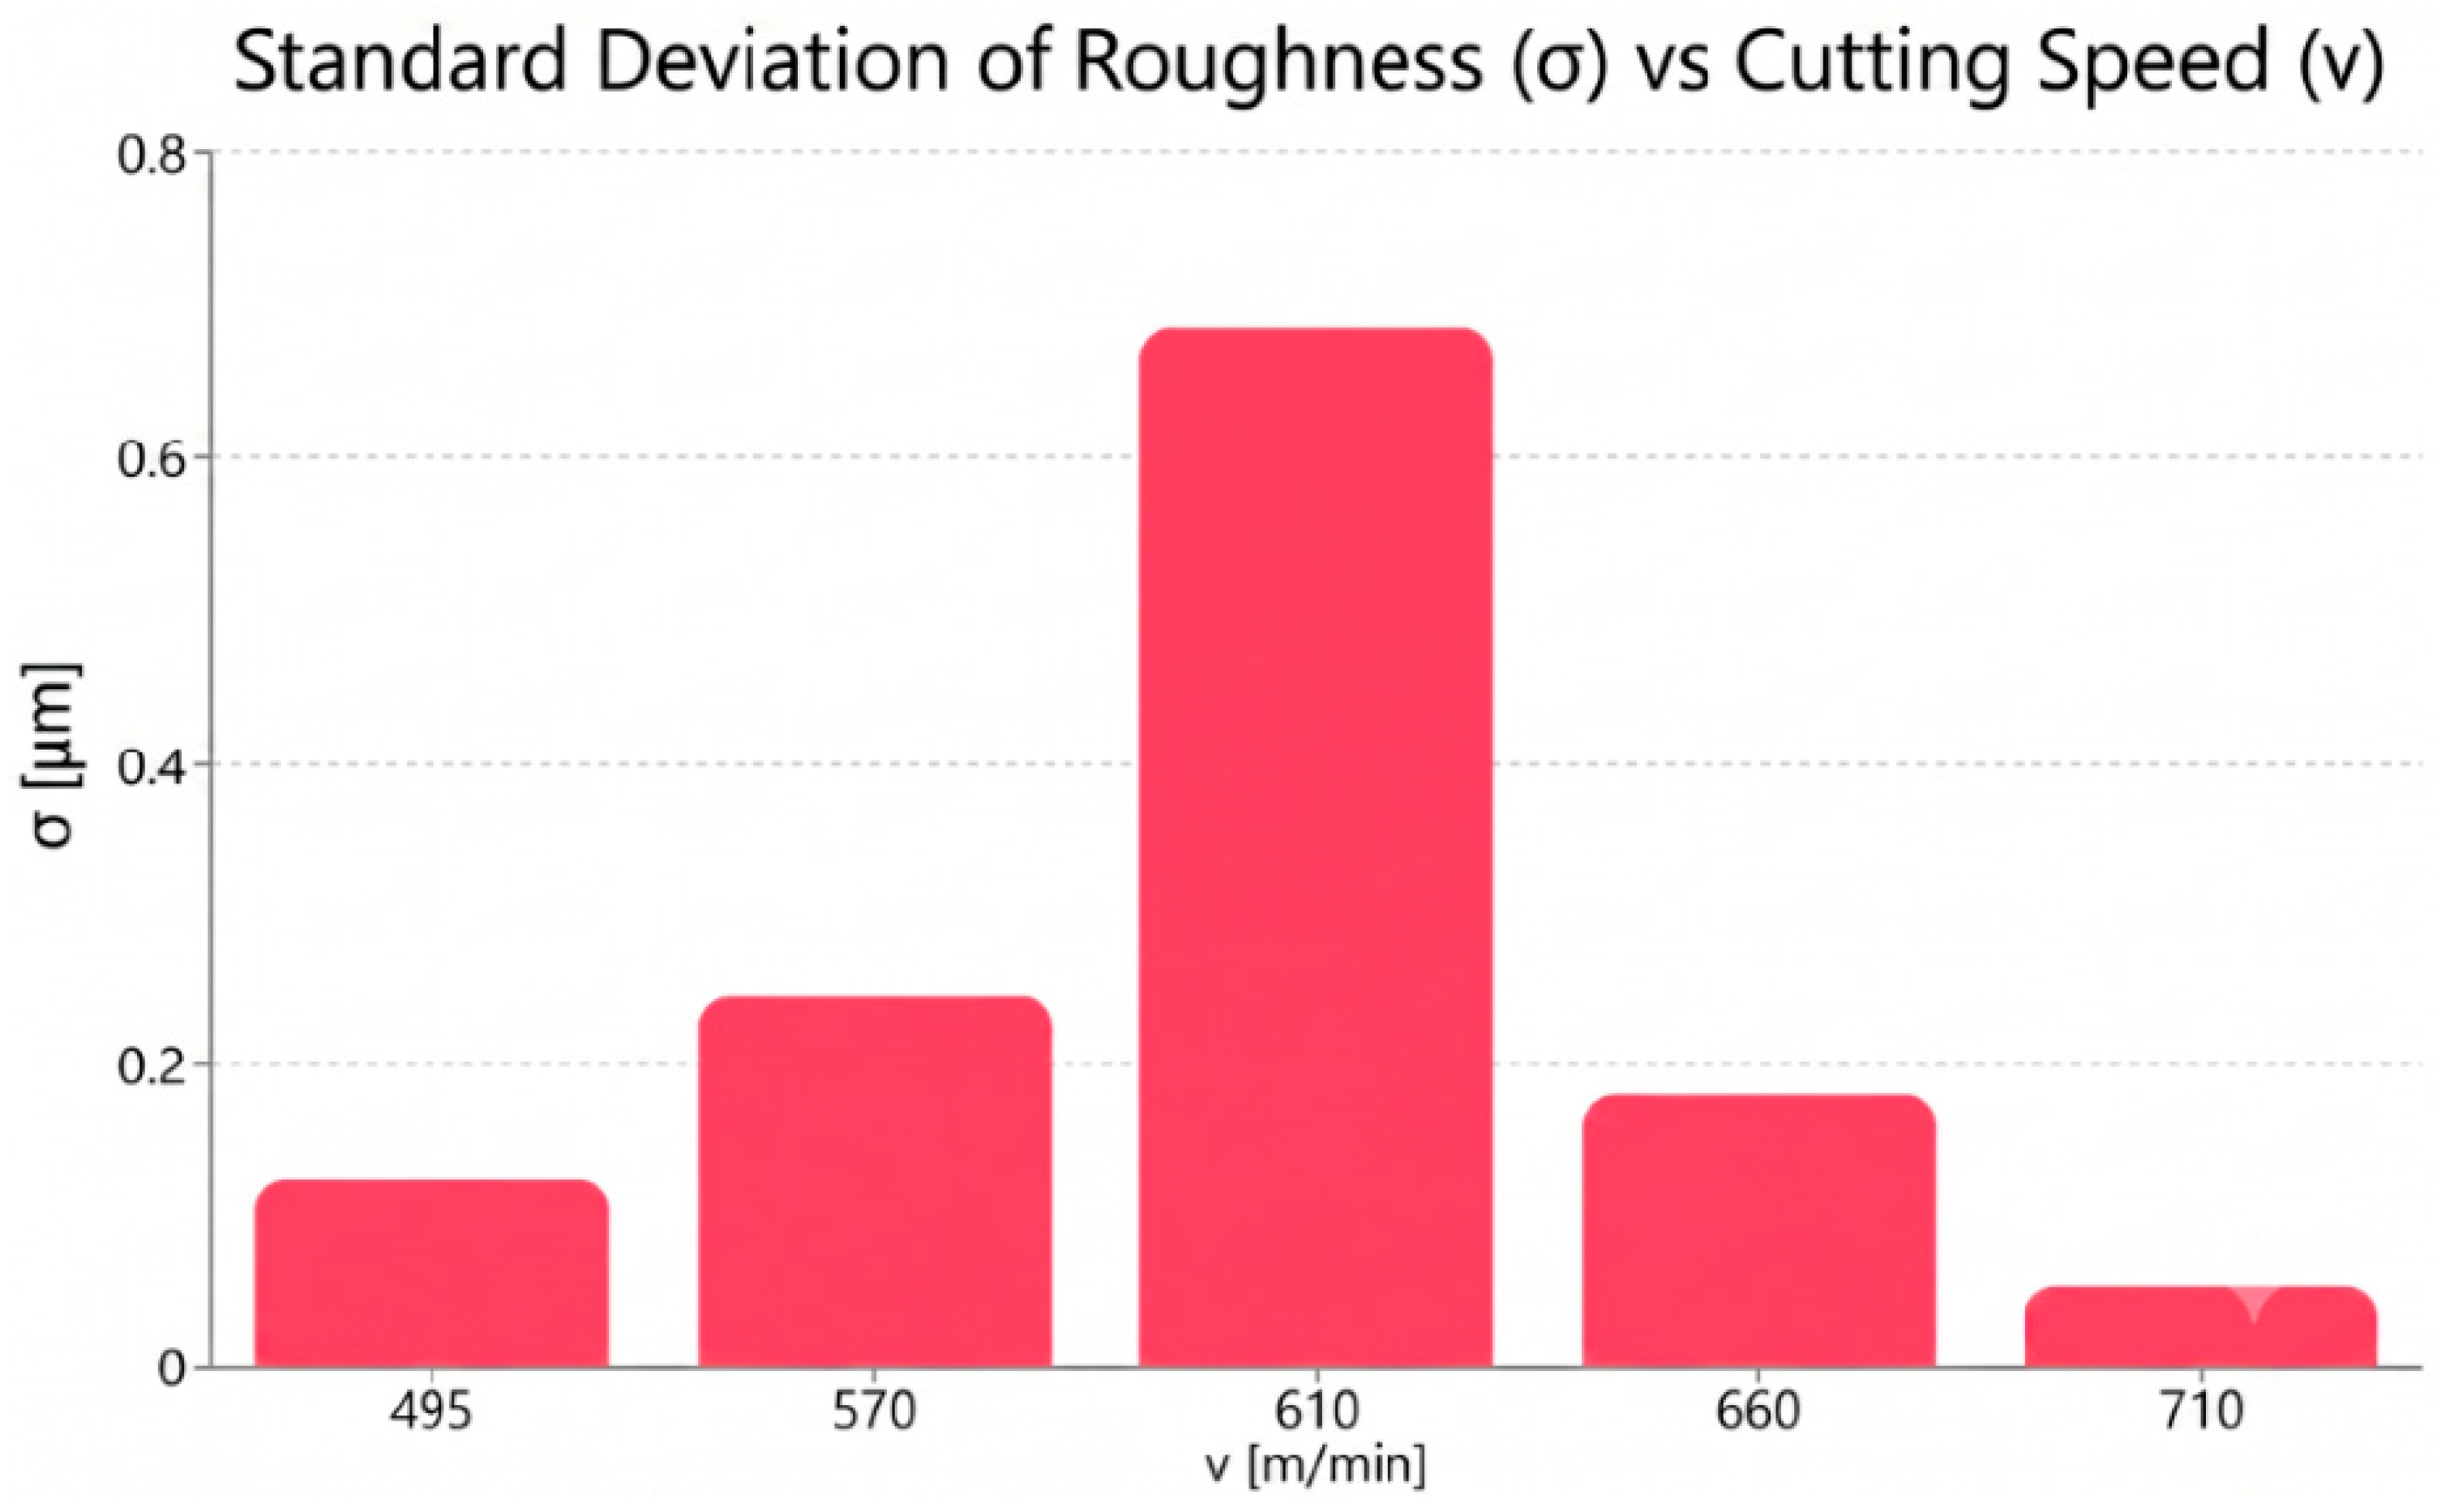
vc = 570–610 m/min), the severe increase in standard deviation (from
σ = 0.051 µm in the stable regime to
σ = 0.112 µm) and the prominent transversal roughness peaks (up to 2.7 µm) statistically demonstrate a highly unpredictable process. Based on machining dynamics theory, such a massive rise in process noise is a strong mathematical indicator of chatter. According to literature models (e.g., refs. [
24,
30,
33]), these severe cyclic vibrations are highly prone to inducing sub-surface damage, including localized tensile residual stresses and micro-fissures. While direct microstructural quantification via SEM or XRD was not conducted in this phase of the work, our macro-topographical data (high
σ and anisotropy) act as reliable prognostic precursors for these underground geometric and structural defects.
As rightly pointed out by manufacturing dynamics, the critical chatter zone (570–610 m/min) identified in this research is fundamentally a function of the specific machine-tool structural stiffness and clamping rigidity. In the absence of experimental modal extraction or transfer function data, these exact velocity boundaries must be interpreted as system-specific parameters rather than absolute universal constraints. If the same Al 7136 alloy is machined on a machining center possessing a significantly higher or lower static and dynamic stiffness profile, the resonance peak may shift to a different velocity coordinate.
Nevertheless, the true generalizability of this study lies in the validation of the predictive methodology itself: establishing that tracking the roughness standard deviation (σ) allows engineers to map and isolate sub-surface coating vulnerabilities, independent of where the specific stiffness-induced chatter marks occur in the velocity space.
From an industrial shop-floor perspective, while navigating completely outside this dynamic instability window is highly recommended, an absolute restriction may prove impractical under rigid production constraints. In scenarios where operating within this priority avoidance zone (570–610 m/min) is non-negotiable, specific mechanical and technological mitigation strategies must be deployed to safeguard the substrate’s structural integrity:
Tool Geometry Optimization: Utilizing advanced end mills engineered with variable helix angles and asymmetrical tooth pitches effectively disrupts the regenerative phase feedback loop, suppressing the harmonic amplification of chatter waves.
Dynamic Damping: Implementing specialized hydraulic tool holders or tuned mass dampers within the technological fixture system to absorb high-frequency chatter harmonics and shrink the standard deviation.
Surface Stratum Remediation: Prescribing a compulsory post-milling micro-finishing, automated polishing, or chemical milling pass. This targeted secondary operation physically shaves off the undulating ‘chatter marks’ and eliminates the defect-prone Surface Stratum Deformation (SSD) layer, restoring a geometrically uniform substrate profile optimized for successful anodization.
While direct sub-surface microstructural quantification via SEM, EBSD, or XRD was not performed during this experimental phase, our macro-topographical data (high σ and severe surface anisotropy) act as reliable spatial precursors for these anomalies. According to established manufacturing models, high-amplitude chatter undulations are strongly correlated with localized tensile residual stresses and micro-fissures within the Surface Stratum Deformation (SSD) layer, which are treated herein as inferred structural risks to be directly mapped in future validations.
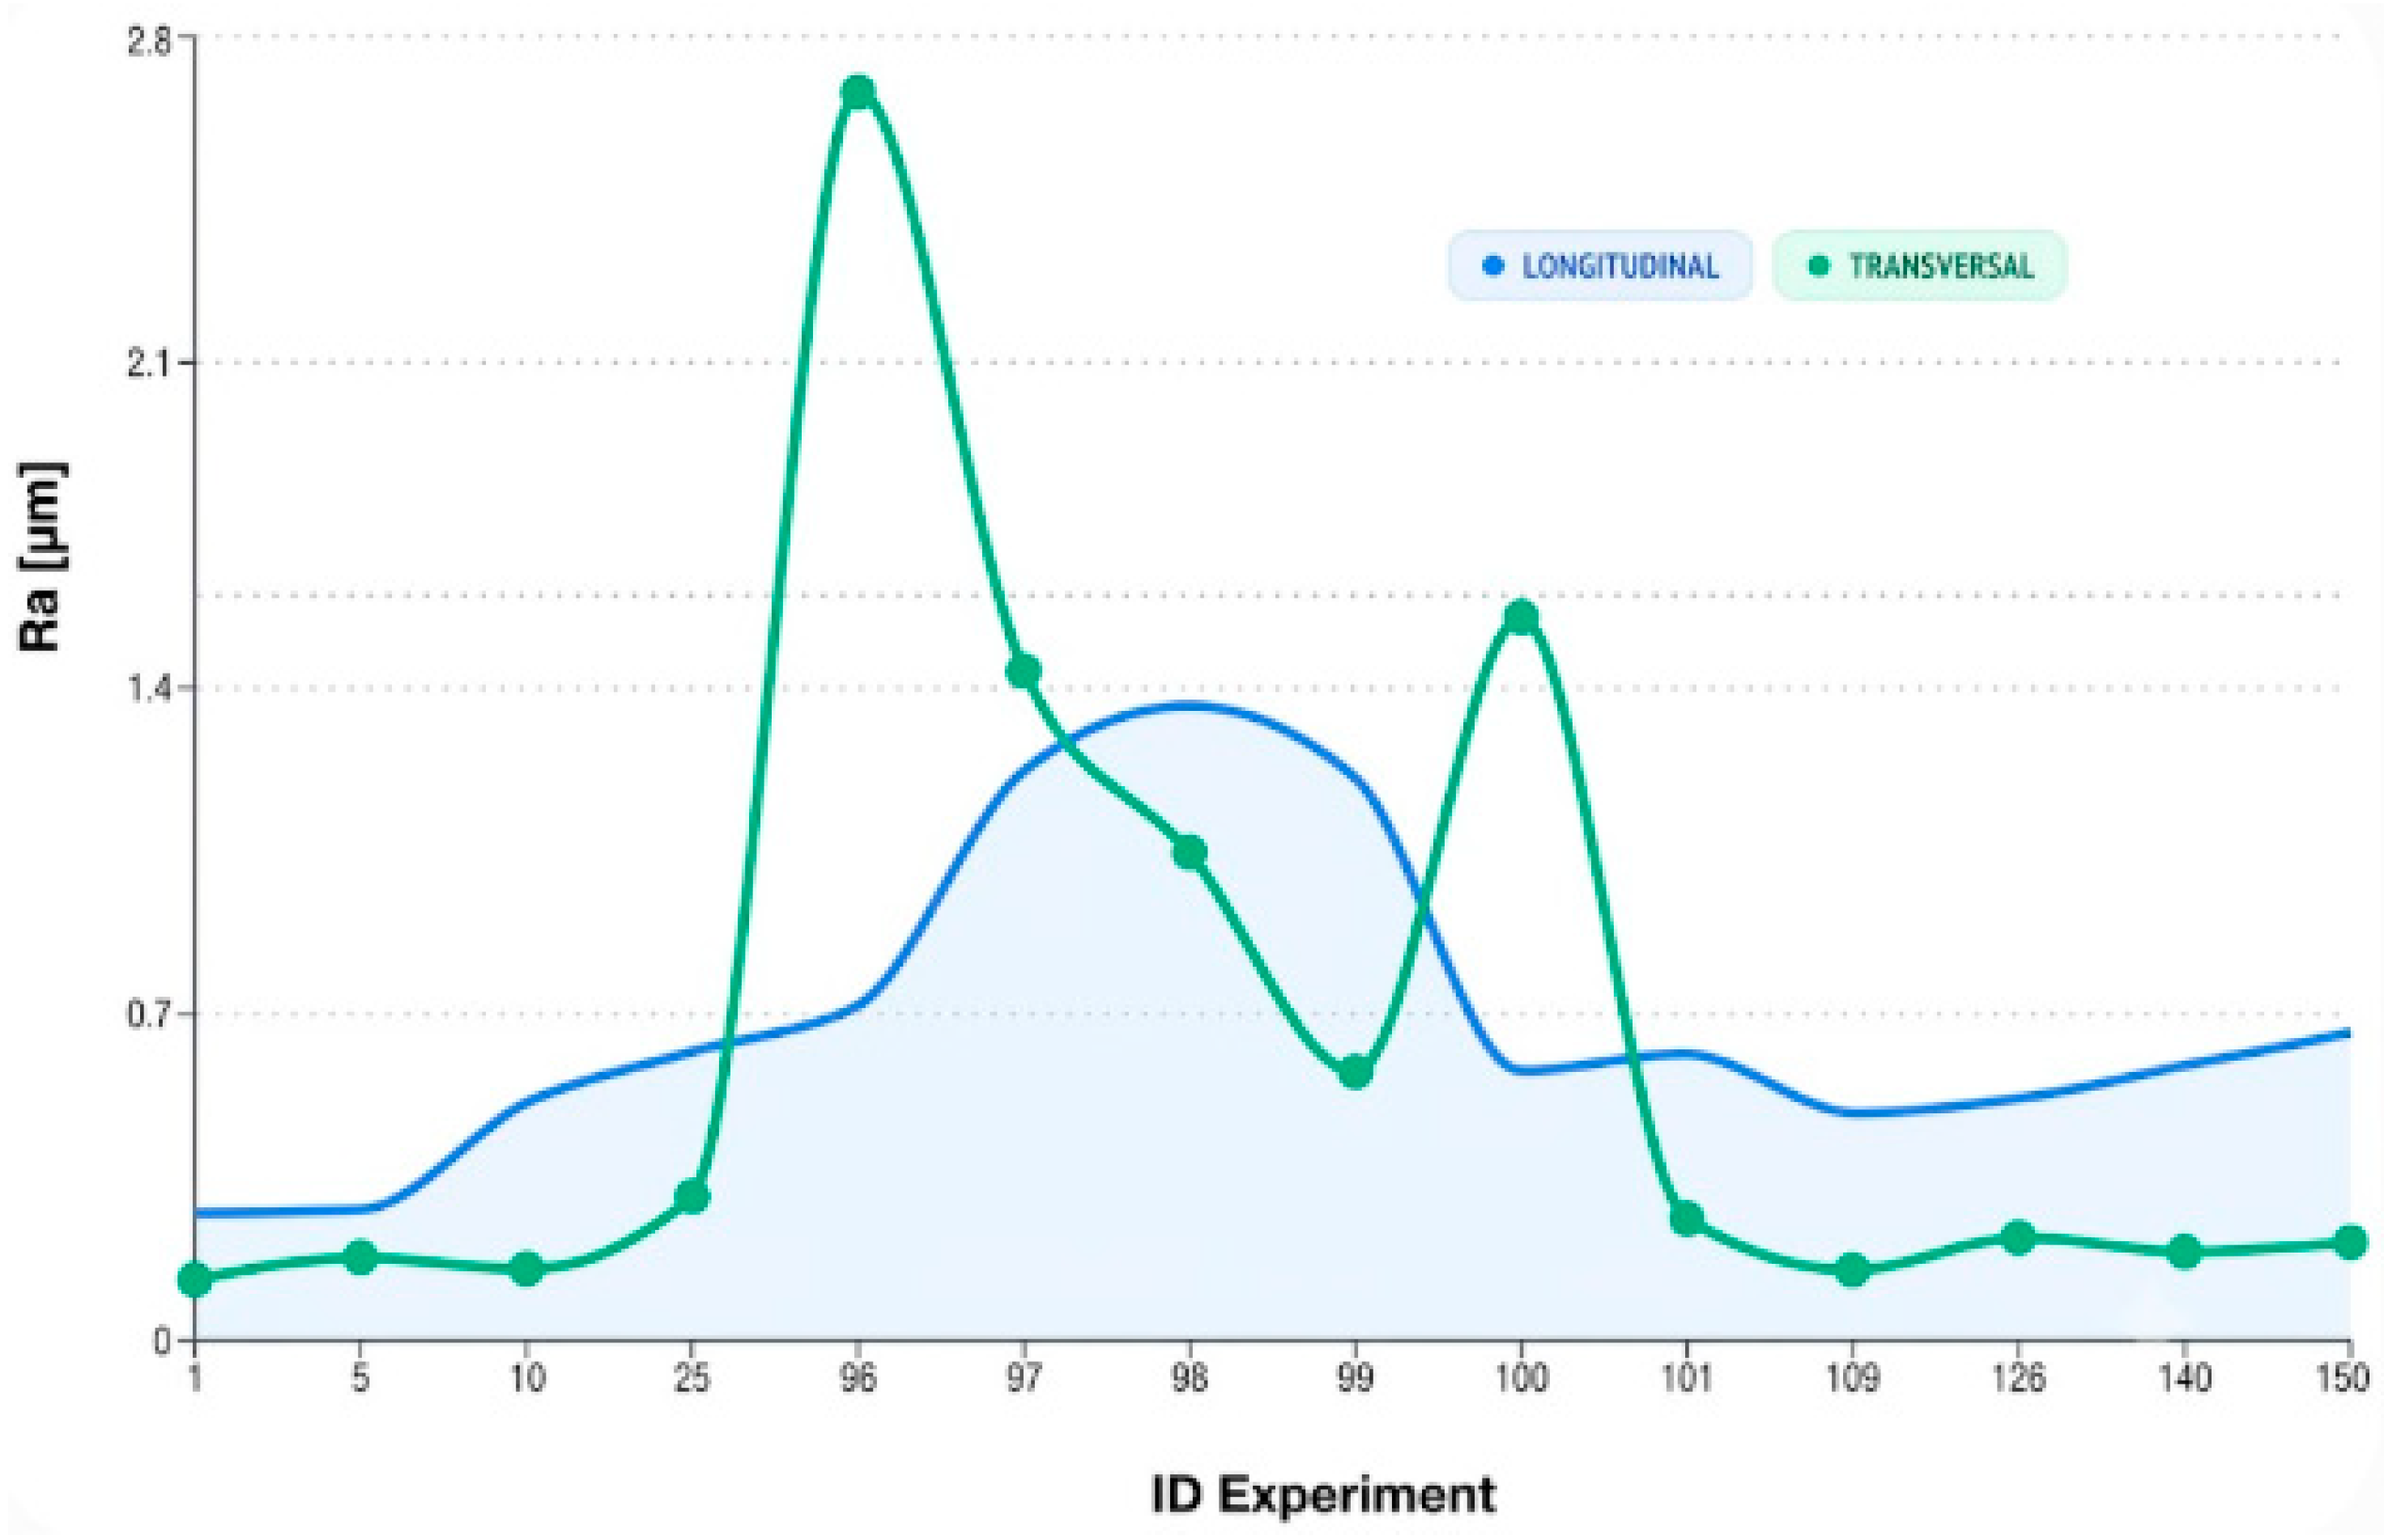
Figure 1 illustrates the evolution of surface roughness as a function of cutting speed. The comparison in
Figure 1 shows that longitudinal
Ra is consistently lower than transversal Ra. However, in the 610 m/min resonance zone, transversal
Ra peaks significantly more (up to 2.7 µm), indicating that vibrations affect the transversal texture more severely than the longitudinal one.
High-Speed Stabilization: At vc = 710 m/min, the longitudinal roughness stabilizes. High cutting speeds reduce Built-Up Edge (BUE) formation, providing an ideal substrate for anodization.
Self-Excited Vibrations: In experiments 96–100, the high Transversal Ra values indicate the presence of self-excited vibrations (chatter). These regions will exhibit low corrosion resistance due to the induction of micro-cracks.
Geometric vs. Dynamic Profile: Transversal Ra typically follows the tool’s geometric profile. When Longitudinal Ra significantly exceeds Transversal Ra, the process is undergoing dynamic instability.
Longitudinal Measurements: The Mean Longitudinal Ra is 0.706 μm, with the recorded values being influenced by vibrations.
Transversal Measurements: The Mean Transversal Ra is 0.763 μm; here, the influences of tool geometry and feed per tooth (fz) are most prominent.
Peak Anomaly: A maximum detected value of 2.682 μm was recorded, identifying a critical resonance zone.
Correlation Analysis: The following table presents a correlation between the cutting parameters and the resulting surface quality.
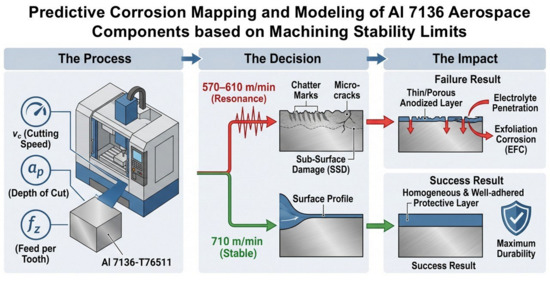
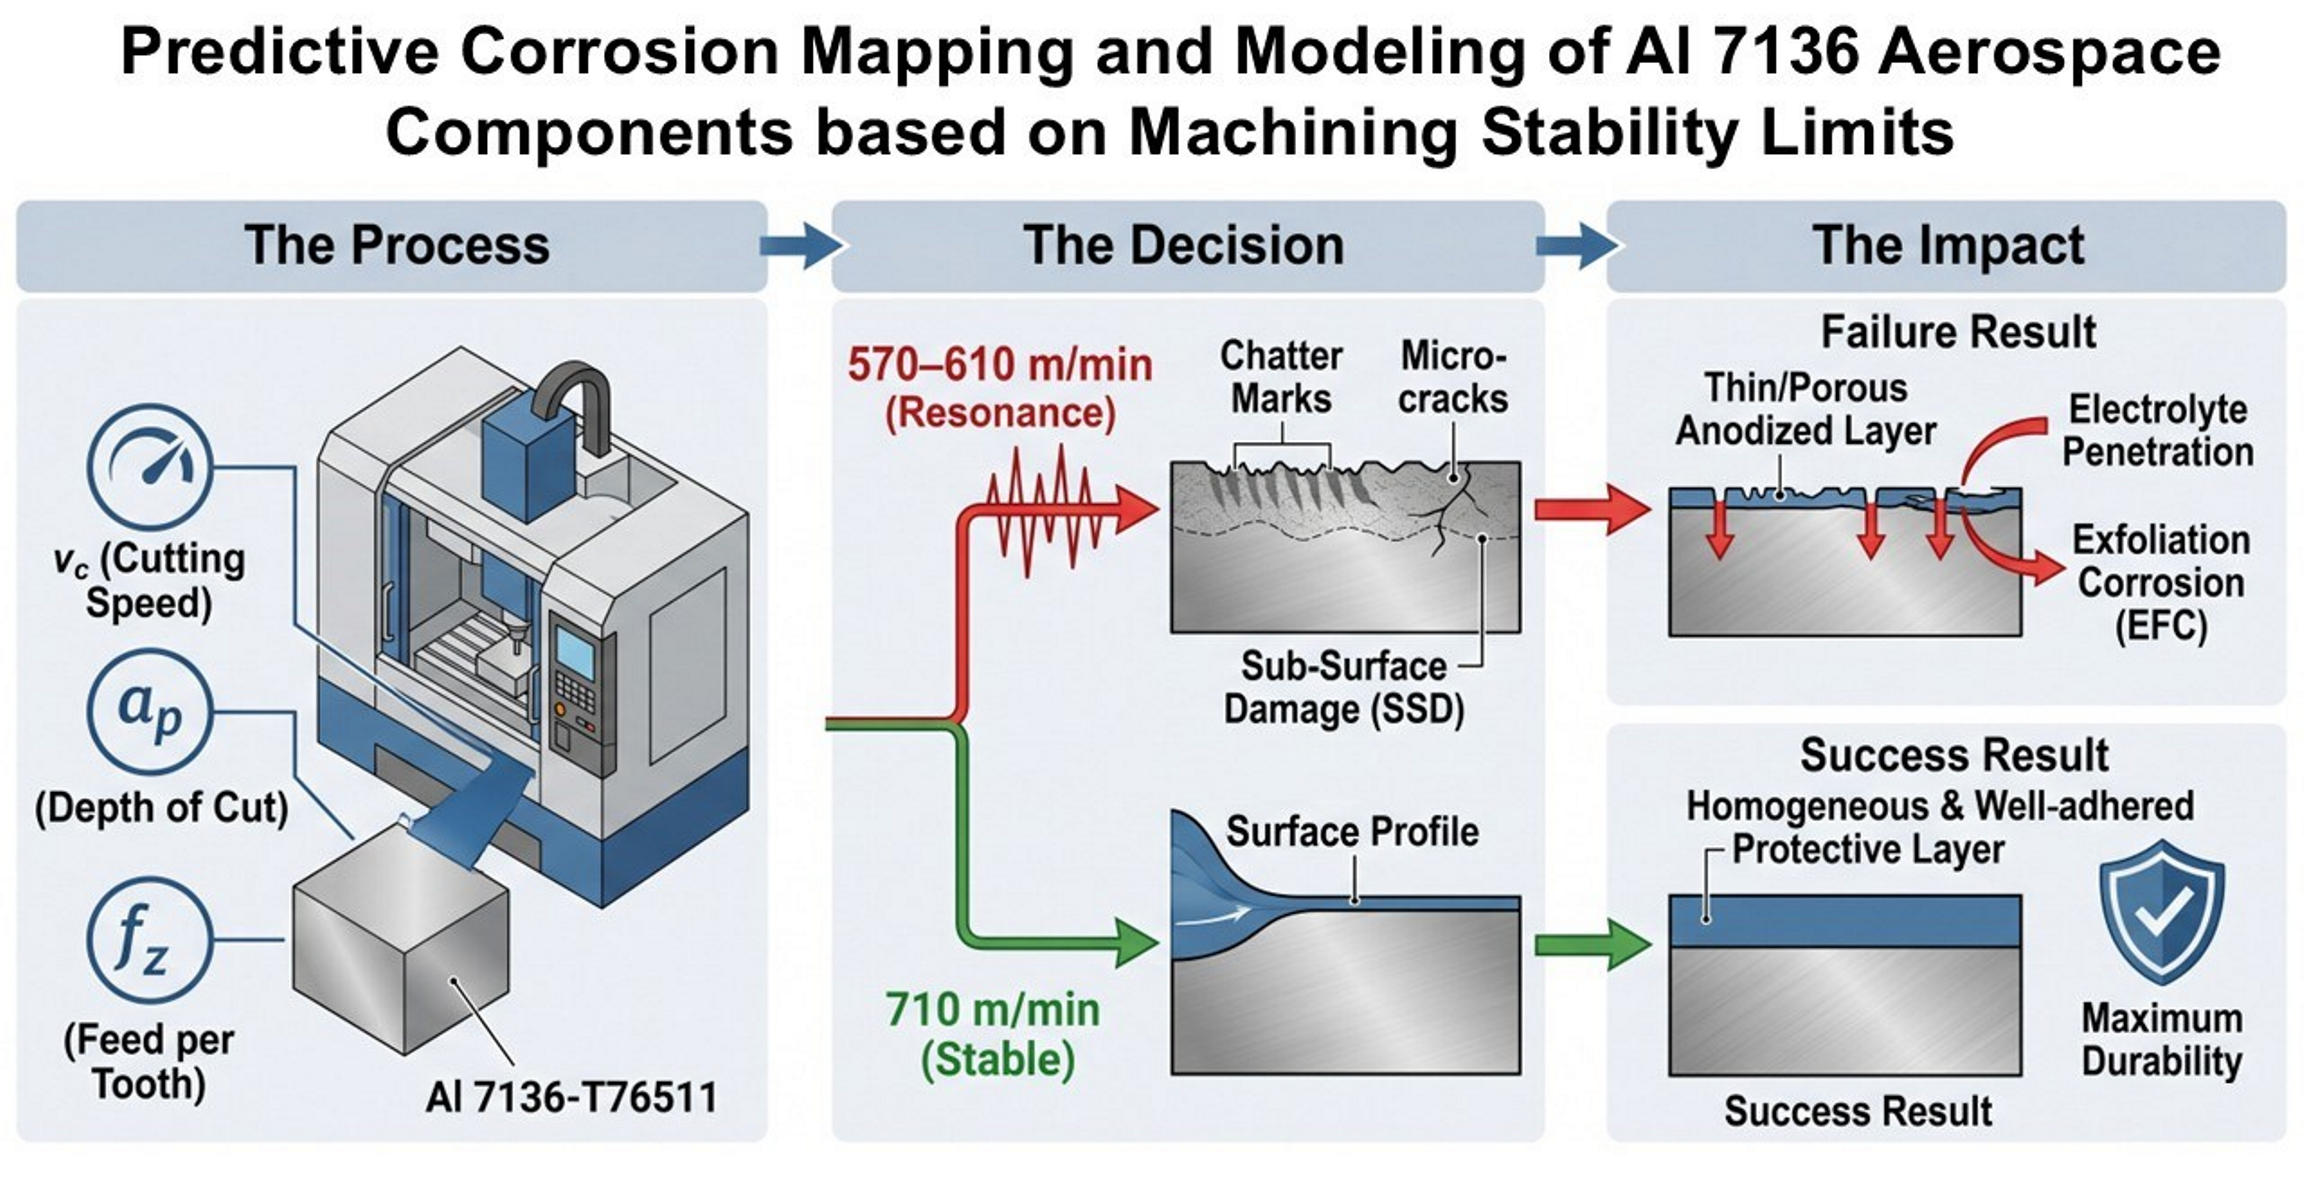
The proposed correlation between cutting parameters and corrosion performance is based on the predictive capacity of the dynamic stability index (σ). Our data indicate that a high standard deviation of roughness (σ = 0.112 µm in the 570–610 m/min zone) is a direct precursor of anodized layer defects (
Table 8). According to the mechanism described in
Table 2, a surface with ‘chatter marks’ (vibration traces) exhibits a micro-geometry with steep slopes where the oxide layer, following the metallic contour, becomes extremely thin at the peaks. These points of minimum thickness represent the ‘corrosion origin mode,’ acting as gateways for pitting corrosion initiation under electrochemical load. Thus, the regression model for
Ra and the anisotropy analysis become prognostic tools: a regime that minimizes both
Ra and σ (such as the one at 710 m/min) guarantees a substrate with uniform surface energy, optimal for maximum adhesion and efficient sealing of the protective layer.
Self-excited vibrations (chatter) identified in the vc = 570–610 m/min range induce cyclic dynamic loads on the material surface. These loads exceed the local yield strength of the Al 7136 alloy under the tool tip, causing severe and non-uniform plastic deformation. This mechanical instability leads to the formation of intergranular micro-cracks within the Surface Stratum Deformation (SSD) layer, which functions as stress concentration zones. Unlike the stable regime at 710 m/min, where the material flow is continuous and uniform, the resonance regime produces an undulated texture that promotes the appearance of tensile residual stresses at the surface.
The impact of CNC parameters on the integrity of the anti-corrosion coating is shown below (
Figure 2,
Figure 3 and
Figure 4).
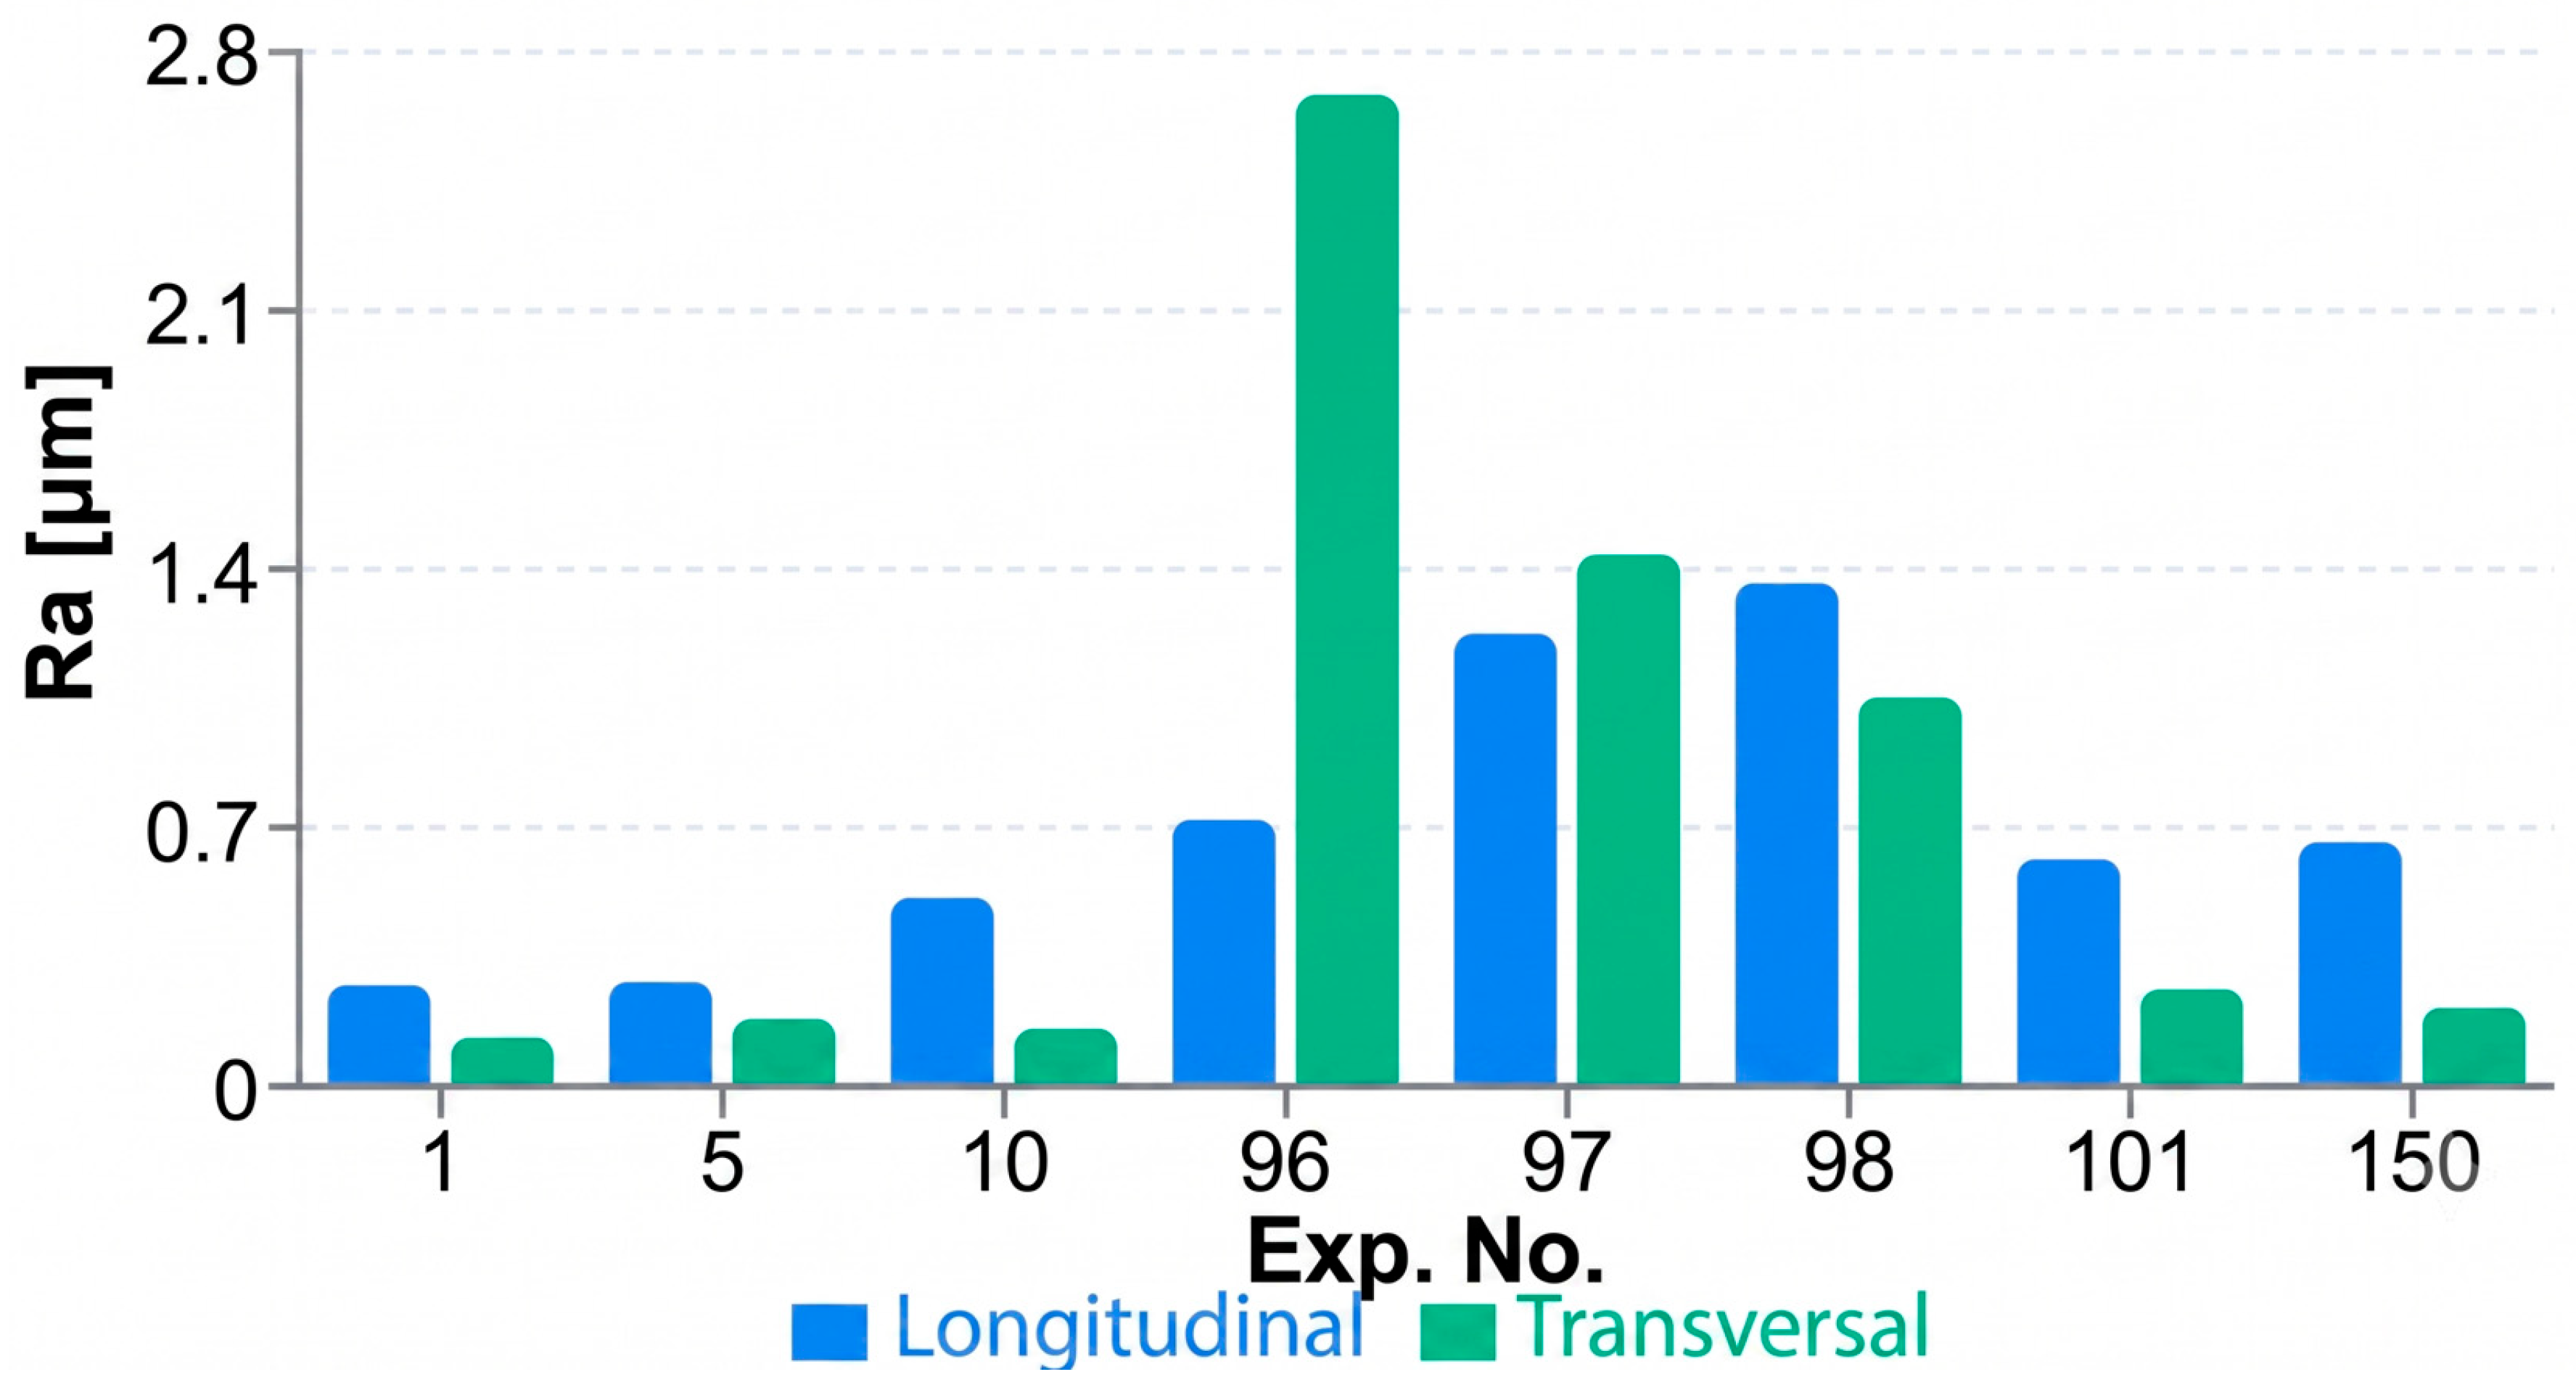
In
Figure 2, the
X-axis represents the Experiment ID, corresponding to the testing sequence within the block of 150 unique cutting regimes. The
Y-axis displays the roughness values (Ra):
Longitudinal Ra: Measured along the feed direction. Elevated values are indicative of process instability.
Transversal Ra: Measured in the perpendicular direction. A significant discrepancy compared to the longitudinal Ra confirms the presence of chatter.
The analysis of the graphs in
Figure 1 and
Figure 2 confirms that roughness does not increase linearly with speed. An instability ‘crest’ is observed at intermediate speeds, followed by a stabilization zone at high speeds (vc = 710 m/min), where the formation of Built-Up Edge (BUE) is minimized.
To systematically clarify the non-linear topography trends observed across the experimental dataset, a clear distinction must be made between the low-speed resonance behaviors and the high-speed stabilization mechanisms. As cutting speed increases from 400 m/min toward the intermediate 570–610 m/min range, the machine-tool system encounters a critical dynamic instability window, where self-excited chatter harmonics trigger severe wave amplification, forcing the prominent roughness crests mapped in
Figure 2 and
Figure 3. Conversely, upon crossing past this structural resonance threshold into the ultra-high-speed finishing envelope (
vc 680–710 m/min), a distinct physical transition occurs. At these elevated peripheral velocities, Built-Up Edge (BUE) formation is eliminated, cutting force components drop, and thermal dissipation via continuous chip evacuation stabilizes the shear zone. This aerodynamic and mechanical stabilization accounts for the sharp decrease and ultimate leveling of the
Ra profile observed at 710 m/min, delineating a highly predictable, low-roughness processing window.
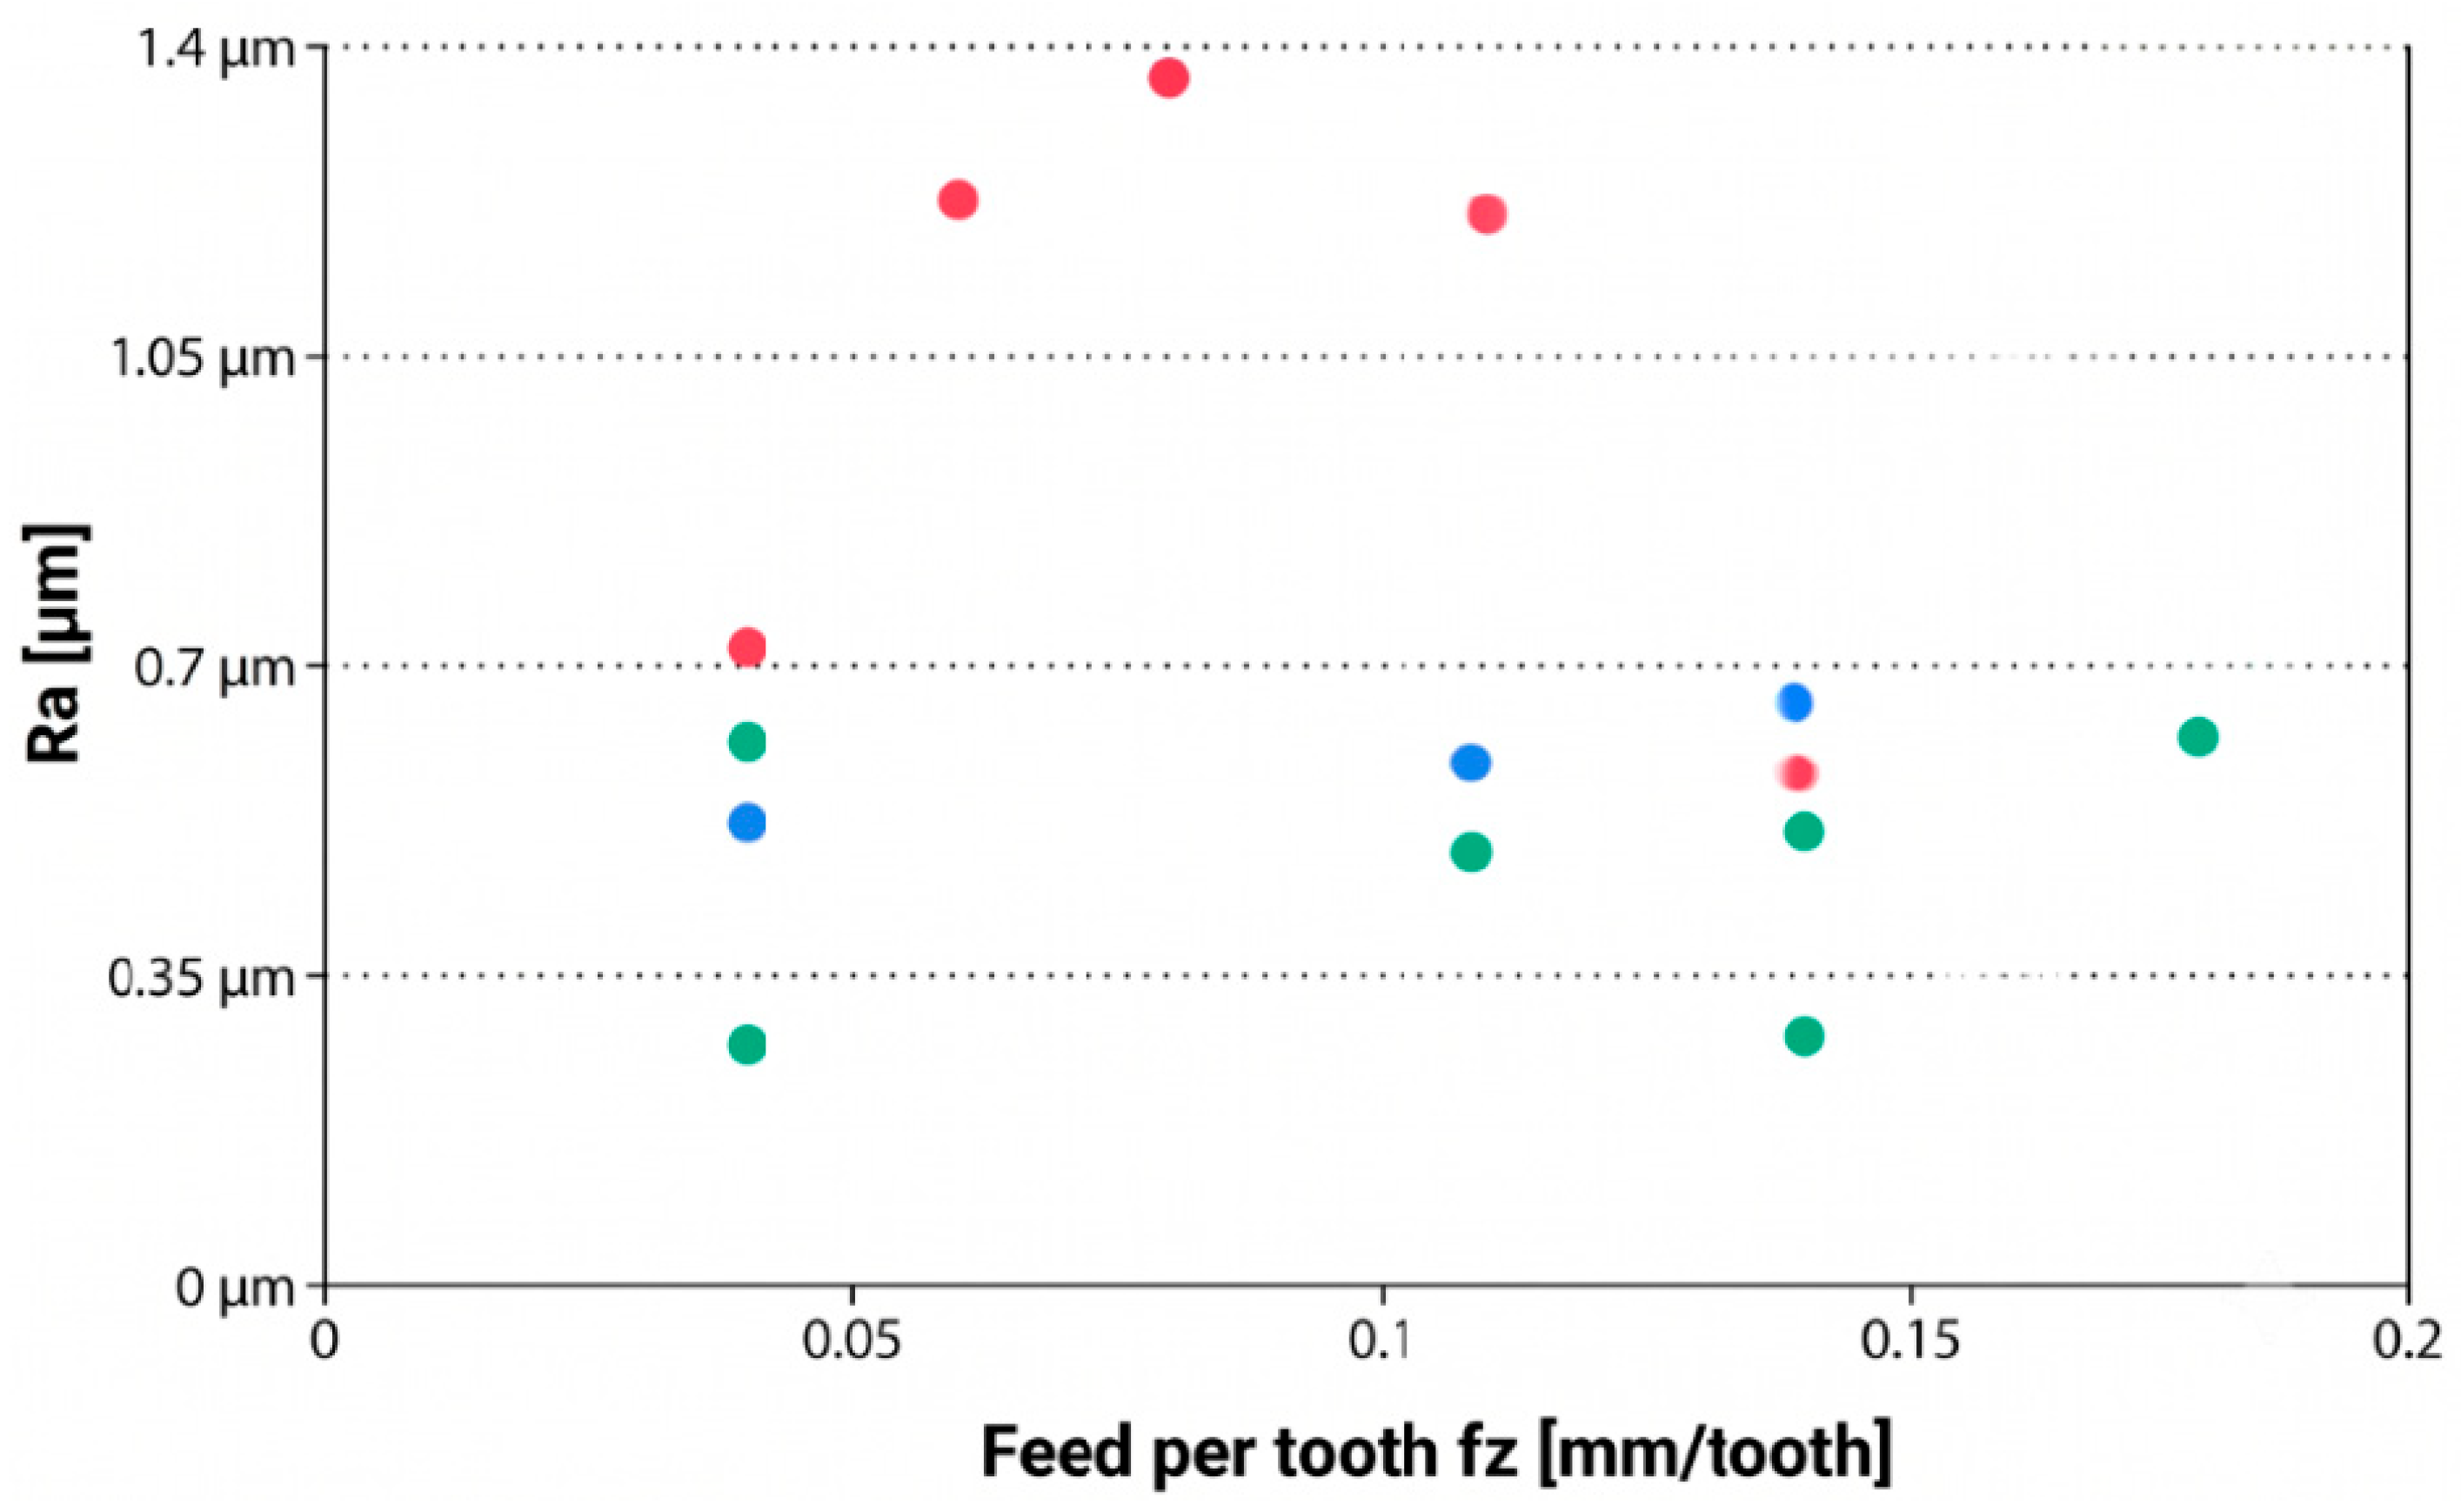
In
Figure 3,
fz (mm/tooth) the feed per tooth is the main factor generating geometric micro-geometry.
The data confirms that roughness does not increase linearly with speed. There is an “island” of stability at high speeds where the adhesion of the protective layer will be maximum.
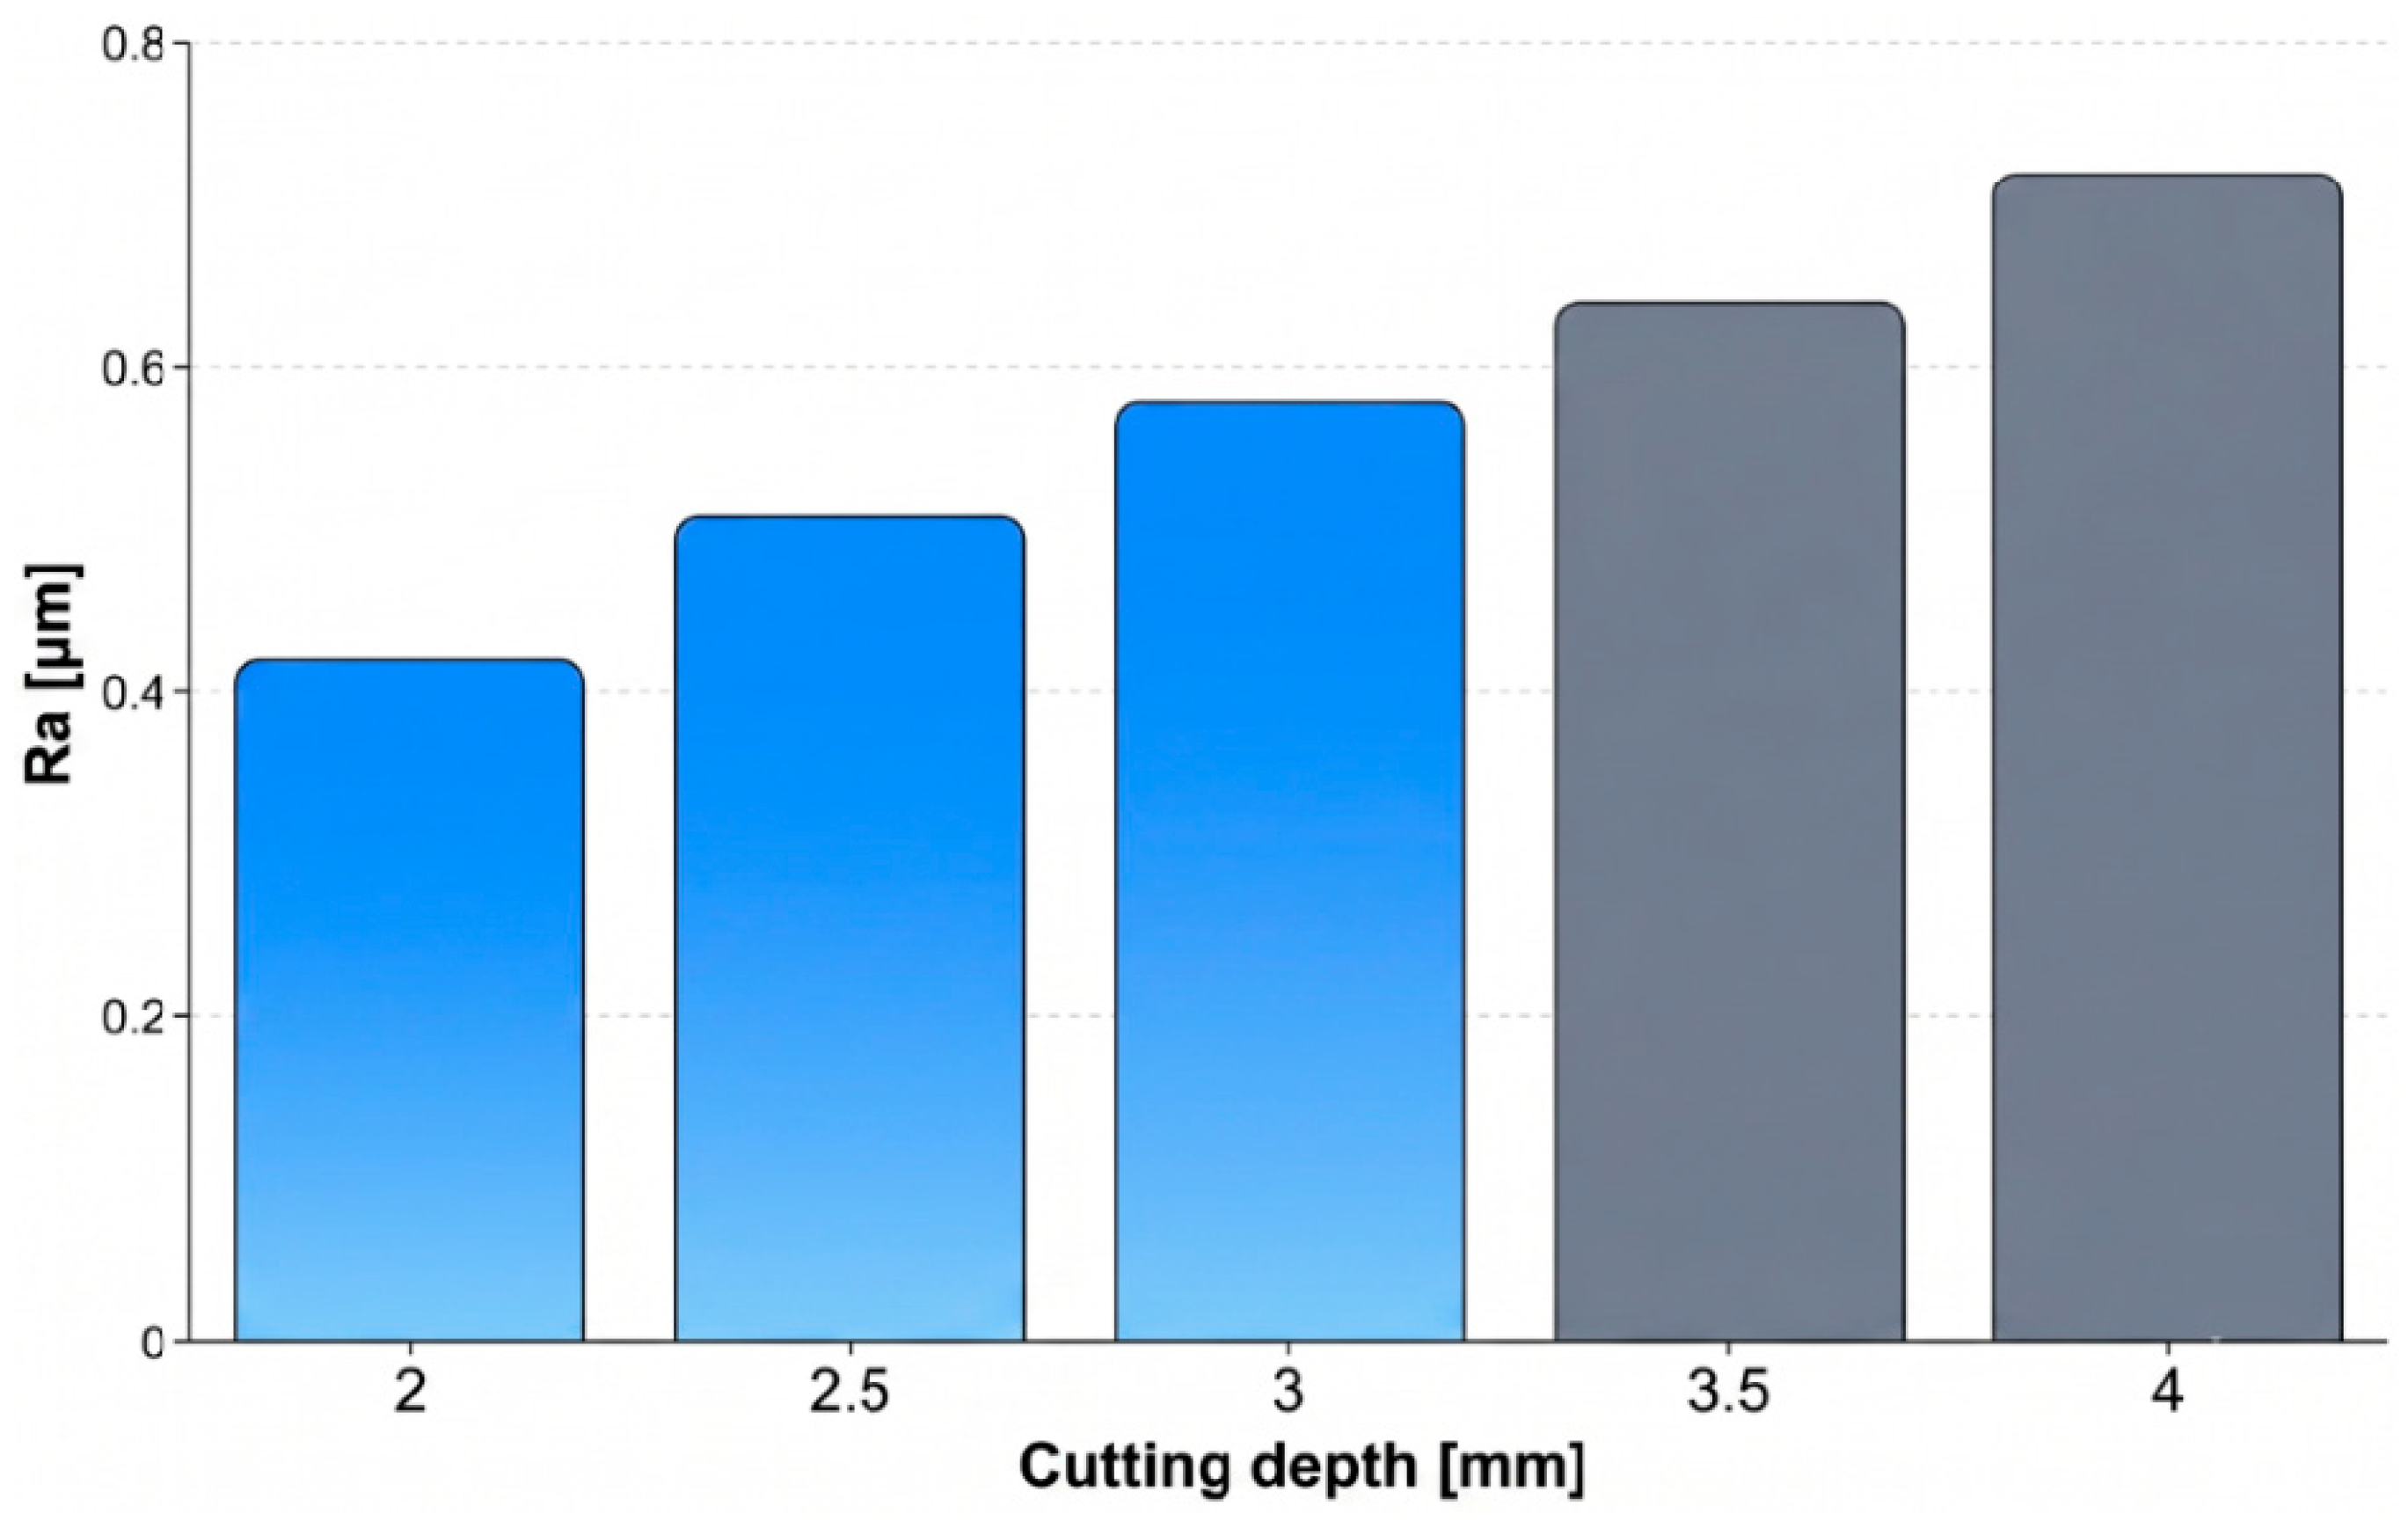
These graphs show that it is not advisable to use the regime v = 610 m/min ap = 4 mm and recommend v = 710 m/min and fz = 0.14 mm.
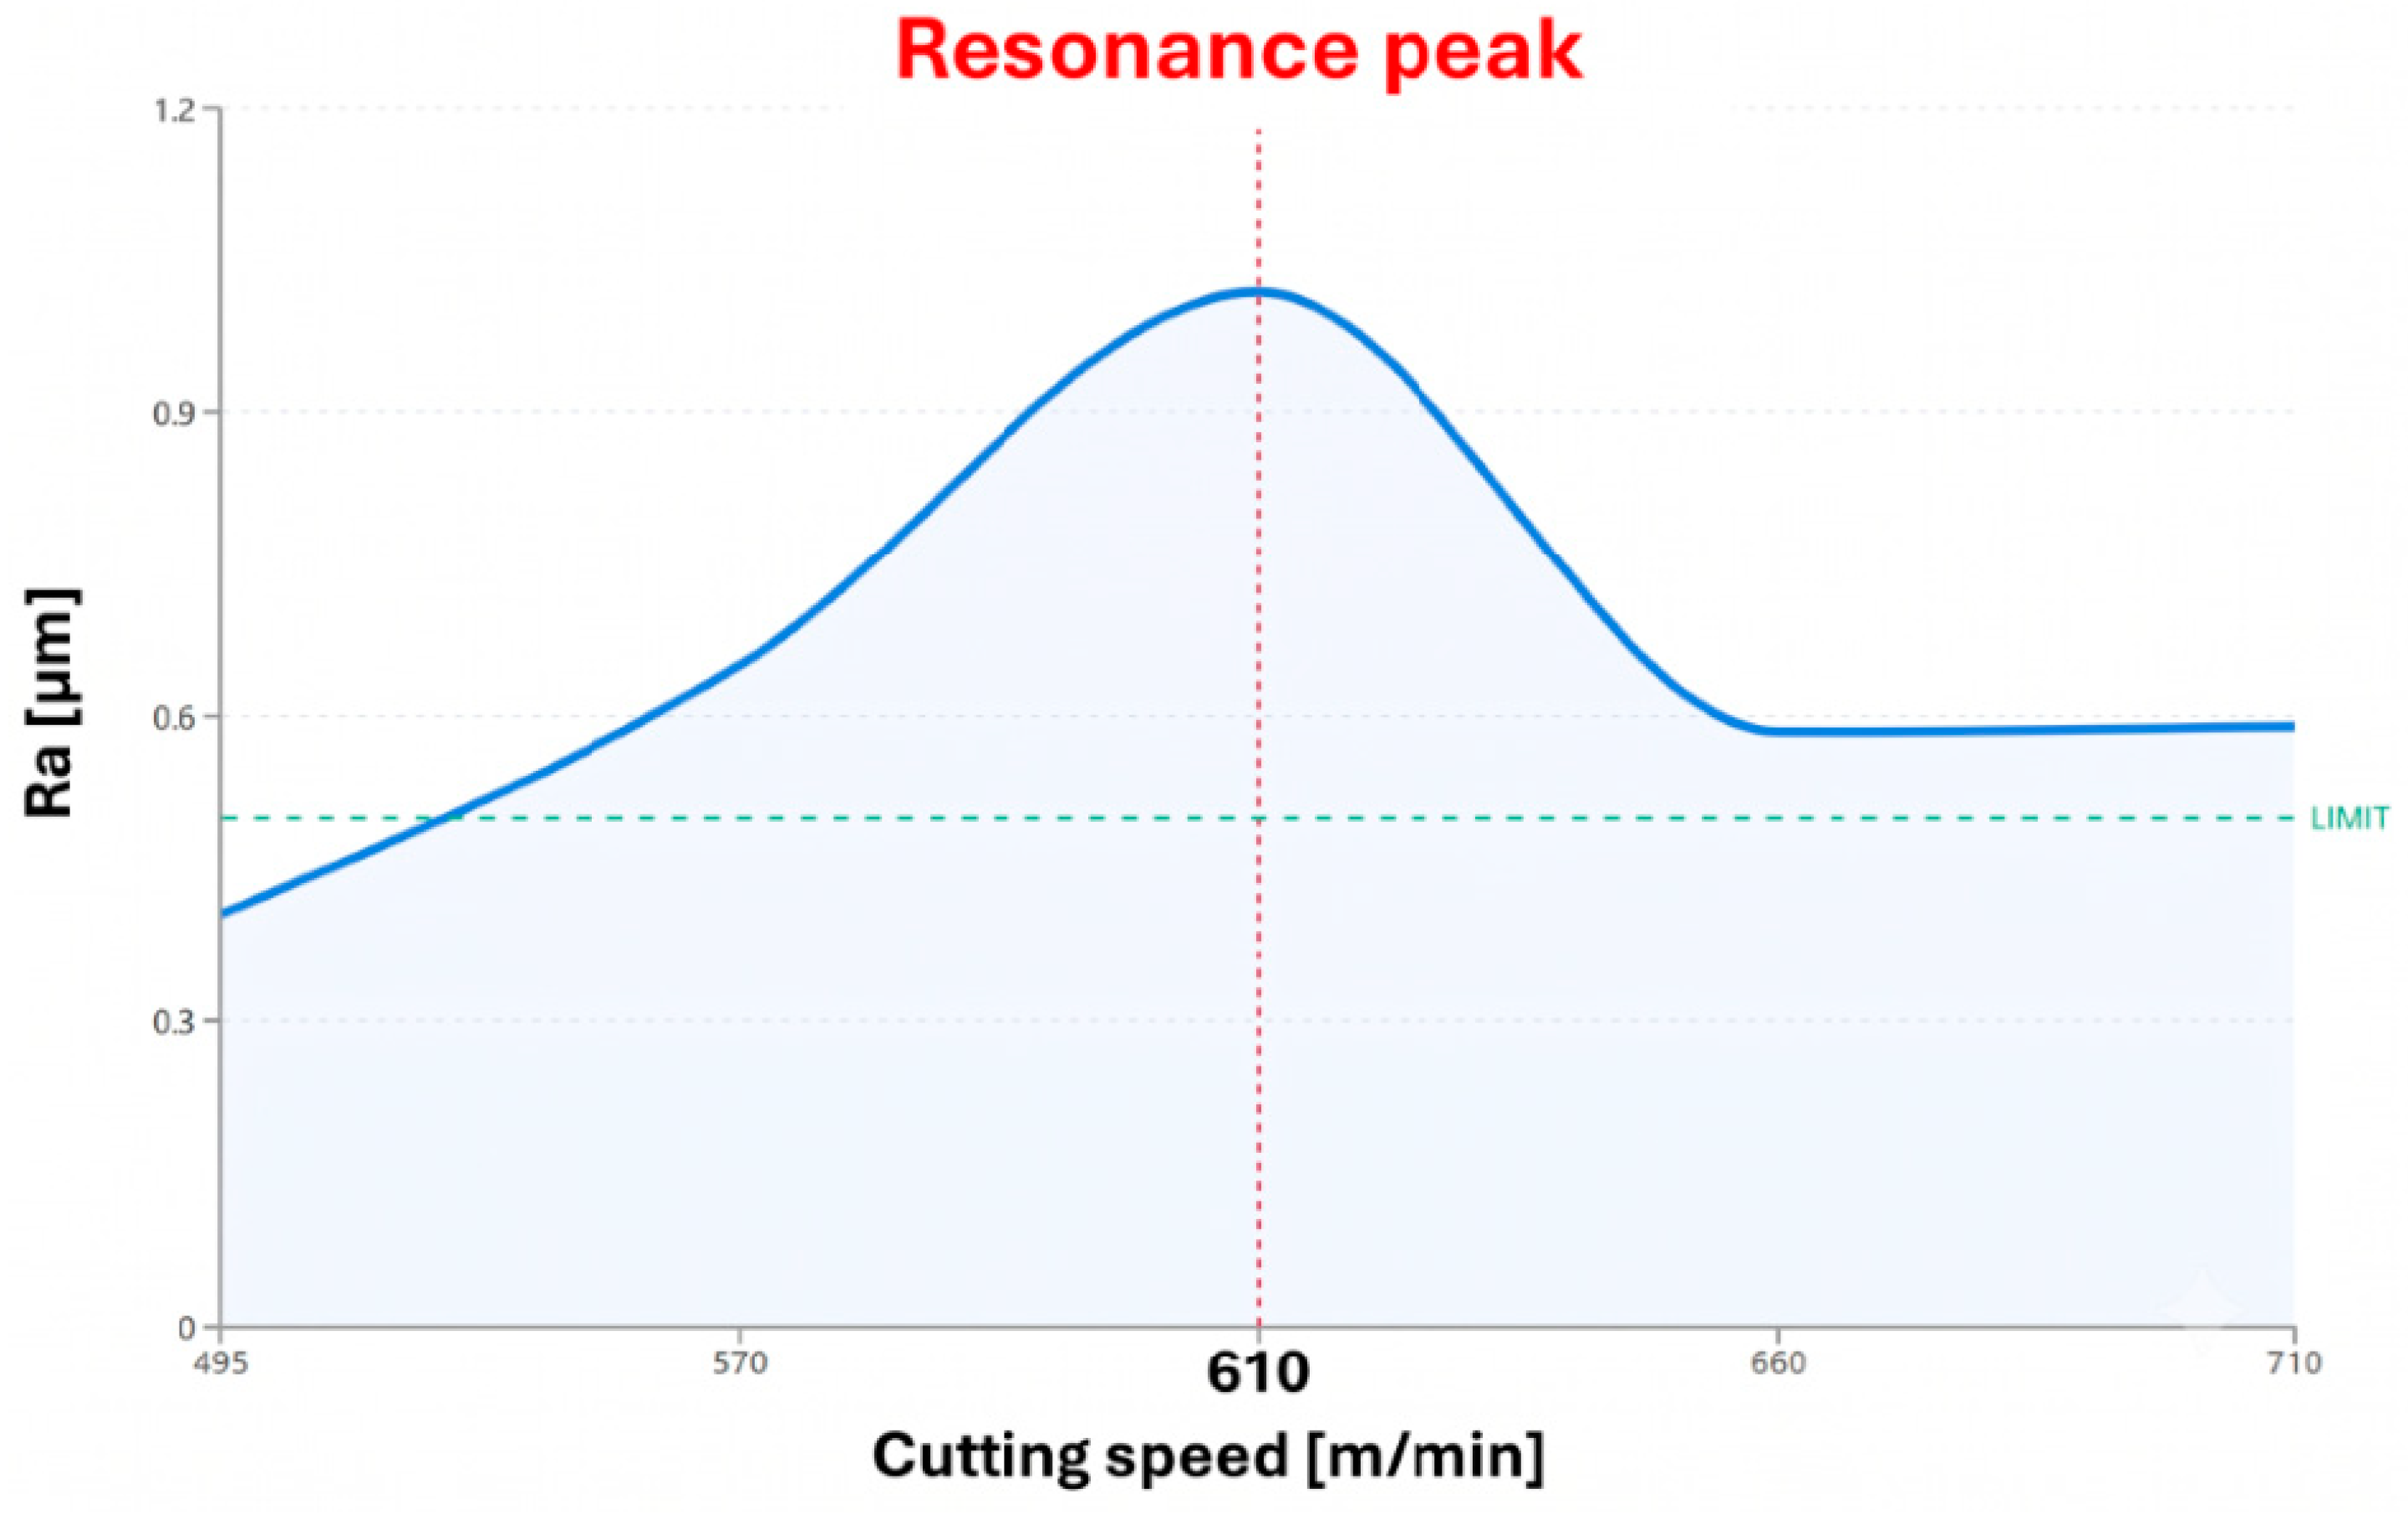
Figure 4 and
Figure 6—Resonance and Standard Deviation: The correlation between these two figures is essential. The resonance peak at
vc = 610 m/min corresponds directly to the maximum standard deviation value of 0.112 µm, statistically demonstrating the lack of process predictability within this interval.
Figure 7 illustrates the prominent directional discrepancy between the longitudinal and transversal roughness profiles, which defines the structural anisotropy of the machined surface. However, within the 570–610 m/min resonance zone, this regular anisotropy is heavily disrupted by self-excited vibrations, transforming the surface into a highly non-uniform topography. This severe spatial non-uniformity represents the core physical defect that compromises the dimensional consistency and mechanical adhesion of the subsequent protective layer.
A deeper analysis of the surface texture and morphology characteristics is achieved by examining the structural anisotropy, captured through the relationship between Longitudinal
Ra and Transversal
Ra (as visualized in
Figure 7). In stable machining regimes (e.g., ID 1 and ID 150), the surface texture is predominantly governed by tool kinematics and geometric feed markers (
fz), keeping the standard deviation remarkably low (
σ = 0.051 µm). However, upon entering the resonance ‘danger zone’ (
vc = 570–610 m/min), the surface morphology undergoes severe transition. The extreme peak anomalies (Transversal
Ra spiking up to 2.682 µm) combined with a massive expansion of standard deviation (
σ = 0.680 µm) confirm that the regular geometric texture is completely replaced by dominant, high-amplitude undulations, commonly classified as chatter marks. This severe topographical asymmetry creates a highly non-uniform micro-geometric environment, directly predisposing subsequent protective layers to localized physical degradation.
The regular directional discrepancy observed between the longitudinal and transversal parameters defines the structural anisotropy of the machined surface, expected from tool kinematics. However, within the 570–610 m/min window, self-excited vibrations heavily disrupt this texturing, transforming it into a highly non-uniform topography. This severe spatial non-uniformity represents the core physical defect that compromises subsequent coating adhesion.
Cutting Speed (vc): Establishes the transition toward High-Speed Machining (HSM). The peak observed at 610 m/min indicates the dynamic limitation of the CNC machine.
Depth of Cut (ap): Demonstrates the system’s stability under increased axial forces. A linear increase in roughness is observed as the depth of cut increases.
Standard Deviation (σ): Represents the risk of localized defects (such as oxide porosity) caused by an unpredictable process.
Anisotropy: The significant discrepancy between Longitudinal Ra and Transversal Ra confirms the presence of vibration waves, which will embrittle the protective coating.
Surfaces with Ra > 1.2 μm exhibit a “peak-like” (crest) topography, where the metallic peaks are not fully covered by the oxide layer, subsequently acting as a local anode.
In conclusion, the data obtained demonstrate that roughness is not merely a geometric value, but a direct indicator of the dynamic state of the workpiece.
4.5. Discussions
To clearly reinforce the primary goal of this investigation, the results discussed herein serve to build a non-speculative, data-driven manufacturing map focused exclusively on substrate optimization. By demonstrating that cutting speed dominates roughness variance with an 83.89% contribution, this study shifts the engineering focus toward suppressing process noise during the high-speed milling of the Al 7136-T76511 alloy. The purpose is to provide a predictive framework that allows process engineers to proactively avoid resonance configurations, thereby guaranteeing a uniform metallic substrate that maximizes the mechanical efficiency of subsequent aerospace coatings.
The massive 83.89% contribution of cutting speed (vc) to surface roughness variance explicitly isolates this work from conventional milling theories. In low-speed, traditional manufacturing operations, the tool’s corner radius and the feed per tooth are the fundamental components driving Ra. However, by operating deep within high-speed machining (HSM) regimes, the thermal dissipation via the chip and the minimization of Built-Up Edge (BUE) completely redirect the process physics. This extreme speed dominance mathematically justifies why conventional, generalized aluminum cutting models are inadequate for specialized aerospace alloys like Al 7136-T76511, necessitating the specific regression framework proposed herein.
The cutting regime that produces a minimum and stable roughness profile (vc = 710 m/min with σ = 0.051 µm) offers a superior and mathematically predictable substrate configuration for anti-corrosive treatments. This low and uniform roughness configuration optimizes the effective contact area and surface energy, which inherently facilitates a highly uniform layer deposition during subsequent anodization. In stark contrast, substrates processed within the dynamic resonance range exhibit high process noise and prominent chatter marks that systematically compromise the structural uniformity of the applied oxide layer. Because the porous anodic layer closely follows the microscopic substrate profile, these vibration-induced variations result in localized coating thinning at the micro-ridges, which severely weakens the physical barrier property and accelerates the initiation of localized sub-surface degradation.
Regarding the general applicability of the proposed findings, a distinction must be made between the mathematical framework and the empirical velocity boundaries.
Nevertheless, the true generalizability of this study lies in the validation of the predictive methodology itself: establishing that tracking the roughness standard deviation allows engineers to map and isolate sub-surface coating vulnerabilities, independent of where the specific stiffness-induced chatter marks occur in the velocity space. This work establishes a flexible predictive methodology that industrial engineers can readily calibrate to the modal stiffness profiles of their specific production centers.
Furthermore, a rigorous metrological distinction must be maintained when interpreting the surface texturing. The directional discrepancy observed between the longitudinal and transversal roughness profiles defines the structural anisotropy of the machined surface, which is an expected consequence of tool kinematics and feed orientation. However, within the 570–610 m/min resonance zone, this regular directional texturing is heavily disrupted by self-excited vibrations, transforming the surface into a highly non-uniform topography. This severe spatial non-uniformity, rather than natural anisotropy, represents the core physical defect that compromises the dimensional consistency and mechanical adhesion of the subsequent protective layer.
This synergistic interaction between geometric surface anomalies and microstructural orientation highlights the importance of process stabilization. The physical displacement of the applied barrier layers over dynamic chatter marks provides the initial geometric vulnerability that facilitates subsequent intergranular propagation along the elongated rolling boundaries of the Al 7136 alloy state.
To provide process engineers with an actionable and unified operational framework based on these technological findings, a comprehensive synthesis mapping the manufacturing regimes to their corresponding structural profiles, degradation risks, and engineering remediation pathways is structured in
Table 9.