Article

Innovative Energy Storage in Wood Base Hybrid Composite: Energy Storage Furniture with Microencapsulated Phase Change Material


1
Department of Forest Industrial Engineering, Bartin University, 74100 Bartin, Türkiye
2
Forest Products Application and Research Center, Bartin University, 74100 Bartin, Türkiye
3
Department of Forestry, Akseki Vocational School, Alaaddin Keykubat University, 07630 Antalya, Türkiye
4
Civil Engineering Department, Faculty of Engineering, Architecture and Design, Bartin University, 74100 Bartin, Türkiye
5
Department of Metallurgical and Material Engineering, Karadeniz Technical University, 61080 Trabzon, Türkiye
6
Interdisciplinary Research Center for Sustainable Energy Systems (IRC-SES), King Fahd University of Petroleum and Minerals, Dhahran 31261, Saudi Arabia
7
Mechanical Engineering Department, Faculty of Engineering, Architecture and Design, Bartin University, 74100 Bartin, Türkiye
8
Department of Gluing and Finishing of Wood, Poznan University of Life Sciences, 60-637 Poznan, Poland
*
Authors to whom correspondence should be addressed.
Coatings 2026, 16(7), 792; https://doi.org/10.3390/coatings16070792
Submission received: 1 June 2026 / Revised: 24 June 2026 / Accepted: 30 June 2026 / Published: 2 July 2026
(This article belongs to the Collection Wood: Modifications, Coatings, Surfaces, and Interfaces)

Abstract

The integration of microencapsulated phase change materials (MPCMs) significantly improved the energy storage capacity of wood-based hybrid composites (WBHCs). MPCM incorporated into the surface coating enabled the composites to store thermal energy from solar radiation and ambient heat, offering an energy-efficient and sustainable solution for furniture applications. In this study, the structural, thermal, surface, and mechanical properties of MPCM/WBHC were comprehensively investigated. The microstructural features and chemical functionalities of the samples were characterized through scanning electron microscopy (SEM) and Fourier transform infrared (FTIR) spectroscopy. Thermal performance and stability were subsequently assessed by means of differential scanning calorimetry (DSC), thermogravimetric analysis (TGA), thermal conductivity evaluation, and solar-based thermoregulation experiments. The MPCM exhibited onset melting and freezing temperatures of 25.72 °C and 21.73 °C, respectively, whereas these values ranged between 22.45 °C and 22.90 °C in MPCM/WBHC, indicating effective thermal integration. Thermoregulation results clearly demonstrated that MPCM substantially improved the thermal energy storage capacity of the composites. Overall, the findings highlight the strong potential of MPCM/WBHC as latent heat thermal energy storage material for energy-saving furniture and interior applications.

1. Introduction

The world population, which was 3 billion in 1960, exceeded 5 billion in 1987 and reached approximately 7.9 billion in 2022. The world population increased by approximately 30% from 2000 (6144) to 2022 (7950) [1]. Increasing population rate increases the need for energy. The rise in greenhouse gas emissions [2] that results from this increase in energy consumption also contributes to global warming [3,4,5]. Buildings are the largest end-use energy sector in Europe, accounting for around 40% of all final energy usage, while transportation is the second largest, with 33% [6].
A substantial surface area is available for interaction with the interior environment thanks to the furniture and interior thermal mass components. Through convective interaction with indoor air and diffusive transfer across directly adjacent surfaces, such as walls or floors, these elements enable the exchange of both heat and moisture. They can cover and obstruct radiant heating or cooling systems. They can also share heat with nearby surfaces through long wave radiation. They can alter the room’s air flow pattern, which can have an impact on convective heat transfer and ventilation effectiveness. They could swiftly release solar radiation or internal gain into the surrounding air after reflecting, diffusing, and absorbing it [7]. Numerical tests by Corcione et al. [8] revealed a non-negligible drop in heat transmission from radiant surface systems to the furnished interior area as compared with an empty room scenario. There were additional effects on the mean radiant temperature and the air. Using a small-scale test setup, Fontana [9] expanded on this work by conducting experimental examinations to examine the effects of furniture pieces with varying surface areas, positions, and distances from the floor. The author concluded that 40% of the floor covering combined with various furniture pieces might cut the heat flux into the room from the radiant floor by 25% to 30%.
A numerical examination of the effects of modeling floor coverings and furniture elements integrated into thermal building simulations under temperature setpoint modulation control was conducted by Wolisz et al. [10]. Two large, light-framed buildings with excellent insulation levels and under-floor heating systems served as research cases. An analogous horizontal plank made of metal or wood served as the furniture element’s representation. By connecting inner surfaces to a hypothetical massless blackbody node configured within a star-network topology, long-wave radiation heat exchanges were modeled [11]. Fifty percent of one interior wall’s surface was taken up by furnishings. After four hours of elevated set point, it was discovered that the huge, empty room was 1.2 °C warmer than the one with flooring and furnishings. Compared with an empty room, a fully furnished large room can take almost 7 h to warm up by 5 °C. Under periodic set point monitoring, furnishings and floor coverings can alter cool-down times up to two hours.
The surface area of the furniture used in the house and the calculation of the total square meter of space they occupy are given in Table 1. This calculation was calculated by considering the furniture found in a standard house in Türkiye. According to Table 1, furniture surfaces and four doors in the house have a total surface area of 64.5 m2.
The most popular goods on the market are cooling chairs and cooling blankets, which provide passive cooling through direct contact with the human body. Additionally, “smart textile” with embedded PCM is marketed. These methods, however, only slightly improve the thermal comfort of passengers and are not TES systems [7]. There are several publications that examine or discuss the various PCM applications, but none that specifically address PCM integration in furniture could be located. The PCM furnishing option is mentioned in very few papers, and when it is, no specific examples are given [12]. There was just one article that showcased the initial PCM active use found in furniture. This is composed of a macro-encapsulated PCM air heat exchanger (electric fan). The mechanism is hidden behind living room or bedroom box-style furniture. Although the idea was put out for the 2007 American Solar Decathlon, no more details or paperwork were located [13]. For passive workplace cooling, EPS Ltd. has developed “PlusICE furniture.” The firm only offers bulk containment or stable form PCM to be positioned under the furnishing components; this product is truly not available [14]. For the 2012 “adream” competition, a group of architects proposed mounting different office furniture items in an aluminum frame using paraffin. According to a straightforward performance evaluation conducted in office buildings, energy requirements for heating and cooling may be lowered by up to 34% and 40%, respectively [15]. The engineering firm Egis offered a comparable idea in the French media in 2015. The PCM is contained and situated behind a wooden desk. To improve the heat exchange rate, an aluminum corrugated sheet is placed over the furniture’s bottom face. According to the designers, the PCM-integrated table has the potential to reduce cooling and heating demands by up to 30% and 60%, respectively [16]. The surface areas of furniture, walls, floors, and ceilings directly exposed to indoor air were approximated using a simplified evaluation of typical interior layouts in Danish buildings. Up to 50% of the interior surface of the space may be made up of the furniture surface, which is suitable for PCM integration. The ideal daily active PCM thickness, according to optimization research conducted on a wallboard with 60% microencapsulated paraffin, is 1 cm [17]. The daily effective thermal capacity of interior walls and furnishings wrapped in a layer of PCM is estimated simply using this figure. An amount of 180 MJ/m3 is selected as the product’s latent heat. One centimeter of PCM is thought to be completely activated in a 24 h cycle, or 1.8 MJ/m2 [17]. The daily effective heat capacity of each building element and a 4 °C temperature change is used to compute the sensible heat of the other building elements.
The aim of this study is to develop an environmentally benign and energy-efficient functional coating approach for wood-based furniture applications. In this context, MPCM were incorporated both into particleboard substrates and, more importantly, into surface coating formulations to impart thermal energy storage capability. The MPCM-containing coatings enable the absorption, storage, and release of thermal energy derived from solar radiation and ambient heat sources, thereby enhancing the thermal regulation potential of furniture surfaces. Overall, the proposed MPCM-containing coating system represents a promising strategy for advancing sustainable, energy-functional furniture materials within the scope of modern paint technologies.

2. Materials and Experimental Methods

2.1. Materials

The production of composite materials involves the use of wood chips obtained from 45% softwood, specifically Pinus nigra, and 55% hardwood, comprising a mixture of Carpinus betulus, Populus nigra, and Fagus orientalis. The urea-formaldehyde (UF) adhesive exhibited a viscosity of 255–315 mPa·s at a temperature of 22 °C. Its density varied between 1.275 and 1.295 g/m3, and its solid content was 65% ± 1%. For the curing process, a 20% solution of ammonium chloride was introduced to the adhesive at a weight ratio of 1%.
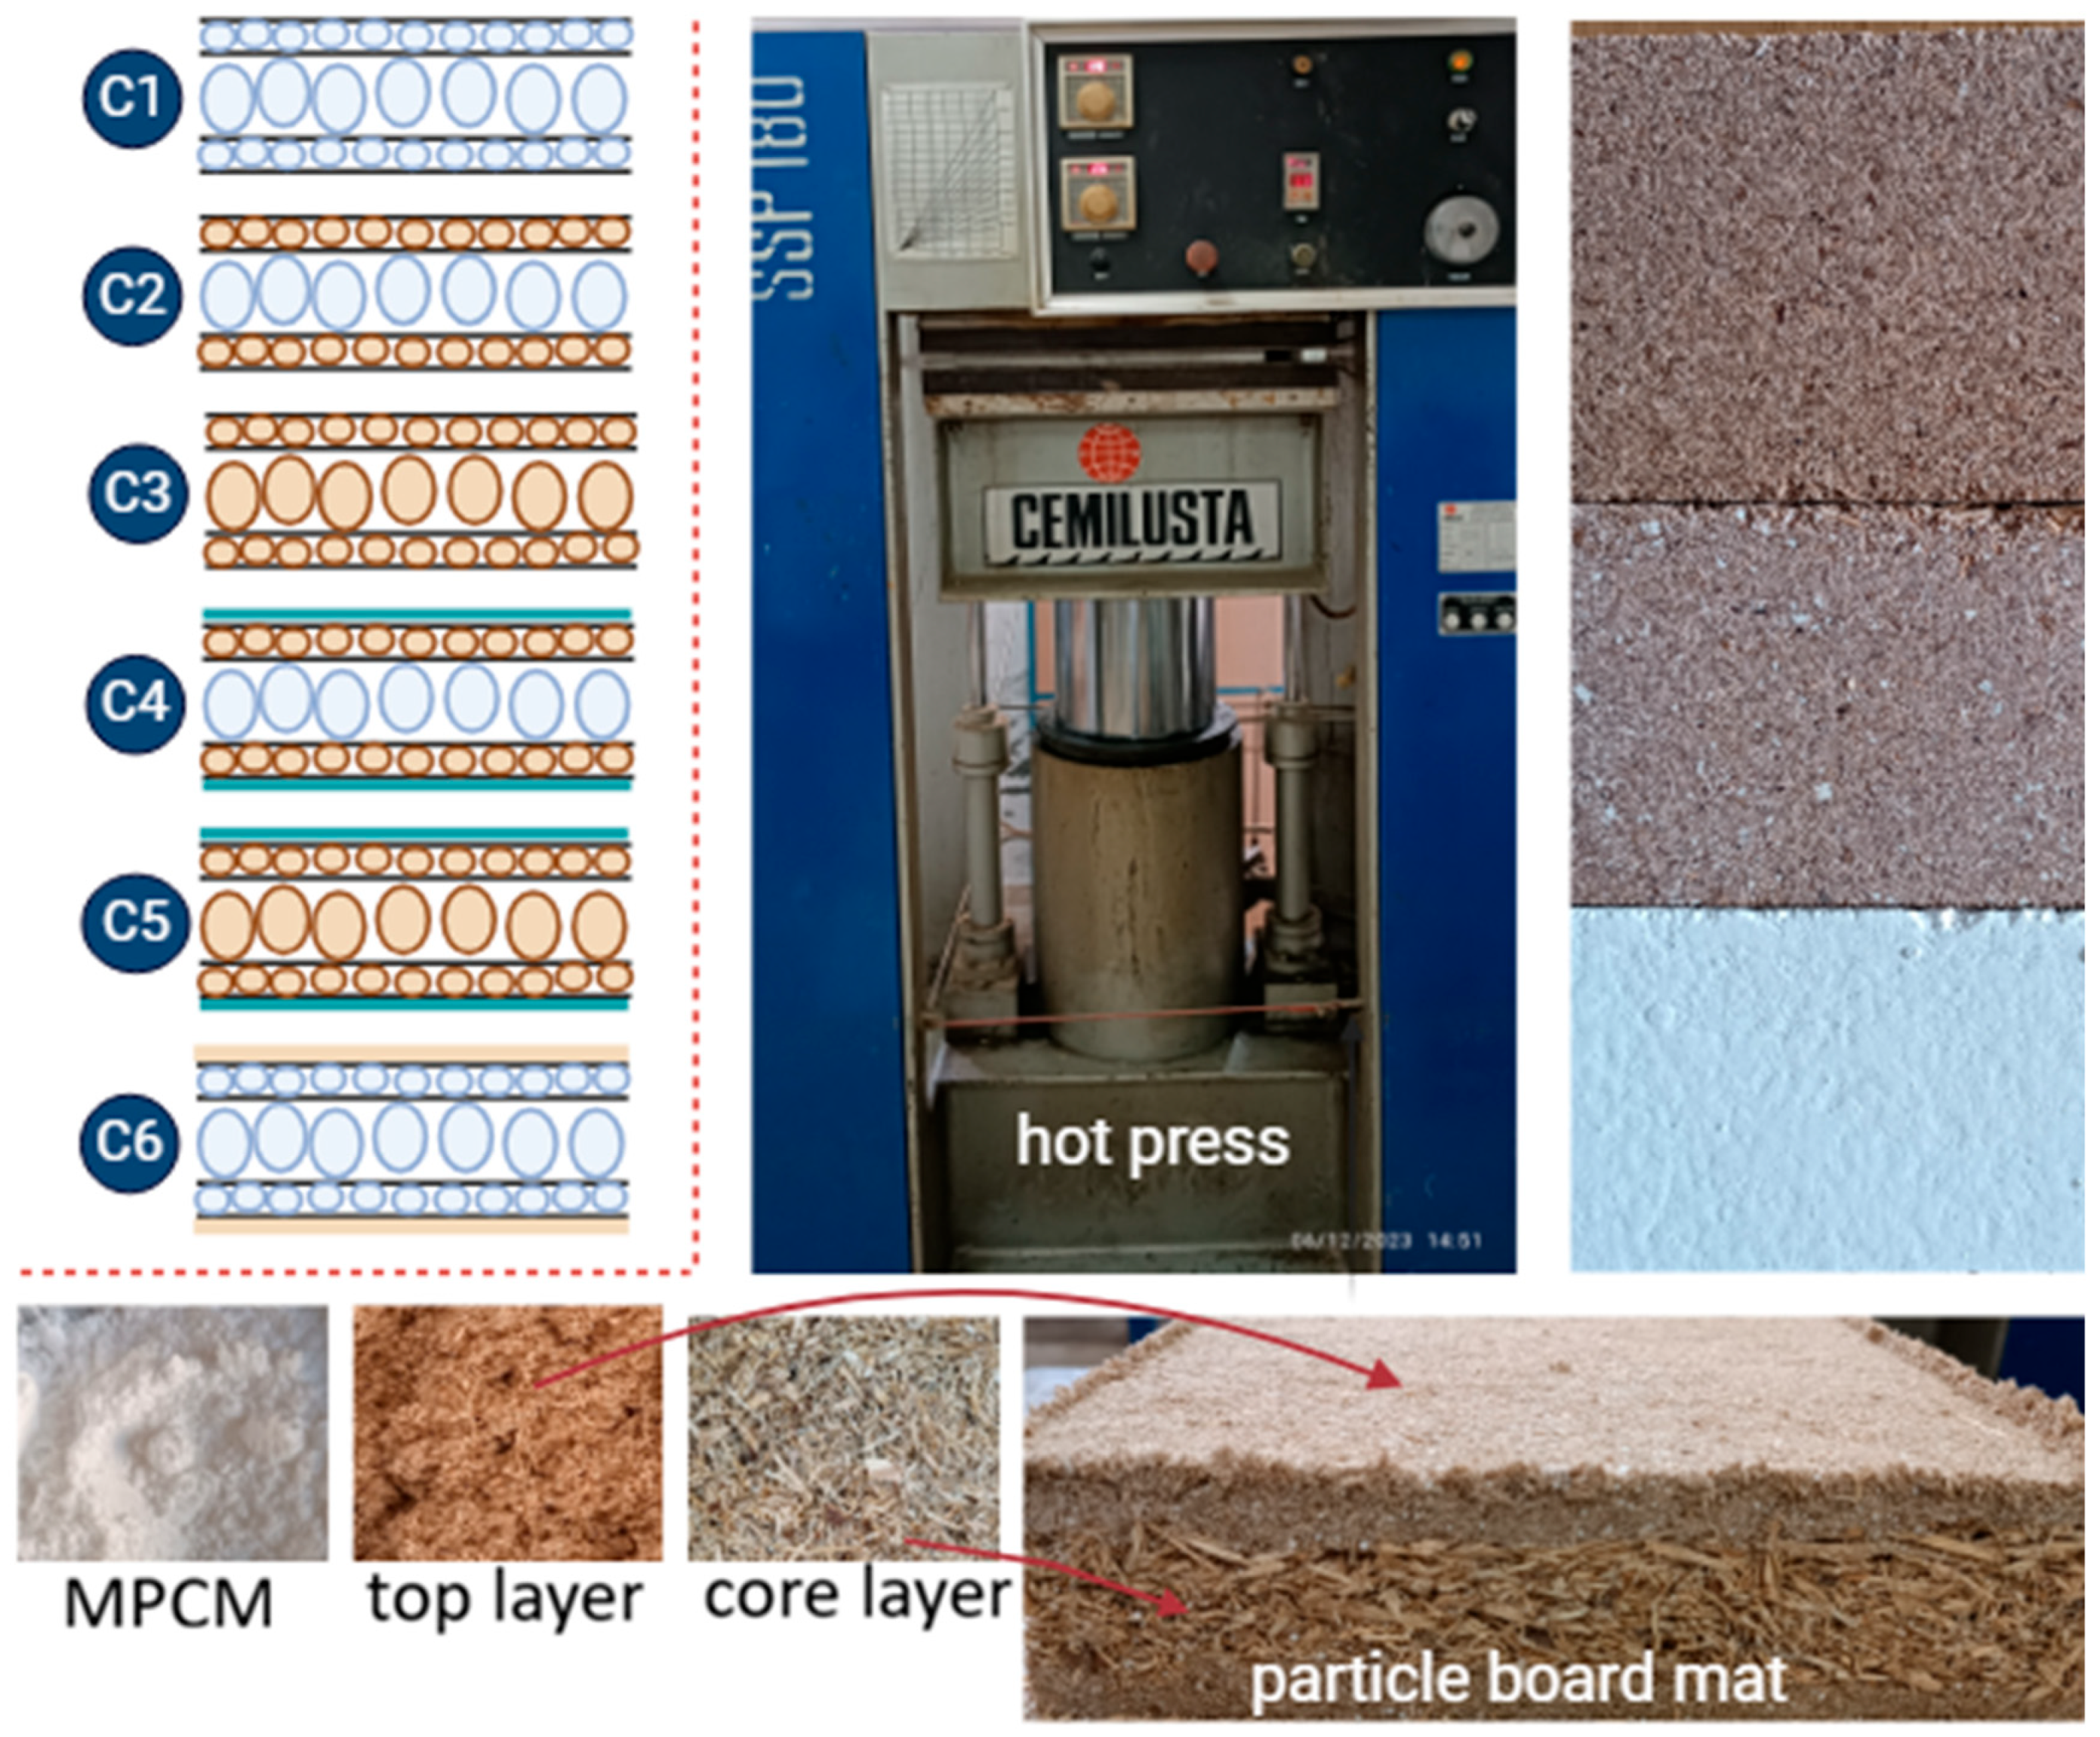
The MPCM produced by Microtek Laboratories, Inc. was used in this study. The MPCMs have a melting temperature of around 25.72 °C, a latent heat of fusion of about 110 J/g, a particle size range of 15 μm to 30 μm, and a density of about 0.9 g/cm3. Some features of the MPCM used are given in our previous study [18]. In the study, 032-XXXX Aqua-Tech water-based MDF filler and 031-XXXX Aqua-Tech Water-Based Interior Topcoat Y. Matte Paint, obtained from Kubilay Boya/İnegöl company (İnegöl/Türkiye), were used. The image of the materials used is shown in Figure 1.

2.2. Methods

The 3-layer composite materials were made using the pre-manufactured surface and core chips obtained from the particleboard machine. The chip usage rate of the top and bottom layers was 20%, whereas the core layer exhibited a chip utilization rate of 60%. Before the application of the adhesive, the chips were subjected to a drying procedure to get a moisture content that is within the range of 1% to 3%. The top layers were coated with a 10% adhesive amount, while the core layer was coated with an 8% adhesive quantity. An adhesive gun was used to coat the chips with adhesive. The coated chips were arranged in a 250 × 250 mm stacking mold to obtain a three-layer structure. The assembly was then placed between press plates inside a hot press. After being removed from the press, the boards were subjected to a cooling procedure and then subjected to conditioning. This included subjecting them to a controlled environment with a relative humidity of 65% ± 5% and a temperature of 20 ± 2°C. Test samples were acquired from the boards to analyze their qualities. The MPCM was introduced into chips and paint in varying amounts, as further detailed in the following sections. The additional parameters for particleboard manufacture are given in Table 2.
In the control group (C1), only chipboard was used. For the first application group of the experiment (C2), 40 g of MPCM was used in the bottom layer and 40 g in the top layer. The third group (C3) contained 26.6 g of MPCM in the bottom layer, 26.6 g in the core layer, and 26.6 g in the top layer. For the fourth group (C4), 40 g of MPCM was used in the bottom layer and 40 g in the top layer, paint was applied without MPCM. In the fifth group (C5) there was a structure containing 26.6 g of MPCM in the bottom layer, 26.6 g in the core layer and 26.6 g in the top layer, paint was applied without MPCM. For the sixth group (C6), the reference composite that does not contain MPCM in its layers was applied to the surface of the samples, with 10 g MPCM in first coat filler, 10 g MPCM in second coat filler, 10 g MPCM in the primary coat paint, and 10 g MPCM in the second coat paint (Figure 1). These various application amounts were used to determine how the energy storage properties of particle boards used in furniture would be highest. The MPCM location, MPCM dosage, coating/filler condition, and whether a paint contains MPCM are given in Table 3.
The surfaces of the composites were cleaned and sanded using 180 grit sandpaper, and the filler and surface painting were carried out with a brush. Approximately 10 g of paint was applied per square meter. Filler and paint were applied in two layers. After the first coat application, the second coat was applied to the samples that were kept in room conditions for 24 h. After the first and second coat filler applications, the sample surfaces were sanded with 180 grit sandpaper to remove any surface roughness and lumps.

2.3. Characterizations of WBHC

Prior to analysis, the composite sheets were milled into a fine powder to ensure homogeneous measurement conditions (Fritsch, Idar-Oberstein, Germany). The WBHC powder was ground and passed through a 60-mesh sieve (approximately 0.25 mm) prior to further analyses. The characterization of composite materials was carried out on the C3 variation, in which MPCM was placed in all three layers during production. Morphological structural studies were performed using a field emission scanning electron microscope (SEM) (Zeiss LEO 440 model, Carl LEO, Cardiff, UK). Conversely, a Hitachi-7020 model (Hitachi High-Tech Corporation, Hitachinaka, Japan) differential scanning calorimetry (DSC) analyzer was used to examine the TES properties of the WBHCs. DSC analyses were performed in an environment of nitrogen gas at a rate of 3 °C per minute of heating and cooling. Fourier transform infrared (FTIR) spectroscopy was employed to elucidate the chemical characteristics of the WBHC. Infrared spectra were recorded over the wavenumber range of 400–4000 cm−1 using a JASCO FTIR-430 spectrometer (ASCO Corporation, Hyōgo, Japan). Thermal stability and degradation behavior of the samples were evaluated by thermogravimetric analysis (TGA). Measurements were conducted with a PerkinElmer TGA-7 thermal analyzer (PerkinElmer, Inc., Hopkinton, MA, USA) under an inert argon atmosphere. The samples were heated from 30 °C to 600 °C at a constant heating rate of 20 °C·min−1.

2.4. Thermal Regulation Performance Tests

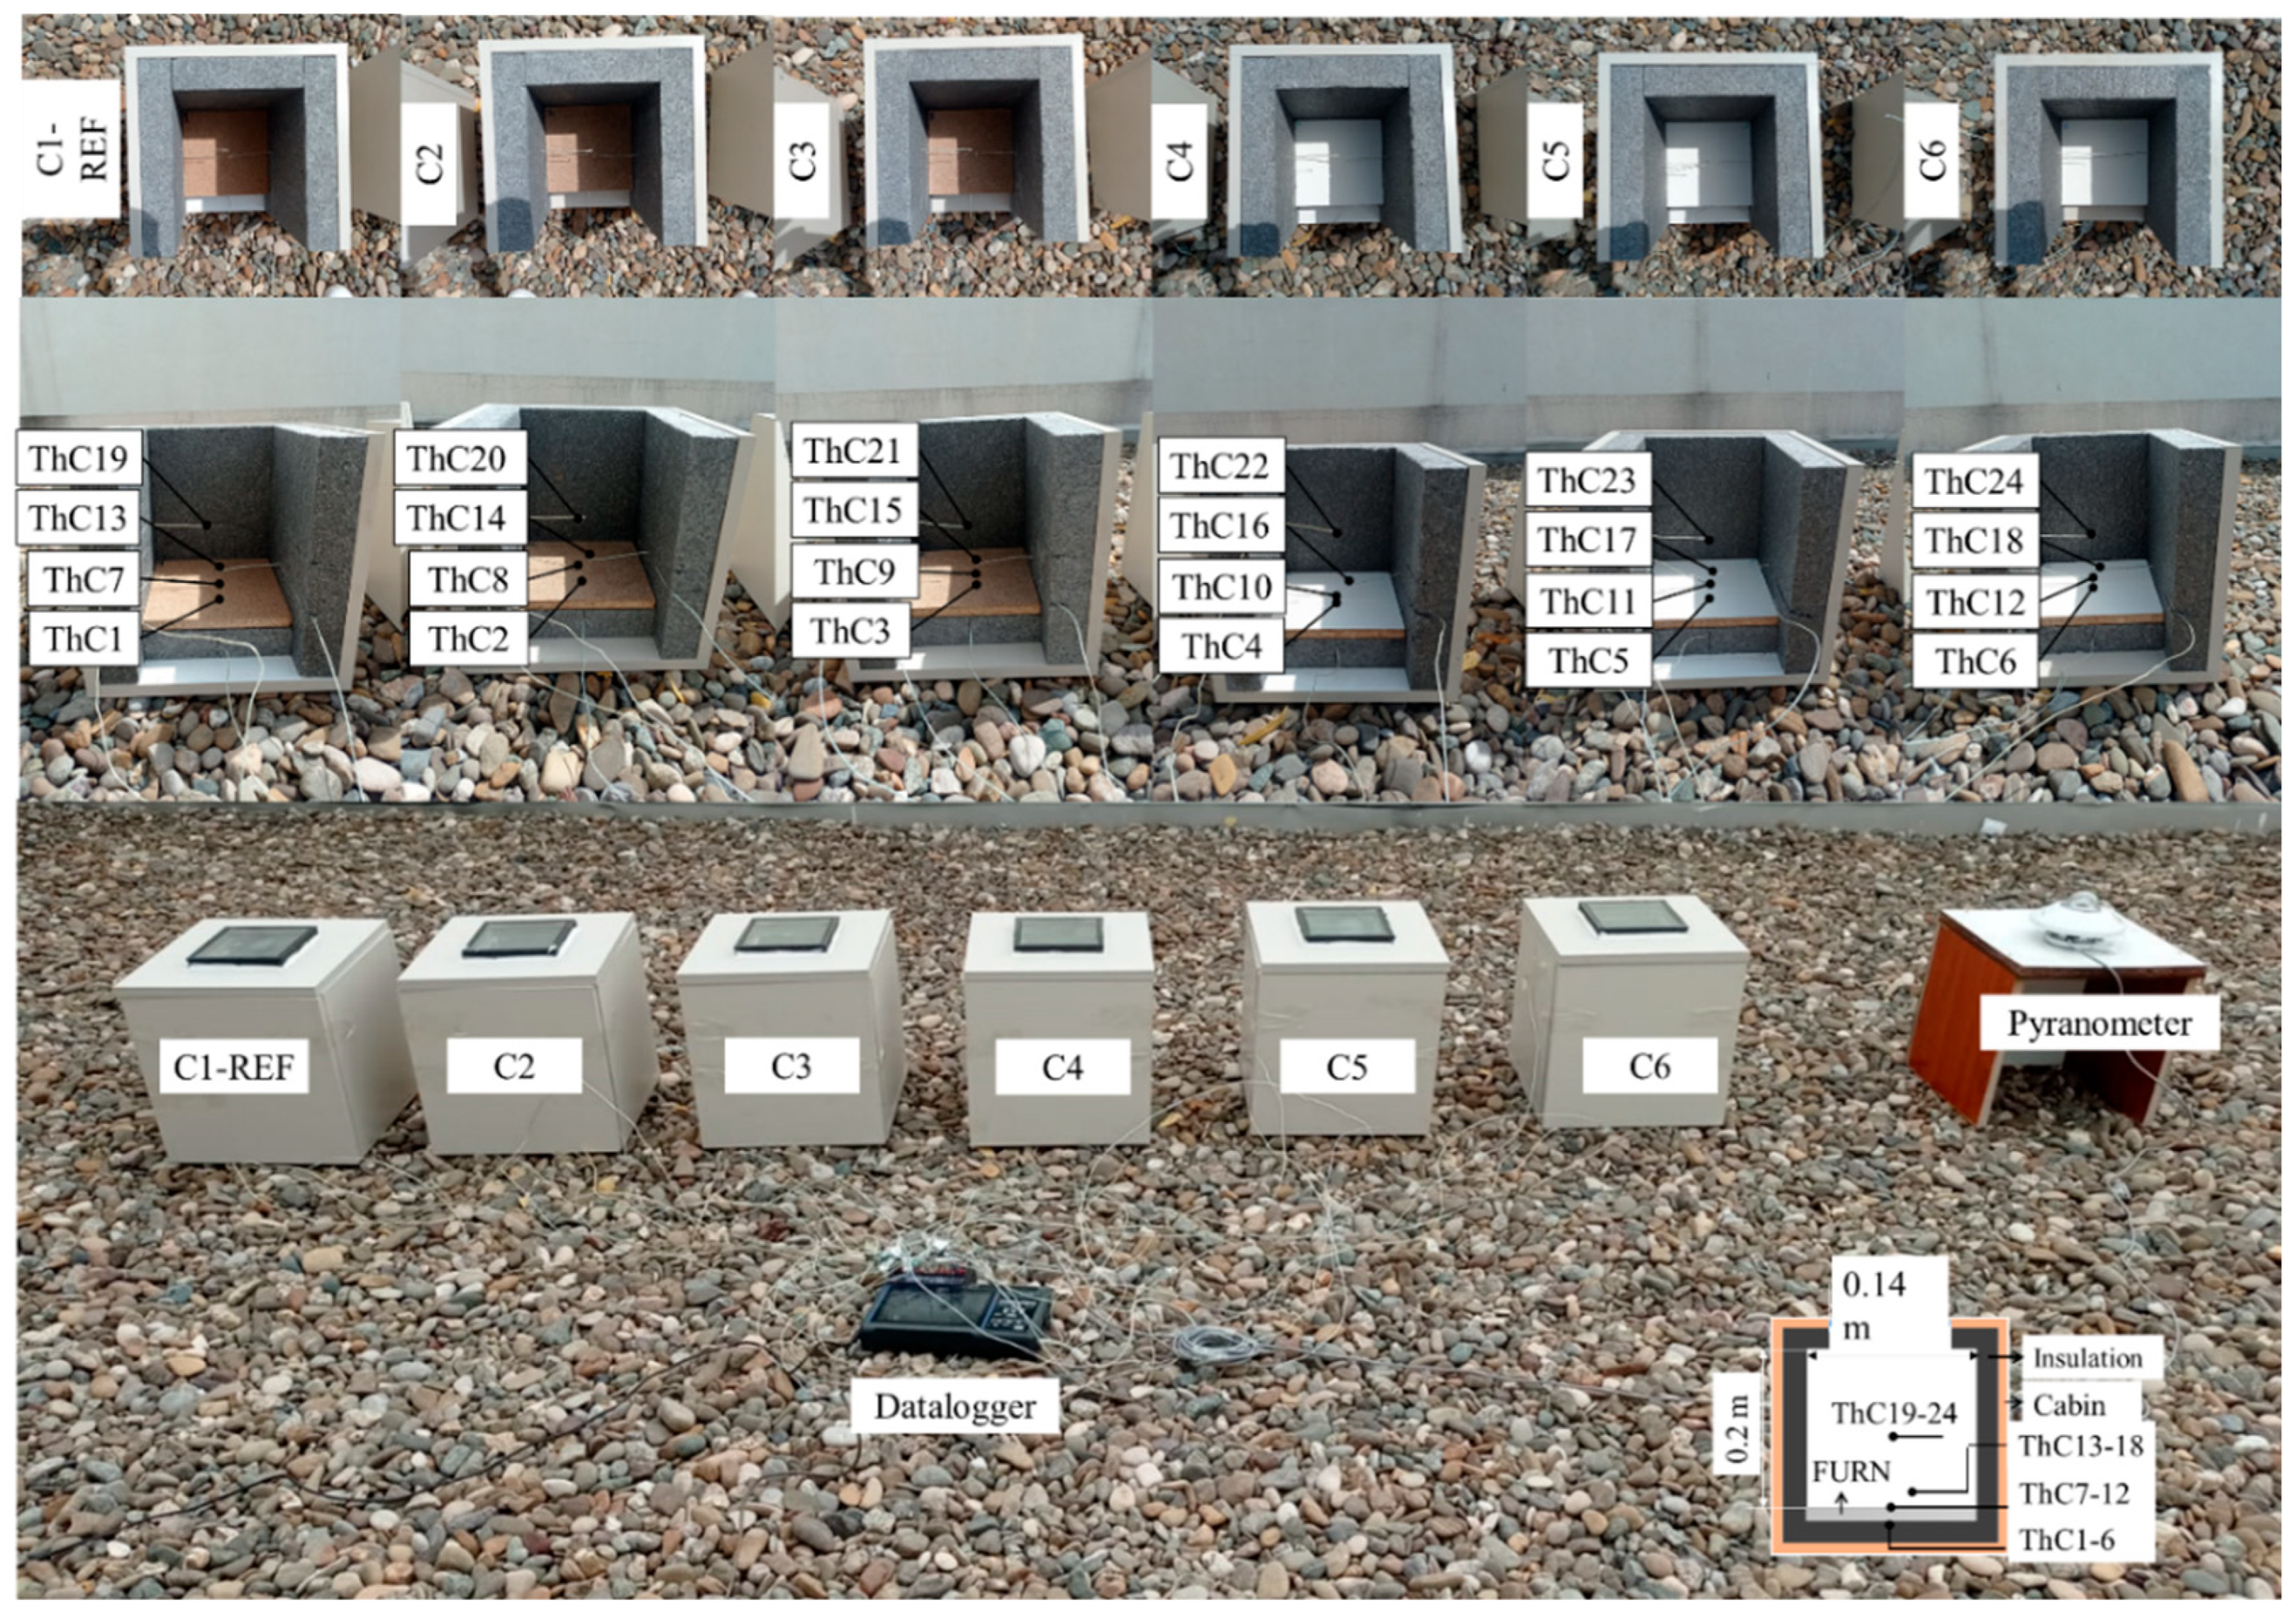
In a real-ambient scenario, the thermoregulation qualities of the control particle board (C1) and MPCM-added boards with different variations (C2, C3, C4, C5, and C6) were investigated. The experiment was conducted from the roof of the Faculty of Engineering, Architecture, and Design Office building at Bartin University on 17–18 April 2024, on days where there was a combination of clouds and sunny weather. Six identical test chambers were used for the experiment. Figure 2 shows the test cabins’ experimental configuration. For testing, samples with dimensions of 20 × 20 × 1.6 cm3 were placed on the test chamber floors and temperature readings were taken in four different areas (lower-surface, upper-surface, near-surface and center) of each chamber. The measurements included the bottom and top surfaces of the particle boards, a point located 0.01 m from the board surface, and the volume center of the test chamber. To measure global solar radiation value, an Eco MS-410 pyranometer (EKO Instruments, Tokyo, Japan) was utilized. The air’s cloudiness index was used to calculate the solar radiation levels, both diffuse and direct. For two days, the measurements were conducted continually.

2.5. Contact Angle

Contact angle measurements were conducted using a drop shape analysis system (DSA100, KRÜSS GmbH, Hamburg, Germany; software version 1.92). Distilled water at 20 °C was employed as the test liquid and dispensed onto the sample surfaces through a dosing unit equipped with a 0.5 mm needle positioned 3 mm above the surface. A droplet volume of 2 μL was consistently applied for all measurements. The evolution of droplet geometry on the surface was monitored over a period of 90 s, with image acquisition performed at 4 s intervals. For each specimen, contact angle values were obtained from four distinct surface points, and five replicate samples were evaluated for every treatment group to ensure statistical reliability.

2.6. Surface Roughness

Surface roughness characteristics were evaluated in accordance with ISO 4287 [19] standards using a Mitutoyo Surftest SJ-310 profilometer (Mitutoyo Corporation, Kawasaki, Japan). A diamond stylus (R-type) with a tip radius of 2 μm was employed during the measurements. The cutoff length (λc) was set to 0.8 mm, while the evaluation length was maintained at 12.5 mm. Scanning was performed perpendicular to the fiber direction at a traverse speed of 0.5 mm·s−1. The arithmetic mean roughness (Ra) parameter was selected to quantify surface irregularities. For each sample, roughness measurements were obtained from ten independent locations to ensure representative surface characterization.

2.7. Mechanical Properties

The internal bond strength (IB) as well as the bending-related properties, namely modulus of rupture (MOR) and modulus of elasticity (MOE), of the MPCM/WBHC panels were evaluated in accordance with TS EN 319 and TS EN 310 standards [20,21]. For each composite formulation, mechanical testing was performed using five replicate specimens.

2.8. Statistical Analysis

A descriptive analysis was developed (mean and standard deviation) for mechanical properties. ANOVA was applied to verify the MPCM on mechanical properties. Duncan’s test was set at a 99% confidence level to determine the statistical difference between the means.

3. Results and Discussion

3.1. Characterizations of MPCM/WBHC

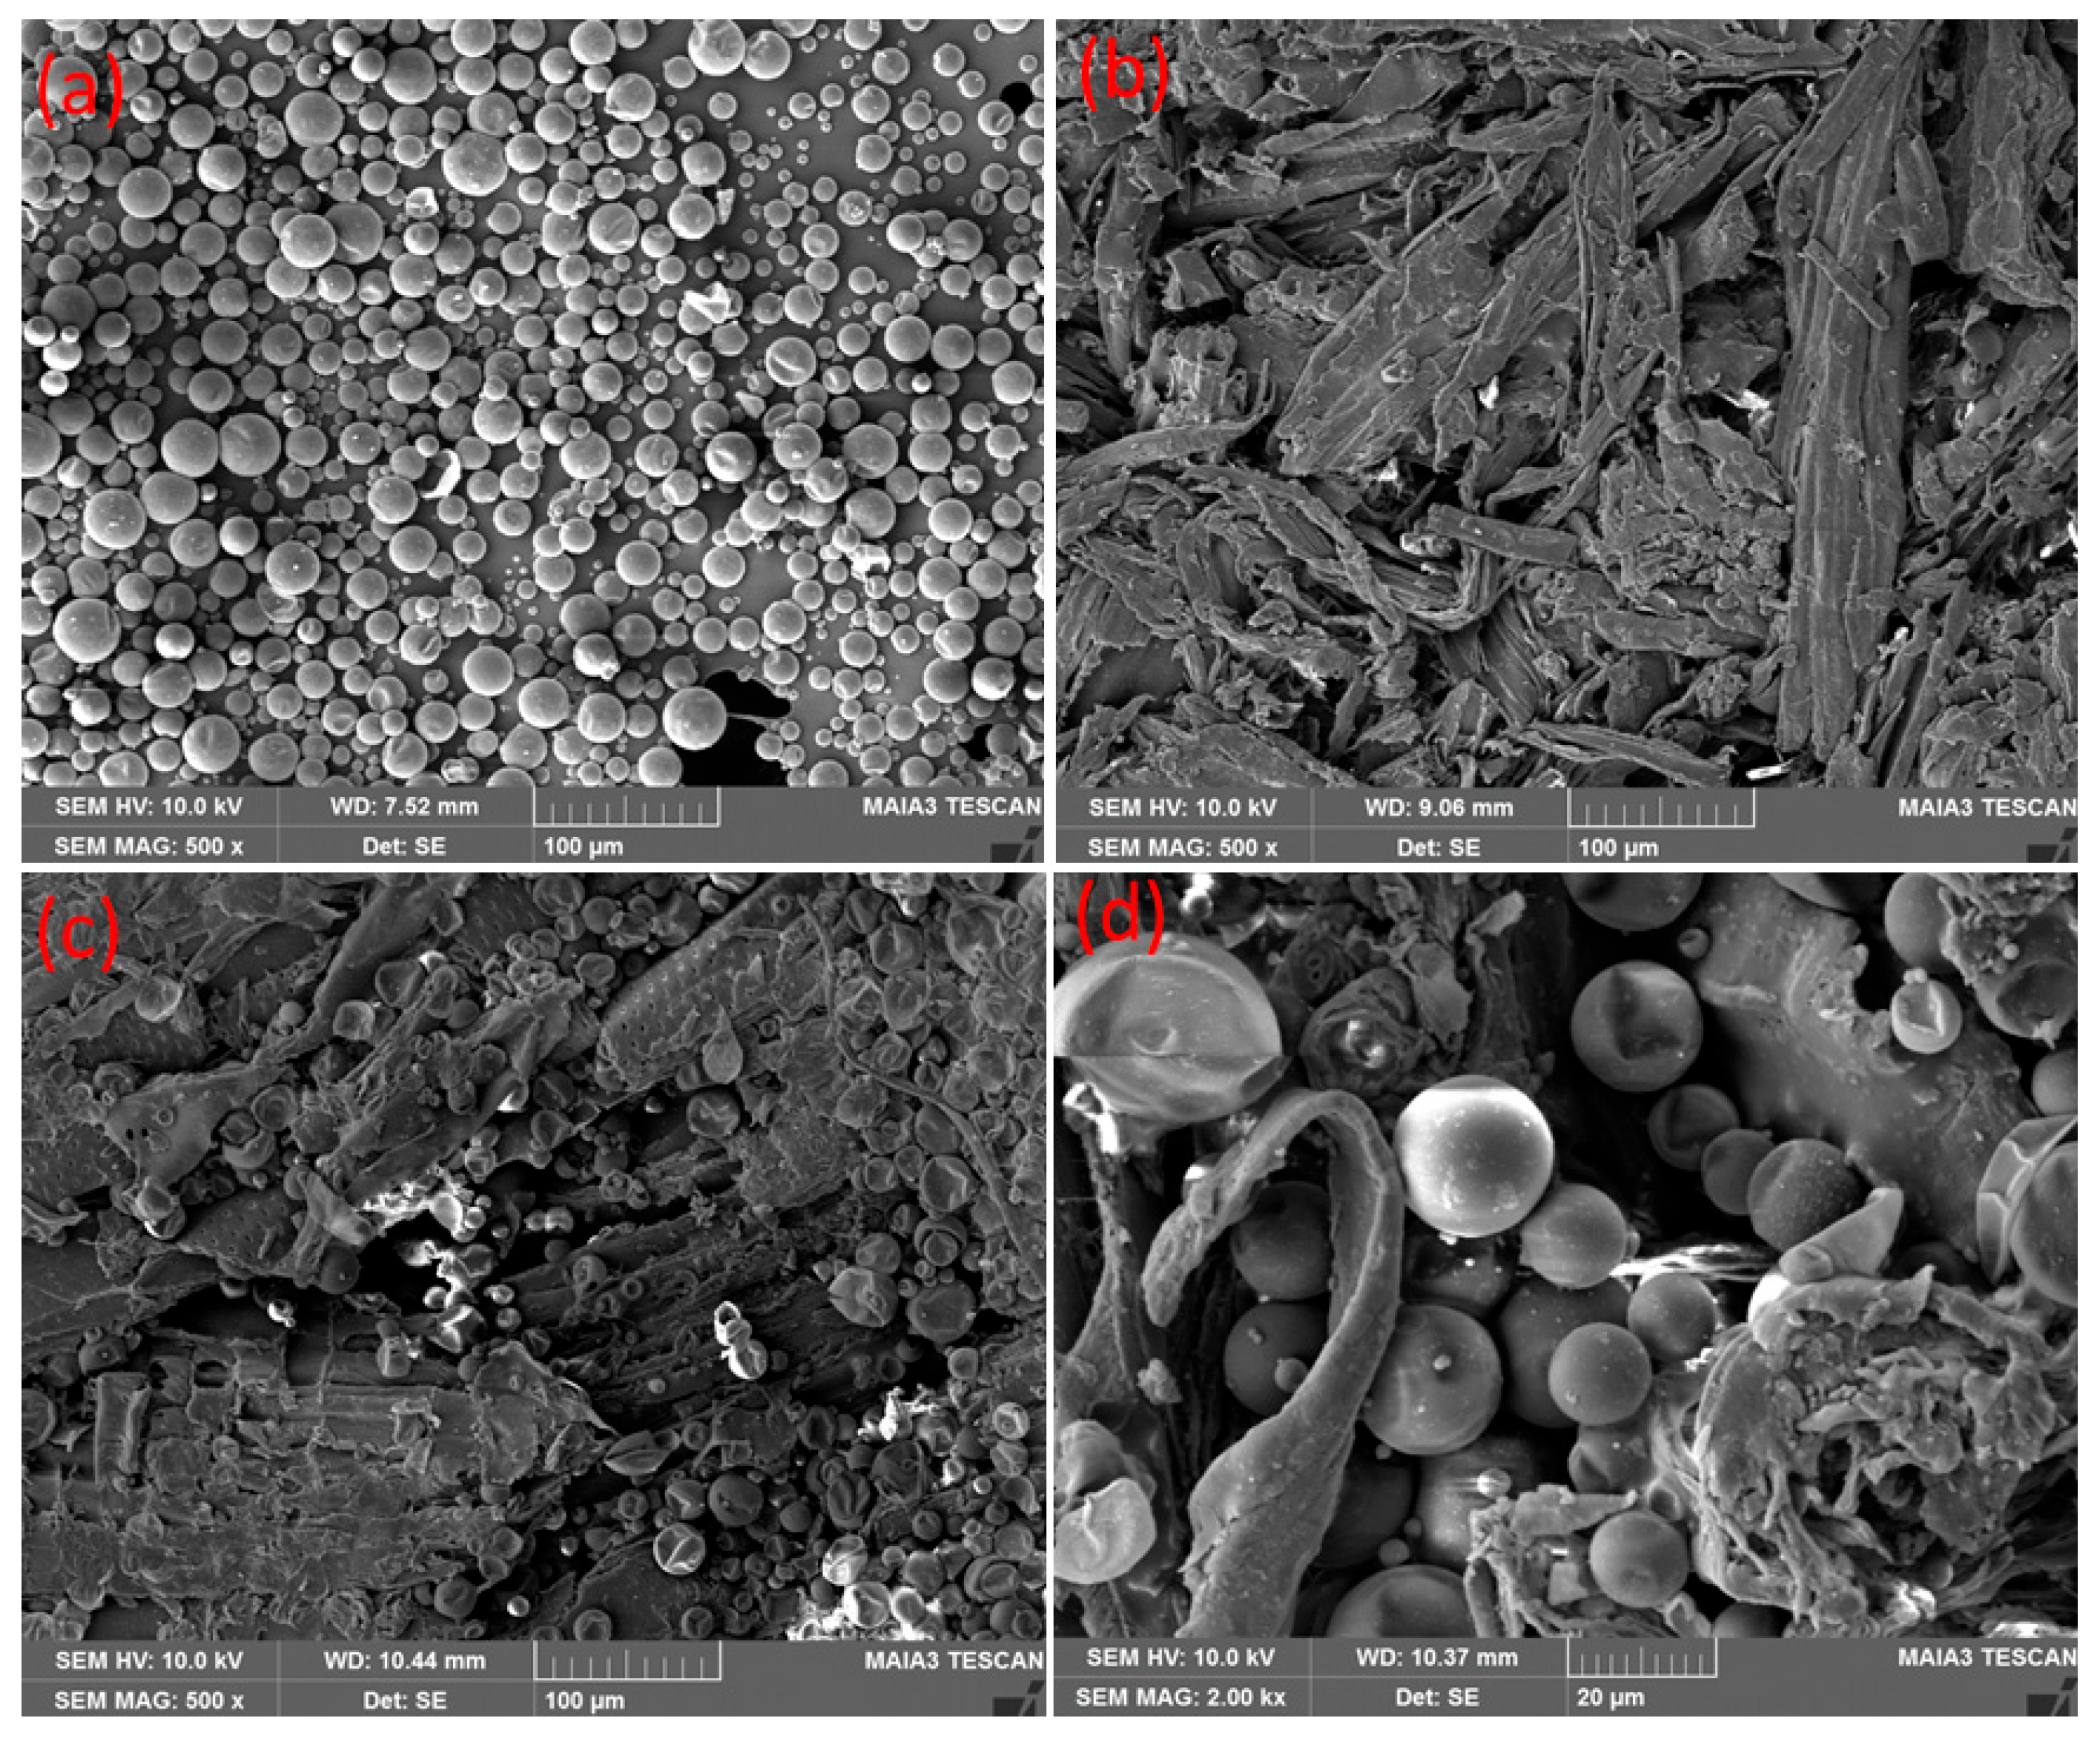
Figure 3 illustrates the microstructural features of the MPCM (a), WBHC (b), and MPCM/WBHC composites observed at magnifications of 500× and 2000×. As shown in Figure 4a, the microencapsulated PCM particles exhibit a predominantly spherical morphology with relatively smooth outer surfaces. The WBHC structure (Figure 3b) is composed of intertwined wood chip elements with characteristic widths and lengths ranging approximately from 5 μm to 200 μm. The interlaced arrangement of these wood chips creates interparticle voids, while micro- and nanoscale pores are distributed across the chip surfaces, providing favorable sites for MPCM retention via physical adsorption mechanisms. Examination of the MPCM/WBHC composite micrographs (Figure 3c,d) reveals that the MPCM is effectively distributed both on the wood chip surfaces and within the interstitial spaces between adjacent strands. In some regions, partial rupture of the MPCM shell structure was detected, particularly in the upper layers of the composite, which can be attributed to mechanical stresses encountered during the hot-pressing process. The intimate interfacial contact and uniform dispersion of MPCM within the wood-based matrix indicate good compatibility between the two phases, which is facilitated by the presence of the urea–formaldehyde adhesive system. However, it is seen that the microcapsule structure is preserved in the core layer of the composites (Figure 3d). In a literature study, it was emphasized that the bond between softwood fibers (WF) and MPCM is provided by starch [22].
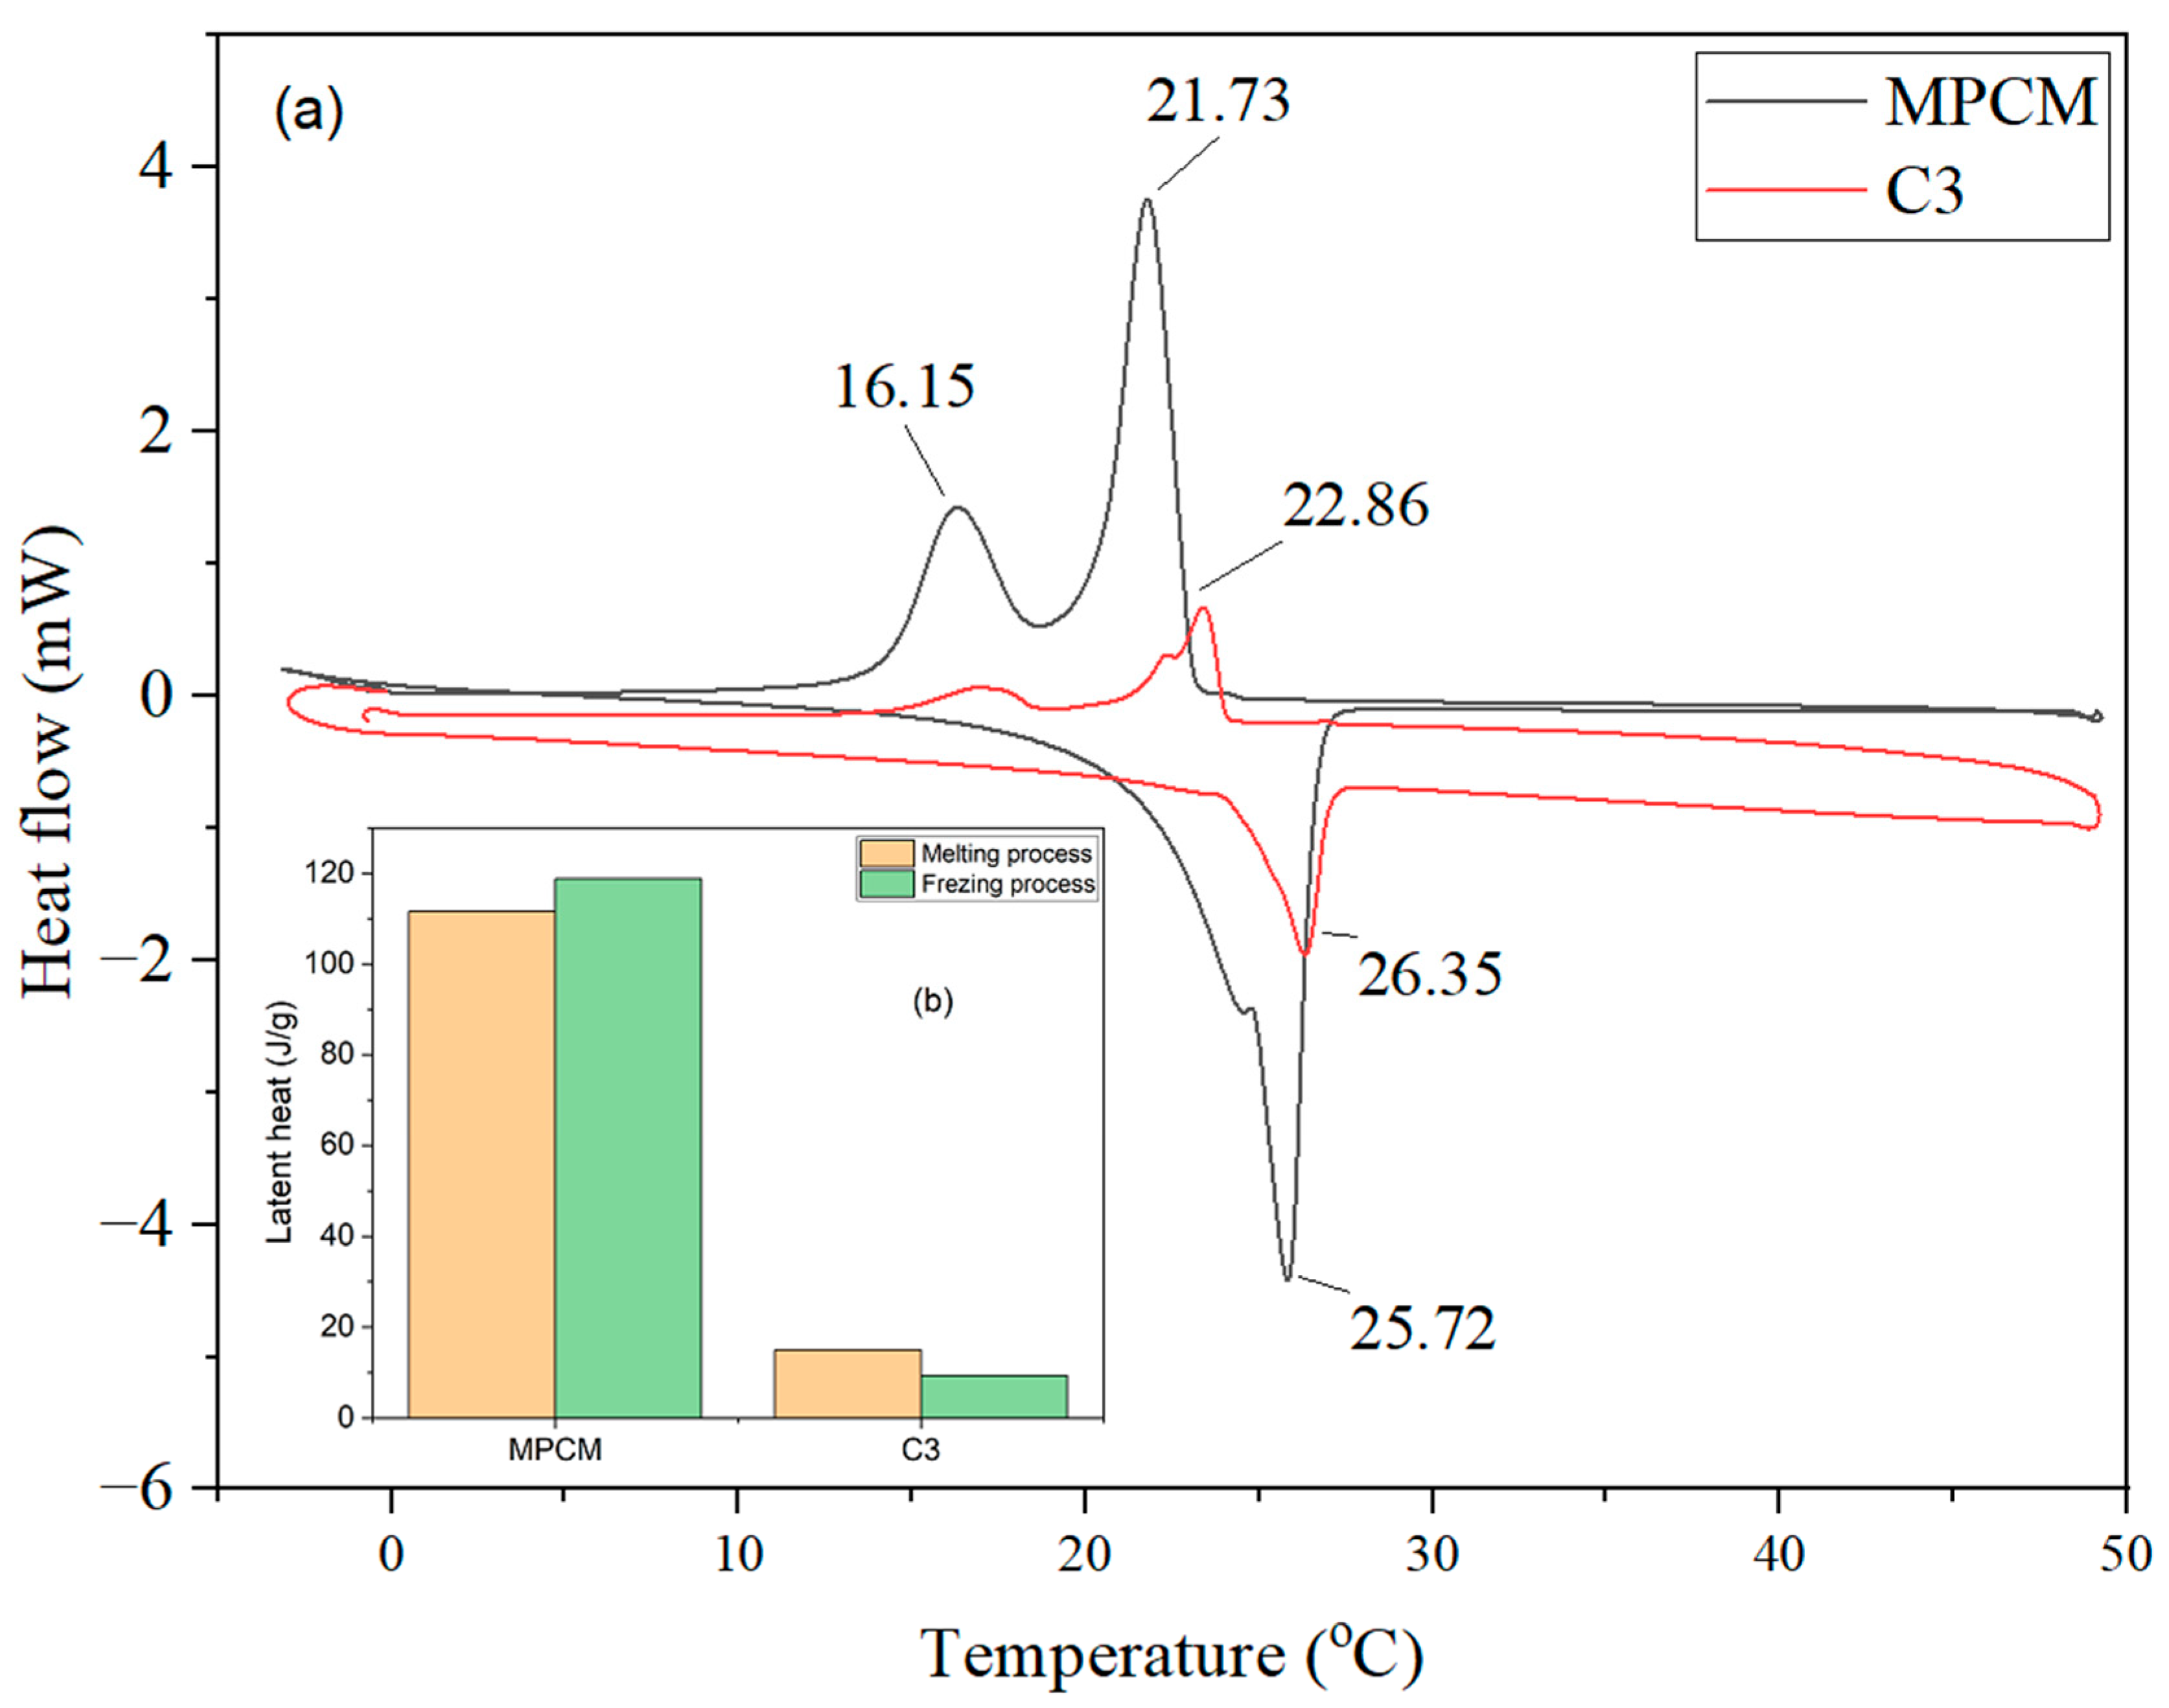
DSC was used to examine the thermal energy storage capacity and phase change temperature of composite. Figure 4 displays the melting and freezing DSC curves. The freezing and melting latent heat of MPCM were 118.75 J/g at 21.73 °C and 111.67 J/g at 25.72 °C respectively, while the enthalpy of MPCM/WBHC (C3) was reduced to 15.04 J/g at 22.86 °C and 9.33 J/g at 26.35 °C. This is because wood chips are unable to store thermal energy and wood plays a role of supporting material without phase transition behavior [23].
As can be observed from Figure 4, C3 nevertheless had an acceptable latent heat that was only marginally lower than MPCM’s, and the phase transition temperature, although showing a large enthalpy loss in comparison to MPCM. Consequently, C3 has a significant potential for usage as a construction material that saves energy at room temperature when it has the proper temperature and excellent enthalpy. Depending on the weather, PCMs with phase transition temperatures ranging from 18 °C to 28 °C are advised [22,24,25,26]. The MPCM employed in this study exhibits a melting point of 25 °C. Phase change and heat storage are efficiently facilitated by this PCM. However, on hot summer days, its phase change temperature may induce melting; hence, mid-season and moderately chilly areas are better suited for its use. Despite this limitation, the MPCM can lower yearly cooling demands on warm days in addition to offering heating advantages in the winter.
The latent heat retention ratio was calculated in formula 1 to evaluate more accurately the effect of MPCM incorporation into the wood-based composite. The latent heat retention ratio was calculated based on the experimentally measured enthalpy value of the MPCM-containing composite with the theoretical enthalpy contribution expected from the incorporated amount of MPCM.
L a t e n t   h e a t   r e t e n t i o n   r a t i o   ( % ) = Δ H c o m p o s i t e m M P C M × Δ H M P C M × 100
In the formula, ΔHcomposite is the measured latent heat capacity of the MPCM-containing composite (J/g), mMPCM is the mass ratio of MPCM in the composite, and ΔHMPCM is the latent heat capacity of pure MPCM (J/g).
The latent heat retention ratio was calculated as 42.21% based on the experimental data of the latent heat value of C3. These results show that a large percentage of the latent heat storage capacity of MPCM was retained after incorporation in the wood-based composite structure. The lower latent heat capacity than pure MPCMs might be attributed to the dilution effect of the wood matrix and limited accessibility of some MPCM particles during phase transition.
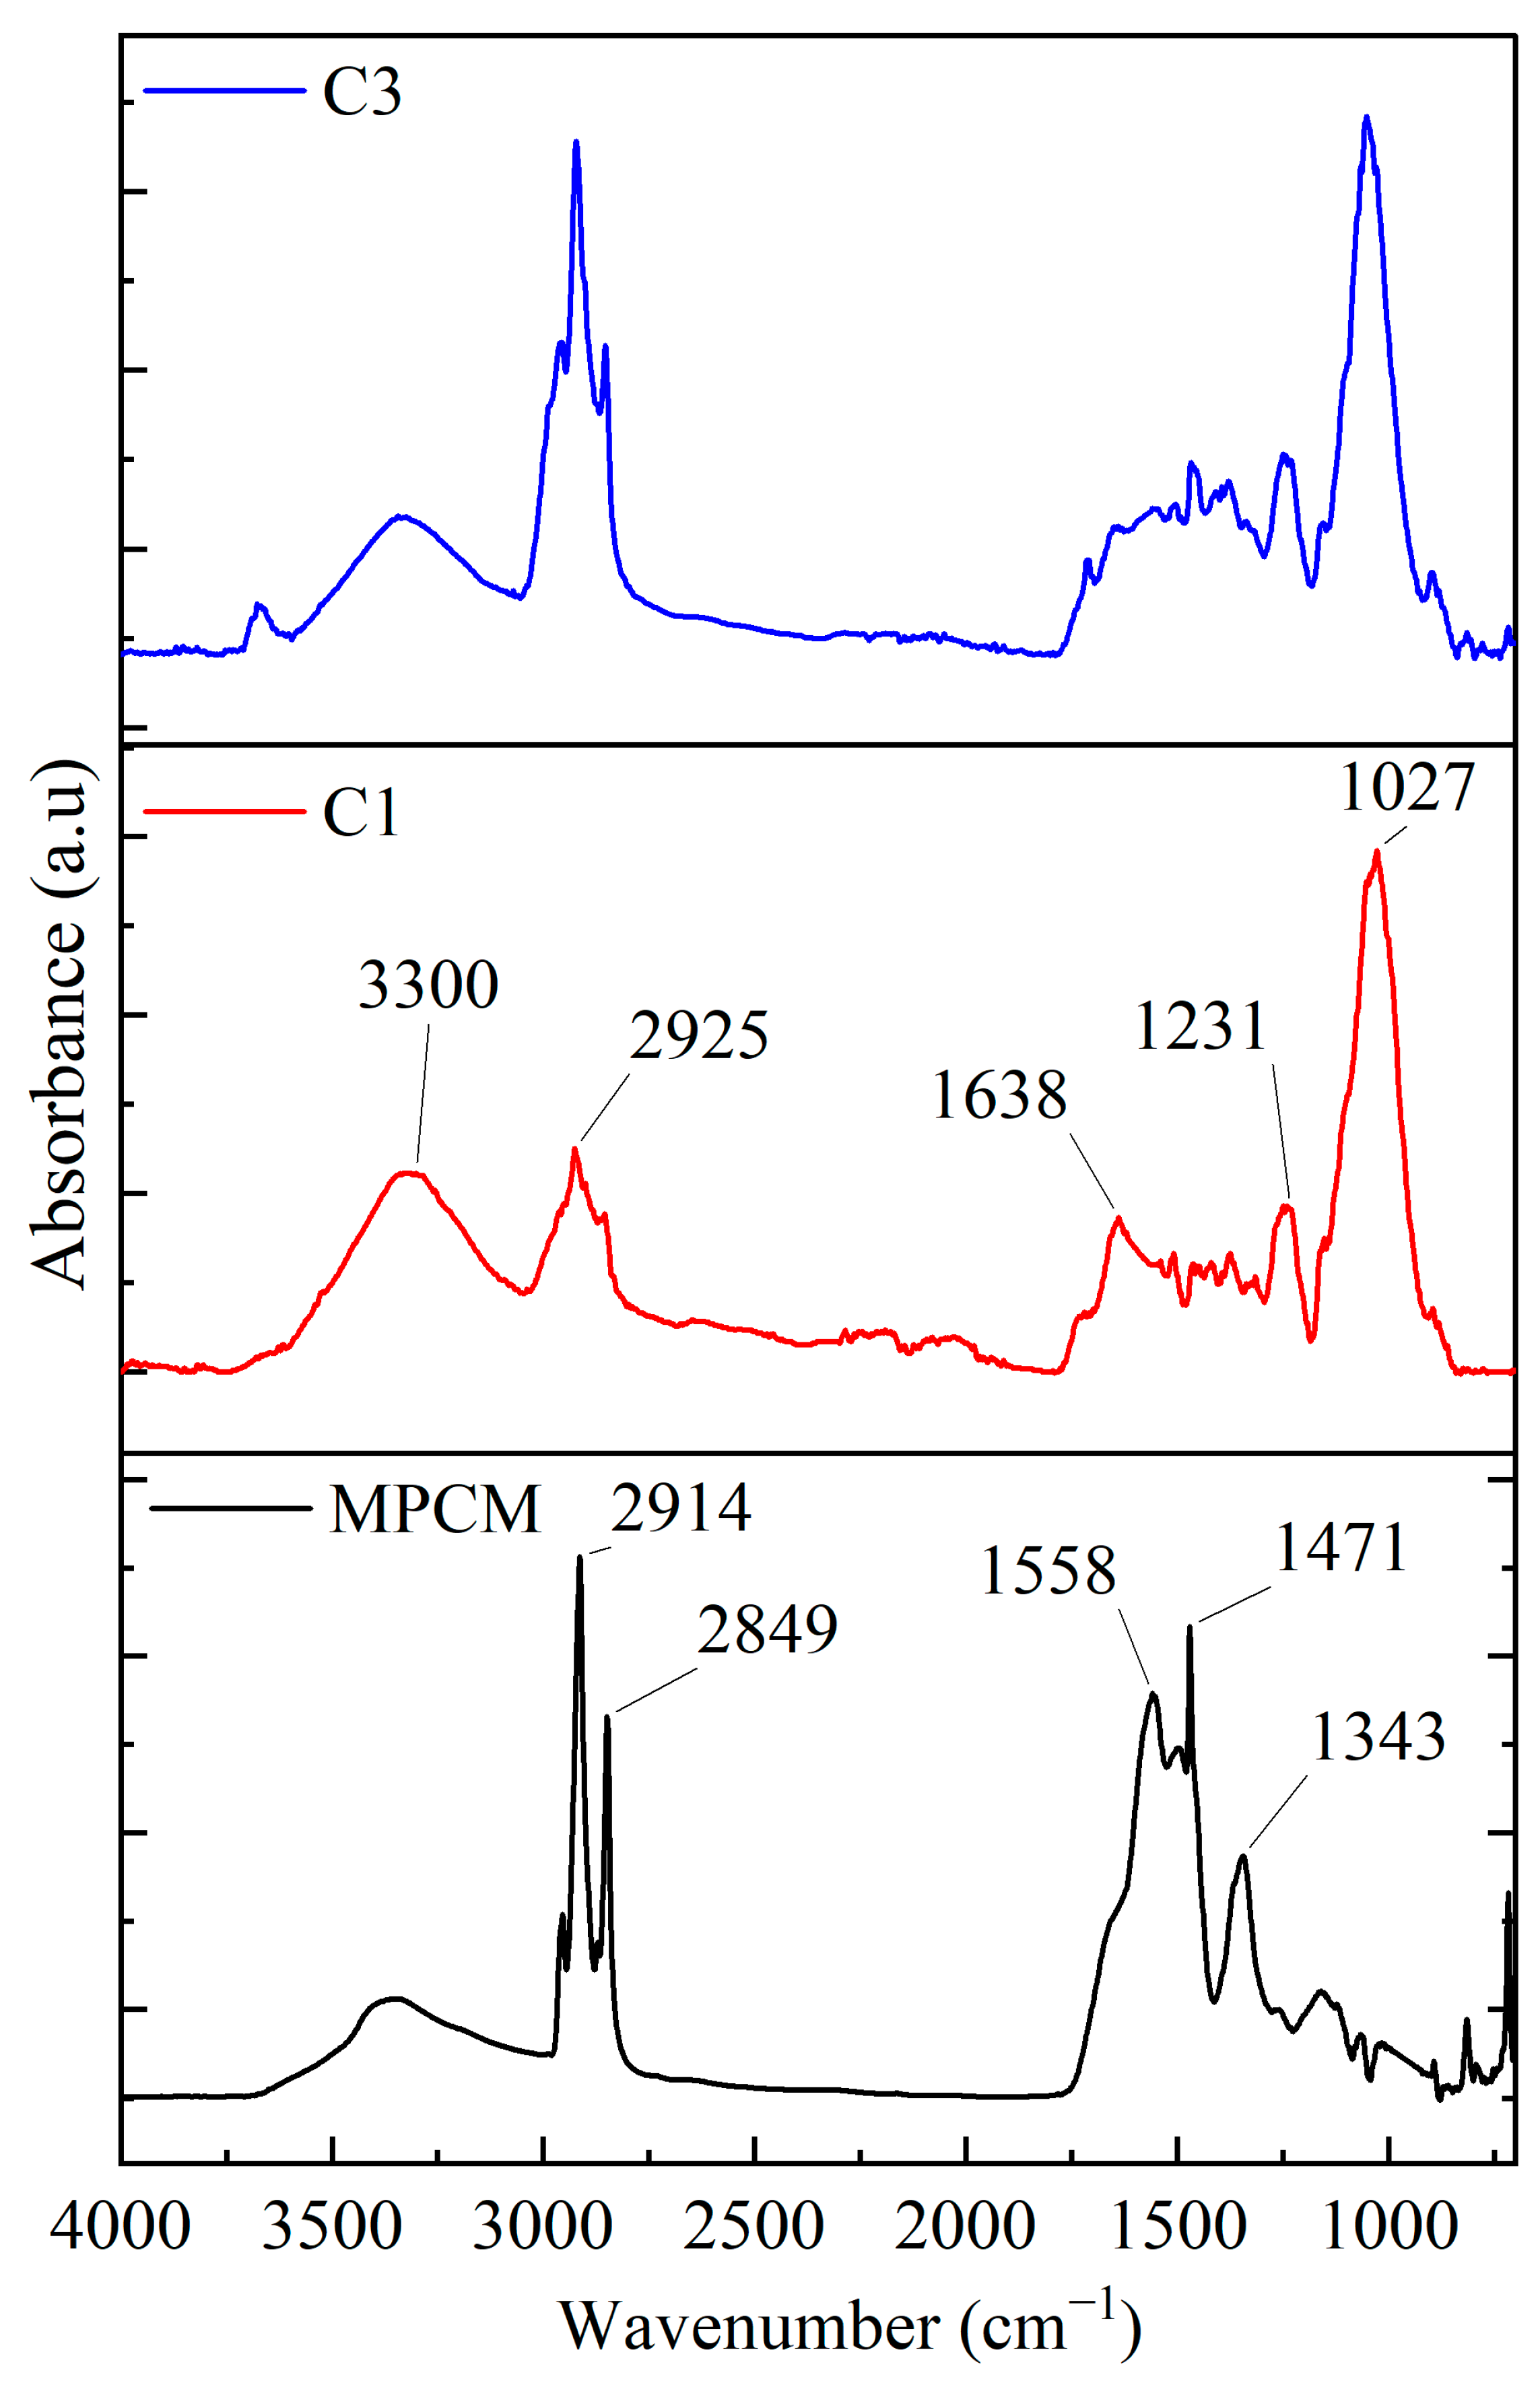
Figure 5 displays the FTIR spectra of MPCM, C1, and C3 wood-based composites. Peaks at 2914 cm−1 and 2849 cm−1 in the FTIR of MPCM were generally found to be linked to stretching vibration band CH2 groups [27,28]. The big peak at 3335 cm−1 represents the traditional OH group stretching vibrations. The peaks at 1343 cm−1 and 1471 cm−1 are associated with the C-H bond bending vibrations [22,25].
The stretching of intermolecularly linked hydroxyl groups in aliphatic or aromatic alcohols found in lignin is responsible for the broad band observed at 3330 cm−1 in the wood chips spectrum. Stretching vibrations of C=C bonds in aromatic structure and bending vibrations of C-H groups in lignin are the characteristics of the 1595 cm−1 and 1231 cm−1 bands, respectively. The asymmetrical stretching of C-O-C in cellulose and hemicelluloses resulted in the formation of the 1027 cm−1 band. These wood peaks appear on the C1 composite material. Unlike the wood peaks, peaks arising from glue appear at 2925 cm−1 and 1638 cm−1. These peaks are methylene C-H asymmetric vibrations at 2925 cm−1 and C=C band vibrations of the product aromatic ring [22,29].
The outstanding compatibility among the components of the leak-proof composite is further demonstrated by the presence of the same peaks of both MPCM and wood chips, devoid of any additional bands, in the FTIR spectrum of C3.
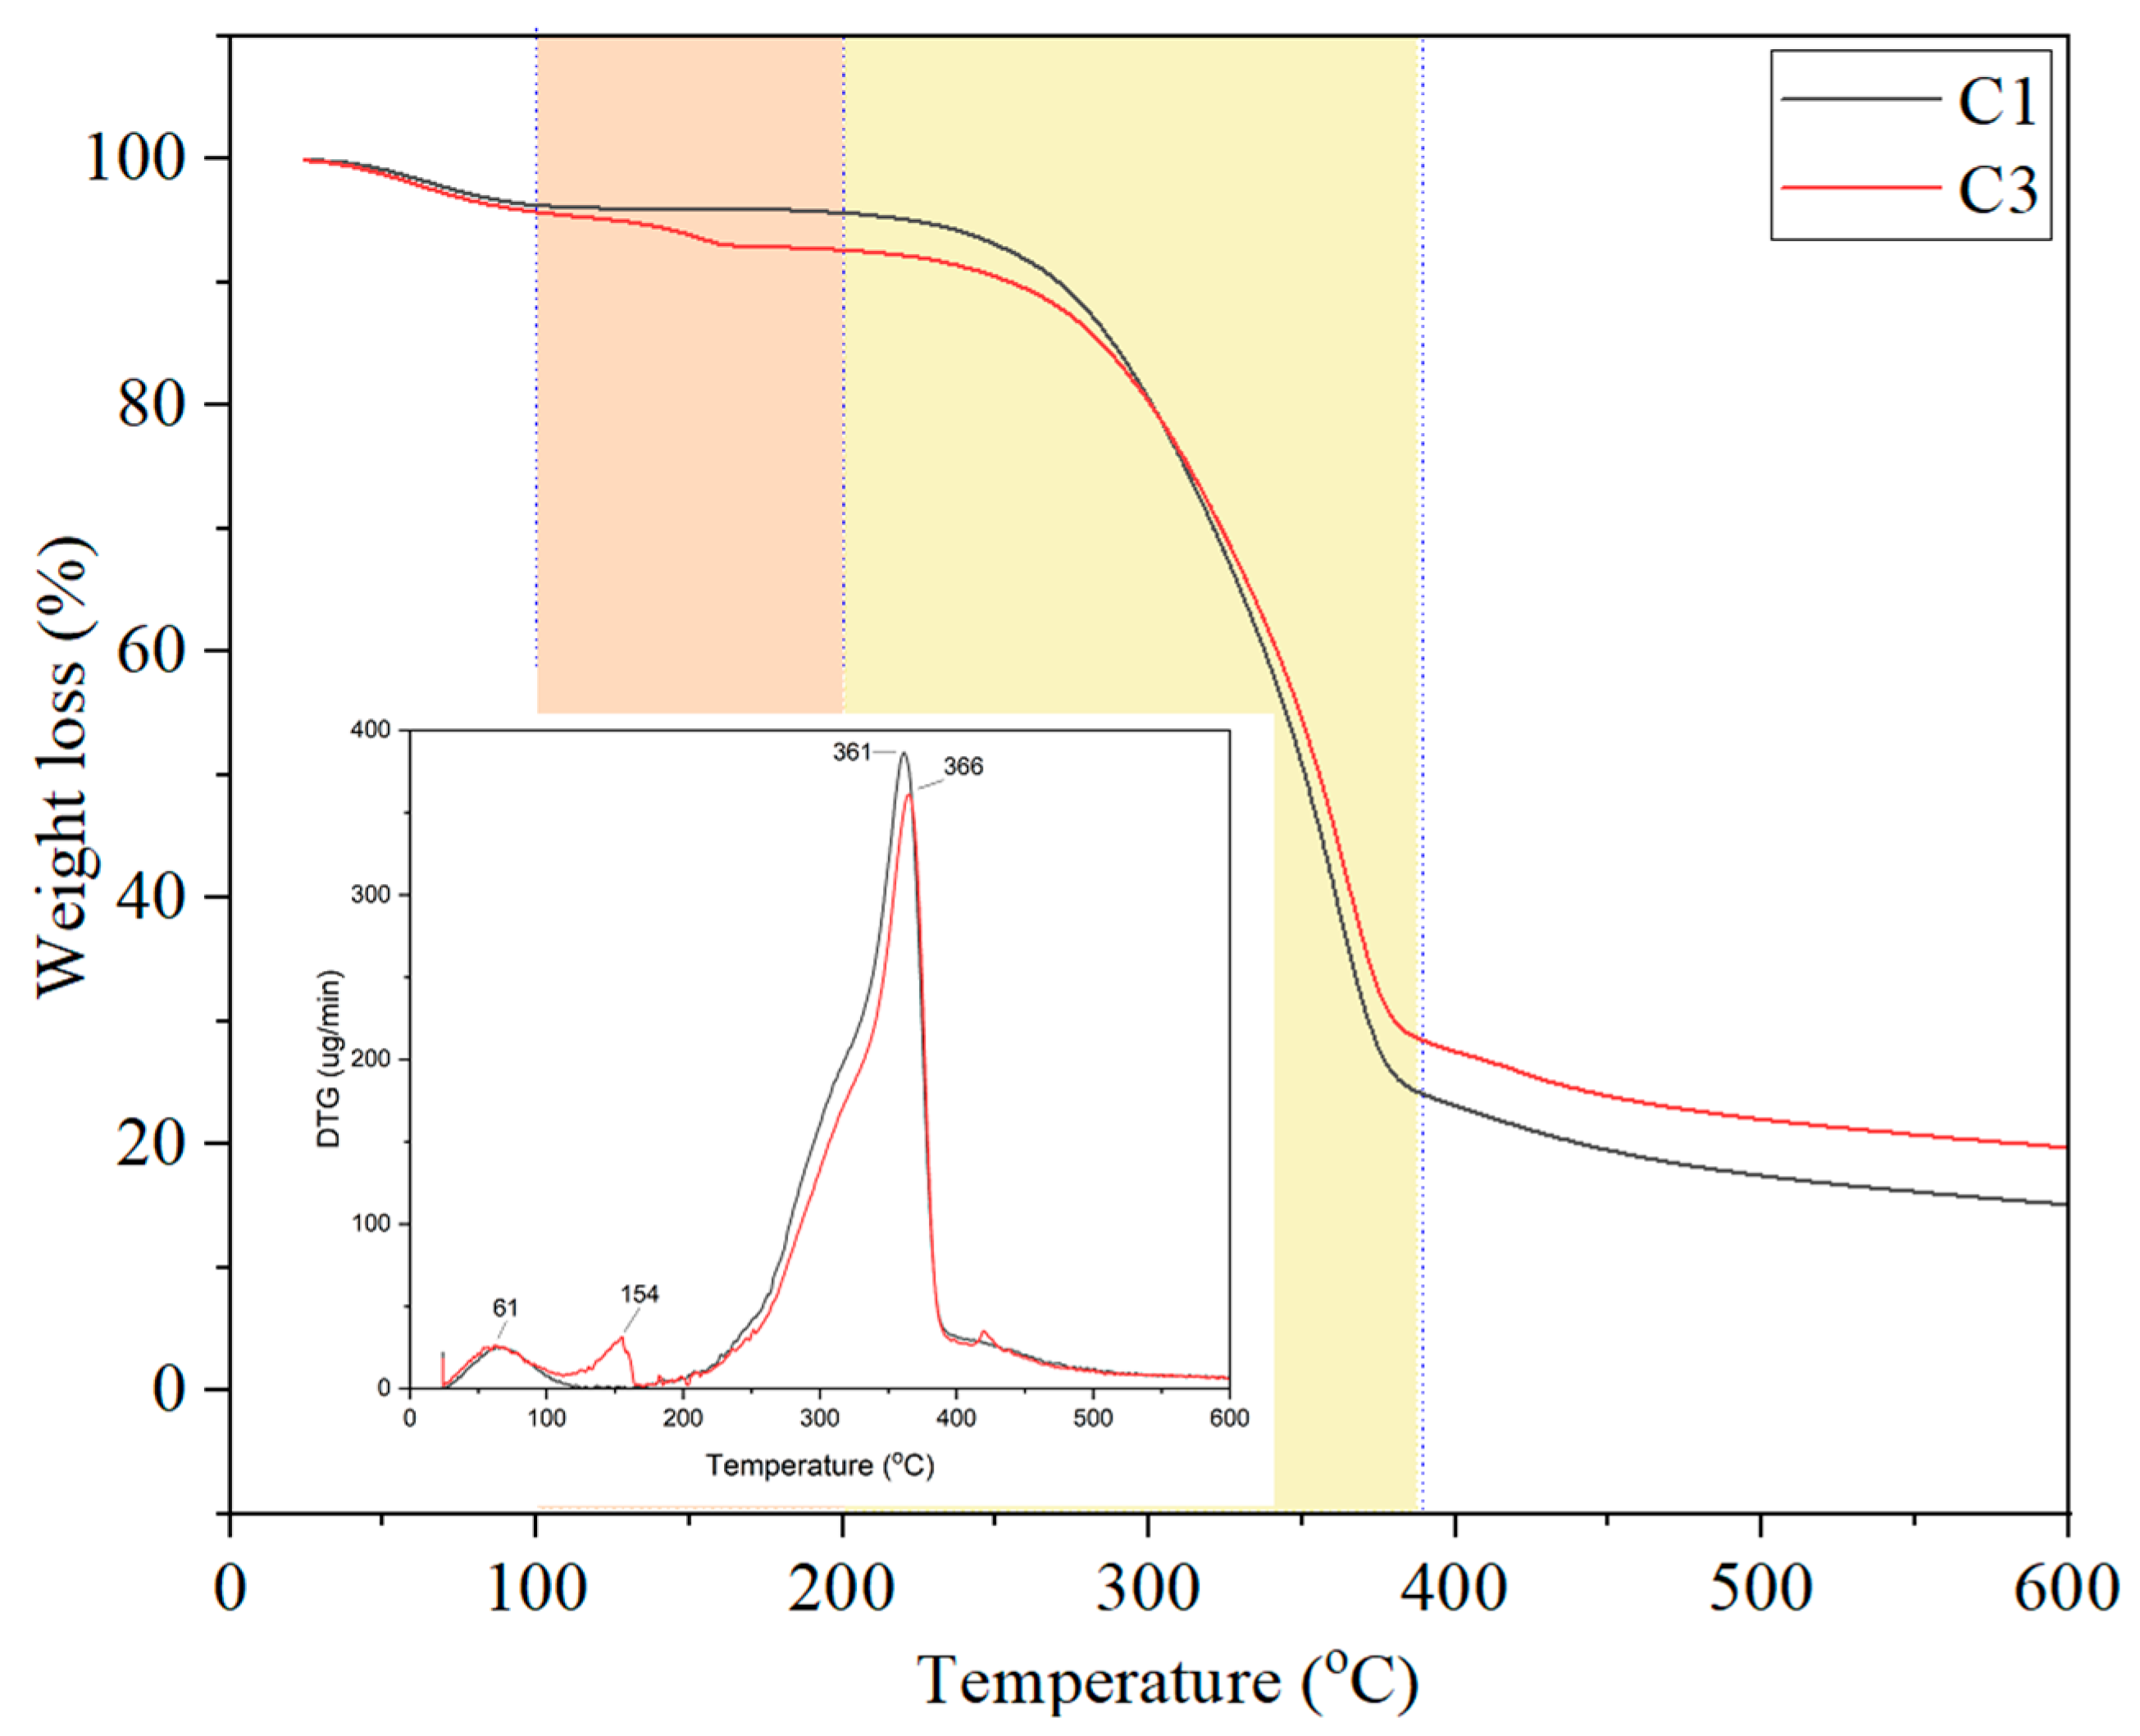
The thermal stability of WBHC and MPCM/WBHC is examined using TGA and derivative thermogravimetry (DTG), which are valuable tools for understanding the connection between the material’s underlying structure and chemical properties. The TGA and DTG curves of C1 and C3 are shown in Figure 6. Three separate phases of WBHC breakdown occur: gradual pyrolysis, significant decomposition, and early degradation. Substantial mass loss below 100 °C is seen in both the C1 and C3 curves, which is explained by moisture evaporation. Hemicellulose breaks down in the C1 group during the first phase (100 °C to 200 °C), while PCM and hemicellulose break down in the C3 group. C3 samples lost more weight in the first 200 degrees due to PCM deterioration. Major breakdown takes place between 200 °C and 380 °C. As the temperature rises, a sharp drop in sample mass is seen, which can be attributed to the cleavage of lignin ether linkages and the evaporation of monomeric phenol. The creation of carbon because of the demethylation of lignin and condensation polymerization of volatile compounds characterizes the slow degradation phase, which lasts from 400 °C to 600 °C. In this study, C3’s decomposition rate increased from 200 °C to 380 °C, and its rapid decomposition temperature increased from 250 °C to 370 °C. This suggests that the addition of MPCM to the WBHC system may contribute to the improved thermal stability of wood. Additionally, the rate at which C3 retained carbon rose marginally, presumably as a result of the MPCM stopping the breakdown of cellulose residues. This demonstrates that adding MPCM to the composite material does not significantly alter or increase its improved thermal stability.

3.2. Thermal Regulation Performance Tests Results

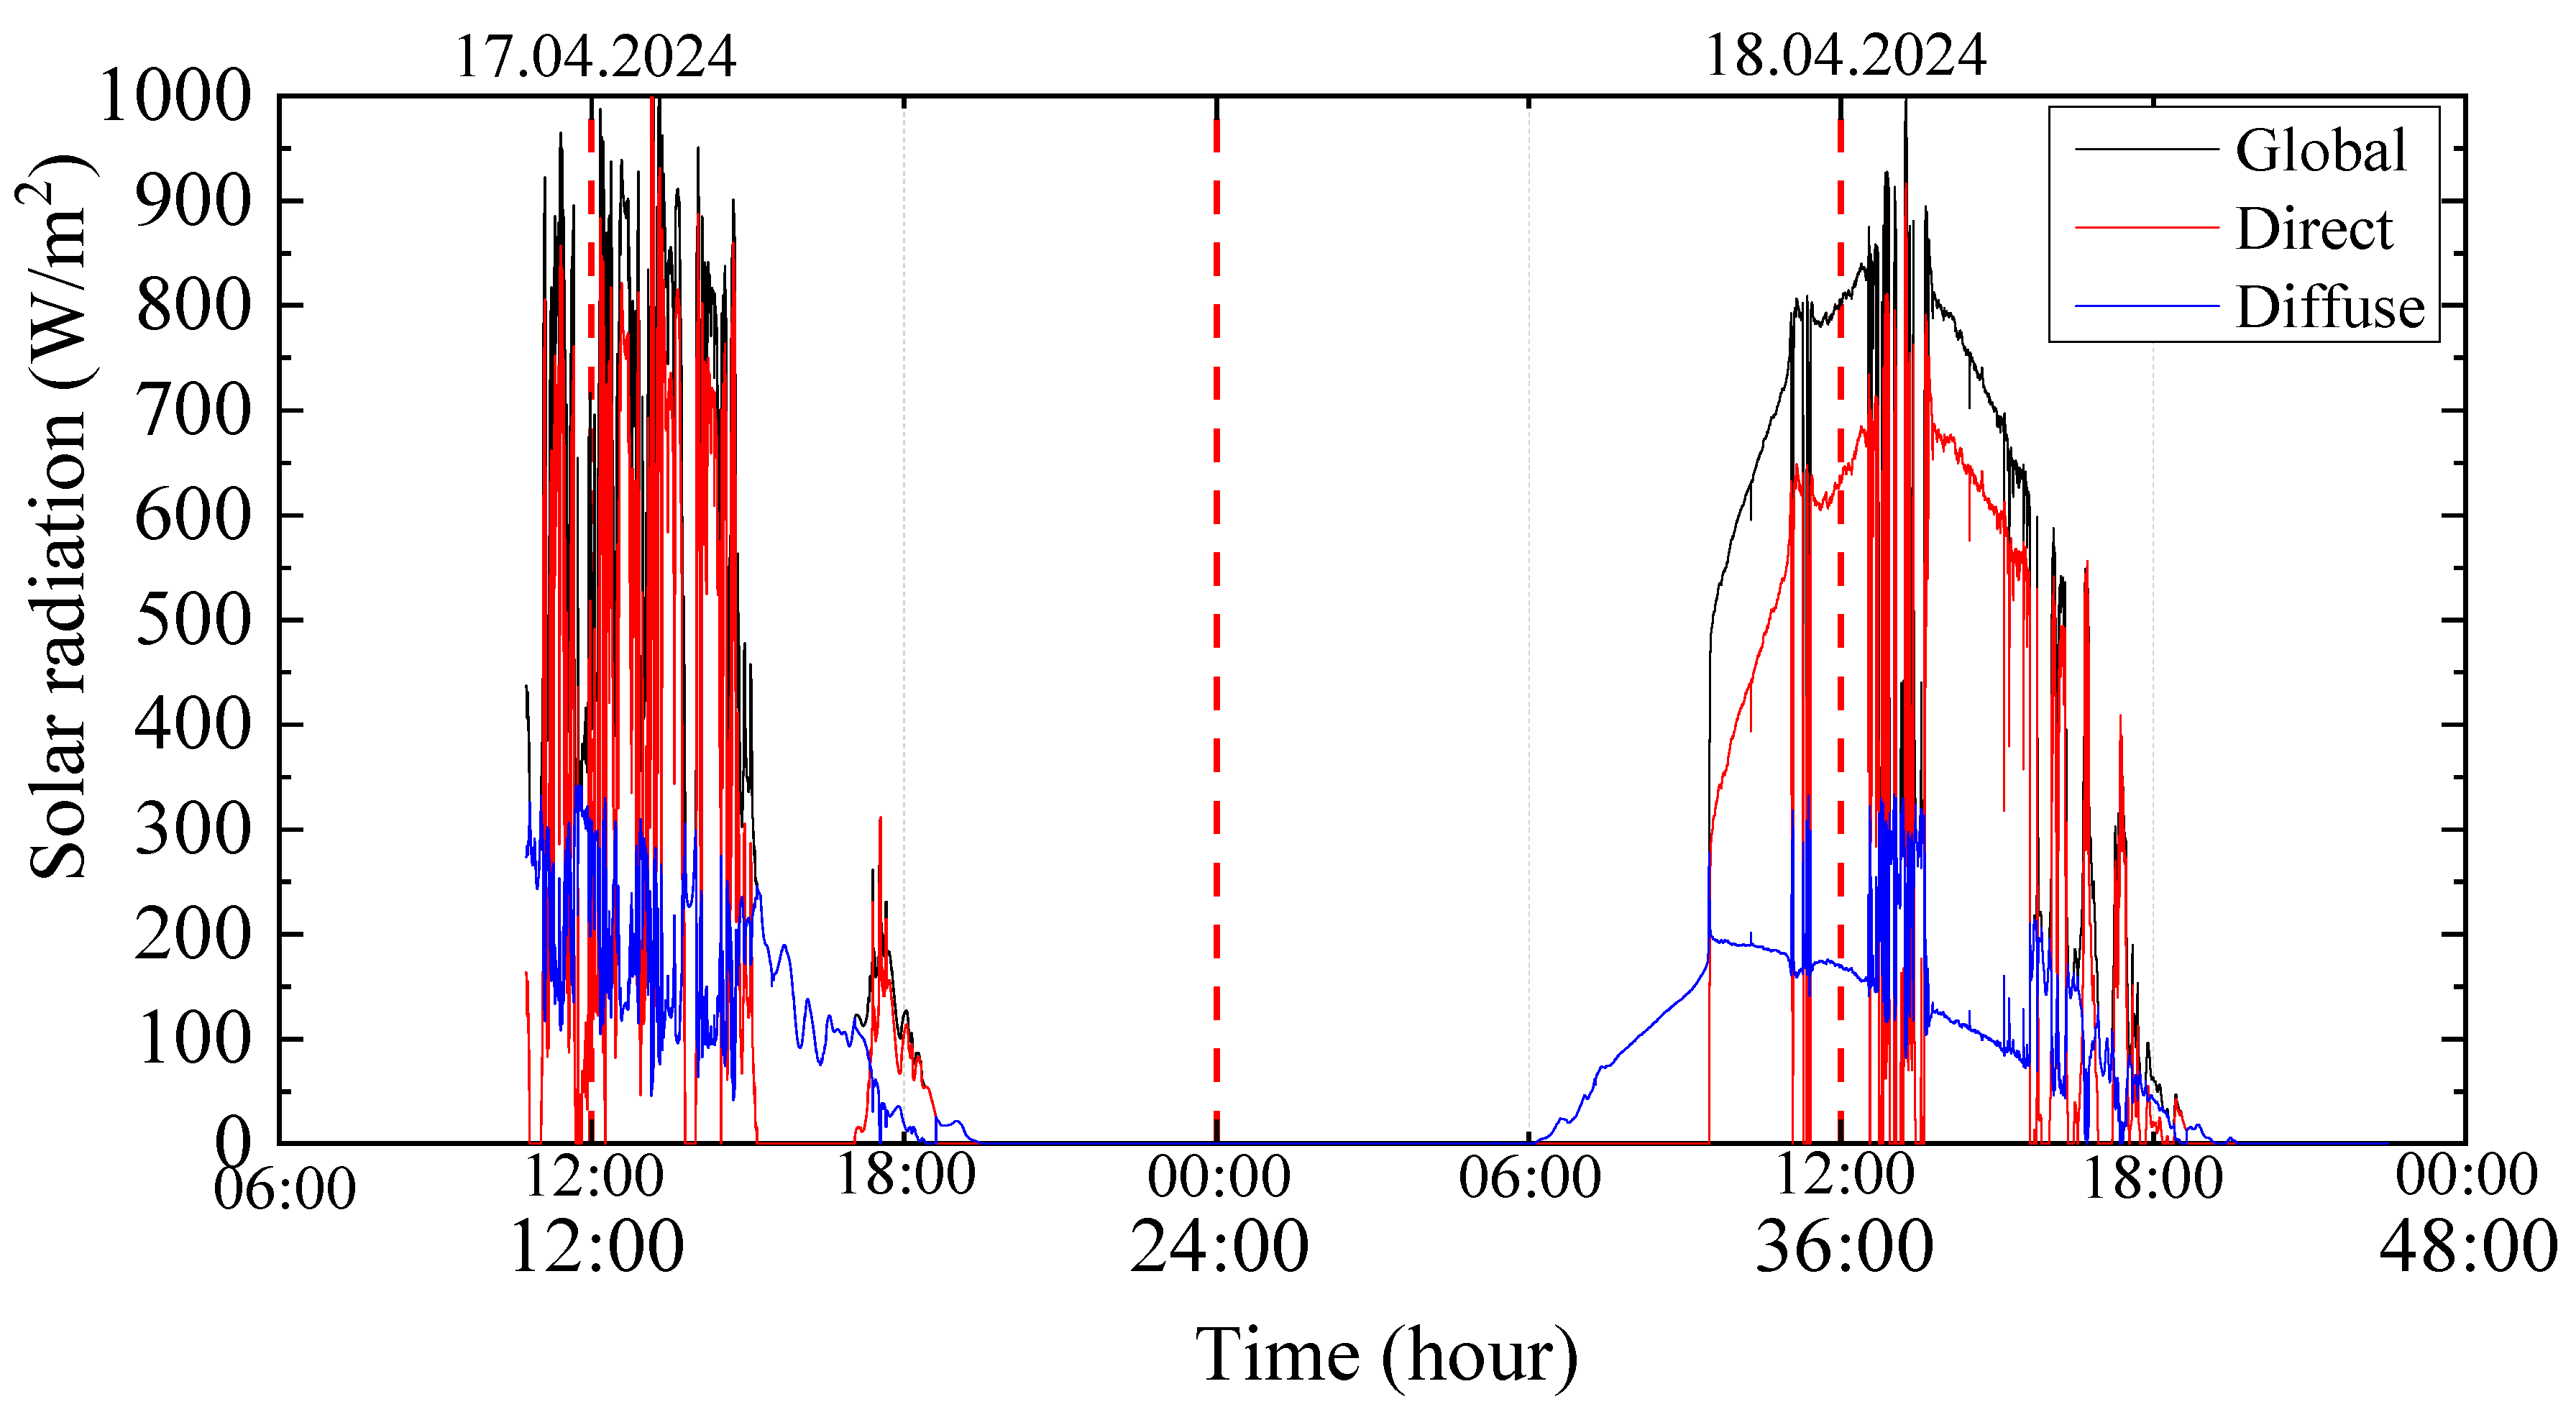
The data on solar irradiation collected throughout the course of two day-long experiments on 17–18 April 2024, is shown in Figure 7. There were both bright and overcast weather conditions during these specific days. The significant fluctuations in global, direct, and diffuse radiation indicate the presence of overcast hours. On the other hand, the times of maximum direct radiation correspond to periods of clear sky or sunny hours. The systems can receive solar radiation from 6:00 to 19:20. On 17 April, the weather was mostly cloudy. Therefore, the solar radiation significantly varied during the experiment. On 18 April, the weather was partly sunny. The partially sunny weather caused changes in the solar flux during interval times of 11:30–12:00 and 12:30–13:30. At around 13:00, the highest recorded global radiation level was approximately 850 W/m2. Approximately 85% of the global radiation consists of direct radiation during the peak solar flux at noon hours in the second-day experiment. Due to the sharp increase and decrease on the first day of the experiment, this ratio is not observed clearly. However, the solar flu seems higher compared with the second day. Its effect may have appeared on temperature measurement.
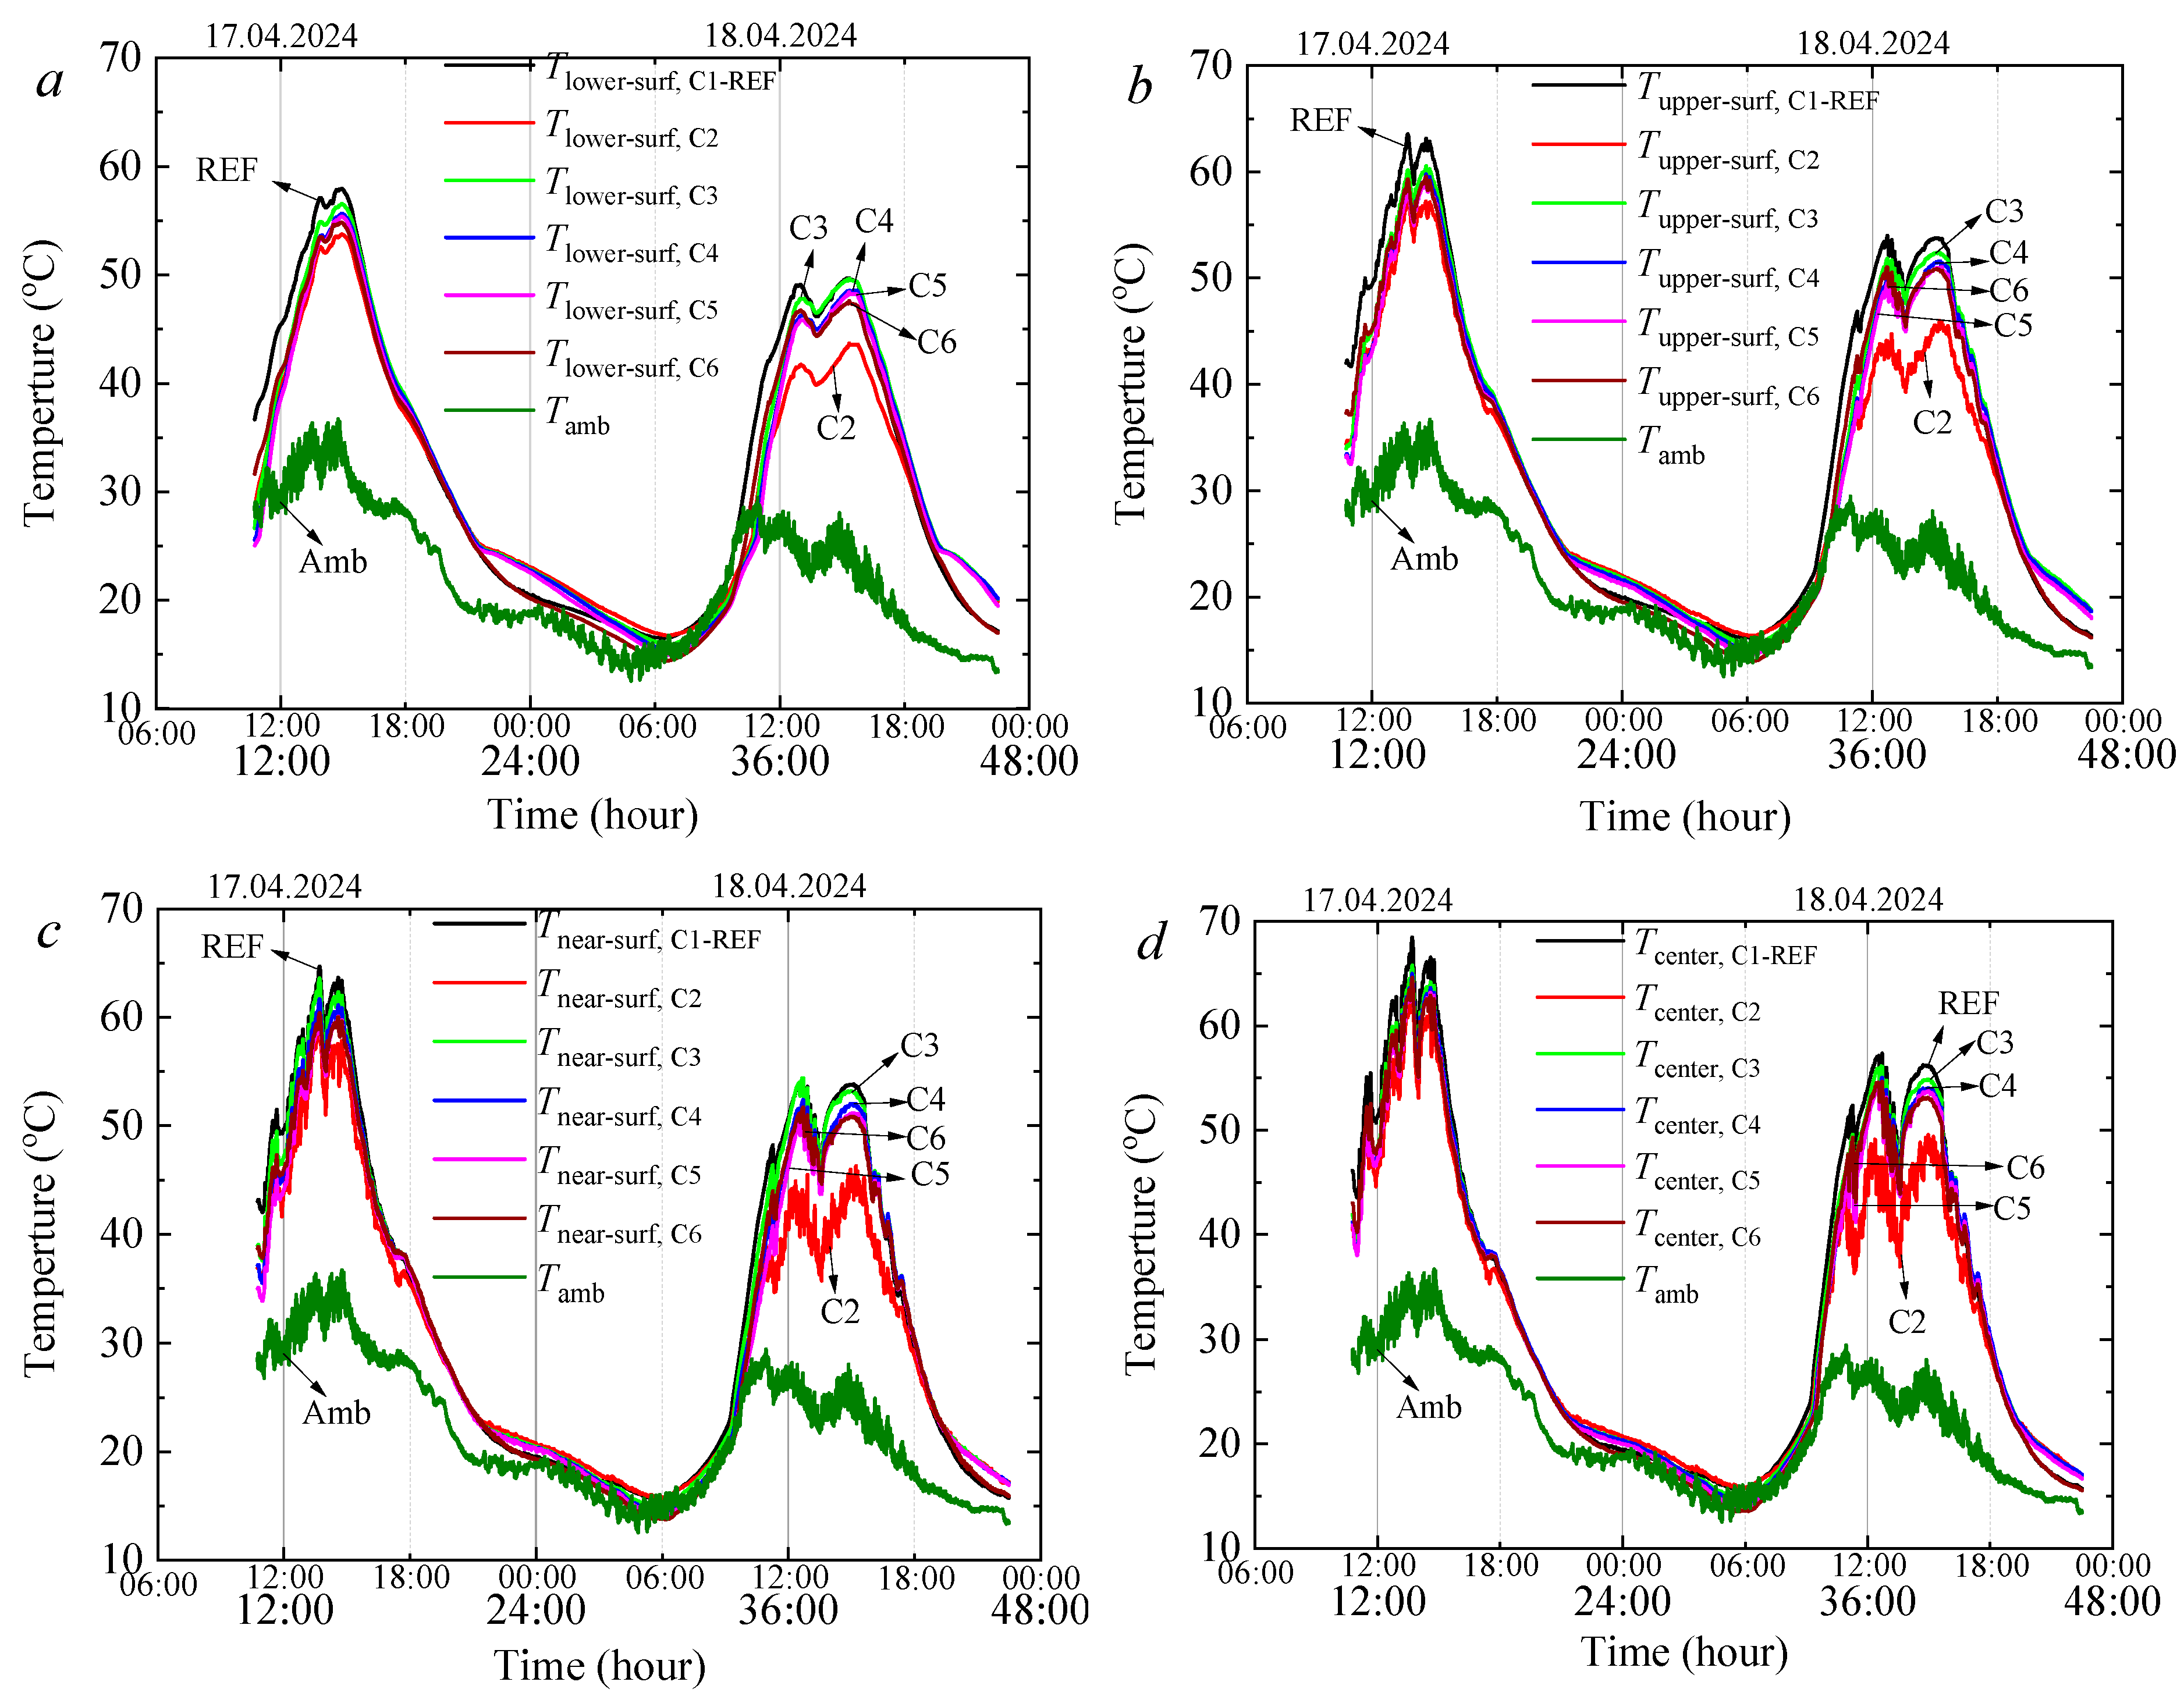
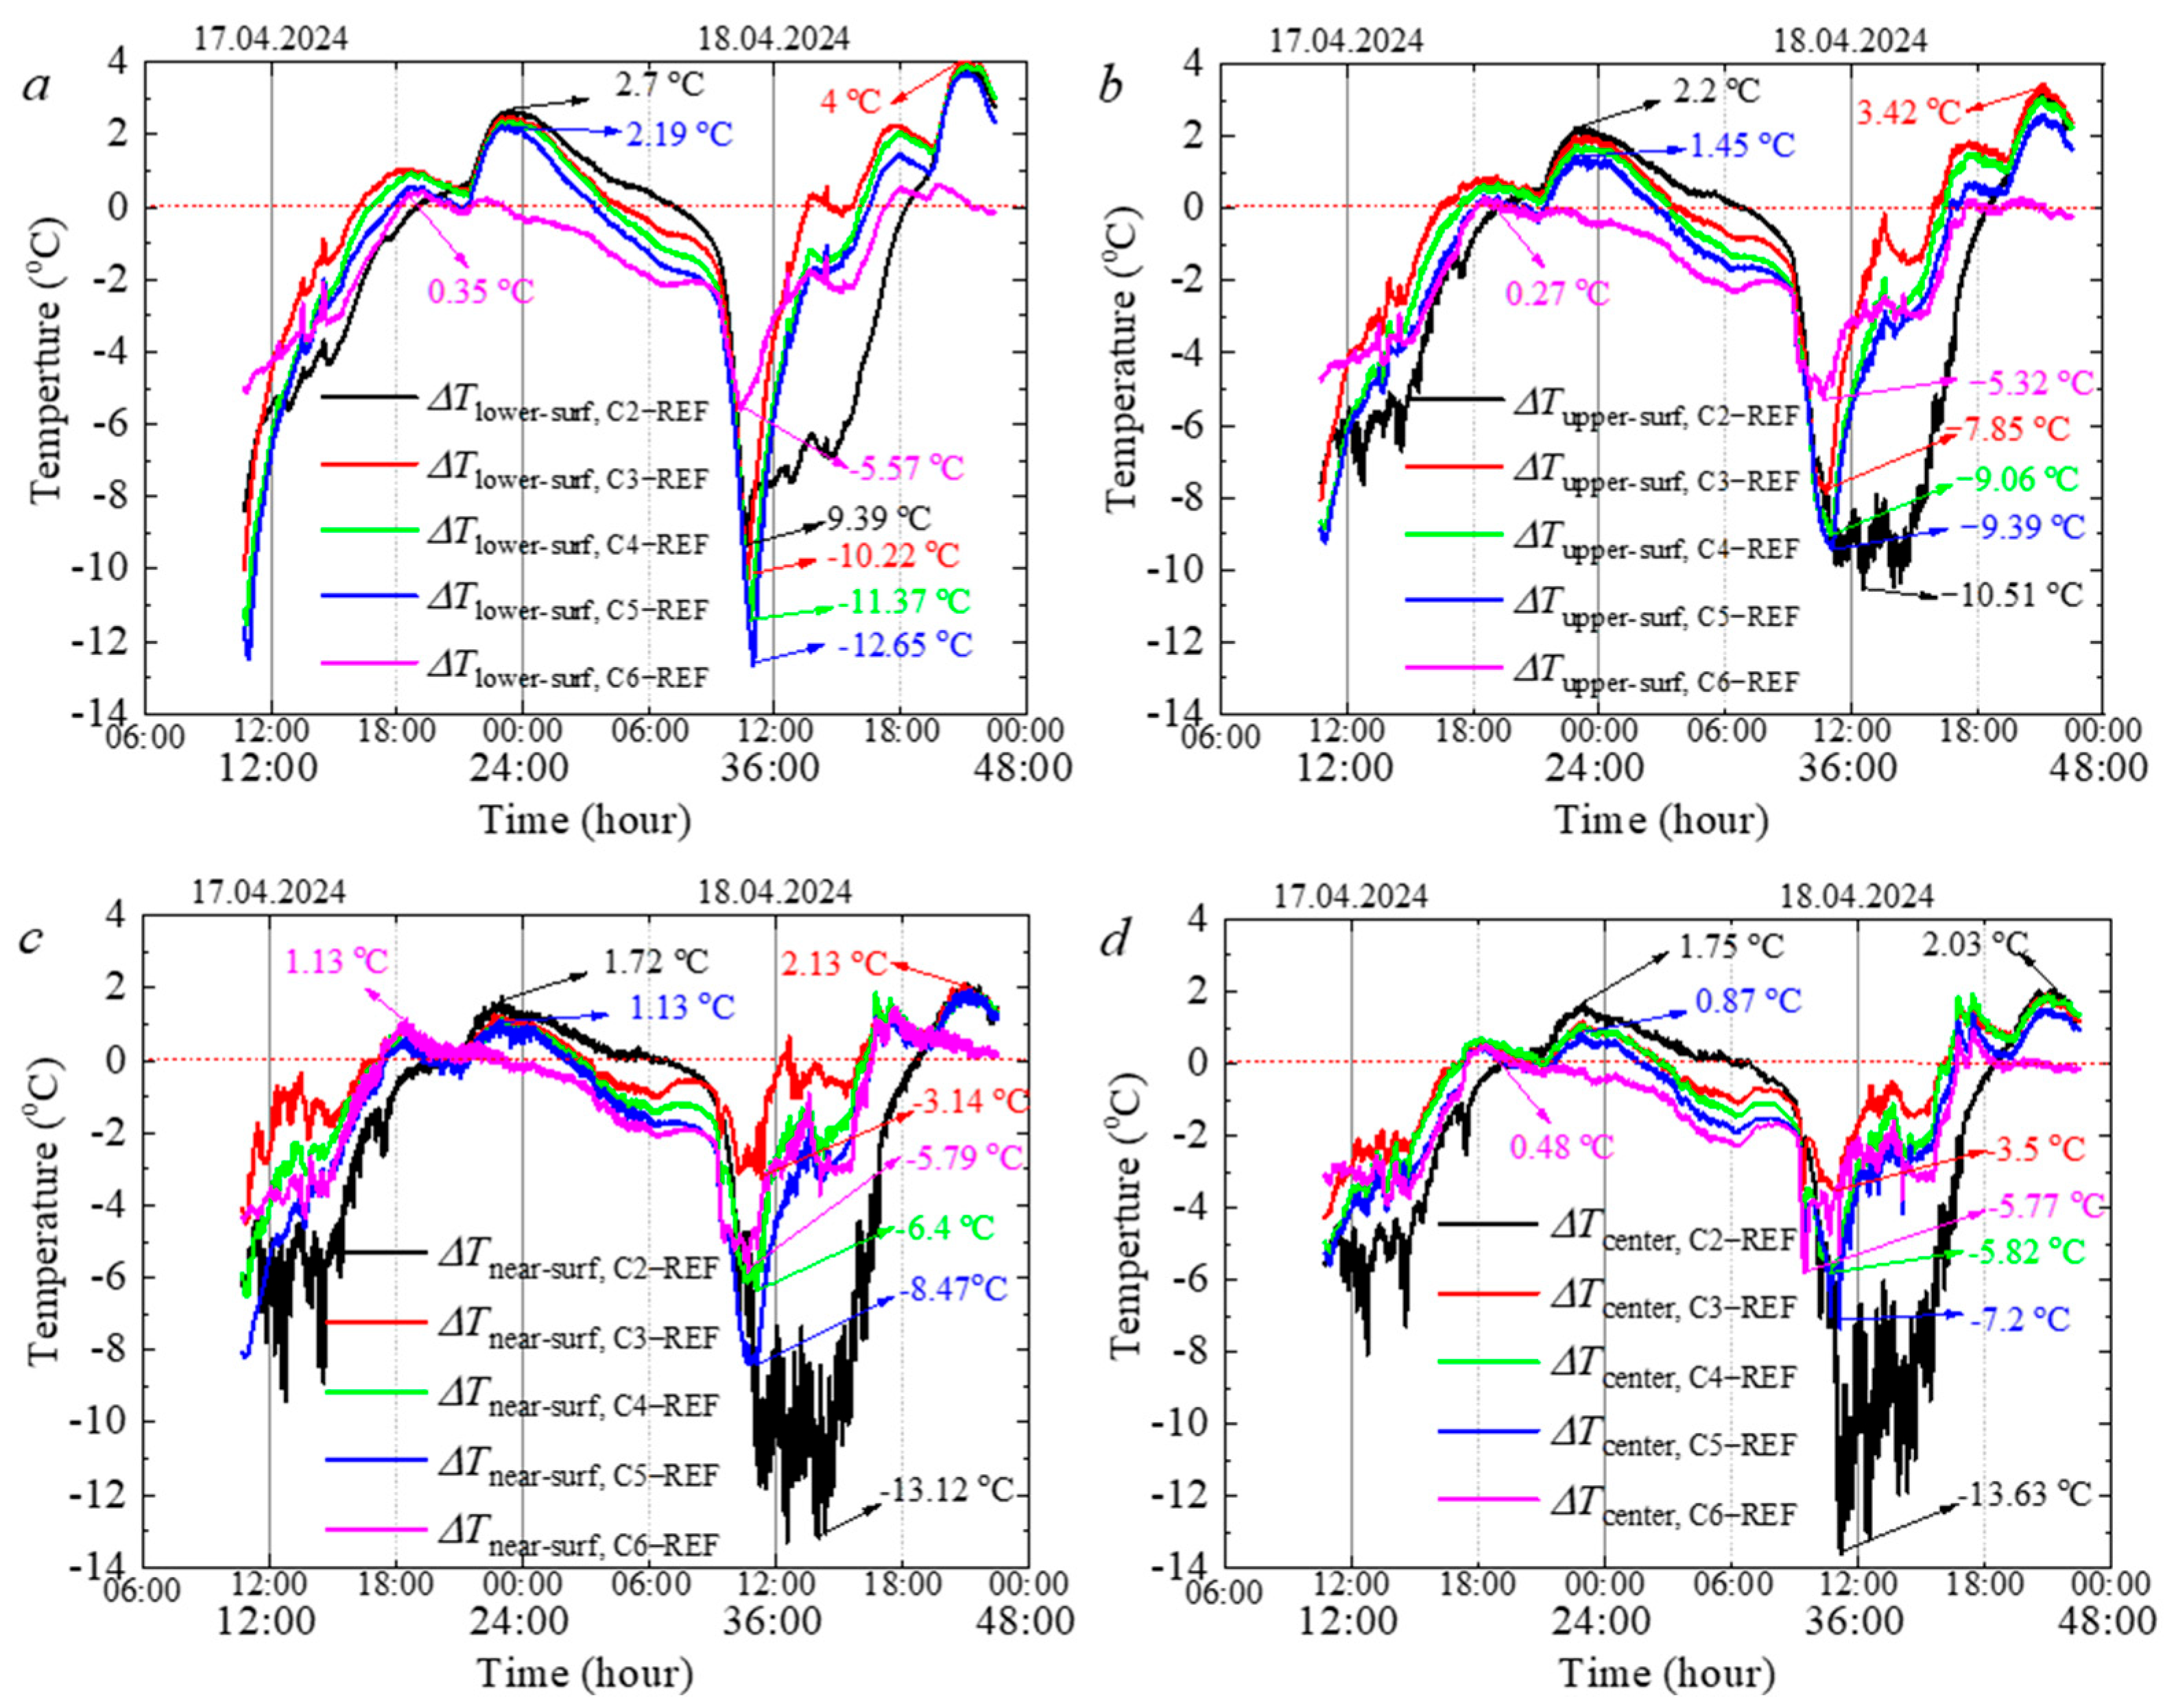
To understand the temperature change and energy conservation, the temperature of the surface of the specimen and testing chamber was measured using a K-type thermocouple (TCp) as shown in Figure 2. For each different specimen, the temperatures of the top and bottom surfaces, the near surfaces (i.e., the medium temperature 0.01 m close to the upper surfaces), and the temperature of the center of the test room for the C1–6 samples were measured. The outside temperature was measured with another thermocouple. Figure 8 presents the experimental room lower-surface, upper-surface, near-surface, and room center temperatures with the C1, C2, C3, C4, C5 and C6 samples. From the data given in Figure 8, the registered minimum ambient temperature was about 12.5 °C at 05:00. This was followed by the maximum outside temperature of about 29.5°C at about 11:00 h, with fluctuations during the afternoon, and a gradual decrease after 14:50 h on 18 April. The maximum ambient temperature recorded yesterday was 36°C at around 14:45. The weather was mostly cloudy, but the clearness index was higher so that the solar radiation was higher. This is clearly seen from the ambient and indoor temperatures of the test cabins. The lowest temperatures were observed for the C2 sample in all measured positions. Its effect is mainly seen in the second day experiment with low ambient temperatures. C3 was operated very close to the reference board C1. The best performance was observed in C2, followed by C6, C5, C4 and C3. Figure 8 shows the temperature difference between C2, C3, C4, C5, C6 and reference samples (C1) for lower surface, upper surface, near surface and room center cases. As opposed to the control particle board sample without PCM, the particle board samples containing PCM exhibit higher temperatures on the top and bottom surfaces of the PCM from approximately 17:00–19:00 (17 April) until about 04:00–07:00 (18 April) in the early morning. Additionally, the MPCM sample test chamber temperatures are consistently higher than the chamber with the reference sample at the center and near-surface temperature. This observation shows that, when compared with the reference board, the specimen with MPCM gives higher temperatures on its surface, near surface, and room center during the cooler hours of the day. As for each specific sample, the temperature difference appears to have a different effect. Although the best performance for the cooling effect was observed with an order of C2, C6, C5, C4, and C3, the best heating performance was seen with an order of C2, C3, C4 and C5 between 21:30 (17 April) and 03:30 (18 April) (Figure 9a). Between 16:15 and 21:00 (17 April), the best heating performance was observed in C3. After 03:30, the surface temperature of C5 becomes higher than the reference sample. This is followed by C4 at 04:00, C3 at 04:45 and C2 at 07:12. Moreover, the largest differences between the boards with PCM and the reference boards without PCM during the hot ambient hours were observed in C5 (12.65°C), C4 (11.37°C), C3 (10.2°C), C2 (9.4°C) and C6 (5.57°C). However, this peak difference value does not continue the whole time during hot weather. Although C5 provides the coolest lower surface temperature, C5 provides a longer cooler lower surface temperature.
The temperature measurements were correlated with the concurrently recorded solar irradiation profiles to separate the thermal effects caused by MPCM phase change from those resulting from solar radiation and ambient temperature fluctuations. Any temperature dampening or plateau seen in MPCM/WBHC relative to the reference board (C1) during times of stable solar irradiation (such as clear sky conditions between 11:00 and 14:00 on 18 April) can be mainly attributed to the latent heat absorption of the MPCM during melting. On the other hand, the latent heat release during MPCM solidification is linked to the temperature differential between MPCM/WBHC and the reference board during cloudy periods (like 17 April) or after sunset, when solar irradiation approaches zero. The brief times, such as 11:30–12:00 and 12:30–13:30 on 18 April, when sun irradiation varies quickly, show competitive interactions between MPCM thermal buffering and external thermal gains. It is found that ΔT grows while irradiation drops by cross-correlating the temperature differential (ΔT = TPCM − Treference) with the irradiation data. This confirms the thermal buffering action of MPCM independent of external variables. This division makes it possible to evaluate MPCM performance more clearly, irrespective of weather fluctuations.
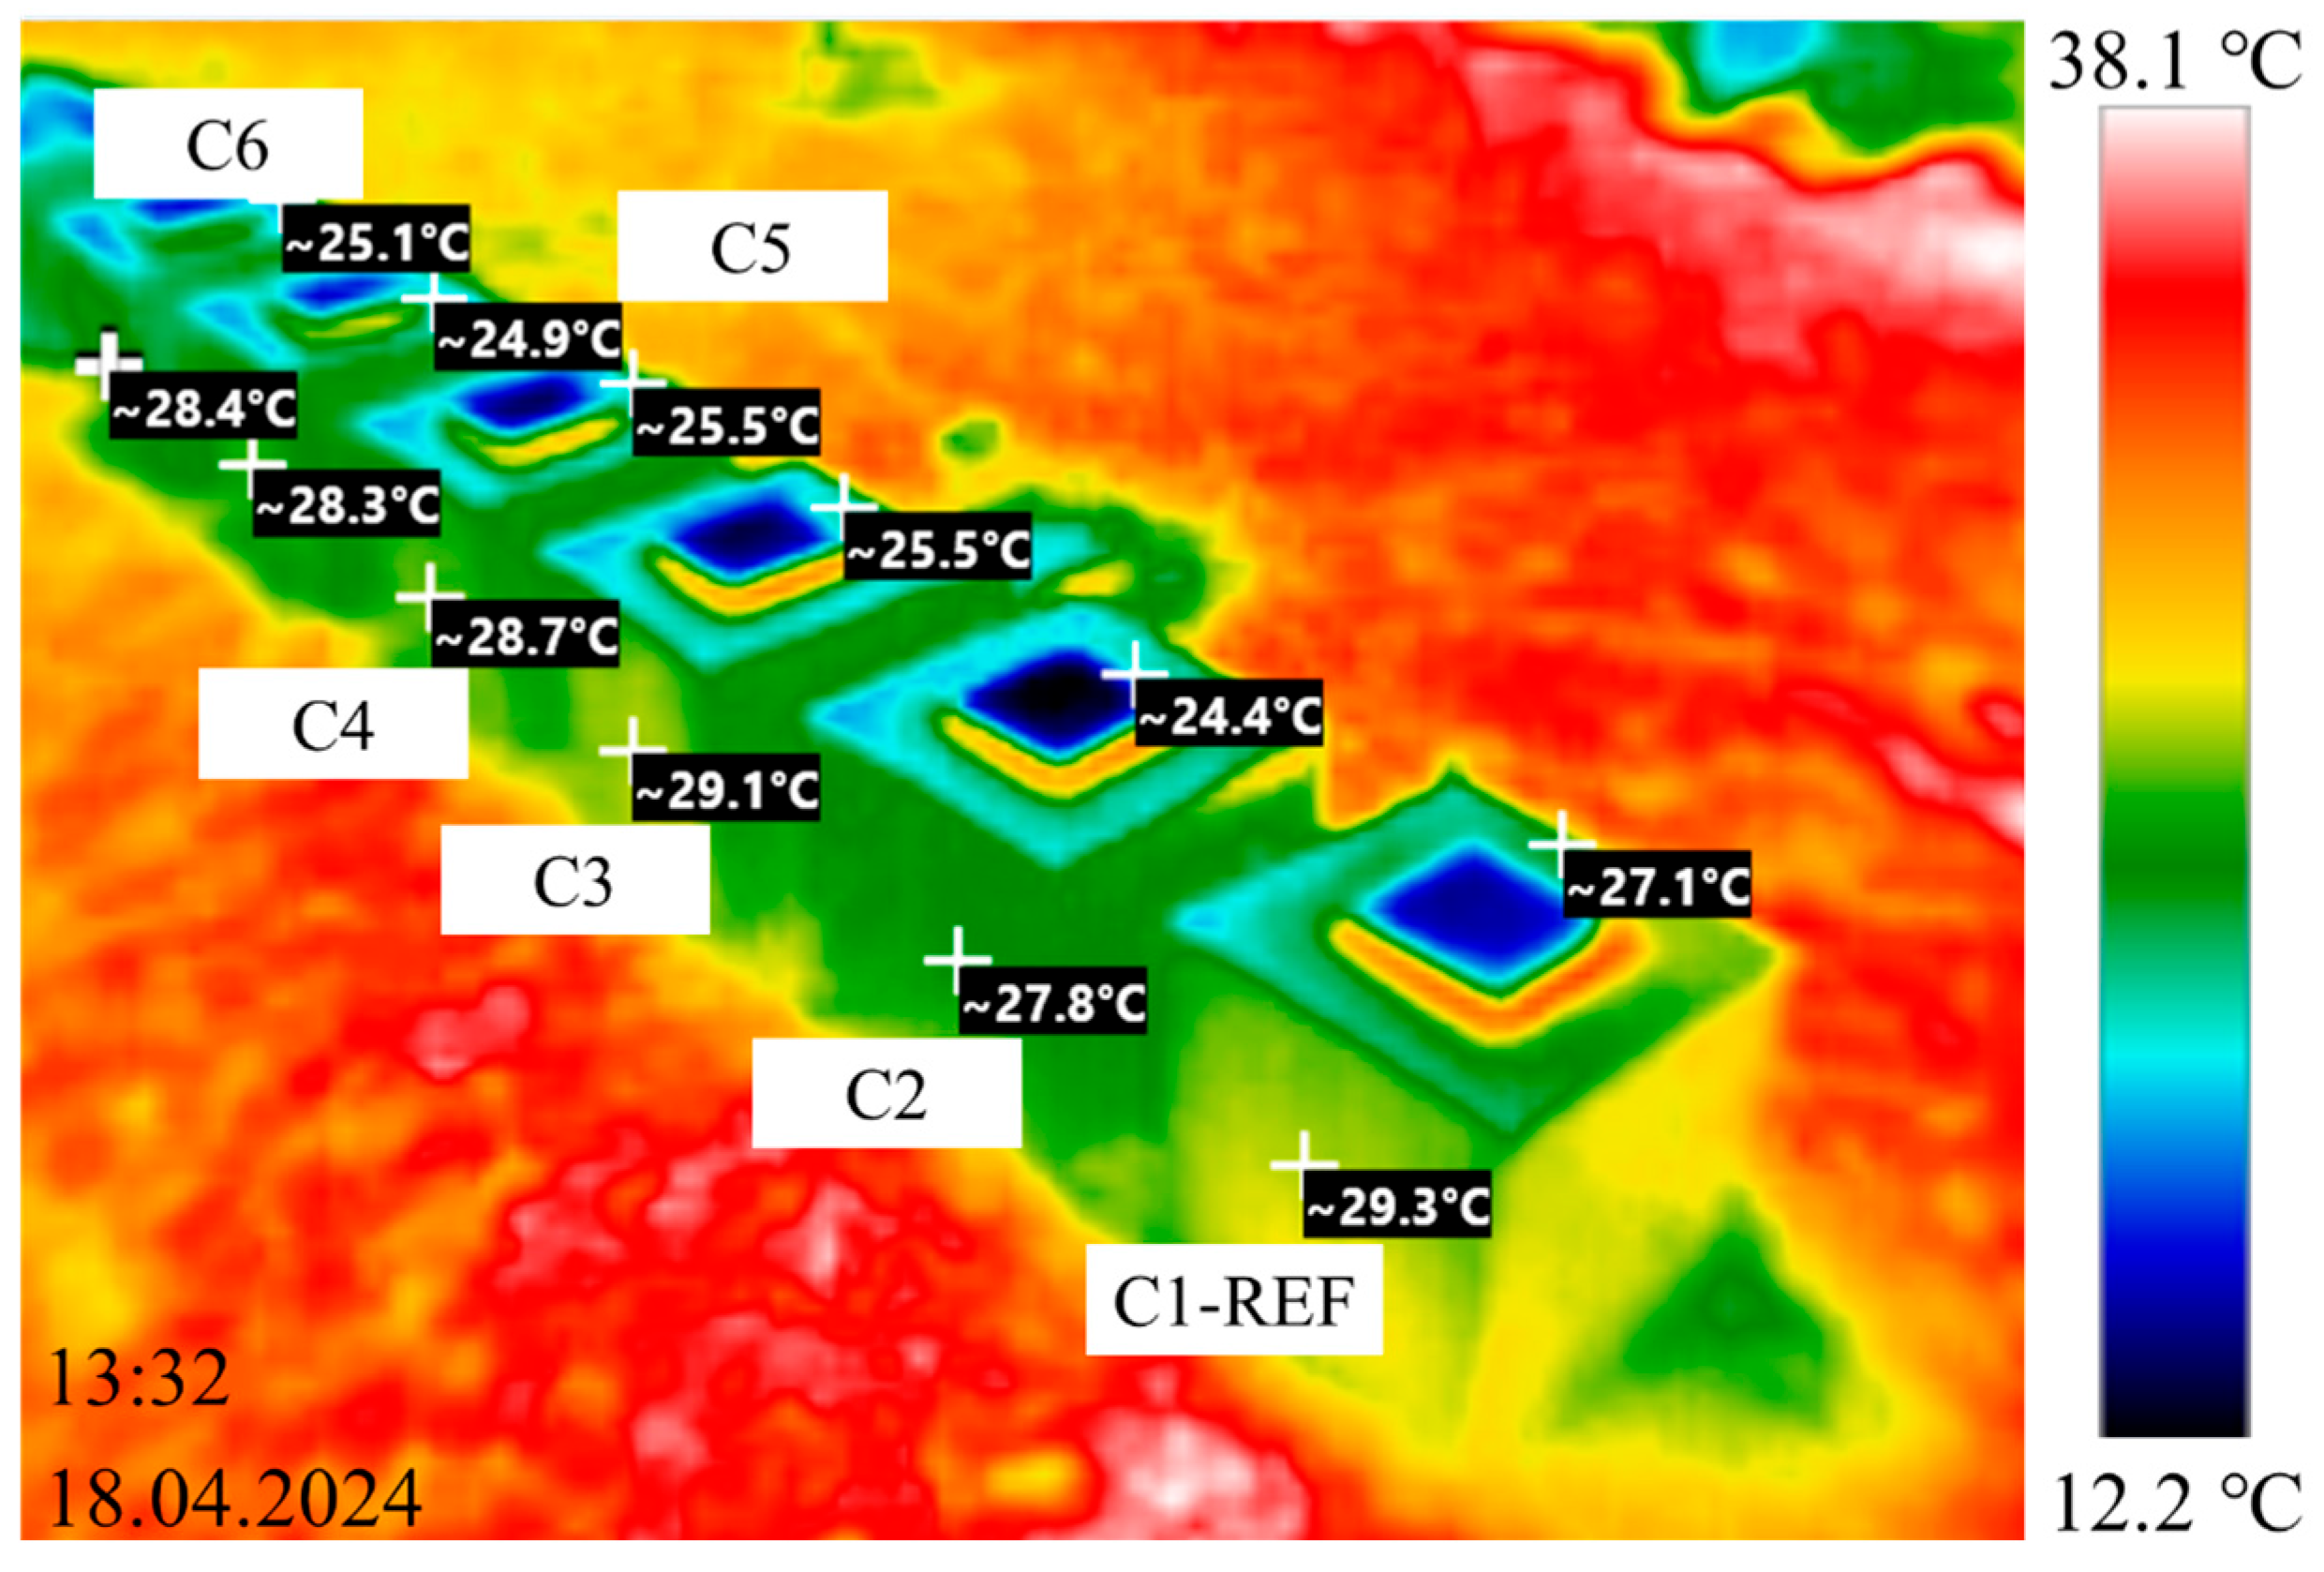
In Figure 8d, the differences for the room center temperature were illustrated. The lowest indoor temperature in hot weather was observed for the C2 case, with a difference of 13.6 °C. This is followed by C5 (7.2 °C), C4 (5.8 °C), C6 (5.7 °C) and C3 (3.5 °C), respectively. During the cold weather conditions, C2 provided 1.75 °C higher room center temperature. C4 and C3 provided similar maximum temperature differences of 1.07 °C. This is followed by C5, which recorded 0.87 °C. The effect of C6 is barely seen for a very short time around 18:00 (17 April). The MPCM/WBHC shows very interesting behavior depending on incident solar radiation and ambient temperature. Moreover, the phase change duration in the board’s changes were found to be related to the layers with MPCM and the amount of the MPCM on those layers. Therefore, the cooling–heating time, cooling–heating duration, and maximum cooling–heating values vary. The results of the outer surface temperature measured with a thermal camera indicate the cooling effect of the C2 (Figure 9).
Temperature plateaus in the cooling and heating curves indicated the MPCM’s phase transition behavior within the boards. In comparison to the reference board, the temperature rise of MPCM/WBHC samples was delayed during the heating phase (during the day), and a clear plateau was seen around the MPCM melting temperature range (about 25 °C). This plateau shows how latent heat is absorbed while melting. A similar plateau was seen during solidification in the cooling phase (nighttime), when the release of latent heat momentarily stopped the temperature drop. Because each sample had a distinct MPCM content and layer structure, the length of these plateaus differed. C2, for example, showed the longest plateau duration, which is consistent with its better thermal performance in both heating and cooling modes. However, there was no similar plateau on the C1, indicating that phase change effects were not present. Overall, the outdoor thermoregulation tests show three simultaneous factors—solar radiation intensity, ambient temperature, and PCM phase transition—which control the thermal performance of MPCM/WBHC. MPCM melting, which absorbs excess heat and lowers surface and indoor temperatures by up to 13.6 °C (C2), dominates the cooling impact under intense sun radiation (e.g., noon on 18 April). MPCM solidification, which produces latent heat and sustains greater temperatures (up to 1.75 °C for C2) than the reference board, dominates the heating impact under low solar radiation or at night. The MPCM functions as a thermal buffer to reduce abrupt temperature swings during periods of varying solar energy, such as partially cloudy situations. In C2 and C5, which exhibit the most consistent temperature profiles under various weather situations, this buffering effect is most noticeable. These results demonstrate that the latent heat storage/release mechanism of MPCM offers a definite and measurable advantage over the passive effects of ambient temperature and solar radiation alone.
The temperature differential (ΔT) between each MPCM-containing sample (C2–C6) and the reference sample without MPCM (C1) was examined as a function of sun irradiation in order to quantitatively distinguish the MPCM contribution from environmental factors. Positive ΔT readings, or MPCM samples that are colder than reference, show the cooling effect of MPCM melting at times of strong irradiation (>500 W/m2). The heating effect of MPCM solidification is indicated by positive ΔT values (i.e., PCM samples warmer than reference) with low irradiation (<100 W/m2). The MPCM content and layer configuration were shown to be directly correlated with the magnitude of ΔT, with C2 exhibiting the highest ΔT values in both cooling and heating modes. This method successfully separates the MPCM phase change contribution from the simultaneous impacts of temperature fluctuations and solar radiation.
Figure 10 shows the thermal camera image of the test rooms with C1, C2, C3, C4, C5 and C6 and the samples. The surface temperatures of MPCM/WBHC are lower than the control composite material.

3.3. Contact Angle and Surface Roughness

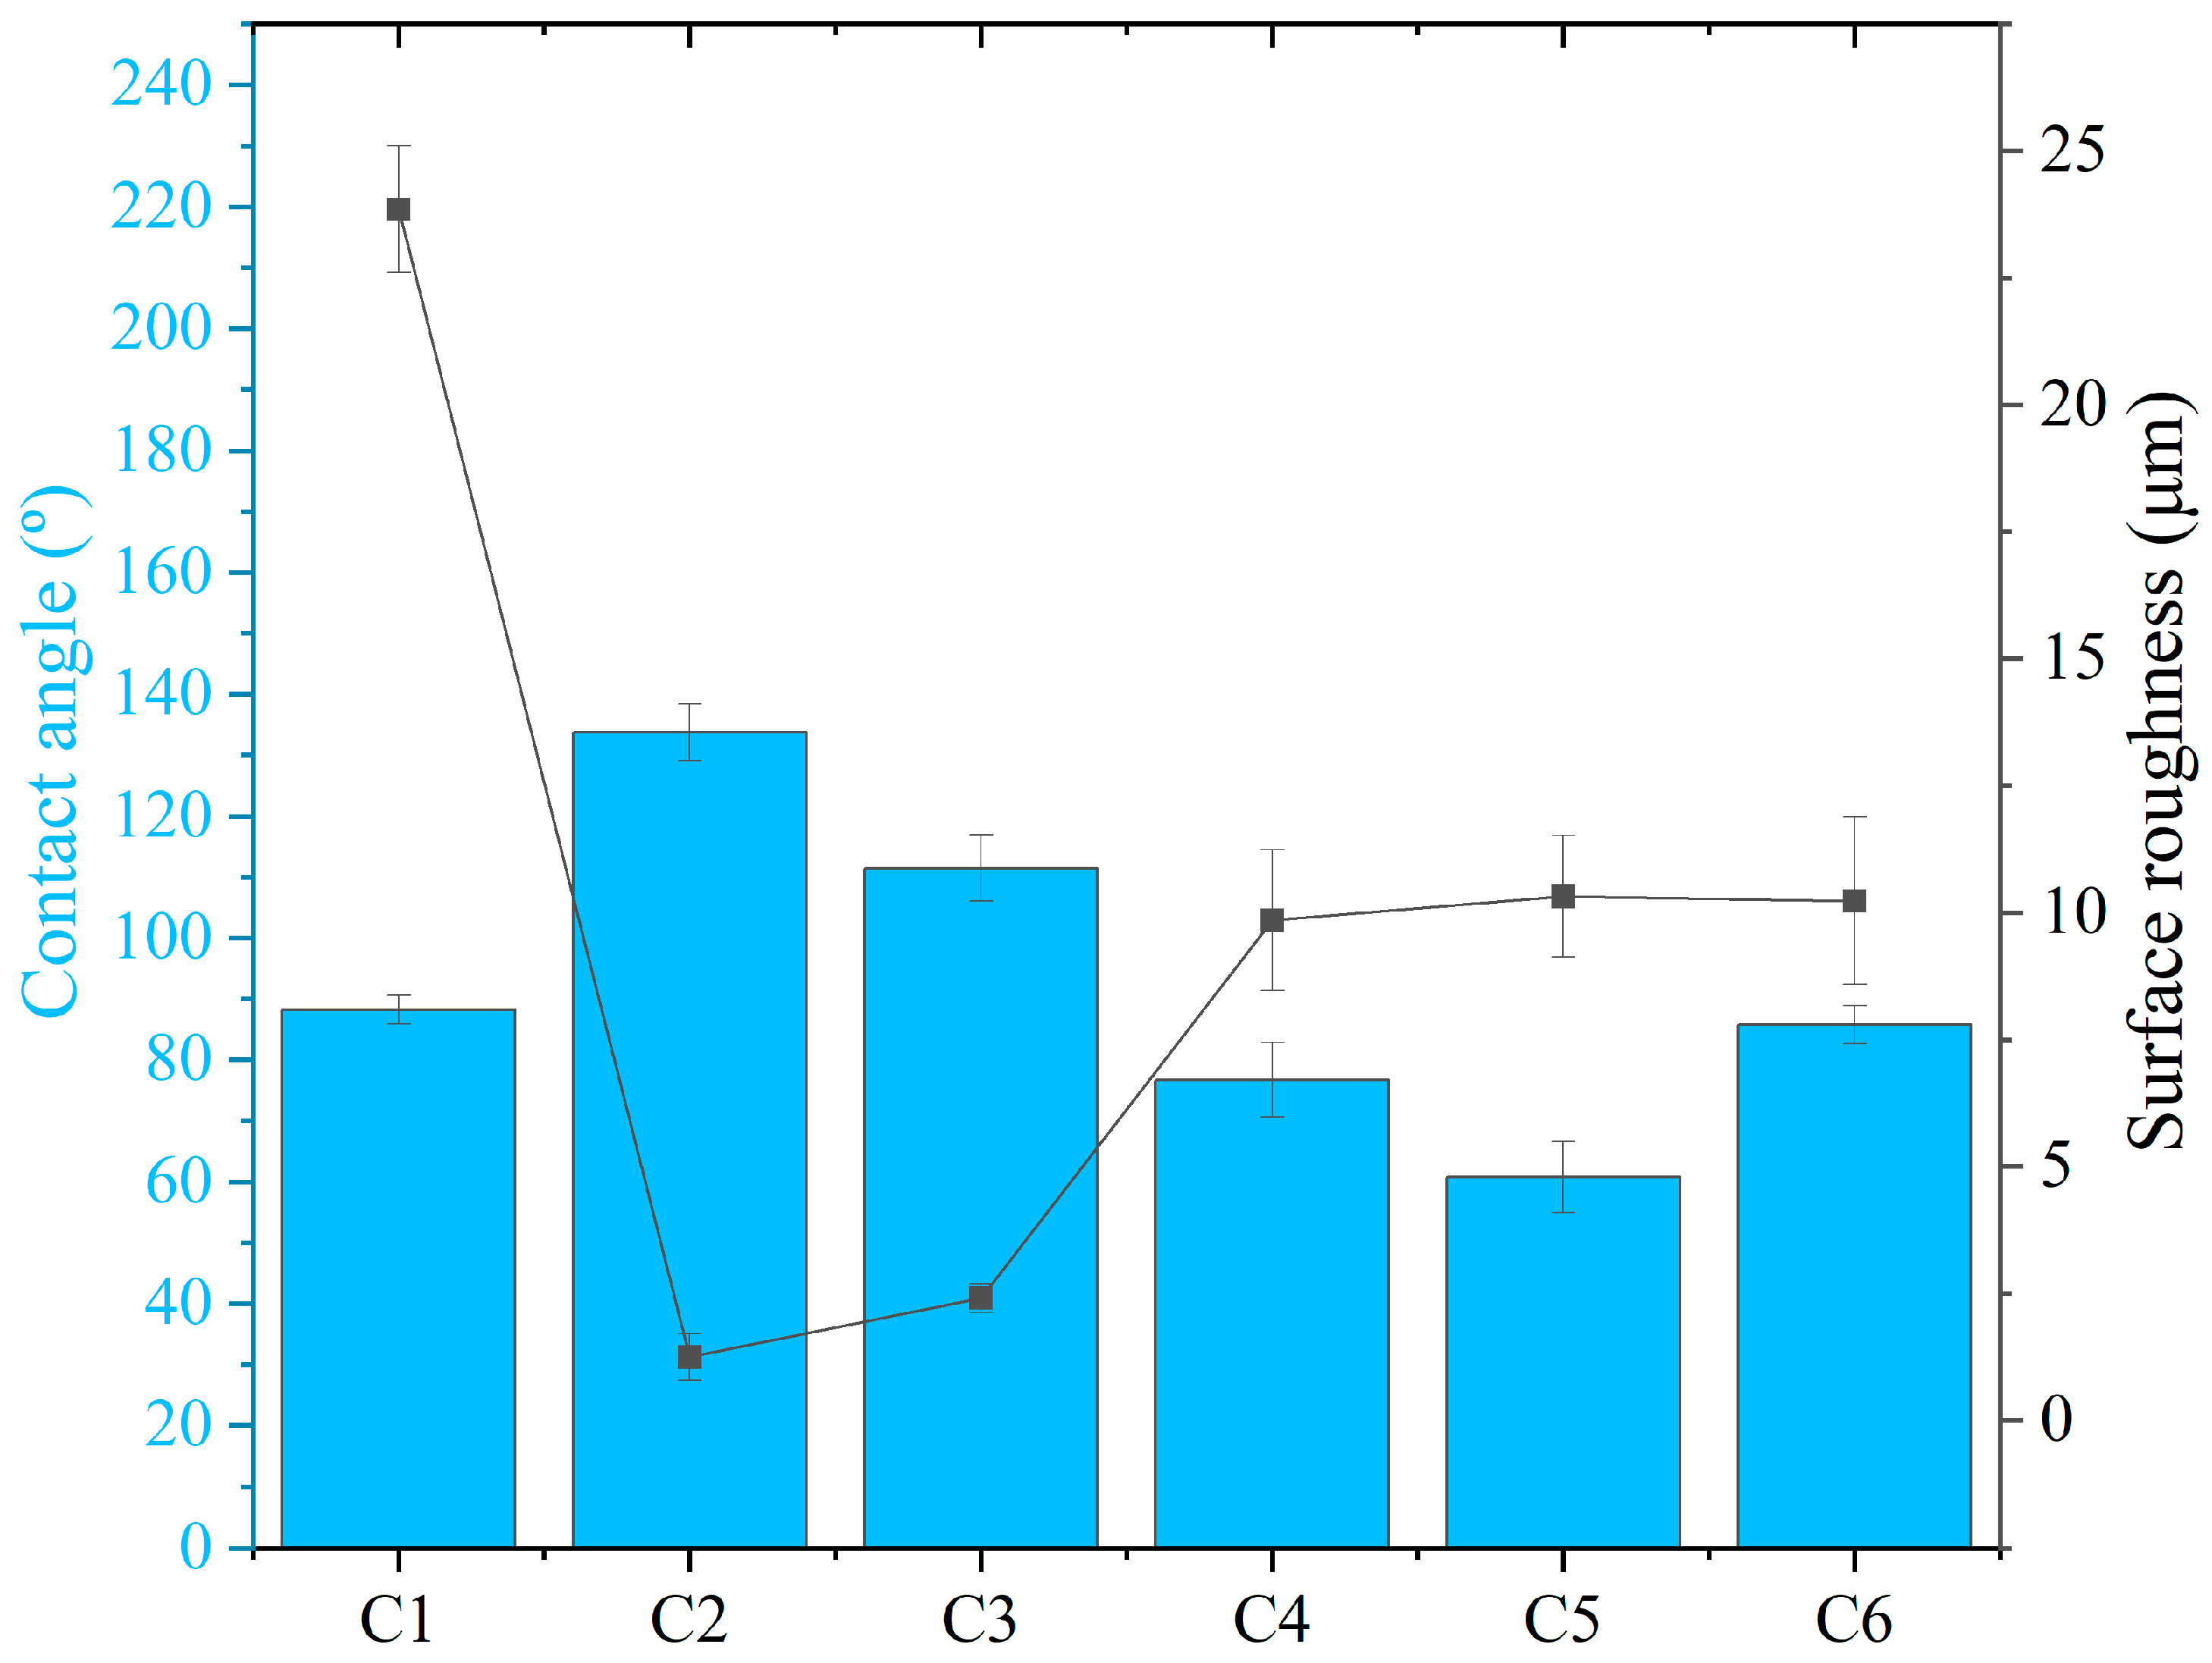
The surface roughness (Ra) of the C1 material was found to be 23.85 μm (Figure 11), though the test samples yielded lower roughness values. This reduction is attributed to the addition of MPCM and the filling effect of WBHC on the surface voids. The lowest Ra value was obtained in C2 composite material with 1.25 μm. With the application of paint on the composite material surfaces (C4, C5, C6), the roughness value increased slightly, but still approximately 50% less roughness was obtained than with the C1 samples. It is thought that the absence of MPCM in the paint applied to the surface of C4 and C5 composite materials caused the surface roughness to be lower when compared with the C6 composite material. In other words, the increase in surface roughness of the C6 composite material is due to the MPCM contained in the paint. However, there is no statistical difference between these three variations in which paint is applied. In terms of surface quality, surface texture is quite important, especially during finishing procedures [30].
A material with a smooth surface can cause liquid drops to spread less on the surface, creating a higher contact angle. This is because a smooth surface allows liquid drops to adhere less to the surface at the molecular level, thus creating a higher contact angle. As seen in Figure 11, the contact angle decreased as the roughness of surface increased. The contact angle of the control composite material produced was measured as 88.25°, the C2 and C3 samples were measured as 133.75° and 111.48°, respectively, and the contact angles of the painted surfaces (C4, C5, C6) were measured as 76.69°, 60.77°, and 85.78°, respectively. The increase in surface roughness resulted in lower contact angle values. This behavior can be explained by the increased surface roughness, which improves the spreading of the liquid and therefore decreases the contact angle [31].

3.4. Mechanical Properties Results

Previous studies have indicated that surface treatments applied to wood-based composites generally have a limited influence on their bulk mechanical properties [32]. Therefore, mechanical testing was focused on C1–C3 to evaluate the effect of MPCM incorporation within the composite structure. The mechanical properties of composites measured included density, MOR, MOE, and IB. The results for each test group are given in Table 4.
The densities of the C1, C2 and C3 samples ranged from 0.64 g/cm3 to 0.75 g/cm3. The control group (C1) exhibited the lowest density at 0.64 ± 0.06 g/cm3. The highest density was observed in groups C2 and C3, both at 0.75 g/cm3. The inclusion of MPCM can increase the density of the composites. The MOR values varied between 9.73 N/mm2 and 10.78 N/mm2. Group C3 exhibited the highest MOR at 10.78 ± 2.38 N/mm2. The addition of MPCM has a positive impact of bending strength. The C1 had an MOR of 9.93 ± 2.55 N/mm2. The MOE values showed significant variation, ranging from 941 N/mm2 to 1373 N/mm2. Group C2 exhibited the highest MOE at 1373 N/mm2. The control group (C1) had the lowest MOE at 941 N/mm2. C2 and C3 with MPCM additions showed MOE values ranging from 1373 N/mm2 and 1225 N/mm2 respectively, indicating that MPCM contributes to increased stiffness. The statistical analysis revealed that all variations for density and MOR were in the same homogeneity class while there were significant differences from the control (p < 0.05). In the MOE results, C2 and C3 are in the same homogeneity group, while C1, with the lowest value, is in a different homogeneity group. The absence of a statistically significant difference between C1 and other variations is considered a significant result. Prior research revealed similar results, which indicates that an increase in composite density leads to a drop in the load per unit area and an observed rise in MOR and MOE values [33,34]. Furthermore, Sun et al. [35] state that PCMs in the microstructure improve the interfacial bonding characteristics by filling up the voids in the composite. Excessive incorporation of MPCM in composite materials has been shown to cause aggregation within the matrix, leading to a reduction in both the MOR and MOE values [36].
The IB values were relatively consistent across three groups (C1, C2 and C3), ranging from 0.24 N/mm2 to 0.25 N/mm2. The samples broke out by fracturing through the core layer after the IB test. The highest IB value of 0.25 N/mm2 was observed with C2. The additions of MPCM enhanced the internal bonding of the composites. The C1 showed an IB of 0.24 ± 0.05 N/mm2, which was comparable to the other groups, indicating 4% improvement with the addition of MPCM. The IB values of the control group and the MPCM-containing composites were found to be quite similar. In a study conducted by Öztürk et al. [22], it was reported that the IB values of wood fiber–starch composites with and without MPCM were also similar. It was stated that the use of high amounts of MPCM in different materials can lead to voids and weak bonds within the matrix, causing a decrease in IB values [37]. Additionally, the hydrophobic properties of formaldehyde-based adhesives can reduce the bond strength between the high content of microcapsules and the surrounding matrix, leading to a decrease in IB strength [38].

4. Conclusions

This study presents results and discussions regarding the integration of MPCM into composite materials. The microstructure of wood-based composite materials with MPCM was examined and it was demonstrated through SEM images that MPCM was harmoniously integrated with wood particle boards. It has been observed that MPCM increases the thermal energy storage capacity of composite materials used in furniture and shows phase change at 26 °C. Additionally, the thermal stability of composite materials was evaluated by TGA and it was observed that MPCM did not change the flame retardancy properties of MPCM/WBHC. The effect of MPCM on reducing the surface temperatures of composite materials has been observed through solar radiation measurements and thermal camera imaging. In conclusion, it may be summarized that the C2 sample showed the best cooling and heating performances due to its more prolonged duration for these effects, while the C5 board reached maximum difference for a short time in the case of the board surface. On the other hand, C5 provided the best cooling and heating performances for a prolonged time and achieved the maximum difference in the room center case, which may be the most crucial location for deciding the indoor performance of the boards. Finally, the effect of MPCM on the mechanical properties of composite materials was evaluated and it was observed that MPCM increased the density and flexural strength of the composites. However, no statistically significant difference was found. These results highlight the potential of MPCM for use as an environmentally friendly and energy-efficient solution in the furniture industry.

Author Contributions

A.C.: Supervision, resources, writing—original draft. M.E.E.: Methodology, writing—original draft. O.G.: Methodology, writing—original draft. A.S.: Writing—review and editing, methodology, formal analysis. G.H.: Methodology, investigation. A.U.: Methodology, writing—original draft. İ.Ö.: Writing—review and editing. T.K.: Writing—review and editing. All authors have read and agreed to the published version of the manuscript.

Funding

This research received no specific grant from any funding agency in the public, commercial, or not for profit sectors.

Data Availability Statement

No datasets were generated or analyzed during the current study.

Conflicts of Interest

The authors declare that they have no known competing financial interests or personal relationships that could have appeared to influence the work reported in this paper.

References

  1. World Bank. World Energy Balances [Online]. 2024. Available online: https://data.worldbank.org/ (accessed on 6 March 2024).
  2. Climate Watch [Online]. 2024. Available online: https://www.climatewatchdata.org/ghg-emissions?end_year=2020&start_year=1990 (accessed on 6 March 2024).
  3. CW. Climate Watch. GHG Emissions (1990–2020). 2024. Available online: https://www.climatewatchdata.org/ghg-emissions?end_year=2023&start_year=1990 (accessed on 6 March 2024).
  4. Tapia-Calderón, A.; Boer, D.; Salinas-Lira, C.; Vasco, D.A. Optimized thermal envelope of low-income dwellings in Santiago de Chile incorporating Pinus radiata wood impregnated with phase change materials. J. Energy Storage 2023, 60, 106665. [Google Scholar] [CrossRef]
  5. The European Parliament and the Council of the European Union. Directive 2010/31/EU on the energy performance of buildings. Off. J. Eur. Union 2010, 13, 19. [Google Scholar]
  6. Building Performance Institute Europe (BPIE). Europe’s Buildings Under the Microscope. Exec Summ; Buildings Performance Institute Europe (BPIE): Brussels, Belgium, 2011. [Google Scholar]
  7. Johra, H.; Heiselberg, P. Influence of internal thermal mass on the indoor thermal dynamics and integration of phase change materials in furniture for building energy storage: A review. Renew. Sustain. Energy Rev. 2017, 69, 19–32. [Google Scholar] [CrossRef]
  8. Corcione, M.; Fontana, L.; Moncada Lo Giudice, G. A parametric analysis on the effects of furnishings upon the performance of radiant floor-panel heating systems. In Proceedings of the Clima 2000 International Congress, Naples, Italy, 14–18 September 2001; pp. 59–68. [Google Scholar]
  9. Fontana, L. Thermal performance of radiant heating floors in furnished enclosed spaces. Appl. Therm. Eng. 2011, 31, 1547–1555. [Google Scholar] [CrossRef]
  10. Wolisz, H.; Kull, T.M.; Streblow, R.; Müller, D. The effect of furniture and floor covering upon dynamic thermal building simulations. In Proceedings of the 6th International Building Physics Conference, IBPC, Turin, Italy, 14–17 June 2015. [Google Scholar]
  11. Felgner, F.; Agustina, S.; Cladera Bohigas, R.; Merz, R.; Litz, L. Simulation of Thermal Building Behaviour in Modelica. In Proceedings of the 2nd International Modelica Conference, Oberpfaffenhofen, Germany, 18–19 March 2002. [Google Scholar]
  12. Kalnaes, S.E.; Jelle, B.P. Phase change materials and products for building applications: A state-of-the-art review and future research opportunities. Energy Build. 2015, 94, 150–176. [Google Scholar]
  13. Rodriguez-Ubinas, E.; Ruiz-Valero, L.; Vega, S.; Neila, J. Applications of phase change material in highly energy-efficient houses. Energy Build. 2012, 50, 49–62. [Google Scholar] [CrossRef]
  14. PlusIce. Passive Cooling Furniture; Brochure; EPS Ltd.: Grangemouth, UK, 2010. [Google Scholar]
  15. Johra, H.; Filonenko, K.; Heiselberg, P.; Veje, C.; Dall’Olio, S.; Engelbrecht, K.; Bahl, C. Integration of a magnetocaloric heat pump in an energy flexible residential building. Renew. Energy 2019, 136, 115–126. [Google Scholar] [CrossRef]
  16. Sapporo, J. Abaisser les Factures Énergétiques en Changeant de Mobilier. Le Monıteur.FR. 2015. Available online: https://www.lemoniteur.fr/article/abaisser-les-factures-energetiques-en-changeant-de-mobilier.707324 (accessed on 7 March 2024). (In French)
  17. Kuznik, F.; Virgone, J.; Noel, J. Optimization of a phase change material wallboard for building use. Appl. Therm. Eng. 2008, 28, 1291–1298. [Google Scholar] [CrossRef]
  18. Emiroğlu, M.; Özgüler, A.T.; Nas, M.; Subasi, S.; Sari, A.; Hekimoglu, G.; Ustaoğlu, A.; Gencel, O. Physico-mechanical properties and thermal monitoring performance of thermal enhanced cement slurry-coated LWAs containing microencapsulated phase change material. Mater. Today Sustain. 2024, 26, 100748. [Google Scholar]
  19. ISO 4287:1997; Geometrical Product Specifications (GPS)—Surface Texture: Profile Method—Terms, Definitions and Surface Texture Parameters. International Organization for Standardization (ISO): Geneva, Switzerland, 1997.
  20. TS EN 319; Particleboards and Fibreboards—Determination of Tensile Strength Perpendicular to the Plane of the Board. Turkish Standards Institution (TSE): Ankara, Türkiye, 1999.
  21. TS EN 310; Wood—Based Panels-Determination of Modulus of Elasticity in Bending and of Bending Strength. Turkish Standards Institution (TSE): Ankara, Türkiye, 1999.
  22. Öztürk, G.; Temiz, A.; Hekimoğlu, G.; Aslan, M.; Demirel, G.K.; Erdeyer, Ö.N.; Sari, A.; Gencel, O.; Subaşı, S. Microencapsulated phase change material/wood fiber-starch composite as novel bio-based energy storage material for buildings. J. Energy Storage 2024, 84, 110911. [Google Scholar]
  23. Lin, X.; Chen, X.; Weng, L.; Hu, D.; Qiu, C.; Liu, P.; Zhang, Y.; Fan, M.; Sun, W.; Guo, X. In-situ copper ion reduction and micro encapsulation of wood-based composite PCM with effective anisotropic thermal conductivity and energy storage. Sol. Energy Mater. Sol. Cells 2022, 242, 111762. [Google Scholar]
  24. Zhou, D.; Zhao, C.Y.; Tian, Y. Review on thermal energy storage with phase change materials (PCMs) in building applications. Appl. Energy 2012, 92, 593–605. [Google Scholar] [CrossRef]
  25. Cui, Y.; Xie, J.; Liu, J.; Wang, J.; Chen, S. A review on phase change material application in building. Adv. Mech. Eng. 2017, 9, 1687814017700828. [Google Scholar] [CrossRef]
  26. Al-Yasiri, Q.; Szabó, M. Incorporation of phase change materials into building envelope for thermal comfort and energy saving: A comprehensive analysis. J. Build. Eng. 2021, 36, 102122. [Google Scholar] [CrossRef]
  27. Yazici, H. Painting of Wooden Parts with Organic Paints by Boiling Together Method. Bioresources 2024, 19, 6569–6583. [Google Scholar]
  28. Can, A.; Gencel, O.; Sarı, A.; Hekimoğlu, G.; Ustaoglu, A. Accelerating weathering and thermal regulation performance of window frame applied with microencapsulated phase change thermochromic pigment coated wood material. J. Build. Eng. 2025, 100, 111718. [Google Scholar] [CrossRef]
  29. Poljanšek, I.; Šebenik, U.; Krajnc, M. Characterization of phenol–urea–formaldehyde resin by inline FTIR spectroscopy. J. Appl. Polym. Sci. 2006, 99, 2016–2028. [Google Scholar]
  30. Buyuksari, U.; Akbulut, T.; Guler, C.; As, N. Wettability and surface roughness of natural and plantation-grown narrow-leaved ash (Fraxinus angustifolia Vahl.) wood. BioResources 2011, 6, 4721–4730. [Google Scholar]
  31. Papp, E.A.; Csiha, C. Contact angle as function of surface roughness of different wood species. Surf. Interfaces 2017, 8, 54–59. [Google Scholar] [CrossRef]
  32. Nemli, G.; Kalaycıoğlu, H. The resistances of several types of overlaying materials against cigarette burn, scratch, and abrasion. Build. Environ. 2006, 41, 640–645. [Google Scholar] [CrossRef]
  33. Li, J.; Xue, P.; Ding, W.; Han, J.; Sun, G. Micro-encapsulated paraffin/high-density polyethylene/wood flour composite as form-stable phase change material for thermal energy storage. Sol. Energy Mater. Sol. Cells 2009, 93, 1761–1767. [Google Scholar]
  34. Ergun, M.E.; Ozen, E.; Yildirim, N.; Dalkilic, B.; Baysal, E. Mechanical and thermal properties of polyvinyl acetate foams reinforced with biopolymers. Cell. Polym. 2023, 42, 156–173. [Google Scholar] [CrossRef]
  35. Sun, J.; Xu, J.; Zhou, S.J.; Pang, Y.; Zhang, W.; Zhou, J.; Liu, Y.; Guo, H.; Jiang, F. Enhancing Building Energy Efficiency: Leaf Transpiration Inspired Construction of Lignin-Based Wood Plastic Composites for Building Energy Conservation. Appl. Energy 2024, 367, 123448. [Google Scholar] [CrossRef]
  36. Guo, X.; Cao, J.; Peng, Y.; Liu, R. Incorporation of microencapsulated dodecanol into wood flour/high-density polyethylene composite as a phase change material for thermal energy storage. Mater. Des. 2016, 89, 1325–1334. [Google Scholar]
  37. Urgessa, G.; Yun, K.K.; Yeon, J.; Yeon, J.H. Thermal responses of concrete slabs containing microencapsulated low-transition temperature phase change materials exposed to realistic climate conditions. Cem. Concr. Compos. 2019, 104, 103391. [Google Scholar] [CrossRef]
  38. Wei, Z.; Falzone, G.; Wang, B.; Thiele, A.; Puerta-Falla, G.; Pilon, L.; Neithalath, N.; Sant, G. The durability of cementitious composites containing microencapsulated phase change materials. Cem. Concr. Compos. 2017, 81, 66–76. [Google Scholar] [CrossRef]
Figure 1. Descriptions of production flow and coding.
Coatings 16 00792 g001
Figure 2. Experimental setup and thermocouple positions.
Coatings 16 00792 g002
Figure 3. SEM photographs of (a) MCPM, (b) reference composite (C1), (c) MPCM/WBHC (C3) (500×), and (d) MPCM/WBHC (C3) (2.00 kx).
Coatings 16 00792 g003
Figure 4. The DSC curves of (a) MCPM and MPCM/WBHC (C3) and (b) the latent heat of MPCM and C3 composite.
Coatings 16 00792 g004
Figure 5. Chemical structures of MCPM and MPCM/WBHC.
Coatings 16 00792 g005
Figure 6. TG curves of MPCM/WBHC (C1) and C3.
Coatings 16 00792 g006
Figure 7. Global, direct, and diffuse solar radiation measurement in the actual ambient conditions (17 April 2024–18 April 2024).
Coatings 16 00792 g007
Figure 8. Lower-surface (a), upper-surface (b), near-surface (c), and room center (d) temperature in the experimental room with C1, C2, C3, C4, C5, and C6 samples (17 April 2024–18 April 2024).
Coatings 16 00792 g008
Figure 9. Temperature difference (∆T) between C2, C3, C4, C5, C6 and reference samples (C1) for lower-surface (a), upper-surface (b), near-surface (c), and room center (d) cases (17 April 2024–18 April 2024).
Coatings 16 00792 g009
Figure 10. Thermal camera image of the control and test rooms.
Coatings 16 00792 g010
Figure 11. Contact angle (°) and surface roughness (Ra) of C1, C2, C3, C4, C5 and C6.
Coatings 16 00792 g011
Table 1. Furniture use and surface areas in the home.
Living RoomDimensions and Surface AreaMaterial Shape
Console220 cm (width), 78 cm (height), 51 cm (depth)—42,276 cm2Rectangular prism
Table60 cm (width), 100 cm (depth)—6000 cm2Rectangular
Display cabinet110 cm (width), 156 cm (height), 52 cm (depth)—50,544 cm2Rectangular prism
TV unit200 cm (width), 56 cm (height), 58 cm (depth)—14,448 cm2Rectangular prism
Bedroom
Wardrobe246 cm (width), 220 cm (height), 66 cm (depth)—137,280 cm2Rectangular prism
Bed frame200 cm (width), 40 cm (height), 215 cm (length)—33,200 cm2Rectangular prism
Dresser125 cm (width), 75 cm (height), 50 cm (depth)—26,250 cm2Rectangular prism
Nightstand110 cm (width), 88 cm (height), 100 cm (depth)—36,960 cm2Rectangular prism
Etagere51 cm (width), 125 cm (height), 47 cm (depth)—12,250 cm2Rectangular prism
Vanity table126 cm (width), 47 cm (depth)—5922 cm2Rectangular
Kitchen
Table200 cm (width), 90 cm (depth)—18,000 cm2Rectangular
Cabinets38,040 cm2Rectangular prism
Children’s room
Wardrobe180 cm (width), 205 cm (height), 57 cm (depth)—97,170 cm2Rectangular prism
Dresser90 cm (width), 88 cm (height), 42 cm (depth)—23,232 cm2Rectangular prism
Nightstand51 cm (width), 52 cm (height), 42 cm (depth)—4836 cm2Rectangular prism
Study desk115 cm (width), 62 cm (depth)—7130 cm2Rectangular
Bookshelf90 cm (width), 163 cm (height), 60 cm (depth)—48,900 cm2Rectangular prism
Four Doors90 cm (width), 120 cm (height)—43,200 cm2Rectangular
Table 2. Particleboard manufacturing parameters.
Particleboard Manufacturing Parameters Values
Board dimensions (mm) 250 × 250
Target board density (g/cm3) 0.650
Thickness (mm) 16
Press time (s) 240
Press temperature (°C) 165–175
Specific press pressure (bar) 30–40
Table 3. Summary of experimental groups and MPCM applications.
Sample CodeMPCM in Particleboard Layers
MPCM
Dosage in Particleboard (g)Coating/Filler
Applied
MPCM in
Coating/Paint System
C1None (Control)0NoNo
C2Top and bottom layers40 g (Top) + 40 g (Bottom) = 80 gNoNo
C3Top, core, and bottom layers26.6 g (Top) + 26.6 g (Core) + 26.6 g (Bottom) = 79.8 gNoNo
C4Top and bottom layers40 g (Top) + 40 g (Bottom) = 80 gYesNo
C5Top, core, and bottom layers26.6 g (Top) + 26.6 g (Core) + 26.6 g (Bottom) = 79.8 gYesNo
C6None in particleboard layers0YesYes
Table 4. Mechanical test results of composites.
CodesDensity (g/cm3)MOR (N/mm2)MOE (N/mm2)IB (N/mm2)
C10.64 a ± 0.069.93 a ± 2.55941 a ± 2370.24 a ± 0.05
C20.75 a ± 0.0910.40 a ± 1.541373 b ± 2100.25 a ± 0.03
C30.75 a ± 0.0510.78 a ± 2.381225 ab ± 4230.24 a ± 0.01
The letters “a” indicate Duncan’s homogeneity groups in the column.
Disclaimer/Publisher’s Note: The statements, opinions and data contained in all publications are solely those of the individual author(s) and contributor(s) and not of MDPI and/or the editor(s). MDPI and/or the editor(s) disclaim responsibility for any injury to people or property resulting from any ideas, methods, instructions or products referred to in the content.