Article

Effect of Green Light on Citrate-Coated Gold Nanoparticles and Their Effect on the Growth of Cellulolytic Fungi

1
Laboratory of Atmosphere Optics, Spectroscopy and Laser (LOASL), Faculty of Physics, Alexandru Ioan Cuza University, 11, Carol I Bld., 700506 Iasi, Romania
2
Research Center with Integrated Techniques for Atmospheric Aerosol Investigation in Romania, RECENT AIR, Laboratory of Astronomy and Astrophysics, Astronomical Observatory, Physics, Alexandru Ioan Cuza University, 11, Carol I Bld., 700506 Iasi, Romania
3
Laboratory of Physical Chemistry of Polymers, Petru Poni Institute of Macromolecular Chemistry, 41A, Gr. Ghica Voda Alley, 700487 Iasi, Romania
4
Faculty of Biology, Alexandru Ioan Cuza University, 11, Carol I Bld., 700506 Iasi, Romania
5
Institute of Biological Research Iasi, Branch of NIRDBS, 700107 Iasi, Romania
6
Faculty of Physics, Alexandru Ioan Cuza University, 11, Carol I Bld., 700506 Iasi, Romania
*
Authors to whom correspondence should be addressed.
Coatings 2026, 16(6), 657; https://doi.org/10.3390/coatings16060657 (registering DOI)
Submission received: 14 April 2026 / Revised: 20 May 2026 / Accepted: 27 May 2026 / Published: 29 May 2026
(This article belongs to the Special Issue Emerging Trends in Functional Coatings for Biomedical Applications)

Abstract

The design and study of gold nanoparticles (AuNPs) with improved catalytic properties is of great interest due to the wide range of applications, so the modification of the surface of nanoparticles by coating with organic functional groups, as well as the treatment of these coatings with a light beam, is investigated as a potential nanotechnological tool in this regard. We obtained fine gold nanoparticles (AuNPs) by the conventional method with pH adjustment and by green light irradiation of pristine gold–citrate nanoparticles. The physicochemical properties of these products were revealed by electron microscopy, dark-field optical microscopy, UV-Vis spectrophotometry, dynamic light scattering and cyclic voltammetry. The phenomena at the interface between pristine colloidal nanoparticles and those exposed to green light with environmental fungi were analyzed at the level of the cellulolytic species of Chaetomium globosum, considering the final fate in the biosphere of gold nanoparticles used in the technical and biomedical fields. Measurements of fungal growth in the presence of 200 to 1000 µL/L of AuNP suspensions (or Au content of 0.098 to 0.49 µg/mL) provided semi-quantitative information on their nanotoxicity, focusing on the comparison between non-irradiated and green-light-exposed gold nanoparticles.

1. Introduction

The studies on the applications of gold nanoparticles (AuNPs) underlined the importance of their properties optimization and developed various protocols of chemical synthesis aiming at the control of particle size and reactivity. Besides the chemical surface modification, much attention is paid nowadays to particle surface irradiation, aiming to improve their reactivity at the interface with biological media.
Several studies have shown that AuNPs endocytosed by cancer cells and then irradiated with a laser light beam have led to cell death. It was observed that malignant cells died even under non-thermal irradiation conditions [1], which was later attributed to photochemical reactions induced by the irradiated nanoparticles, which were capable of producing increased levels of reactive oxygen species (ROS) [2]. In [3], the authors reported that by using the irradiation procedure of endocytosed AuNPs, the photochemical effect only affects the diseased cells and not the healthy ones in the vicinity, avoiding the rapid diffusion of photothermal heat into the irradiated volume. Some studies have shown that ROS play an important role in cell proliferation, but only if they are not administered in concentrations at which they become cytotoxic. The effect of modulating the amount of ROS in cell culture by the action of gold nanoparticles irradiated with visible light at certain wavelengths can make the difference between inhibiting and stimulating cell proliferation. Thus, it has been reported [4] that, upon visible light irradiation of gold nanoparticles administered into tissues, ROS were generated after the nanoparticles attached to cell membrane receptors or by internalization, and most likely, the increase in ROS levels inactivated specific antioxidant enzymes and initiated cellular lipid peroxidation. However, other authors [5] found that the use of AuNPs exposed to a visible light beam could enhance their efficacy as therapeutic agents for the delivery of nucleic acids into cells, which could provide a way to control the spatiotemporal modulation of genes. According to [6], the mechanisms of ROS generation at the surface of irradiated gold nanoparticles are also of great interest to researchers in frontier sciences, mainly due to the possibility of tuning the surface properties of the particles by light irradiation.
Also, in [7,8,9], the surface plasmonic properties of gold nanoparticles are considered to underlie their photocatalytic characteristics and increase the interest in tuning this reactivity by controlling the size and morphology, as well as by optimizing the use of surfactants and light exposure. In [10], it is said that the interest in the use of gold nanoparticles against pathogenic microorganisms arose from the comparison with silver nanoparticles, which can induce nanotoxicity in treated subjects. The efficacy of gold nanoparticles against bacteria and fungi can be improved by controlling their size and shape and, in particular, by controlling the surface plasmonic properties, taking into account the photothermal effect in cells. Lotfali et al. demonstrated the antifungal activity of gold nanoparticles against strains of Candida resistant to pharmaceutical therapy [11]. In addition to the attention paid to the use of gold nanoparticles against pathogenic microorganisms, their potential applications in virology and oncology have also been considered [12,13]. Less studied seem to be the effects of gold nanoparticles on microorganisms in the environment, which are of interest because these nanoproducts are eventually released into running waters and spread to soil and air, which means multiple pathways of interaction with the biosphere. Mishra et al. [14] studied the potential applications of gold nanowires against fungal infections and found a significant effect on the human pathogen Candida as well as on the beneficial cellulolytic fungus Fusarium from environmental vegetation. We designed an experimental research focused on the photochemical synthesis of gold nanoparticles by using green light to act on the citrate–AuNPs resulting from the chemical synthesis step, and then comparatively tested the influence of these nanoparticles on fungal growth under laboratory conditions. The fungus Chaetomium globosum was chosen as a representative of environmental saprophytic fungi that decompose plant waste using the cellulase activity of hyphae [15]. We designed an experimental study focused on the photochemical modification of citrate-capped AuNPs through green light irradiation and on the comparative assessment of their effects on cellulolytic fungal growth under laboratory conditions. A previous study from our group [15] investigated the effects of visible light on AuNPs and the effects of the irradiated AuNPs in Phanerochaete chrysosporium biochemistry [16]. In the present research, the wavelength of 520 nm was selected because it corresponds to the LSPR peak of citrate-capped AuNPs of approximately 15–17 nm diameter (confirmed at 522 nm in the present study), ensuring selective and controlled photochemical interaction with the nanoparticle surface layer. We assume that irradiation at the LSPR wavelength modifies the surface properties of AuNPs—citrate layer reorganization and partial surface oxidation—leading to measurable changes in their electrochemical reactivity and biological effects on fungal growth. The fungus Chaetomium globosum was chosen as a representative saprophytic environmental fungus that decomposes plant waste through cellulase activity [15], and AuNP concentrations were selected at levels one order of magnitude lower than those typically used in antimicrobial studies, to simulate realistic environmental exposure scenarios.

2. Materials and Methods

2.1. Reagents

The chemicals used in the AuNPs synthesis, i.e., tetrachloroauric(III) acid trihydrate (HAuCl4 × 3H2O), sodium hydroxide (NaOH) and trisodium citrate dihydrate (Na3C6H5O7 × 2H2O) were purchased from Sigma Aldrich (Darmstadt, Germany). The solutions were prepared using Milli-Q deionized water (18.2 MOhm).

2.2. Gold Nanoparticle Synthesis

GC (gold nanoparticle control, i.e., pure, non-irradiated sample): An amount of 2 mL of 25 mM HAuCl4 × 3H2O and 6.6 mL of 20 mM NaOH were mixed with distilled and deionized water to 20 mL in a glass bottle. The flask was immersed in a water bath preheated to 110 °C on a thermostatic heat source. After the solution in the flask was brought to 101 °C, 0.6 mL of sodium citrate (50 mg/mL) was added. The flask was left on the thermostatic plate under magnetic stirring (750 rpm) for another 30 min at the same temperature, until the reaction mixture turned pink. Then, the flask was removed from the heat source and immersed in cold water at 4 °C to stop the nucleation process. The AuNP samples remained stable for several months, as UV-Vis recordings did not reveal changes in the characteristic spectral bands, being used for physicochemical investigations and biological tests after three weeks.

2.3. Light Exposure of AuNPs

GGL (gold nanoparticles, green light exposure): A 10 mL volume of the citrate–AuNP stock suspension was exposed at 24.5 cm under a 50 W helium lamp in a suitable Petri dish. The sample was exposed to green light (520 nm filter, 26.3 W/m2) for 80 min: 20 min of light exposure and 5 min of breaks.
Analysis of the light beam and energy absorbed by the irradiated samples was performed with the Solar Light PMA 2100 device and the PMA 2130 sensor (Orlando, FL, USA). The temperature of the suspension did not exceed 30 °C, owing to the alternating light-pause cycle (20 min exposure/5 min pause). No thermal control (dark sample maintained at equivalent temperature) was included in the present experimental design.

2.4. Physicochemical Characterization

A Hitachi High-Tech HT7700 device (Hitachi High-Tech Corporation, Tokyo, Japan) was used to obtain transmission electron microscopy (TEM) images to investigate the microstructural characteristics of the samples. The diameter of the nanoparticles was measured using ImageJ software, version 1.54.
UV-Vis spectroscopy with a Shimadzu PharmaSpec 1800 device (Shimadzu Corporation, Kyoto, Japan) and UV-Probe 1900 software was used to record the absorption spectrum of the characteristic plasmonic band of the AuNP suspension.
A Nikon Eclipse Ti microscope (Tokyo, Japan) was used for dark-field (DF) analysis of the plasmonic characteristics of the AuNP samples. Both TEM and optical microscopy images were processed and analyzed using NIS Elements (NIS-BR) software. Plasmonic profiles of 50 NPs for both samples were obtained using the DF dark-field microscopy images with a 40× objective (a device from OPTIKA B-383DK, Bergamo, Italy).
Zeta potential and hydrodynamic size measurements were performed using the Zetasizer Nano ZSP instrument (Malvern Instruments, Tokyo, Japan).
Cyclic voltammograms of GC and GGL samples were recorded (BASi Corporate Headquarters, West Lafayette, IN, USA), with the electric potential ranging between −1 V and 1.5 V, at 100 mVs−1 in 0.05 M H2SO4. The investigations were performed for different amounts of GC and GGL adsorbed on the electrodes: 3 µL and 9 µL. The deposition of samples on the electrodes was performed by the drop-casting method: precise volumes of 3 µL and, respectively, 9 µL of the GC and GGL suspensions were applied directly onto the surface of the glassy carbon electrode, and allowed to dry at room temperature for approximately 30 min, forming a stable adsorbed film. The use of two different volumes (3 µL and 9 µL) aimed to investigate the dependence of the voltammetric response on the amount of material deposited on the electrode, allowing the evaluation of the AuNP film thickness and its effect on the observed anodic/cathodic currents.
A Sartorius pp-50 professional pH meter was used to measure the pH.

2.5. Biological Test

Biological material was consistent with the cellulolytic fungus Chaetomium globosum, MO96 strain [15] provided by the Biology Faculty, Microbiology Laboratory in “Alexandru Ioan Cuza” University of Iasi, Romania. Fungal growth was conducted in Petri dishes on solid (agarized) Haynes culture medium supplied with different concentrations of nanoparticle suspensions. Five replicates, i.e., five identical Petri dishes for every concentration and each nanoparticle suspension, were seeded with 7-day-old C. globosum inoculum samples in the form of cylinders of equal size (0.8 cm diameter) withdrawn from previously prepared agarized culture. Fungus growth dynamics, in the presence of gold nanoparticle suspensions supplied in the culture medium in concentrations of 200–400–600–800–1000 µL/L (or Au concentrations of 0.098–0.197–0.2955–0.394–0.49 µg/mL) was studied by measuring the diameter of the developed mycellar cultures (with a transparent ruler) at specified time intervals—while Petri dishes were kept in sterile conditions at about 25 °C up to 72 h. Average values and standard errors were estimated for statistical significance and interpretation of the represented graphs. The box-plot graphical method was used to graphically represent the measurement results from the biological test, together with the one-way ANOVA test (n = 5) applied for statistical significance relative to the p < 0.05 threshold.

3. Results

3.1. Physical Characterization

3.1.1. TEM Investigation Results

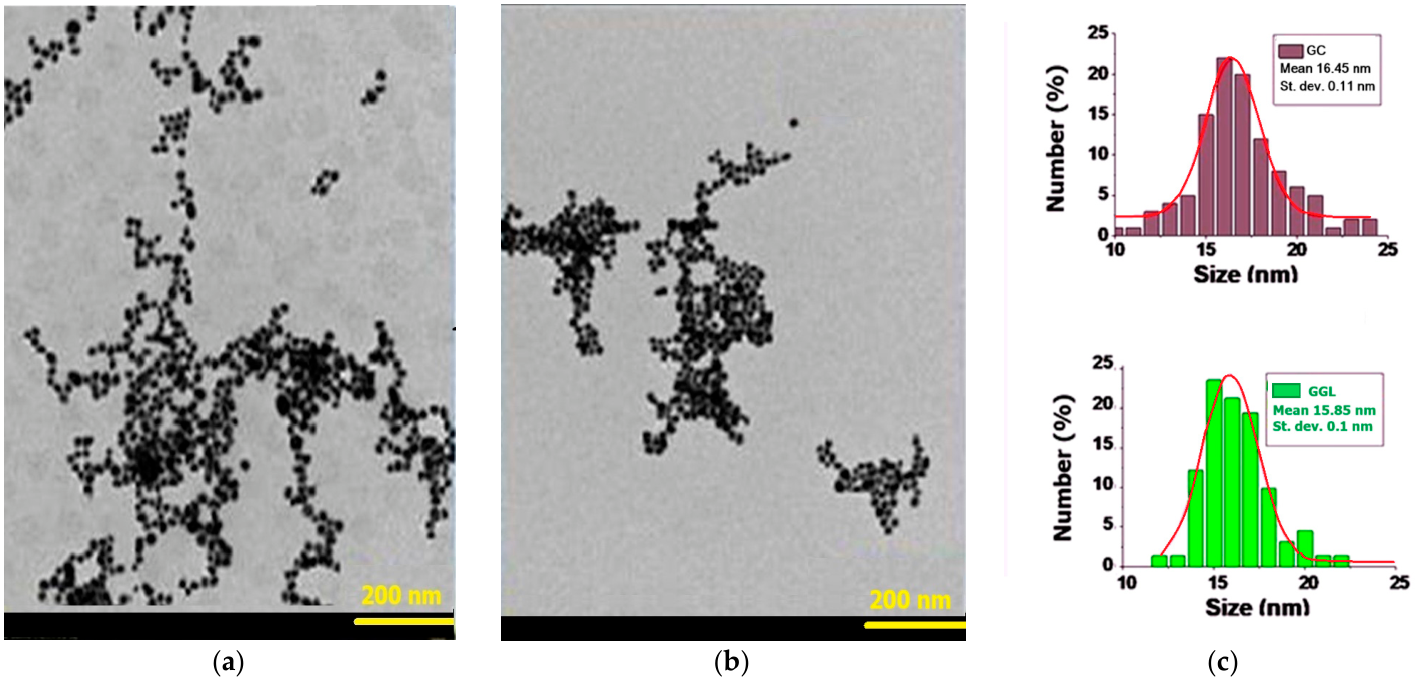
In Figure 1, the citrate–AuNP images recorded by TEM are presented along with their size distribution for both pristine AuNPs (GC) and green-light-exposed ones (GGL).
For both studied samples, predominantly spherical nanoparticles were highlighted, with close values for the average diameter, as resulted from the fitting of the dimensional histograms with the Gaussian statistical distribution curve, such as 16.4 nm for non-irradiated citrate–gold nanoparticles (GC) and 15.8 nm for citrate–gold nanoparticles exposed to green light (GGL), respectively, but which still have a lower average value.
By applying gold reduction with citrate, other researchers synthesized stable AuNPs with a similar size (17 nm diameter), like in [17]. Also in [18], the authors reported AuNPs with about 14 nm mean diameter, synthesized by reaction medium exposure to ultraviolet radiation in a flow at high temperature.
From a mechanistic point of view, a slight reduction in the mean diameter of individual particles in the GGL sample could be explained by the detachment and partial rearrangement of citrate on the particle surface under the action of green light at LSPR resonance [19]. Also, the nucleation continuation under the irradiation effect is supposed to lead to new small particles formation. Although the spectral maximum remained at the same position, the spectral band narrowed towards shorter wavelengths (Figure 2). Mean size values were 16.4 nm and 15.8 nm with standard errors of 0.11 nm for GC and 0.10 nm for GGL, as obtained from Gaussian fitting of the size histograms, which means about 0.6%, while the difference between the two mean values is approx. 3.6%.

3.1.2. UV-Vis Data

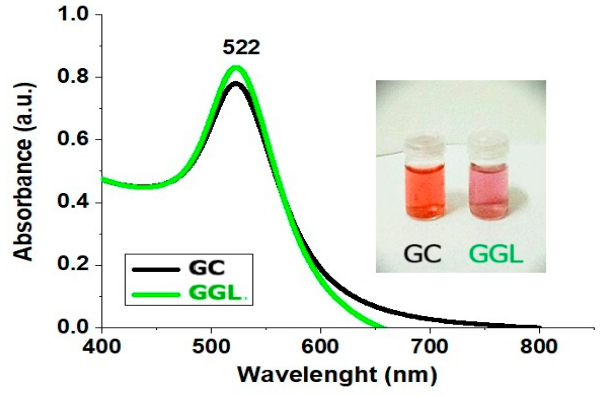
In Figure 2, the results of UV-Vis recordings carried out on GC and GGL samples are presented.
UV-Vis recording shows the spectrum generated mainly by the localized surface plasmon resonance phenomenon (LSPR) specific to some noble metal particles under the light action; in this case, the spectral band maximum is at 522 nm.
For the GGL sample (Figure 2, green curve), an increase in LSPR band intensity was noticed, which was assigned to the continuation of the nucleation process under the action of light.

3.1.3. Optical Microscopy Results

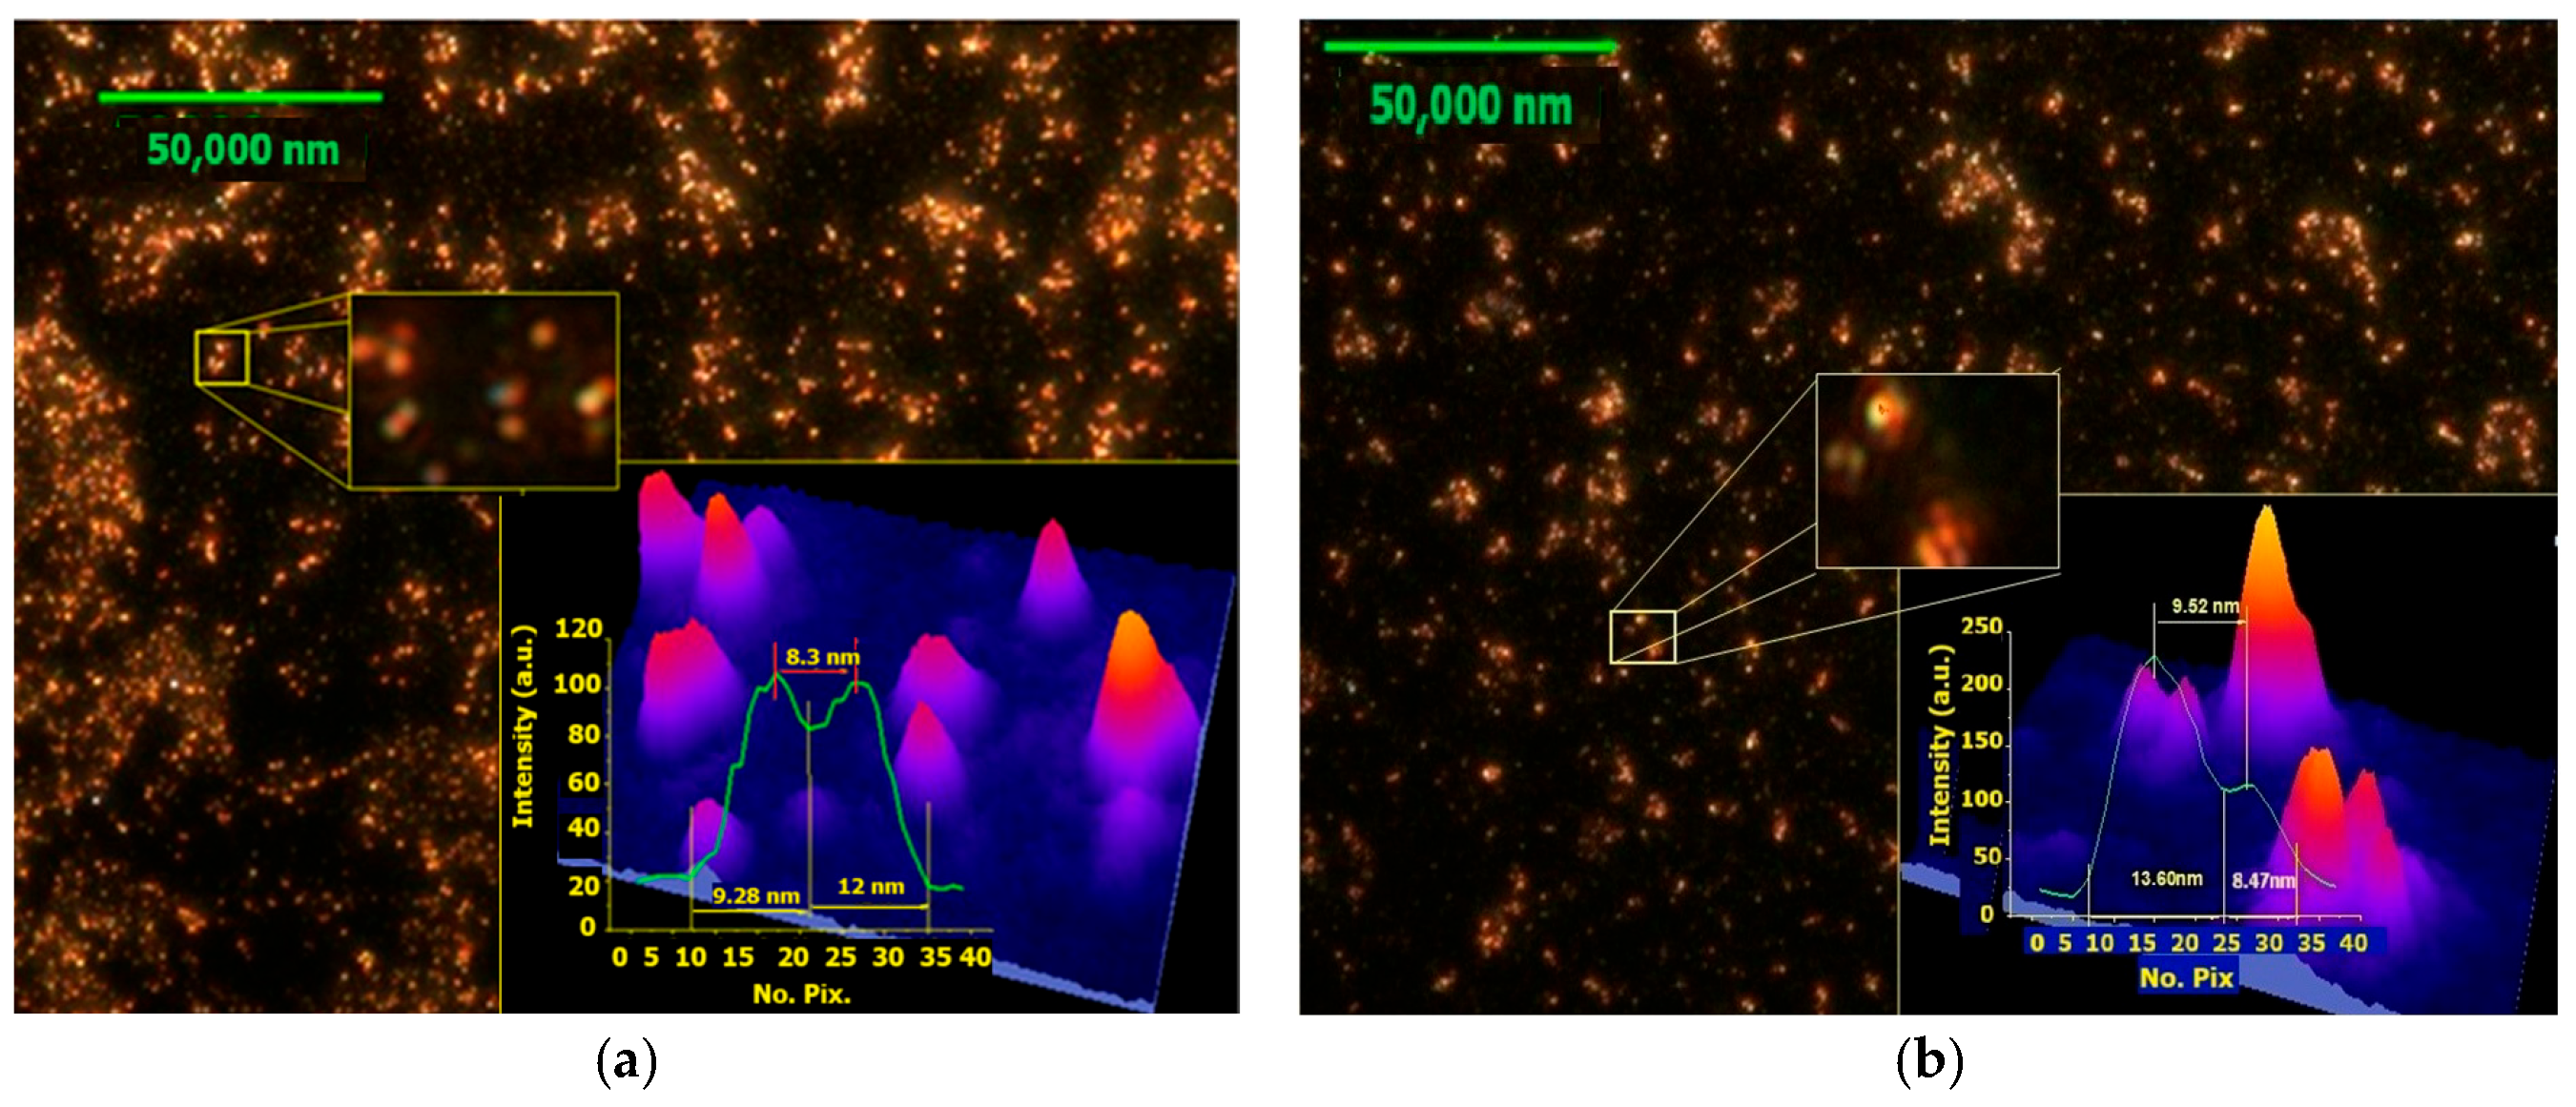
DF optical micrographs are shown in Figure 3, along with the plasmon intensity profiles.
It was observed that the GGL sample (Figure 3b) exhibits higher plasmon intensities—approximately 200 (relative intensity units) compared to 100 in the GC sample (Figure 3a), even though in both suspensions the distance between neighboring nanostructures is similar, i.e., 8.3 nm in the GC sample and 9.5 nm in the GGL sample.
But on the case of irradiated citrate–gold nanoparticles some dimers can be seen (Figure 3b) and this can be attributed to the green light effect since as mentioned above, the irradiation of AuNPs was performed in visible light beam at 520 nm and this wavelength range is close to the plasmonic resonance peak of AuNPs samples (spectral band maximum at 522 nm, in Figure 2) [20]. Reorganization of citrate groups under green light exposure can lead to the association of neighboring particles as previously suggested for AuNPs irradiated near their LSPR wavelength [19].

3.1.4. Hydrodynamic Diameter and Zeta Potential Investigation

Investigations were carried out on the hydrodynamic diameter and Zeta potential in the AuNP suspensions (GC and GGL samples) as prepared through DLS (dynamic light scattering). Particle measurements were performed in triplicate for all samples, and then the average was calculated for tabulation.
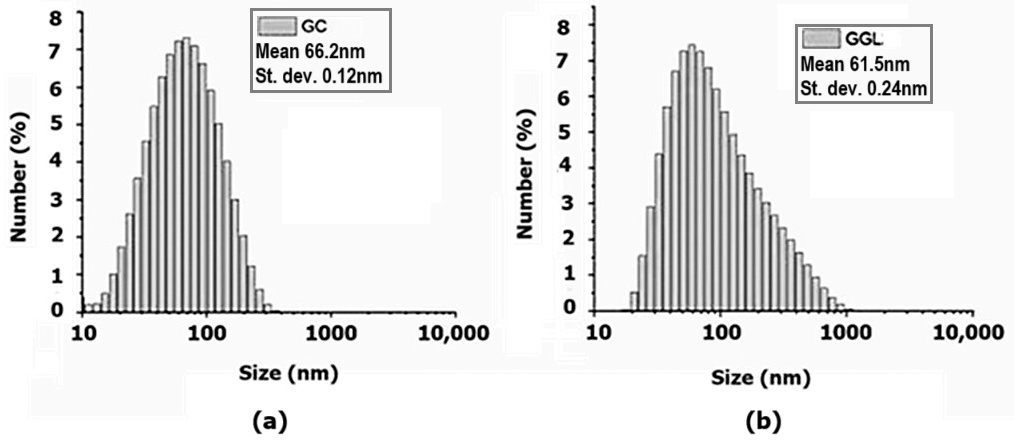
According to Figure 4a,b and Table 1, the hydrodynamic diameter of 61.2 nm on average that characterizes the irradiated nanoparticles in suspension (GGL) appeared to be relatively smaller than that corresponding to pristine, non-irradiated colloidal particles in suspension (GC), of 66.2 nm, which is concordant with the TEM data.
But the lack of the smallest AuNPs present in the case of GC non-irradiated nanoparticles (near ten nm), and, instead, the presence of some larger particles in GGL irradiated nanoparticles (near 1000 nm), identified in the histogram corresponding to irradiated AuNPs, may suggest the formation of the dimers suggested by the visualization in dark-field microscopy. The diameter measured by DLS reflects the hydrodynamic size of the particle, together with the shell and the solvation layer interacting with it. It should be noted that the hydrodynamic diameter is larger than the TEM diameter for both samples (DLS: ~61 nm for GGL, with an average size of about 15 nm in TEM and ~66 nm for GC, with an average size of about 16 nm in TEM). The smaller value of the hydrodynamic diameter in GGL compared to GC can be attributed to the rearrangement or partial release of the citrate layer under the action of light irradiation, thus reducing the size of the solvation layer. This interpretation is correlated with the dark-field microscopy data, which suggest a change in the citrate distribution at the surface of the GGL particles.
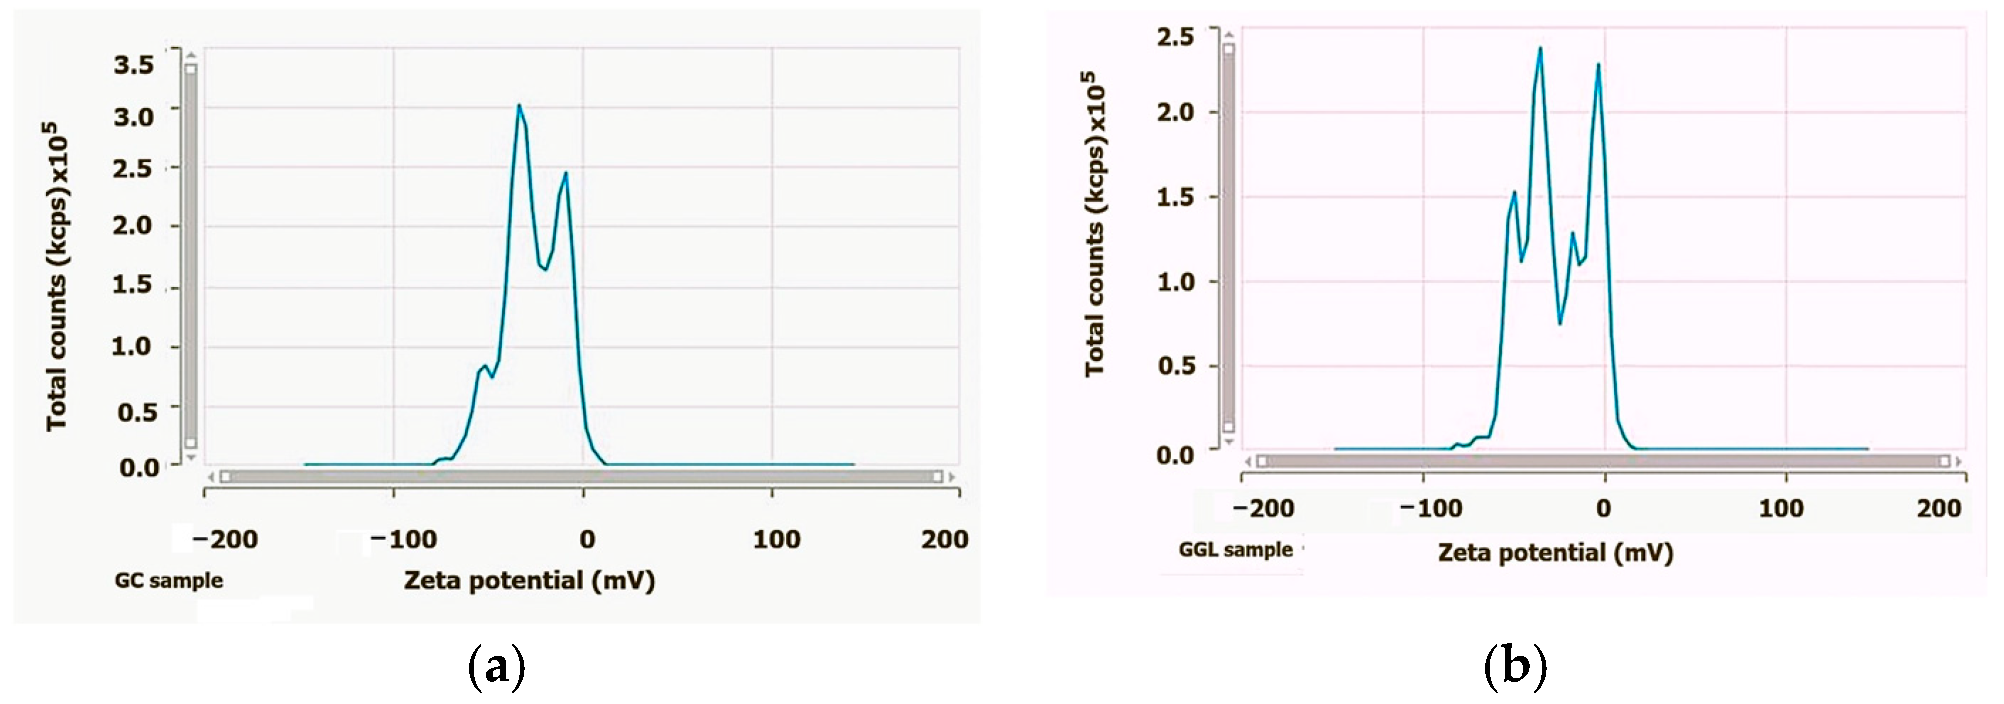
Also, a lower polydispersity index (0.505) for the irradiated particles, namely GGL, than for the non-irradiated ones, GC (0.604), indicated a better stability in the first case, which is consistent with the smaller diameters revealed by microscopy. Zeta potential measurement revealed a negative charge on the surface citrate–gold nanoparticles of the nanoparticles (Figure 5), which ensures electrostatic repulsion forces between particles close to the theoretical threshold of −30 mV.

3.1.5. Cyclic Voltammetry Investigation

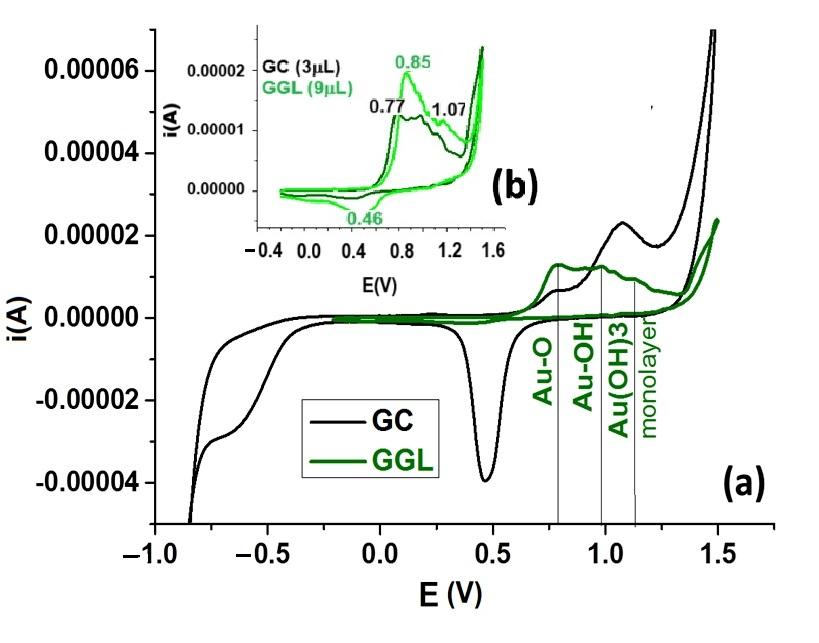
The redox behavior of citrate–AuNP from the GC (non-irradiated) sample deposited onto electrodes was compared with that of the irradiated sample (GGL) to investigate the effect of light beam impact (Figure 6).
For non-irradiated GC (as obtained from chemical reduction with citrate), the voltammetric response shows two anodic current peaks around +0.77 V and +1.07 V (Figure 6), accompanied by a cathodic counterpart at around +0.46 V [21,22]. The oxidation peak at +0.77 V is ascribed to the electronic transfer from metallic gold to the gold oxide (1):
2Au0 + H2O → Au2O + 2H+ + 2e
The second anodic process at +1.07 V is also attributed to the oxidation of gold to the trivalent state, according to the reaction (2):
Au0 + 3H2O → Au(OH)3 + 3H+ + 3e
Au(OH)3 + 3H+ + 3e → Au0 + 3H2O
The photocurrent of the Au electrode from the irradiated GGL suspension starts to drastically increase to about 0.77 V relative to the photocurrent of the electrode in the GC suspension. At equal concentrations, GGL shows reduced electrochemical surface activity compared to GC, reflecting the modification of the adsorbed layer and surface structure induced by irradiation. This does not imply lower biological activity, but rather a different electrochemical profile, consistent with the change in surface reactivity. For the sample irradiated in green light, with illumination intensity of 26.3 W/m2, the formation of these chemisorbed species of gold oxide can play an important role in the photoactivities of gold particles.

3.2. Biological Test

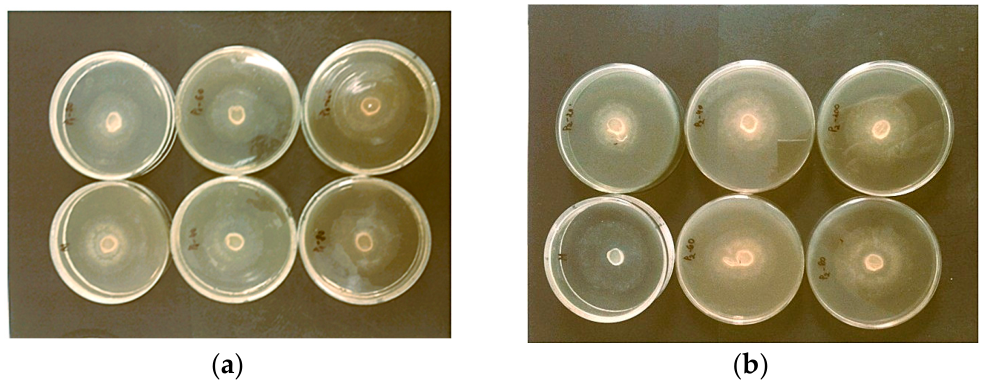
The microbiological fungal growth test was chosen to non-invasively investigate the general effect on metabolism of gold nanoparticles upon interaction with live cultures. The results of the fungal growth test of C. globosum are presented in Figure 7, Figure 8, Figure 9, Figure 10 and Figure 11 as images and mean values of the diameter of the translucent growth zone, resulting from five responses for each experimental variant of the growth control (without AuNP) and the samples fed with GC or GGL.
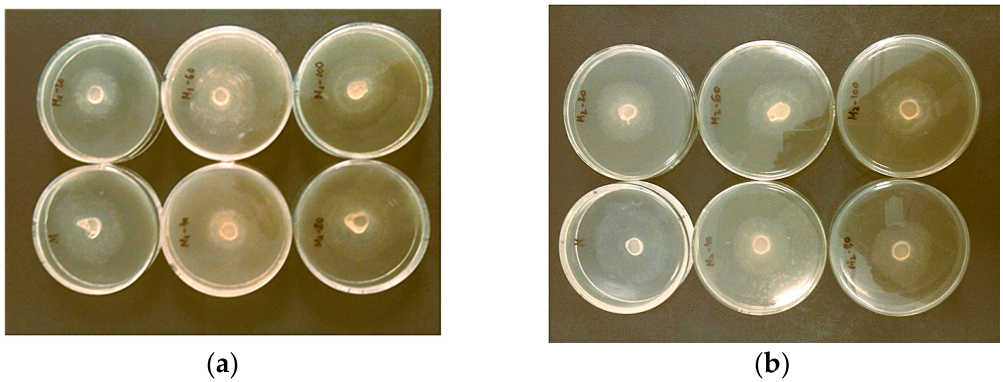
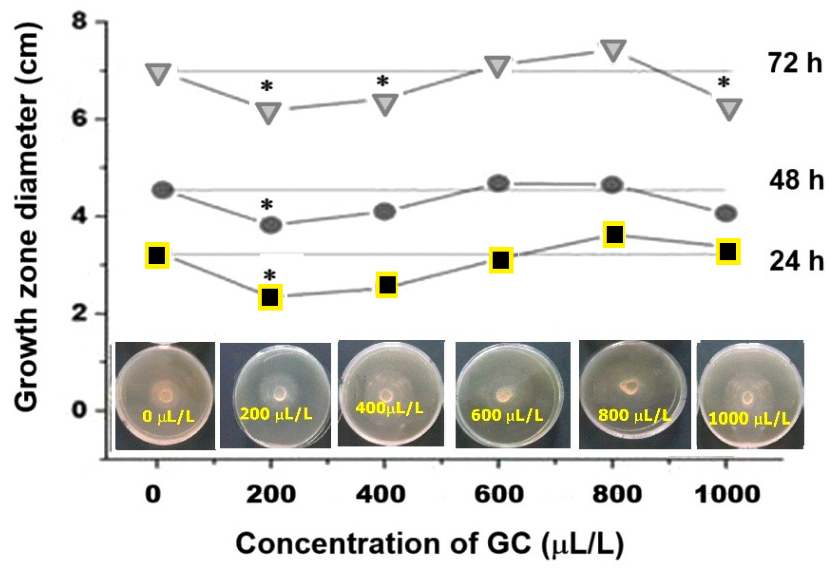
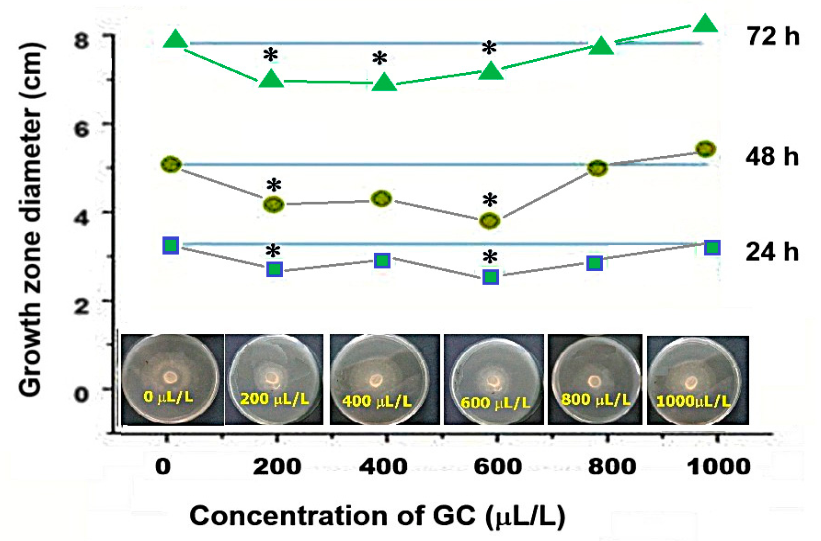
The fungal growth zones when fed with non-irradiated AuNPs are illustrated in Figure 7, while the measured data are represented in Figure 9. Incubation of fungal cultures fed with GC sample aliquots appears to induce constraint of fungal culture growth at relatively low AuNP concentrations of 200 and 400 µL/L (Figure 9).
Higher AuNP concentrations of 600–800 µL/L appear to stimulate fungal growth comparable to the control sample (without AuNPs), while the highest concentration tested in this experiment, 1000 µL/L, accentuated the final decrease in the mean diameter of the growth zone.
According to one-way ANOVA test (n = 5) compared to the fungal cultures grown in the lack of AuNPs (zero GC concentration), significant diminutions (p < 0.05) were revealed for the 200 µL/L sample at all three measurement times (24, 48, 72 h) while at 72 h there were significant variations also for the samples with 400 µL/L (smaller diameter) and 1000 µL/L (larger diameter).
The results of growth zone diameter illustrated in the photos in Figure 8 can be presented in the curves in Figure 10. It appeared that fungi incubation with the GGL sample induced growth inhibition at practically all AuNP concentrations added in the fungal cultures, which is evident mainly in the 72 h curve of the graph. For the highest concentrations, the average diameter of fungus growth zones equals the control data (for 800 µL/L) and even exceeds them (for 1000 µL/L).
According to the ANOVA test (n = 5) for the samples with 200 µL/L and respectively 600 µL/L irradiated AuNPs, significant variations (p < 0.05) were evidenced at all three measurement times (24, 48 and 72 h) as well as at 72 h for the concentration of 400 µL/L.
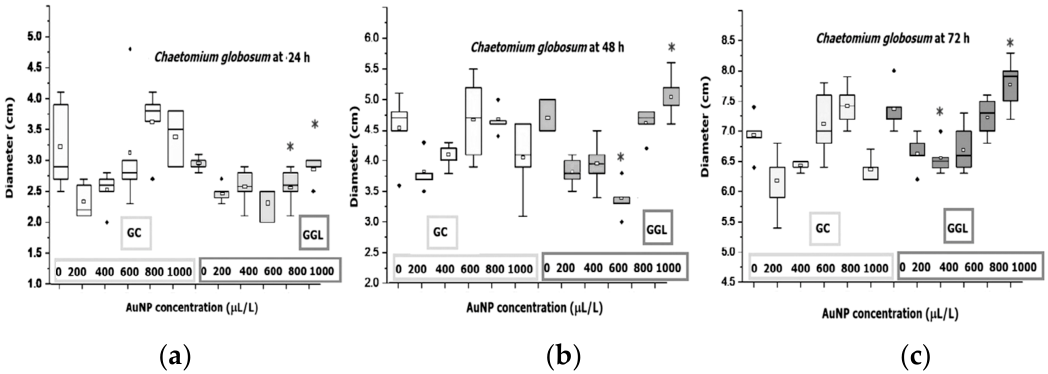
The box-plot representation of the biological test measurements showed mainly close values for the diameter of the fungal growth with GGL (small box-plots), except for relatively high AuNP concentrations (600–800–1000 µL/L) at 72 h, where the box plot sizes are larger, denoting more dispersed values within the five replicate samples in each case. Looking for the influence of exposure to green light of AuNP nanoparticles (Figure 11), we identified significant differences (p < 0.05) between fungal growth with GC samples, and respectively with GGL, for the highest concentration, 1000 µL/L, for all three measurement times (24 h, 48 h and 72 h), as well as for 400 µL/L at 72 h, for 600 µL/L at 48 h and for 800 µL/L at 24 h. No significant variations were found for the lowest AuNP concentration, 200 µL/L, between the fungal growth areas resulting from feeding with GC samples, and respectively with GGL.

4. Discussion

The preparation protocol was basically that of Turkevich [23] but included NaOH as an additional ingredient. This is because the HAuCl4 is a strong acid, and pH often drops slightly during the reaction due to the oxidation of citrate, while the pH range for optimal reduction with citrate and small reactive particle formation is 5–7, so that, for better control of synthesized AuNP size, we set the solution pH to a value of ≈7.0 by the addition of NaOH. During the synthesis of AuNPs, sodium citrate acts primarily as a reducing agent, reducing Au3+ ions, which leads to the formation of citrate-Au0 complexes [22] and attaches to the surface of AuNPs as a capping agent [24]. We can say that citrate stabilizes the AuNP colloidal solution [25] electrostatically. Depending on pH, the citrate is present during the AuNP suspension synthesis, in the form of different reactivity species. For a pH higher than 6.4, the gold nanoparticles capped with monoprotonated citrate and their reactivity is increased, ensuring monodisperse AuNPs [19]. Specifically, at a pH of 7, the adsorption to the AuNP surface of monoprotonate citrate species decreases compared to deprotonated citrate species, which enhances electrostatic repulsion between AuNPs. The addition of NaOH to the precursor solution favors citrate control over nanoparticle size in the early stages of synthesis, balancing nanoparticle nucleation and growth, which tend to occur simultaneously when no pH correction is performed.
In our samples, some change in the dimensional distributions could be observed in Figure 1c, such as the diminution of large particle frequency (over 20 nm diameter) when passing from GC to GGL, and this could be related to deprotonation stimulation by light exposure in relation to pH increasing. At the same time, some associations of gold particles revealed by the analysis of DF images (Figure 3b) have been attributed by other authors [26] to the role of free deprotonated citrate, detached from the surface of already formed AuNPs, which acts as an electrolyte and favors the formation of dimers and multimers in colloidal gold suspensions. The underlying mechanism could be based on phenomena described previously [19] regarding the photomodification of AuNPs irradiated at the plasmonic resonance wavelength. Upon LSPR excitation, the photonic energy absorbed by the nanoparticle can induce hotspot electron transfers to the surface, which can weaken the coordination bonds of the citrate carboxylate groups with the gold surface.
Thus, it could be said that exposure to green light led to the release of some citrate groups from the AuNP surface in the irradiated suspension, which further determined the formation of dimers, and the DF microscopy results confirm this by the twofold higher intensity of the plasmonic profile (Figure 3a) compared to the unassociated monomers (Figure 3a).
The decrease in the mean diameter in TEM distribution as well as the increase in the spectral band intensity for GGL suspension compared to GC one reflects the redistribution of the population of individual particles due to the continuation of nucleation under the action of light, with the generation of mostly small particles, while some other particles experienced dimerization (evidenced by dark-field microscopy) and highlighted by DLS results.
We can suppose that irradiation can support the continuation of the nucleation process, after the completion of the thermal synthesis, when the reduction in Au3+ ions with citrate can be considered theoretically complete for the reaction parameters used (30 min at 101 °C, citrate/Au molar ratio of 3.5). However, traces of incompletely reduced gold or citrate ions may persist, especially during the rapid cooling phase [19], conferring the dynamic equilibrium character of the reaction environment. The increase in LSPR band intensity observed in the GGL sample compared to GC can be interpreted as a continuation of nucleation under light impact, due to photochemical reactions of these residual species. However, this interpretation is indirect, not being directly validated by a method for dosing residual gold ions (e.g., inductively coupled plasma mass spectrometry, ICP-MS).
The partial release of citrate from the AuNP surface under the action of light allows the particles to approach each other and form dimers; free citrate in solution contributes additionally to the electrostatic stabilization of the collective system, including already formed dimers.
A higher polydispersity index, PDI = 0.604, for GC sample with a mean value of approximately 66 nm, compared to PDI = 0.505 for GGL sample with a mean value of approximately 61 nm, together with a smaller standard deviation of the hydrodynamic size for GC (0.12 nm) than for GGL (0.24 nm—reflecting the contribution of the minority dimer subpopulation ~1000 nm), may be related to the fact that standard deviation is an absolute measure while PDI is a relative measure of dispersion, the results depending on instrument settings for acquisition or averaging time of the measurement, and this may come into play generating the counterintuitive result.
Regarding the cyclic voltammetry results, we need to mention that the oxide film, which is formed in the positive scan, is not readily reduced in the reverse scan as seen by the smaller reduction peak (Figure 6). The smaller reduction peak observed for GGL compared to GC suggests that the oxide layer formed on irradiated nanoparticles exhibits modified reduction kinetics—likely due to a more disordered or hydrated oxide structure—rather than simply a thicker layer. A systematic scan-rate analysis would be required to quantify the oxide charge and confirm this interpretation [19]. Figure 6b illustrates the typical cyclic voltammetry curves for different amounts of GGL adsorbed on the electrode surface, and evaluated in sulfuric acid, but scanning the potential over a shorter range. Similar to Figure 6a, the two oxidation peaks are present, and the height of the peak increases with the amount of GGL. The position of peaks is slightly shifted to a more positive value, as expected for a larger amount of nanoparticles that require a higher potential for oxidation (regarded as the driving force for electronic transfer). For the irradiated GGL sample, the anodic current increases steeply starting from approximately +0.85 V—a positive shift of ~80 mV relative to GC—suggesting that the oxidation of gold surface atoms requires a higher overpotential after irradiation, consistent with a modified surface layer induced by light exposure. At equal deposited volumes (3 µL), GGL shows reduced electrochemical surface area compared to GC, reflecting restructuring of the adsorbed citrate layer and partial surface oxidation. This does not imply lower biological activity, but rather a different electrochemical profile.
Regarding the cathodic peak, the less pronounced reduction signal observed for GGL compared to GC may reflect altered reduction kinetics of the surface oxide layer rather than a thinner oxide—a more hydrated or disordered oxide formed under irradiation conditions may be reduced at a slightly different potential and with a broader current distribution [25]. A systematic scan-rate dependent analysis would be needed to quantify the oxide charge and confirm this interpretation, and is proposed as a direction for future work.
The chemisorbed gold oxide species identified by cyclic voltammetry may be relevant to the surface reactivity of AuNPs in biological environments; however, their potential role in photocatalytic processes was not directly assessed in the present study and remains a hypothesis for further investigation.
The interpretation of biological test results was focused on two aspects: the influence of AuNP concentration on the fungus growth and the influence of the green light exposure on the fungal cultures when supplied with the same concentrations of nanoparticle suspension.
The way in which the increase in AuNPs concentration influences biomass growth is qualitatively the same for low and medium doses for both types of nanoparticles used (Figure 9 and Figure 10). But at relatively high doses, particles irradiated in green light give an obvious stimulatory influence compared to those not irradiated at the same concentrations, especially at 1000 µL/L.
We also consider that the differences between the mean values of the growth zone size in control samples and samples fed with gold nanoparticles are affected in some cases by relatively large standard deviations (mean standard deviations of 8–9%), as reflected also by the corresponding box-plot sizes, most likely due to an uncontrollable variability of biological parameters in live cell cultures, which is not uncommon in biological experiments.
It seems that we are in a situation where, while relatively low concentrations of AuNPs disrupt cell homeostasis and therefore the growth of the studied cultures, at higher concentrations, growth seems not to be disrupted or even stimulated (Figure 11). Thus, it can be assumed that, for AuNPs loaded at relatively high concentrations, cells can more easily counteract the nanoparticles through a spatial effect of their grouped capture and the reduction in the reactive surface effect with the reduction in the total surface of the aggregates created. It may be hypothesized that, at high concentrations, the tendency of GGL nanoparticles to form dimers could reduce their effective reactive surface area, potentially limiting the generation of reactive oxygen species (ROS) and thus exerting less inhibitory effect on fungal growth. However, ROS levels were not measured in the present study, and this interpretation remains speculative.
However, it is possible that non-irradiated gold nanoparticles have smaller negative influences on the active site of the enzyme than irradiated ones in the case of relatively high concentrations (1000 µL/L).
Additional tests and analyses related to antioxidant enzymes could allow a more detailed understanding of cellular processes in the presence of gold-related stress factors—this should be the subject of our next investigative studies on C. globosum, a fungal species that has demonstrated a great capacity to adapt to external environmental stress, exploring every opportunity for proliferation.
Thus, the interpretation of the effect of the highest concentration of irradiated AuNPs tested in this study (1000 µL/L) takes into account both the possible complex influence of gold nanoparticles on different metabolic activities of the cell, such as phosphate secretion, and the possible improvement of the antioxidant system.


5. Conclusions

Gold nanoparticles were synthesized using sodium citrate in the presence of sodium hydroxide. A second batch was produced via photochemical synthesis by irradiating the first product. Both batches formed small colloidal particles (the physical diameter obtained by TEM, and the hydrodynamic diameter given by DLS) and exhibited distinct plasmonic properties. The Zeta potential is negative in both samples, leading to the electrostatic stability of the colloidal suspensions. Cyclic voltammetry indicated the formation of gold oxide on the surface of nanoparticles exposed to green light, which could influence the reactivity needed for AuNP biomedical or environmental applications.
Microbiological tests focused on the growth of cellulolytic fungal cultures revealed certain differences in the effect of adding AuNPs to the culture medium for pure particles and those exposed to green light on fungal growth, especially for relatively high concentrations of irradiated nanoparticles, such as 1000 µL/L, which induced higher growth than non-irradiated AuNPs. These indicate a relative biocompatibility with beneficial fungi in the biosphere and rather suggest possible biotechnological applications related to the stimulation of fungal growth for the controlled degradation of cellulosic residues of natural or anthropogenic origin.

Author Contributions

Conceptualization, D.A.P., L.O. and D.C.; methodology, S.G. and D.A.P.; software, L.U. and S.P.; validation, D.C., S.G. and E.O.; formal analysis, F.D. and A.A.; investigation, S.P., E.O., A.A., L.U., G.V. and L.O.; resources, A.A., F.D., G.V. and L.O.; data curation, F.D. and D.A.P.; writing—original draft preparation, D.A.P., L.O., G.V. and D.C.; writing—review and editing, D.A.P., S.G. and L.O.; visualization, D.A.P., E.O. and S.P.; supervision, S.G., D.A.P. and D.C.; project administration, S.G.; funding acquisition, L.U. and S.G. All authors have read and agreed to the published version of the manuscript.

Funding

This research received no external funding.

Institutional Review Board Statement

Not applicable.

Informed Consent Statement

Not applicable.

Data Availability Statement

The original contributions presented in this study are included in the article. Further inquiries can be directed to the corresponding authors.

Conflicts of Interest

The authors declare no conflicts of interest.

References

  1. Cecotka, M.; Radomski, P.; Ziółkowski, P.; Tymińska, A.; Czerwiec, K.; Zielinski, J.; Dong, Y.; Rosnner, C.; Petronella, F.; Narajczyk, M.; et al. Laser irradiation of human skin tissue after gold nanoparticles injection for thermal ablation processes—A combined experimental and numerical approach. Sci. Rep. 2025, 15, 34422. [Google Scholar] [CrossRef]
  2. Shukla, N.; Das, R.; Rodriguez, C.Y.C.; Mukhanova, E.; Soldatov, A.; Bathla, A.; Belbekhouche, S. Optimizing near-infrared-activated gold nanostructures for targeted combination cancer therapy. Colloids Surf. B 2025, 253, 114687. [Google Scholar] [CrossRef]
  3. Chadwick, J.S.; Salah, D.; Livesey, P.M.; Brust, M.; Volk, M. Singlet oxygen generation by laser irradiation of gold nanoparticles. J. Phys. Chem. C. 2016, 120, 10647–10657. [Google Scholar] [CrossRef]
  4. Rau, L.R.; Huang, W.Y.; Liaw, J.W.; Tsai, S.W. Photothermal effects of laser-activated surface plasmonic gold nanoparticles on the apoptosis and osteogenesis of osteoblast-like cells. Int. J. Nanomed. 2016, 11, 3461–3473. [Google Scholar] [CrossRef]
  5. Ferreira, D.; Fernandes, A.R.; Baptista, P.V. Mild hyperthermia via gold nanoparticles and visible light irradiation for enhanced siRNA and ASO delivery in 2D and 3D tumour spheroids. Cancer Nano 2024, 15, 19. [Google Scholar] [CrossRef]
  6. Sekhar, M.R.; Laha, R.; Kar, M. Tuning optical and optoelectronic properties of gold nanoparticle and ZnO thin film hetero-structures. Nano Express 2020, 1, 030037. [Google Scholar] [CrossRef]
  7. Huang, H.J.; Wu, J.C.S.; Chiang, H.P.; Chou Chau, Y.F.; Lin, Y.S.; Wang, Y.H.; Chen, P.J. Review of experimental setups for plasmonic photocatalytic reactions. Catalysts 2020, 10, 46. [Google Scholar] [CrossRef]
  8. Leong, K.H.; Aziz, A.A.; Sim, L.C.; Saravanan, P.; Jang, M.; Bahnemann, D. Mechanistic insights into plasmonic photocatalysts in utilizing visible light. Beilstein J. Nanotechnol. 2018, 9, 628–648. [Google Scholar] [CrossRef]
  9. Yoo, S.; Nam, D.H.; Signh, T.I.; Leem, G.; Lee, S. Effect of reducing agents on the synthesis of anisotropic gold nanoparticles. Nano Converg. 2022, 9, 5. [Google Scholar] [CrossRef]
  10. Saed, M.; Ayivi, R.D.; Wei, J.; Obare, S.O. Gold nanoparticles antibacterial activity: Does the surface matter? Colloid Interface Sci. Commun. 2024, 62, 100804. [Google Scholar] [CrossRef]
  11. Lotfali, E.; Toreyhi, H.; Makhdoomi Sharabiani, K.; Fattahi, A.; Soheili, A.; Ghasemi, R.; Keymaram, M.; Rezaee, Y.; Iranpanah, S. Comparison of antifungal properties of gold, silver, and selenium nanoparticles against amphotericin b-resistant Candida glabrata clinical isolates. Avicenna J. Med. Biotechnol. 2021, 13, 47–50. [Google Scholar] [CrossRef] [PubMed]
  12. Kadhum, F.J.; Aziz, S.A.; Sulaiman, H.T. Synthesis of gold nanoparticles by electrolysis and their antifungal effects. J. Phys. Conf. Ser. 2025, 2974, 012023. [Google Scholar] [CrossRef]
  13. Almansob, A.; Bahkali, A.H.; Ameen, F. Efficacy of gold nanoparticles against drug-resistant nosocomial fungal pathogens and their extracellular enzymes: Resistance profiling towards established antifungal agents. Nanomaterials 2022, 12, 814. [Google Scholar] [CrossRef]
  14. Mishra, P.; Ray, S.; Sinha, S.; Das, B.; Khan, M.I.; Behera, S.K.; Soon-Il, Y.; Tripathy, S.K.; Mishra, A. Facile bio-synthesis of gold nanoparticles by using extract of Hibiscus sabdariffa and evaluation of its cytotoxicity against U87 glioblastoma cells under hyperglycemic condition. Biochem. Eng. J. 2016, 105, 264–272. [Google Scholar] [CrossRef]
  15. Manoliu, A.L.; Olteanu, Z.; Oprica, L.; Zamfirache, M.M.; Creanga, D. Petroleum ferrofluid influence on cellulase specific activity in Chaetomium globosum. Roum. Biotechnol. Lett. 2002, 7, 737–744. [Google Scholar]
  16. Andries, M.; Pricop, D.; Oprica, L.; Creanga, D.-E.; Iacomi, F. The Effect of Visible Light on Gold Nanoparticles and Some Bioeffects on Environmental Fungi. Int. J. Pharm. 2016, 505, 255–261. [Google Scholar] [CrossRef] [PubMed]
  17. Mbae, J.; Mugo, W.; Mbiyu, N. Determination of gold nanoparticle sizes from their plasmon resonance within the optical spectrum. J. Agric. Sci. Technol. 2023, 22, 83–90. [Google Scholar] [CrossRef]
  18. du Toit, H.; Macdonald, T.J.; Huang, H.; Parkinb, I.P.; Gavriilidis, A. Continuous flow synthesis of citrate capped gold nanoparticles using UV induced nucleation. RSC Adv. 2017, 7, 9632–9638. [Google Scholar] [CrossRef]
  19. Lupusoru, R.V.; Pricop, D.A.; Uritu, C.M.; Arvinte, A.; Coroaba, A.; Esanu, I.; Zaltariov, M.F.; Silion, M.; Stefanescu, C.; Pinteala, M. Effect of TAT-DOX-PEG Irradiated Gold Nanoparticles Conjugates on Human Osteosarcoma Cells. Sci. Rep. 2020, 10, 6591. [Google Scholar] [CrossRef]
  20. Wu, X.; Thrall, E.S.; Liu, H.; Steigerwald, M.; Brus, L. Plasmon induced photovoltage and charge separation in citrate-stabilized gold nanoparticle. J. Phys. Chem. C 2010, 114, 12896–12899. [Google Scholar] [CrossRef]
  21. Zhang, W.; Bas, A.D.; Ghali, E.; Choi, Y. Passive behavior of gold in sulfuric acid medium. Trans. Nonferrous Met. Soc. 2015, 25, 2037–2046. [Google Scholar] [CrossRef]
  22. Dong, J.; Carpinone, P.L.; Pyrgiotakis, G.; Demokritou, P.; Moudgil, B.M. Synthesis of precision gold nanoparticles using Turkevich method. KONA Powder Part. J. 2020, 37, 224–232. [Google Scholar] [CrossRef] [PubMed]
  23. Duman, H.; Akdaşçi, E.; Eker, F.; Bechelany, M.; Karav, S. Gold nanoparticles: Multifunctional properties, synthesis, and future prospects. Nanomaterials 2024, 14, 1805. [Google Scholar] [CrossRef] [PubMed]
  24. Ojea-Jimenez, I.; Romero, F.M.; Bastus, N.G.; Puntes, V. Small gold nanoparticles synthesized with sodium citrate and heavy water: Insights into the reaction mechanism. J. Phys. Chem. C 2010, 114, 1800–1804. [Google Scholar] [CrossRef]
  25. Munro, C.H.; Smith, W.E.; Garner, M.; Clarkson, J.; White, P.C. Characterization of the surface of a citrate-reduced colloid optimized for use as a substrate for surface-enhanced resonance Raman scattering. Langmuir 1995, 11, 3712–3720. [Google Scholar] [CrossRef]
  26. Kumar, S.; Gandhi, K.S.; Kumar, R. Modeling of formation of gold nanoparticles by citrate method. Ind. Eng. Chem. Res. 2007, 46, 3128–3136. [Google Scholar] [CrossRef]
Figure 1. TEM images for: (a) GC samples; (b) GGL samples; (c) size distributions with Gaussian fitting curves in red lines.
Coatings 16 00657 g001
Figure 2. The characteristic spectral bands of GC (black line) and GGL (green line) samples.
Coatings 16 00657 g002
Figure 3. Dark-Field image and square-marked spots with plasmonic intensity profile: (a) for GC sample corresponding to non-irradiated citrate–gold nanoparticles; (b) for GGL sample of green light exposed citrate–gold nanoparticles (NIS Elements 3.2 software provided 3D and 2D views of AuNPs in the selected square spots).
Coatings 16 00657 g003
Figure 4. Dimensional histograms of the hydrodynamic diameter for: (a) GC sample; (b) GGL samples. Lin-log representations.
Coatings 16 00657 g004
Figure 5. Zeta potential in the studied suspensions of AuNPs: (a) GC sample; (b) GGL sample.
Coatings 16 00657 g005
Figure 6. (a) Cyclic voltammograms of GC (black line) and GGL (dark green line) sweeping the potential for 3 µL AuNP sample deposited onto electrodes (in 0.05 M H2SO4); (b) cyclic voltammograms of different amounts of GGL sample adsorbed on electrodes (3 µL, black line and 9 µL, light green line) in 0.05 M H2SO4.
Coatings 16 00657 g006
Figure 7. Two sets of Petri dishes with fungal cultures grown with GC sample in concentrations of 0–200–400–600–800–1000 µL/L after 72 h of incubation are shown. (a) For the first GC sample set with non-irradiated AuNPs, the notation on the dishes was M1; (b) For the second GC sample set with non-irradiated AuNPs, the notation on the dishes was M2.
Coatings 16 00657 g007
Figure 8. Two sets of Petri dishes with fungal cultures grown with GGL sample in concentrations of 0–200–400–600–800–1000 µL/L are shown, after 72 h of incubation. (a) For the first set of GGL samples, with AuNPs exposed to green light, the notation on the dishes was P1; (b) For second set of GGL samples, with AuNPs exposed to green light, the notation on the dishes was P2.
Coatings 16 00657 g008
Figure 9. Average values of the diameter of the central translucent zones in Petri dishes with fungal cultures grown with non-irradiated AuNPs (GC); (average standard deviation of 8%). * represents a statistically significant difference compared to the sample without AuNPs (p < 0.05 according to the one-way ANOVA test).
Coatings 16 00657 g009
Figure 10. Average values of the diameter of the central translucent zones in Petri dishes with fungal cultures grown in the presence of green light irradiated AuNPs (GGL); (average standard deviation of 9%). * represents a statistically significant difference compared to the sample without AuNPs (p < 0.05 according to the one-way ANOVA test).
Coatings 16 00657 g010
Figure 11. Comparison of the influences on the fungal growth of pristine AuNPs (GC) and irradiated AuNPs (GGL). Box-plot representation.* stands for statistical significance according to the ANOVA one-way test. (a) At 24 h; (b) At 48 h; (c) At 72 h.
Coatings 16 00657 g011
Table 1. Evaluation of hydrodynamic size and Zeta potential.
SampleHydrodynamic Dimension (nm)Polydispersity IndexZeta Potential (mV)
GC66.20.6045−26.09
GGL61.50.5058−26.93
Disclaimer/Publisher’s Note: The statements, opinions and data contained in all publications are solely those of the individual author(s) and contributor(s) and not of MDPI and/or the editor(s). MDPI and/or the editor(s) disclaim responsibility for any injury to people or property resulting from any ideas, methods, instructions or products referred to in the content.