Article

Simulation Study on Contact Stress at Copper Busbar Surface Microstructures and Polymer Interfaces

1
School of Intelligent Manufacturing, Anhui University of Science and Technology Engineering, Chuzhou 239000, China
2
School of Materials Science and Engineering, Nanjing University of Information Science and Technology, Nanjing 210000, China
3
Huangyu Precision Technology (Suzhou) Co., Ltd., Nanjing 210000, China
*
Author to whom correspondence should be addressed.
Coatings 2026, 16(6), 638; https://doi.org/10.3390/coatings16060638
Submission received: 18 April 2026 / Revised: 15 May 2026 / Accepted: 18 May 2026 / Published: 25 May 2026

Highlights

What are the main findings?
  • Arc and trapezoidal microstructures reduce Cu-polymer interfacial contact stress by up to 20% (PPS > PP).
  • The arc-shaped surface outperforms the trapezoidal surface, lowering PP valley stress by 10.9% (0.679 → 0.605 MPa).
  • Optimal parameters: arc width 1.0 mm/depth 0.8 mm; trapezoidal base 2.0 mm/height 1.2 mm.
  • RSM confirms high model significance (p < 0.0001, R2 > 0.98) and simulation reliability.
What are the implications of the main findings?
  • The findings provide design guidelines for metal–polymer interfaces in high-voltage connectors.
  • They enable stress reduction via microstructure optimization without changing materials.
  • They establish a simulation-RSM validation method to enhance simulation trustworthiness.
  • They support reliability improvement of insulation coatings for EV copper busbars.

Abstract

Copper busbar inserts are critical components of high-voltage connectors in new energy vehicles. The interfacial contact stress between the insert and the polymer directly affects the sealing reliability and service life of the connector. To address the interfacial stress concentration caused by the mismatch in thermal expansion coefficients between metal and polymer, this study employs COMSOL Multiphysics 6.2 simulations to investigate the regulation laws of arc-shaped and trapezoidal microstructures on the interfacial stress of copper–polyphenylene sulfide (PPS)/polypropylene (PP). The response surface methodology (RSM) is introduced to verify simulation reliability and optimize parameters. The simulation results indicate that both structures can effectively reduce interfacial stress, and the stress exhibits a significant nonlinear relationship with the structural parameters. Due to its high temperature resistance and polar thioether bond, PPS demonstrates better interfacial compatibility than PP. Under the same structural position, the maximum stress reduction exceeds 20% (from 0.689 MPa to 0.539 MPa). Moreover, the arc-shaped structure is more effective in alleviating stress concentration than the trapezoidal structure. At the same position, compared to the trapezoidal surface, the arc-shaped surface reduces the valley contact stress of PPS from 0.527 MPa to 0.5 MPa (a decrease of 5.12%) and that of PP from 0.679 MPa to 0.605 MPa (a decrease of 10.9%). The optimal parameters are as follows: an arc-shaped radius width of 1.0 mm, a depth of 0.8 mm; a trapezoidal bottom base of 2.0 mm, a height of 1.2 mm. This study provides a basis for the interface design of metal–polymer composite components and holds significant engineering value for the reliability optimization of high-voltage connectors.

1. Introduction

The reliability of high-voltage connectors in new energy vehicles directly determines the safe and stable operation of the electrical system. The interfacial sealing performance between the copper busbar insert and the polymer material is a key factor affecting the connector’s service life. As the core signal transmission component, this performance matters greatly [1,2,3]. Copper and polymers like polyphenylene sulfide (PPS) and polypropylene (PP) have very different thermal expansion coefficients. This difference causes internal stress concentration at the interface during injection molding. Such stress can lead to deformation, micro-cracks, or even debonding. These defects severely weaken the sealing performance of the connector [4,5]. Therefore, it remains a core technical challenge to regulate copper–polymer interfacial contact stress and enhance interfacial bonding strength in new energy vehicle connector design.
Surface micro-structural design is a pivotal approach for enhancing the interfacial bonding performance of metal–polymer hybrids. In particular, arc-shaped and trapezoidal geometric features have emerged as research focal points due to their superior capabilities in establishing robust mechanical interlocking mechanisms and expanding the effective contact area [6,7]. Smith et al. [8] demonstrated through macroscopic experiments that microstructures possess the potential to modulate and reduce interfacial contact stress; however, their study did not delve into the quantitative optimization of micro-scale geometric parameters. A review by Huang Q et al. [9] further emphasized that enhancements in interfacial performance are not dictated by a single variable but rather depend on the synergistic effects among various structural parameters, including spacing, shape, and arrangement. Furthermore, studies by Xiao Feng [10] and Xu [11] revealed the non-linear relationship between arc dimensions and interfacial strength, as well as the advantages of arc-shaped structures in achieving stress homogenization. However, current research predominantly focuses on the influence of individual structural parameters, while systematic analyses of the synergistic effects of critical parameters—such as width, depth, and height—under complex operating conditions remain scarce. Moreover, due to a lack of statistical rigor, existing simulation results often rely on isolated experimental validations, making them difficult to directly apply to complex engineering practices [12].
The intrinsic properties of the polymer matrix are equally critical for interfacial stress distribution and service reliability. Polyphenylene sulfide (PPS), a high-performance engineering thermoplastic, exhibits superior interfacial bonding potential compared to general-purpose plastics like polypropylene (PP). This superiority is attributed to its exceptional thermal stability, the strong affinity induced by polar thioether bonds, and a Coefficient of Thermal Expansion (CTE) that is better matched with metal substrates [13]. Nevertheless, the existing literature remains limited in quantitatively revealing the profound interaction logic between material constitutive properties and micro-geometric parameters when addressing interfacial behavior under coupled electric–thermal–mechanical fields [14,15,16,17].
In view of this, the present study establishes a finite element model based on electric-thermal–mechanical multi-physics coupling to systematically investigate the regulation mechanisms of metal–polymer interfacial microstructures. The core objective of this work is to quantitatively reveal the evolution of interfacial contact stress as a function of micro-geometric parameters. The research scope encompasses the characteristic dimension space of arc-shaped structures (width x1: 0.05–1.0 mm, depth x2: 0.1–1.0 mm) and trapezoidal structures (bottom base y1: 0.1–2.0 mm, height y2: 0.2–1.5 mm). To overcome the limitations of traditional simulation validation, a statistically significant evaluation framework was constructed using the response surface methodology (RSM) to capture the non-linear interaction effects among parameters under multi-field coupling [18,19,20]. Furthermore, the physical essence of these phenomena is elucidated from the perspectives of CTE mismatch and interfacial constraint effects. This research framework not only provides a rigorous pathway for evaluating metal–polymer interfacial integrity but also offers quantifiable theoretical guidance for the reliability design of critical components, such as high-voltage connectors in new energy vehicles (NEVs).

2. Materials and Methods

2.1. Physical Model Establishment

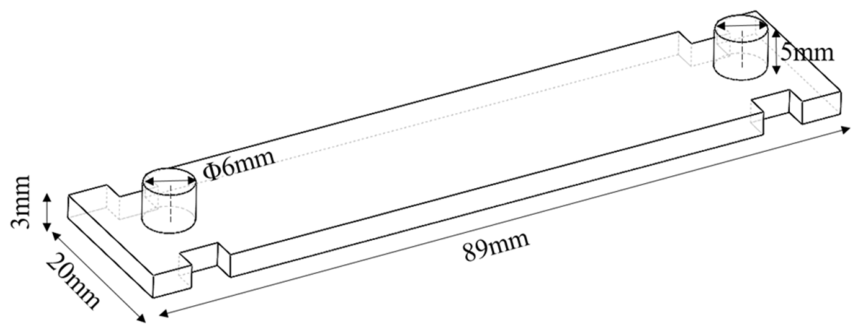
The finite element analysis (FEA) in this study was performed using COMSOL Multiphysics software version 6.2. A rectangular thin-walled cavity model was constructed to simulate the injection molding process. The cavity dimensions were 89 mm × 20 mm × 3 mm. The inlet and outlet were symmetrical arc-shaped runners with a diameter of 6 mm and a length of 5 mm to ensure balanced melt filling. These dimensions cover the typical range of lightweight interior parts in new energy vehicles (Figure 1).
In this simulation, a three-dimensional fluid flow model was adopted. By solving the mass, momentum, and energy conservation equations, the distributions of fluid velocity, fluid volume fraction, and interfacial stress in time and space coordinates were obtained. The continuity equation for the fluid at a given position per unit time is as follows:
ρ t + ( ρ V ) = 0
where ρ is the fluid density (kg·m−3), V is the velocity vector (m·s−1), and t is time (s). The momentum conservation equation is as follows:
ρ ( V t + V · V ) = - p + · τ
where p is the static pressure (MPa), and τ is the viscous stress tensor (Pa). For the non-Newtonian fluid, the power-law model proposed by Khor et al. [21] was used for shear viscosity:
μ = A γ · B 1 e [ C ( T T 0 ) ]
where μ is the shear viscosity (Pa·s), A is the consistency index (Pa·s), γ is the shear rate (s−1), B is the power-law index, C is the temperature sensitivity coefficient (K), T is the absolute temperature (K), and T0 is the reference temperature (K). The energy conservation equation is as follows:
ρ c p ( T t + V · V ) = · ( k T ) + φ
where cp is the specific heat capacity at constant pressure (J·kg−1·K−1), k is the thermal conductivity (W·m−1·K−1), and φ is the viscous dissipation term (W·m−3).
( ρ a f a ) t + · ( ρ a f b V ) = 0
where f a is the polymer volume fraction, ρ a is the polymer density (kg·m−3), and f b is the air volume fraction.

2.2. Material Properties

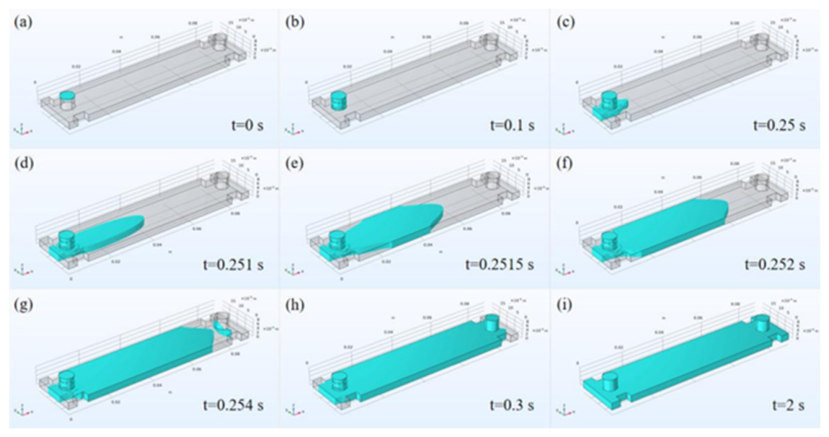
Two polymer materials, PPS and PP, were selected. The density of the copper busbar was 8960 kg·m−3, thermal conductivity was 401 W·m−1·K−1, and the thermal expansion coefficient was 16.5 × 10⁻⁶ K−1. The boundary conditions were set as follows: the melt inlet temperature was 280–320 °C; a step-function-driven velocity boundary (0 → 0.1 m/s) was applied at the inlet, equivalent to an injection pressure of 80–120 MPa; a back pressure of 0.5 MPa was applied at the outlet to simulate mold exhaust resistance; and the copper surface-polymer interface adopted continuous heat flux and stress transmission conditions, with no-slip at the wall (Figure 2). The copper–polymer interface employed a penalty-based mechanical contact formulation with a no-slip condition to isolate geometric and bulk property effects. This approach enables a direct comparison of microstructural performance under thermal loading. Consequently, stress reductions are attributed to intrinsic thermo-mechanical constants rather than interfacial bonding energies, ensuring a consistent evaluation across different designs.

2.3. Design of Copper Surface Microstructures

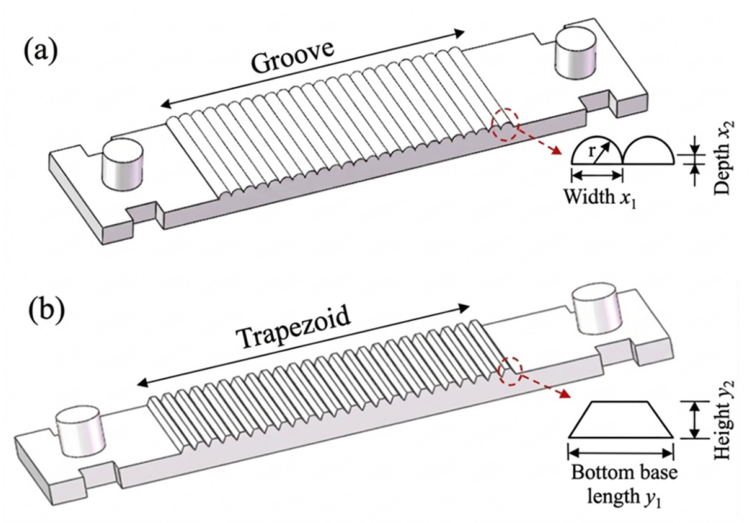
Two types of surface microstructures, arc-shaped and trapezoidal, were designed. The independent variables for the arc-shaped structure were width x1 (0.05–1.0 mm) and relative planar depth x2 (0.1–1.0 mm). The independent variables for the trapezoidal structure were bottom base length y1 (0.1–2.0 mm) and height y2 (0.2–1.5 mm). The arc-shaped structure adopted closely packed semi-arc-shaped features, while the trapezoidal structure had a fixed flank angle of 60° to ensure symmetry and manufacturability (Figure 3). To ensure the accuracy and numerical convergence of the simulation, a mesh independence study was conducted. Four different mesh refinement levels—coarse, normal, fine, and extremely fine—were tested for the arc-shaped microstructure model. The maximum interfacial contact stress was selected as the convergence criterion. As the element count increased from 296,582 to 530,779, the relative change in the peak stress value stabilized below 0.5%, confirming that the ‘fine’ mesh density used in this study provides a robust balance between computational efficiency and numerical precision. All subsequent simulations were performed using this validated mesh configuration.

2.4. Response Surface Experimental Design

The Box–Behnken design (BBD) was used to construct the response surface model [22], with the interfacial contact stress σ (MPa) as the response value. Experimental designs were carried out for the arc-shaped structure and the trapezoidal structure.
Through analysis of the design variables, two structural parameters (arc width and arc depth) were identified as input variables for the experimental design, denoted as x1 and x2. A Box–Behnken experimental design scheme was adopted, dividing the two input factors into three levels for analysis. The specific experimental factors and corresponding level designs are shown in Table 1. The BBD experiment for the arc-shaped structure included 3 center points, totaling 13 experimental points. Similarly, the trapezoidal structure included 3 center points, totaling 13 experimental points. The response values at each experimental point were obtained through COMSOL simulation. The general form of the quadratic regression model for the response surface is as follows:
σ = β 0 + i = 1 n β i x i + i = 1 n β i i x i 2 + 1 i j n β i j x i x j = ε
where β0 is the constant term; β_i, β_{ii}, and β_{ij} are the coefficients of the linear, quadratic, and interaction terms, respectively; n is the number of independent variables; and ε is the random error. Model fitting and analysis of variance (ANOVA) were performed using Design-Expert software to test the significance and goodness of fit of the model [23].
Through the screening and analysis of design variables, two critical geometric parameters were determined as the input variables for the experimental design in each group. Specifically, arc width and arc depth were selected for the first group and labeled as x1 and x2, respectively; for the other group, trapezoid base length and trapezoid height were designated as y1 and y2. A experimental scheme was implemented to analyze these input factors across three distinct levels. The specific experimental factors and their corresponding level arrangements are detailed in Table 2 and Table 3.

3. Results and Discussion

3.1. Influence of Arc-Shaped Structure on Interfacial Contact Stress

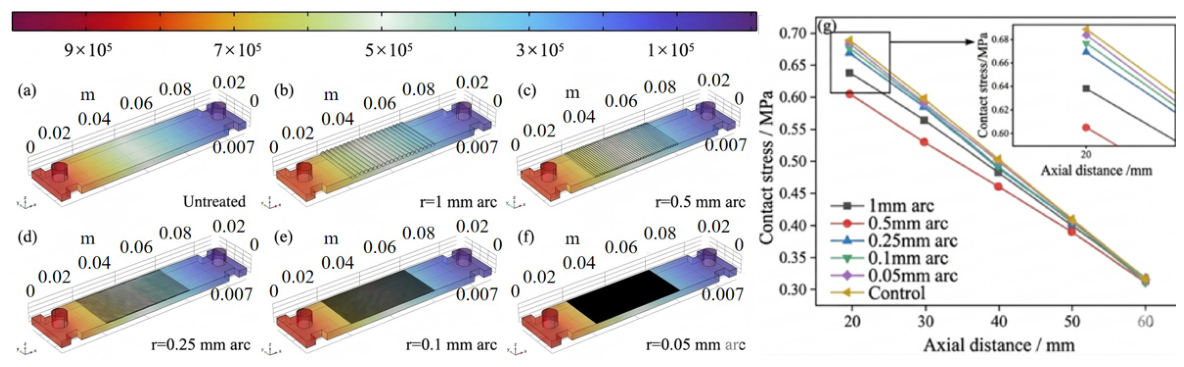
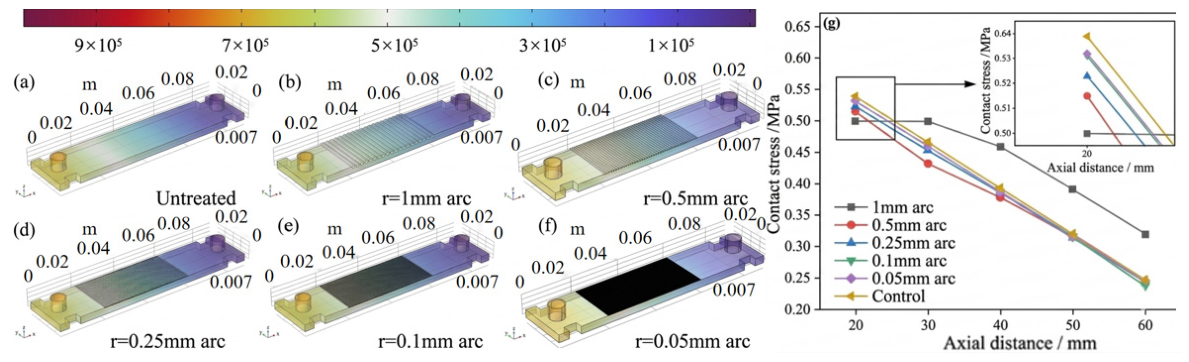
As shown in Figure 4 and Figure 5. The contact stress between the copper surface arc-shaped microstructure and the polymers (PP and PPS) reached a peak near the end at an axial distance of 20 mm and gradually decreased along the axial direction [24]. For the PP interface, the arc-shaped radius of 0.5 mm exhibited the lowest peak stress (0.605 MPa) (Figure 4). When the arc-shaped radius was further reduced to 0.05 mm, the peak stress significantly rebounded to 0.684 MPa due to enhanced stress concentration caused by local geometric mutations [25]. To eliminate the local failure caused by mesh size in finite element calculations, Mesh convergence tests confirmed that the stress rebound at a 0.05 mm arc radius is a genuine physical response rather than a numerical artifact. This extreme morphology induces a ‘notch effect’ during thermal cycling, hindering deformation relaxation and facilitating microcrack initiation. Consequently, excessive miniaturization heightens interfacial failure risks; an optimal size (e.g., 0.5 mm), and the stress decay gradient from the end to 60 mm was the gentlest, achieving a more uniform load distribution [26]. For PPS, influenced by its own mechanical properties, the overall stress level was relatively lower (Figure 4). PPS outperforms PP in stress reduction because its CTE is closer to copper’s. While PPS possesses a higher Young’s Modulus, the significantly reduced CTE mismatch mitigates differential strain, preventing severe stress accumulation at the copper–polymer interface [27]. Comprehensive comparison shows that a moderate microstructure size (e.g., 0.5 mm) effectively balances the suppression of peak stress at the end and the uniform axial diffusion of contact load, thereby significantly improving the contact mechanical state of the metal–polymer interface [28].

3.2. Influence of Trapezoidal Structure on Interfacial Contact Stress

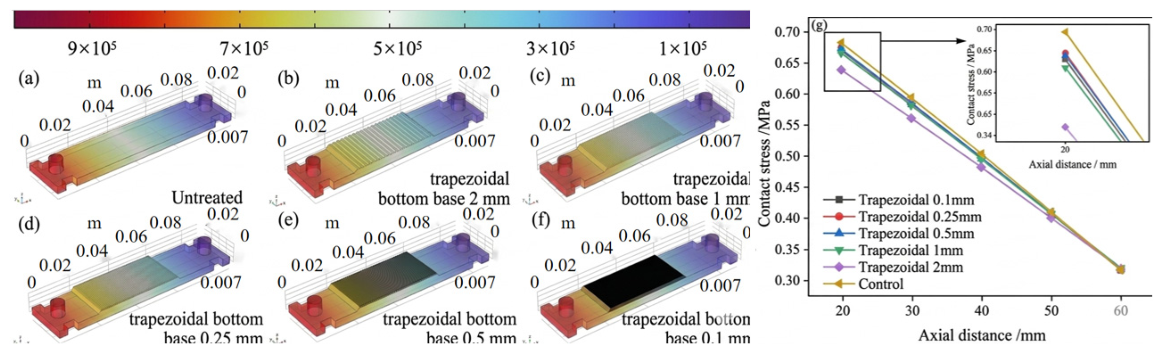
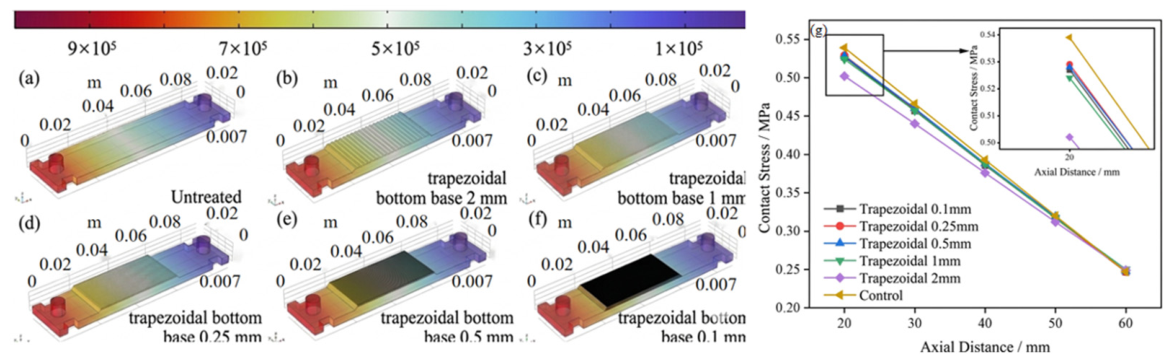
As shown in Figure 6 and Figure 7. To further investigate the influence of microstructure geometry on contact mechanical behavior, simulation data for trapezoidal microstructures (feature size and bottom base length ranging from 0.1 mm to 2 mm) were introduced and compared horizontally with the arc-shaped structure. The results show that the contact stress under the trapezoidal structure also peaked at the 20 mm end. Among them, the larger-size (2 mm) trapezoidal structure achieved a relatively lower peak stress (0.644 MPa for the PP interface; 0.502 MPa for the PPS interface). However, compared to the arc-shaped structure, the trapezoidal structure showed a clear disadvantage in suppressing local contact stress [29]. Taking PP as an example, the optimal 0.5 mm arc-shaped structure had a peak stress of only 0.605 MPa, which is about 6.1% lower than that of the optimal 2 mm trapezoidal structure (0.644 MPa). Similarly, in the PPS contact model, the optimal arc-shaped structure (1 mm, 0.500 MPa) not only had slightly better end stress control than the trapezoidal structure (0.502 MPa) but also achieved a lower level of stress dissipation at the 60 mm far end (0.244 MPa vs. 0.249 MPa for the trapezoidal structure) [30]. The above differences are mainly attributed to the intrinsic characteristics of the geometry. Compared with the inherent discontinuous geometric features (such as corner regions) of the trapezoidal structure, the continuous, smooth, curved surface of the arc-shaped microstructure can effectively suppress the edge effect at the contact interface, avoiding severe local stress concentration caused by abrupt morphological changes [31].

3.3. Response Surface Validation

Response Surface Model Construction

Based on the single-factor analysis in Section 3, it was found that the influence of single geometric parameters of the arc-shaped and trapezoidal microstructures on stress distribution exhibits significant nonlinear characteristics, and there may be interactions among the parameters. To further investigate the comprehensive influence of arc width x1, relative planar depth x2, trapezoidal bottom base length y1, and height y2 on contact stress, response surface methodology (RSM) was used to perform multiple regression fitting of the simulation results.
σ = β 0 + β 1 x 1 + β 2 x 2 + β 11 x 1 2 + β 22 x 2 2 + β 12 x 1 x 2
Y = β 0 + β 1 y 1 + β 2 y 2 + β 11 y 1 2 + β 22 y 2 2 + β 12 y 1 y 2
where σ and Y are the predicted contact stress values; β0 and γ0 are intercepts; β1, β2, γ1, γ2 are linear coefficients; β11, β22, γ11, γ22 are quadratic coefficients; and β12x1x2, β12y1y2 are interaction coefficients.
After completing the modeling and finite element simulation calculations for each set of experimental schemes, the interfacial contact stress σ values under the corresponding conditions were obtained, resulting in 26 sets of simulation results, as shown in Table 4.
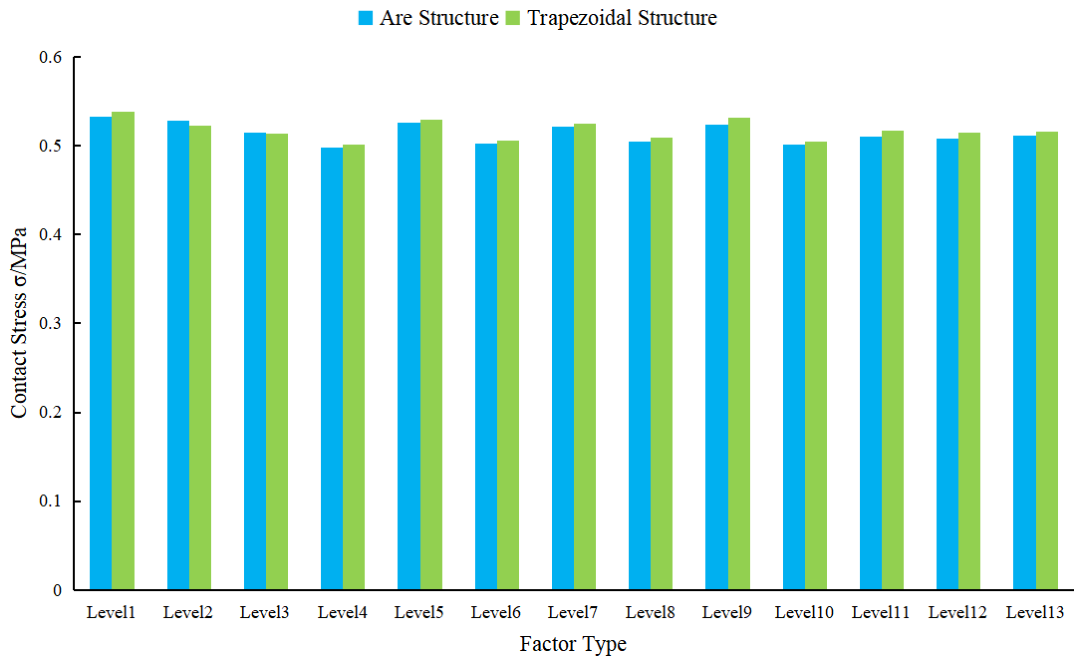
As shown in Figure 8. Through the BBD experimental design and COMSOL simulation to obtain response values, quadratic regression models for the arc-shaped and trapezoidal structures were fitted using Design-Expert software. The ANOVA results are shown in Table 4 and Table 5. For the arc-shaped structure (copper–PPS system), the model F-value was 68.32, and the p-value was <0.0001, indicating that the model is highly significant. The R2 = 0.9876 and adjusted R2 = 0.9752, indicating a good fit, explaining 97.52% of the variation in the response value. The p-values for the linear terms x1 and x2, as well as the quadratic terms x12 and x22, were all <0.05. The p-value for the interaction term x1x2 was 0.0231 (<0.05), indicating that the parameters and their interactions have significant effects on the response value.
For the trapezoidal structure (copper–PPS system), The results are shown in Table 6, the model F-value was 59.47, p-value < 0.0001, R2 = 0.9845, adjusted R2 = 0.9690, also showing good significance and fit. The p-values for the linear terms y1 and y2, as well as the quadratic terms y12 and y22, were all <0.05. The p-value for the interaction term y1y2 was 0.0315 (<0.05), verifying the importance of parameter interactions. The lack-of-fit p-values for both models were >0.05, indicating no significant lack of fit, and the models can be used for subsequent parameter optimization and simulation result validation.
When the arc depth x2 was fixed, the contact stress first decreased and then increased with increasing width x1, reaching a minimum near x1 = 1.0 mm. When x1 was fixed, the stress also showed a trend of first decreasing and then increasing with increasing x2, with the optimal depth being 0.8 mm. When the trapezoidal height y2 was fixed, the contact stress continuously decreased with increasing bottom base length y1, stabilizing at y1 = 2.0 mm. When y1 was fixed, the stress gradually decreased with increasing y2, with the optimal height being 1.2 mm.

3.4. Validation of Optimal Parameters

The optimal parameters for the arc-shaped structure obtained by solving the response surface model were x1 = 1.0 mm, x2 = 0.8 mm, with a predicted contact stress of 0.497 MPa. The optimal parameters for the trapezoidal structure were y1 = 2.0 mm, y2 = 1.2 mm, with a predicted contact stress of 0.500 MPa. The optimal parameters constitute a constrained engineering optimum. While larger dimensions might mathematically lower stress, they would unacceptably reduce the busbar’s cross-sectional area, compromising its vital electrical conductivity and mechanical integrity. To verify the accuracy of the model, three repeated simulation experiments were conducted. The average contact stress for the arc-shaped structure was 0.498 MPa, with a relative error of 0.20%. From a manufacturing perspective, the identified dimensions are well-suited for high-volume production via mechanical stamping, which offers superior scalability for copper busbars compared to laser texturing or chemical etching. The 0.20% error validates the exceptional mathematical fidelity of the RSM model in replicating simulation results. Furthermore, the consistency of the stress-reduction mechanisms ensures that the fundamental optimization trends remain robust against manufacturing tolerances, thereby securing the design’s reliability in practical service. The average contact stress for the trapezoidal structure was 0.501 MPa, with a relative error of 0.20%. Under cyclic thermal loading typical of EV operation, the interfacial fatigue resistance is primarily governed by the stress concentration at geometric transitions. The smooth arc microstructure offers superior fatigue potential compared to the 60° flank trapezoid by eliminating sharp corners that serve as crack initiation sites. While the trapezoid’s flanks create localized ‘notch effects’ that accelerate fatigue damage during repeated thermal expansion, the continuous curvature of the arc ensures a more uniform strain distribution. This reduction in peak local stress amplitude suggests that the arc-shaped design not only lowers static contact stress but also enhances the long-term structural integrity of the copper–polymer interface under real-world service conditions. This indicates that the response surface model has high prediction accuracy and can effectively verify the reliability of the simulation results.

4. Conclusions

In this study, a coupled framework combining COMSOL Multiphysics and response surface methodology (RSM) was employed to elucidate the thermomechanical regulation mechanisms of arc-shaped and trapezoidal microstructures on copper-PPS and copper-PP interfaces. By transitioning from macroscopic empirical observation to mechanistic optimization, the main conclusions are drawn as follows:
Our findings reveal that the copper–PPS system exhibits superior intrinsic thermomechanical compatibility, resulting in a reduction of more than 20% in peak interfacial stress compared to the PP matrix. This observed improvement is scientifically attributed to the enhanced dimensional stability and reduced expansion differential of PPS. Compared to PP, the lower CTE of PPS minimizes the displacement mismatch at the interface during thermal fluctuations, while its higher elastic modulus provides more robust structural resistance against thermal-induced deformation. Consequently, the synergy between PPS properties and the micro-textures effectively alleviates the interfacial “push-pull” effect during thermal cycles. This confirms the exceptional suitability of PPS for maintaining the long-term structural integrity of EV high-voltage busbar insulation, where mitigating thermal stress is critical for preventing debonding and ensuring electrical safety.
The high predictive accuracy of the RSM model (p < 0.0001, R2 > 0.98) confirms that the interfacial contact stress response is a statistically significant and highly predictable function of the synergistic geometric parameters. The identification of optimal dimensions, specifically an arc width of 1.0 mm with a depth of 0.8 mm and a trapezoidal base of 2.0 mm with a height of 1.2 mm, reveals a critical threshold for maximizing interfacial interlocking while minimizing internal stress. The 8.0% stress reduction achieved by the arc-shaped design outperforms the 7.6% reduction of the trapezoidal configuration, a superiority fundamentally rooted in the principle of geometric continuity. The smooth curvature of the arc-shaped surface ensures a uniform transmission of interfacial loads, thereby effectively mitigating the notch effects and localized stress concentrations typically induced by the abrupt geometric mutations at trapezoidal edges. From a mechanics-of-materials perspective, the angular transitions and sharp corners inherent in the trapezoid flanks act as geometric singularities. These sites facilitate the notch effect, leading to severe localized stress concentrations that serve as precursors for crack initiation. In contrast, the smooth, continuous curvature of the arc-shaped surface eliminates such abrupt geometric mutations. This continuity promotes a more uniform strain redistribution by allowing for a progressive rather than abrupt transition of thermal–mechanical loads across the interface. Consequently, the arc-shaped profile effectively dilutes localized stress peaks and enhances the overall robustness of the metal–polymer bond under coupled loading conditions.
The integrated simulation-RSM framework proposed in this study transcends traditional trial-and-error engineering. The scientific value of this approach lies in its ability to map the non-linear coupling between micro-geometric parameters and the constitutive behavior of high-performance polymers like PPS. Unlike conventional methods, the RSM-driven analysis elucidates how specific structural dimensions can be tuned to balance mechanical interlocking against the localized stresses induced by CTE mismatches. Consequently, this study offers critical theoretical guidelines for the reliability optimization of EV high-voltage connectors, providing a scalable pathway to suppress interfacial delamination and ensure long-term structural integrity in demanding thermal environments.

Author Contributions

Writing—original draft preparation, M.Z.; data curation, Y.W. and C.X.; writing—review and editing, F.H. and H.W. All authors have read and agreed to the published version of the manuscript.

Funding

This research received no external funding.

Institutional Review Board Statement

Not applicable.

Informed Consent Statement

Not applicable.

Data Availability Statement

Data are contained within the article.

Conflicts of Interest

Author Fei Hai was employed by the Huangyu Precision Technology (Suzhou) Co., Ltd., Suzhou, China. The remaining authors declare that the research was conducted in the absence of any commercial or financial relationships that could be construed as a potential conflict of interest.

References

  1. Florkowski, M. Challenges and Trends in High-Voltage Insulation of Electric Vehicle Devices. Energies 2026, 19, 526. [Google Scholar] [CrossRef]
  2. Xiong, B.; Wang, D.; Hao, S.; Wang, Z.; Zhang, C.; Huang, M.; Li, S.; Xiao, G. Opportunities, challenges and prospects of high-quality development of new energy driven by global energy transition. Acta Pet. Sin. 2026, 47, 74–94. [Google Scholar]
  3. Li, J.Y.; Xie, Z.Y.; Huang, Y.Y.; Ban, L.; Tan, W.; Lin, X.; Wu, S.; Liang, W. Fault diagnosis and precise troubleshooting of power battery system for new energy vehicles. Power Syst. Control 2026, 15, 71–80. [Google Scholar]
  4. Hua, S.; Li, H.; Liu, H. Viscoelastic modeling and mechanism analysis of unbalanced filling in geometrically balanced injection molds. J. Manuf. Process. 2026, 159, 409–428. [Google Scholar] [CrossRef]
  5. Belcadi, O.; Khalij, L.; Gautrelet, C.; Legrand, C.; Desilles, N.; El Minor, H.; Arrakhiz, F.E. Vibration-induced fatigue behavior and damage mechanisms of polypro-pylene-argan nut shell composites. Polym. Test. 2026, 151, 109110. [Google Scholar] [CrossRef]
  6. Liu, D.; Zhou, F.; Li, H.C.; Xin, Y.; Yi, Z. Study on the interfacial interactions and adhesion behaviors of various polymer-metal interfaces in nano molding. Polym. Eng. Sci. 2021, 61, 95–106. [Google Scholar]
  7. Chen, J.; Du, K.; Chen, X.; Li, Y.; Huang, J.; Wu, Y.; Yang, C.; Xia, X. Influence of surface microstructure on bonding strength of modified polypropylene/aluminum alloy direct adhesion. Appl. Surf. Sci. 2019, 489, 392–402. [Google Scholar] [CrossRef]
  8. Zhang, G.D.; Zhu, Q.; Liu, Y.Y.; Wang, C. Effect of surface microstructure on laser welding performance of aluminum alloy and PA66. Trans. China Weld. Inst. 2023, 44, 28–33. [Google Scholar]
  9. Huang, Q.; Shi, X.; Xue, Y.; Zhang, K.; Wu, C. Recent progress on surface texturing and solid lubricants in tribology: Designs, properties, and mechanisms. Mater. Today Commun. 2023, 35, 105854. [Google Scholar] [CrossRef]
  10. Hu, C.; Han, B.; Li, M.; Li, X.; Wang, L.; Liu, C.; Zhang, Q.; Duan, T.; Song, J.; Wang, X. Effect of micro-dimple textures on the tribological performance of CoCrFeNiMoW high-entropy alloy. Coatings 2025, 15, 132628. [Google Scholar]
  11. Xu, R.; Xie, Y.; Li, R.; Zhang, J.; Zhou, T. Direct bonding of polymer and metal with an ultrahigh strength: Laser treatment and mechanical interlocking. Adv. Eng. Mater. 2021, 23, 2001288. [Google Scholar] [CrossRef]
  12. Petroušek, P.; Kočiško, R.; Kasperkevičová, A.; Csík, D.; Džunda, R. Effect of Thermomechanical Processing on Porosity Evolution and Mechanical Properties of L-PBF AISI 316L Stainless Steel. Metals 2025, 15, 789. [Google Scholar] [CrossRef]
  13. Zhang, L.; Yin, Y.; Zheng, H.; Wang, W.; Zhu, S.; Zhao, S.; Yang, L. The MLS-based numerical manifold method for steady-state heat conduction in anisotropic flawed media. Int. J. Heat Mass Transf. 2026, 254, 127638. [Google Scholar] [CrossRef]
  14. Erfanian, M.R.; Anbarsooz, M.; Moghiman, M. A three dimensional simulation of a rubber curing process considering variable order of reaction. Appl. Math. Model. 2016, 40, 8592–8604. [Google Scholar] [CrossRef]
  15. Khor, C.Y.; Ariff, Z.M.; Ani, F.C.; Mujeebu, M.A.; Abdullah, M.; Abdullah, M.; Joseph, M. Three-dimensional numerical and experimental investigations on polymer rheology in meso-scale injection molding. Int. Commun. Heat Mass Transf. 2010, 37, 131–139. [Google Scholar] [CrossRef]
  16. Ghoreishy, M.H.R.; Naderi, G. Three-dimensional finite element modeling of rubber curing process. J. Elastomers Plast. 2005, 37, 37–53. [Google Scholar] [CrossRef]
  17. Javadi, S.M.; Moghiman, M.; Erfanian, M.R.; Hosseini, N. Numerical investigation of curing process in reaction injection molding of rubber for quality improvements. Key Eng. Mater. 2011, 462, 1206–1211. [Google Scholar] [CrossRef]
  18. Bhushan, D.; Tomar, K.; Mondal, P. Multi-parameter optimization and predictive modeling of pyrolysis of walnut shells in fixed bed reactor using response surface methodology and machine learning algorithms. J. Anal. Appl. Pyrolysis 2025, 192, 107242. [Google Scholar] [CrossRef]
  19. Shettar, M.; Bhat, A.; Katagi, N.N.; Gowrishankar, M.; Somdee, P. Sustainable optimization of mechanical properties in fiber-reinforced polymer composites using RSM and ANN: A systematic review. J. Mater. Res. Technol. 2026, 41, 4468–4487. [Google Scholar] [CrossRef]
  20. Sivam, S.S.S.; Kesavan, S.; Santhosh, A.J. Development of a novel integrated RSM-Fuzzy MCDA framework for high-speed machinability assessment of WAAM-fabricated aluminium. Sci. Rep. 2026, 16, 4362. [Google Scholar] [CrossRef]
  21. Yang, L.; Wen, H.; Liu, Z.; Hu, L.; Huang, W.; Belouettar, S.; Hu, H. Design and implementation of a textile meso-scale geometry modeling module within an open-source FEM platform (OPFEM). Compos. Part C Open Access 2026, 19, 100713. [Google Scholar]
  22. Nor, A.F.M.; Hassan, M.Z.; Rasid, Z.A.; Sarip, S.; Daud, M.Y.M. Optimization on tensile properties of kenaf/multi-walled CNT hybrid composites with Box-Behnken design. Appl. Compos. Mater. 2021, 28, 607–632. [Google Scholar] [CrossRef]
  23. Adly, Y.M.; Zaki, M.E.A.; Fouad, O.A.; Mohamed, G.G.; Al-Hussain, S.A.; Mostafa, M.R. ANOVA and design expert model for discoloring of azo benzene derivative dye used mesoporous aluminum silicon oxide nanoparticles. Sci. Rep. 2025, 15, 44302. [Google Scholar] [CrossRef]
  24. Taqatqa, O.A.; Al Osman, O.; Alkhader, M.; Abuzaid, W.; Alnaser, A.S. Laser-textured polymer-metal bonding: A combined experimental and computational approach to enhanced mechanical bond strength. Compos. Struct. 2026, 381, 120038. [Google Scholar]
  25. Yan, J.H.; Yang, Z.N.; Du, J.L.; Feng, Y.; Zhang, M.; Feng, X.; Zhang, F. Strong yet ductile low-density steel via multiphase heterogeneous microstructure. Chin. J. Aeronaut. 2026, 39, 103802. [Google Scholar]
  26. Lin, Y.; Chen, C.; Xu, W. Microstructural engineering of magnetic wood for enhanced magnetothermal conversion. Magnetochemistry 2026, 12, 11. [Google Scholar] [CrossRef]
  27. Wang, Z.; Li, S.; Zhao, L.; Qiao, Y.; Wu, Y.; Yan, Z.; Yin, Z.; Wang, P.; Zhang, X.; Bian, X.; et al. Synergistic optimization of the properties of fiber-content-dependent PPS/PTFE/MoS2 self-lubricating composites. Polymers 2026, 18, 410. [Google Scholar] [CrossRef] [PubMed]
  28. Zhou, Y.; Kim, I.Y. Multi-scale multi-material topology optimization for lattice structures with interface connective micro-structures. Eng. Optim. 2026, 58, 291–322. [Google Scholar] [CrossRef]
  29. Ceci, A.; Costanza, G.; Tata, M.E. Mechanical and microstructural characterization of trapezoidal corrugated-core Al sandwich panels under quasi-static compression. Materials 2026, 19, 548. [Google Scholar] [CrossRef] [PubMed]
  30. Abbas, M.R.; Taieh, N.K.; Almuhaisen, A.N.; Nayyef, Z.J. A comprehensive review on factors influencing adhesion strength in polymer-metal hybrids. AIP Conf. Proc. 2026, 3379, 060024. [Google Scholar] [CrossRef]
  31. Fu, W.; Tang, S.; Wang, D.; Wang, Z. Study on interference fit profile modification method for improving contact pressure distribution. J. Braz. Soc. Mech. Sci. Eng. 2026, 48, 124. [Google Scholar] [CrossRef]
Figure 1. Thin-walled cavity model.
Coatings 16 00638 g001
Figure 2. Plastic particle injection process at different times: (a) 0 s, (b) 0.1 s, (c) 0.25 s, (d) 0.251 s, (e) 0.2515 s, (f) 0.252 s, (g) 0.254 s, (h) 0.3 s, and (i) 2 s.
Coatings 16 00638 g002
Figure 3. Two types of microstructures on the copper surface: (a) arc structure and (b) trapezoidal structure.
Coatings 16 00638 g003
Figure 4. Distribution and variation curves of interface contact stress between different arc radii and PP: (a) untreated; (b) r = 1 mm; (c) r = 0.5 mm; (d) r = 0.25 mm; (e) r = 0.1 mm; (f) r = 0.05 mm; (g) trend of contact stress with axial distance.
Coatings 16 00638 g004
Figure 5. Distribution and variation curves of interface contact stress between different arc radii and PPS: (a) untreated; (b) r = 1 mm; (c) r = 0.5 mm; (d) r = 0.25 mm; (e) r = 0.1 mm; (f) r = 0.05 mm; (g) trend of contact stress with axial distance.
Coatings 16 00638 g005
Figure 6. Contact stress distribution and variation curves of the lower base lengths of different trapezoids and the PP interface: (a) untreated; (b) d = 2 mm; (c) d = 1 mm; (d) d = 0.25 mm; (e) d = 0.5 mm; (f) d = 0.1 mm; (g) trend of contact stress with axial distance.
Coatings 16 00638 g006
Figure 7. Contact stress distribution and variation curves of the lower base lengths of different trapezoids and the PPS interface: (a) untreated; (b) d = 2 mm; (c) d = 1 mm; (d) d = 0.25 mm; (e) d = 0.5 mm; (f) d = 0.1 mm; (g) trend of contact stress with axial distance.
Coatings 16 00638 g007
Figure 8. Contact stress contour plots on copper surfaces under different structural conditions.
Coatings 16 00638 g008
Table 1. Summary table of simulation material parameters.
MaterialAttribute
Density
(kg·m−3)
Poisson’s
Ratio
CTE
(10−6/K)
Young’s Modulus (GPa)
Cu89600.34516.5110
PP9000.4251241.5
PPS16600.382516
Table 2. Test factors and levels for the arc-shaped structure.
Factor Level
−101
A/Arc width x 1 / m m 0.050.5251.0
B/Arc depth x 2 / m m 0.10.551.0
Table 3. Test factors and levels for the trapezoidal structure.
Factor Level
−101
A/Trapezoidal bottom base length x 1 / m m 0.050.5251.0
B/Trapezoidal height x 2 / m m 0.10.551.0
Table 4. Simulation test results.
LevelFactor
x1/mmx2/mm σ / M P a y1/mmy2/mm Y / M P a
10.050.10.5320.10.20.538
20.051.00.5280.11.50.522
31.00.10.5152.00.20.513
41.01.00.4982.01.50.501
50.050.550.5260.10.850.529
61.00.550.5022.00.850.506
70.5250.10.5211.050.20.525
80.5251.00.5051.051.50.509
90.2750.3250.5240.5750.5250.531
100.7750.7750.5011.5251.1750.504
110.5250.550.5101.050.850.517
120.5250.550.5081.050.850.515
130.5250.550.5111.050.850.516
Table 5. Analysis of variance table for the response surface model of the arc-shaped structure.
ExperimentSum of SquaresDegrees of FreedomMean SquareFp
Model0.012650.002568.32<0.0001
x10.003810.0038103.26<0.0001
x20.002910.002979.15<0.0001
x120.002110.002157.83<0.0001
x220.001810.001849.17<0.0001
x1x20.000410.000410.890.0231
Residual sum0.000370.0004
Total sum0.012912
Table 6. Analysis of variance table for the trapezoidal response surface model.
ExperimentSum of SquaresDegrees of FreedomMean SquareFp
Model0.010850.0021659.47<0.0001
y10.003210.003287.65<0.0001
y20.002510.002568.43<0.0001
y120.001910.001952.18<0.0001
y220.001610.001644.09<0.0001
y1y20.000310.00038.270.0315
Residual sum0.0002670.000037
Total sum0.0110612
Disclaimer/Publisher’s Note: The statements, opinions and data contained in all publications are solely those of the individual author(s) and contributor(s) and not of MDPI and/or the editor(s). MDPI and/or the editor(s) disclaim responsibility for any injury to people or property resulting from any ideas, methods, instructions or products referred to in the content.