Article

Performance Analysis of Stainless Steel Fiber Recycled Aggregate Concrete Under Dry and Wet Cycles Based on Response Surface Methodology

1
School of Civil Engineering, Architecture and Environment, Hubei University of Technology, Wuhan 430068, China
2
Key Laboratory of Health Intelligent Perception and Ecological Restoration of River and Lake, Ministry of Education, Hubei University of Technology, Wuhan 430068, China
3
China Railway Major Bridge Engineering Group Co., Ltd., Wuhan 430050, China
4
Zhongcai India Chemical Building Material Private Limited, Hangzhou 310018, China
5
East China Power Transmission & Transformation Engineering Co., Ltd., Shanghai 201803, China
6
School of Public Policy and Management, Tsinghua University, Beijing 100084, China
7
High-Tech Research and Development Center, Ministry of Science and Technology, Beijing 100044, China
8
Dongying Urban Construction and Development Group Co., Ltd., Dongying 257092, China
*
Author to whom correspondence should be addressed.
Coatings 2025, 15(9), 1100; https://doi.org/10.3390/coatings15091100
Submission received: 19 August 2025 / Revised: 10 September 2025 / Accepted: 11 September 2025 / Published: 19 September 2025
(This article belongs to the Section Environmental Aspects in Colloid and Interface Science)

Abstract

Recycled aggregate concrete refers to concrete made by using recycled aggregates produced from construction waste to replace natural aggregates. The performance of recycled aggregate concrete is extremely unstable. Internal factors such as water–cement ratio, porosity, and the properties of recycled aggregates, as well as external factors like temperature, humidity, environmental erosion, and the addition of improvement materials, may all have an impact on its mechanical properties. The response surface analysis method was employed to investigate the impact of three key factors—the number of dry–wet cycles, the content of stainless steel fibers, and the concentration of Na2SO4—on the mechanical properties of stainless steel fiber recycled aggregate concrete (SSFRAC) under dry–wet cycling conditions in the study. By incorporating stainless steel fibers into the cementitious gel network, SSFRAC is conceptualized as a composite material where the metal fibers are integrated into the gel matrix, forming a hybrid system akin to metallogels. The response models for compressive strength durability coefficient Sc and flexural strength durability coefficient Sf are established using Design-Expert software to evaluate the significance of these factors and their interactions. The version of Design-Expert used in this study is Design Expert 13.0. The results demonstrated that both Sc and Sf models exhibit high fitting accuracy, effectively capturing the relationships among the factors. The number of dry–wet cycles exhibit the highest significance, followed by Na2SO4 concentration and stainless steel fiber content. The interaction between dry–wet cycle number and Na2SO4 concentration has a particularly significant impact on Sc. For Sf, stainless steel fiber content is the most significant factor, followed by dry–wet cycle number and Na2SO4 concentration, with the interaction between fiber content and Na2SO4 concentration exerting a notably strong influence. This study highlights the potential of cement-based gels as raw materials for synthesizing functional composite materials, where the incorporation of metal fibers enhances mechanical performance and durability under aggressive environmental conditions. The findings provide insights into the design and optimization of hybrid gel–metal systems for advanced construction applications.

1. Introduction

Currently, due to infrastructure updates, urban relocation, road and bridge construction, and natural disasters, etc., there is a continuous cycle of new building constructions and demolitions taking place. However, the construction of new buildings inevitably leads to substantial consumption of natural resources while the demolition process generates significant amounts of waste. According to statistics, billions of tons of natural aggregate are consumed in the global concrete industry annually and an immense volume of construction waste is simultaneously produced. In 2005 alone, China witnessed at least 210 million tons of total construction waste (including both from construction activities and demolition) along with a minimum estimate of 100 million tons of waste concrete (comprising both production process leftovers and demolished structures). It is projected that these figures are still on the rise [1]. Consequently, research focusing on recycling construction waste for reuse in new buildings has emerged as a crucial area for investigation. The proposition of recycled aggregate concrete (RAC) not only addressed concerns regarding excessive depletion of natural resources but also offered a solution to the challenge posed by limited disposal options for construction waste. Moreover, it aligns with China’s strategic objective towards sustainable development and environmental conservation [2].
The term RAC refers to the production of concrete through the mixing of crushed, screened, washed, and graded debris from demolished buildings and roads with a specific proportion and gradation of recycled aggregate obtained by crushing, screening, washing, and grading waste concrete. However, due to the presence of internal pores and cracks in most recycled aggregates which are primarily composed of pebbles and cement mortar blocks wrapped in sand, their high water absorption rate significantly impacts the mechanical properties of RAC. Li et al. [3] demonstrated that as the replacement ratio increases when using recycled aggregate instead of ordinary gravel, there is a corresponding decrease in concrete compressive strength. This reduction becomes more pronounced when the replacement ratio for recycled coarse aggregate exceeds 70%. Bravo et al. [4] revealed that incorporating recycled aggregate into concrete leads to a reduction in both tensile strength and modulus of elasticity.
To address these challenges, the incorporation of metal fibers into cementitious gel networks has emerged as a promising approach, drawing inspiration from the concept of metallogels—composite materials where metals are integrated into gel matrices to enhance mechanical and functional properties [5]. Ahmadi et al. [6] conducted a study that demonstrated that the addition of steel fibers resulted in increased tensile strength, flexural strength, and flexural toughness of RAC. The maximum strength of RAC was achieved when the steel fiber content reached 1%. Bayraktar et al. [7] revealed that incorporating steel fibers significantly improved both split tensile strength and flexural strength of RAC, and the enhancement effect was more pronounced as the aspect ratio of steel fibers increased.
However, steel fibers are susceptible to corrosion, particularly in the saline soil area of the Yellow River Basin in China where high sulfate levels lead to sulfate ion penetration and the formation of ettringite and gypsum, resulting in cracks. Corrosion-induced rust cracking is not uncommon and has caused significant concrete aggregate loss, leading to premature structural failure and a notable decline in concrete’s mechanical and durability performance [8]. Incorporating ordinary steel fibers into reinforced concrete components can shorten their service life due to fiber corrosion, thereby affecting long-term durability. Poorsaheli et al. [9] demonstrated that steel fibers may compromise concrete’s anti-corrosion performance and even weaken the positive impact of polyolefin fibers on corrosion resistance. Stainless steel fibers, as a novel industrial material with inherent non-rusting properties along with high tensile strength and modulus of elasticity, offer potential benefits when added to concrete. Their distributed presence can effectively inhibit internal microcrack expansion while their chromium (Cr) and nickel (Ni) elements enhance acid and alkali resistance, thus improving overall corrosion resistance [10]. The innovative addition of stainless steel fibers not only enhances the properties of recycled concrete but also avoids the decrease in the properties of recycled concrete due to the incorporation of ordinary steel fibers.
Wang et al. [11] utilized fractal dimension to characterize the self-similarity and structural complexity of the fracture network, elucidating the morphological disparities of fractures in dry–wet cycles. Zhang et al. [12] demonstrated that the compressive strength, local density, dynamic modulus of elasticity, etc., of RAC were more responsive than ordinary concrete in sulfate-rich environments, particularly during frequent or periodic humidity fluctuations. Simultaneously, they postulated that the interface transition zone (ITZ) between the new aggregate and the cement paste as well as the old mortar played a pivotal role in determining the durability of RAC. Sobhan et al. [13] investigated the deleterious effects of wet–dry cycles and repeated mechanical loading on a rolled concrete pavement composed of recycled concrete aggregate (RCA) and cement, uncovering that the absorption rate of the ITZ was primarily responsible for diminishing compressive and residual bending strength of RCA concrete under dry–wet exposure. Liu et al. [14] analyzed the load–deflection curve (F-δ curve) and characteristic parameters of steel fiber concrete subjected to dry–wet cycles and sulfate corrosion, revealing distinct morphological variations characterized by multi-crack structures and pore formations after successive dry–wet cycles and sulfate corrosion events within localized regions. Shahidzadeh-Bonn et al. [15] discovered through their research that sulfate can induce severe damage to porous materials following dry–wet cycles due to partial dissolution of anhydrous sodium sulfate crystals with concurrent formation of numerous hydrated crystals (Na2SO4 ·10H2O) when relative humidity increases. However, most previous studies have focused on the influence of a single or two factors on the performance of concrete. In reality, the environment is often the result of multiple factors acting simultaneously. There are relatively few studies on the combined effect of the content of stainless steel fibers, the concentration of sulfate solution, and the number of dry–wet cycles.
In addition to recycled aggregate concrete, the durability of cement-based composites under aggressive environments has been widely studied in other material systems. For example, Verre [16] investigated the debonding behavior of fiber-reinforced cementitious matrix–concrete joints conditioned in alkaline and hot water environments, highlighting the significant influence of environmental exposure on bond capacity and failure mechanisms. Such findings demonstrate that the deterioration of cementitious composites in aggressive conditions is a broader concern across different structural applications, which further underpins the necessity of exploring the sulfate resistance of recycled aggregate concrete reinforced with stainless steel fibers.
The present study builds upon the existing research foundation to investigate the mechanical properties and corrosion resistance of SSFRAC under various sulfate dry–wet cycles. By incorporating stainless steel fibers into the cementitious gel network, SSFRAC is conceptualized as a hybrid material that combines the principles of metallogels and functional composites. Regenerated concrete samples with 1%, 1.5%, and 2% volume fractions of stainless steel fibers were subjected to 30, 60, and 90 cycles of dry–wet exposure in Na2SO4 solutions with concentrations ranging from 0% to 5%. Using response surface methodology (RSM), this study explores the significant effects of three key factors—dry–wet cycle number, stainless steel fiber volume fraction, and Na2SO4 concentration—on the compressive strength corrosion resistance coefficient Sc and flexural strength corrosion resistance coefficient Sf. The findings highlight the potential of cement-based gels as raw materials for synthesizing durable and high-performance composites, where the integration of metal fibers enhances both mechanical properties and environmental resistance. These results provide valuable theoretical support for the further development and practical application of SSFRAC in advanced construction materials, particularly in aggressive environments.

2. Test Materials and Methods

2.1. Raw Materials

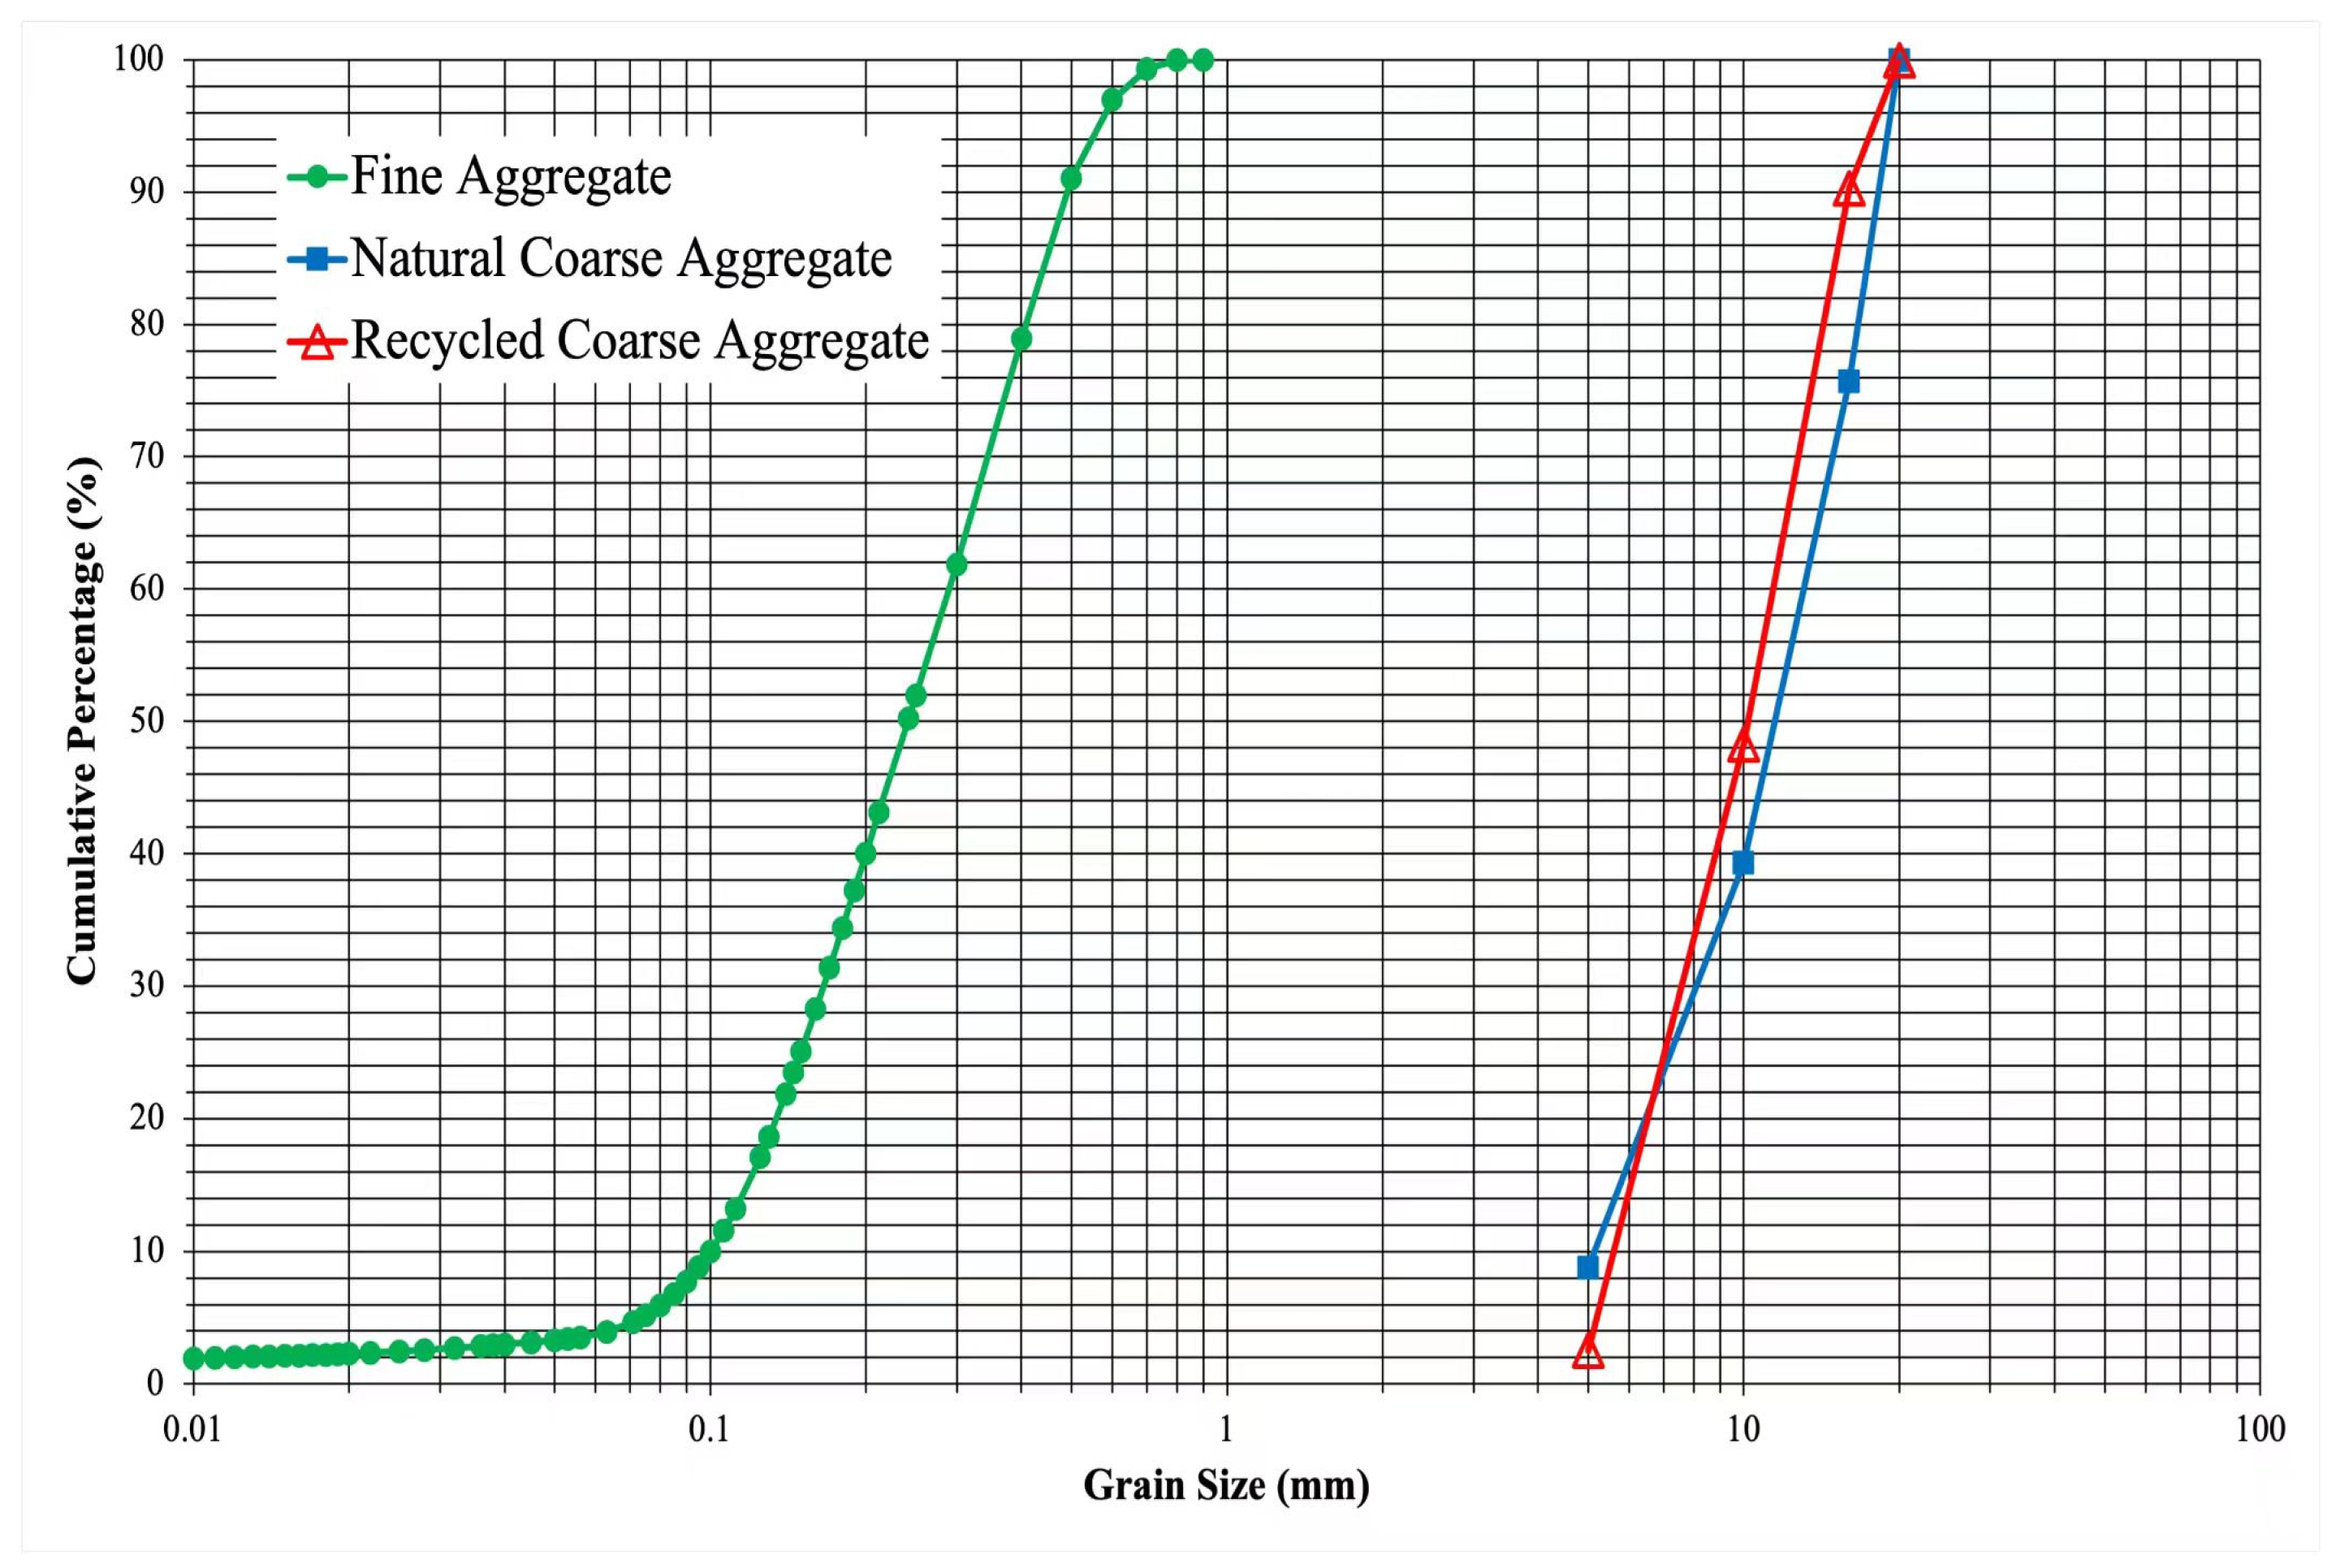
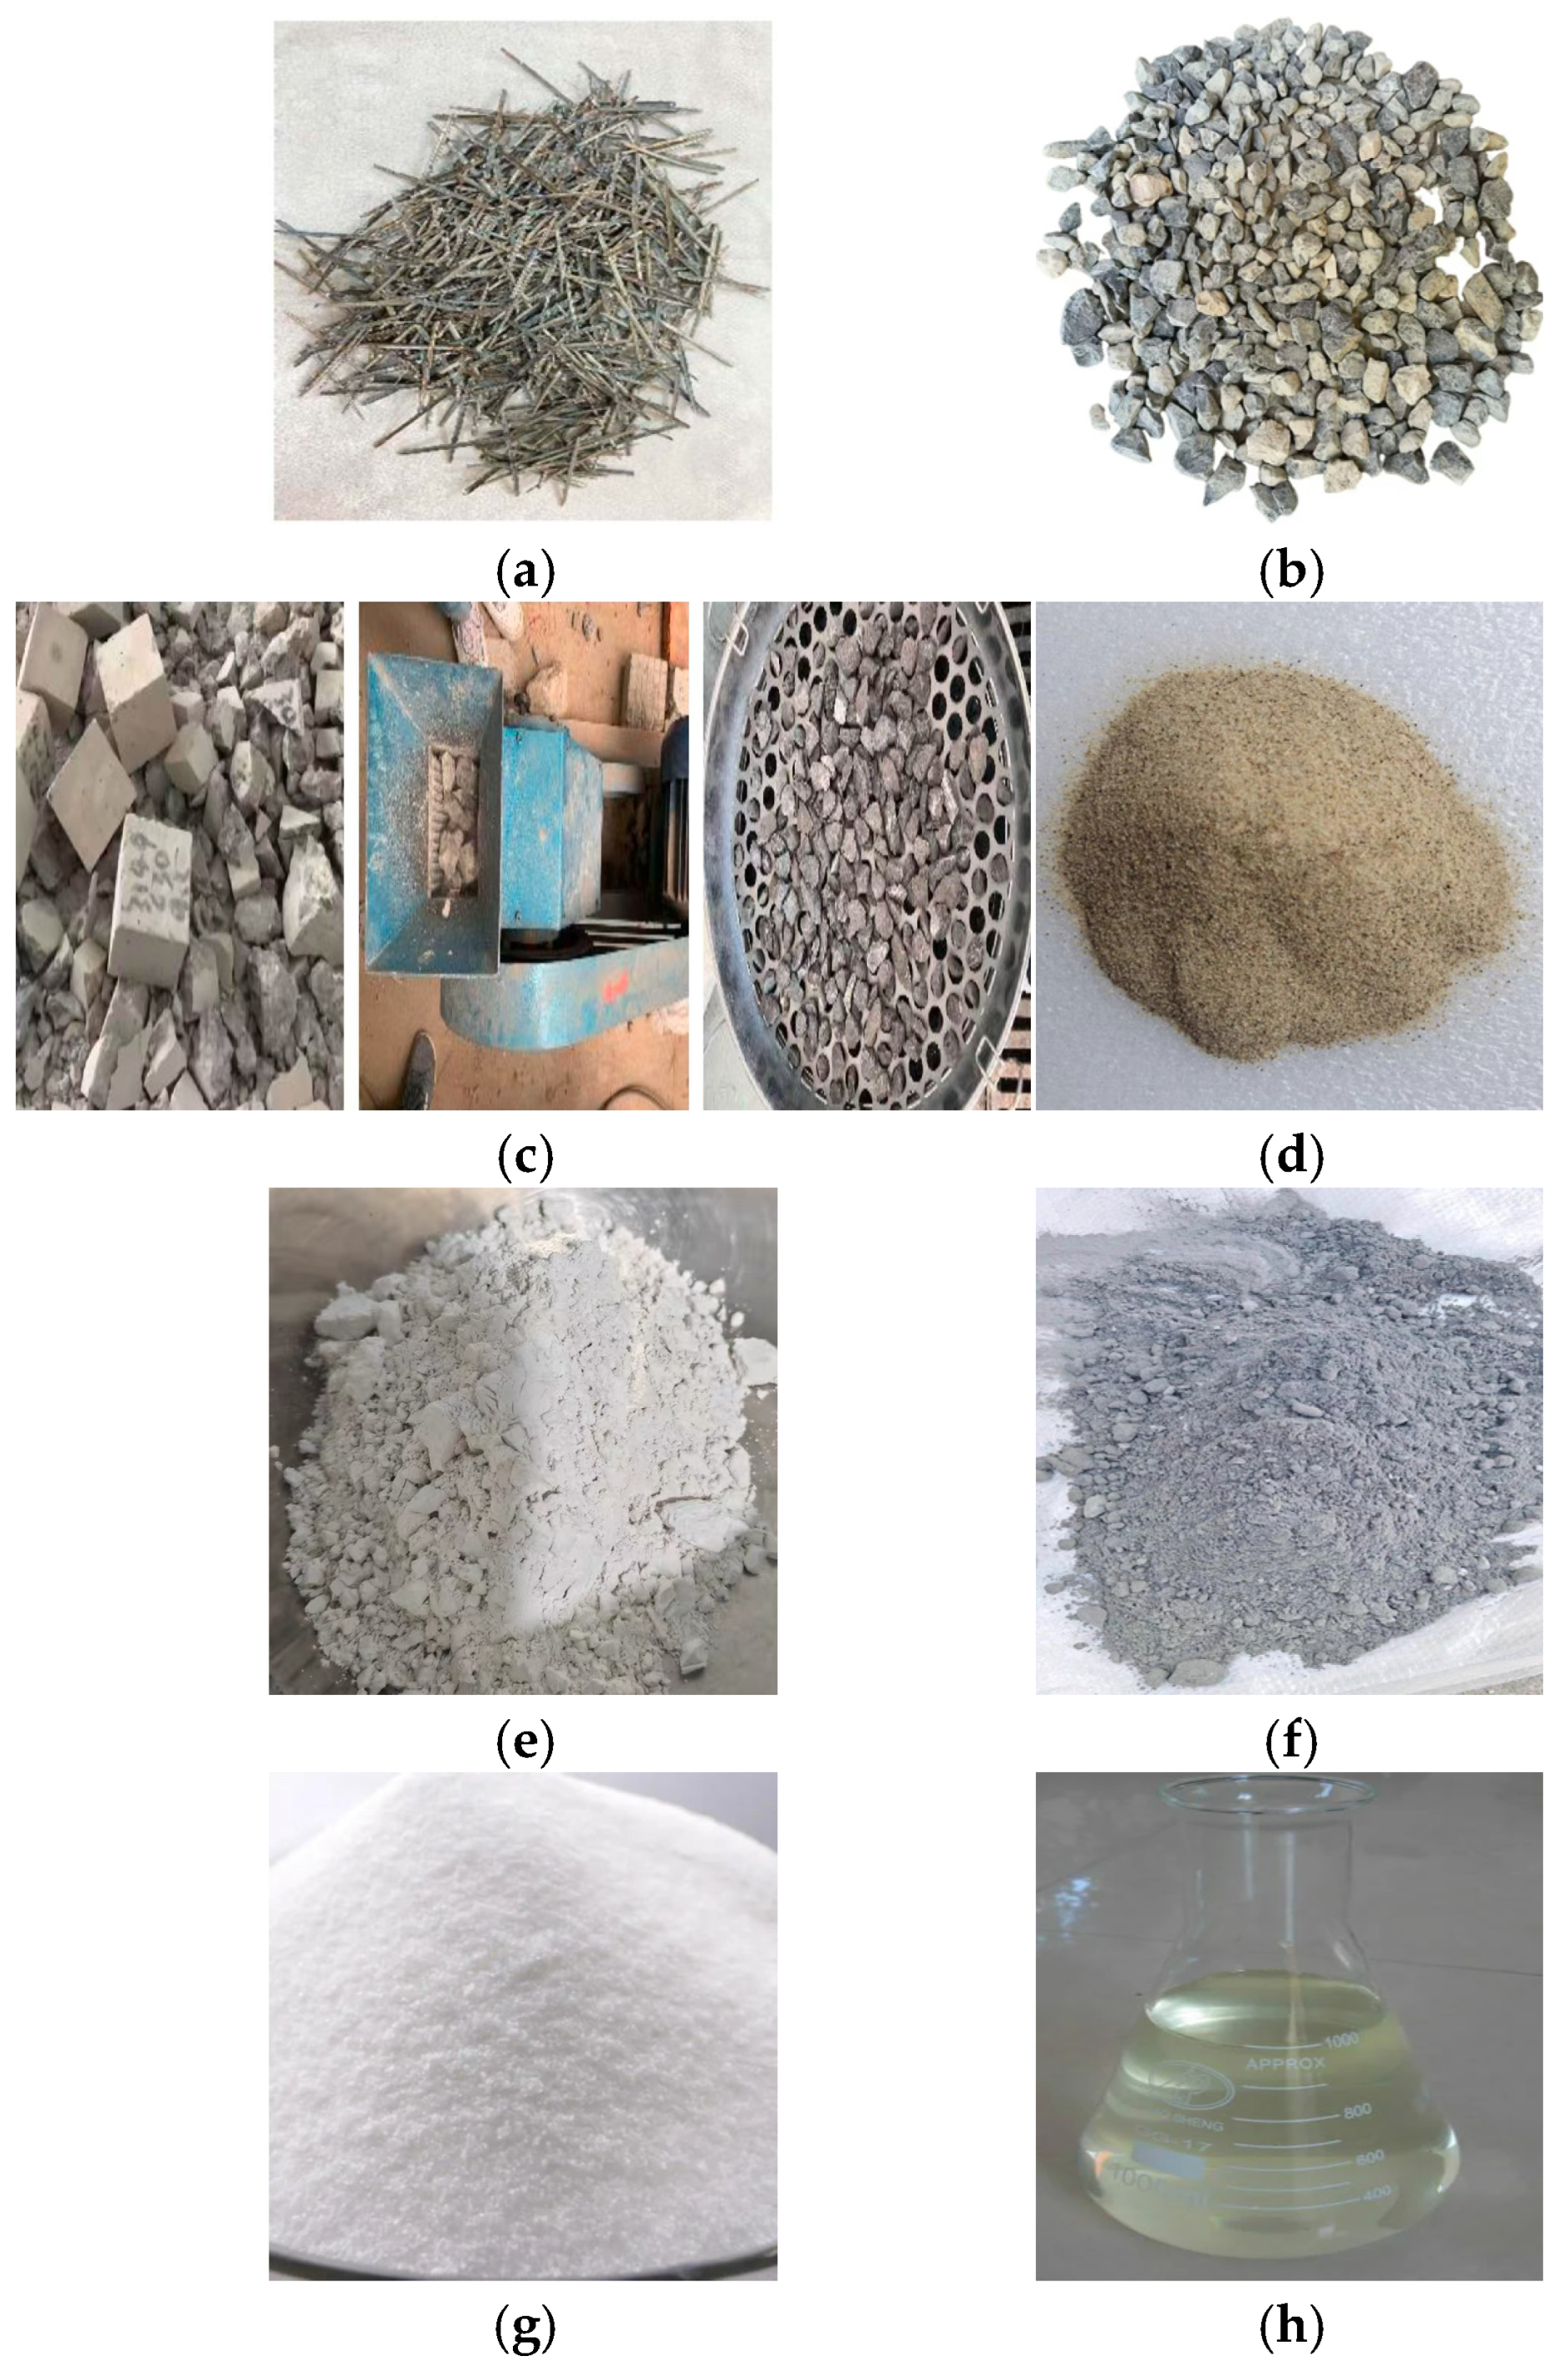
The cement used is P.O.42.5 grade ordinary Portland cement provided by Zhongjian Commercial Concrete Co., Ltd. Jiangxia Factory in Wuhan, China; the standard consistency water content is 26.6%, the compressive strength is 49.8 MPa, the initial setting time is 196 min, and the final setting time is 265 min; the coarse aggregate consists of natural coarse aggregate and recycled coarse aggregate, both with a grain size of 5–20 mm and a continuous gradation aggregate; the fine aggregate is non-coastal common fine river sand, with a fineness modulus of 0.7–1.5, and the use of non-coastal river sand is to control and reduce the sulfate and chloride content in the sand. The particle size distribution curves of natural coarse aggregates, recycled coarse aggregates, and fine aggregates are shown in Figure 1. Fly ash and slag powder are double-added II grade fly ash and S95 grade slag powder; the parameters of fly ash and slag powder are shown in Table 1. Sodium sulfate is used as a sulfate admixture; the superplasticizer is a polycarboxylate high-efficiency superplasticizer, with a slump loss of no more than 25%; the fiber used is 304 straight stainless steel fiber. The chromium content of the fibers is 18%–20%, the nickel content is 8%–11%, the length is 50–60 mm, the diameter is 0.33–0.4 mm, the aspect ratio is 150, the longitudinal elastic modulus is 193 GPa, and the tensile strength is greater than or equal to 1200 MPa. The measurement of the strength of stainless steel fibers is based on Steel Fibers for Concrete (GB/T 39147-2020) [17]. Figure 2 shows the pictures of the main materials used in the experiment.

2.2. Test Mix Proportions and Specimen Preparation

The test procedure follows the Chinese industry standard Technical Specification for Application of Recycled Aggregate (JGJ/T 240-2011) [18], issued by the Ministry of Housing and Urban–Rural Development of the People’s Republic of China, applicable within the People’s Republic of China, and implemented on 1 December 2011. The SSFRAC mixture design was conducted using C30 as the reference strength, as detailed in Table 2. The recycled aggregate replacement rate is 20%, and both fly ash and slag powder were added at a volume fraction of 20%. Additionally, the stainless steel fiber dosage ranges from 1% to 2%. Before adding fibers, the recycled aggregates should be pre-treated to reach the saturated surface dry state. Then, the aggregates, fibers, cement, and water should be added in sequence and stirred in a powerful mixer for a sufficient period of time to ensure that the fibers are as evenly distributed as possible in the concrete.
In this study, the replacement level of recycled coarse aggregate was fixed at 20%. This choice was made to balance two considerations. On the one hand, previous studies have shown that when the replacement ratio exceeds approximately 30%–40%, the mechanical properties of RAC decline significantly due to the high porosity and water absorption of recycled aggregates [3,4]. On the other hand, using a 20% replacement ratio allows the RAC specimens to retain sufficient baseline strength while still reflecting the performance modifications introduced by stainless steel fiber incorporation. Furthermore, since the objective of this work was to investigate the effects of stainless steel fiber dosage, Na2SO4 concentration, and dry–wet cycle number, fixing the recycled aggregate content helped to reduce the number of experimental variables and simplify the response surface design.
According to the Standard for Test Methods of Concrete Physical and Mechanical Properties (GB/T 50081-2019) [19], the standard cube specimen for compressive strength tests is 150 mm × 150 mm × 150 mm. In this study, 100 mm × 100 mm × 100 mm specimens were used due to preparation and equipment limitations. This size has been widely adopted in related research, and the standard also provides testing procedures for such non-standard specimens. The molds were demolded from the concrete specimens after 48 h of casting. Subsequently, the specimens underwent standard curing conditions (20 ± 2 °C, with relative humidity exceeding 95%) for a duration of 26 days.

2.3. Test Methods

We removed the specimens that had been maintained for 26 days, wiped off any surface moisture, and then dried them in an oven at 80 °C for 48 h. Once the drying process was completed, we allowed the specimens to cool in a dry environment to room temperature before placing them into the LSY-18 sulfate dry–wet cycling test equipment, which is from Jinan Yongce Industrial Equipment Co., Ltd. in Jinan, China. We ensured a spacing of 20 mm between adjacent specimens and maintained a distance of over 20 mm between the specimens and the inner wall of the equipment. An appropriate concentration of Na2SO4 solution was poured into the upper water tank through the filling port for each dry–wet cycle. Each cycle consisted of 24 h, with immersion lasting for 15 h followed by a drainage and air-drying period of 0.5 h. The subsequent drying time was set at 6 h with an additional cooling time of one hour, resulting in a total cycling time of 24 h, maintaining drying temperature at 80 °C and cooling temperature at 28 °C while controlling solution temperature within the range of 20–25 °C. pH levels were monitored every ten cycles in both upper and lower water tanks to ensure they remained between pH values of six and eight. After completing thirty cycles, we assessed the compressive strength using a DYE-2000S microcomputer servo-hydraulic pressure testing machine from Dongguan Senming Equipment Co., Ltd in Dongguan, Guangdong as well as an MTS microcomputer-controlled electronic pressure testing machine from Jinan Wenteng Testing Instrument Co., Ltd. in Jinan, Shandong. The test procedure follows the Standard for Test Methods of Concrete Physical and Mechanical Properties (GB/T 50081-2019) and the Standard for Test Methods of Long-Term Performance and Durability of Ordinary Concrete (GB/T 50082-2019) [20].

3. Compressive Strength

3.1. Compressive Strength Test Results

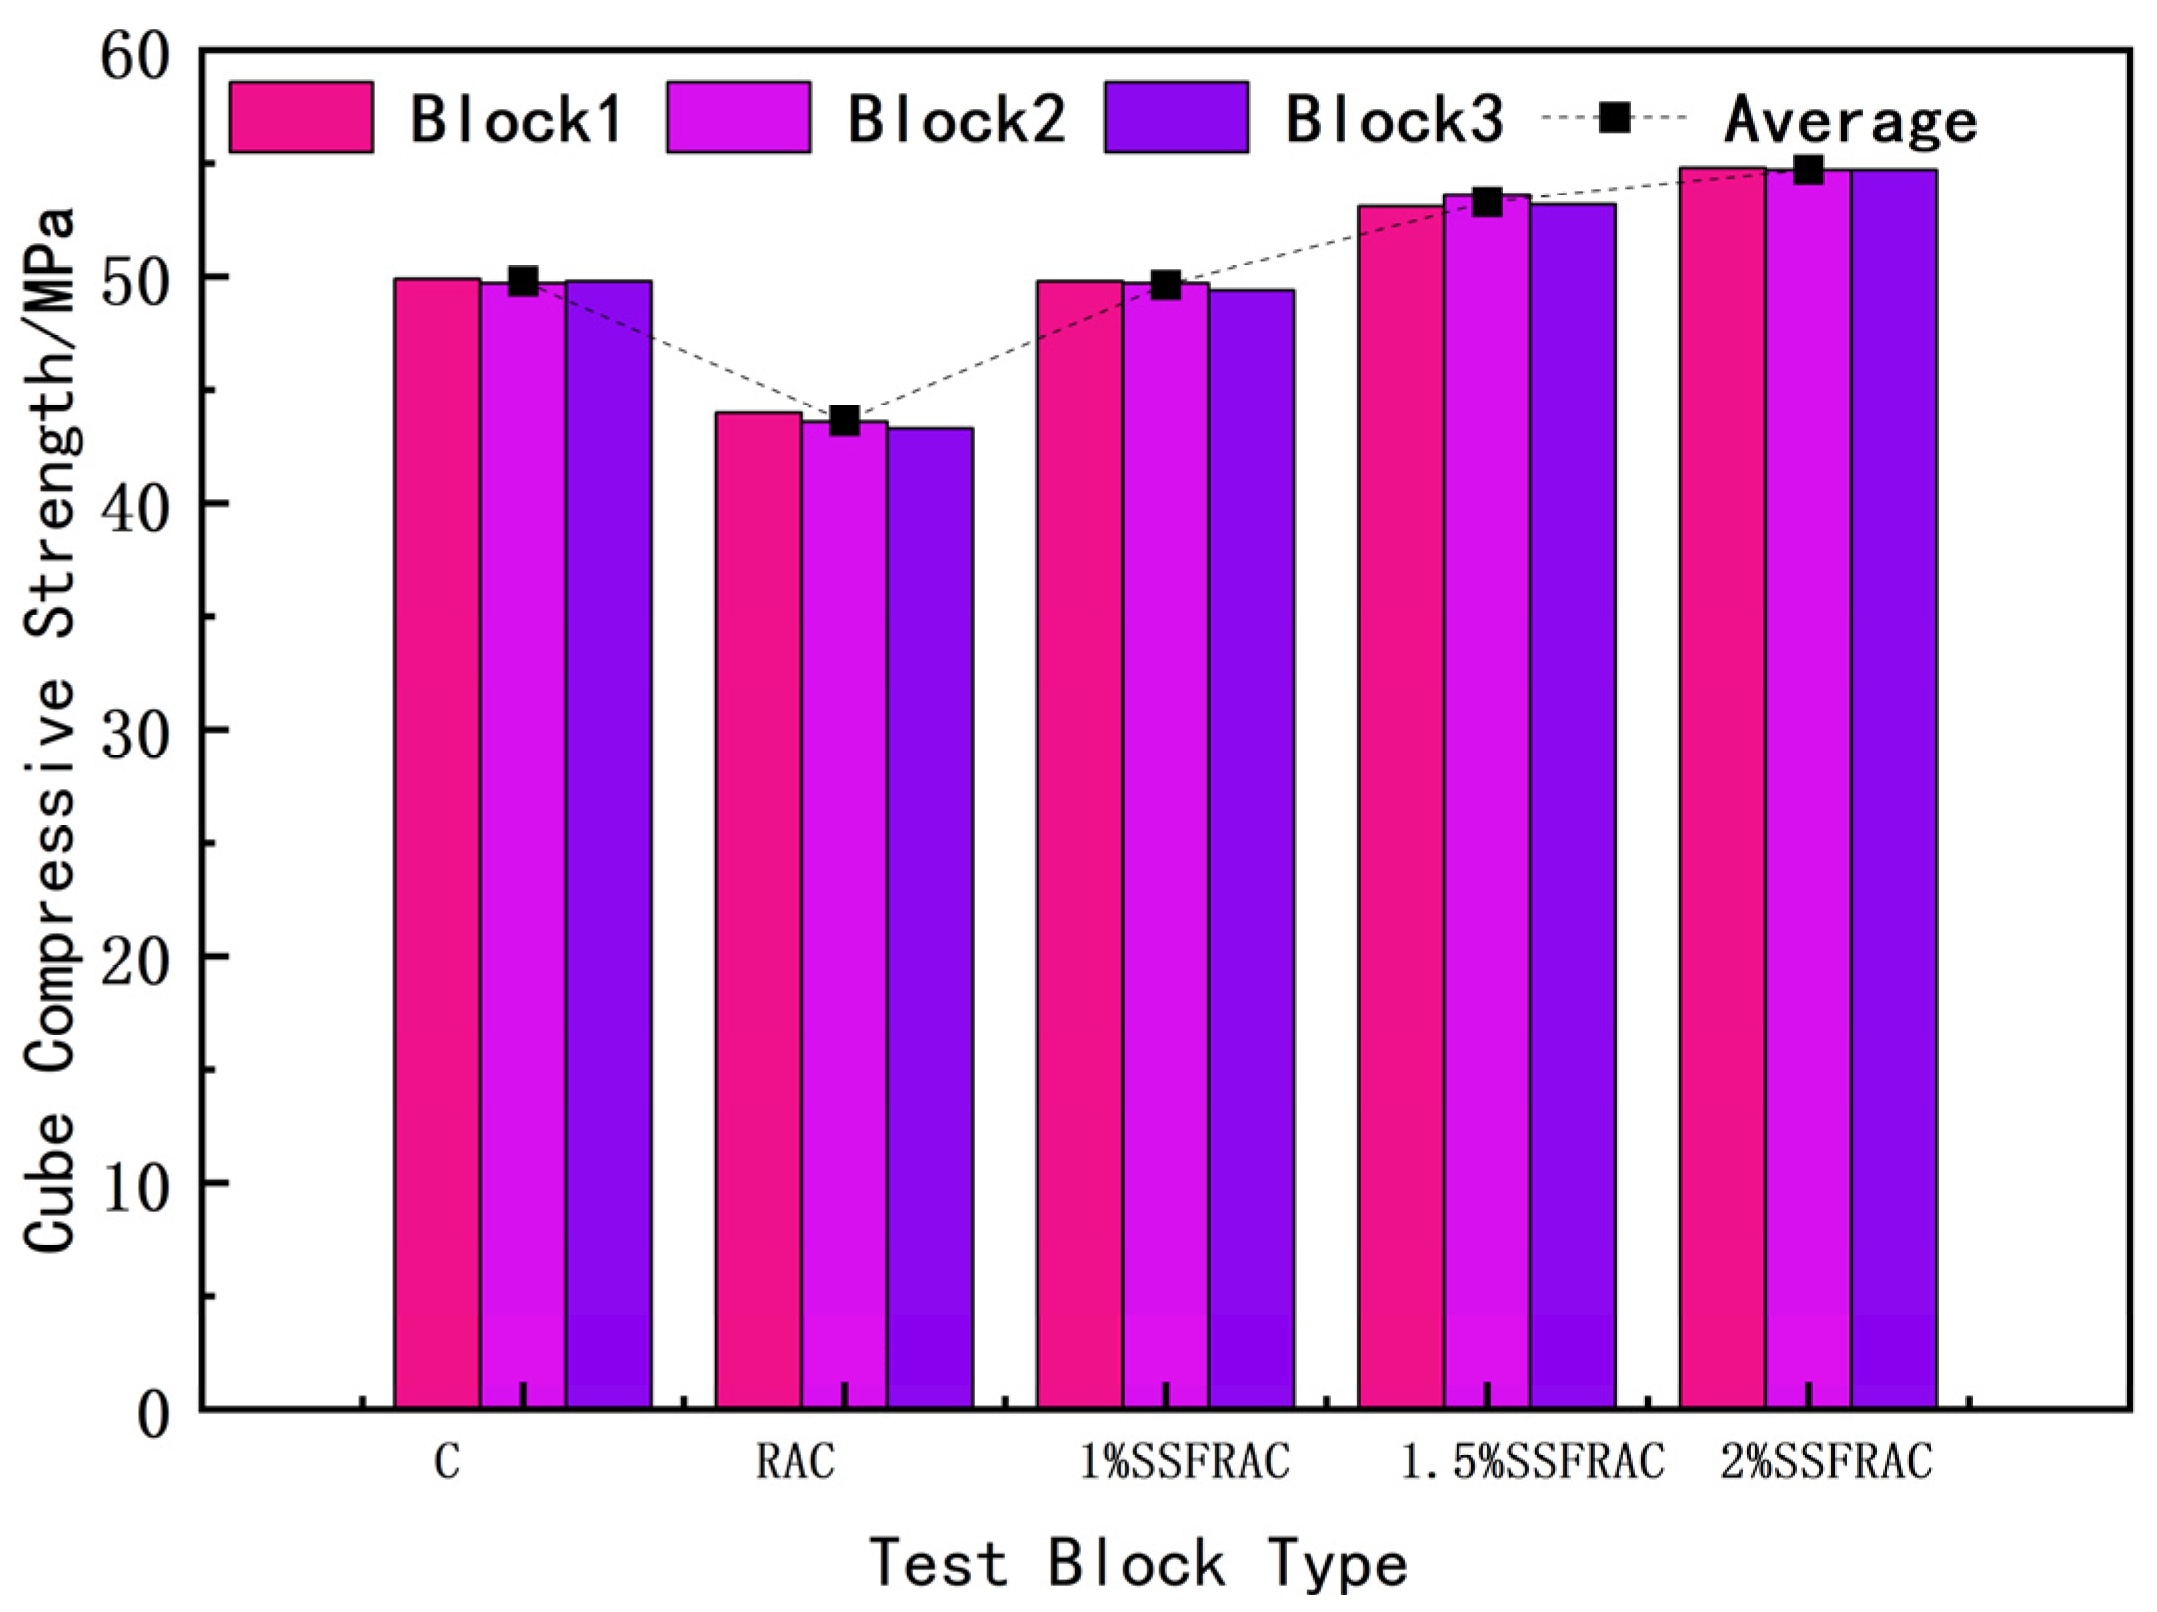
Table 3 shows the cube compressive strengths of ordinary concrete, RAC, and SSFRAC. Three parallel tests were conducted for each group of specimens to reduce test errors. It can be seen that the compressive strength of SSFRAC is lower than that of ordinary concrete. This is because RAC contains pores and cracks within its structure, resulting in a compressive strength significantly lower than that of natural aggregate concrete. However, the addition of stainless steel fibers to RAC can notably improve its compressive strength. Based on the data presented in Table 3, Figure 3 illustrates the cube compressive strength of each group of specimens after a 28-day curing period. As depicted in Figure 3, the compressive strength of SSFRAC demonstrates varying performance under different fiber dosage conditions. The introduction of stainless steel fibers leads to a rapid initial enhancement followed by a gradual plateau in SSFRAC’s compressive strength. When the dosage of fibers reaches 2%, the compressive strength of SSFRAC reaches 54.73 MPa, which is 11.1 MPa higher than that of RAC, with an increase of 25.4%. This is attributed to the generation of microcracks within SSFRAC when subjected to loading forces and the dispersion of stainless steel fibers throughout the concrete matrix, which impedes crack development within the matrix by altering their original trajectory. Due to their random distribution within the concrete, cracks propagate along complex paths around or through the fibers, necessitating more energy and consequently enhancing SSFRAC’s compressive strength.

3.2. Destructive Features

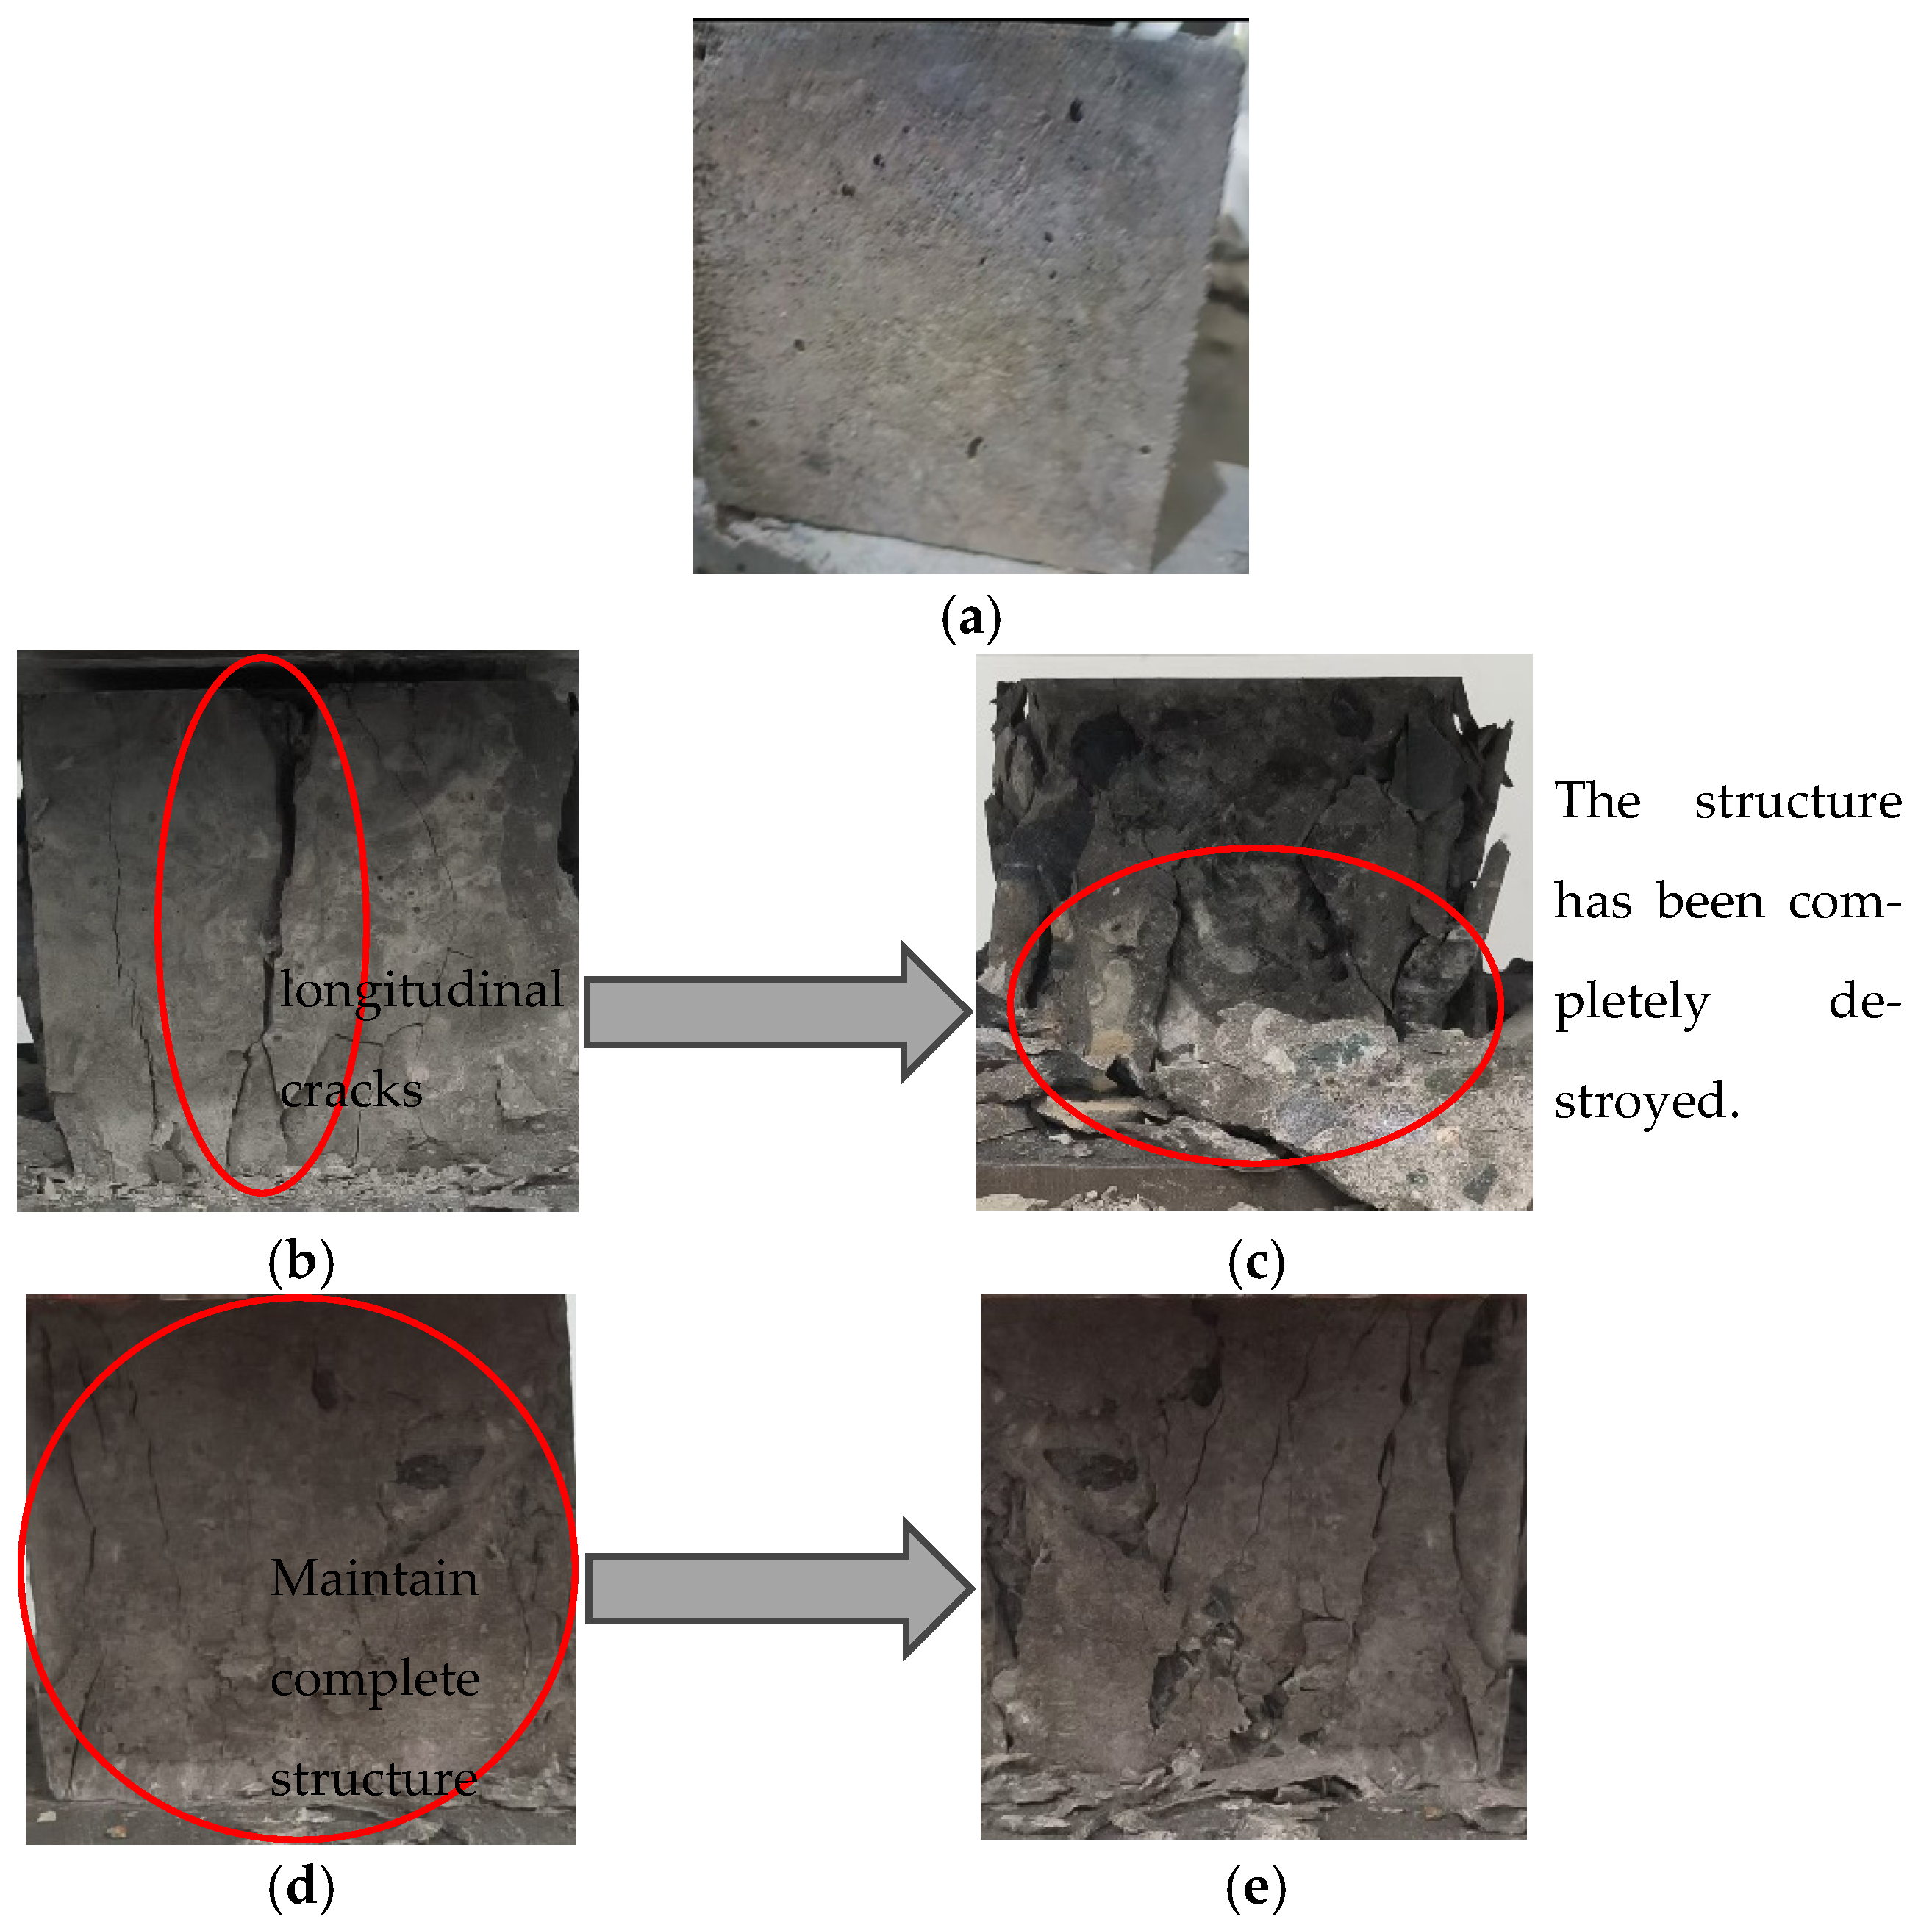
Figure 4 presents the compressive failure morphologies of RAC and 1.5% SSFRAC. Both materials initially exhibit longitudinal cracks during the early stage of loading. At the late stage, RAC undergoes rapid fragmentation due to the absence of fiber reinforcement, whereas SSFRAC retains integrity and residual load-bearing capacity because of the bridging and tensile effects of stainless steel fibers.

4. RSM Model Establishment

4.1. Response Surface Model Selection

The RSM is a technique used to approximate a function that cannot be explicitly expressed by creating a series of design points based on random variables and analyzing experimental data to fit an explicit function. It enables the assessment of the relationship between one or more responses of measurable variables through regression fitting, response surfaces, and contour lines. In this study, the central composite design (CCD) method will be employed for response surface design [21,22,23,24].
By employing the CCD method offered by the Design-Expert software, a more accurate second-order model was chosen, and a quadratic response surface equation was formulated, encompassing all first-order, second-order, and two-way interaction terms [25], as follows:
Y = β 0 + i = 1 k β i X i + i = 1 k β i i X i 2 + i < j k β i j X i X j + e X i , X i , , X i
In Equation (1), Y denotes the response value which, in this study, refers to the compressive strength durability coefficient (Sc) or the flexural strength durability coefficient (Sf), both of which are dimensionless. X represents the independent variables, namely the number of dry–wet cycles (cycles), the stainless steel fiber content (vol.%), and the Na2SO4 concentration (mass%). The regression coefficients (β) are dimensionless parameters derived from model fitting. The term e denotes the residual error, defined as the deviation between the experimentally observed values and those predicted by the regression model.

4.2. Factors Levels and Response

A three-factor two-level experiment was conducted, combining the external dry–wet cycle frequency (A), the amount of stainless steel fibers in recycled concrete (B), and the concentration of Na2SO4 solution (C). The factors and levels are detailed in Table 4. The response values selected were the compressive strength retention coefficient S c and flexural strength retention coefficient S f . Formulas (2) and (3) were utilized to calculate the strength change in SSFRAC after undergoing a specific number of dry–wet cycles.
S c = c i c × 100 %
S f = f i f × 100 %
In the equation, S c ( S f ) represents the coefficient of compressive (flexural) strength corrosion resistance; c i ( f i ) denotes the compressive (flexural) strength of SSFRAC after undergoing, measured in MPa; and c(f) signifies the compressive (flexural) strength of SSFRAC from the same batch and age as the test specimen, standard conditioned and cured under standard conditions, also in MPa.

4.3. Coupling Test Design and Results

Considering that the quantity of stainless steel fibers is an internal factor influencing concrete performance, and that the concentration of Na2SO4 solution and the number of dry–wet cycles are the external factors, the integration of internal and external factors in concrete constitutes the focal point of this study. The experimental design and response values for fiber tests are detailed in Table 5. Experiments numbered 1–14 represent factorial experiments, whereas 15–19 denote center experiments, resulting in a total of 19 test points. Among these, numbers 1–14 correspond to factorial points, representing fixed three-dimensional points formed by assigning values to A, B, and C as response factors. Numbers 15–19 pertain to repeated test points where the average value from three repetitions is calculated for each group to minimize experimental error.

5. RSM Model Verification

Using the Design-Expert software, the experimental data in Table 5 was integrated and processed to establish models for each response value. The data in Table 5 was subjected to second-order multivariate regression based on Formula (1), followed by optimization of the fitted data. As a result, second-order polynomial models for S c and S f concerning the number of dry–wet cycles (A), the number of stainless steel fibers in recycled concrete (B), and Na2SO4 solution concentration (C) were obtained.

5.1. Compressive Strength Index S C

The quadratic polynomial model of S C is
S c = 0.857 0.119 A + 0.023 B + 0.002 C + 0.018 A B 0.022 A C 0.016 B C + 0.078 A 2 0.012 B 2 0.058 C 2
Table 6 and Table 7 present the analysis of variance and regression coefficient significance, respectively. An adjusted R2 = 0.9613 suggests that the model can account for 96.13% of the changes in response values, indicating a strong fit. The F value and p value in Table 6 serve as indicators to assess the effectiveness and significance of S c . With an F value of 50.68 and a p value of less than both 0.0001 and 0.05, it is evident that the model for S c adheres to reliability and significance criteria; furthermore, with a residual term of 1.28 exceeding 0.05, it signifies a significant association with S c while maintaining high reliability.
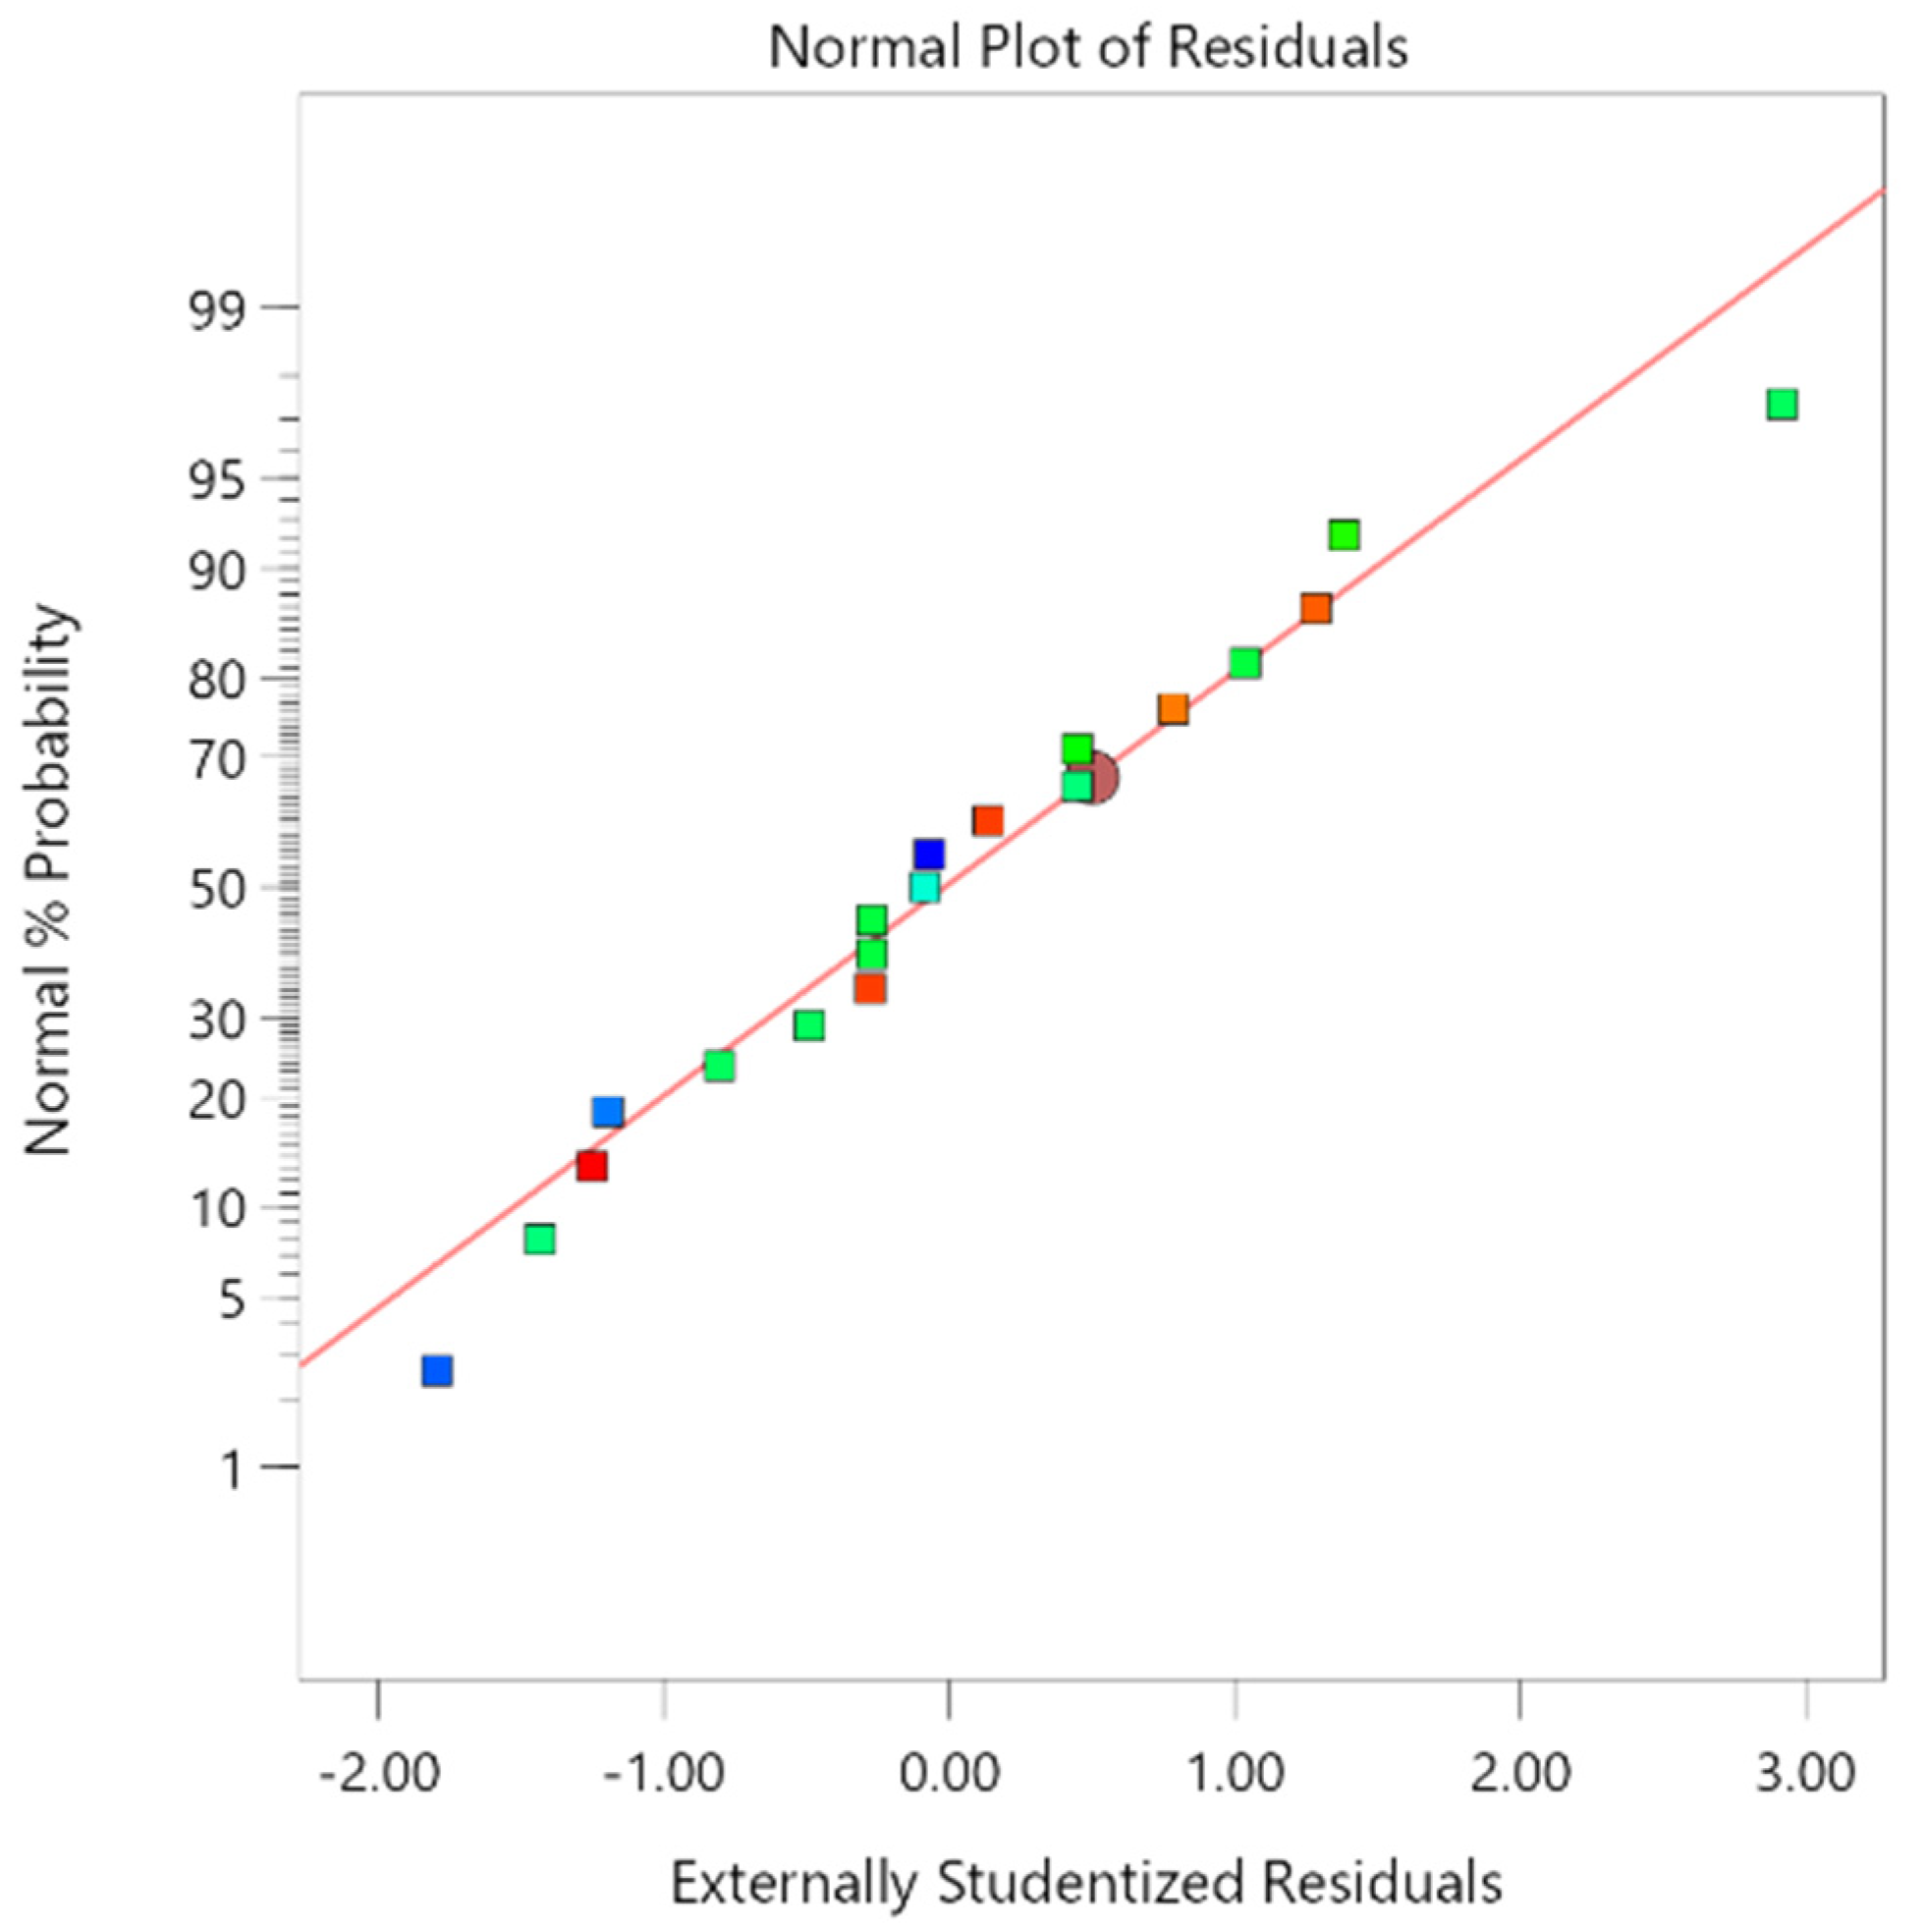
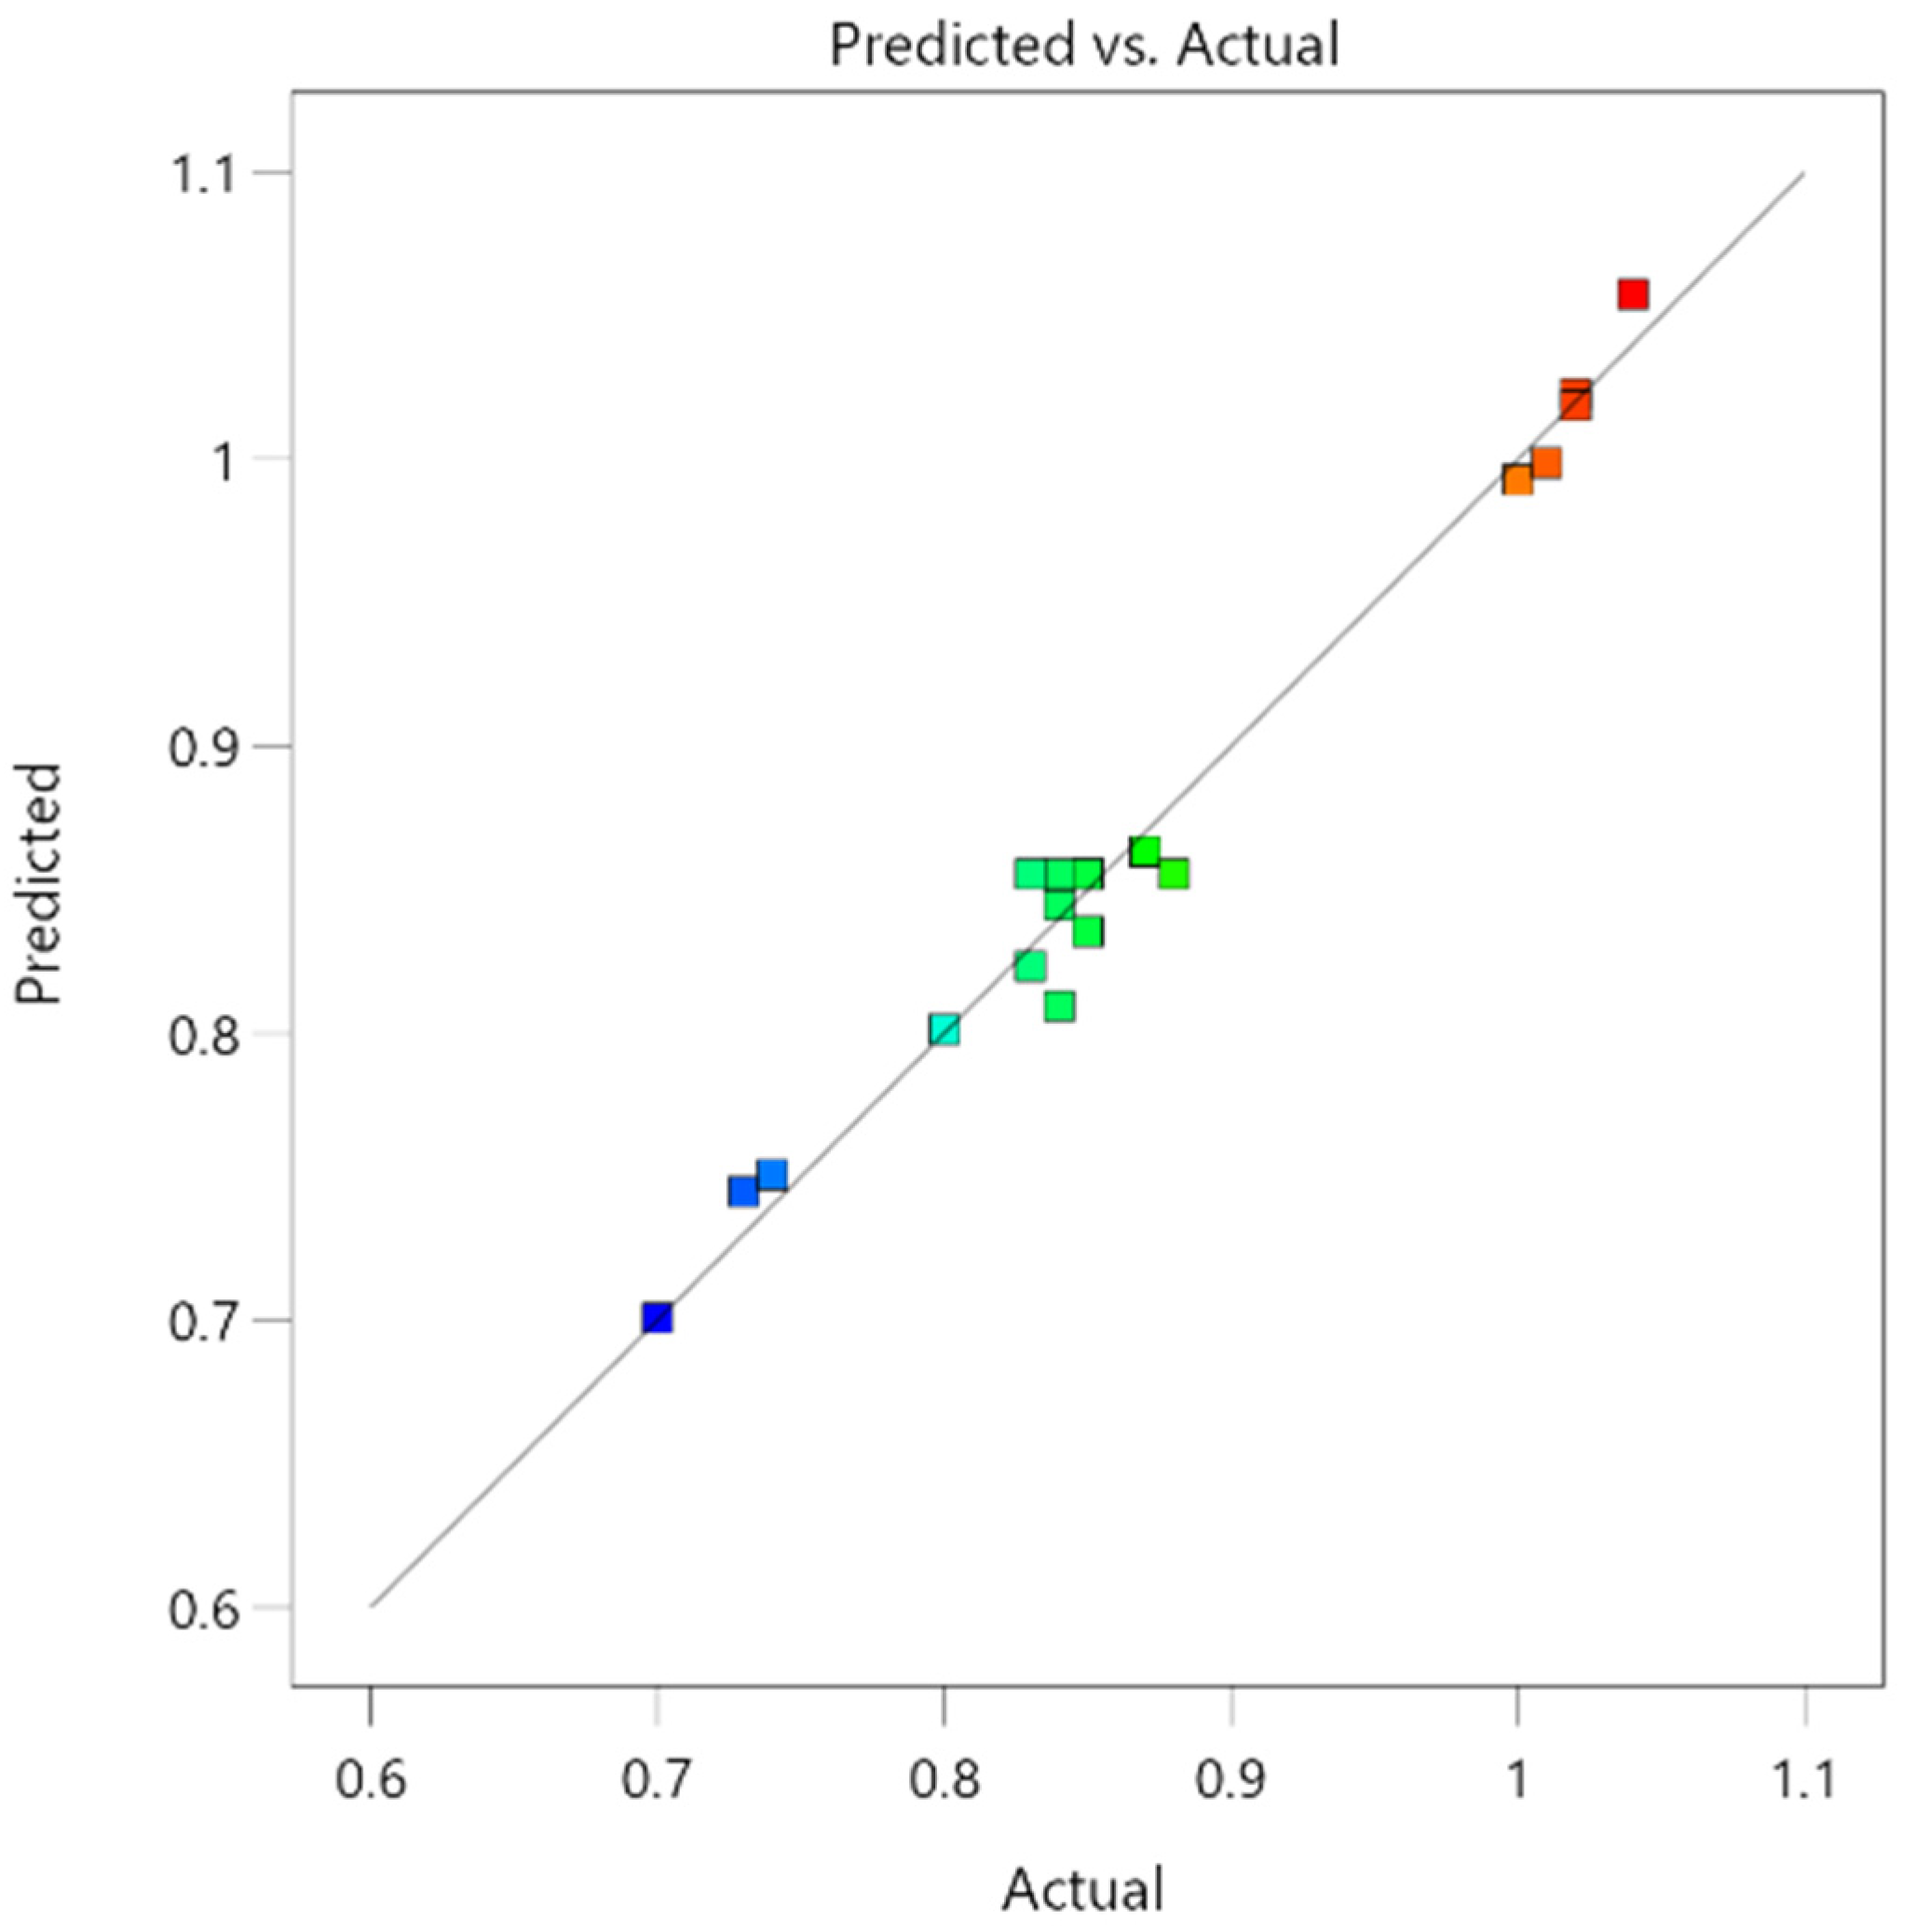
Figure 5 displays the normal distribution of the residuals of S c , with all data points aligning closely to a straight line, indicating a strong fit. In Figure 6, the residuals vs. predictions plot for S c reveals random distribution on both sides of zero. Additionally, Figure 7 illustrates the predictions vs. actual plot for S c , demonstrating that all data points are tightly clustered around a straight line; closer proximity to this line signifies better performance. The high accuracy of the model is evident from the distribution pattern of these data points. In conclusion, Equation (4) effectively captures the relationship between S c and the three factors.

5.2. Flexural Strength Index S f

The quadratic polynomial model of S f is
S f = 0.734 0.041 A + 0.020 B + 0.006 C 0.011 A B 0.014 A C + 0.039 B C + 0.020 A 2 + 0.050 B 2 0.046 C 2
Table 8 and Table 9 present the analysis of variance and regression coefficient significance, respectively. An adjusted R2 = 0.9457 indicates that the model can account for 94.57% of the changes in response values, suggesting a strong fit. The F value and p value in Table 8 serve as indicators to assess the effectiveness and significance of S f . With an F value of 35.87 and a p value of less than both 0.0001 and 0.05, it is evident that the model for S f adheres to reliability and significance criteria; furthermore, with a residual term of 4.81 exceeding 0.05, it signifies a significant association with S f while maintaining high reliability.
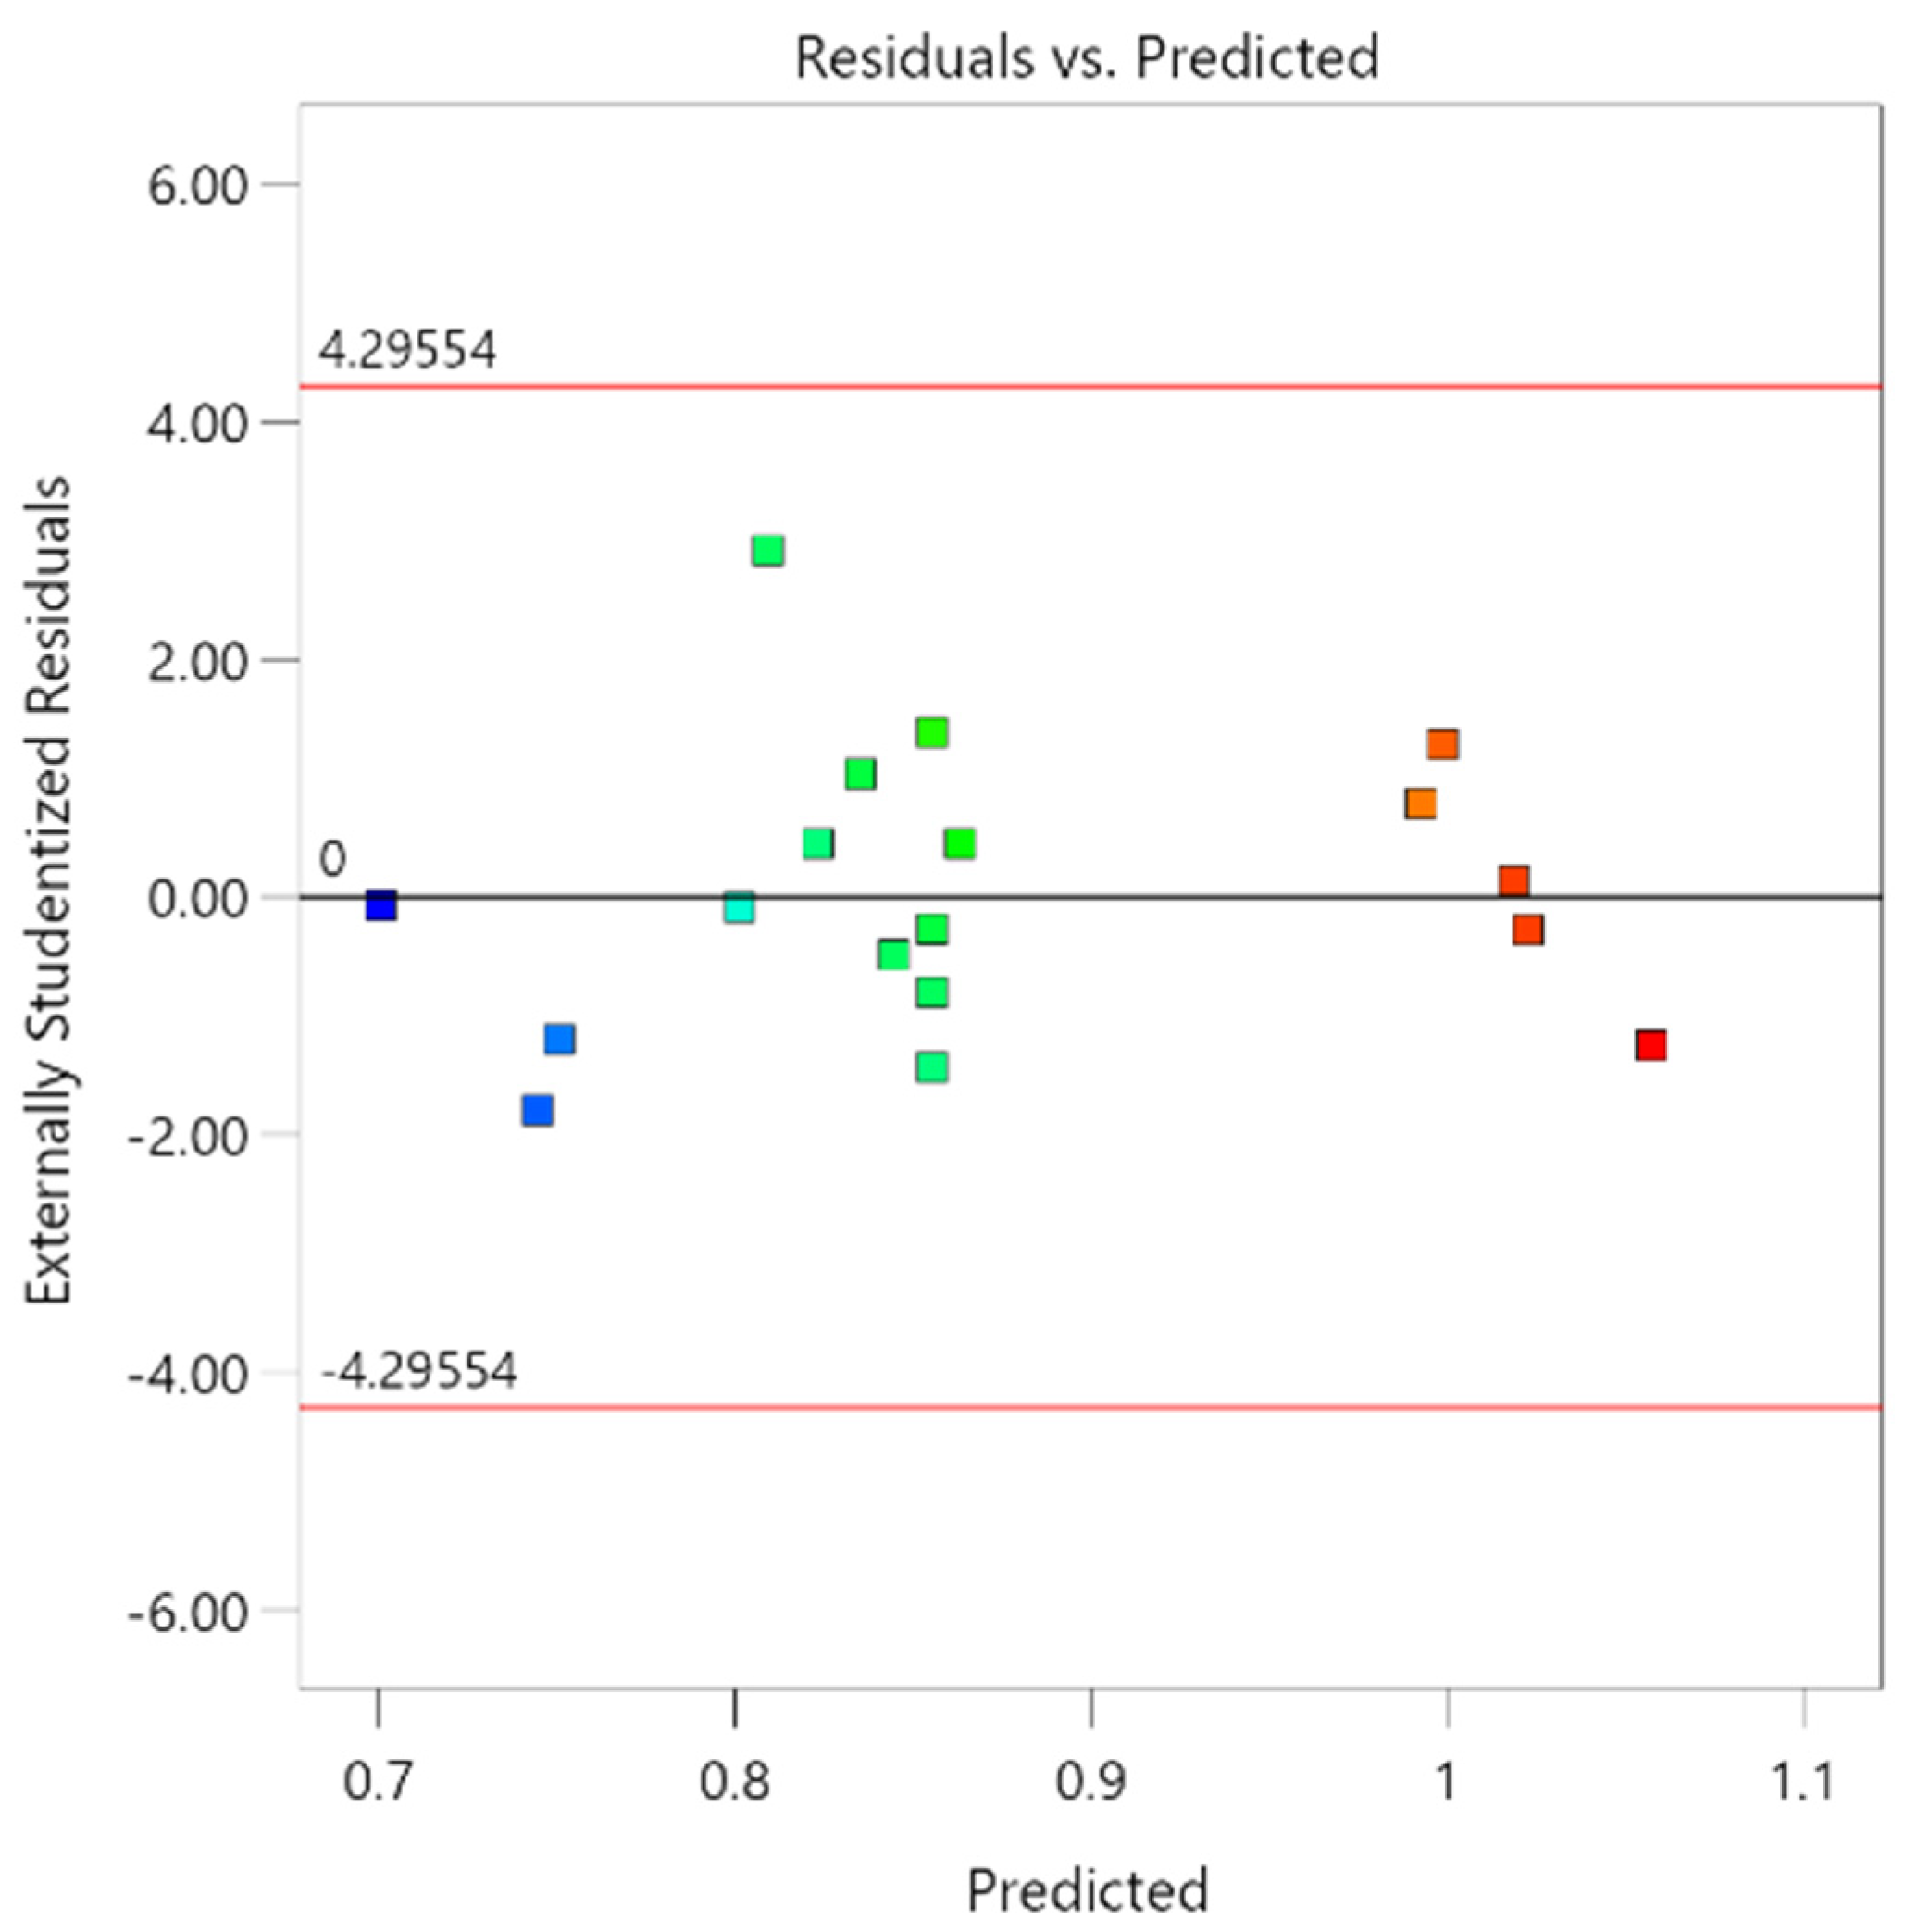
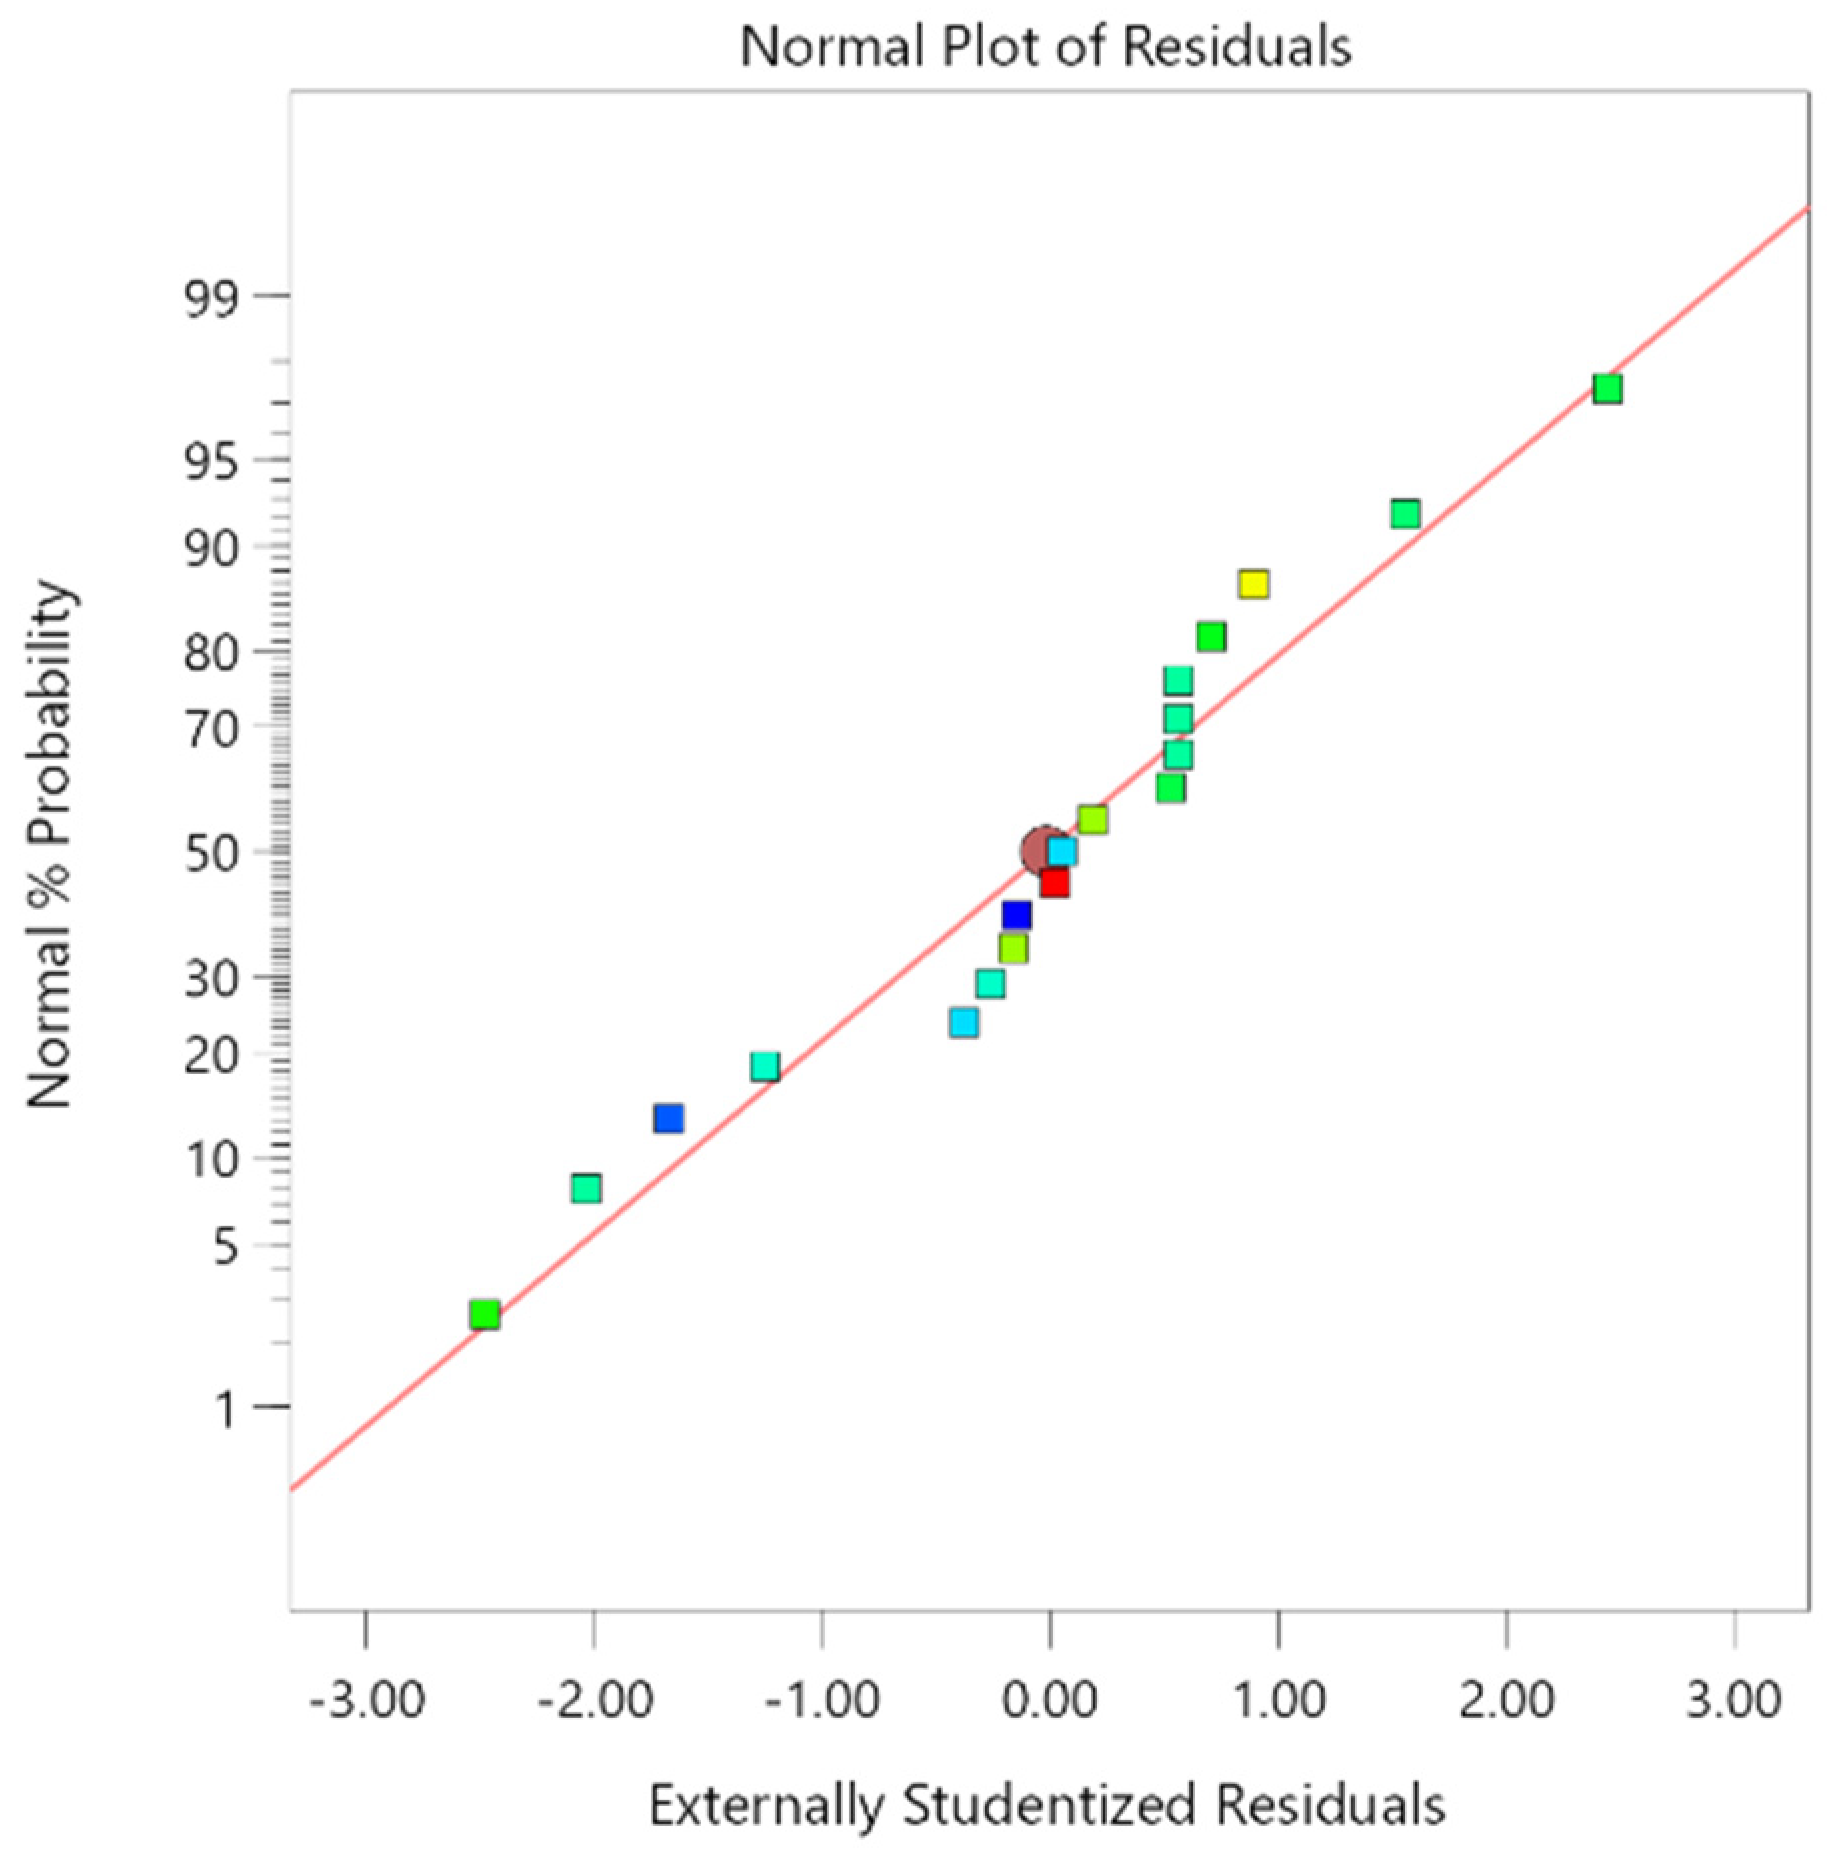
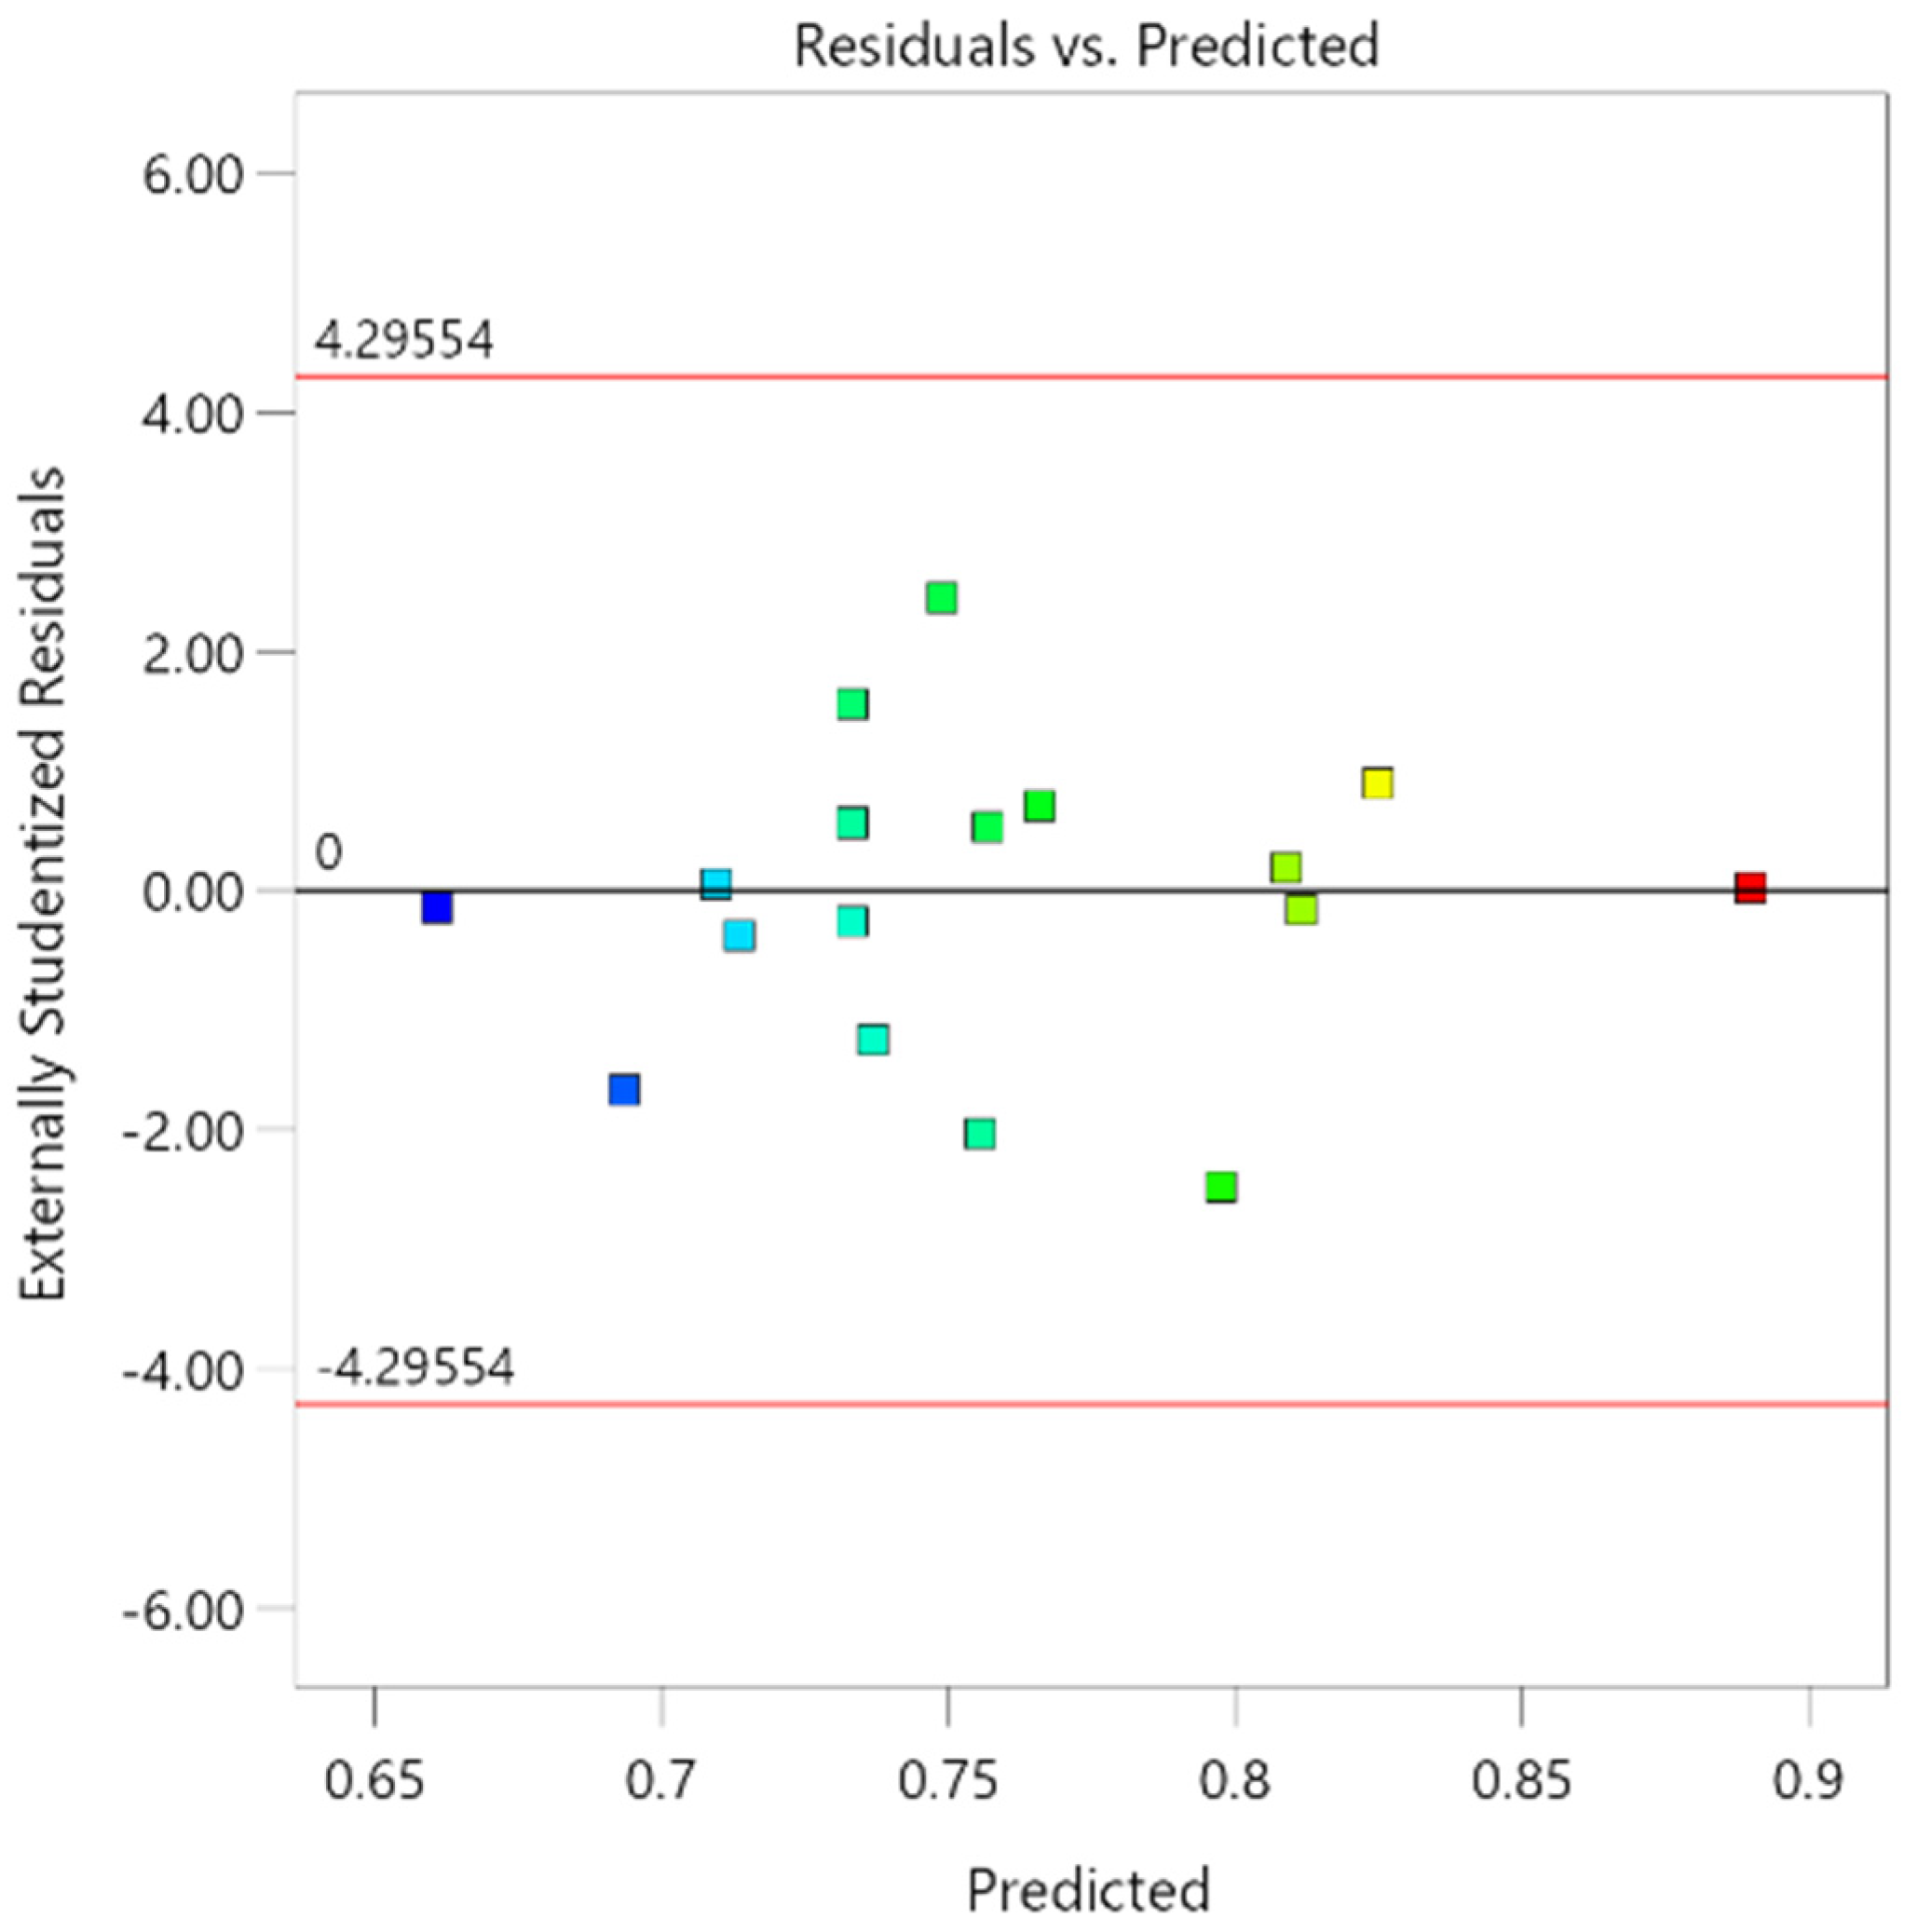
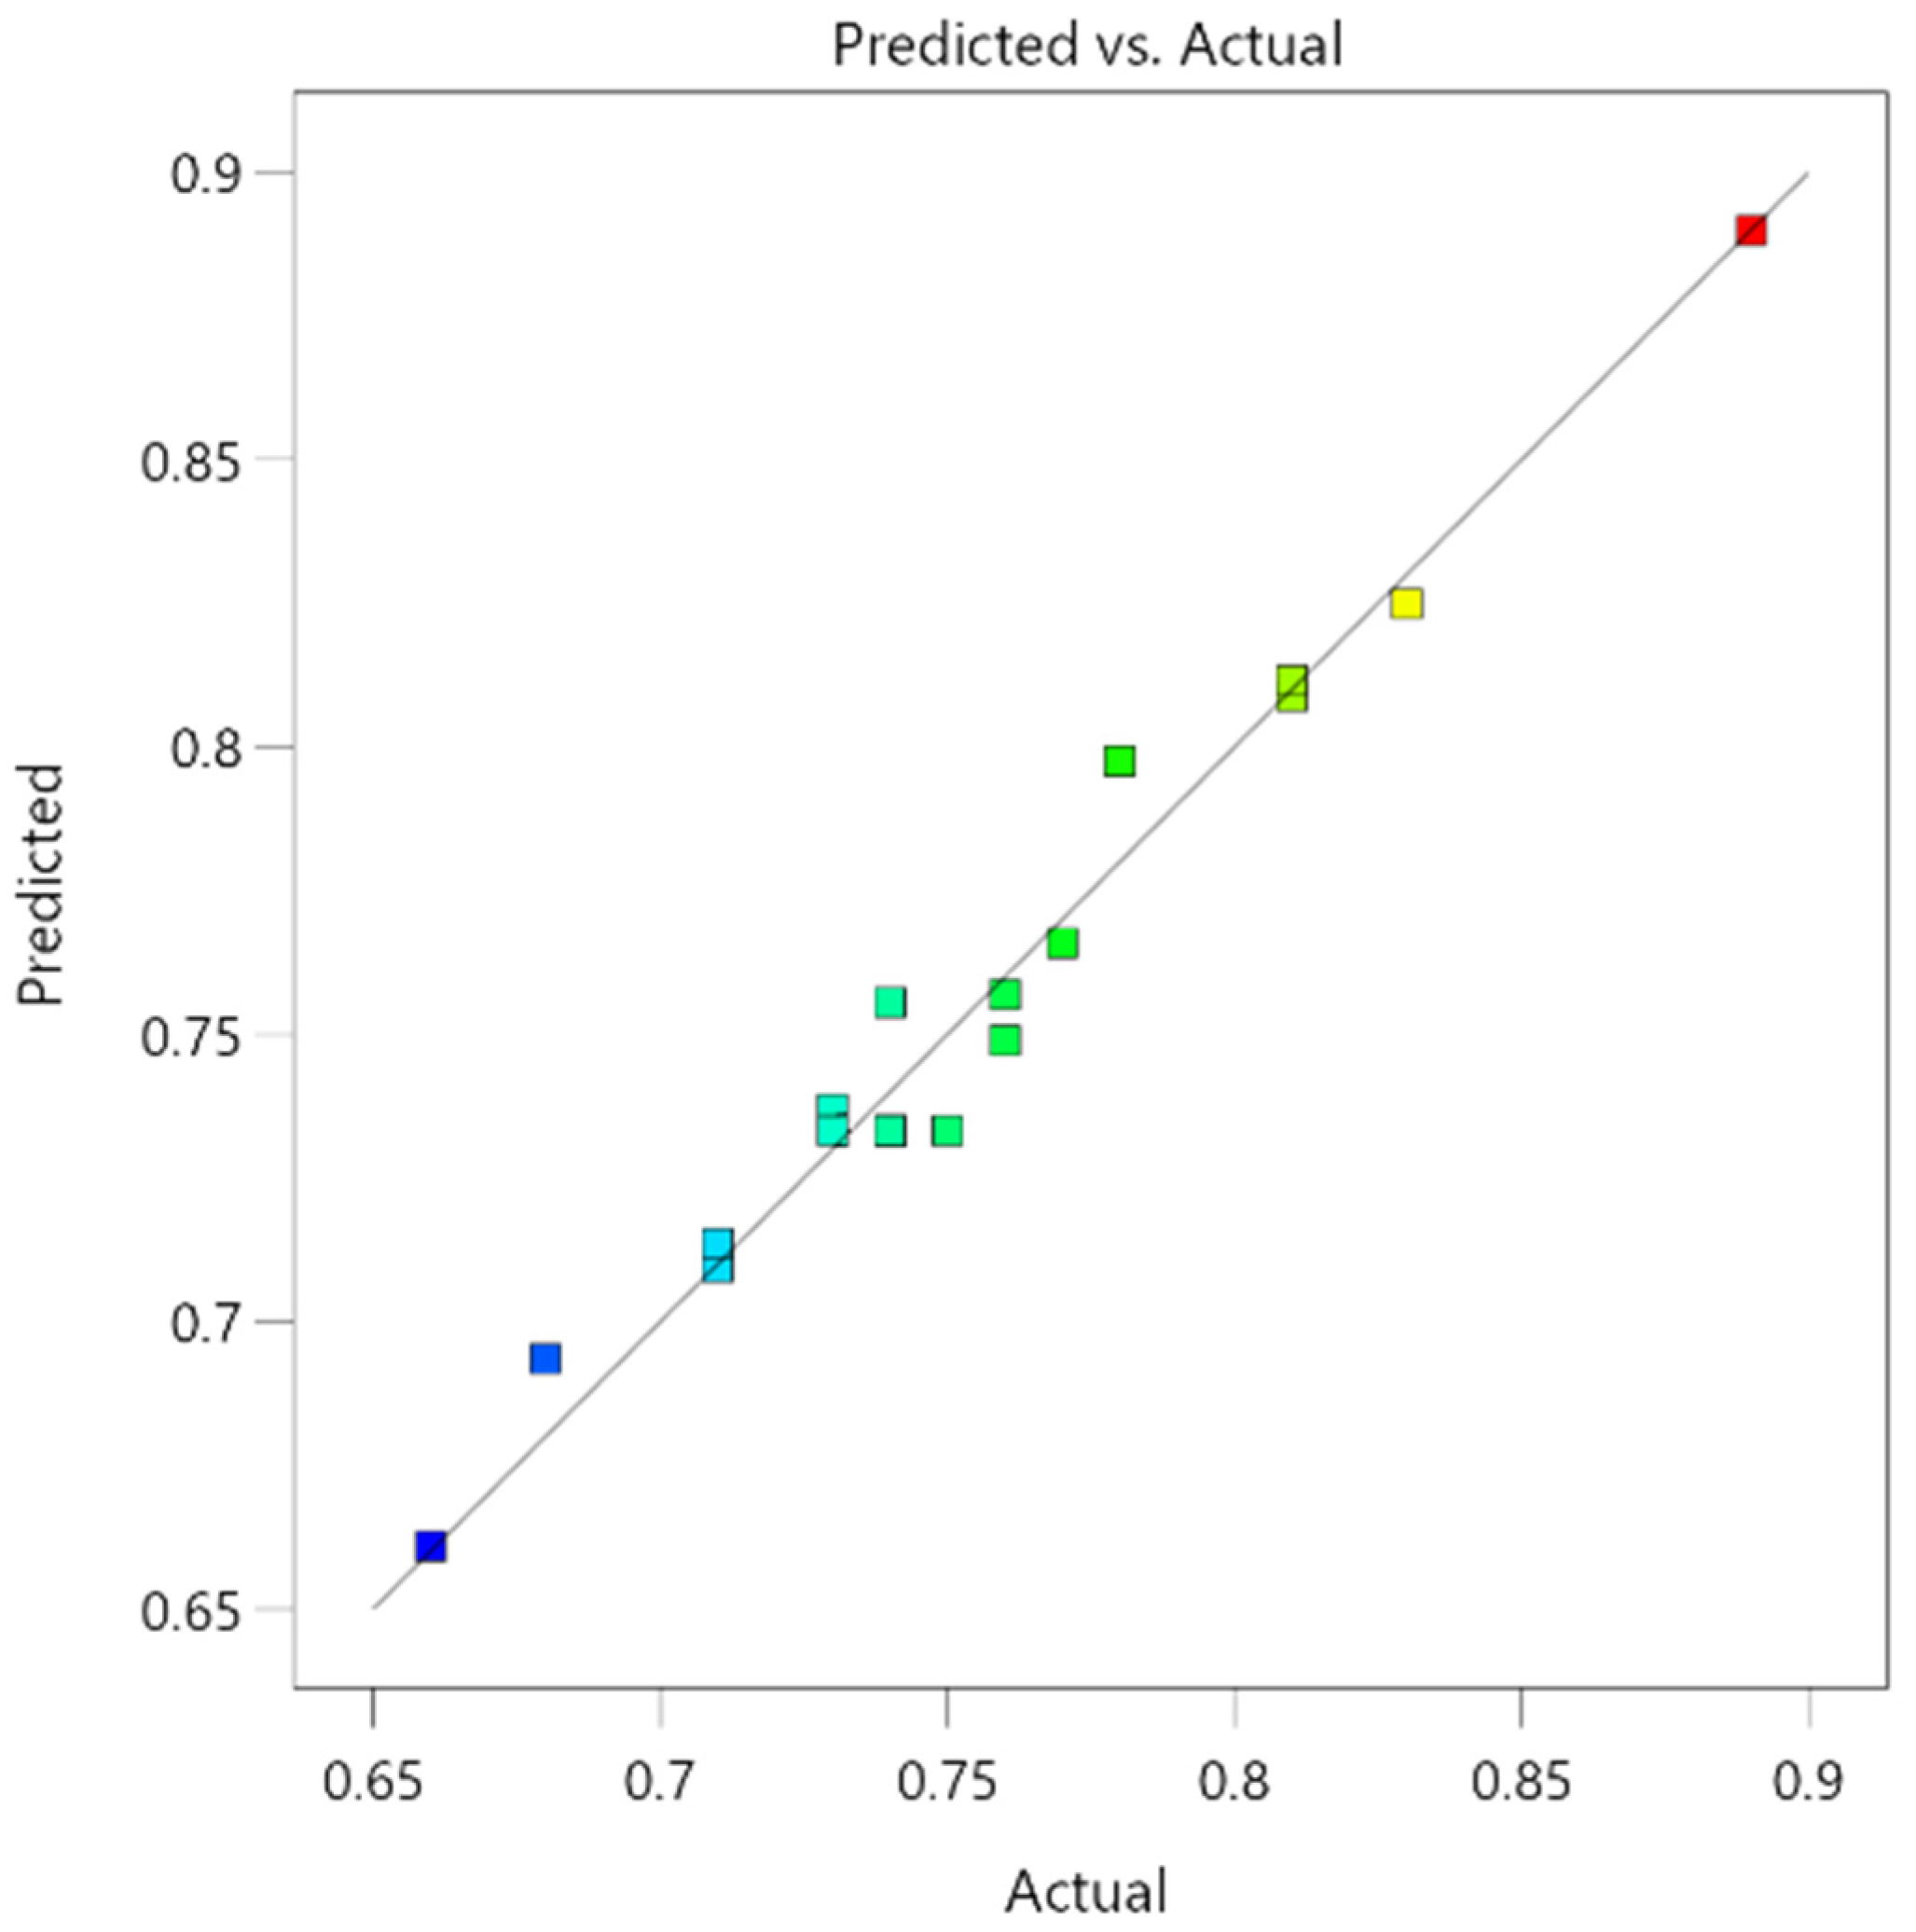
Figure 8 illustrates the normal distribution of the residuals of S f , with all data points aligning closely to a straight line, indicating a strong fit. In Figure 9, the residuals vs. predictions plot for S f reveals random distribution on both sides of zero. Additionally, Figure 10 depicts the predictions vs. actual plot for S f , demonstrating that all data points are tightly clustered around a straight line; closer proximity to this line signifies better performance. The high accuracy of the model is evident from the distribution pattern of these data points. In conclusion, Equation (5) effectively captures the relationship between S f and the three factors.

6. Analysis and Discussion of RSM Model Results

6.1. Influences of Various Factors and Their Interaction on S c

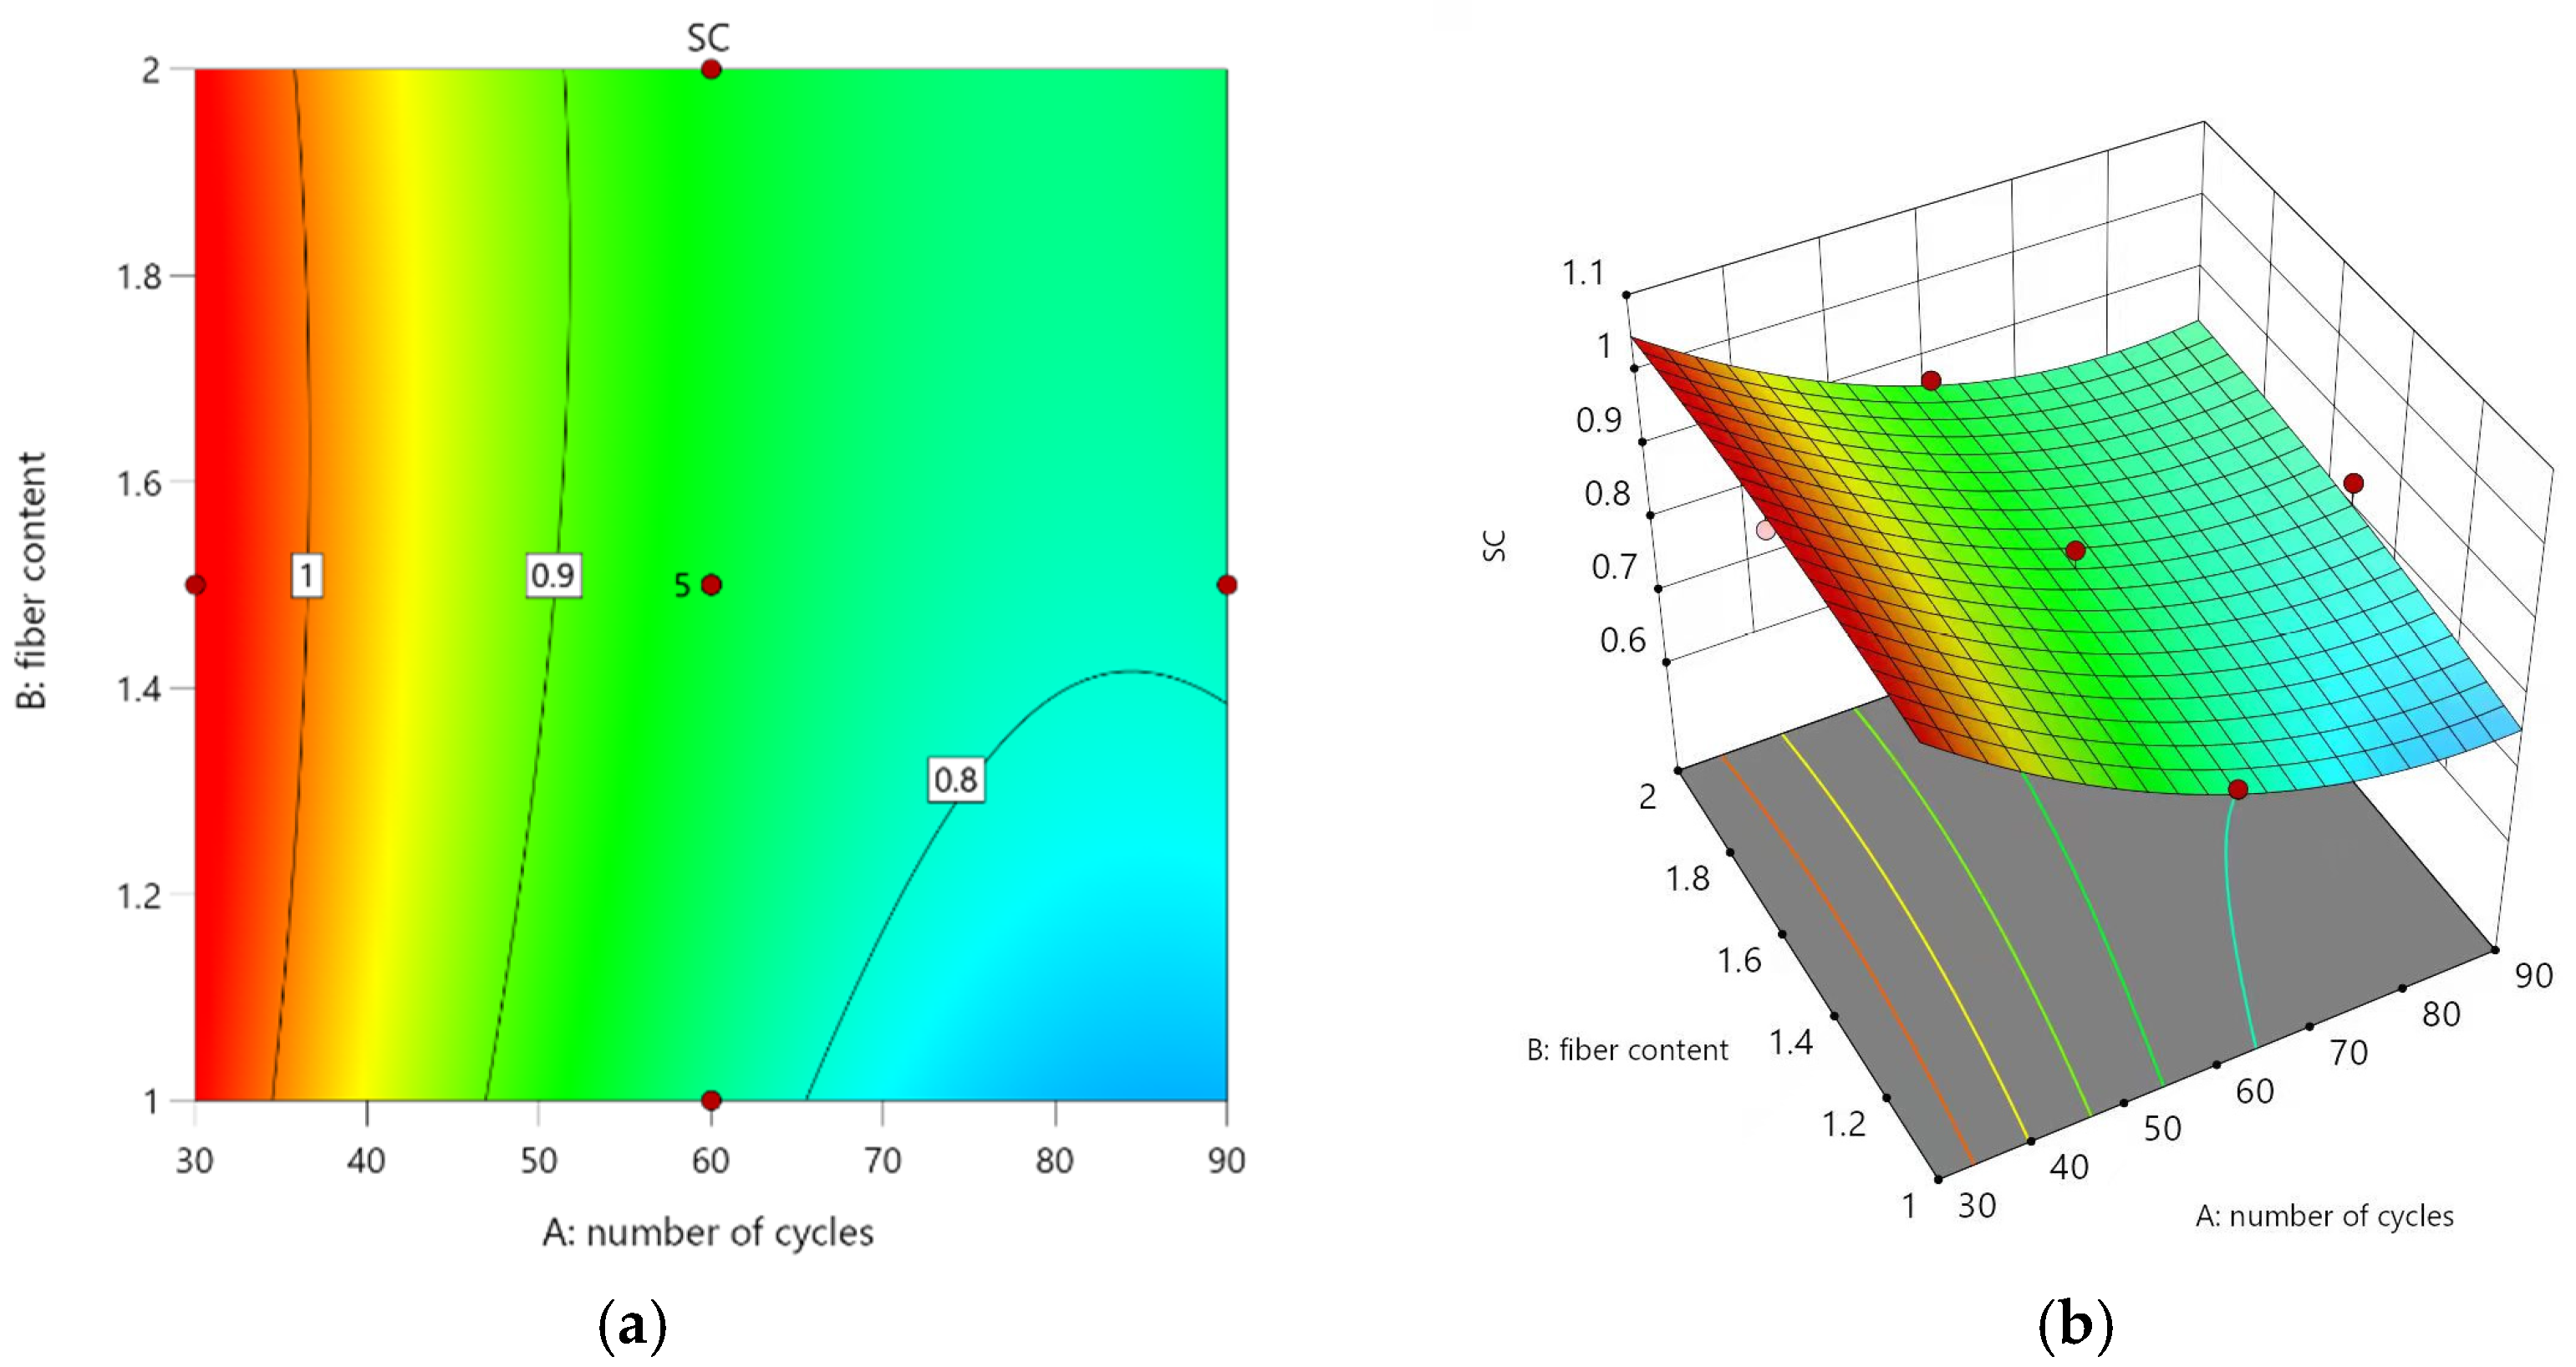
Figure 11a presents contour plots, depicting S c versus the number of dry–wet cycles and stainless steel fiber content, along with a three-dimensional response surface plot 11b ased on Equation (4). The density of the contour lines in 11a reveals that the vertical coordinate representing stainless steel fiber content is less densely populated than the horizontal coordinate denoting dry–wet cycle count, indicating that the influence of stainless steel fiber content on S c is comparatively less significant than that of dry–wet cycle count.
In 11b, the three-dimensional response surface can be described as follows: When the fixed number of dry–wet cycles is considered, an increase in stainless steel fiber content leads to a sustained upward trend in SSFRAC’s S c . This observation suggests that within the 1%–2% range, higher fiber content results in enhanced compressive strength due to the bridge-like action of fibers, which inhibits the formation and expansion of macroscopic cracks. Conversely, when maintaining constant fiber content, an increase in dry–wet cycles causes a continuous decline in SSFRAC’s S c , indicating that an increased number of dry–wet cycles weakens SSFRAC’s resistance to pressure.
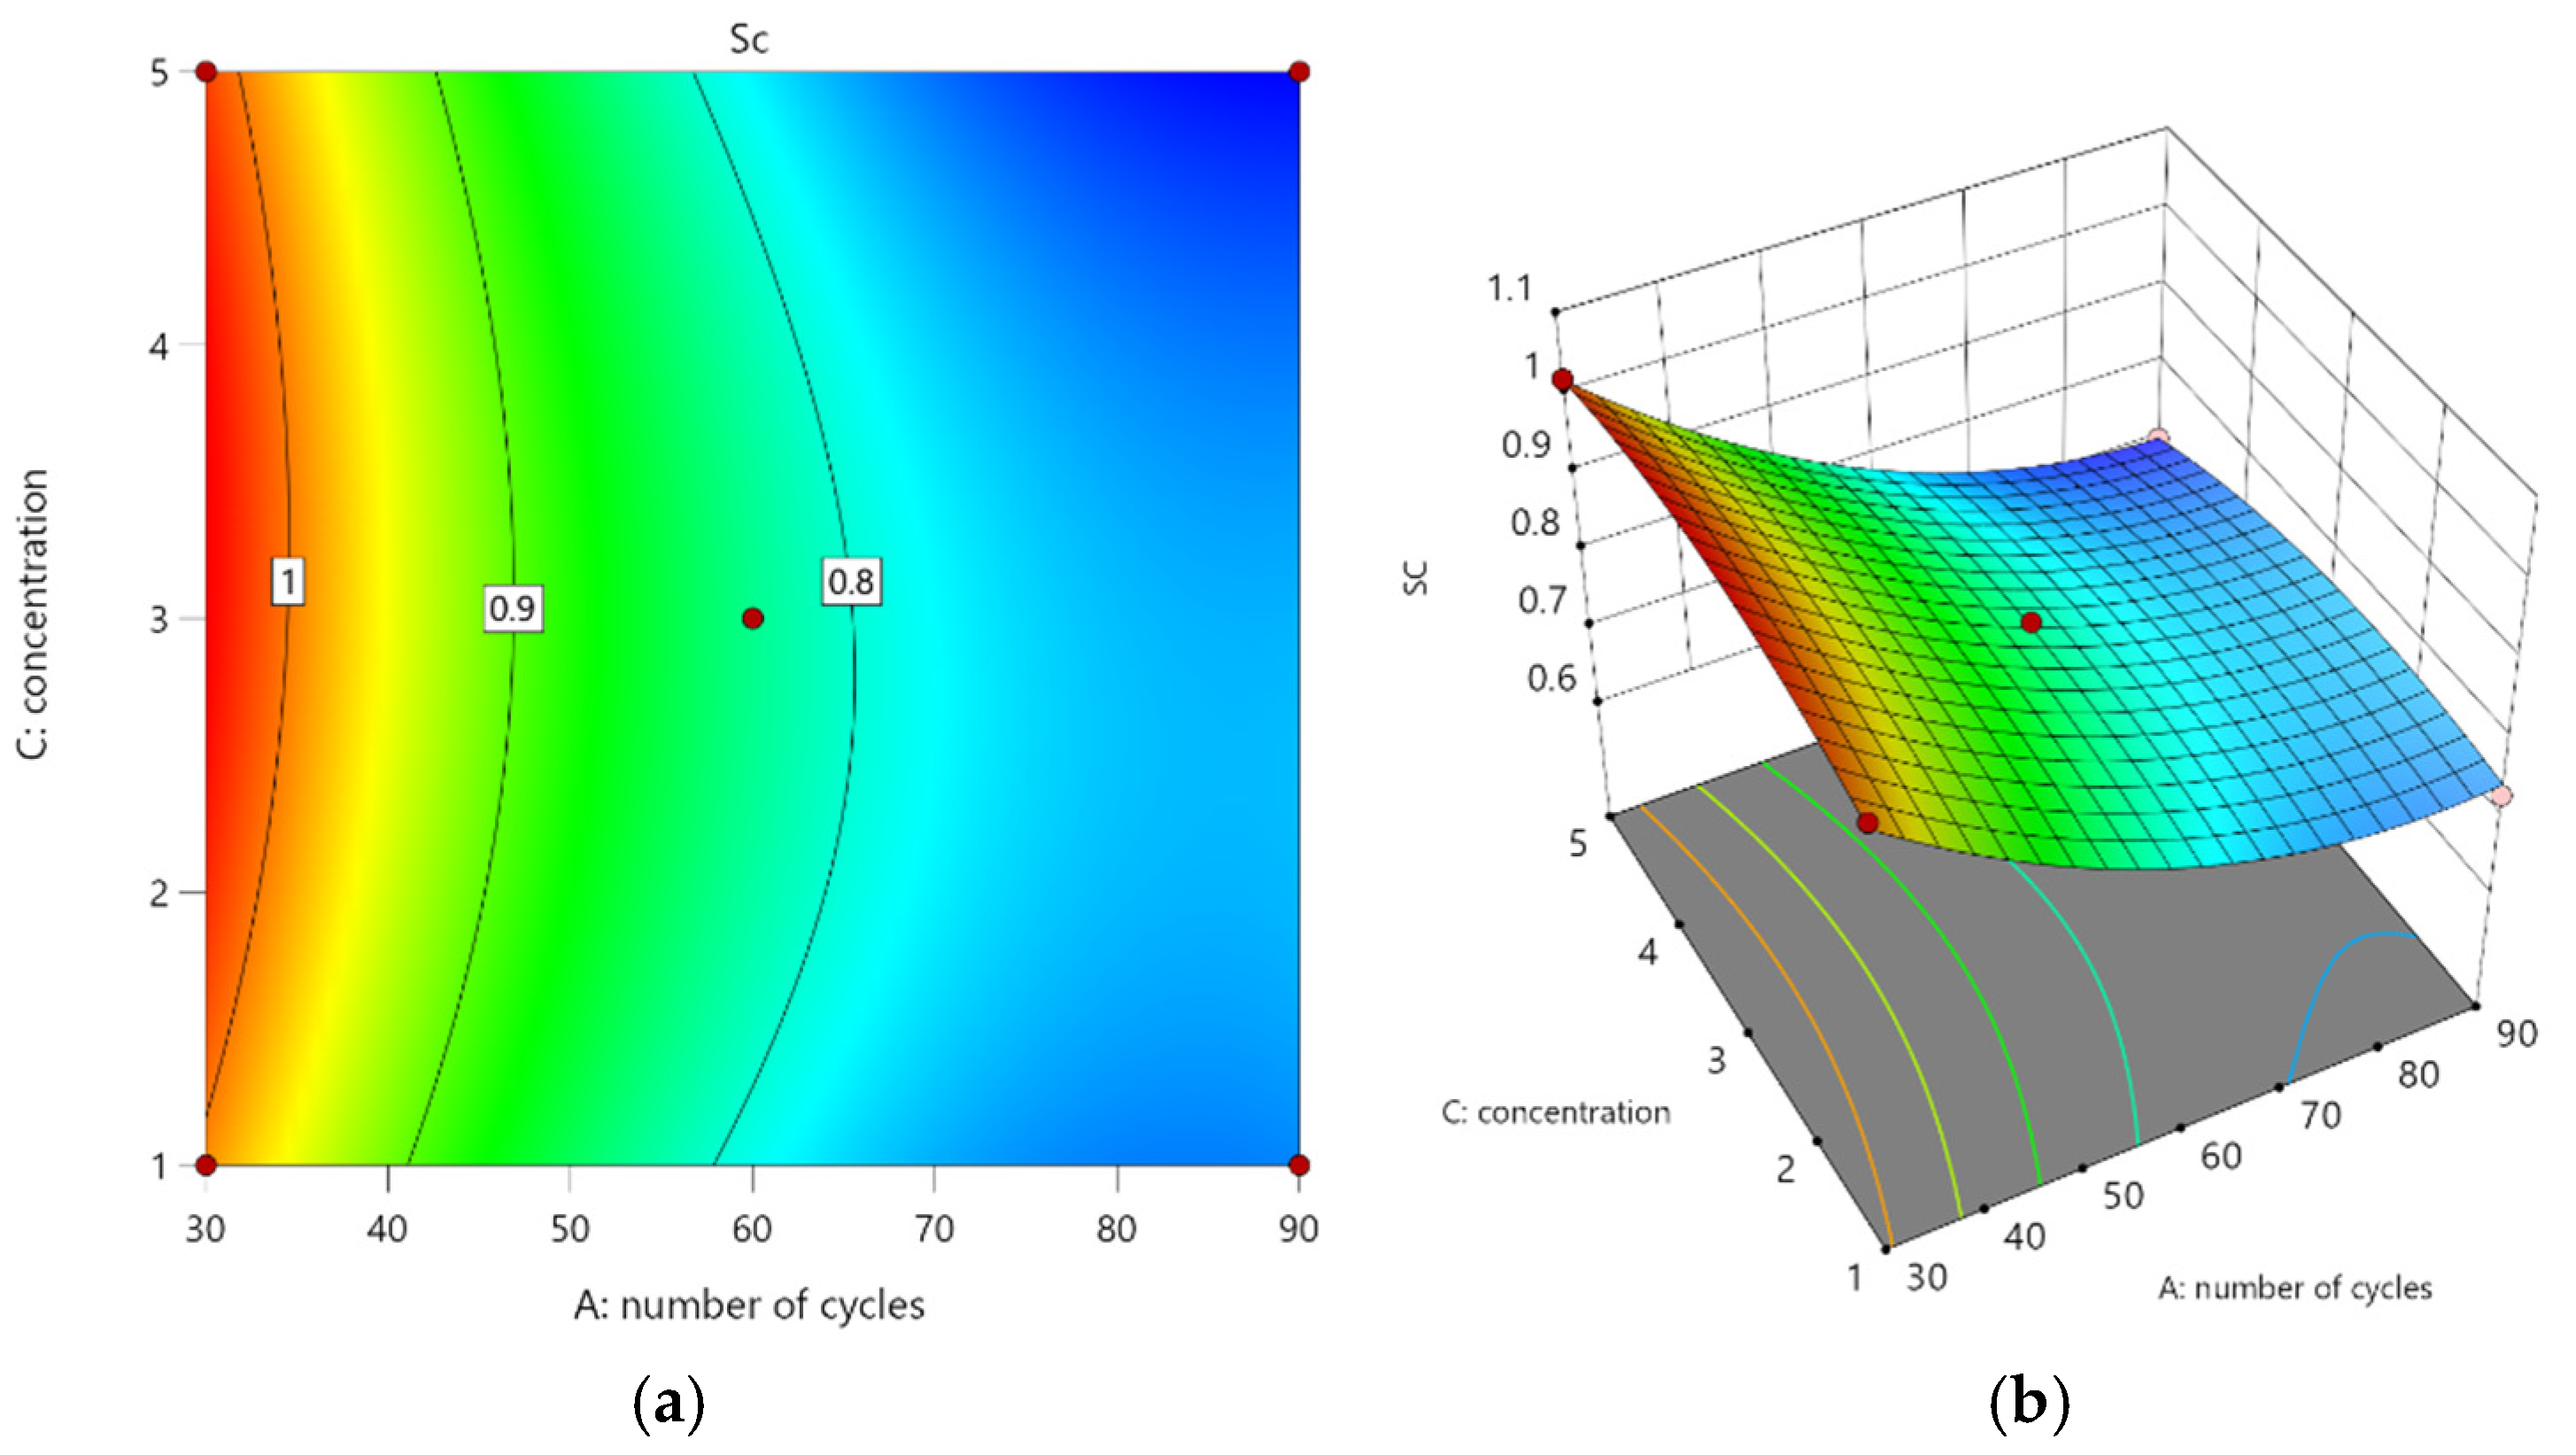
Figure 12a presents contour maps, depicting S c concerning the number of dry–wet cycles and Na2SO4 concentration, along with a three-dimensional response surface plot Figure 12b based on Equation (4). The density of the contour lines in Figure 12a reveals that the Na2SO4 concentration contour lines are less dense than those representing dry–wet cycles, indicating that the influence of Na2SO4 concentration on S c is comparatively less significant than that of dry–wet cycles.
In 12b, the three-dimensional response surface can be described as follows: The increase in the concentration of Na2SO4 solution is related to the increase in the number of cycles, leading to a declining trend in S c . This indicates that as the cycle progresses, the concrete’s salt solution attains saturation, triggering crystallization and precipitation. Subsequently, this mechanism exacerbates erosion on the concrete surface and results in a significant reduction in SSFRAC’s compressive strength.
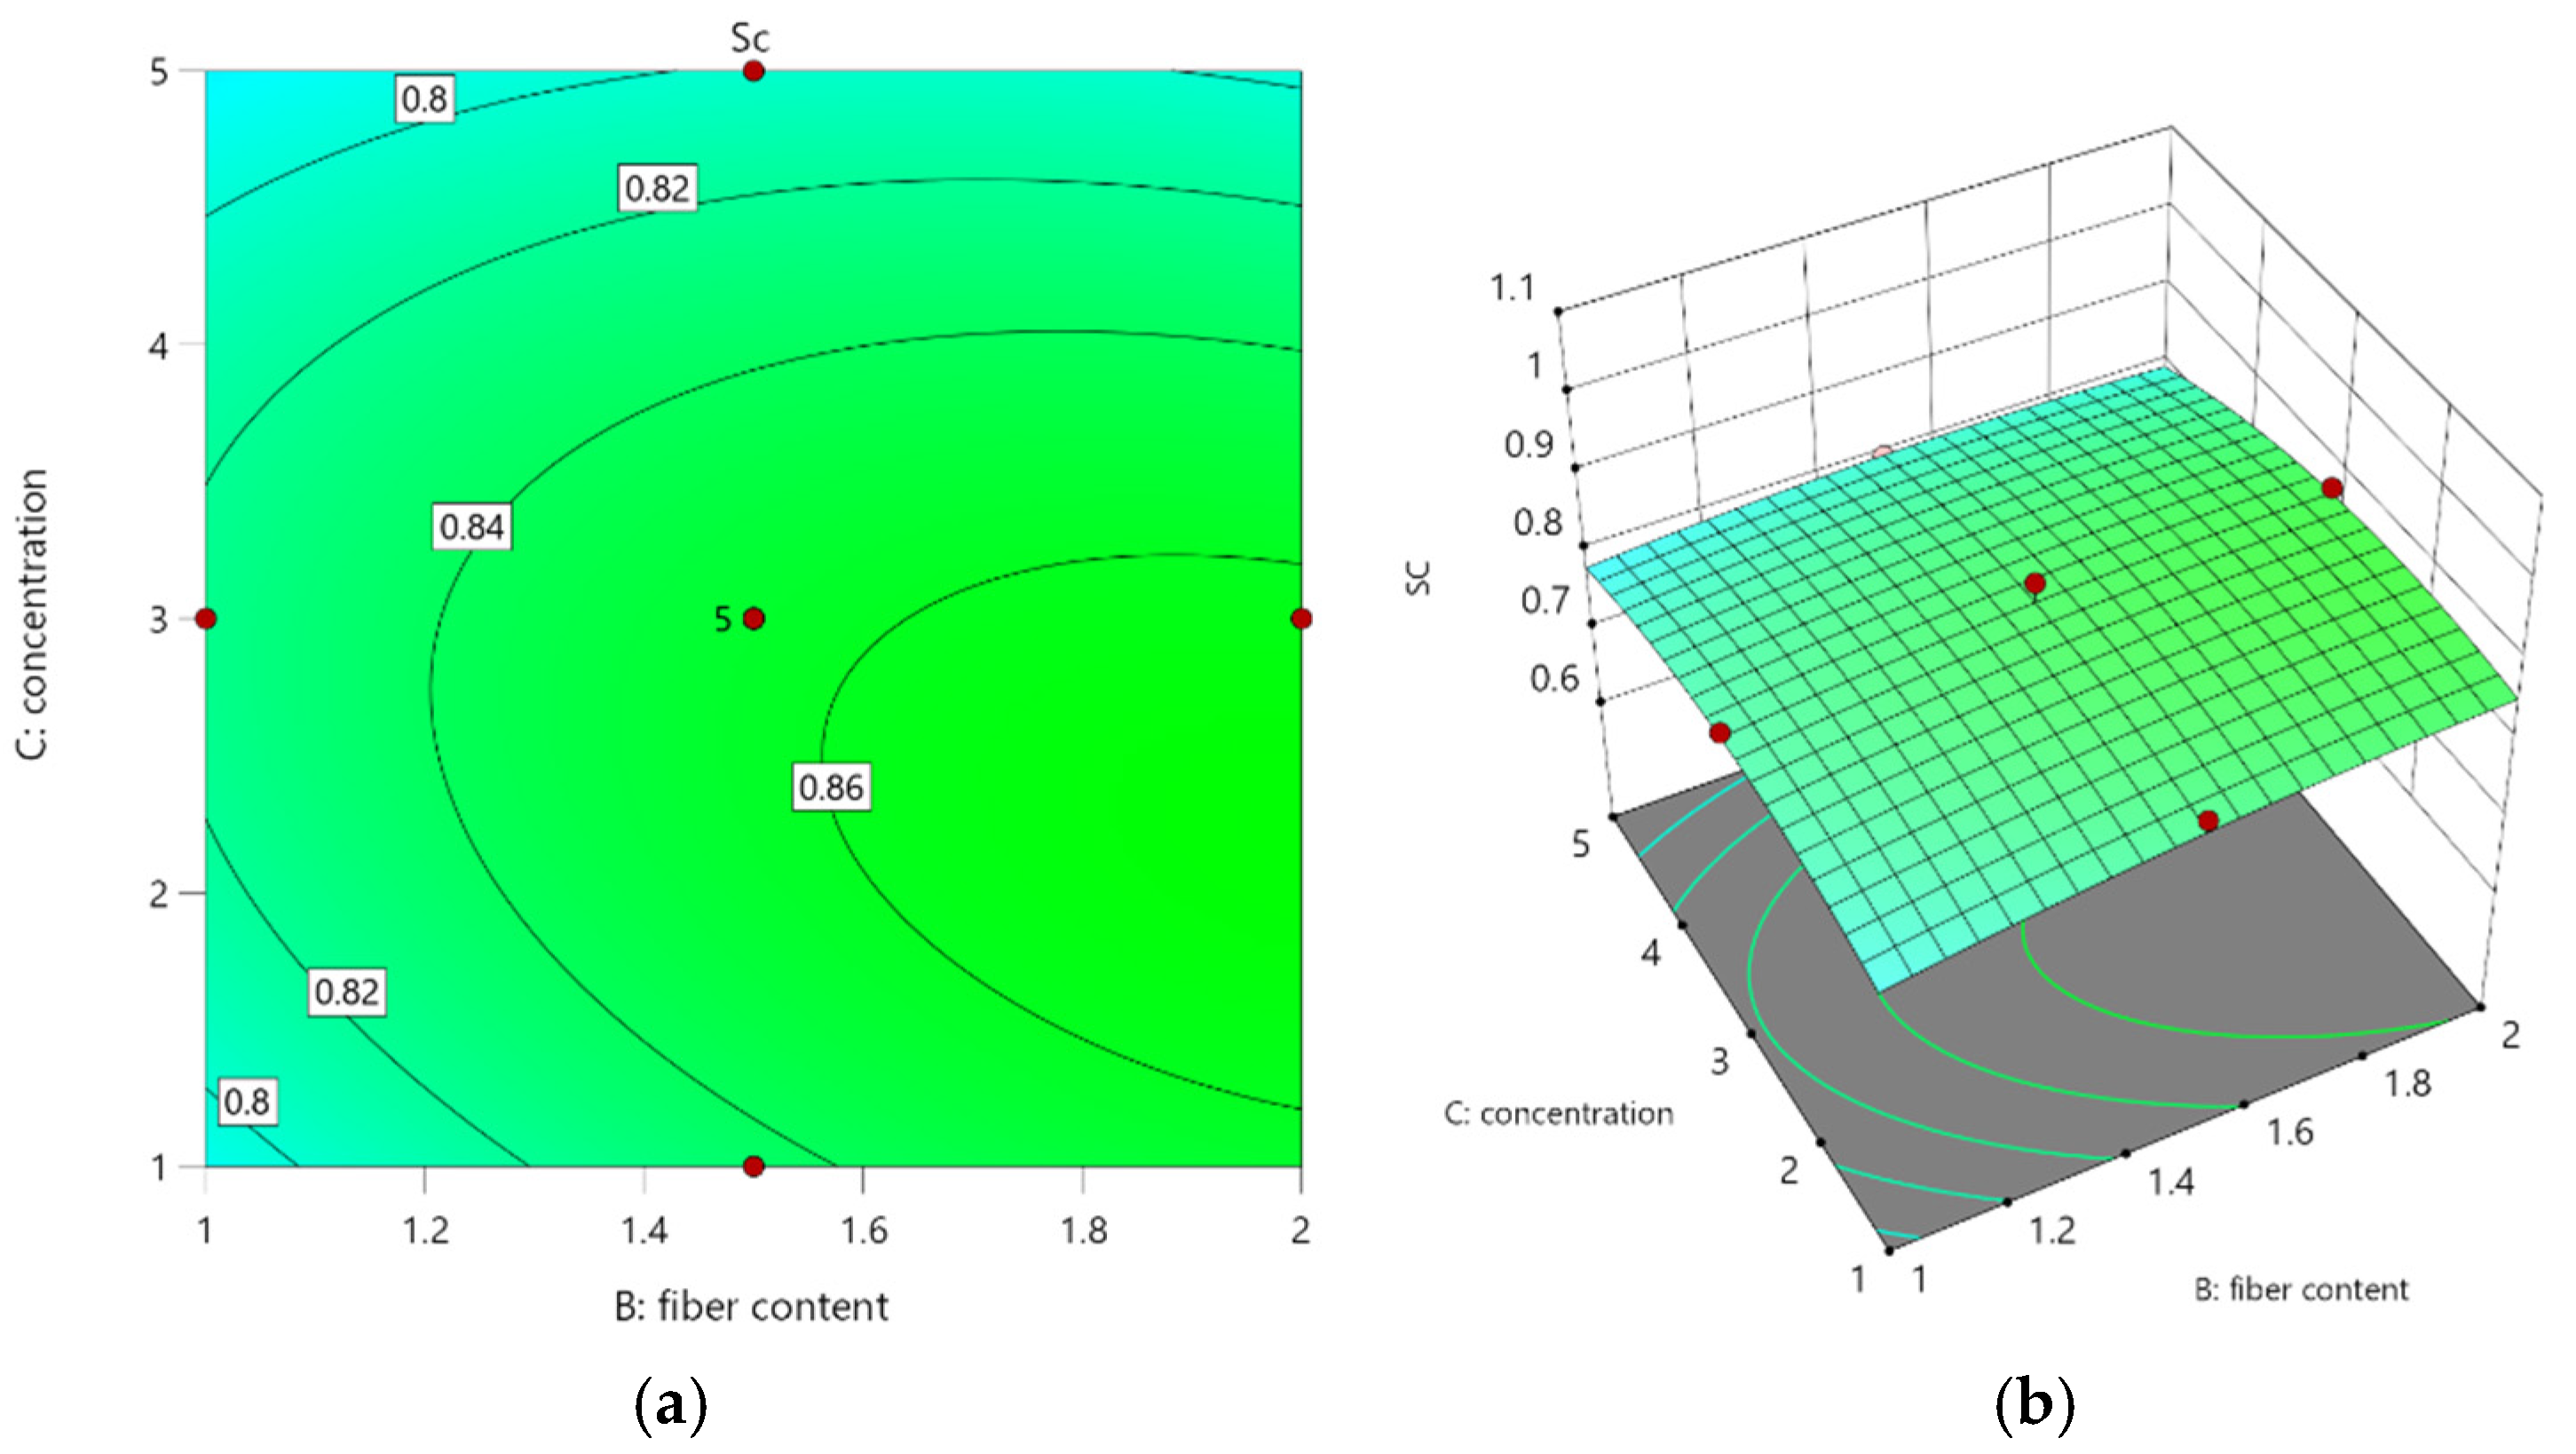
Figure 13 displays contour plots and 3D response surfaces of S c concerning stainless steel fiber content and Na2SO4 concentration based on Equation (4). The figure illustrates that the contour lines representing fiber content on the horizontal axis in Figure 13a are less dense than those depicting Na2SO4 concentration on the vertical axis, suggesting that the impact of fiber content on S c is comparatively less significant than that of Na2SO4 concentration. In Figure 13b, the 3D response surface can be described as follows:
When the Na2SO4 concentration remains constant, the trend of SSFRAC’s S c consistently rises with increasing stainless steel fiber content, suggesting that within the 1%–2% range, higher fiber content leads to improved pressure resistance. Conversely, when the fiber content is held constant, the trend of SSFRAC’s S c declines with increasing Na2SO4 concentration, indicating that higher Na2SO4 concentrations result in reduced pressure resistance for SSFRAC.

6.2. Influences of Various Factors and Their Interaction on S f

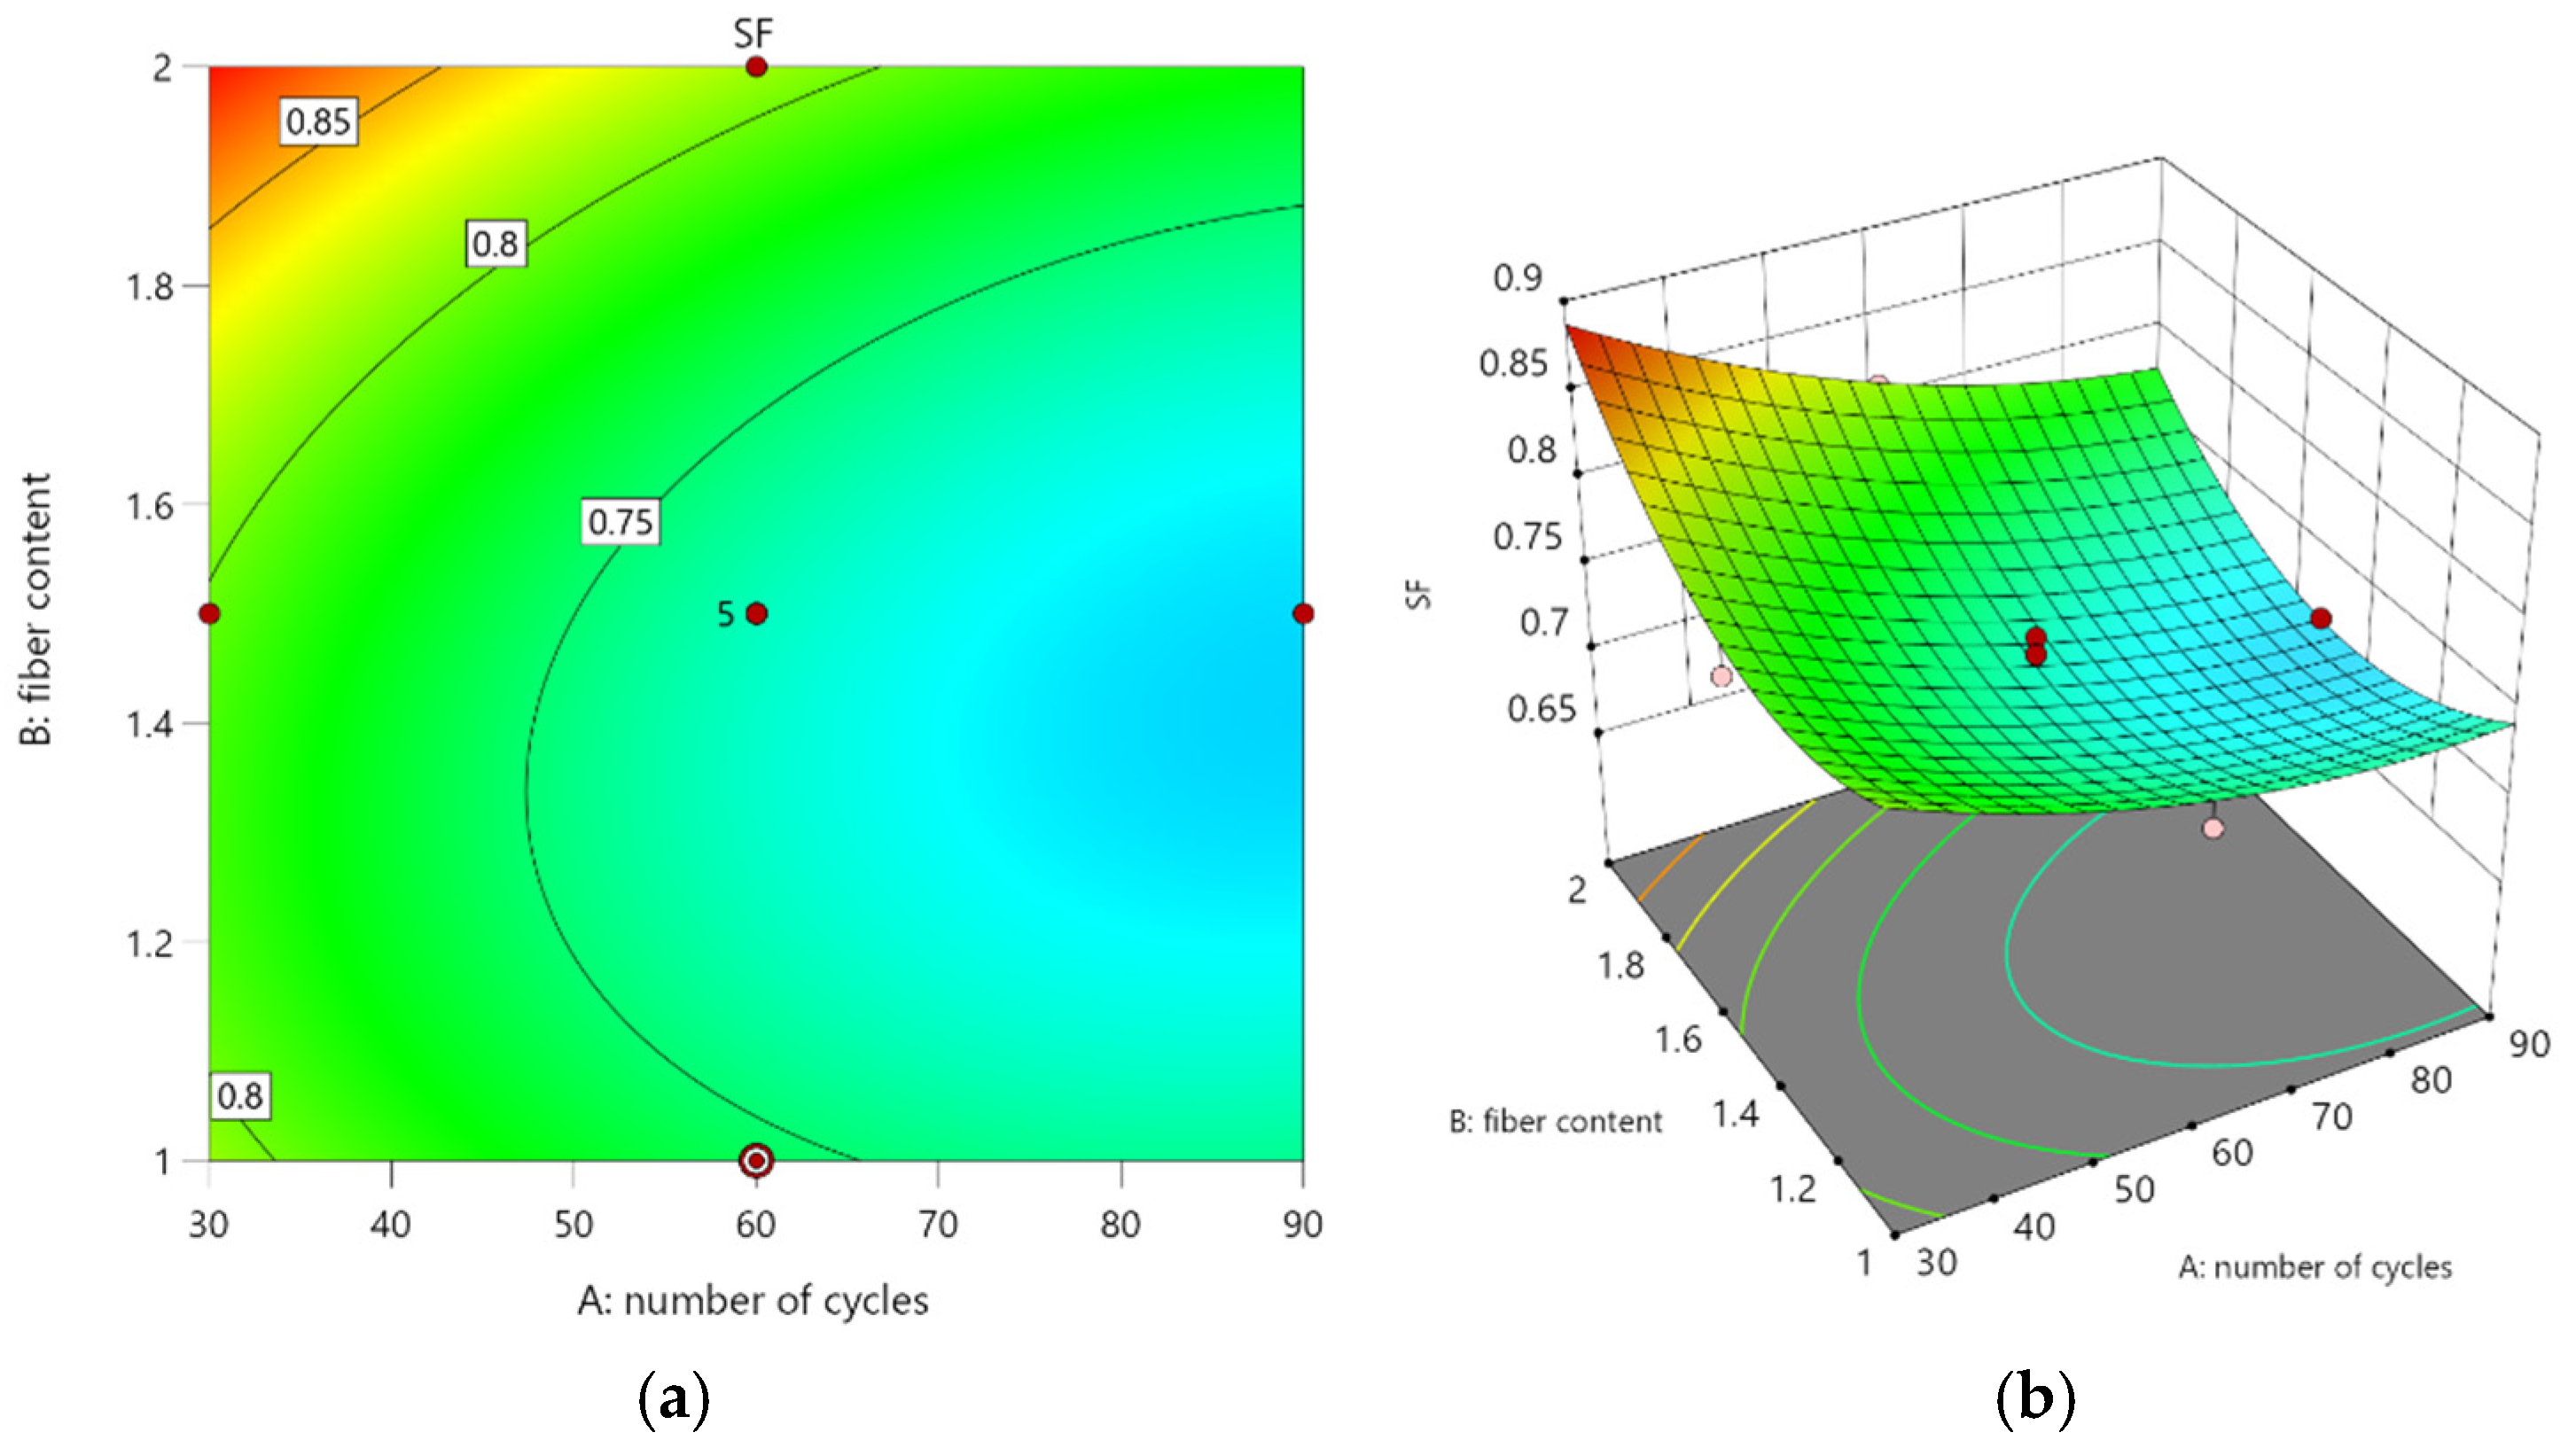
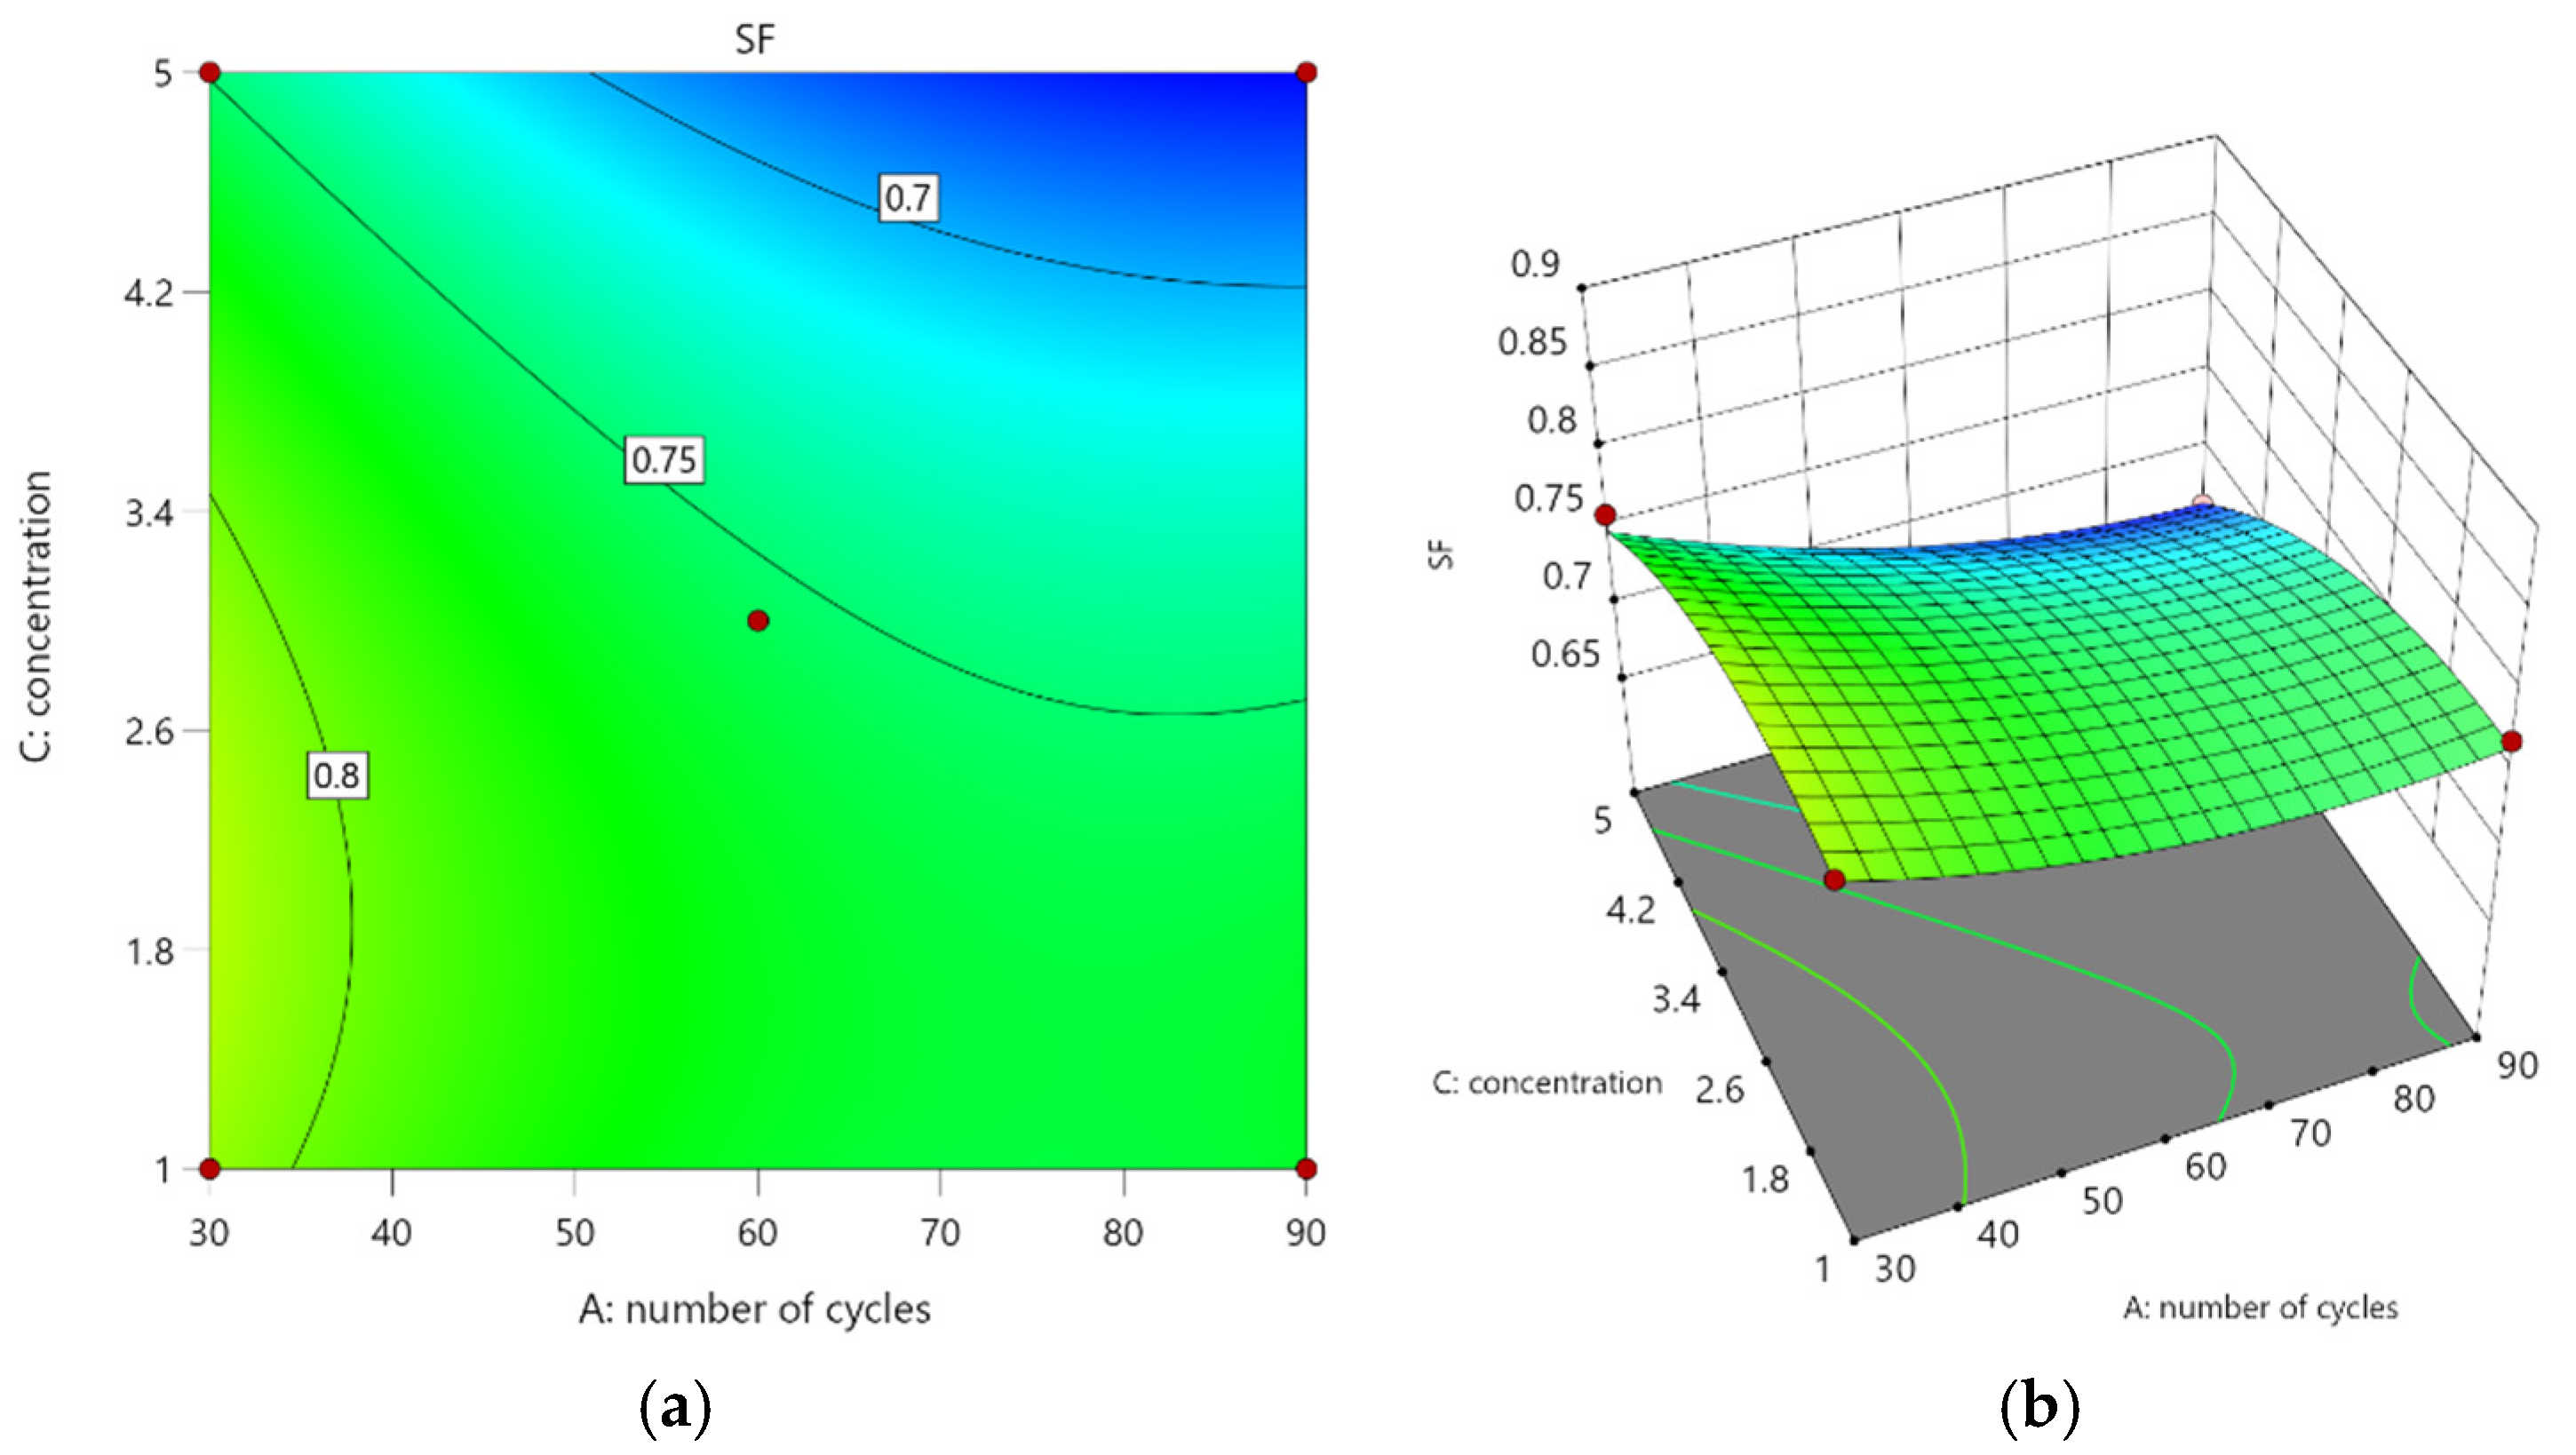
Figure 14a presents contour plot, illustrating S f concerning the number of dry–wet cycles and stainless steel fiber content, along with a three-dimensional response surface plot Figure 14b based on Equation (5). The density of the contour lines in Figure 14a reveals that the vertical coordinate representing fiber content is more densely packed than the horizontal coordinate depicting dry–wet cycle count, indicating that the influence of fiber content on S f is more significant than that of dry–wet cycle count. In Figure 14b, a concave three-dimensional response surface is depicted, which can be described as follows:
When the number of dry–wet cycles is held constant, the trend of S f consistently rises with increasing stainless steel fiber content, suggesting that higher fiber content within the 1%–2% range leads to improved bending resistance. Conversely, when the fiber content is kept constant, the trend of S f declines with increasing dry–wet cycle count, indicating that a greater number of dry–wet cycles results in reduced bending resistance.
Figure 15a presents contour plot illustrating S f concerning the number of dry–wet cycles and Na2SO4 concentration, along with a three-dimensional response surface plot Figure 15b based on Equation (5). The density of the contour lines in Figure 15a reveals that the Na2SO4 concentration contour lines are more densely packed than the dry–wet cycle contour lines, indicating that the influence of Na2SO4 concentration on S f is more significant than the number of dry–wet cycles. In Figure 15b, a concave three-dimensional response surface is depicted, which can be described as follows:
When the Na2SO4 concentration remains constant, the three-dimensional response surface of S f exhibits a decreasing trend with an increase in dry–wet cycling times, indicating that higher dry–wet cycling times lead to reduced bending resistance for SSFRAC. Conversely, when the number of dry–wet cycling times is held constant, the three-dimensional response surface of S f demonstrates an initial upward trend followed by a downward trend with increasing Na2SO4 solution concentration. This suggests that during the secondary hydration stage, Na2SO4 accelerates the generation of hydration products, filling pores and compacting the internal structure of SSFRAC while enhancing its strength. However, as the concentration of Na2SO4 increases, concrete’s internal salt solution easily reaches saturation and crystallizes; subsequently eroding surface crystals further degrade concrete. Therefore, an increase in Na2SO4 concentration results in decreased flexural strength for SSFRAC.
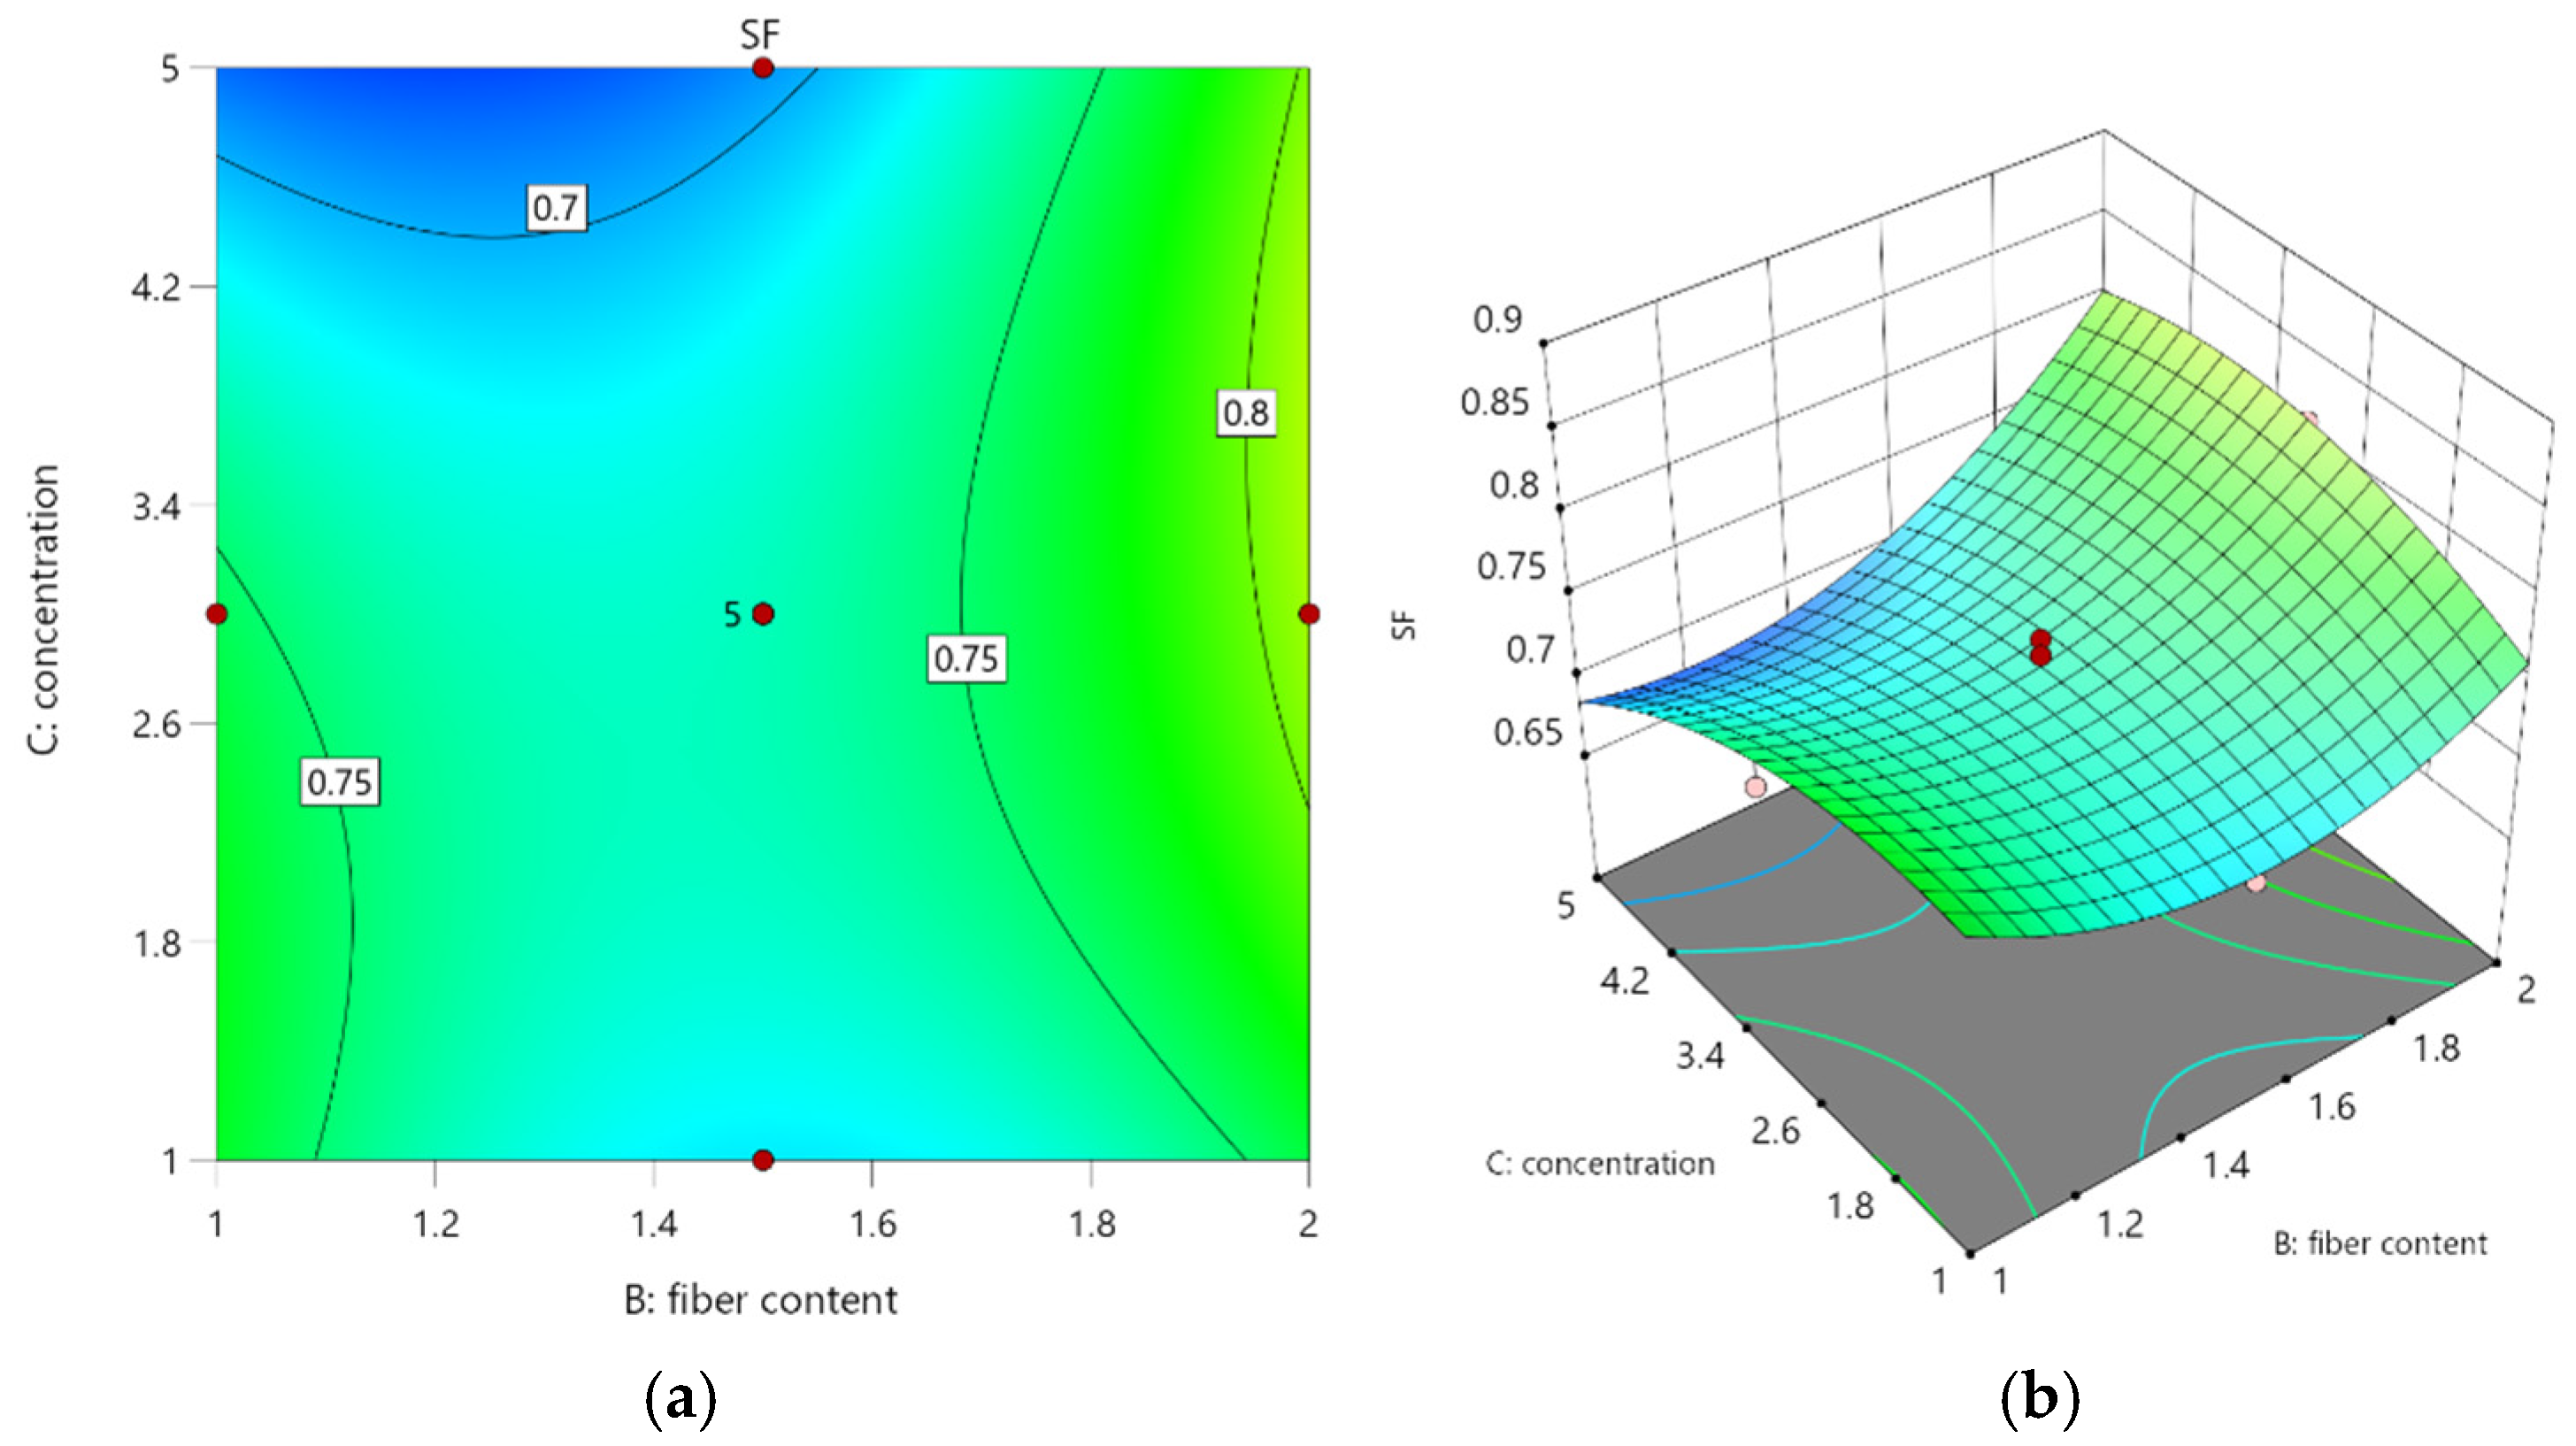
Figure 16 depicts a contour plot and a 3D response surface plot of S f as a function of stainless steel fiber content and Na2SO4 concentration, derived from Equation (5). The density of contour lines in Figure 16a’s horizontal axis, representing the fiber content, closely mirrors that in the vertical axis, which signifies the Na2SO4 concentration. This observation suggests that both factors exert a comparable influence on S f when assessing its performance. In Figure 16b, the 3D response surface is presented as follows:
When a small amount of Na2SO4 solution is added and the concentration of Na2SO4 solution is 1%, the S f curve exhibits a gradual increase with rising stainless steel fiber content. However, as the concentration of Na2SO4 solution increases, the curve demonstrates an upward trend that is more pronounced than at lower concentrations, indicating that an appropriate Na2SO4 concentration can synergistically enhance the effect of stainless steel fiber content.

6.3. Corrosion of SSFRAC by Na2SO4

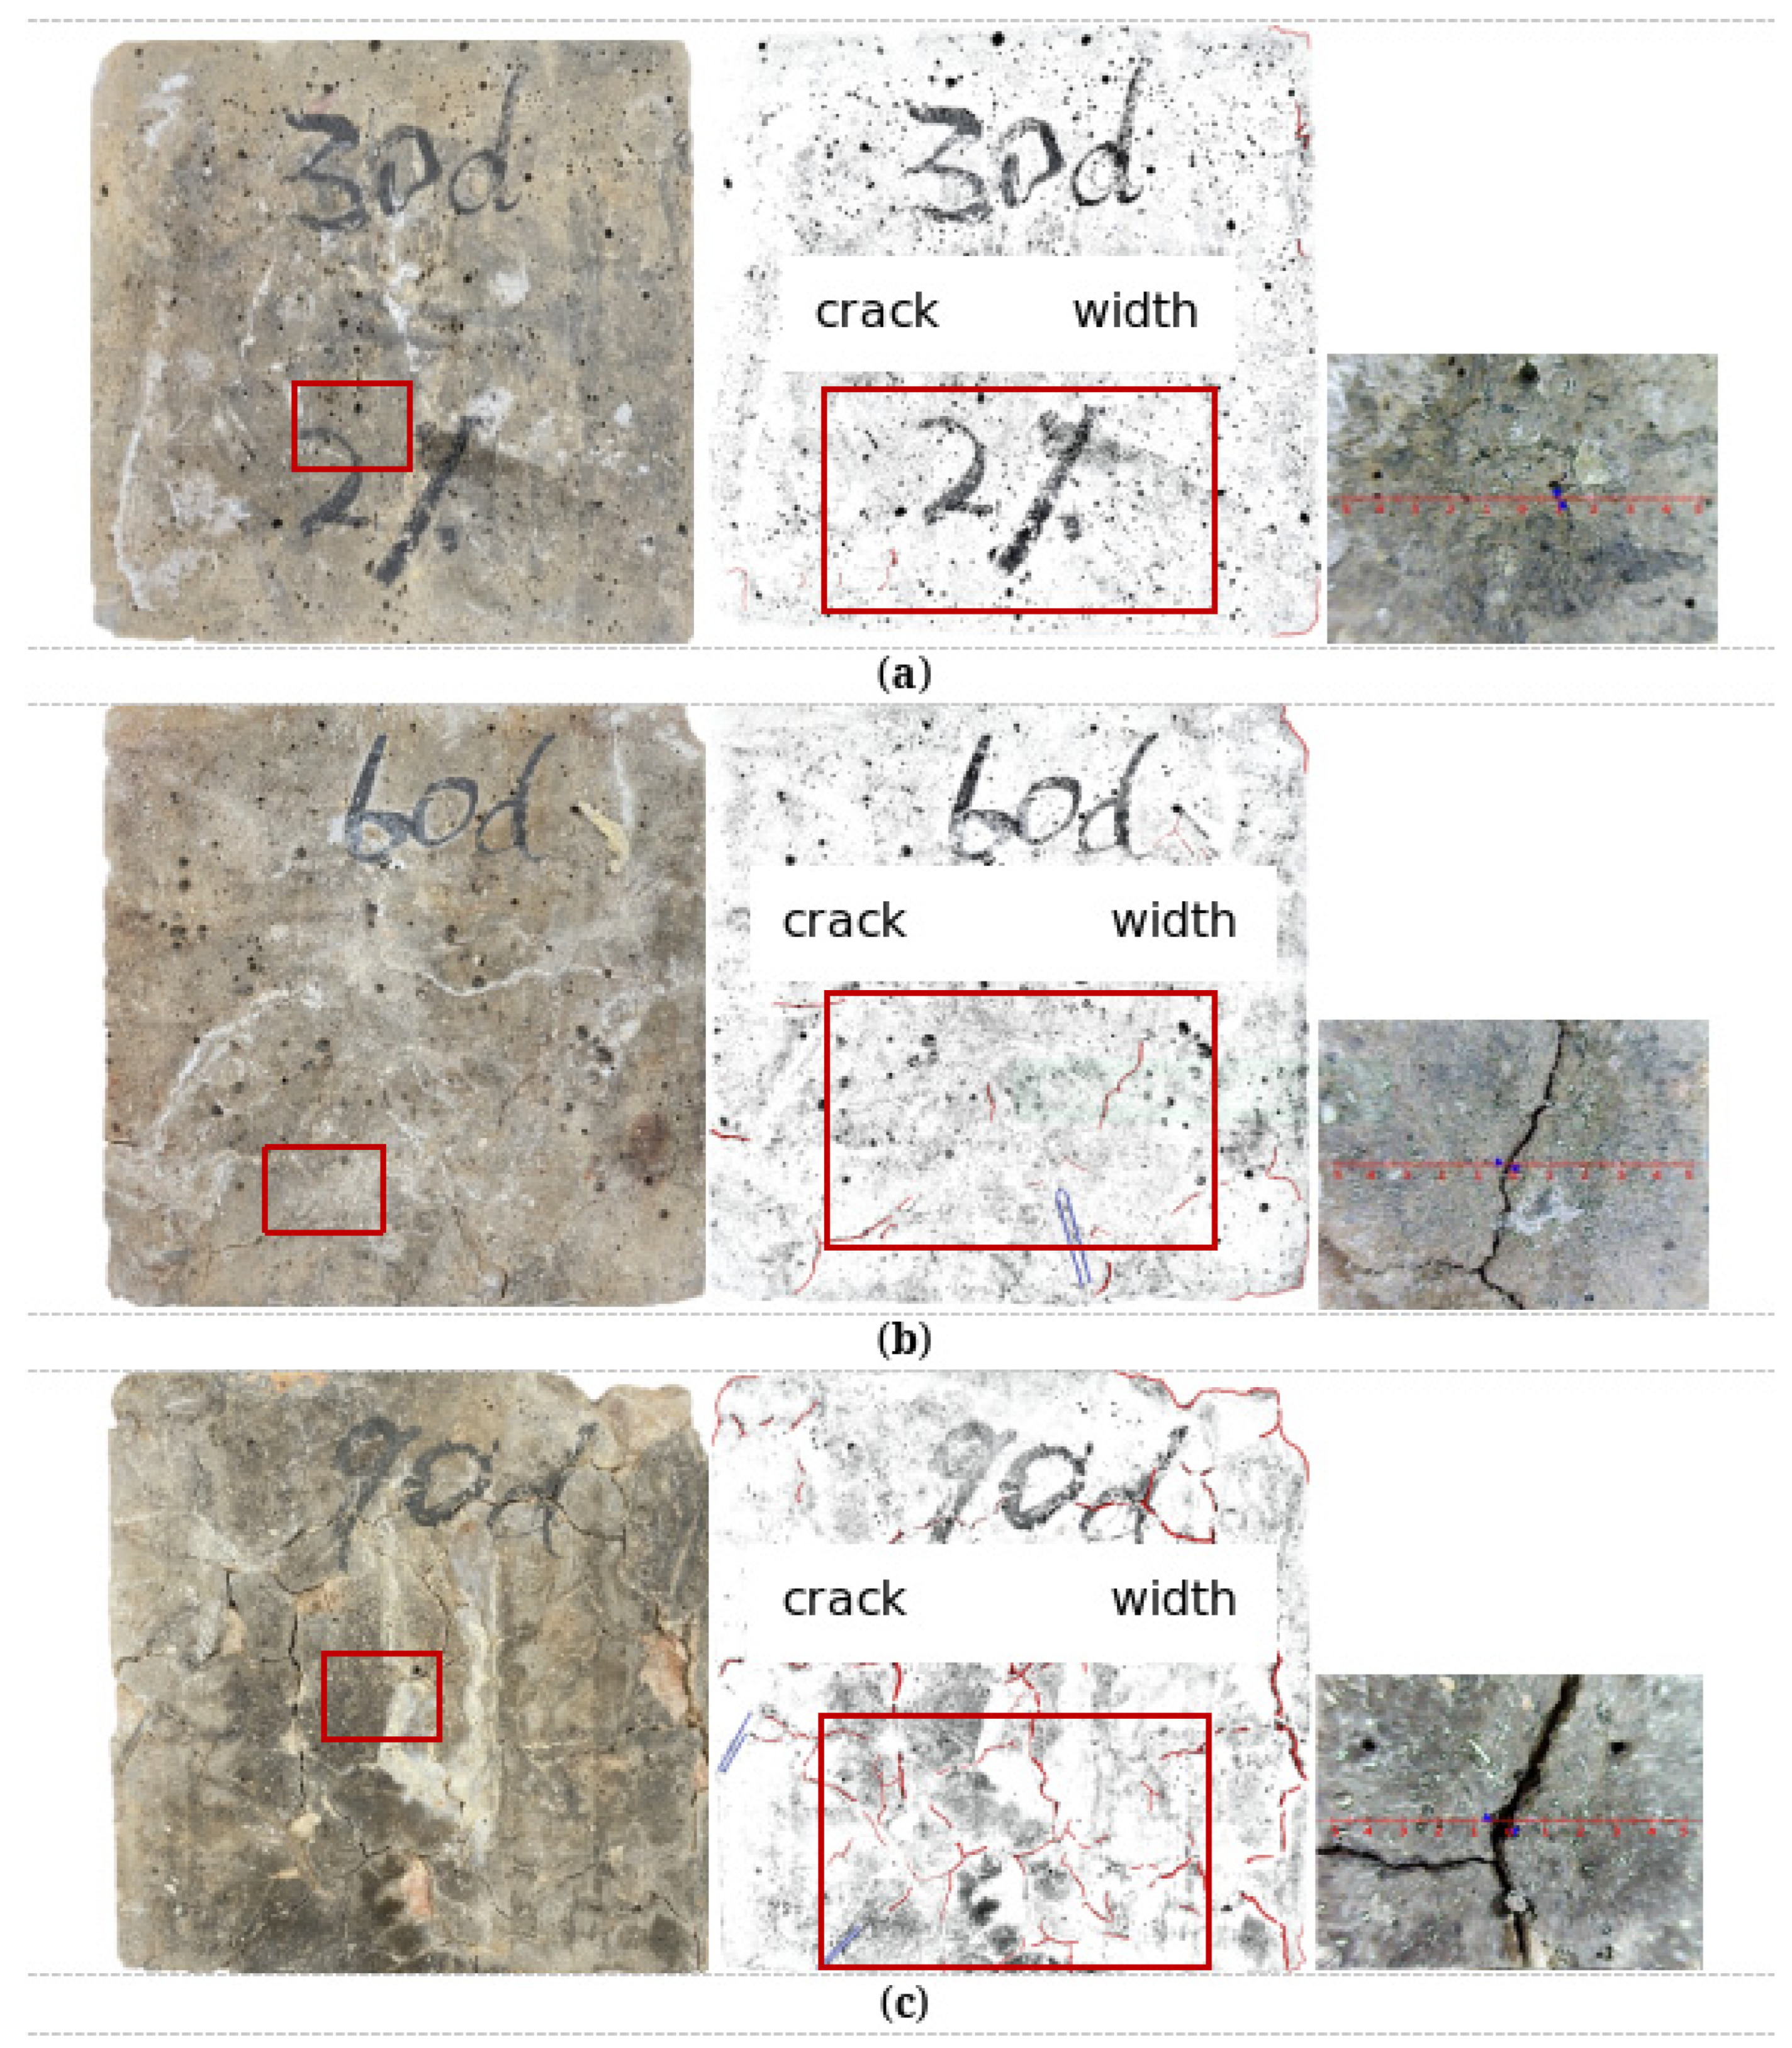
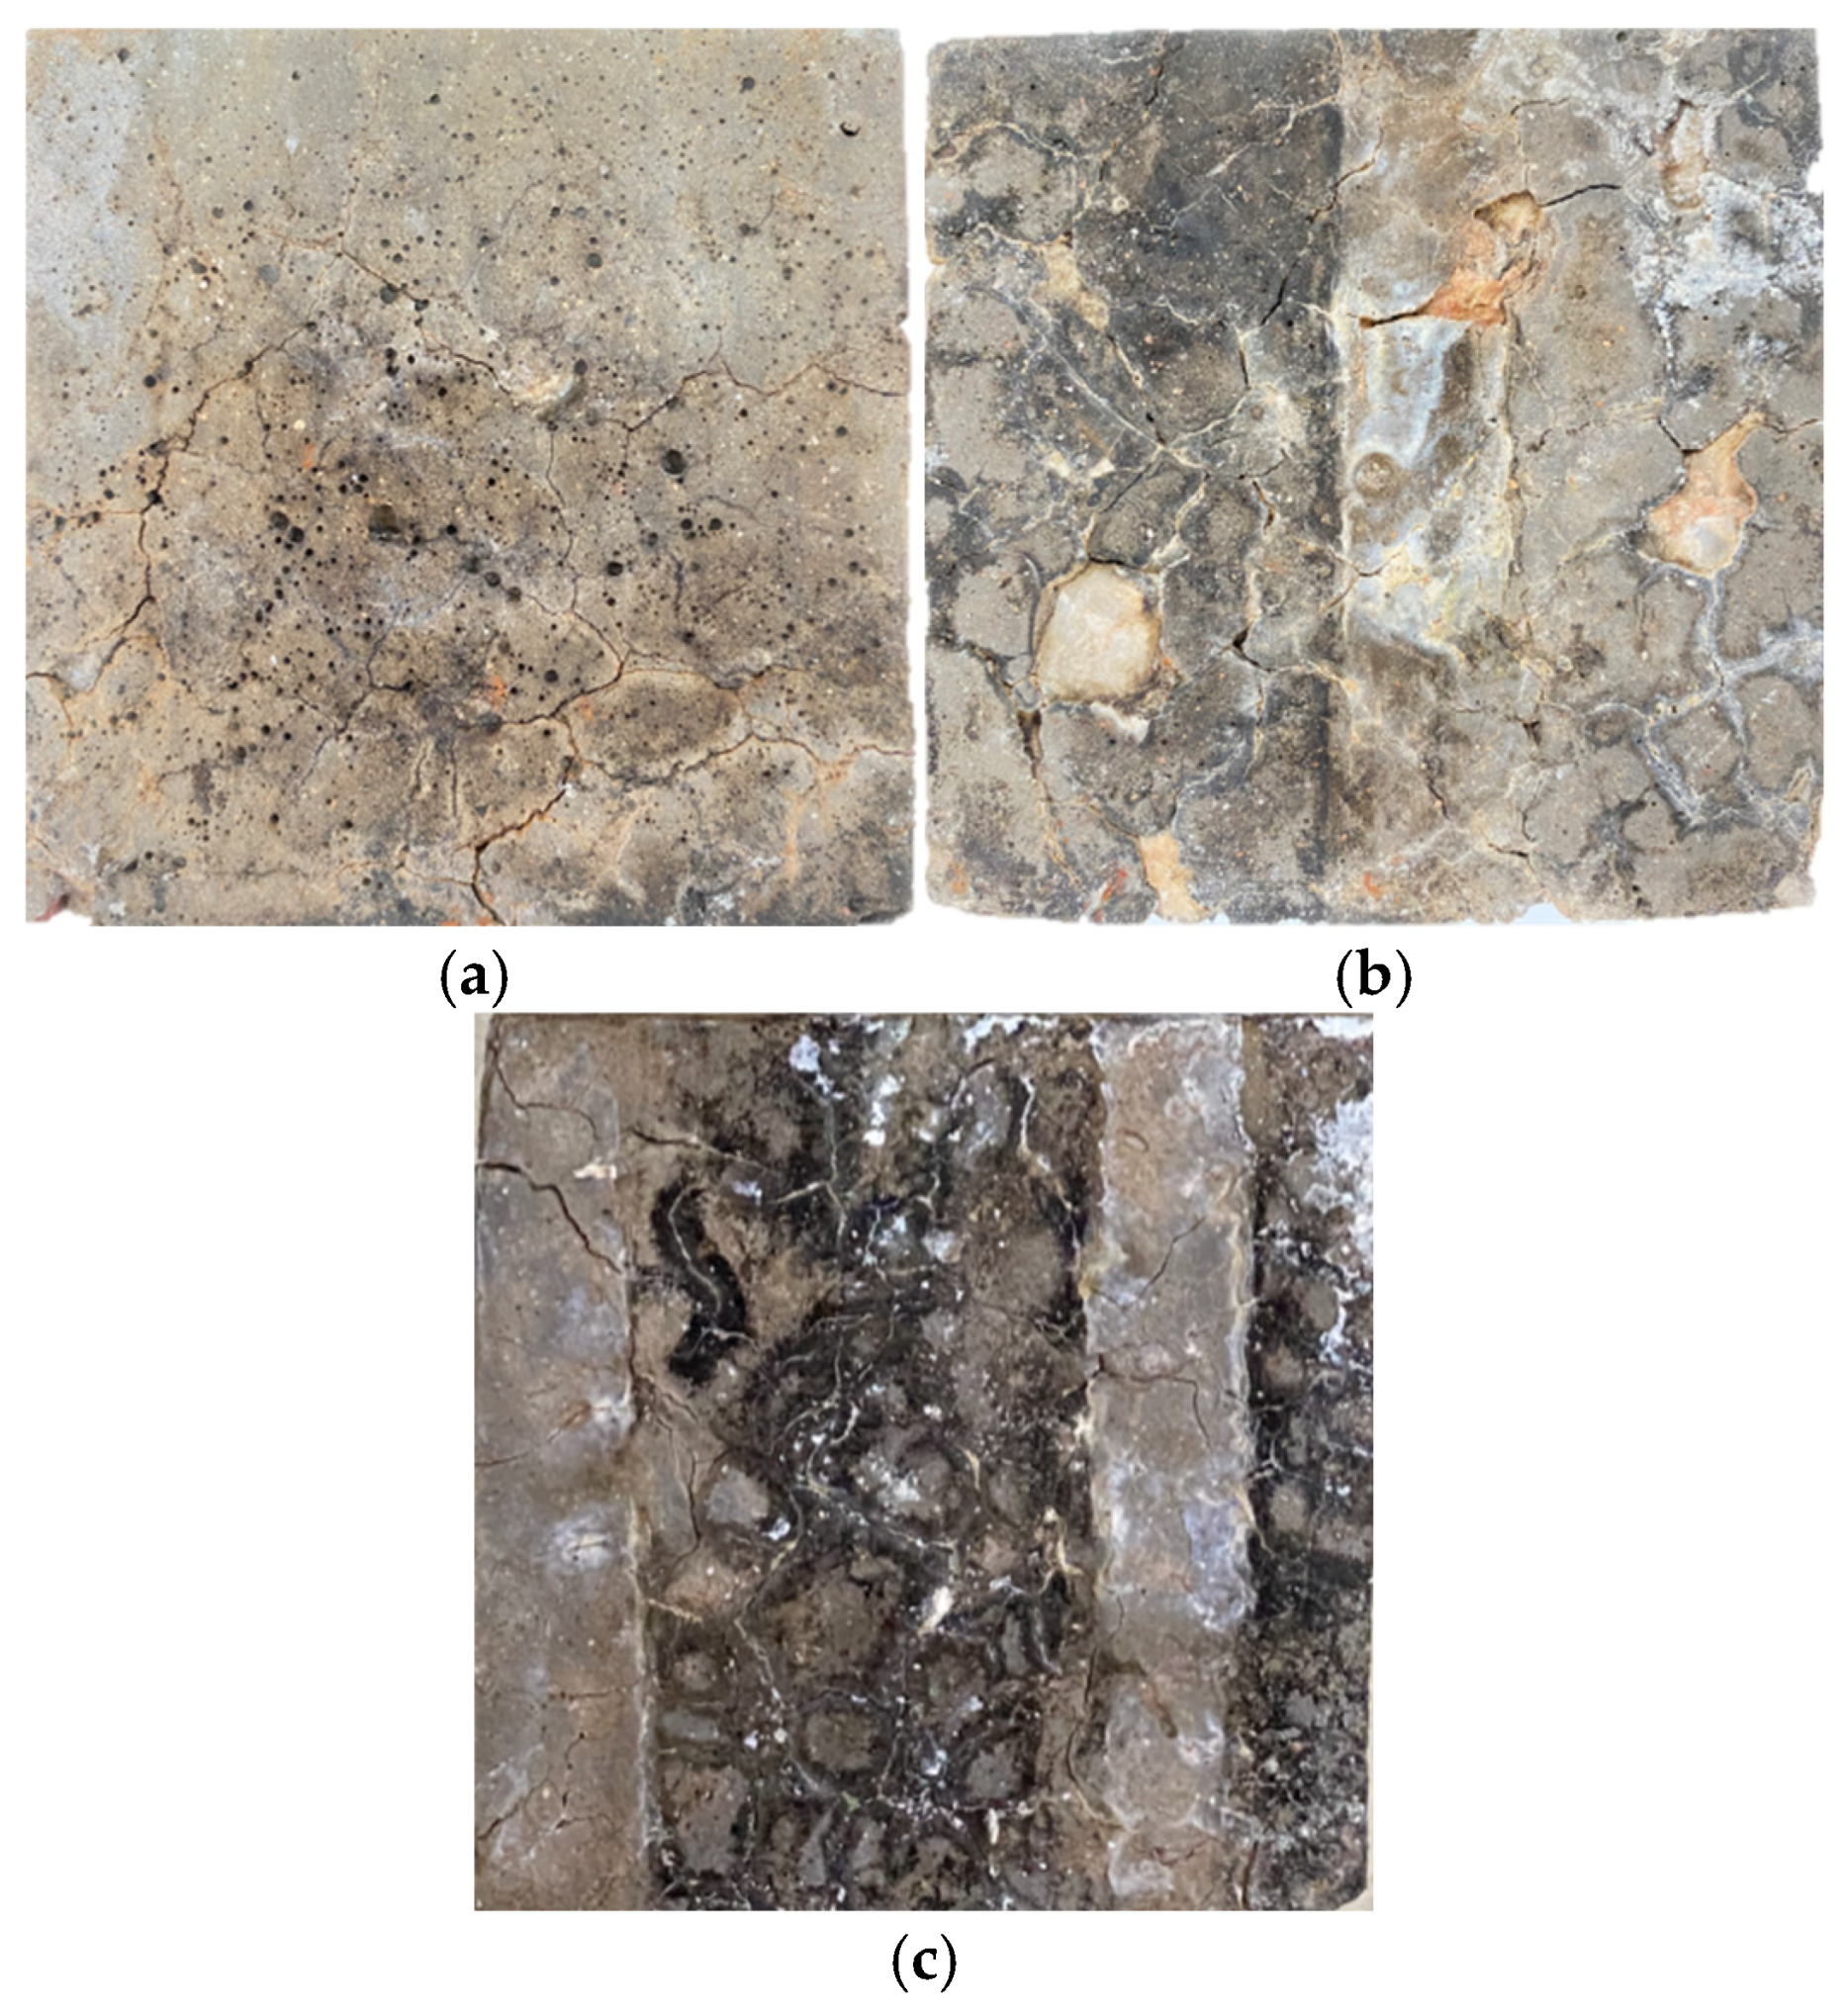
Figure 17 illustrates the observed alterations in the test specimens under a 5% Na2SO4 concentration, 2% stainless steel fiber content, and dry–wet cycling for 30, 60, and 90 cycles. The cracks were detected using PS and depicted. It is evident that with an increase in the number of dry–wet cycles from Figure 17a–c, there is a corresponding escalation in both the quantity and width of cracks on the specimen surface. Utilizing the KS-105 wireless crack width gauge alongside advanced electronic imaging technology, the original state of the specimen surface was displayed on a tablet screen, enabling automatic measurement of crack widths using a high-precision ruler. The measured crack widths on the specimen surface after 90 dry–wet cycles were found to be 0.49 mm; after 60 cycles they were recorded at 0.23 mm, while after just 30 cycles they measured only at 0.03 mm. There is a varying degree of precipitation on the surface, indicating a violent chemical reaction within the concrete. The hydration product Ca(OH)2 reacts with Na2SO4 solution to form gypsum, leading to the gradual formation of cracks in both the interior and surface of the concrete. As dry–wet cycling times increase, crack width and connectivity continue to expand, accompanied by precipitation of gypsum crystals that reduce bonding material between aggregates. Visible cracks can be observed on aggregate surfaces as well. At this stage, the bending resistance of the test piece decreases. Furthermore, higher stainless steel fiber content results in more internal pores and faster deterioration, explaining why higher stainless steel fiber content leads to faster decline compared to lower content. Figure 18 illustrates apparent changes in test pieces after 90 dry–wet cycles with 2% stainless steel fiber content and Na2SO4 concentrations at 1%, 3%, and 5%. From Figure 17c, it is evident that at a Na2SO4 concentration of 5%, there is increased precipitation and more pronounced deterioration on the test piece surface.

6.4. Theoretical Analysis of Na2SO4 for SSFRAC

Sulfate attack primarily involves two stages: the initial stage occurs when sulfate ions infiltrate SSFRAC and react with the hydration products of cement, Ca(OH)2, to form gypsum, which fills the pores within SSFRAC. The subsequent stage occurs as some sulfate ions penetrate further, leading to the formation of ettringite (AFt), which induces internal stress expansion upon contact with the pore wall. Once this internal stress expansion reaches the tensile strength of concrete aggregate, microcracks are generated, thereby facilitating salt precipitation [26,27,28,29].
In the experiment, a dark red substance was observed on the surface of the sample immersed in the solution and on the concrete specimen in the dry–wet cycling tank, indicating the presence of Fe2O3. While stainless steel fibers did not exhibit visible corrosion, microscopic corrosion products had already formed internally, with iron elements detected within these products. Equation (6) depicts the chemical reaction of sulfate ions penetrating the specimen during testing, while Equation (7) illustrates how this reaction involving Cr2O3 unique to stainless steel fibers differs from that of common steel fibers.
3 C a O · A l 2 O 3 · C a S O 4 · 12 H 2 O + 2 C a 2 + + 2 S O 4 2 + 16 H 2 3 C a O · A l 2 O 3 · 3 C a S O 4 · 32 H 2 O
C r 2 O 3 + 3 N a 2 S O 4 C r 2 ( S O 4 ) 3 + 3 H 2 O
It should be noted that the feasibility of the reaction expressed in Equation (7) is also governed by thermodynamic principles. According to reported thermodynamic data of the relevant oxides and sulfates (ΔG and ΔH values), the reaction between Cr2O3 in stainless steel fibers and sulfate ions is thermodynamically permissible under aqueous conditions. This indicates that the reaction can proceed spontaneously, although the rate may be limited by kinetic factors such as ion diffusion and local concentration gradients during dry–wet cycling. Therefore, Equation (7) is not only a hypothetical mechanism but is also supported by thermodynamic considerations, which distinguishes the corrosion resistance mechanism of stainless steel fibers from that of ordinary steel fibers.
7. Conclusions and Prospect

7.1. Conclusions

The mechanical properties of recycled concrete reinforced with stainless steel fibers were evaluated through sulfate dry–wet cyclic tests, and a three-factor two-level experiment based on RSM was designed to obtain the response values. The following conclusions were derived:
(1)
The addition of stainless steel fibers to the cementitious gel matrix effectively offsets the deficiencies in the compressive strength of RAC. The compressive strength of SSFRAC gradually increases with the increase in the fiber content, and finally stabilizes at 1.5% fiber content, Therefore, the optimal content of stainless steel fibers is 1.5%.
(2)
In the Sc model, the factors are ranked in order of significance as follows: dry–wet cycling times > Na2SO4 concentration > stainless steel fiber content. For the Sf model, the ranking is stainless steel fiber content > dry–wet cycling times > Na2SO4 concentration. The interaction between dry–wet cycling times and Na2SO4 concentration has the most significant impact on Sc, while the interaction between fiber content and Na2SO4 concentration most significantly influences Sf. These findings underscore the complex interplay between environmental conditions and material composition in hybrid gel–metal systems.
(3)
Micro-cracks induced by dry–wet cycles predominantly manifest on the concrete surface, with their abundance and width increasing with the number of cycles. This phenomenon reflects the degradation of the gel network under cyclic environmental stress, emphasizing the need for optimized metal–gel composites to enhance durability in aggressive conditions.

7.2. Prospect

The present study offers several notable strengths, including the novelty of incorporating stainless steel fibers into recycled aggregate concrete subjected to sulfate dry–wet cycling, combined with a systematic application of response surface methodology. This approach provides valuable quantitative insights into the interactive effects of fiber content, sulfate concentration, and cycling frequency. Nevertheless, certain limitations should be acknowledged. First, recycled aggregates originate from diverse sources, with variations in composition, original mix proportions, and service environments. These differences lead to significant fluctuations in particle morphology, surface roughness, porosity, water absorption, and strength [30]. Second, the mix design of recycled concrete is inherently more complex than that of ordinary concrete. In addition to conventional factors such as cement, aggregates, and water, it must also account for the replacement rate of recycled aggregates, the dosage and aspect ratio of stainless steel fibers, and their mutual interactions. Finally, discrepancies exist between the controlled laboratory conditions and real-world engineering environments. Actual service conditions are highly complex, and examining only the mechanical properties of recycled aggregate concrete under sulfate dry–wet cycling cannot fully capture the multifaceted deterioration processes encountered in practice.
Therefore, in future work, we can further improve our research. First, we can optimize the experimental design, such as expanding the range of factor levels, introducing more key variables, or conducting cross-validation by combining other numerical simulation methods with the response surface method. Second, we can increase the complexity and authenticity of the simulation environment, for example, by superimposing freeze–thaw cycles, temperature and humidity fluctuations, and other multi-factor coupling effects on the basis of dry–wet cycles, to make the conclusions more valuable for engineering reference. Third, we can enhance the universality of the research results by conducting multiple response surface modeling studies on recycled aggregates from different sources and with different substitution rates, as well as on stainless steel fibers of different types and dosages, summarizing the common laws among the variables, and constructing a general prediction model applicable to a wider range of material parameters.

Author Contributions

Conceptualization, C.Z. and J.Z.; Methodology, C.Z. and J.Z.; Software, W.M.; Validation, C.C.; Resources, J.S.; Data curation, S.X.; Writing—original draft, S.W.; Writing—review & editing, C.C.; Supervision, J.C.; Project administration, Y.X.; Funding acquisition, J.Z. All authors have read and agreed to the published version of the manuscript.

Funding

This research was funded by the National Natural Science Foundation of China (grant number 52208340), the Knowledge Innovation Program of Wuhan–Shuguang Project (grant number 2023020201020375), the State Key Laboratory of Bridge Structure Health and Safety (grant number BHSKL19–04–KF), the Project of Outstanding Young and Middle-aged Scientific and Technological Innovation Team in Hubei Universities and Colleges (grant number T2022010), and the Doctoral Start-up Fund of Hubei University of Technology (grant number BSQD2020051).

Data Availability Statement

All data generated or analyzed during this study are included in this published article.

Conflicts of Interest

Authors Chuheng Zhong, Weiqi Mao and Sijia Xing was employed by China Railway Major Bridge Engineering Group Co., Ltd. Author Shuai Wang was employed by Zhongcai India Chemical Building Material Private Limited. Author Jianan Shi was employed by East China Power Transmission & Transformation Engineering Co., Ltd. Author Yuan Xiao was employed by Dongying Urban Construction and Development Group Co., Ltd. Authors Changlong Chen, authors Jinhui Chen and authors Jinzhi Zhou declare that the research was conducted in the absence of any commercial or financial relationships that could be construed as a potential conflict of interest, and this manuscript is approved by all authors for publication. I would like to declare on behalf of my co-authors that the work described is original research that has not been published previously, and not under consideration for publication elsewhere, in whole or in part. All the authors listed have approved the manuscript that is enclosed.

References

  1. Xiao, J.Z. Recycled Concrete; China Architecture & Building Press: Beijing, China, 2008; pp. 3–4. [Google Scholar]
  2. Makul, N.; Fediuk, R.; Amran, M.; Zeyad, A.M.; Klyuev, S.; Chulkova, I.; Ozbakkaloglu, T.; Vatin, N.; Karelina, M.; Azevedo, A. Design strategy for recycled aggregate concrete: A review of status and future perspectives. Crystals 2021, 11, 695. [Google Scholar] [CrossRef]
  3. Li, Y.; Tao, J.L.; Lei, T.; Xie, J.J. Experimental study on compressive strength of recycled concrete. Adv. Mater. Res. 2017, 75, 261–263. [Google Scholar] [CrossRef]
  4. Bravo, M.; Brito, J.D.; Pontes, J.; Evangelista, L. Mechanical performance of concrete made with aggregates from construction and demolition waste recycling plants. J. Clean Prod. 2015, 99, 59–74. [Google Scholar] [CrossRef]
  5. Ramesh, R.B.; Mirza, O.; Kang, W.H. Mechanical properties of steel fiber reinforced recycled aggregate concrete. Struct. Concr. 2019, 20, 745–755. [Google Scholar] [CrossRef]
  6. Ahmadi, M.; Farzin, S.; Hassani, A. Mechanical properties of the concrete containing recycled fibers and aggregates. Constr. Build. Mater. 2017, 144, 392–398. [Google Scholar] [CrossRef]
  7. Bayraktar, O.Y.; Kaplan, G.; Shi, J.; Benli, A.; Bodur, B.; Turkoglu, M. The effect of steel fiber aspect-ratio and content on the fresh, flexural, and mechanical performance of concrete made with recycled fine aggregate. Constr. Buid. Mater. 2023, 368, 130497. [Google Scholar] [CrossRef]
  8. Xu, P.; Jiang, L.; Guo, M.Z.; Zha, J.; Xu, N. Influence of sulfate salt type on passive film of steel in simulated concrete pore solution. Constr. Build. Mater. 2019, 223, 352–359. [Google Scholar] [CrossRef]
  9. Poorsaheli, H.B.; Behravan, A.; Aghda, S.T.T. Durability performance of hybrid reinforced concretes (steel fiber+ polyolefin fiber) in a harsh marine tidal zone of Persian Gulf. Constr. Build. Mater. 2020, 266, 121176. [Google Scholar] [CrossRef]
  10. Huang, Z.Y. Study on the Performance Impact of Stainless Steel Fibers on Ultra-High Performance Concrete. J. Railw. Sci. Eng. 2019, 16, 376–383. [Google Scholar]
  11. Wang, C.; Zhang, Z.Y.; Liu, Y.; Fan, S.M. Geometric and fractal analysis of dynamic cracking patterns subjected to wetting-drying cycles. Soil Tillage Res. 2017, 170, 1–13. [Google Scholar] [CrossRef]
  12. Zhang, H.; Ji, T.; Liu, H. Performance evolution of recycled aggregate concrete (RAC) exposed to external sulfate attacks under full-soaking and dry-wet cycling conditions. Constr. Build. Mater. 2020, 248, 118675. [Google Scholar] [CrossRef]
  13. Sobhan, K.; Gonzalez, L.; Reddy, D.V. Durability of a pavement foundation made from recycled aggregate concrete subjected to cyclic wet–dry exposure and fatigue loading. Mater. Struct. 2016, 49, 2271–2284. [Google Scholar] [CrossRef]
  14. Liu, J.; Tao, H.; Yang, Y. Study on effect of sulfate attack on bending properties of steel fiber reinforced SCC. Water Resour. Hydropower Eng. 2022, 53, 118–124. [Google Scholar]
  15. Shahidzadeh-Bonn, N.; Desarnaud, J.; Bertrand, F.; Chateau, X.; Bonn, D. Damage in porous media due to salt crystallization. Phys. Rev. E 2010, 81, 066110. [Google Scholar] [CrossRef]
  16. Verre, S. Effect of different environments’ conditioning on the debonding phenomenon in fiber-reinforced cementitious matrix-concrete joints. Materials 2021, 14, 7566. [Google Scholar] [CrossRef] [PubMed]
  17. GB/T 39147-2020; Steel Fibers for Concrete. China Standards Press: Beijing, China, 2020.
  18. JGJ/T 240-2011; Technical Specification for Application of Recycled Aggregate. China Building Industry Press: Beijing, China, 2011.
  19. GB/T 50081-2019; The Standard for Test Methods of Concrete Physical and Mechanical Properties. China Building Industry Press: Beijing, China, 2019.
  20. GB/T 50082-2019; The Standard for Test Methods of Long-Term Performance and Durability of Ordinary Concrete. China Building Industry Press: Beijing, China, 2019.
  21. Tan, Y.; Guo, M.; Cao, L.; Zhang, L. Performance optimization of composite modified asphalt sealant based on rheological behavior. Constr. Build. Mater. 2013, 47, 799–805. [Google Scholar] [CrossRef]
  22. Vinayagamoorthy, R.; Manoj, I.V.; Narendra Kumar, G.; Sai Chand, I.; Sai Charan Kumar, G.V.; Suneel Kumar, K. A central composite design based fuzzy logic for optimization of drilling parameters on natural fiber reinforced composite. J. Mech. Sc. Technol. 2018, 32, 2011–2020. [Google Scholar] [CrossRef]
  23. Palanikumar, K. Modeling and analysis of delamination factor and surface roughness in drilling GFRP composites. Mater. Manuf. Processes 2010, 25, 1059–1067. [Google Scholar] [CrossRef]
  24. Abdellatief, M.; Elemam, W.E.; Alanazi, H.; Tahwia, A.M. Production and optimization of sustainable cement brick incorporating clay brick wastes using response surface method. Ceram. Int. 2023, 17, 9395–9411. [Google Scholar] [CrossRef]
  25. Guo, J.J.; Wang, K.; Guo, T. Effect of dry–wet ratio on properties of concrete under sulfate attack. Materials. 2019, 12, 2755. [Google Scholar] [CrossRef]
  26. Yuan, J.; Liu, Y.; Tan, Z.; Zhang, B. Investigating the failure process of concrete under the coupled actions between sulfate attack and drying–wetting cycles by using X-ray CT. Constr. Build. Mater. 2016, 108, 129–138. [Google Scholar] [CrossRef]
  27. Li, L.; Shi, J.; Kou, J. Experimental study on mechanical properties of high-ductility concrete against combined sulfate attack and dry–wet cycles. Materials 2021, 14, 4035. [Google Scholar] [CrossRef] [PubMed]
  28. Guo, J.J.; Liu, P.Q.; Wu, C.L. Effect of dry–wet cycle periods on properties of concrete under sulfate attack. Appl. Sci. 2021, 11, 888. [Google Scholar] [CrossRef]
  29. Shen, P. Comparative Study on Corrosion Resistance Performance of 304 Stainless Steel Hot Rolled Plate Materials in China; Lanzhou University of Technology: Lanzhou, China, 2011. [Google Scholar]
  30. Yang, K.H.; Chung, H.S.; Ashour, A.F. Influence of type and replacement level of recycled aggregates on concrete properties. ACI Mater. J. 2008, 105, 289–296. [Google Scholar] [CrossRef] [PubMed]
Figure 1. Particle size distribution curves of natural coarse aggregate, recycled coarse aggregate, and fine aggregate.
Coatings 15 01100 g001
Figure 2. Images of the materials used in the experiment: (a) SSFRAC; (b) natural course aggregate; (c) recycled course aggregate; (d) fine aggregate; (e) S95 mineral powder; (f) secondary fly ash; (g) Na2SO4; (h) carboxylic acid type water reducer.
Coatings 15 01100 g002
Figure 3. Compressive strength of different types of concrete.
Coatings 15 01100 g003
Figure 4. Failure morphology: (a) unstressed sample; (b) the early-stage failure of RAC; (c) the late-stage failure of RAC; (d) the early-stage failure of 1.5%SSFRAC; (e) the late-stage failure of 1.5%SSFRAC.
Coatings 15 01100 g004
Figure 5. The normal distribution of the residuals of S c . (Points in different colors correspond to the respective tests presented in Table 5).
Coatings 15 01100 g005
Figure 6. The residuals vs. predictions plot for S c (colors are consistent with Figure 5).
Coatings 15 01100 g006
Figure 7. The predictions vs. actual plot for S c (colors are consistent with Figure 5).
Coatings 15 01100 g007
Figure 8. The normal distribution of the residuals of S f . (Points in different colors correspond to the respective tests presented in Table 5).
Coatings 15 01100 g008
Figure 9. The residuals vs. predictions plot for S f . (Colors are consistent with Figure 8).
Coatings 15 01100 g009
Figure 10. The predictions vs. actual plot for S f . (Colors are consistent with Figure 8).
Coatings 15 01100 g010
Figure 11. Influence of A, B, and their interactions on S c . (a) Contour chart; (b) 3D surface chart. (Red points denote experimental values exceeding the predictions, whereas pink points denote values below the predictions. Curves in different colors denote different contour lines).
Coatings 15 01100 g011
Figure 12. Influence of A, C, and their interactions on S c . (a) Contour chart; (b) 3D surface chart. (Red points denote experimental values exceeding the predictions, whereas pink points denote values below the predictions. Curves in different colors denote different contour lines).
Coatings 15 01100 g012
Figure 13. Influence of B, C, and their interactions on S c : (a) contour chart; (b) 3D surface chart. (Red points denote experimental values exceeding the predictions, whereas pink points denote values below the predictions. Curves in different colors denote different contour lines).
Coatings 15 01100 g013
Figure 14. Influence of A, B, and their interactions on S f . (a) Contour chart; (b) 3D surface chart. (Red points denote experimental values exceeding the predictions, whereas pink points denote values below the predictions. Curves in different colors denote different contour lines).
Coatings 15 01100 g014
Figure 15. Influence of A, C, and their interactions on S f . (a) Contour chart. (b) 3D surface chart. (Red points denote experimental values exceeding the predictions, whereas pink points denote values below the predictions. Curves in different colors denote different contour lines).
Coatings 15 01100 g015
Figure 16. Influence of B, C, and their interactions on S f . (a) Contour chart. (b) 3D surface chart. (Red points denote experimental values exceeding the predictions, whereas pink points denote values below the predictions. Curves in different colors denote different contour lines).
Coatings 15 01100 g016
Figure 17. The apparent crack change in the specimen under 5% Na2SO4 concentration, 2% stainless steel fiber content, and dry–wet cycling for 30, 60, and 90 cycles: (a) 30 dry and wet cycles; (b) 60 dry and wet cycles; (c) 90 dry and wet cycles.
Coatings 15 01100 g017
Figure 18. The apparent change in the specimen under 90 dry–wet cycles, 2% stainless steel fiber content and Na2SO4 concentrations at 1%, 3%, and 5%: (a) 1% Na2SO4; (b) 3% Na2SO4; (c) 5% Na2SO4.
Coatings 15 01100 g018
Table 1. Parameters of fly ash and slag powder.
TypesDensity (g/cm3)Specific Surface Area (m2/kg)Loss on Ignition (%)28-Day Activity IndexWater Demand Ratio (%)45-Nanometer Residue (%)
II grade fly ash2.174263.08493.6
S95 grade slag powder2.80515 9792.84
Table 2. Mix proportions (kg/m3).
TypeCementFly AshSlag PowderRecycled AggregateNatural AggregateSandStainless Steel FiberWaterSuperplasticizer
C22676760114767301747.6
RAC226767622991867301747.6
1%SSFRAC226767622990667311.471747.6
1.5%SSFRAC226767622990167317.211747.6
2%SSFRAC226767622989567322.941747.6
Table 3. Cube compressive strength test results.
Type of ConcreteFiber Content/(%)Cube Compressive Strength/(MPa)
Sample 1Sample 2Sample 3Average
C-49.949.749.849.80
RAC-44.043.643.343.63
1%SSFRAC1%fiber49.849.749.449.63
1.5%SSFRAC1.5%fiber53.153.653.253.30
2%SSFRAC2%fiber54.854.754.754.73
Table 4. RSM factor levels.
FactorCodeCode Levels
−101
The number of dry–wet cyclesA306090
Fiber contentB11.52
Na2SO4 ConcentrationC135
Table 5. CCD test design and results.
Test Serial Number Test Design Test Results
A: Period B: Fiber Content C: Na2SO4 Concentration S c /% S f /%
1301110.81
290110.730.77
330211.020.83
490210.840.73
530151.020.76
690150.70.66
730251.010.89
890250.740.76
9301.531.040.78
10901.530.840.71
1160130.830.74
1260230.870.81
13601.550.80.68
14601.510.850.71
15601.530.880.75
16601.530.840.74
17601.530.850.73
18601.530.830.74
19601.530.850.74
Table 6. Analysis of variance of Sc.
Sum of SquaresdfMean SquareF-Valuep-Value
Model0.184390.020550.68<0.0001significant
Residual0.003690.0004
Lack of fit0.002250.00041.280.418not significant
Pure error0.001440.0004
Cor total0.187918
Table 7. Significance of regression coefficients of Sc..
Coefficient EstimateStandard Error95% CI Low95% CI Highp-Value
A−0.11960.0066−0.1346−0.1047<0.0001
B0.02310.00660.00820.03810.0067
C0.00190.011−0.0230.02680.8657
AB0.01750.00710.00140.03360.036
AC−0.02190.0089−0.042−0.00180.036
BC−0.01560.0089−0.03570.00450.1124
A20.07790.01220.05040.10540.0001
B2−0.01210.0122−0.03960.01540.3471
C2−0.05790.019−0.1009−0.01490.0138
Table 8. Analysis of variance of Sf..
Sum of SquaresdfMean SquareF-Valuep-Value
Model0.050390.005635.87<0.0001significant
Residual0.001490.0002
Lack of fit0.001250.00024.810.0767not significant
Pure error0.000240.0001
Cor total0.051718
Table 9. Significance of regression coefficients of Sf..
Coefficient EstimateStandard Error95% CI Low95% CI Highp-Value
A−0.04120.0041−0.0505−0.0319<0.0001
B0.02020.00410.01090.02950.0008
C0.00610.0068−0.00940.02150.398
AB−0.01120.0044−0.0212−0.00130.0312
AC−0.01410.0055−0.0265−0.00160.0312
BC0.03910.00550.02660.0515<0.0001
A20.02030.00750.00320.03740.0248
B20.05030.00750.03320.0674<0.0001
C2−0.04640.0118−0.0731−0.01970.0034
Disclaimer/Publisher’s Note: The statements, opinions and data contained in all publications are solely those of the individual author(s) and contributor(s) and not of MDPI and/or the editor(s). MDPI and/or the editor(s) disclaim responsibility for any injury to people or property resulting from any ideas, methods, instructions or products referred to in the content.