Abstract
To evaluate the feasibility of a virtual overlay tester (OT), a modeling approach was proposed based on the discrete element method (DEM). Simulations were conducted on three types of asphalt mixtures across three different thickness conditions. Through the analysis of the load/displacement curves, crack propagation paths, force chains, and contact force characteristics, it was observed that the peak loads decrease with increasing thicknesses, indicating a notable size effect. The complexity of the crack path was positively correlated with the particle size along the path and the fractal dimension. Coarse aggregates can inhibit crack propagation to some extent. Prior to reaching the peak load, compressive force chains in asphalt concrete-13 (AC13) and large stone porous asphalt mixture-30 (LSPM30) exhibited a symmetrical and divergent distribution along the crack, while tensile force chains formed an arch-like pattern. After the peak load, compressive force chains were symmetrically distributed in an arch shape along the crack. In stone mastic asphalt-13 (SMA13), compressive forces were transmitted along coarse aggregates, forming several continuous vertical paths. The proportion of strong compressive force chains to total compressive force chains across the three gradations ranged from 0.74 to 0.83, while the corresponding proportion for tensile force chains ranged from 0.72 to 0.78.
1. Introduction
Pavement cracking is the most prevalent and common form in pavement distress [1,2,3]. It not only affects aesthetic appearance and ride comfort but also has an adverse impact on the structural integrity, load-bearing capacity, and service life of the pavement. So far, pavement cracking remains a critical research focus and a persistent concern in the field of road engineering. Over time, long-term loading and complex environmental factors, such as temperature fluctuations [4,5], not only lead to the initiation of new cracks during the pavement’s service life but also cause the progression and expansion of pre-existing micro-cracks into through-cracks. This process undermines the mechanical performance of the pavement structure, reduces its service life, and ultimately results in structural deterioration. As a key construction material in road infrastructure, asphalt mixture plays a vital role in pavement performance. Therefore, the investigation of its crack resistance characteristics, crack propagation behavior, and the evolution of mechanical properties holds significant value for optimizing the pavement material design, enhancing structural crack resistance and durability, and informing the maintenance strategies [6].
To mitigate the pavement cracking and delay the progression of crack development, numerous scholars have conducted extensive investigations on the performance of asphalt mixtures. The indirect tensile (IDT) test is widely employed to evaluate the cracking behavior and mechanical properties of asphalt mixtures [7,8]. Based on the principles of continuous damage mechanics, a damage density model has been proposed to predict the fatigue crack propagation in asphalt mixtures under IDT loading conditions. The previous works indicated that asphalt mixtures exhibit ductile fracture characteristics and the crack lengths predicted by the model show a good agreement with experimental results. The fatigue behavior analyses of asphalt mixtures were conducted using both four-point bending test and IDT across a temperature range of 15 °C to 40 °C [9]. The study revealed that asphalt mixtures initiate a stable fatigue damage phase when their stiffness declines to 70% of the initial value. Notably, as temperature increased, the fatigue life of asphalt mixtures increased in the four-point bending test, whereas fatigue life decreased significantly in IDT tests. In a separate study [10], the researchers investigated the tensile strength of hot-mixed asphalt mixtures incorporating recycled pavement materials under varying aggregate gradations, asphalt contents, and temperatures conditions, utilizing both IDT and semi-circular bending (SCB) tests. The findings demonstrated that tensile strength is closely related to the aforementioned variables, and a strong correlation was observed between the results obtained from IDT and SCB testing methods.
Although the IDT test has been widely adopted due to its simple operation and its effectiveness in characterizing the tensile strength and viscoelastic properties of asphalt mixtures, the applied load in this test tends to concentrate near the loading plates. This phenomenon affects the uniformity of stress distribution and contributes to high variability in test results. The SCB test has been increasingly utilized because of its advantages, including simplicity, repeatability, and the ability to accurately determine the tensile and fracture strength of asphalt mixtures [11,12,13,14]. Some studies [13,14] have employed the SCB test to investigate the fatigue cracking behavior of asphalt mixtures. Furthermore, previous studies [11,15] conducted fatigue cracking tests on large stone asphalt mixtures using the SCB method, examining the various influencing factors on fatigue performance, such as loading frequency, temperature, sample thickness, notch length, and loading rates. The results indicate that large stone asphalt mixtures exhibit superior crack resistance with crack propagation paths deviating around coarse aggregate particles, resulting in longer crack paths and enhanced energy dissipation. Currently, two primary SCB testing methods were employed, including monotonic loading and repetitive loading [11,15]. Existing research has demonstrated that the repetitive loading SCB test can more accurately simulates the shear effects induced by the traffic loads on real pavement [16].
Asphalt mixture is a complex composite material composed of aggregates, asphalt binder, and voids, with aggregates constituting the majority and exhibiting typical granular characteristics. The macroscopic mechanical properties of asphalt mixtures are strongly influenced by their microstructural composition. Conventional macroscopic mechanical testing methods have limitations in elucidating the cracking mechanisms and crack propagation behavior of asphalt mixtures. In recent years, the DEM has played an increasingly important role in analyzing the internal aggregate characteristics and skeleton structure and in predicting the mechanical properties and road performance of asphalt mixtures. However, due to complex factors, such as aggregate morphology, particle size distribution, and spatial arrangement, and the viscoelastic characteristics of the asphalt binder, the development of accurate DEM models based on component-level representation has become more challenging [17]. The selection and calibration of constitutive models for contacts between aggregates and aggregates, for contacts between aggregates and asphalt binder, and for contacts within the asphalt phase have a substantial impact on the accuracy and computational efficiency of DEM simulations of asphalt mixtures. At present, there are two primary approaches for modeling asphalt mixtures based on DEM, i.e., the digital image reconstruction method and the random aggregate generation method. The digital image reconstruction method employs industrial CT scanning to capture the true morphology of aggregates, enabling high-fidelity structural reproduction; however, it is associated with complex operational procedures and limited flexibility. In contrast, the random aggregate generation method utilizes stochastic algorithms to create aggregate morphologies with approximate real aggregates. Although it cannot fully replicate the exact shape of natural aggregates, this method offers greater flexibility and reproducibility. Previous studies [1,2,3,6,17] have established virtual tests, such as the IDT test, SCB test, beam bending test, and axial compression test, based on the DEM framework to investigate the crack resistance performance of asphalt mixtures. These studies have demonstrated that DEM virtual testing exhibits strong consistency with the laboratory experimental results.
The OT test was originally developed to investigate the reflective cracking in asphalt mixtures and has been recently applied to the evaluation of fatigue performance and crack resistance in asphalt mixtures. The OT test comprises two loading modes, i.e., monotonic loading and repetitive loading, both of which operate under displacement control and are capable of simulating the influence of pre-existing cracks on the asphalt surface layer. Li et al. [18] employed the OT test to examine the crack resistance of epoxy porous asphalt mixtures under varying temperature and aging conditions, demonstrating that the incorporation of epoxy asphalt binder can enhance the crack resistance of porous asphalt mixtures. Xiao et al. [4] utilized the OT test to investigate the thermal fatigue behavior of asphalt concrete waterproof layers in high-speed railway applications, showing that the test effectively simulates fatigue behavior at a temperature of 20 °C and an opening displacement of 0.6 mm. The researchers [19] performed a study to assess the correlation between OT test results and reflective cracking observed in existing pavements, indicating that the OT test offers promising potential for evaluating and quantifying the crack resistance of hot-mixed asphalt mixtures.
In a word, although considerable progress has been made in investigating the crack resistance of asphalt mixtures through laboratory testing and numerical simulation methods, the issue of pavement cracking remains a persistent challenge. A more critical concern is that cracks can lead to secondary damages, such as water infiltration and air ingress, which can accelerate the aging of asphalt binders. These effects further compromise the structural integrity of pavements and expedite surface deformation. The OT test, as one of the methods used to study reflective cracking, has yielded meaningful research outcomes; however, a universally accepted testing protocol and standardized procedure have yet to be established. Moreover, there is a limited number of numerical simulation studies focusing on the OT test in the field of crack propagation research. Asphalt mixtures are multi-phase composite materials composed of aggregates, asphalt mortar, and pores, and their mechanical behavior is closely dependent on their internal structural composition. However, understanding the evolution of force chains within asphalt mixtures remains a significant technical challenge. Therefore, this study proposes a methodology based on DEM to simulate the OT test and explores the feasibility of applying numerical simulation techniques based on the OT test to evaluate the crack resistance of asphalt mixtures. The crack resistance performance of three asphalt mixtures with different gradations, i.e., SMA13, AC13, and LSPM30, was investigated under varying specimen thicknesses, aiming to provide a theoretical foundation and practical reference for improving the virtual OT testing methods for crack resistance evaluation.
2. Development of a Virtual Model Based on the DEM
2.1. Aggregate Gradation and Classification Assumptions
AC13 is a continuously graded asphalt mixture that forms a dense, suspended structure. Due to the relatively low content of coarse aggregate, it is insufficient to form an interlocking stone skeleton; therefore, its strength primarily derives from the cohesive force of the asphalt binder and the overall compactness of the mixture. It is typically applied in the surface and intermediate layers of asphalt pavements. In contrast, SMA13 contains a high proportion of coarse aggregate, which interlocks and compacts to form a primary load-bearing skeleton, resulting in a strong skeletal-dense structure. It is mainly used in the wearing course of pavements. LSPM30 contains an exceptionally high proportion of coarse aggregate with minimal fine aggregate and filler, forming a skeletal-void structure characterized by a robust “stone-to-stone” contact framework. This structural feature contributes to its high load-bearing capacity, making it suitable for use in the pavement base layer.
In this study, AC13, SMA13, and LSPM30 asphalt mixtures were selected as virtual samples and their corresponding gradation and material parameters are presented in Table 1 and Table 2, respectively [17,20]. The asphalt mixtures were categorized into three components: coarse aggregate, asphalt mortar, and voids. For AC13 and SMA13, aggregates with particle sizes greater than 1.18 mm were classified as coarse aggregate, while particles smaller than 1.18 mm, including fine aggregate and asphalt binder, were grouped as asphalt mortar. For LSPM30, aggregates with particle sizes exceeding 2.36 mm were considered coarse aggregate, and particles smaller than 2.36 mm, comprising fine aggregate and asphalt binder, were defined as asphalt mortar. The complex geometric morphology of coarse aggregates based on the DEM inevitably increases both the analytical complexity and computational cost. This study aims to explore the methodology for establishing an OT virtual test based on the DEM. To reduce the computational burden and modeling complexity, this study has simplified the geometric morphology of coarse aggregates by representing them with circular particles, which are used to simulate both coarse aggregates and asphalt mortar.

Table 1.
Passing percentage of asphalt mixtures (%).
Table 2.
Material parameters.
2.2. The Proportion of Coarse Aggregate Volume
This study establishes asphalt mixture specimens based on the DEM, Itasca Consulting Group, Inc. (DEM Solutions Ltd., Edinburgh, UK). (2019). According to the gradation curves of AC13, SMA13, and LSPM30, the proportion of coarse aggregate content in each grade is determined by the asphalt-aggregate ratio and void ratio. The calculation formula for the coarse aggregate proportion is presented in Equation (1) [17].
where VLn—the volume of n-th grade aggregate; Pn—the passing percentage of n-th grade aggregate; Pn+1—the passing percentage of (n + 1)th grade aggregate; VL—the volume of coarse aggregates; Vs—the volume of fine aggregates; V—the volume of specimen; ρa—the density of asphalt; ρs—the density of aggregates; a—the bitumen/aggregate ratio; VV—the porosity of the specimen.
Based on Table 1 and Table 2 [17,20], the volume of each grade of coarse aggregate for AC13, SMA13, and LSPM30 can be determined, as presented in Table 3. The number of coarse aggregates in each grade for the sample can be calculated based on the adopted virtual sample volume. In this study, the DEM is employed to model the asphalt mixture. It is assumed that the density of coarse aggregates remains consistent across grades. The volume ratio of aggregates derived from the gradation curve corresponds to the area ratio. Given the total area of the sample, the area ratio of each aggregate grade can be computed, and subsequently the number of aggregates in each grade can be determined by Table 1 and Table 2 and Equation (1).
Table 3.
Coarse aggregate content.
2.3. Monotonic Tensile OT Test
The OT test involves two loading modes, i.e., dynamic loading and monotonic loading. The testing apparatus for both loading modes is identical, consisting of two steel plates—one fixed and the other one capable of horizontal movement to simulate crack opening and closing. The specimens and loading plates are bonded together using high-strength epoxy adhesive to ensure that the specimens remain securely attached to the plates throughout in the whole loading process. The focus of this study is primarily on the monotonic loading mode of the OT test, conducted based on the DEM for asphalt mixture testing; therefore, the dynamic loading mode is not considered. As illustrated in Figure 1a, a standard asphalt mixture specimen with dimensions of 150 mm × 75 mm × 38 mm is used, and the displacement-controlled loading is applied at a rate of 0.32 cm/min. Figure 1b presents a typical result from a monotonic loading OT test. The graph reveals two distinct stages of the asphalt mixture: the crack initiation stage (Region A) and the crack propagation stage (Region B). Key mechanical parameters, such as fracture energy (FE), tensile strength (σt), modulus (Et), and peak strain (εt) under monotonic loading conditions, can be derived from the load/displacement curves [19].
in which Pmax denotes the maximum load, w2 and w1 represent the displacements corresponding to the peak load and the initial displacement, respectively, t and b refer to the thickness and width of the specimen, and f(x) represents the load/displacement curve.
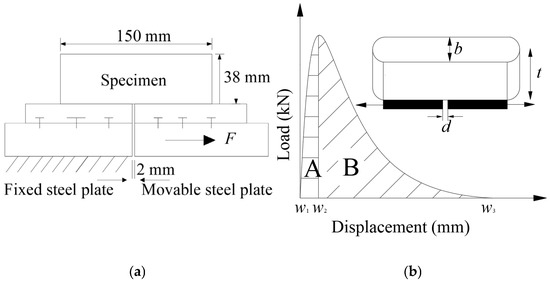
Figure 1.
The OT test under monotonic loading. (a) Schematic diagram of OT test; (b) load/displacement curve under monotonic loading.
The objective of this study is to perform a preliminary numerical analysis of the OT test for asphalt mixtures. The geometric morphology of coarse aggregates significantly influences numerical simulations. To facilitate subsequent analysis, the DEM was employed to model the coarse aggregate morphology using circular particles with diameters equaling to those of the actual coarse aggregate particles in the same gradation. Meanwhile, this study investigates the effect of varying thicknesses on the numerical test results. Based on the coarse aggregate content presented in Table 3, while maintaining the specimen aspect ratio unchanged, the thickness is set to four, six, and eight times the nominal particle size of the gradation. For the OT tests of AC13 and SMA13, the specimen dimensions are set to 52 mm × 104 mm, 78 mm × 156 mm, and 104 mm × 208 mm, respectively. For LSPM30, the dimensions are 120 mm × 240 mm, 180 mm × 360 mm, and 240 mm × 480 mm, respectively.
2.4. Development of the OT Numerical Model
2.4.1. Generation of the OT Specimen
As is well known, the morphological characteristics of aggregates have a certain influence on the load transfer capacity of the skeletal structure. However, when both the morphological characteristics and gradation of aggregates are considered in the discrete element model of asphalt mixtures, it becomes challenging to identify and quantify the morphology of force chains. According to previous studies [21], discrete element simulations of asphalt mixtures based on the assumption of circular aggregates can effectively capture the load transfer behavior of the skeletal structure under external loading conditions [22]. Furthermore, the study [22] conducted rutting tests on asphalt mixtures based on the DEM. Two-dimensional circular particles were employed to represent aggregates, and the results indicated that the use of circular particles can effectively capture the internal force chain characteristics of asphalt mixtures. The study [23] established a three-dimensional rutting test using spherical particles to represent aggregates within the DEM framework. The findings demonstrated that the DEM model incorporating spherical particles could accurately simulate the rutting behavior of asphalt mixtures, with a final relative error of less than 10%.
Consistent with previous studies [21,22,23], this study also employs circular particles to represent aggregates in asphalt mixtures. Taking the AC13 specimen with dimensions of 52 mm × 104 mm as an example, the four-sided wall shown in Figure 2 was created using the “wall create” command in the DEM. The “ball generate” command was employed to generate the specified number of coarse aggregate circular particles within the designated area based on the coarse aggregate content for each gradation listed in Table 3. The “cycle” command was applied to eliminate the initial overlap between aggregate particles. In the DEM, particles were assumed to be rigid bodies, meaning that they do not deform during the loading and deformation process of the specimen; therefore, the overall deformation of the specimen is primarily attributed to particle displacement. In this study, the asphalt components and fine aggregates with particle sizes smaller than 1.18 mm in AC13 and SMA13 are considered as asphalt mortar and are represented by regularly arranged circular particles with an equivalent diameter of 1 mm. Based on the specified void ratio, a certain number of asphalt mortar particles were randomly removed using a custom-developed algorithm in the DEM to simulate the void structure characteristics. Finally, the OT test specimen of asphalt mixtures generated using DEM is presented in Figure 2.
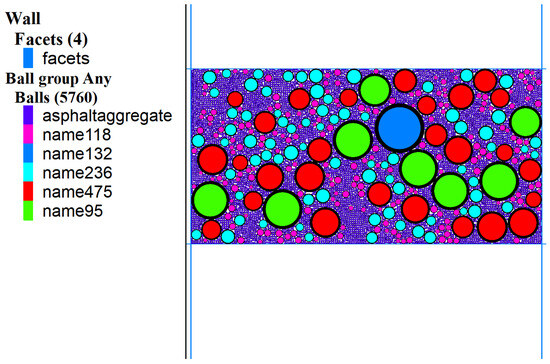
Figure 2.
Monotonic loading OT test.
As illustrated in Figure 2, the ‘walls’ in the model are represented by blue lines, while the coarse aggregates of the same gradation are grouped into a total of five categories. Specifically, group 118 represents coarse aggregates with particle sizes ranging from 1.18 mm to 2.36 mm; group 132 represents aggregates ranging from 13.2 mm to 16 mm; group 236 corresponds to aggregates ranging from 2.36 mm to 4.75 mm; group 475 refers to aggregates ranging from 4.75 mm to 9.5 mm; and group 95 denotes aggregates ranging from 9.5 mm to 13.2 mm. Additionally, the fine aggregates and asphalt binder are categorized as group asphalt aggregate with particles sizes smaller than 1.18 mm. For the convenience of analysis, the colors of each group of particles are adjusted to gray in the subsequent sections.
2.4.2. Definition of the Contact Model
The contact model of asphalt mixture defined in this study includes three contact types: contact between coarse aggregates; internal contact within the asphalt mortar; and contact between aggregates and asphalt mortar. Given that the stiffness of aggregates is significantly higher than that of asphalt mortar, the contact between coarse aggregates can be typically defined using a linear stiffness model [17]. Although the DEM provides a built-in burgess model to represent the viscoelastic behavior of asphalt mortar, this model is unable to capture the bonding characteristics within the asphalt mortar [17]. More importantly, the primary objective of this study is to investigate the evolution of force chains during the OT test of asphalt mixtures and evaluate the feasibility of numerical modeling OT tests using the discrete element method. In monotonic OT tests, the loading rate is relatively high, the viscoelastic effects of the asphalt mortar are minimal, and the computational cost associated with the Burgess model is considerable. Therefore, the internal contact within the asphalt mortar is modeled using a linear parallel bond model [2], and the contact between aggregates and asphalt mortar is also defined using the same type of model. It should be noted that in actual asphalt mixtures, aggregates are typically coated with asphalt films. Accordingly, the contact between aggregates in this study is also defined using a linear parallel bond model to account for this interfacial behavior
Determining the mesoscopic contact mechanics model parameters in the DEM is a challenging task [2]. Typically, initial parameter values are assigned in the DEM, and iterative calculations are performed in conjunction with experiments to minimize the discrepancy between the load/displacement curves obtained from numerical simulations and those from the actual laboratory tests. Through this calibration process, the mesoscopic contact parameters of the material are obtained. The contact model parameters used in this study are adopted from the study [2] and summarized in Table 4. Specifically, the tensile strength and cohesion parameters for the contact between coarse aggregates, as well as between coarse aggregates and asphalt mortar, are defined as 0.8 times the corresponding values between asphalt mortar particles.
Table 4.
Mesoscopic parameters of the linear parallel bond model.
2.4.3. Definition of Loading Conditions
As illustrated in Figure 3, the red particles on the left (grouped as top_grip) are designated as the fixed end, with both translational and rotational degrees of freedom being constrained. The green particles on the right (grouped as bottom_grip) have their vertical and rotational degrees of freedom constrained, allowing free movement in the horizontal direction. In the OT test, loading is applied in the form of displacement control. Therefore, in this study, to balance computational accuracy and efficiency, the horizontal loading velocity of the green particles on the right is set to 0.002 m/s. The test is deemed complete when the specimen is fully fractured or when the tensile load decreases to 0.1 times the peak load. Displacement is defined as the average horizontal displacement of all particles within the bottom_grip group, while the load is calculated as the average ratio of the total contact force of all particles in the bottom_grip group to the particle diameter within the corresponding group. The test monitors the load/displacement curve using the “hist” command, as well as the evolution of cracks and contact forces.
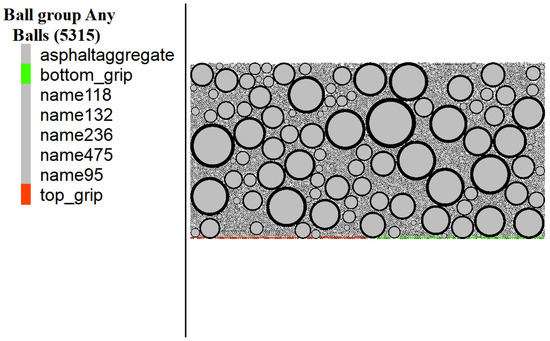
Figure 3.
Loading and boundary conditions of the model.
3. Results and Discussion
3.1. The Influence of Different Thicknesses on the OT Test
The virtual OT tests varying the specimen thicknesses were conducted while maintaining a constant aspect ratio. The tested specimens included AC13 and SMA13 at dimensions of 52 mm × 104 mm, 78 mm × 156 mm, and 104 mm × 208 mm, as well as LSPM30 at 120 mm × 240 mm, 180 mm × 360 mm, and 240 mm × 480 mm, resulting in a total of nine distinct test conditions. The load/displacement curves obtained from the OT tests are presented in Figure 4. The curves generally exhibit three distinct stages: linear increasing phase, plateau phase, and descending phase. Notably, the linear phase of LSPM30 is significantly more pronounced compared to that of AC13 and SMA13. The peak loads of all three mixtures demonstrate a gradual decline with increasing the specimen thickness. In terms of particle size, the distribution of coarse aggregates in specimens with smaller thickness is significantly uneven, while the larger the specimen size, the more uniform the distribution of coarse aggregates. The failure mode of the specimens is primarily characterized by tensile failure between particles, with cracks predominantly occurring within the asphalt mortar and at the aggregate–asphalt mortar interface. Under identical specimen dimensions, the peak load of SMA13 is generally higher than that of AC13, although no significant difference is observed in the maximum tensile displacement between the two mixtures. However, under the specimen size of 104 mm × 208 mm, the maximum tensile displacement of AC13 exceeds that of SMA13, suggesting that the dense skeleton structure of SMA13 provides superior resistance to external loading compared to AC13. When the aspect ratio is kept constant and the specimen thickness is four, six, and eight times the nominal maximum aggregate size, LSPM30 exhibits significantly greater tensile displacement than both AC13 and SMA13. Unlike the maximum displacement, the peak load of LSPM30 does not exhibit significant variation and remains comparable to that of AC13. This indicates that the coarse aggregates in LSPM30 impede crack propagation, resulting in longer and more tortuous crack paths that consume more energy during failure.
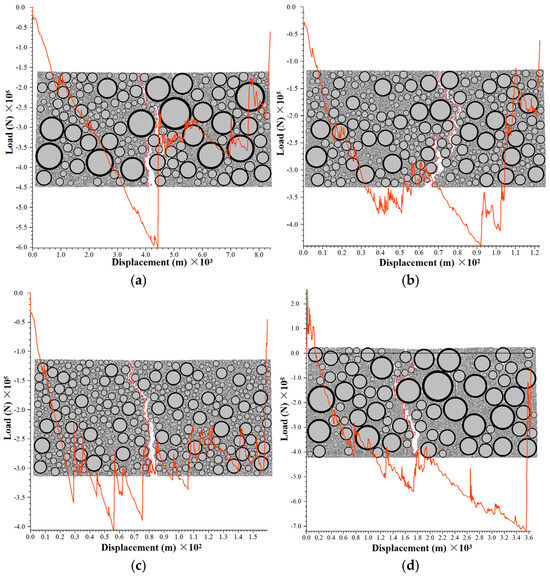
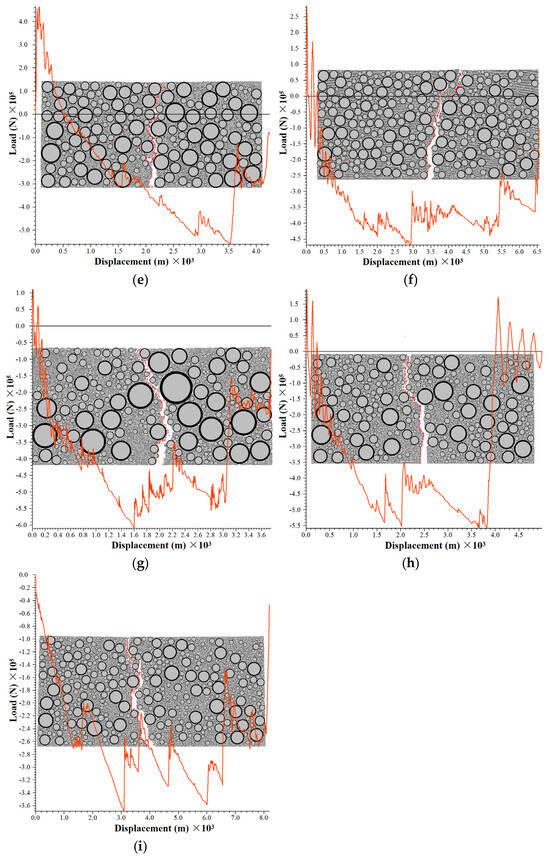
Figure 4.
Load/displacement curves under varying thickness conditions. (a) LSPM30−120 mm × 240 mm; (b) LSPM30−180 mm × 360 mm; (c) LSPM30−240 mm × 480 mm; (d) SMA13−52 mm × 104 mm; (e) SMA13−78 mm × 156 mm; (f) SMA13−104 mm × 208 mm; (g) AC13−52 mm × 104 mm; (h) AC13−78 mm × 156 mm; (i) AC13−104 mm × 208 mm.
The study [17] established 3D models for AC13 and SMA13 mixtures based on the DEM. The simulation results indicated that AC13 exhibited a slightly higher peak load and a relatively smaller maximum displacement compared to SMA13, which aligns closely with the findings of this study. It should be noted that the study [17] employed a three-dimensional modeling approach, whereas this paper utilizes a two-dimensional model. Furthermore, the aggregate model in study [17] was constructed based on actual morphological features, while this study adopts circular particles to represent coarse aggregates in order to simplify the computational model. These differences may account for the discrepancies observed in the simulation results. The study [15] investigated the fracture behavior of asphalt mixtures using semi-circular bending tests and found that mixtures containing large-sized aggregates demonstrate superior crack resistance. This is attributed to the fact that during crack propagation, cracks tend to bypass large particles, leading to an elongated, more tortuous crack path and greater energy dissipation. This phenomenon is consistent with the results observed in this study, where LSPM30 exhibited significantly higher maximum tensile displacement on the load/displacement curve compared to AC13 and SMA13.
3.2. Fractal Characteristics of Cracks in the OT Test
In this study, the crack propagation behavior of LSPM30, AC13, and SMA13 specimens was analyzed while maintaining a constant aspect ratio and setting the specimen thickness to four, six, and eight times the nominal maximum aggregate size of the gradation. As shown in Figure 4, the crack propagation appears macroscopically irregular, with cracks developing around large aggregates during upward propagation, following a tortuous and non-uniform path. The primary crack extends upward from the center part of the specimen’s bottom along the boundaries of the simulated loading plates, and a few cracks also appear in other regions of the specimen, as illustrated in Figure 5. Fractal theory was employed in this study to investigate the crack propagation patterns in the asphalt mixture OT test. Given the computational convenience of the box-counting method, a custom matlab algorithm was developed to calculate the fractal dimension of the cracks, as summarized in Table 5. Generally, larger specimens contain more particles and thus exhibit a greater number of cracks. However, in the case of LSPM30-180 mm × 360 mm, the number of cracks exceeded that of LSPM30-240 mm × 480 mm. This phenomenon can be attributed to the presence of more large-sized aggregates along the crack path in the former, which altered the crack propagation trajectory. In contrast, fewer large-sized aggregates were present along the crack path in LSPM30-240 mm × 480 mm, allowing for easier crack propagation. The complexity of the crack path is positively correlated with the aggregate sizes along the path, which in turn increases the fractal dimension. This indicates that large-sized aggregates exert a certain inhibitory effect on the crack development. In general, as shown in Table 6, the fractal dimension and fracture energy exhibit a consistent trend. For the same gradation, higher fractal dimension corresponds to greater fracture energy. For different gradations, this trend is maintained across all specimen sizes except for 104 mm × 208 mm in the case of SMA13 and AC13. The specimen thickness of LSPM30 is greater than that of AC13 and SMA13. Only when the specimen size is 180 mm × 360 mm (i.e., the thickness is six times the nominal maximum aggregate size) the fractal dimension and fracture energy show a consistent trend. This observation suggests the presence of size effect in the OT test, which is also influenced by the spatial distribution of large-sized aggregates. Therefore, for subsequent tests, the specimen thickness was uniformly set to six times the nominal maximum aggregate size to ensure consistency and comparability.
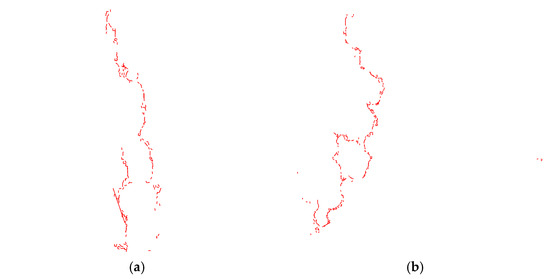
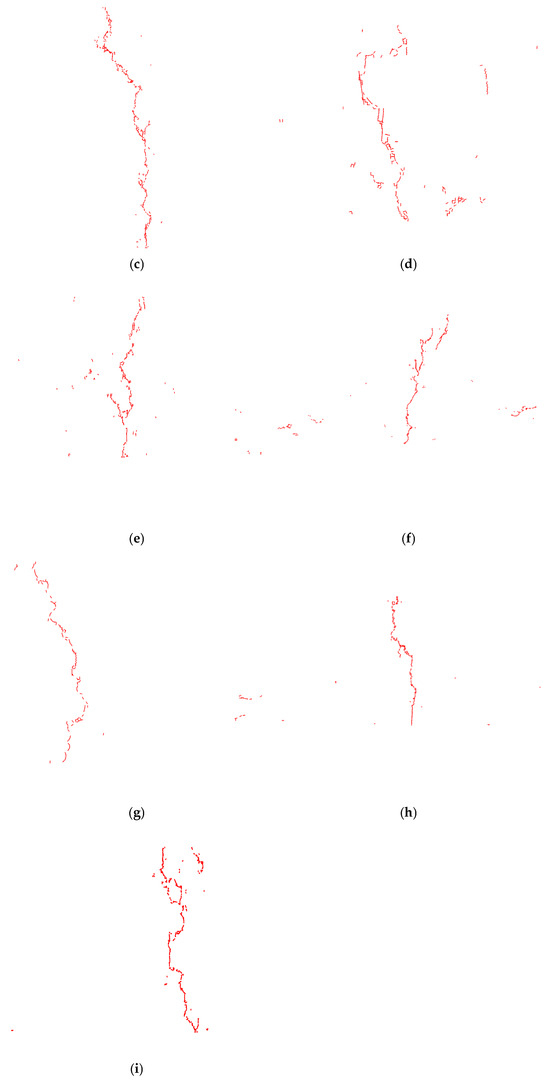
Figure 5.
Cracking paths under varying thickness conditions. (a) LSPM30-120 mm × 240 mm; (b) LSPM30-180 mm × 360 mm; (c) LSPM30-240 mm × 480 mm; (d) SMA13-52 mm × 104 mm; (e) SMA13-78 mm × 156 mm; (f) SMA13-104 mm × 208 mm; (g) AC13-52 mm × 104 mm; (h) AC13-78 mm × 156 mm; (i) AC13-104 mm × 208 mm.
Table 5.
Fractal dimensions of cracks under varying thickness conditions.
Table 6.
Fracture energy (N/m3).
3.3. Force Chain Characteristics in the OT Test
During the loading process, the force chains within the asphalt mixtures evolve continuously as increasing load. To have a good comparison of force chain variations during the OT test of asphalt mixtures, this study statistically analyzed the force chain characteristics at 25%, 50%, 75%, and 100% of the peak load during the loading phase, as well as at 75%, 50%, and 25% during the unloading phase. Three distinct contact types were considered: contact between coarse aggregates, contact between asphalt mortars, and contact between asphalt mortars and coarse aggregates. The force chain distribution patterns of LSPM30 and AC13 were found to be similar. Therefore, AC13, LSPM30 and SMA13 were selected as representative examples for further analysis of their force chain characteristics. Figure 6, Figure 7 and Figure 8 present the force chain distribution diagrams of AC13, LSPM30, and SMA13 at different loading stages, respectively.
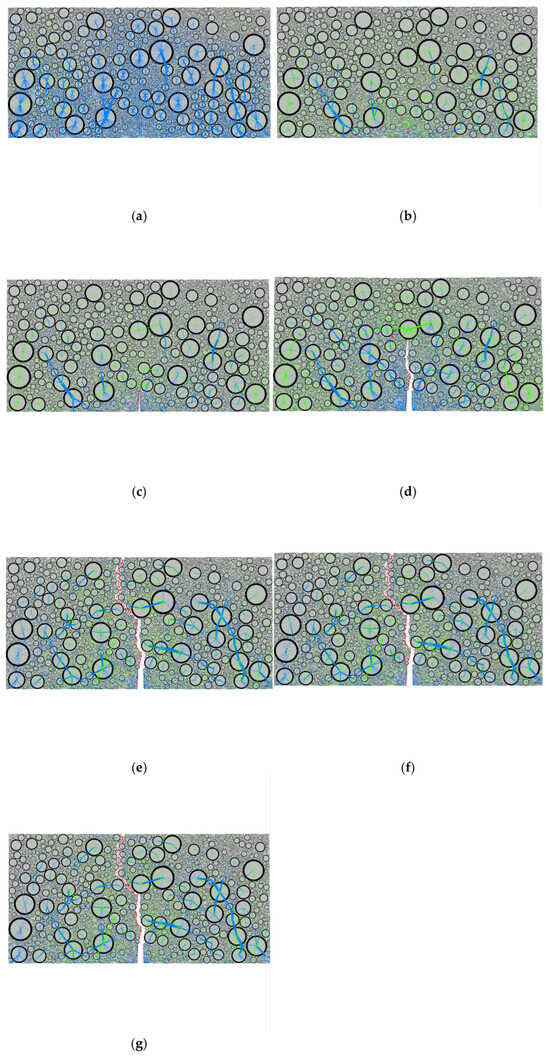
Figure 6.
Evolution of AC13 force chain in different loading stages (compressed force chains represented by blue and tensile chains represented by green). (a) 25% of peak load; (b) 50% of peak load; (c) 75% of peak load; (d) 100% of peak load; (e) 75% of peak load in the descending phase; (f) 50% of peak load in the descending stage; (g) 25% of peak load in the descending stage.
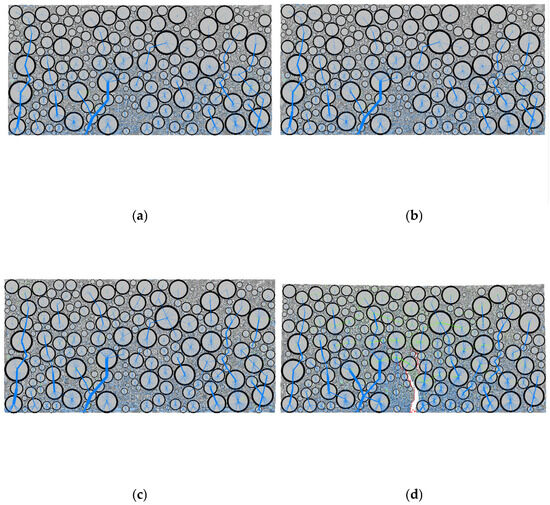
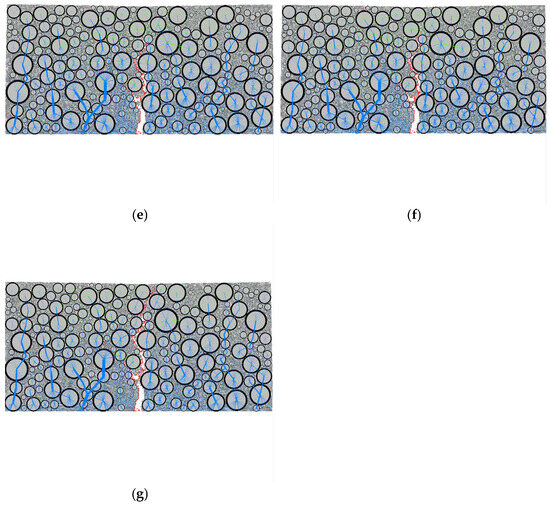
Figure 7.
Evolution of the SMA13 force chain in different loading stages (compressed force chains represented by blue and tensile chains represented by green). (a) 25% of peak load; (b) 50% of peak load; (c) 75% of peak load; (d) 100% of peak load; (e) 75% of peak load in the descending phase; (f) 50% of peak load in the descending stage; (g) 25% of peak load in the descending stage.
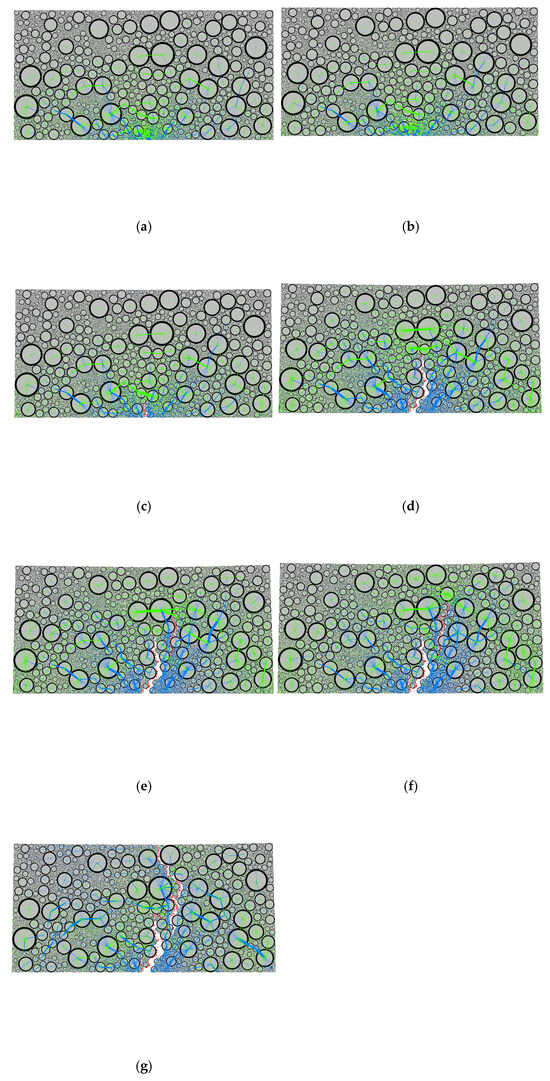
Figure 8.
Evolution of the LSPM30 force chain in different loading stages (compressed force chains represented by blue and tensile chains represented by green). (a) 25% of peak load; (b) 50% of peak load; (c) 75% of peak load; (d) 100% of peak load; (e) 75% of peak load in the descending phase; (f) 50% of peak load in the descending stage; (g) 25% of peak load in the descending stage.
As shown in Figure 6, the coarse aggregates in AC13 are irregularly distributed, and the overall coarse aggregate content is relatively low. At the initial loading stage, the internal force within the specimen is predominantly compressive force (with the compressed force chains indicated by blue), which are primarily located between the coarse aggregate particles. These compressive chains exhibit an approximately symmetrical distribution from the bottom to the top along the central axis of the specimen. With the initiation of cracks, the number of compressive chains decreases, while the number of tensile chains (represented by green) increases. At peak load, the compressive chains generally display a symmetrical and divergent distribution along the crack paths, whereas the tensile chains exhibit an arch-shaped distribution pattern. As crack propagation progresses, the load gradually decreases until the specimen is fully fractured, and the compressive force chains predominantly exhibit an arch-shaped and symmetrical distribution along the crack paths.
As shown in Figure 7, the content of coarse aggregates in SMA13 is relatively high, and the distribution of coarse aggregates is more uniform. Prior to reaching the peak load, the dominant force chain within the specimen is the compressive chain. These compressive chains primarily develop between the coarse aggregates, forming multiple force chains extending from the bottom to the top of the specimen. Following crack initiation, the tensile chains undergo significant changes. As the cracks propagate, the compressive force chains are transmitted along the coarse aggregate particles, resulting in the formation of multiple load-transfer paths extending from the bottom to the top of the specimen. From Figure 6 and Figure 7, it can be seen that compressive chains predominantly exist and propagate between coarse aggregate particles, suggesting that the internal distribution of coarse aggregate particles significantly influences the force field within the specimen.
As shown in Figure 8, the spatial distribution characteristics of coarse aggregates in LSPM30 fall between those of AC13 and SMA13. In general, a load concentration phenomenon occurs near the bottom center of the specimen. The primary compressive force chain originates at the bottom center and propagates upward, while the main tensile force chain follows an approximately arch-shaped transmission path. Prior to the peak load, the number of cracks remains relatively low. Distinct tensile force chains are formed within the specimen, and the force chains predominantly exist between coarse aggregates, mainly distributed in the lower two-thirds of the specimen. The compressive force chain initiates at the bottom center and radiates upward, with the magnitude of compressive forces gradually decreasing. During the peak load and subsequent load decline stage, the number of cracks increases significantly, and notable changes occur in the compressive force chain. The compressive force chain remains dominant throughout the loading process. After the specimen is fully fractured, the compressive force chain still exhibits an arch-shaped distribution pattern.
3.4. Contact Force Characteristics of the OT Test
To investigate the evolution of contact forces between particles during the loading process, seven distinct loading stages were selected in the ascending stage, the applied loads were set at 0.25, 0.5, 0.75, and 1.0 times the peak load, while in the descending stage, the loads were set at 0.75, 0.5, and 0.25 times the peak load. The total pressure chain and total tension chain were quantified, along with the ratios of strong pressure chain to total pressure chain, weak pressure chain to total pressure chain, strong tension chain to total tension chain, and weak tension chain to total tension chain. The results are presented in Figure 8. Note that the strong chain in this study is defined as a contact force between particles that exceeds the average inter-particle contact force. As shown in Figure 9, the ratio of strong pressure chain to total pressure chain ranges from 0.74 to 0.83, and the ratio of strong tension chain to total tension chain ranges from 0.72 to 0.78 across the three gradations, indicating that the majority of inter-particle contact forces are carried by the strong pressure and tension chains. The proportions of strong pressure chains and strong tension chains exhibit consistent overall trends for AC13 and LSPM30 that the ratios initially increase and then decrease with increasing load, whereas for SMA13, they first decrease and then increase. Overall, the ratio of total pressure chain to total tension chain for AC13 and LSPM30 increases progressively during the loading process, although the total pressure between particles remains generally lower than the total tension, which suggests that these two mixtures possess a higher tensile capacity provided by the asphalt mortar. For SMA13, the pressure-to-tension ratio generally decreases from high to low, and the total pressure between particles exceeds the total tension. Combining Figure 7 and Figure 9, it can be observed that the coarse aggregate content in the SMA13 gradation is higher than that in AC13 and LSPM30, which facilitates the formation of a more robust skeleton structure.
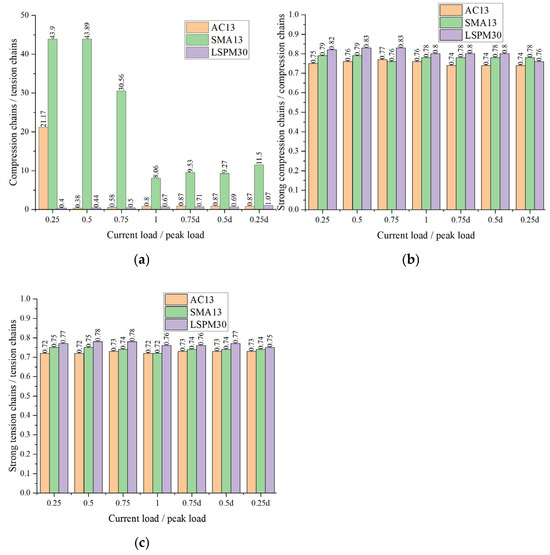
Figure 9.
Variation in contact force during the loading process. (a) Compression chains/tension chains; (b) strong compression chains/compression chains; (c) strong tension chains/tension chains (0.75d, 0.5d, and 0.25d denote the tensile loads during the descending stage that are 0.75, 0.5, and 0.25 times the peak load, respectively).
The variations in the number of force chains among the three types of asphalt mixtures at different loading stages are presented in Table 7, Table 8 and Table 9, respectively. As shown in these tables, before and after the peak load, the total number of tensile force chains in AC13 initially increases and subsequently decreases, while the total number of compressive force chains follows an opposite trend. However, due to the fracture of AC13 occurring when the tensile load during the load reduction phase reaches approximately 75% of the peak load, the data recorded in the subsequent two stages remain nearly unchanged. In SMA13, the total number of tensile force chains increases first and then decreases, with the total number of compressive force chains exhibiting a corresponding decrease followed by an increase. The total number of tensile force chains in LSPM30 initially increases and subsequently decreases, whereas the total number of compressive force chains exhibits the opposite trend, first decreasing and then increasing. Overall, the proportion of strong tensile (compressive) force chains to the total tensile (compressive) force chains across all three asphalt mixtures remains within the range of 30%–40% at different loading stages, indicating a relatively stable inter-aggregate contact force throughout the entire loading process.
Table 7.
Evolution of the force chain in coarse aggregates of LSPM30 (d denotes the stage of load reduction).
Table 8.
Evolution of the force chain in coarse aggregates of SMA13 (d denotes the stage of load reduction).
Table 9.
Evolution of the force chain in coarse aggregates of AC13 (d denotes the stage of load reduction).
The study [17] investigated the force chain characteristics of AC13 and SMA13, revealing that strong force chains accounted for approximately 30% of the total, with contact force directions exhibiting an “8”-shaped distribution pattern. The contact forces between aggregates primarily facilitate the transmission of external loads, and SMA13 demonstrates a more robust skeletal structure compared to AC13. These findings are consistent with the results presented in this study. It is important to note that the study [17] employed a 3D modeling approach, whereas this study utilizes a 2D model, which may partially explain the discrepancies observed between the simulation results of the two studies. In addition, the aggregate model in study 17 was established based on its true morphological characteristics, while in order to simplify the calculation model, circular particles were used to characterize coarse aggregates in this paper. This may be one of the reasons for the differences in simulation results.
As illustrated in Figure 10, the contact forces between coarse aggregates in the AC13, SMA13, and LSPM30 asphalt mixtures under peak load conditions were analyzed separately, and the corresponding strong compressive and tensile force chains were extracted. It can be observed from Figure 10 that the number of strong tensile and compressive force chains is relatively small overall; however, the magnitudes of both tensile and compressive forces are significant, with the compressive force amplitude being greater than that of the tensile forces. This suggests that inter-particle compressive forces play a dominant role in transmitting and sustaining external loads within asphalt mixtures. The distribution patterns of strong compressive force chains in the three asphalt mixtures exhibit an “8”-shaped configuration. In AC13, the strong compressive force chains are predominantly oriented at approximately 60°–130° and 240°–330°, whereas in LSPM30, they are mainly distributed at approximately 130°–240° and 90°–300°. In SMA13, the strong compressive force chains are concentrated at approximately 45°–120° and 210°–300°. The distribution of strong tensile force chains in SMA13 also displays an “8”-shaped pattern, while those in LSPM30 and AC13 do not exhibit distinct directional characteristics. In LSPM30, the tensile force chains are primarily oriented in the horizontal direction, whereas in AC13, they are more uniformly distributed. Based on the distribution of strong tensile and compressive force chains, it can be inferred that the coarse aggregate arrangement in SMA13 is relatively uniform, enabling the formation of a more effective skeleton structure, which facilitates the transmission of external loads within the asphalt mixture. In contrast, the coarse aggregate distribution in AC13 is less uniform and characterized by a lower overall content, resulting in a reduced capacity to transmit external loads. LSPM30 demonstrates intermediate behavior between the AC13 and SMA13.
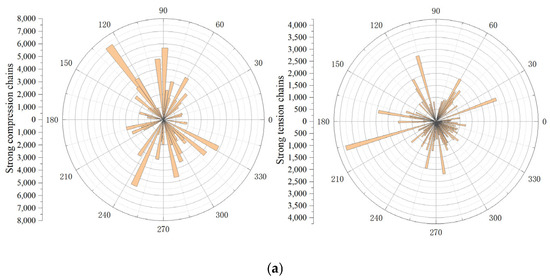

Figure 10.
Strong compressive chains and strong tensile chains. (a) AC13; (b) LSPM30; (c) SMA13.
Under peak load conditions, the strong and weak force chains between coarse aggregates in the three asphalt mixtures, along with their corresponding proportional relationships, are presented in Table 10. In AC13 and LSPM30, the total number of tensile force chains exceeds that of compressive force chains, whereas in SMA13, the total number of compressive force chains is greater than that of tensile force chains. The total number of strong tensile (compressive) force chains in all three mixtures is lower than that of weak tensile (compressive) force chains. Specifically, in AC13 and LSPM30, the number of strong tensile force chains is higher than that of strong compressive force chains, and the number of weak tensile force chains is higher than that of weak compressive force chains. In contrast, in SMA13, the number of strong tensile force chains is lower than that of strong compressive force chains, and the number of weak tensile force chains is lower than that of weak compressive force chains. This pattern aligns with the relationship between the total tensile and compressive force chains. Moreover, the strong tensile (compressive) force chains in the three asphalt mixtures account for approximately 30% of the total tensile (compressive) force chains, indicating that, although the number of strong force chains is relatively lower in these three types of asphalt mixtures, these strong force chains bear a significant proportion of the external loads.
Table 10.
Evolution of the number of strong and weak force chains between aggregates.
Figure 11 presents the relationship between the number of cracks and displacement for the three types of asphalt mixtures. As shown in Figure 11, SMA13 exhibits a clear linear relationship between crack count and displacement, primarily involving two stages: linear crack propagation and fracture. In contrast, the crack/displacement relationship for LSPM30 and AC13 consists of three distinct stages: linear crack propagation, a plateau phase, and final fracture. It can be observed that the maximum tensile displacement of AC13 and SMA13 is comparable but significantly lower than that of LSPM30. The number of cracks in LSPM30 is slightly higher than in SMA13, while the number of cracks in SMA13 is significantly greater than in AC13. This suggests that LSPM30 demonstrates a superior capacity for inhibiting crack propagation.
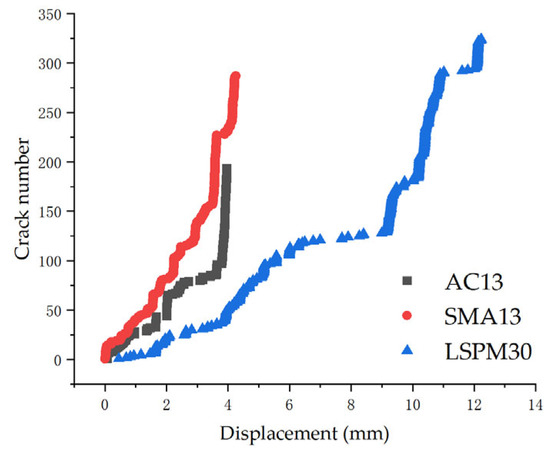
Figure 11.
Evolution of the number of cracks.
3.5. Analysis of Aggregate Displacement Characteristics
The displacement variations of coarse aggregates in three types of asphalt mixtures under different loading stages are presented in Table 11, Table 12, Table 13, Table 14, Table 15 and Table 16. As shown in Table 11, Table 12, Table 13, Table 14, Table 15 and Table 16, the coarse aggregate displacement in all three asphalt mixtures gradually increases with the increase in load, and the displacement of each coarse aggregate group also rises accordingly. It is noteworthy that in AC13, as the fracture occurred when the tensile load was equal to 75% of the peak load during the descending load phase, the displacement of the coarse aggregates remained unchanged in the subsequent two stages. The number of coarse aggregates in SMA13 and LSPM30 is lower than that in AC13. In comparison, it can be observed that the total amount of fine aggregates in AC13 is correspondingly higher. Table 12, Table 14 and Table 16 further demonstrate that the proportion of average displacement of each coarse aggregate group to the total average displacement of all coarse aggregates remains relatively stable throughout the loading process. Specifically, the average displacement of the 4.75 mm aggregate group in AC13 is the lowest, while the 4.75 mm and 2.36 mm aggregate groups in SMA13 exhibit relatively low average displacements. And the 9.5 mm and 31.5 mm aggregate group in LSPM30 show relatively low displacements. Based on the aggregate contact model, this implies that the corresponding contact forces account for a lower proportion of the overall contact forces and contribute less to the transmission of external loads. These findings suggest that the gradation curves of the three asphalt mixtures could be further optimized during the gradation design phase.
Table 11.
Average displacement of coarse aggregate components in AC13 (mm) (d denotes the stage of load reduction).
Table 12.
Displacement ratio of different coarse aggregate components in AC13 (%) (d denotes the stage of load reduction).
Table 13.
Average displacement of coarse aggregate components in SMA13 (mm) (d denotes the stage of load reduction).
Table 14.
Displacement ratio of different coarse aggregate components in SMA13 (%) (d denotes the stage of load reduction).
Table 15.
Average displacement of coarse aggregate components in LSPM30 (mm) (d denotes the stage of load reduction).
Table 16.
Displacement ratio of different coarse aggregate components in LSPM30 (%) (d denotes the stage of load reduction).
4. Conclusions
This study investigates the distribution characteristics of force chains, the properties of crack fractals, and the variation characteristics in contact force in three types of asphalt mixtures, namely AC13, SMA13, and LSPM30, under the OT test and simultaneously examines their mechanical performance under different specimen thicknesses. The findings are summarized as follows:
- (1)
- Under three different sample sizes of 52 mm × 104 mm, 78 mm × 156 mm, and 104 mm × 208 mm, SMA13 exhibits a superior skeleton structure and an enhanced load-bearing capacity compared to AC13. In thinner samples, the distribution of coarse aggregate is notably non-uniform. As the sample thickness increases, the peak load of AC13, SMA13, and LSPM30 all show a decreasing trend, indicating the presence of size effect. When the aspect ratio remains constant and the sample thickness is set at four, six, and eight times the nominal particle size, LSPM30 presents significantly higher tensile displacement than AC13 and SMA13 overall. This suggests that the coarse aggregates in LSPM30 impede crack propagation, resulting in a longer and more tortuous crack path with more consumed energy.
- (2)
- Generally, larger sample sizes contain more particles and exhibit a greater number of cracks. Macroscopically, the primary crack initiates at the bottom center of the specimen and propagates upward. The complexity of the crack path is positively correlated with the variation in particle size along the path, leading to a higher fractal dimension. This indicates that coarse aggregates exert an inhibitory effect on crack propagation. Overall, under the same gradation, a higher fractal dimension is indicative of greater fracture energy, demonstrating a consistent relationship between the two parameters.
- (3)
- The coarse aggregate content in AC13 and LSPM30 is relatively low with an irregular spatial distribution of coarse aggregates. The compressive stress is primarily concentrated between the coarse aggregate, and the corresponding pressure chain exhibits a symmetrical distribution along the central axis of the specimen, extending from the bottom to the top. Prior to reaching the peak load, the pressure chain generally displays a symmetrical and divergent pattern along the crack propagation path, while the tensile chain exhibits an arch-like distribution. As crack development progresses, during the post-peak load decline phase until the complete failure of the specimen, the pressure chain generally forms an arch-shaped and symmetrical distribution along the cracks. In contrast, SMA13 has a relatively higher coarse aggregate content with a more uniform particle distribution. The pressure chain propagates along the coarse aggregate, forming multiple vertical transmission paths from the bottom to the top of the specimen.
- (4)
- The contact forces between particles are predominantly carried by strong compressive force chains and strong tensile force chains. For the three gradations, the proportion of strong compressive force chains relative to the total compressive force chains ranges from 0.74 to 0.83, while the ratio of strong tensile force chains to the total tensile force chains ranges from 0.72 to 0.78. On the whole, during the loading process, the ratio of total compressive force chains to total tensile force chains in AC13 and LSPM30 undergoes a change from low to high. However, the total compressive force between particles remains lower than the total tensile force, indicating that a relatively high amount of asphalt mortar contributes to the tensile strength in these two mixtures. In contrast, in SMA13, the ratio of total compressive force to total tensile force generally decreases from a high to a low value, and the total compressive force exceeds the total tensile force, suggesting that the coarse aggregates in SMA13 form a more effective skeleton structure.
- (5)
- There is a good linear relationship between cracks and displacements in SMA13, mainly presenting two stages: the linear crack propagation stage and the fracture stage. However, in AC13 and LSPM30, the relationship between cracks and displacements shows three stages: the linear crack propagation stage, the plateau stage, and the fracture stage. The maximum tensile strength of AC13 and SMA13 is lower than that of LSPM30, while the number of cracks in LSPM30 is higher than that of SMA13 and AC13. This indicates that LSPM30 has a better advantage in inhibiting crack propagation. The strong tensile (compressive) force chains in the three asphalt mixtures account for approximately 30% of the total tensile (compressive) force chains, suggesting that although the number of strong force chains is relatively small, they bear a considerable amount of external loads. The distribution pattern of strong compressive force chains in the three asphalt mixtures is in an “8” shape. In AC13, the strong compressive force chains are concentrated at approximately 60°–130° and 240°–330°. In LSPM30, they are concentrated at approximately 130°–240° and 90°–300°. In SMA13, they are concentrated at approximately 45°–120° and 210°–300°. Among the three asphalt mixtures, SMA13 has a relatively uniform distribution of coarse aggregates, which can form a better skeleton structure, facilitating the transmission of external loads within the asphalt mixture. The coarse aggregate distribution in AC13 is less uniform and has a lower overall content, making it less effective in transmitting external loads. LSPM30 lies between AC13 and SMA13 in this regard.
- (6)
- During the loading process, the proportion of the average displacement of each group of coarse aggregates to the total average displacement of coarse aggregates remains stable. In AC13, the average displacement of the 4.75 mm aggregate group is the lowest; in SMA13, the average displacements of the 4.75 mm and 2.36 mm aggregate groups are relatively low; and in LSPM30, the average displacements of the 9.5 mm and 31.5 mm aggregate groups are relatively low. This suggests that the gradation curves of the three asphalt mixtures can be further optimized.
Author Contributions
Conceptualization, J.W. and X.F.; methodology, J.W. and T.F.; software, J.W. and T.F.; validation, J.W., X.F. and T.F.; formal analysis, J.W.; investigation, J.W.; resources, J.W.; data curation, J.W.; writing—original draft preparation, J.W.; writing—review and editing, J.W.; visualization, J.W.; supervision, J.W.; project administration, J.W.; funding acquisition, J.W. and X.F. All authors have read and agreed to the published version of the manuscript.
Funding
This research was funded by the Key Research Programs in Universities of Henan Province, grant number 23A560022, Key Research and Development Program of Jiangxi Province, grant number: 20252BCG330027, and the Transportation Department of Jiangxi Province, grant number 2023Z0001.
Institutional Review Board Statement
Not applicable.
Informed Consent Statement
Not applicable.
Data Availability Statement
The data used to support the findings of this study are available on request.
Conflicts of Interest
Author Xiangyang Fan was employed by the company Jiangxi Communications Investment Maintenance Technology Group Co., Ltd. The remaining authors declare that the research was conducted in the absence of any commercial or financial relationships that could be construed as a potential conflict of interest.
References
- Gao, L.; Zhang, Y.; Liu, Y.; Wang, Z.; Ji, X. Study on the cracking behavior of asphalt mixture by discrete element modeling with real ag-gregate morphology. Constr. Build. Mater. 2023, 368, 130406. [Google Scholar] [CrossRef]
- Zhu, X.; Yu, H.; Qian, G.; Yao, D.; Dai, W.; Zhang, H.; Li, J.; Zhong, H. Evaluation of asphalt mixture micromechanical behavior evolution in the failure process based on Discrete Element Method. Case Stud. Constr. Mater. 2023, 18, e01773. [Google Scholar] [CrossRef]
- Nian, T.; Ge, J.; Li, P.; Wang, M.; Mao, Y. Improved discrete element numerical simulation and experiment on low-temperature anti-cracking performance of asphalt mixture based on PFC2D. Constr. Build. Mater. 2021, 283, 122792. [Google Scholar] [CrossRef]
- Xiao, X.; Li, J.; Cai, D.; Cheng, H.; Xiao, F. Characterizing thermal fatigue behaviors of asphalt concrete waterproofing layer in high-speed railway using customized overlay test. Int. J. Fatigue 2022, 165, 107176. [Google Scholar] [CrossRef]
- Zhang, X.; Chen, E.; Li, N.; Wang, L.; Si, C.; Wang, C. Micromechanical analysis of the rutting evolution of asphalt pavement under temperature–stress coupling based on the discrete element method. Constr. Build. Mater. 2022, 325, 126800. [Google Scholar] [CrossRef]
- Nian, T.; Ge, J.; Li, P.; Guo, R.; Li, J.; Wang, M. Improved three-dimensional discrete modeling method and anti-cracking properties of asphalt mixture. Constr. Build. Mater. 2022, 321, 126405. [Google Scholar] [CrossRef]
- Li, H.; Luo, X.; Gu, Z.; Chen, Q.; Zhang, Y. Predicting crack growth of paving materials under indirect tensile fatigue loads. Int. J. Fatigue 2023, 175, 107818. [Google Scholar] [CrossRef]
- Ling, M.; Zhang, J.; Fuentes, L.; Walubita, L.F.; Lytton, R.L. A mechanistic framework for tensile fatigue resistance of asphalt mixtures. Int. J. Fatigue 2021, 151, 106345. [Google Scholar] [CrossRef]
- Cheng, H.; Liu, J.; Sun, L.; Liu, L.; Zhang, Y. Fatigue behaviours of asphalt mixture at different temperatures in four-point bending and indirect tensile fatigue tests. Constr. Build. Mater. 2021, 273, 121675. [Google Scholar] [CrossRef]
- Marín-Uribe, C.R.; Restrepo-Tamayo, L.M. Experimental study of the tensile strength of hot asphalt mixtures measured with indirect tensile and semi-circular bending tests. Constr. Build. Mater. 2022, 339, 127651. [Google Scholar] [CrossRef]
- Meng, Y.; Lu, Y.; Kong, W.; Chen, J.; Zhang, C.; Meng, F. Study on the influence factors of fatigue properties of large-stone asphalt mixtures based on semi-circular bending tests. Constr. Build. Mater. 2024, 414, 134947. [Google Scholar] [CrossRef]
- Song, W.; Deng, Z.; Wu, H.; Zhan, Y. Extended finite element modeling of hot mix asphalt based on the semi-circular bending test. Constr. Build. Mater. 2022, 340, 127462. [Google Scholar] [CrossRef]
- Ma, Y.; Mohammad, L.N.; Liu, J.; Asghar, M.; Elnaml, I.; Cooper, S.B. Development of a cyclic semi-circular bending test protocol to characterize fatigue cracking of asphalt mixture at intermediate temperature. Constr. Build. Mater. 2024, 443, 137669. [Google Scholar] [CrossRef]
- Safazadeh, F.; Romero, P.; Asib, A.S.M.; VanFrank, K. Methods to evaluate intermediate temperature properties of asphalt mixtures by the semi-circular bending (SCB) test. Road Mater. Pavement Des. 2022, 23, 1694–1706. [Google Scholar] [CrossRef]
- Meng, Y.; Chen, J.; Kong, W.; Wang, Z.; Lu, Y.; Chen, P. Research on the influence of parameters on the fracture performance of the large stone asphalt mixture based on the semi-circular bending test. Constr. Build. Mater. 2024, 422, 135720. [Google Scholar] [CrossRef]
- Meng, Y.; Kong, W.; Gou, C.; Deng, S.; Hu, Y.; Chen, J.; Fan, L. A review on evaluation of crack resistance of asphalt mixture by semi-circular bending test. J. Road Eng. 2023, 3, 87–97. [Google Scholar] [CrossRef]
- Tan, Y.; Wang, W.; Xu, Y.; Xing, C.; Hu, J.; Li, S.; Dai, M. Investigation into the force chain transmission mechanism of asphalt mixture under indirect tensile mode. Constr. Build. Mater. 2024, 411, 134500. [Google Scholar] [CrossRef]
- Li, X.; Shen, J.; Ling, T.; Du, H. Multi-index evaluation for anticracking performance of epoxy porous asphalt mixtures based on overlay test. J. Mater. Civ. Eng. 2022, 34, 04022336. [Google Scholar] [CrossRef]
- Walubita, L.F.; Fuentes, L.; Lee, S.I.; Guerrero, O.; Mahmoud, E.; Naik, B.; Simate, G.S. Correlations and preliminary validation of the laboratory monotonic overlay test (OT) data to reflective cracking performance of in-service field highway sections. Constr. Build. Mater. 2021, 267, 121029. [Google Scholar] [CrossRef]
- Li, S.; Wang, C.; Hao, P.; Yuan, G. Research on the evolution law of performance damage of large particle porous asphalt mixture. Highway 2025, 70, 1–8. [Google Scholar]
- Zhang, Y.; Luo, X.; Onifade, I.; Huang, X.; Lytton, R.L.; Birgisson, B. Mechanical evaluation of aggregate gradation to characterize load carrying capacity and rutting resistance of asphalt mixtures. Constr. Build. Mater. 2019, 205, 499–510. [Google Scholar] [CrossRef]
- Liu, G.; Huang, T.; Lyu, L.; Liu, Z.; Ma, C. Effective load transfer capacity analysis for asphalt mixture skeleton based on main force chain characteristics and discrete element method. J. Mater. Civ. Eng. 2023, 35, 04023303. [Google Scholar] [CrossRef]
- Wang, H.; Zhou, Z.; Huang, W.; Dong, X. Investigation of asphalt mixture permanent deformation based on three-dimensional discrete element method. Constr. Build. Mater. 2021, 272, 121808. [Google Scholar] [CrossRef]
Disclaimer/Publisher’s Note: The statements, opinions and data contained in all publications are solely those of the individual author(s) and contributor(s) and not of MDPI and/or the editor(s). MDPI and/or the editor(s) disclaim responsibility for any injury to people or property resulting from any ideas, methods, instructions or products referred to in the content. |
© 2025 by the authors. Licensee MDPI, Basel, Switzerland. This article is an open access article distributed under the terms and conditions of the Creative Commons Attribution (CC BY) license (https://creativecommons.org/licenses/by/4.0/).